Article

Calculation Method and Experimental Study of Stress Loss in T-Beam External Prestressed Tendon Based on the Variation Principle

1
School of Transportation and Logistics Engineering, Wuhan University of Technology, Wuhan 430063, China
2
School of Civil Engineering and Communication, North China University of Water Resource and Electric Power, Zhengzhou 450045, China
3
Henan Transportation Research Institute Co., Ltd., Zhengzhou 450045, China
4
Sichuan Transportation Construction Group Co., Ltd., Chengdu 610000, China
*
Author to whom correspondence should be addressed.
Buildings 2025, 15(17), 3056; https://doi.org/10.3390/buildings15173056
Submission received: 13 July 2025 / Revised: 21 August 2025 / Accepted: 24 August 2025 / Published: 27 August 2025

Abstract

The problem of quantifying prestress loss in the external tendons of in-service bridges is of immense practical importance, and the development of reliable, cost-effective methods is a commendable goal. Based on the principle of static equilibrium, this paper proposes a direct method for determining the effective stress in external prestressed tendons using the variation principle, whose calculation accuracy was validated by conducting experimental and theoretical analysis considering the prestressed tendon arrangement form. A transverse tensioning experiment of the prestressed tendons was carried out under four tension conditions of 50 kN, 80 kN, 110 kN and 170 kN at the anchorage end, and the theoretically calculated internal force of the prestressed tendons gradually approached the measured value as the transverse tension increased. Once the appropriate level of transverse tension was reached, stable and reliable results could be obtained. Ultimately, the error between them will stabilize below 5%. This method was used to detect stress loss in the external prestressed tendons of 20 m, 40 m and 50 m T-beams affected by both internal and external uncertain factors simultaneously, and the probability distribution hypothesis test of the stress loss rate was carried out, the results of which reveal that they all follow normal distribution. The ratio of stress at the bottom edge of the T-beam under self-weight and prestressed load to that under vehicle load is defined as the compressive stress reserve coefficient, which is a verified and reliable index for evaluating the external prestressed stress loss on the reinforcement effect of the bridge.

1. Introduction

The T-shaped beam bridge is one of the widely used medium-span bridge types, which has many advantages such as high section efficiency, reasonable structural force, strong load-bearing capacity, mature construction technology, easy standardized production and low building height. Under the long-term and complex traffic environment, the structural performance of prestressed concrete bridges will gradually deteriorate, which is prone to cause safety problems [1,2]. To solve the above problems, it is usually necessary to reinforce and renovate the bridges that have developed diseases [3,4].
Due to its cross-sectional characteristics, the T-beam is prone to mid-span deflection or shear failure at the supports. Therefore, using external prestressed tendons at the bottom of the beam is a suitable method to improve the bending resistance performance. Through the rational arrangement of anchoring ends and turning blocks, the external prestressed tendons can actively reinforce the beam body [5,6,7,8]. However, due to the stress relaxation, deformation and sliding of the anchorages and adverse external environmental factors, stress loss inevitably occurs in the external prestressed tendons, which will lead to the stress redistribution of the structure [9]. A critical indicator of the structural performance of external prestressing tendons is their remaining stress. It is of vital importance to detect and replenish the loss of prestress in a timely manner [10,11].
At present, the effective methods for prestress detection include: the dynamic detection method [12], acoustic emission technique [13], electromagnetic effect detection method [14], vibration frequency detection method [15] and anchor-end prestress testing technology [16,17]. Ahlborn et al. [18] used acoustic emission technology to test two fully prestressed concrete beam bridges, obtaining the variation curve of prestress values over time and their variation values under the action of truck loads. The test results were basically consistent with the expected values, providing a new approach for the non-destructive testing of effective prestress. Li et al. [19] compared the attenuation of acoustic signals during the propagation of steel wire breakage by changing the strength and material of the concrete embedded in the corrugated pipe, with the aim of determining the optimal placement of acoustic sensors for the damage detection of prestressed steel strands on the concrete surface of T-beams. This study improved the accuracy of health monitoring for prestressed steel bundle damage using acoustic emissions. Chen et al. [20] applied different tensile forces to steel strands and theoretically analyzed the sonoelastic effect and dispersion behavior of longitudinal transient waves passing through slender and tensioned circular rods to identify the arrival times of different frequency components. They concluded that the velocity of each frequency component of the traveling wave is related to the tensile force in the strands. However, this method has relatively low accuracy and is not suitable for cases where the effective prestress value is small. Currently, it is still in the experimental research stage. A set of methods for non-destructive assessment of the internal reinforcing bars and prestressed reinforcing bars of concrete bridge components has been developed by Ghorbanpoor [21] based on the principle of magnetic flux leakage [22]. This method measures the change in induced current transformed from the change in magnetic flux caused by the deformation of the beam body to infer the change in stress. Guo et al. [23] studied the influence of long-term prestress loss on concrete box girders reinforced with external prestressed tendons and used the magnetic flux rope force transducer to monitor the prestress loss in the external prestressed cables. This type of method has fast testing speed, but poor accuracy. Moreover, the equipment is bulky and has serious magnetic contamination. Therefore, it is not feasible to rely on this method for effective prestress detection. Jin et al. [24] proposed a vibration-based method to detect the prestress loss in prestressed concrete bridges by monitoring the changes of several natural frequencies. They developed a system identification model and proposed to identify the prestress loss in prestressed concrete bridges by using the changes of natural frequencies, but there are errors caused by the differences from the actual structure. Xu et al. [25] used the parameter estimation technique of vibration frequency and proposed a method for identifying the prestress of steel tendons based on the minimum square difference between the velocity response at multiple points of the bridge and the baseline response. Experiments show that this vibration-based prestress identification method is feasible both theoretically and in practice. Ye et al. [26] conducted a detailed study on the influencing factors considered in the stress loss mechanism of prestressed tendons inside the bridge, including elastic shrinkage of concrete, relaxation of steel, shrinkage of concrete and creep. Then, the theoretical values of prestressed loss were calculated using European and American standards and compared with the measured values. The results show that the stress loss cannot be accurately predicted by using the time step method. Sensors are deployed inside the structure to monitor the stress of the prestressed tendons, and the ultimate goal is to verify the physical model for stress loss prediction [27].
For non-destructive testing methods, although they are relatively perfect in theory, they generally have the drawbacks of poor accuracy, being easily affected by environmental factors and high cost. Therefore, it is difficult to be applied in engineering practice. The method of measuring the prestress value by arranging pressure sensors at the anchoring end can only be applicable to under-construction bridges and cannot be used in in-service prestressed concrete bridges.
Local damage detection is mainly carried out through the drilling method. The principle is to measure the strain release amount in the steel strands and then establish the calculation relationship between the effective prestress and the released strain [28,29]. It was first proposed by Mathar [30] to determine the residual stress of metal components by measuring the strain at the edge of the hole after drilling. Schajer et al. [31] analyzed and summarized the drilling method for testing residual stress proposed by Mather, and pointed out that using optical fiber technology to measure the trace displacement of the drilling surface in a laboratory with advanced temperature control and vibration isolation will become the future development direction of effective prestress detection. Vimalanandam et al. [32] conducted partial destructive tests using the steel stress relief hole technique (SSRHT) to determine the prestress level, and compared the results with those obtained from conventional load tests in the laboratory. The result is relatively ideal, but this method has a large workload and high cost. Blödorn et al. [33] proposed that if the self-hole method is not properly controlled during drilling, additional stress might be introduced into the hole wall, thereby affecting the accuracy of the blind hole method measurement. They experimentally verified this hypothesis and speculated that the increase in temperature during the drilling process was the main reason for this result. Yun et al. [34] used the micro-hole release technique to measure the effective prestress of steel strands in existing prestressed concrete bridges. The research results show that the tension release of steel strand holes is directly related to the hole depth and diameter, and this method causes less damage to the structure. A large number of research results [35,36] show that the stress released by drilling will not continue to increase after the drilling depth reaches approximately 1.5 times the drilling diameter. At this time, the release value is approximately the stress release value of drilling through the component. Therefore, the drilling method has gradually evolved into the blind hole method that does not drill through the component. The integral method is adopted to detect the residual stress in the non-uniform residual stress field, which can expand the application scope of the blind hole method for detecting the residual stress of metal [37]. S.M.ASCE et al. [38] conducted effective prestress detection tests on seven prestressed concrete beams that had been in use for 42 years using the cracking moment test method, and compared the measured effective prestress results with the calculated values based on the AASHTOLRFD prestress loss equation. The results show that the calculated value can provide the most accurate result within a 10% error range of the measured value.
To make the detection of the stress loss of the external prestressed tendons of in-service bridges more convenient and reliable, when studying the effective prestress of the external prestressed tendons in this paper, the displacement of the steel tendons under the action of transverse tension was first established by using the transverse tension increment method. Further, based on the idea of the variational principle, the effective stress equation of the prestressed tendons was calculated using the principle of energy conservation. Experimental verification and actual bridge measurement indicate the applicability and effectiveness of this effective prestress detection method. The transverse tensioning experiment is an alternative to other non-destructive methods that fits well with the detection and evaluation of existing structures with external prestressed tendon, while it also has a low cost and easy operation. Mathematical statistics on measurement data can provide a more intuitive analysis of the results. The pressure reserve coefficient proposed in this paper is an indicator supplementing relevant specification contents for evaluating the reinforcement effect of stress damage on bridges.

2. The Theory of Effective Stress Detection of External Prestressed Tendon

2.1. Assumption

1.
Ignore the influence of the bending stiffness of the prestressed tendon. The span-to-diameter ratio of the prestressed tendon far exceeds 20, which leads to relatively small self-bending stiffness, which has a negligible impact on the result. Moreover, the lateral displacement of the prestressed tendon is mainly caused by the lateral force during the test.
2.
The stress of the prestressed tendon between any two adjacent constraints varies linearly. The prestressed tendon is made by twisting multiple steel wires, and their microscopic stress distribution is non-uniform. However, on a macro level, when the prestressed tendon is used as an integral material, the uniform stress assumption can effectively characterize average mechanical properties.
3.
The anchoring zones at both ends of the prestressed tendon are simplified to articulated constraints. In actual engineering, anchoring structures are usually designed to only constrain translational degrees of freedom while allowing a certain degree of rotation. The articulated constraints assumption would slightly overestimate the deflection of the prestressed tendon whose error is usually within the allowable range of the project and is biased towards safety.
4.
Consider the lateral displacement of the restrictor under transverse tension.
5.
Ignore the displacement of the boundary point position under transverse tension.

2.2. Calculation Method

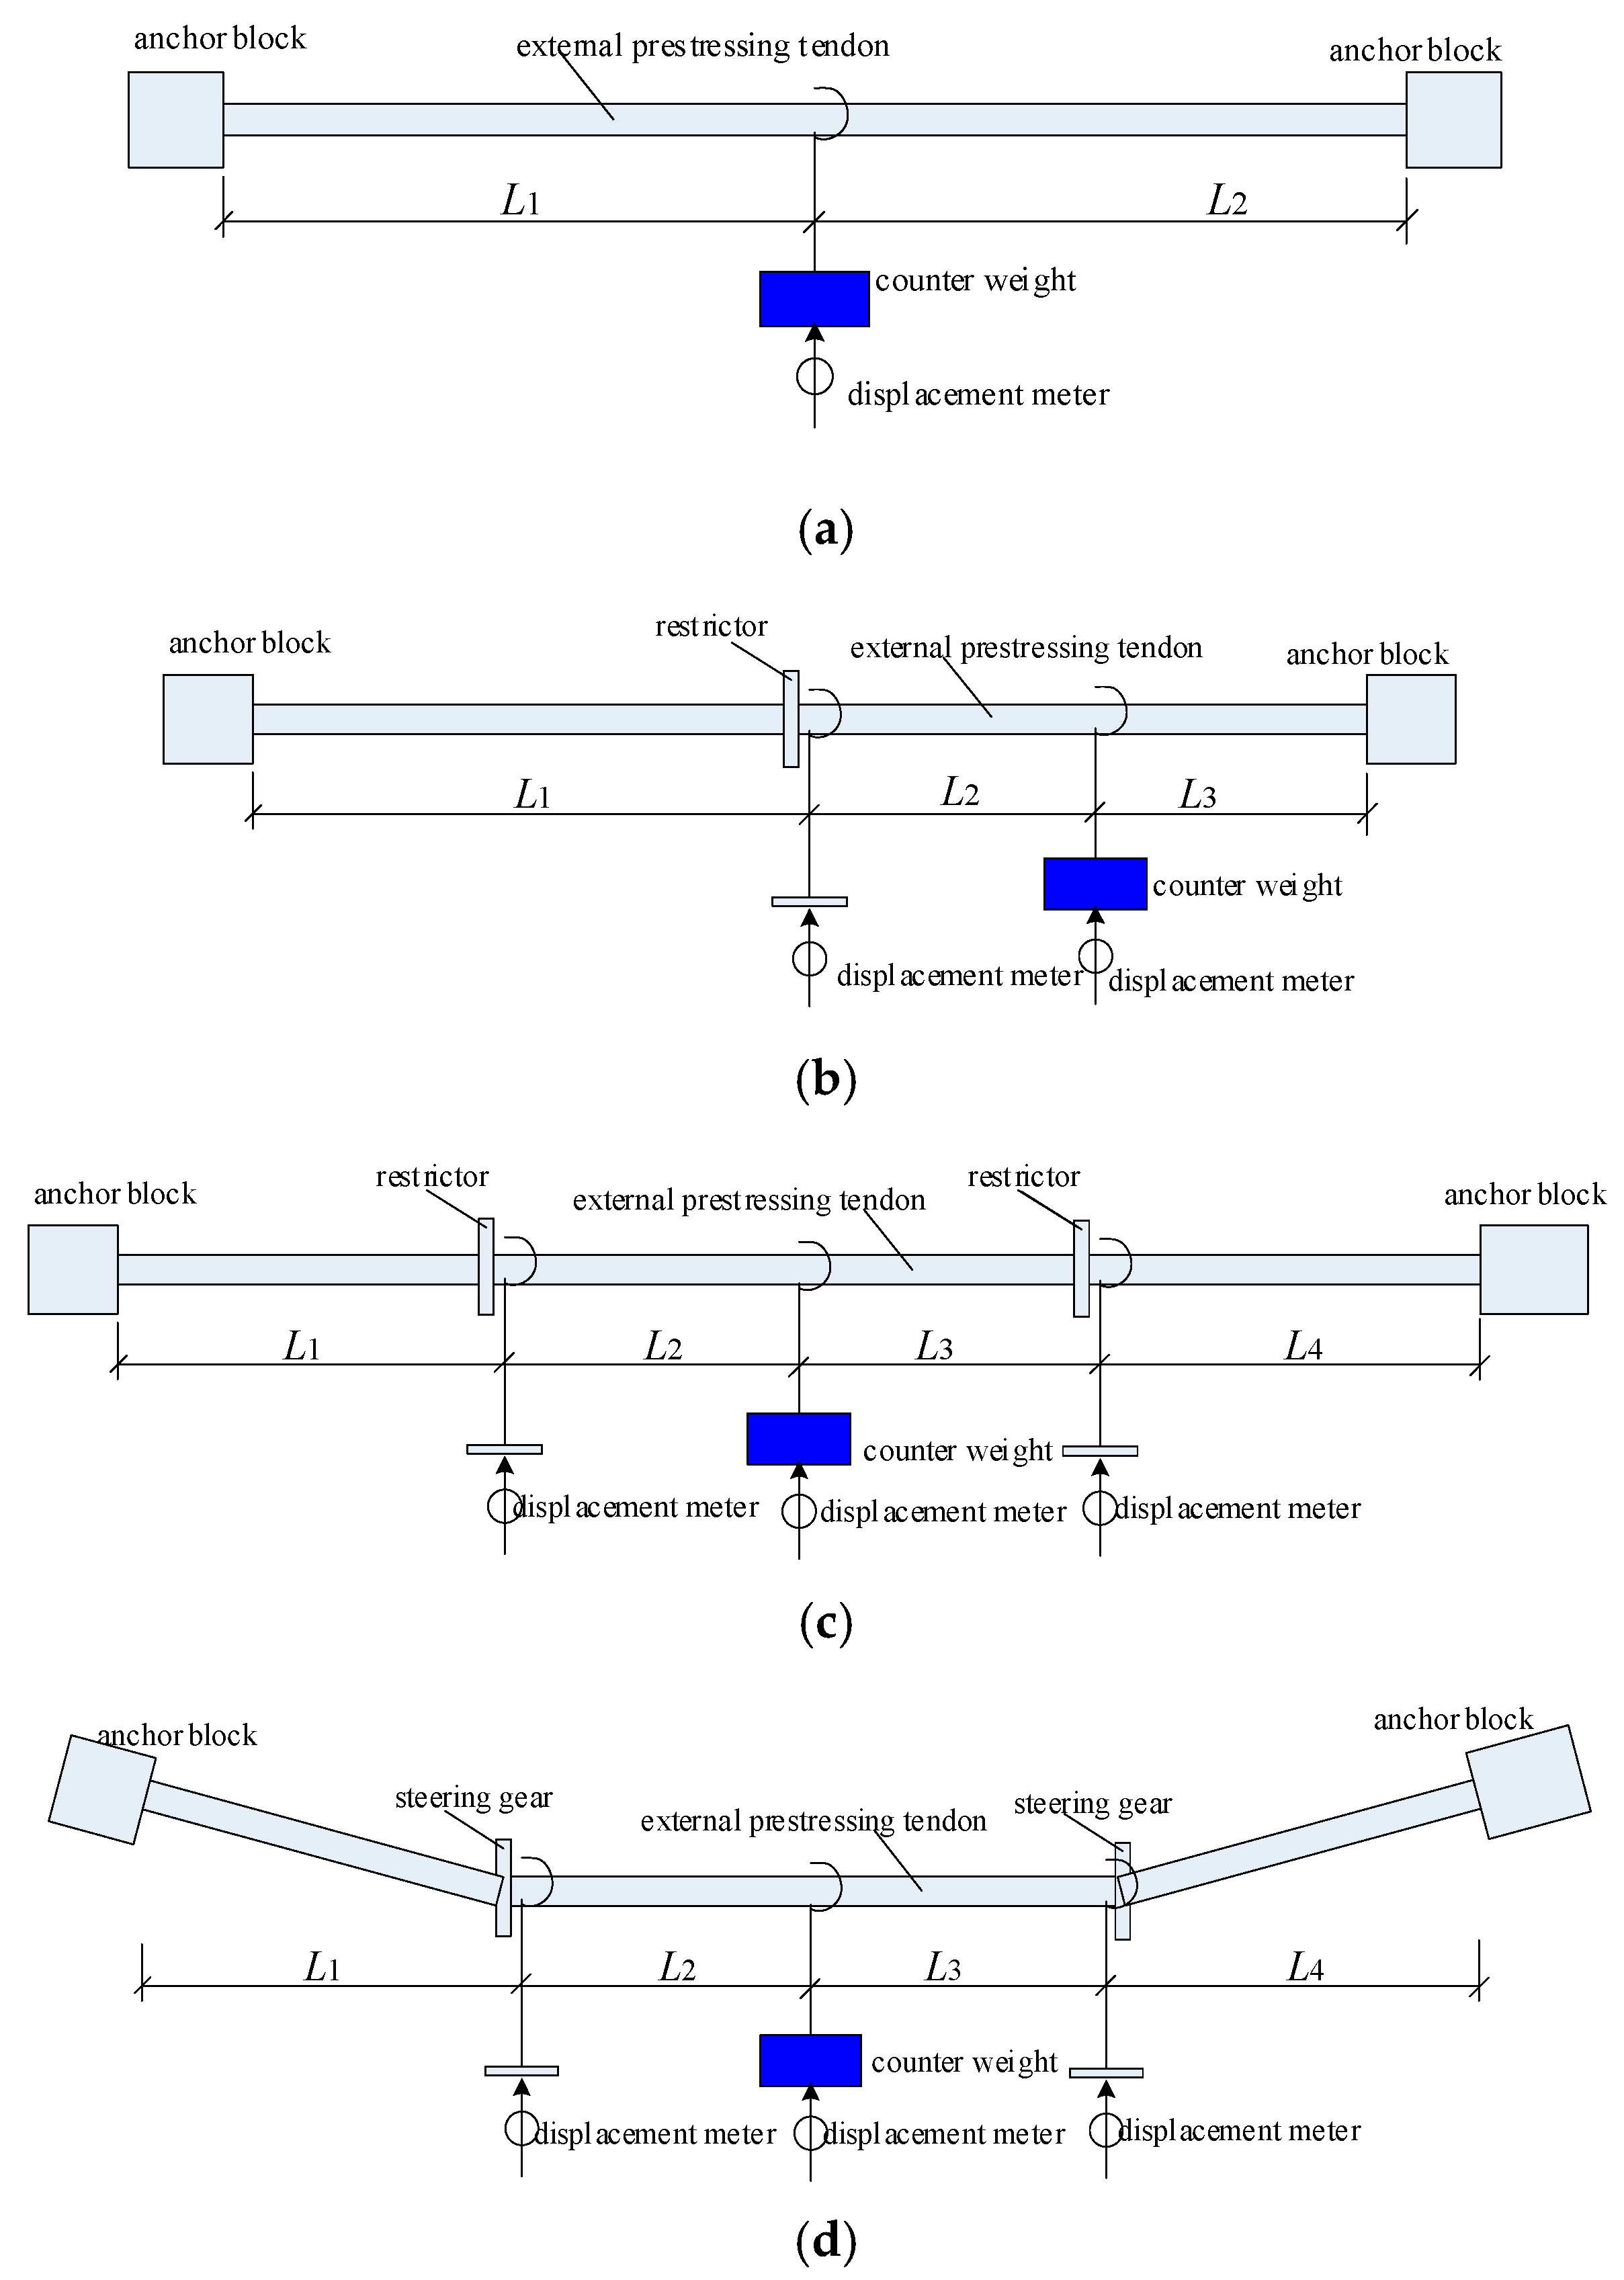
Under the action of the lateral force, the prestressed tendon will undergo lateral displacement. According to the principle of static equilibrium, the displacement equation of the prestressed tendon is listed in the form of piecewise functions. Then, based on the law of conservation of energy, the equilibrium equation is listed. Finally, the expression of the effective internal force of the prestressed tendon is derived. All the physical quantities contained in the formula can be measured. According to the different number of restrictors for a single prestressed tendon, the following situations are analyzed.
(1)
Without restrictor
The deformation δ of the prestressed tendon without restrictor after transverse tensioning T in the mid-span is shown in Figure 1. If the maximum lateral displacement δ under the lateral tension is given, then the displacement function w of the prestressed tendon is shown as Equation (1):
w = δ L 1 x   ( 0 < x < L 1 ) δ L 2 ( L 1 + L 2 x )   ( L 1 < x < L 1 + L 2 )  
According to the law of conservation of energy, the work done by the transverse force should be equal to the internal work done by the effective internal force of the prestressed tendon, as shown in Equation (2):
1 2 0 L 1 + L 2 F ( d w d x ) 2 d x 1 2 T δ = 0
The effective internal force calculation formula of the prestressed tendon is shown in Equation (3):
F = T δ L 1 + δ L 2
If the transverse tension point is located in the middle of the prestressed tendon span, the effective internal force of the prestressed tendon can be simplified to Equation (4):
F = T L 4 δ   ( L 1 = L 2 = L / 2 )
(2)
Single restrictor
The deformation diagram of the prestressed tendon with a single restrictor laterally tensioned at the position between the endpoint and the restrictor is shown in Figure 2. Under the lateral tension T, the maximum lateral displacement at this location is δ 1 , and the lateral displacement at the restrictor position is δ 2 . Then, the displacement function of the prestressed tendon can be expressed as Equation (5):
w = δ 1 L 1 x   ( 0 < x < L 1 ) δ 1 L 2 ( L 1 + L 2 x ) δ 2 L 2 ( L 1 x )   ( L 1 < x < L 1 + L 2 ) δ 2 L 3 ( L 1 + L 2 + L 3 x )   ( L 1 + L 2 < x < L 1 + L 2 + L 3 )  
According to the law of conservation of energy, the work done by the transverse force should be equal to the internal work done by the effective internal force of the prestressed tendon, as shown in Equation (6):
1 2 0 L 1 + L 2 + L 3 F ( d w d x ) 2 d x 1 2 T δ = 0
The effective internal force calculation formula of the prestressed tendon is shown in Equation (7):
F = T δ 1 δ 1 2 / L 1 + ( δ 1 δ 2 ) 2 / L 2 + δ 2 2 / L 3
(3)
Double restrictors
The deformation diagram of the prestressed tendons with the double restrictor laterally tensioned at the position between the two restrictors is shown in Figure 3. The maximum lateral displacement at the point where the lateral tension T acts is δ 2 , and the lateral displacements at the positions of the two restrictors are δ 1 and δ 3 , respectively. Then the displacement function of the prestressed tendon can be expressed as Equation (8):
w = δ 1 L 1 x   ( 0 < x < L 1 ) δ 1 + x L 1 L 2 ( δ 2 δ 1 )   ( L 1 < x < L 1 + L 2 ) δ 3 + L 1 + L 2 + L 3 x L 3 ( δ 2 δ 3 )   ( L 1 + L 2 < x < L 1 + L 2 + L 3 ) L 1 + L 2 + L 3 + L 4 x L 4 ( δ 3 )   ( L 1 + L 2 + L 3 < x < L 1 + L 2 + L 3 + L 4 )
According to the law of conservation of energy, the work done by the transverse force should be equal to the internal work done by the effective internal force of the prestressed tendon, as shown in Equation (9):
1 2 0 L 1 + L 2 + L 3 + L 4 F ( d w d x ) 2 d x 1 2 T δ = 0
The effective internal force calculation formula of the prestressed tendon is shown in Equation (10):
F = T δ 2 δ 1 2 / L 1 + ( δ 2 δ 1 ) 2 / L 2 + ( δ 2 δ 3 ) 2 / L 3 + δ 3 2 / L 4
This section is the detailed derivation process of the calculation formula for the effective internal forces of external prestressed tendons under different conditions. The calculation formula is summarized in Table 1.

2.3. Experimental Verification

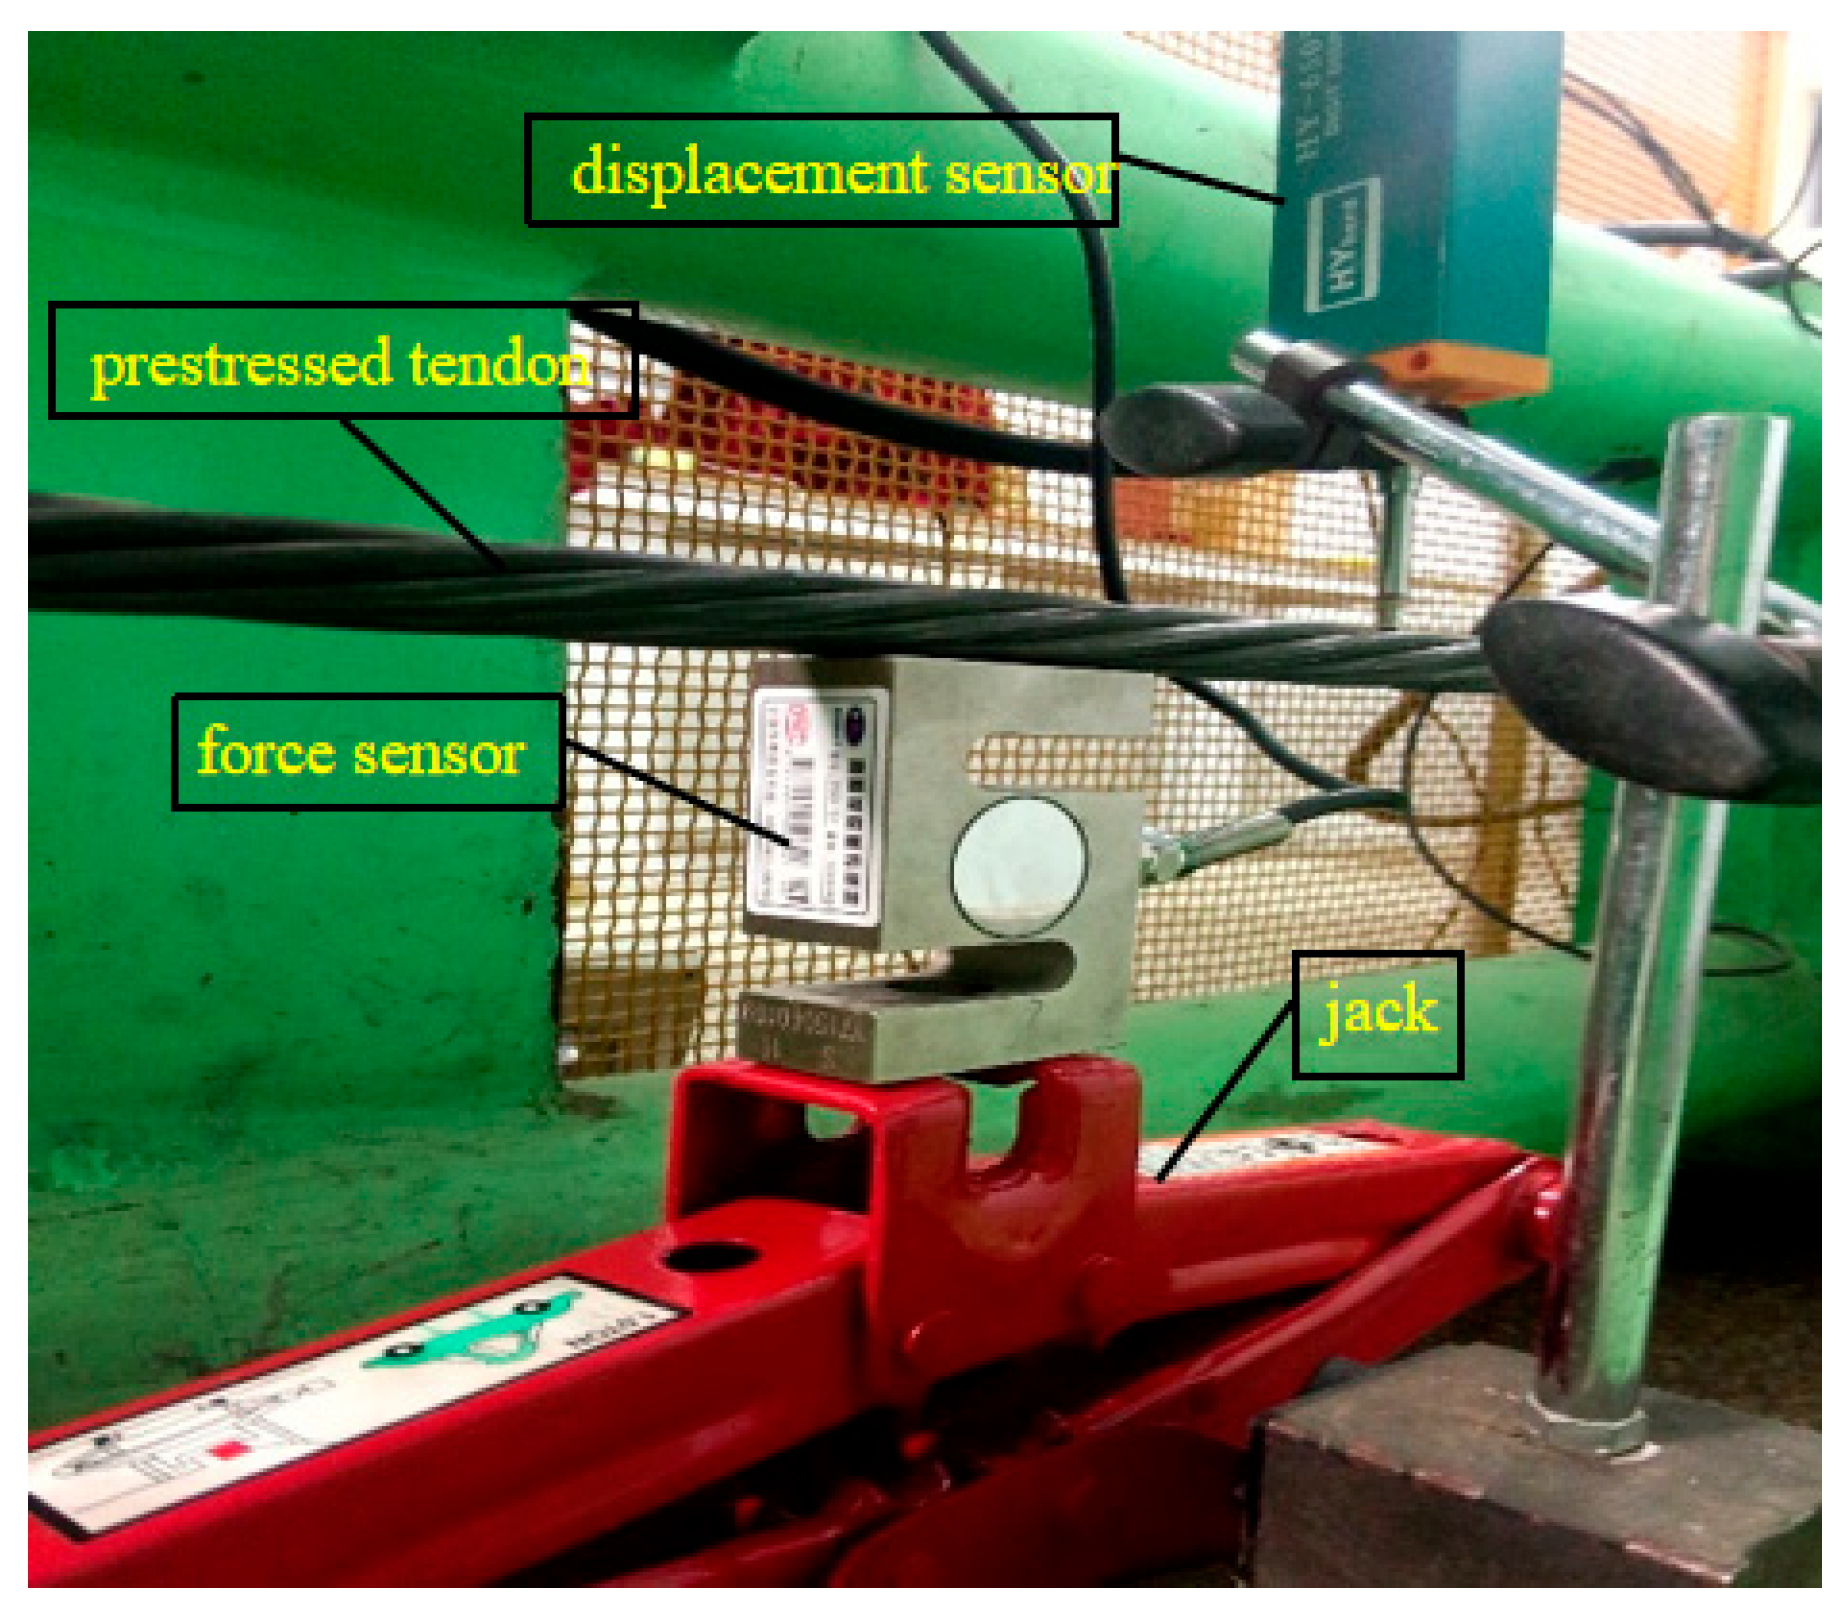
To verify the correctness of the above computability theory, experimental verification was carried out. The effective internal force of the prestressed tendon test was executed by the lateral displacement method involving the principle of force balance. Apply force step by step at the middle position of the two limit steel tubes through the jack, and simultaneously measure the vertical deflection at the counterweight position and two limit steel tubes in stages. Then, the real-time internal force of the prestressed tendon can be calculated using the above equations. Finally, it will be compared with the actual tensile force of the jack at the anchoring end.
The test schematic diagram and loading device are shown in Figure 4 and Figure 5. Limit steel tubes are respectively arranged at the two-quarter points of the prestressed tendon. After tensioning a certain tonnage, the prestressed tendon is lifted at the mid-span position with a jack, and the lateral displacement of the prestressed tendon is monitored simultaneously.
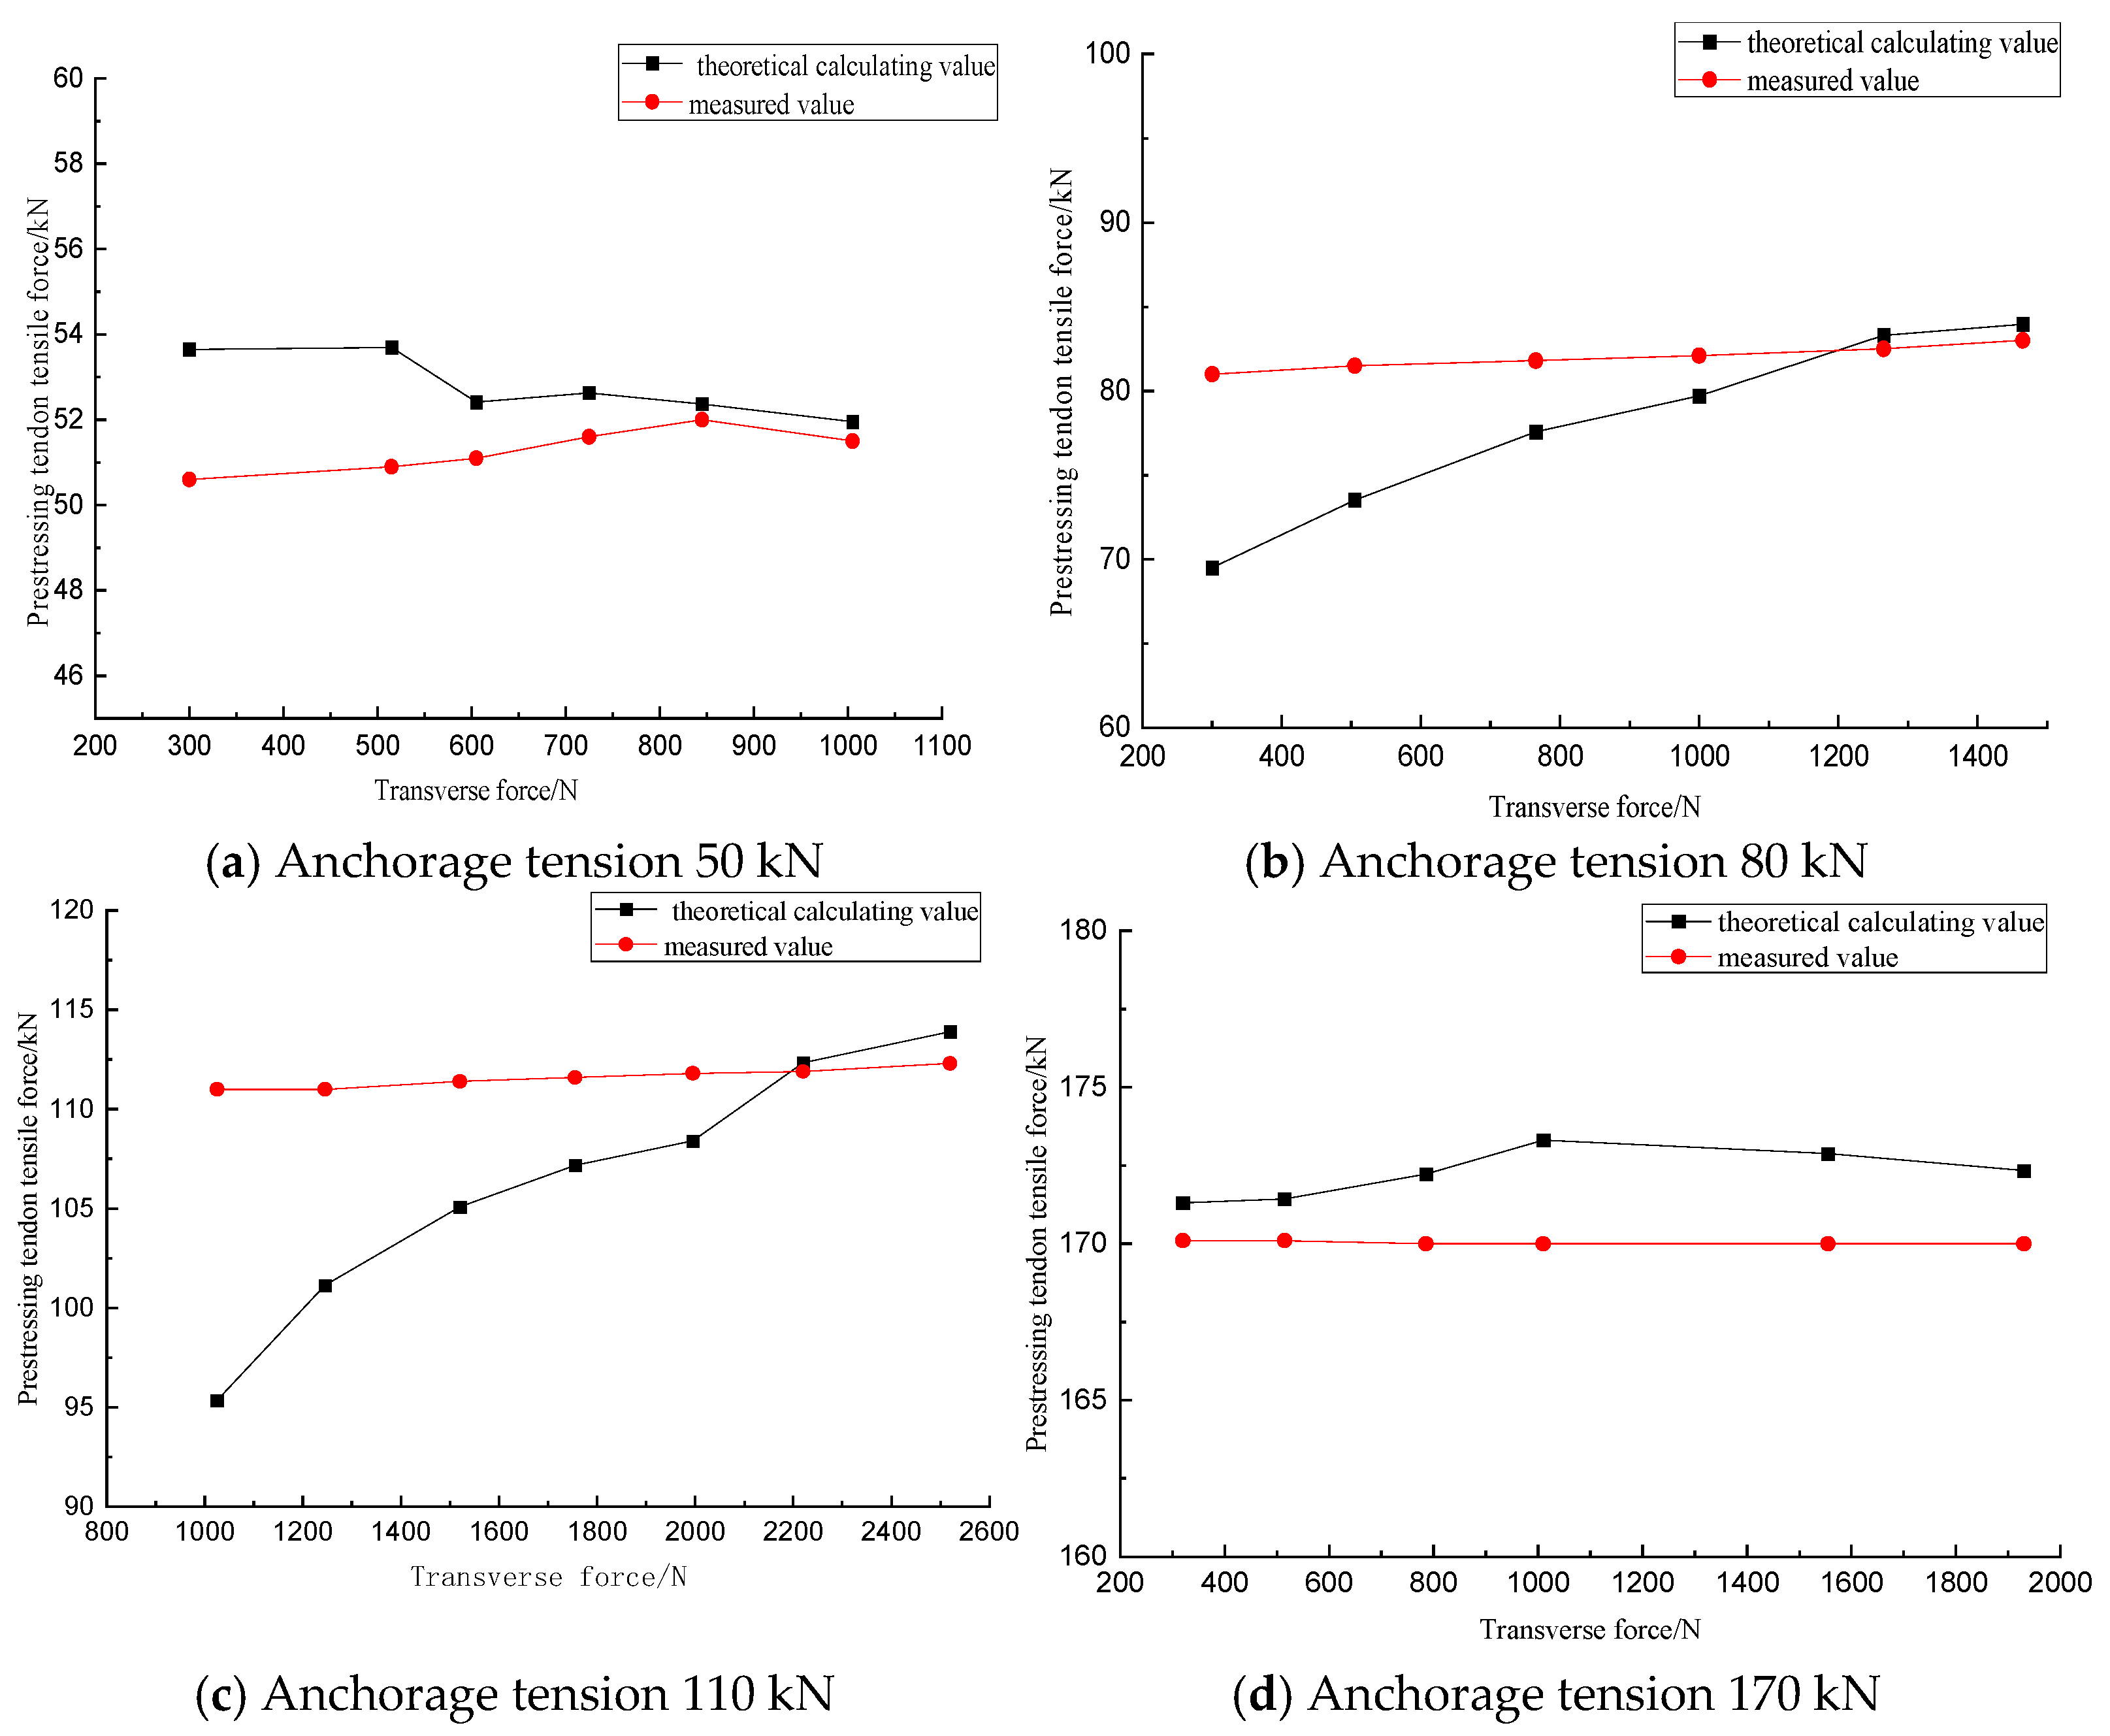
The comparison graph of the calculated internal force and the measured values with the increase of transverse tension under four types of anchorage tension forces is shown in Figure 6. It can be seen that as the transverse applied tension increases, the calculated effective internal force gradually stabilizes, and eventually can be consistent with the actual tension of the prestressed tendons, with the deviation controlled within 5%. The physical mechanism responsible for the larger error between the calculated and measured values at lower transverse tensions is due to the initial slack when the anchorage tension is relatively small. It indicates the correctness of the calculation method, especially when the anchorage tension is 170 kN, and the theoretical results are in good agreement with the measured values.

3. Detection of Stress Loss of External Prestressed Tendons for Existing Bridge

3.1. Measuring Method

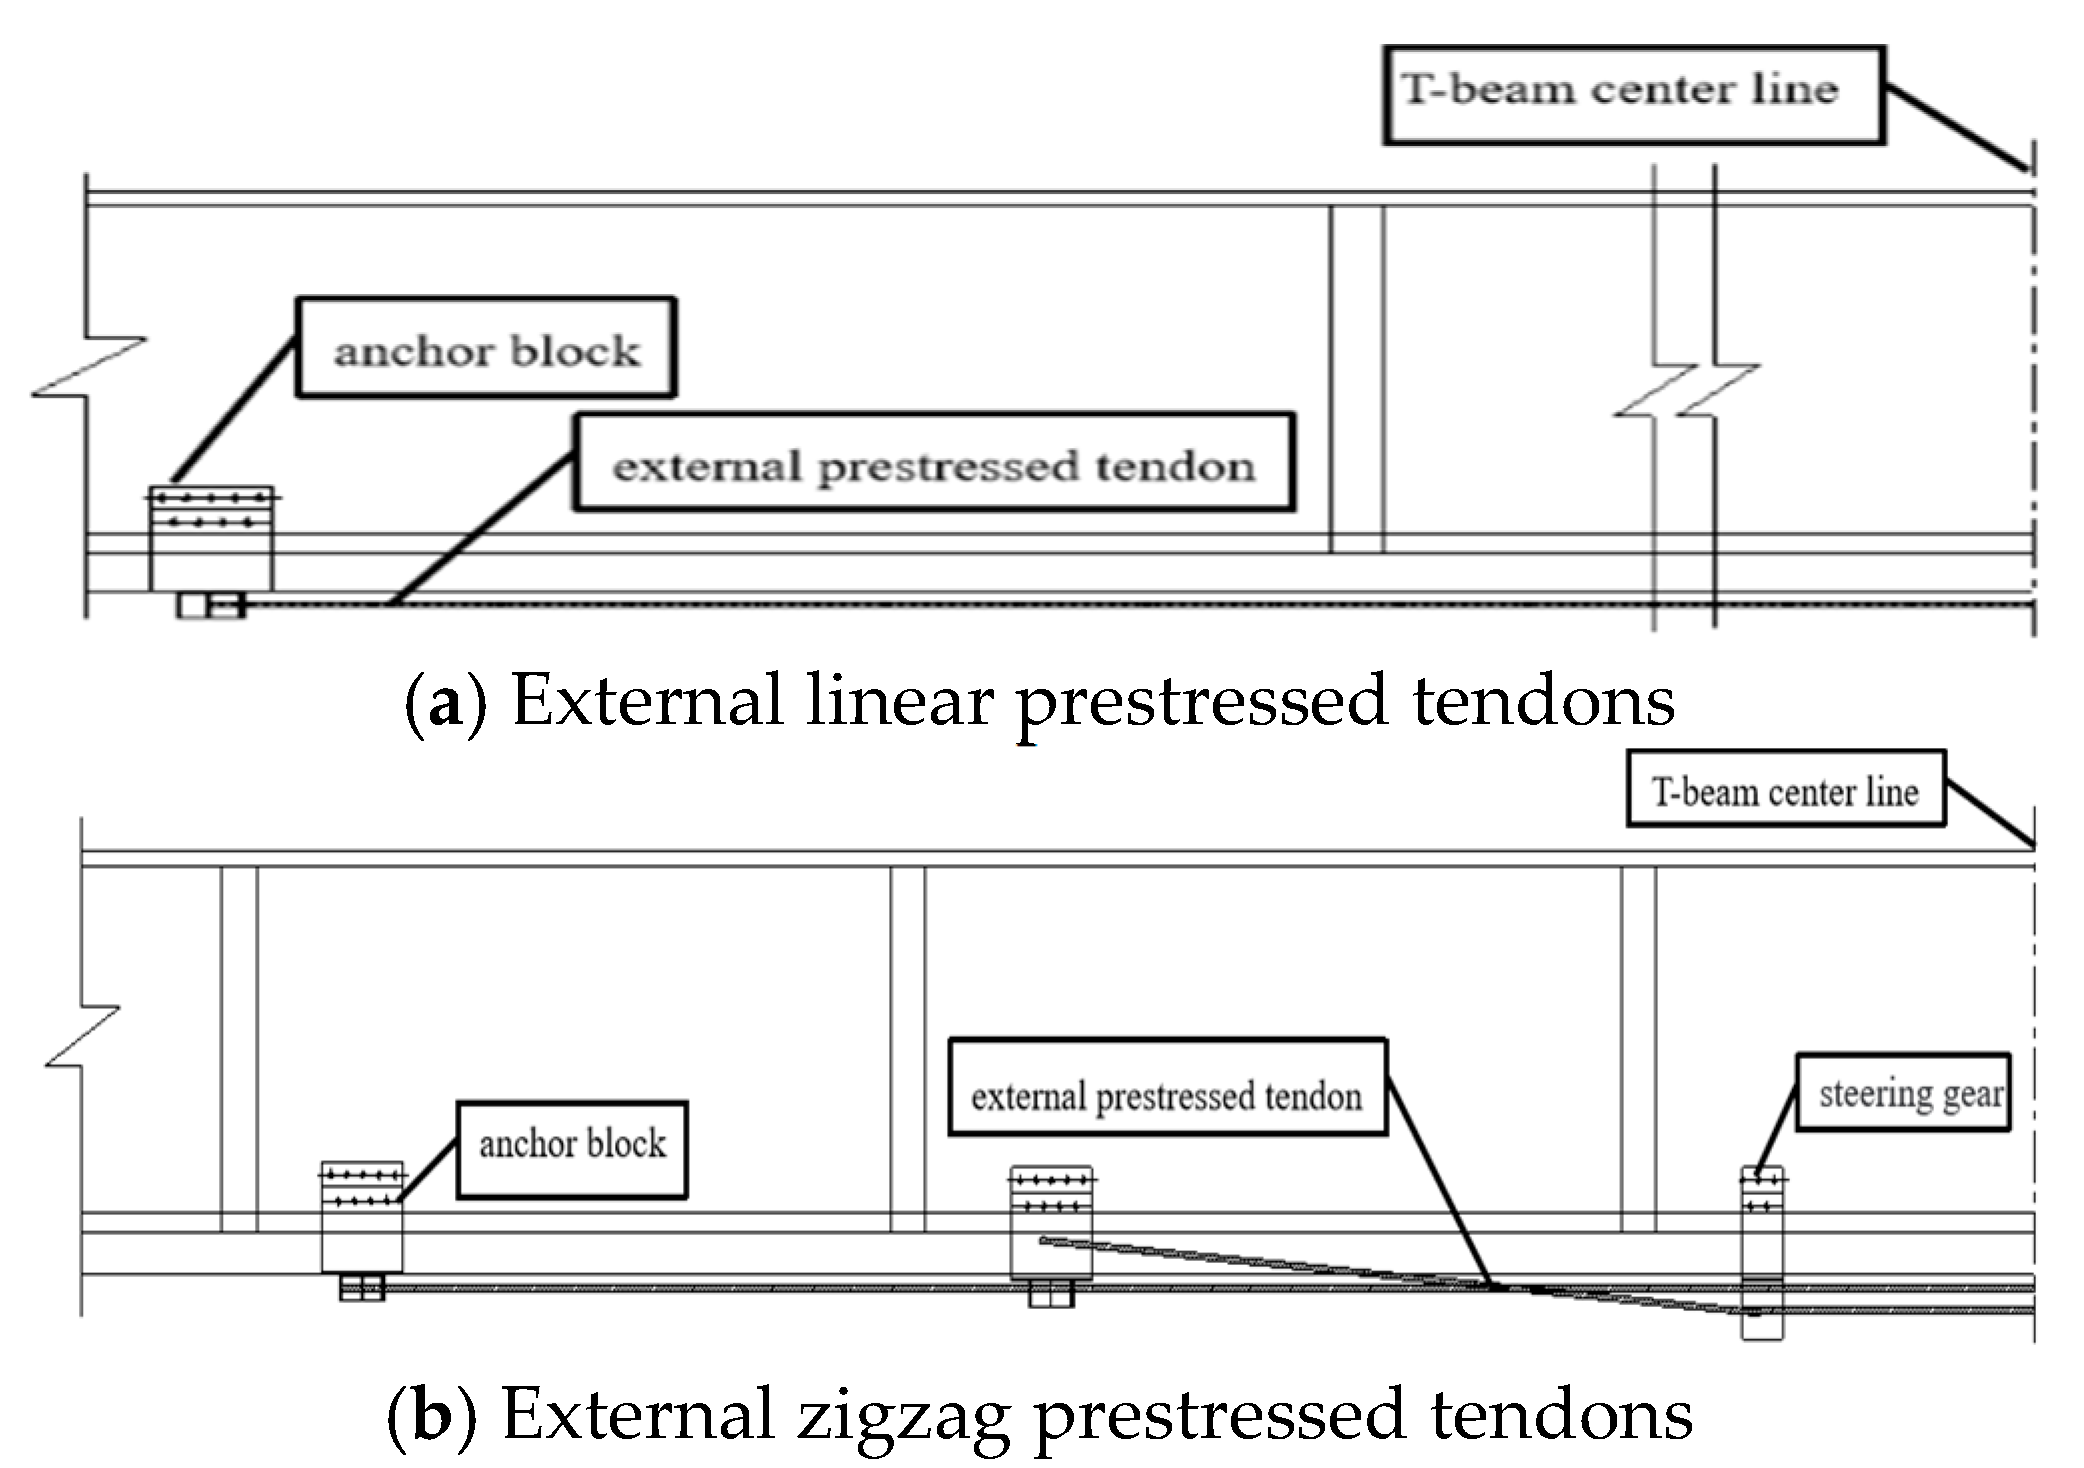
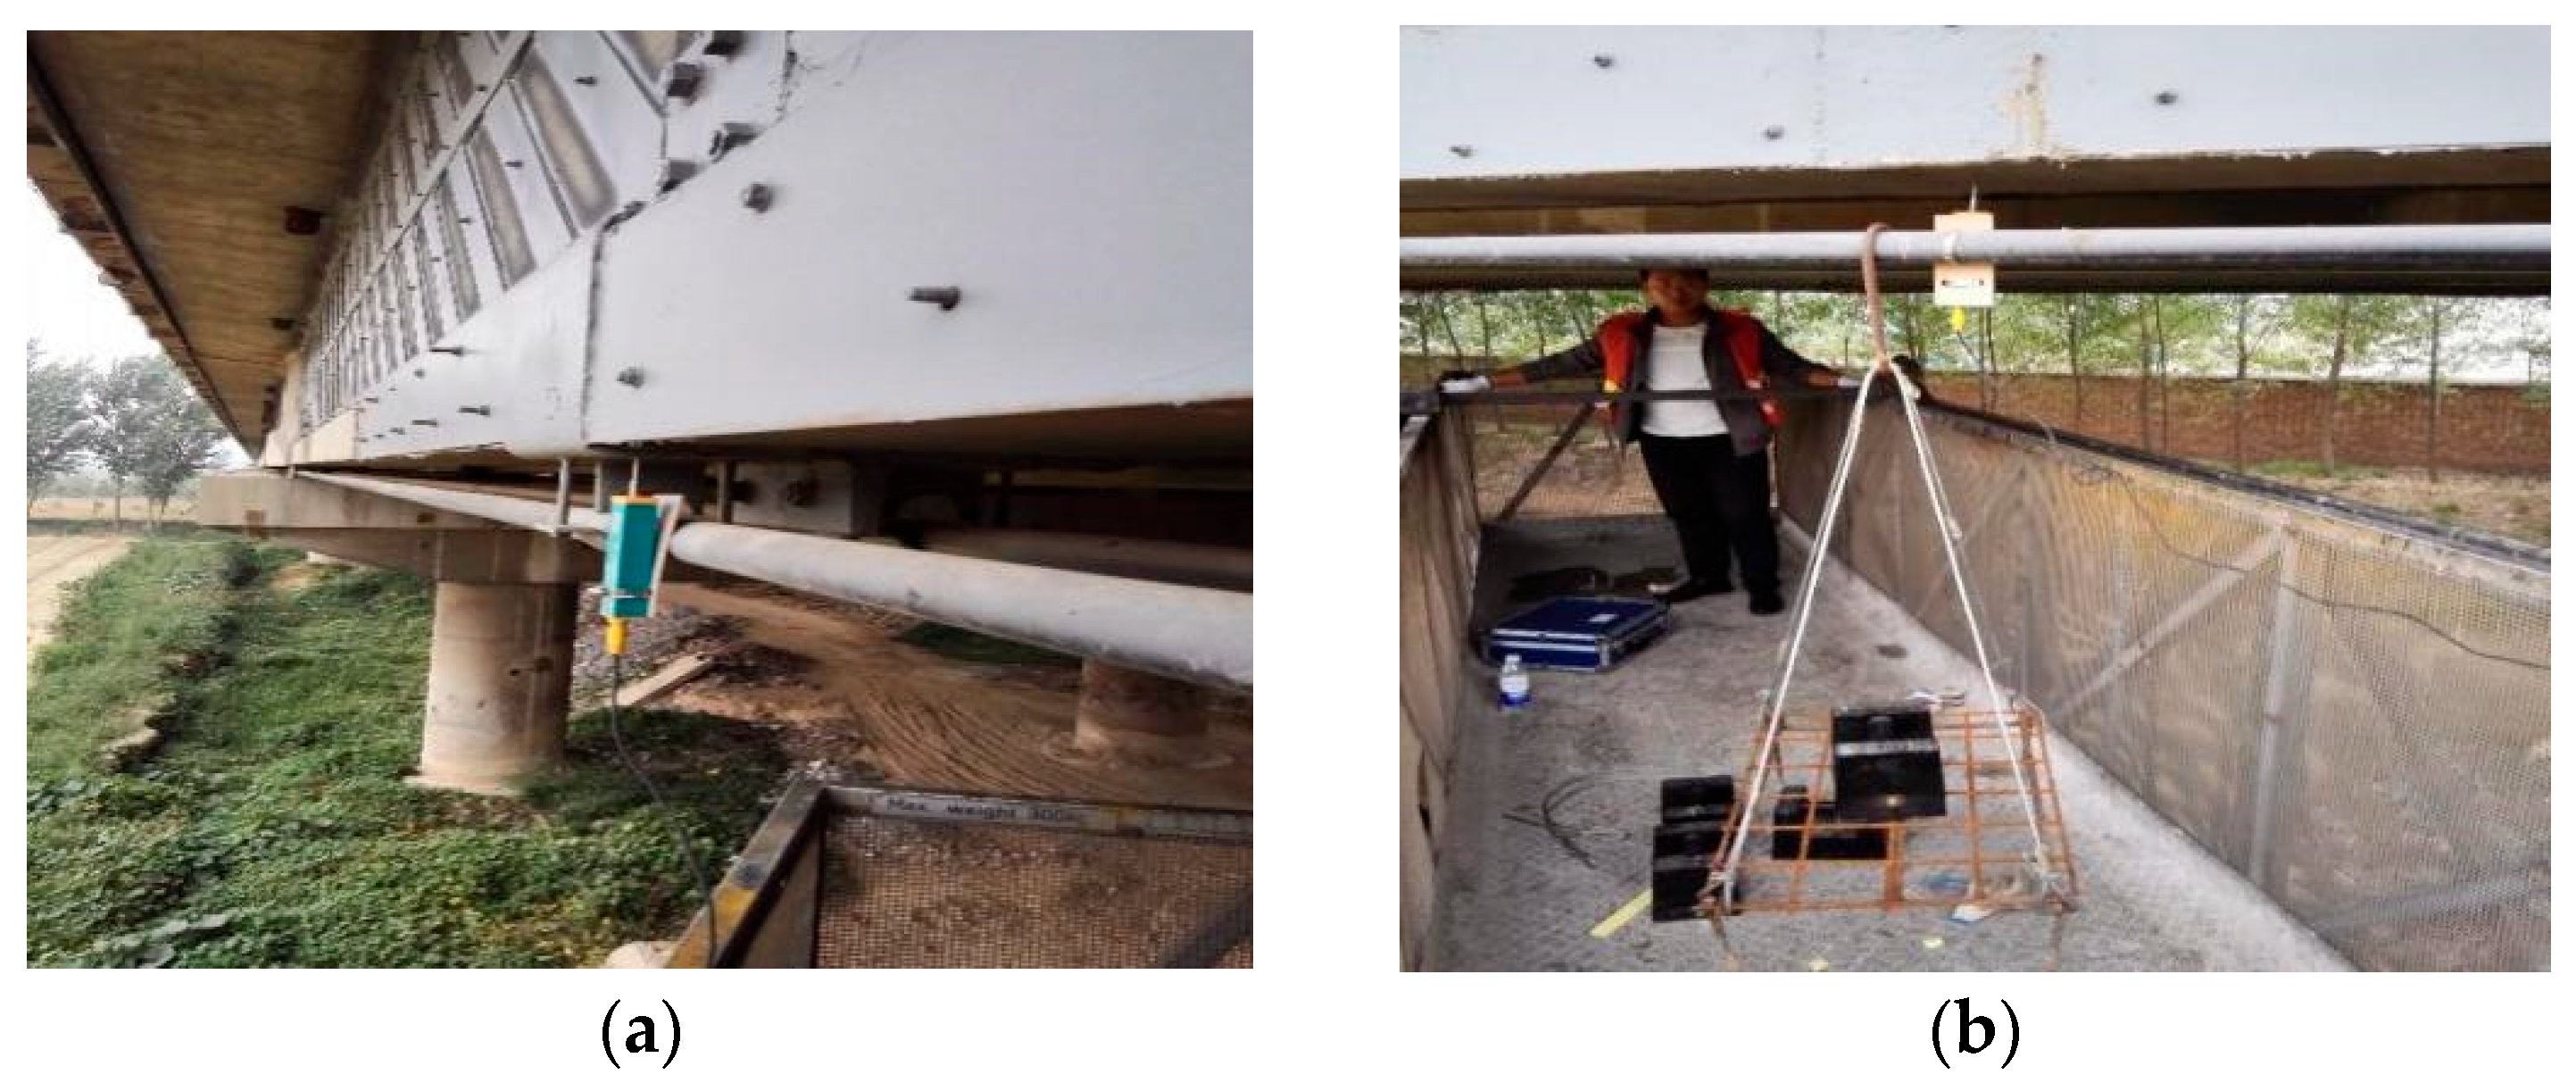
The stress loss detection of the external prestressed tendons of a bridge reinforced by external tendons was carried out, and the arrangement of the external prestressed tendons is shown in Figure 7. By using the method proposed in this paper, the effective internal forces were detected, and then the effective stress could be obtained through calculation. The basic measurement methods are consistent with those described in Section 2.2, and there are four scenarios of external prestressed tendons measurement for existing bridges respectively corresponding to Figure 8a–d.

3.2. Detection Procedure

Firstly, install the testing instrument, reset the displacement meter to zero, and measure the distances between each measurement point. Then, repeat multiple preloads in a cycle to eliminate the inelastic deformation at the anchor block and the steering gear. Finally, apply counterweights step by step until the maximum loading grade is reached, and record the displacement values under each level of load. After testing, a loading grade of 20 kg per level was adopted. When the loading reached 140 kg, the data tended to be stable and could be used to calculate the effective stress. Figure 9 shows the on-site test situation.

3.3. Measured Data and Calculations

The arrangement form of the external prestressed tendons of the 40 m T-beam is linear. Its theoretical effective force is 135 kN. When the measured force is 127 kN, the stress loss rate is 5.6%. The overall measurement result is stable at 5.8%, and the maximum loss rate is 30.3%. All the test results will be further statistically analyzed in the following text.

4. Results and Analysis

4.1. Statistic Analysis of Data

Through the statistics of the detection results, it was obtained that the effective stress losses of the external beams of the 20 m and 40 m T-beams were both above 10%. Compared with the original tensioning control stress, the average loss rates were 21.5% and 22%, respectively. The average value of the stress loss rate of linear and zigzag external tendons for 50 m T-beams were 18.26% and 14.56% respectively. According to the relevant provisions of the “Code for Reinforcement Design of Highway Bridges”, the compression loss of the anchor and the relaxation loss of the steel strands can be calculated according to Equations (11) and (12).
    σ l 2 =   Δ l l E p
Here, σ l 2 is stress loss caused by anchor compression;   Δ l is the sum of anchor deformation, reinforcement retraction and joint compression values; l is the distance from the tensioning end to the anchoring end; E p is the elastic modulus of prestressed tendons.
σ l 5 = ψ ζ 0.52 σ p e f p k 0.26 σ p e
Parameters ψ and ζ are the tensile coefficient and relaxation coefficient, respectively. Parameters σ p e and f p k are standard values of tensile control stress and tensile strength, respectively.
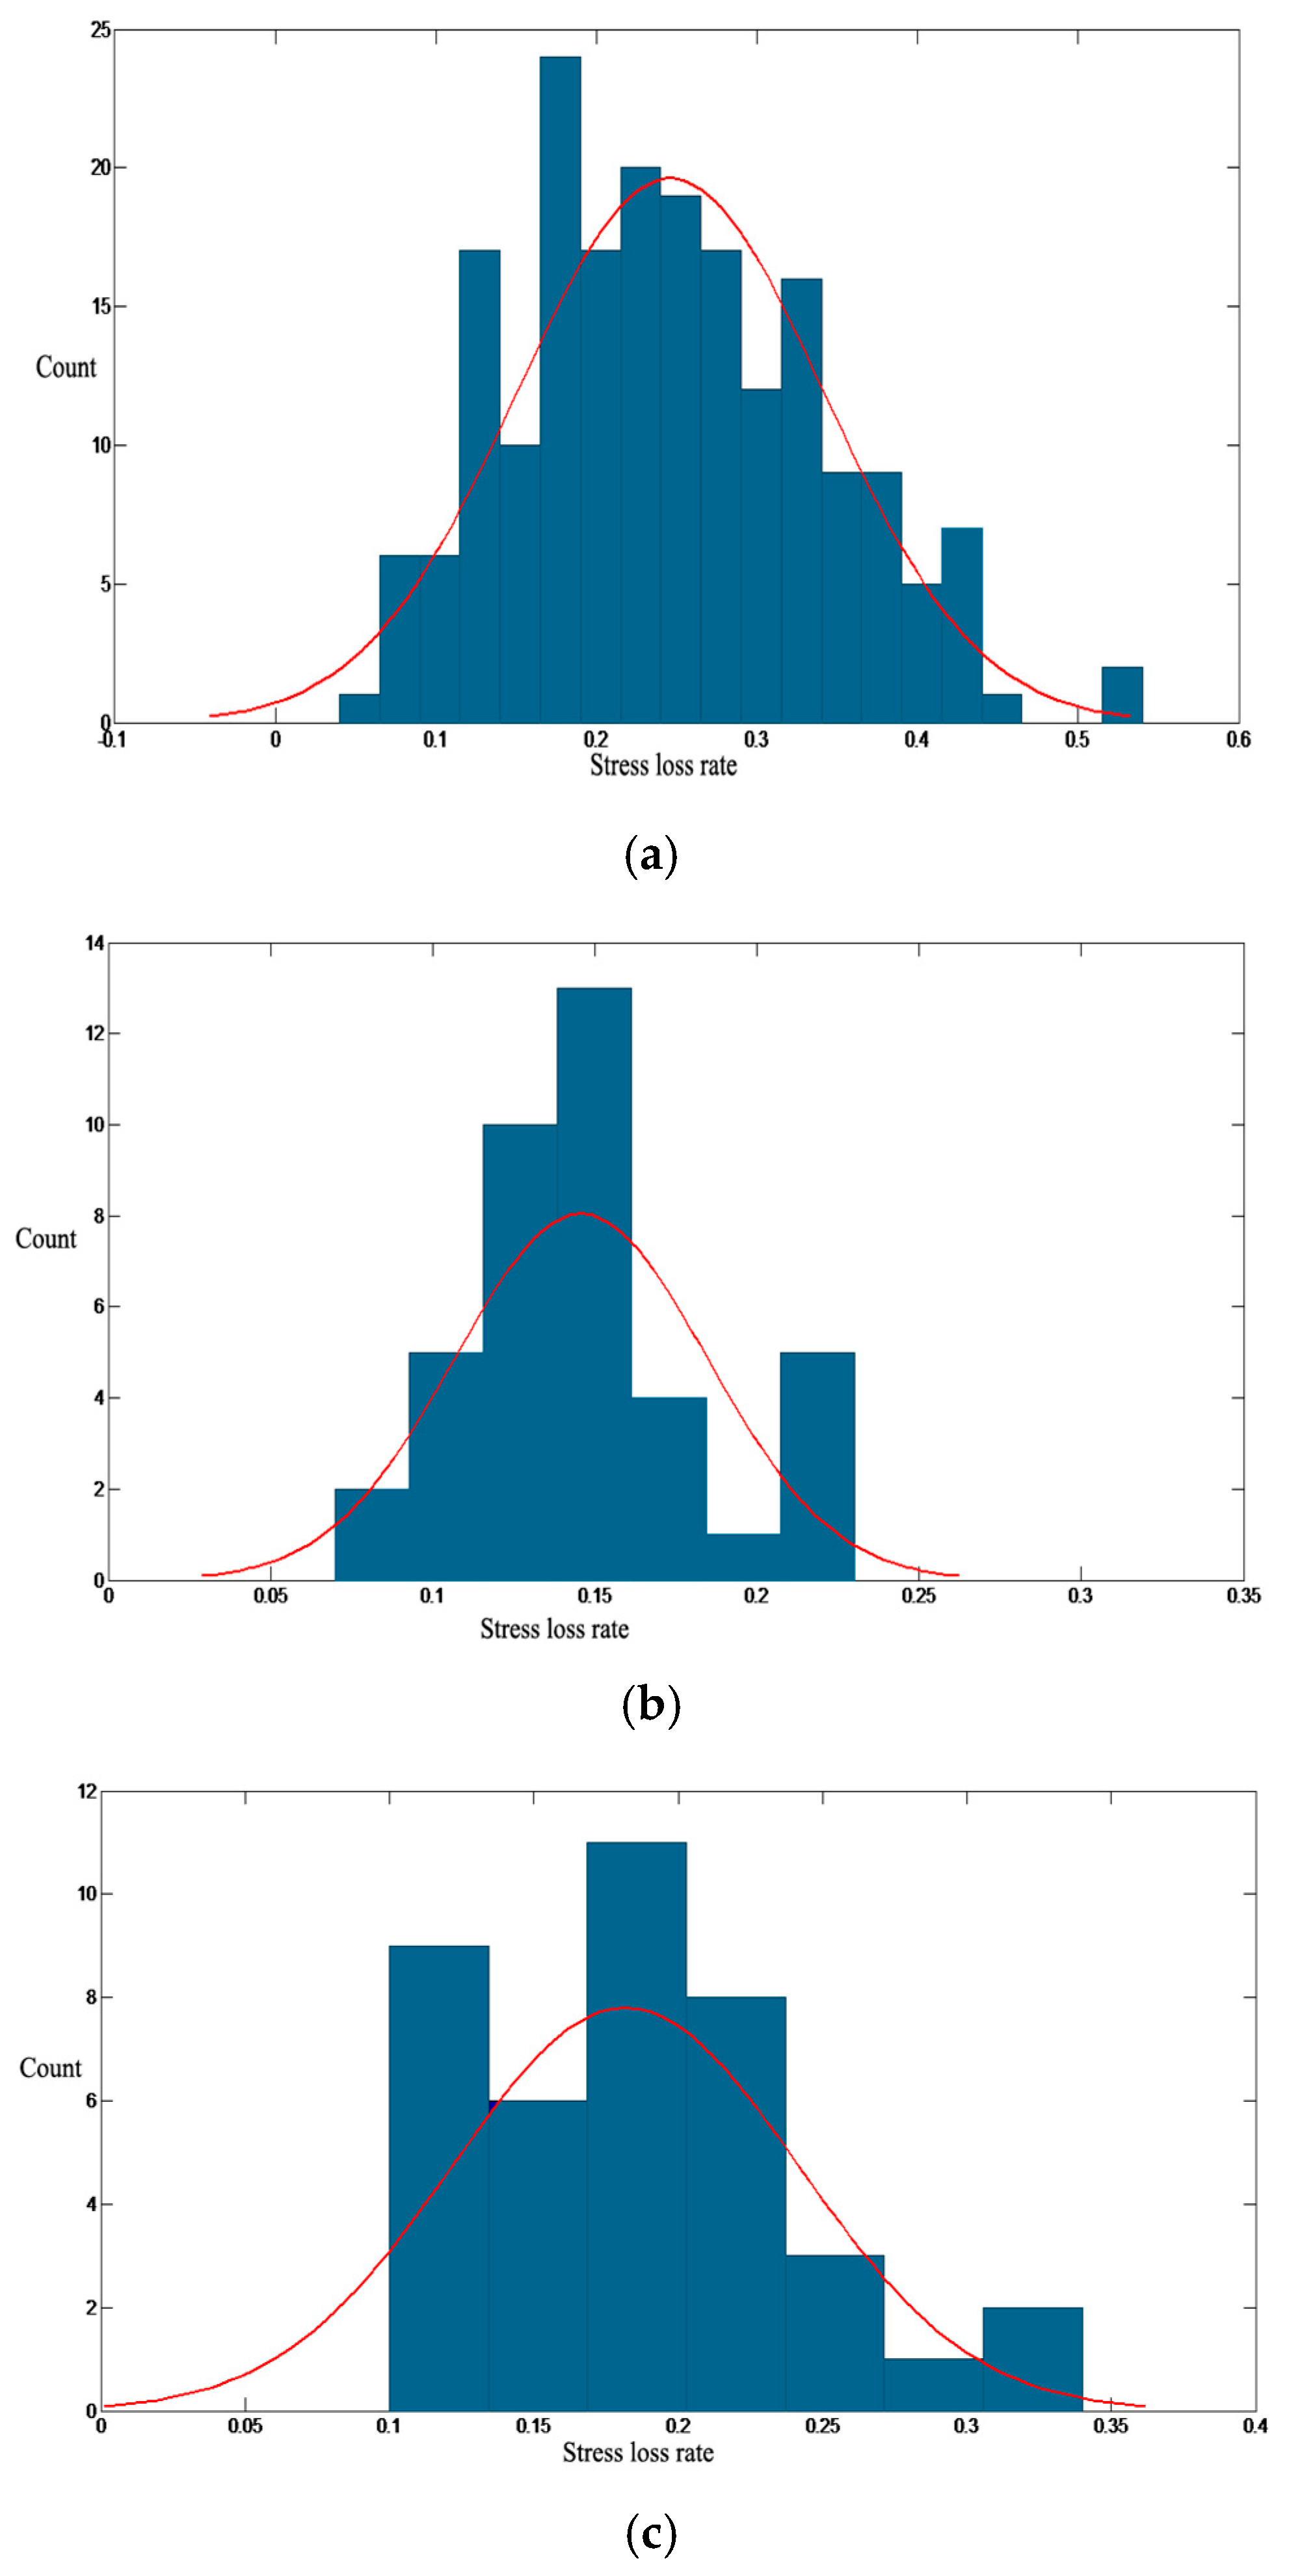
In addition, it is difficult to quantitatively calculate the stress loss of the external tendon caused by looseness of bolts, deformation of the steel anchor box itself and external factors. Therefore, a probability-fitting analysis of the loss rate was carried out. Figure 10 respectively presents the probability fitting of the stress loss ratio in the external prestressed tendons of the 40 m and 50 m T-beams. It can be seen from the figures that the stress loss rate of the external bundles under each span type is assumed to follow a basically normal distribution. To verify the correctness of the hypotheses, the goodness-of-fit hypothesis testing function of normal distribution in Matlab R2022a software was adopted to conduct hypothesis testing on the assumed types of normal distribution.
From the corresponding probability eigenvalue results given in Table 2 and Table 3, it can be accepted that the stress loss rate of the external tendon follows normal distribution. The test function used is Equation (13).
H , P , J , C V = j b t e s t x , a l p h a
H represents the test result. If H = 0, it can be considered that the data x follows normal distribution. If H = 1, it can be denied that X follows normal distribution. P represents the probability value of accepting the hypothesis. The closer P is to 0, the null hypothesis that it is a normal distribution can be rejected. J is the value of the test statistic, and CV is the critical value for whether to reject the null hypothesis. Alpha represents the significance level, and the default is 0.05. What is noteworthy is that external uncertain factors will definitely introduce non-normal components that should be taken into account in actual measurement. A more accurate model needs to be adopted to fit the data for more detailed analysis.

4.2. Analysis of the Influence of Stress Loss on the Reinforcement Effect of Bridges

The prestress loss has basically no impact on the ultimate bearing capacity of the bridge, but the magnitude of the tensile stress has a relatively significant influence on the stiffness and cracking bending moment of the T-beam. However, the current code does not specify the magnitude of the external prestressed reinforcement tensile force. Here, the ratio of stress at the bottom edge of the T-beam under self-weight and prestressed load to that under vehicle load is defined as the compressive stress reserve coefficient of the bridge. This is an indicator for evaluating the influence of external tendon stress loss on the reinforcement effect of the bridge, taking into account the degradation of the actual performance of the bridge, as shown in Equation (14).
η = Z 1 σ g + σ e x ξ q σ q
where η is the compressive stress reserve coefficient of the bridge; Z 1 is the bridge bearing capacity check factor; σ g is the stress of the beam bottom plate under the stress of self-weight and internal prestressed tendon; σ e x is the stress of the beam bottom plate under the function of external prestressed tendon; σ q is the design of the beam bottom plate stress under the super-20 load; and ξ q is the live load influence correction factor.
The proposed coefficient correlates with the requirement for crack resistance verification under the normal service limit state of the structure—no tensile stress occurs on the tensile edge in the Specifications for Design of Highway Reinforced Concrete and Prestressed Concrete Bridges and Culverts (JTG 3362-2018) and checking the coefficient from the Specification for Inspection and Evaluation of Load-bearing Capacity of Highway Bridges (JTG/T J21-2011).
The finite element model of the planar bar system is established by ANSYS 18.0 APDL to calculate, the T-beam is simulated by Solid65 eight-node three-dimensional solid elements and the prestressed tendons and ordinary steel bars are simulated by Link8 two-node three-dimensional bar elements. The bonding and sliding effects between reinforced concrete are not considered. The steel bar elements and concrete elements are treated by the node coupling method. The prestressed effect is simulated by the initial strain method. The boundary conditions of the model are simulated by the simply supported structure of the actual bridge.
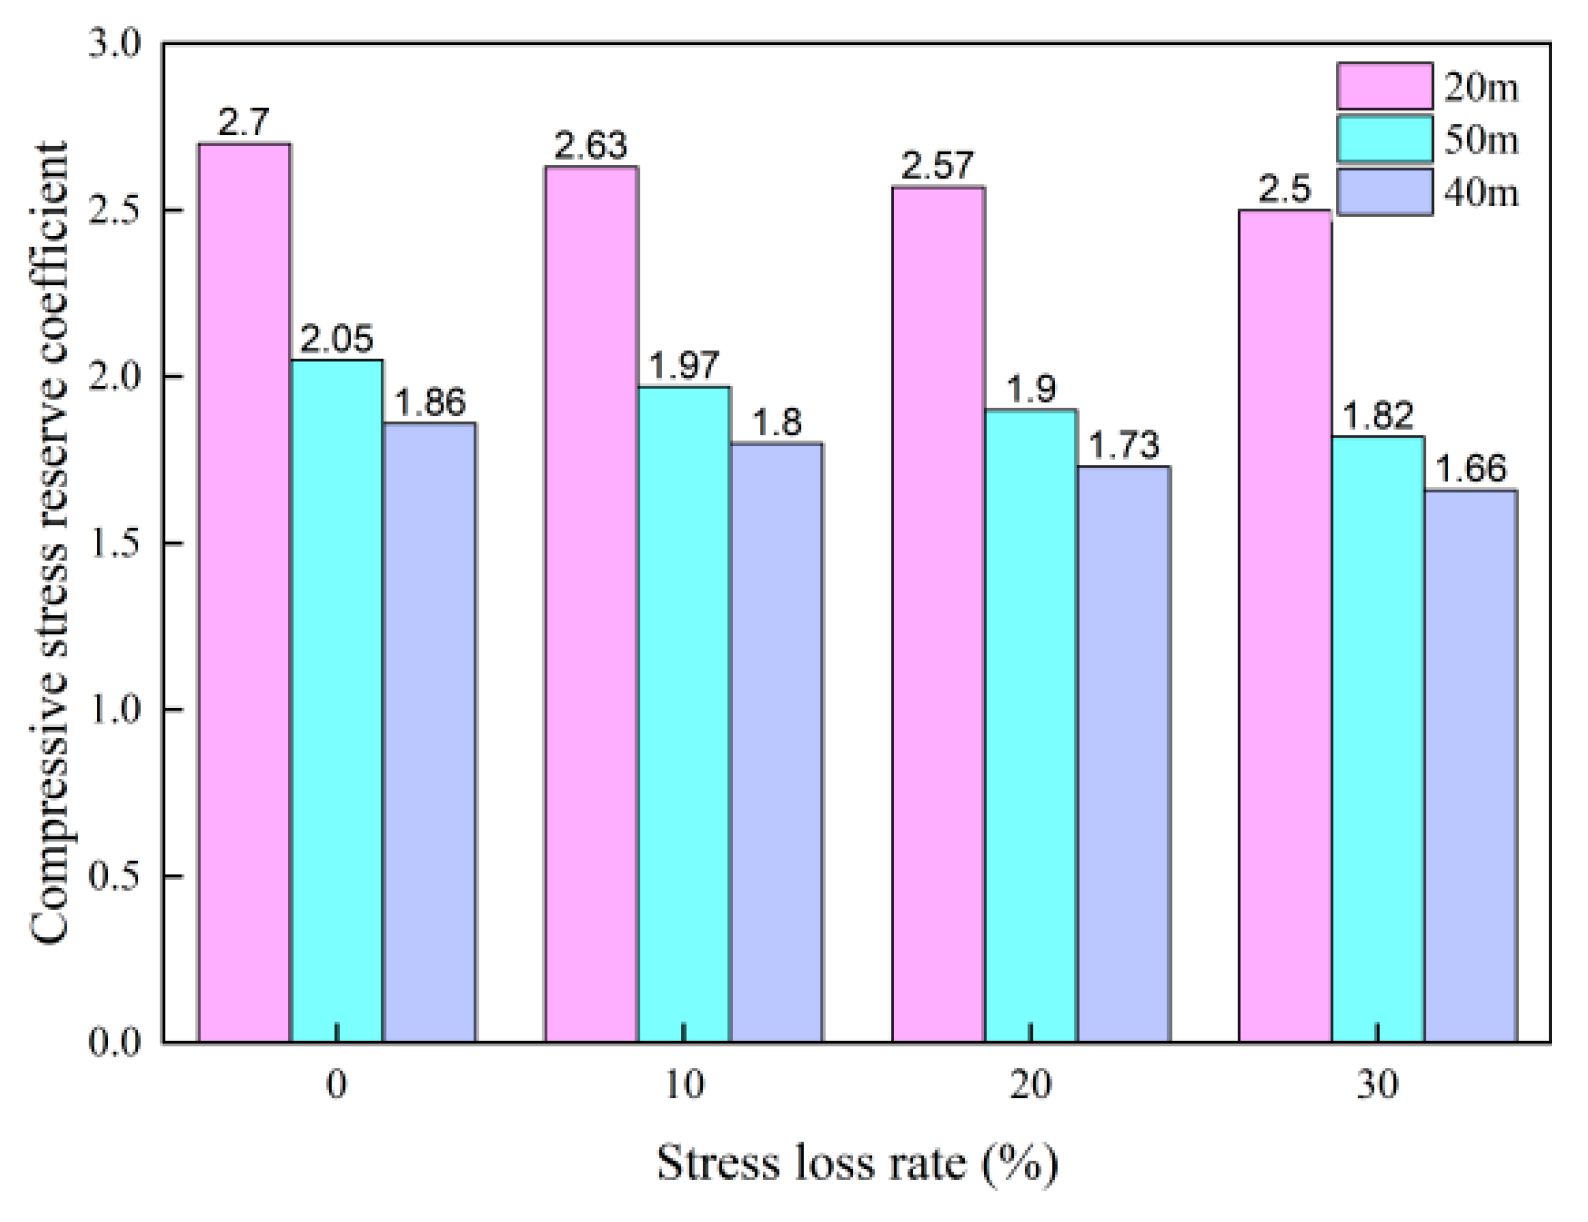
The stress of the T-beam bottom edge under load was shown in Table 4. The compressive stress reserve coefficients of the 20 m, 50 m and 40 m T-beams before reinforcement were 2.05, 1.28 and 1.2, respectively. They notably increased by 31.59%, 60.50% and 54.82%, respectively, after the external prestressed reinforcement was adopted.
Figure 11 presents the changes of the compressive stress reserve coefficients when the external tendon stress of different bridge spans was reduced by 10%, 20% and 30%, respectively, and the decrease rate of the compressive stress reserve coefficient is linearly proportional to that of the stress loss rate of the external tendon. Relevant calculation formulas were obtained.

5. Conclusions

The purpose of this study is to propose a method for detecting and calculating the stress loss of the external prestressed tendon and to conduct a safety assessment of the stress damage conditions of 20 m, 40 m and 50 m T-beams reinforced by prestressed tendons through theoretical derivation and experimental verification. The stress loss rate of external prestressed tendons was statistically analyzed and its influence on the reinforcement effect of bridges was quantitatively calculated. The main conclusions drawn are as follows:
1.
The calculation formulas for different arrangements of prestressed tendons were derived based on the variational principle. The results of the transverse tensioning test show that as the transverse tension increases, the theoretically calculated value will gradually approach the measured value and tend to be stable. Eventually, the error between them can be controlled within 5%, indicating that this method is accurate and feasible.
2.
The stress loss of the external prestressed tendons of 40 m and 50 m T-beams was detected and calculated using the proposed method. Both their stress loss rates and quantities conformed to the normal distribution after counting, and the hypothesis test fitting curves also conformed to the assumption. Taking environmental factors into account in actual measurement is an area that deserves investigation.
3.
The ratio of the compressive stress at the bottom edge of the T-beam under self-weight and prestressed load to the tensile stress under vehicle load was proposed as the compressive stress reserve coefficient of the bridge. It was found that the decreased value of the compressive stress reserve coefficient was linearly proportional to the additional stress loss of the external prestressed tendon through calculating the coefficient at pre-strengthening, post-strengthening and post-prestress-loss scenarios. The compressive stress reserve coefficient could be used as an evaluation index for the influence of stress damage on the reinforcement effect and the supplementary tensioning of prestressed tendons.

Author Contributions

X.Z.: Supervision, Resources, Methodology, Investigation. G.T.: Formal analysis, Data curation, Project administration, Writing—review & editing. B.T.: Writing—review & editing, Writing—original draft, Software, Methodology, Investigation. J.Y.: Investigation, Resources, Visualization. X.D.: Investigation, Resources, Visualization. All authors have read and agreed to the published version of the manuscript.

Funding

This research received no external funding.

Data Availability Statement

Data will be made available on request.

Conflicts of Interest

The authors declare that they have no known competing financial interests or personal relationships that could have appeared to influence the work reported in this paper.

Abbreviations

η The compressive stress reserve coefficient of the bridge
Z 1 Bridge bearing capacity check factor
σ g The stress of the beam bottom plate under the stress of self-weight and internal prestressed tendon
σ e x The stress of the beam bottom plate under the function of external prestressed tendon
σ q The design of the beam bottom plate stress under the super-20 load
ξ q Live load influence correction factor

References

  1. Zanini, M.A.; Toska, K.; Faleschini, F.; Pellegrino, C. Seismic Reliability of Reinforced Concrete Bridges Subject to Environmental Deterioration and Strengthened with FRCM Composites. Soil Dyn. Earthq. Eng. 2020, 136, 106224. [Google Scholar] [CrossRef]
  2. Park, Y.H.; Park, C.; Park, Y.G. The Behavior of an In-Service Plate Girder Bridge Strengthened with External Prestressing Tendons. Eng. Struct. 2005, 27, 379–386. [Google Scholar] [CrossRef]
  3. Panigrahi, S.K.; Salunke, P.J.; Gore, N.G. Rehabilitation, Monitoring and Strengthening of Bridges. Int. Res. J. Eng. Technol. 2015, 4. [Google Scholar]
  4. Miyamoto, A.; Tei, K.; Nakamura, H.; Bull, J.W. Behavior of Prestressed Beam Strengthened with External Tendons. J. Struct. Eng. 2000, 126, 1033–1044. [Google Scholar] [CrossRef]
  5. Straninger, W.; Wicke, M. Bridge Strengthening with Additional Prestressing. Struct. Eng. Int. 1995, 5, 78–80. [Google Scholar] [CrossRef]
  6. Madaj, A.; Mossor, K. Evaluation of External Prestressing as a Strengthening Method for Existing Concrete Bridges. Struct. Eng. Int. 2019, 29, 412–416. [Google Scholar] [CrossRef]
  7. Seręga, S.; Faustmann, D.H. Flexural Strengthening of Reinforced Concrete Beams Using External Tendons. Eng. Struct. 2022, 252, 113277. [Google Scholar] [CrossRef]
  8. Zou, J.; Huang, Y.; Feng, W.; Chen, Y.; Huang, Y. Experimental Study on Flexural Behavior of Concrete T-Beams Strengthened with Externally Prestressed Tendons. Math. Biosci. Eng. 2019, 16, 6962–6974. [Google Scholar] [CrossRef]
  9. Omar, A.H.; Gullu, M.F.; Ahmed, G.H. Experimental and Analytical Investigation of T-Beams Retrofitted through the External Post-Tensioning Using Steel and Various FRP Strands. Structures 2024, 68, 107129. [Google Scholar] [CrossRef]
  10. Mo, D.; Zhang, L.; Wang, L.; Wu, X. A PZT Active Sensing Method for Monitoring Prestressing Force Based on the Ultrasonic Reflection Coefficient. Measurement 2024, 228, 114348. [Google Scholar] [CrossRef]
  11. Chen, S.-Z.; Wu, G.; Xing, T.; Feng, D.-C. Prestressing Force Monitoring Method for a Box Girder through Distributed Long-Gauge FBG Sensors. Smart Mater. Struct. 2017, 27, 015015. [Google Scholar] [CrossRef]
  12. Shi, L.; He, H.; Yan, W. Prestress Force Identification for Externally Prestressed Concrete Beam Based on Frequency Equation and Measured Frequencies. Math. Probl. Eng. 2014, 2014, 1–13. [Google Scholar] [CrossRef]
  13. Nejati, H.R.; Nazerigivi, A.; Imani, M.; Karrech, A. Monitoring of Fracture Propagation in Brittle Materials Using Acoustic Emission Techniques-A Review. Comput. Concr. 2020, 25, 15–27. [Google Scholar] [CrossRef]
  14. Kim, J.; Kim, J.-W.; Park, S. Investigation of Applicability of an Embedded EM Sensor to Measure the Tension of a PSC Girder. J. Sens. 2019, 2019, 2469647. [Google Scholar] [CrossRef]
  15. Identification of Prestress-Loss in PSC Beams Using Modal Information | Request PDF. Struct. Eng. Mech. 2004, 17, 467–482. [CrossRef]
  16. Huynh, T.-C.; Kim, J.-T. RBFN-Based Temperature Compensation Method for Impedance Monitoring in Prestressed Tendon Anchorage. Struct. Control Health Monit. 2018, 25, e2173. [Google Scholar] [CrossRef]
  17. Nguyen, K.-D.; Kim, J.-T. Smart PZT-Interface for Wireless Impedance-Based Prestress-Loss Monitoring in Tendon-Anchorage Connection. Smart Struct. Syst. 2012, 9, 489–504. [Google Scholar] [CrossRef]
  18. Ahlborn, T.M.; Shield, C.K.; French, C.W. Full-Scale Testing of Prestressed Concrete Bridge Girders. Exp. Tech. 1997, 21, 33–35. [Google Scholar] [CrossRef]
  19. Li, S.; Chang, S.; Li, P.; Zhang, X.; Jiang, N. Optimization of Concrete Surface Sensor Arrangement for Acoustic Emission Monitoring of Prestressed Steel Strand Damage in T-Beams. Appl. Acoust. 2024, 223, 110082. [Google Scholar] [CrossRef]
  20. Chen, R.H.L. An Ultrasonic Method for Measuring Tensile Forces in a Seven-Wire Prestressing Strand. AIP Conf. Proc. 2002, 615, 1295–1302. [Google Scholar] [CrossRef]
  21. Ghorbanpoor, A. Magnetic-Based NDE of Steel in Prestressed and Post-Tensioned Concrete Bridges. In Proceedings of the Structural Materials Technology III: An NDT Conference, San Antonio, TX, USA, 31 March–3 April 1998; SPIE: Bellingham, WA, USA, 1998. [Google Scholar]
  22. Kwahk, I.; Park, K.-Y.; Choi, J.-Y.; Kwon, H.; Joh, C. Non-Destructive Evaluation for Sectional Loss of External Tendon of Prestressed Concrete Structures Using Total Flux Leakage. Appl. Sci. 2020, 10, 7398. [Google Scholar] [CrossRef]
  23. Guo, H.; Yang, J.; Tang, R.; Yang, C.; Xu, F. Monitoring and Analysis of Prestress Loss in Prestressed Box Girder Bridges Strengthened with External Prestressing. Sensors 2024, 24, 4549. [Google Scholar] [CrossRef]
  24. Kim, J.-T.; Ryu, Y.-S.; Yun, C.-B. Vibration-Based Method to Detect Prestress Loss in Beam-Type Bridges. In Smart Structures and Materials 2003: Smart Systems and Nondestructive Evaluation for Civil Infrastructures; SPIE: Bellingham, WA, USA, 2003. [Google Scholar]
  25. Xu, J.L.; Sun, Z. Prestress Force Identification Based on Forced Vibration Tests of Eccentrically Prestressed Concrete Beam. AMR 2012, 479–481, 733–738. [Google Scholar] [CrossRef]
  26. Ye, C.; Butler, L.J.; Elshafie, M.Z.E.B.; Middleton, C.R. Evaluating Prestress Losses in a Prestressed Concrete Girder Railway Bridge Using Distributed and Discrete Fibre Optic Sensors. Constr. Build. Mater. 2020, 247, 118518. [Google Scholar] [CrossRef]
  27. Webb, G.T.; Vardanega, P.J.; Middleton, C.R. Categories of SHM Deployments: Technologies and Capabilities. J. Bridge Eng. 2015, 20, 04014118. [Google Scholar] [CrossRef]
  28. Zhang, Z.; Wu, J.; Zhang, C.; Xu, Q.; Chen, Y.; Wang, Z. Identification of Effective Prestress of Steel Strand Based on Blind-Hole Method. Tiedao Xuebao 2023, 45, 166–175. [Google Scholar]
  29. Wu, W.; Chen, S.; Dong, C.; Peng, W.; Yun, J.; Nie, L. Numerical Simulation and Experimental Study on Detecting Effective Prestress of 1860-Grade Strands Based on the Drilling Method. Coatings 2023, 13, 1869. [Google Scholar] [CrossRef]
  30. Mathar, J. Determination of Initial Stresses by Measuring the Deformations Around Drilled Holes. Trans. Am. Soc. Mech. Eng. 2023, 56, 249–254. [Google Scholar] [CrossRef]
  31. Schajer, G.S. Advances in Hole-Drilling Residual Stress Measurements. Exp. Mech. 2010, 50, 159–168. [Google Scholar] [CrossRef]
  32. Vimalanandam, V.; Babu, S.; Sreenath, H.G.; Rao, G.; Rao, A.S. Estimation of Residual Prestress in Uninstrumented Prestressed Concrete Structures Using SSRHT in Wires. Indian Concr. J. 2000, 74, 631–636. [Google Scholar]
  33. Blödorn, R.; Viotti, M.R.; Schroeter, R.B.; Albertazzi, A. Analysis of Blind-Holes Applied in the Hole-Drilling Method for Residual Stress Measurements. Exp. Mech. 2015, 55, 1745–1756. [Google Scholar] [CrossRef]
  34. Yun, J.; Chen, S.; Dong, C.; Wu, W.; Nie, L.; He, M. Detection of Effective Prestressing of 1860-Grade Strands Based on the Microporous Method. Sci. Rep. 2024, 14, 26084. [Google Scholar] [CrossRef] [PubMed]
  35. Schajer, G.S. Measurement of Non-Uniform Residual Stresses Using the Hole-Drilling Method. Part II—Practical Application of the Integral Method. J. Eng. Mater. Technol. 1988, 110, 344–349. [Google Scholar] [CrossRef]
  36. Schajer, G.S. Application of Finite Element Calculations to Residual Stress Measurements. J. Eng. Mater. Technol. 1981, 103, 157–163. [Google Scholar] [CrossRef]
  37. Mainjot, A.K.; Schajer, G.S.; Vanheusden, A.J.; Sadoun, M.J. Influence of Veneer Thickness on Residual Stress Profile in Veneering Ceramic: Measurement by Hole-Drilling. Dent. Mater. 2012, 28, 160–167. [Google Scholar] [CrossRef]
  38. Osborn, G.P.; Barr, P.J.; Petty, D.A.; Halling, M.W.; Brackus, T.R. Residual Prestress Forces and Shear Capacity of Salvaged Prestressed Concrete Bridge Girders. J. Bridge Eng. 2012, 17, 302–309. [Google Scholar] [CrossRef]
Figure 1. Diagram of prestressed tendon deformation without restrictor.
Buildings 15 03056 g001
Figure 2. Diagram of prestressed tendon deformation with single restrictor.
Buildings 15 03056 g002
Figure 3. Diagram of prestressed tendon deformation with double restrictors.
Buildings 15 03056 g003
Figure 4. Illustration of the transverse tensioning test of prestressed tendon.
Buildings 15 03056 g004
Figure 5. Loading device.
Buildings 15 03056 g005
Figure 6. The variation diagram of the calculated internal force and the measured values as the transverse tension increases.
Buildings 15 03056 g006
Figure 7. The arrangement of the external prestressed tendons of the existing bridge.
Buildings 15 03056 g007
Figure 8. Schematic diagram of effective stress detection of external prestressed tendons. (a) Linear prestressed tendons without restrictor. (b) Linear prestressed tendons with single restrictor. (c) Linear prestressed tendons with double restrictors. (d) Zigzag prestressed tendons with double restrictors.
Buildings 15 03056 g008
Figure 9. Stress loss test of external prestressed tendons. (a) Displacement measurement at the steering gear; (b) Counterweight loading and displacement measurement.
Buildings 15 03056 g009
Figure 10. Probability fitting of stress loss ratio of external prestressed tendons. (a) The probability fitting curve of the stress loss rate of the external prestressed tendons for 40 m T-beam. (b) The probability fitting curve of the stress loss rate of the zigzag external prestressed tendons for 50 m T-beam. (c) The probability fitting curve of the stress loss rate of the straight external prestressed tendons for 50 m T-beam.
Buildings 15 03056 g010
Figure 11. The variety of compressive stress reserve coefficient with stress loss rate increase.
Buildings 15 03056 g011
Table 1. The table of effective internal force calculation formula of the prestressed tendon.
Number of restrictorsThe effective internal force calculation formula of the prestressed tendon
Without restrictor F = T L 4 δ   ( L 1 = L 2 = L / 2 )
Single restrictor F = T δ 1 δ 1 2 / L 1 + ( δ 1 δ 2 ) 2 / L 2 + δ 2 2 / L 3
Double restrictors F = T δ 2 δ 1 2 / L 1 + ( δ 2 δ 1 ) 2 / L 2 + ( δ 2 δ 3 ) 2 / L 3 + δ 3 2 / L 4
Table 2. Normal distribution result of external prestressed tendons stress loss rate.
ObjectHPJCV
40 m straight external prestressed tendon00.06135.13345.6756
50 m zigzag external prestressed tendon00.17672.14384.7481
50 m straight external prestressed tendon00.05964.23164.7481
Table 3. Eigenvalues of external prestressed tendons stress loss rate.
ObjectAverage ValueStandard DeviationVariable Coefficient
40 m straight external prestressed tendon0.24610.09560.39
50 m zigzag external prestressed tendon0.14580.03890.27
50 m straight external prestressed tendon0.18180.06010.33
Table 4. The compressive stress reserve coefficients at the bottom of the T-beams.
Bridge Span σ g σ q σ e x η (Unreinforcement) η (Reinforcement)Increase Rate
20 m−14.16.88−4.452.052.7031.59%
50 m−9.237.22−5.581.282.0560.50%
40 m−9.037.51−4.951.201.8654.82%
Disclaimer/Publisher’s Note: The statements, opinions and data contained in all publications are solely those of the individual author(s) and contributor(s) and not of MDPI and/or the editor(s). MDPI and/or the editor(s) disclaim responsibility for any injury to people or property resulting from any ideas, methods, instructions or products referred to in the content.