Abstract
Understanding the combined effects of edge width and cutter ring shape on the rock-breaking performance is critical for optimising disc cutter design. The intrusion test serves as an effective approach for investigating the rock-breaking mechanism of disc cutters. In this study, a two-dimensional discrete element method (DEM) model was established to simulate the intrusion process of a single disc cutter. Three commonly used disc cutter types were analysed: disc cutter with flat edge (FEDC), disc cutter with rounded edge (REDC) and disc cutter with alloy tooth (ATDC). The edge widths ranging from 10 mm to 24 mm were examined to assess their influence on rock crack propagation, stress distribution, cutting force and specific cutting energy. The FEDC and REDC exhibited face-contact extrusion breaking, whereas the ATDC was line-contact embedding breaking. The crack extension range, crack number, force chain intensity, stress distribution, rock-breaking force and specific cutting energy ranks are as follows: FEDC > REDC > ATDC. The ATDC generated a higher proportion of tensile cracks compared to the FEDC and REDC, though with fewer long cracks. The rock-breaking efficiency of the FEDC was lower, whereas the REDC and ATDC exhibited higher efficiency. With the increase in edge width, the force chain distribution became more concentrated, leading to greater internal rock damage, and the number and length of cracks increased significantly. Cracks initially expanded laterally at smaller edge widths but extended downward as edge width increased. The peak force and specific cutting energy increased with increasing edge width; the peak force at an edge width of 24 mm is approximately 3.5 times that of an edge width of 10 mm. The REDC is preferable in hard rock formations, and the ATDC is more effective in soft rock formations. The edge width should be determined based on rock properties and thrust capacity.
1. Introduction
TBMs have been indispensable in deep underground engineering due to their superior excavation efficiency, reduced labour dependency, minimised environmental disruption, and high construction quality [1,2,3,4,5,6]. As the primary rock-cutting tool, the disc cutter’s performance directly governs key operational metrics, including advance rate, energy consumption, and tool longevity [7,8]. The rock-breaking process of disc cutters involves complex mechanical behaviours, such as rock crushing, crack propagation, and chip formation [9,10]. Improving rock-breaking efficiency and reducing cutter wear have always been the ultimate goals of the rock-machine interaction mechanism. The rock-breaking performance of disc cutters is affected by multiple factors [11,12,13], among which the edge width and cutter ring shape are critical parameters determining their interaction with the rock. However, there are still deficiencies in the research on the correlation between the geometric parameters of disc cutters and the rock-breaking performance.
The edge width is a critical parameter that governs the contact area between the disc cutter and the rock, directly influencing the specific pressure distribution (pressure per unit area). Generally, a narrower edge width produces higher localised pressure, which is conducive to fracturing and crack propagation in hard rock formations. However, an excessively narrow edge width may induce severe stress concentrations, accelerating cutter wear and reducing cutter lifespan. Conversely, a wider edge width reduces contact pressure and cutter wear but may require higher rock-breaking forces, potentially diminishing rock-breaking efficiency. Numerical simulations and experimental studies have demonstrated that edge width significantly affects key cutting parameters, including normal force, rolling force, side force, and specific cutting energy [14]. Research indicates that both rock-breaking force and cutting volume increase with edge width, whereas specific cutting energy initially decreases before rising again, reaching an optimal efficiency at an edge width of 13 mm [15]. The crack extension capacity increased and the specific cutting energy decreased with increasing edge width, but high confining pressure limits the effect of the edge width on crack extension [16]. The wearability of the disc cutter increased with increasing edge width and cutter diameter, leading to a reduction in cutter changes [17]. The normal force varied with the edge width [18,19]. Despite these insights, the brittle fracture process in rocks occurs rapidly and transiently, posing significant challenges in capturing real-time rock-breaking dynamics through experimental methods alone.
The cutter ring shape is another critical parameter influencing rock-breaking performance. Common disc cutter ring shapes include FEDC, REDC, and ATDC [20,21,22,23]. Each configuration exhibits distinct mechanical behaviours during rock fragmentation: the large contact area of the disc cutter with the flat cutter ring with the rock leads to high cutting force; the contact area between the alloy tooth cutting ring and the rock is small, resulting in lower cutting force, localised stress concentration, and facilitated crack propagation. The cutter ring shape directly affects the stress distribution and crack extension pattern within the rock. The specific cutting energy of the rounded cutter ring than that of the flat cutter ring; the rock-breaking force of the rounded cutter ring is lower than that of the flat cutter ring. A rounded cutter ring can be considered as a priority in formations with high rock strength and confining pressure [24]. The round-edged disc cutter exhibits higher contact stress concentration but lower cutting force, while promoting more extensive radial crack propagation (extending perpendicularly from the contact zone) compared to other cutter geometries; the flat-edged disc cutter has a smaller contact stress and rock damage range, the cracks are flat, and the cutting force state is better; the rock-breaking performance of the V-edged disc cutter is between the round-edged and the flat-edged disc cutter [25]. While existing research has primarily focused on isolated parameters, the actual rock-breaking process involves the synergistic effects of edge width and cutter ring shape. A comprehensive investigation into their coupled influence remains essential for optimising cutter design and cutting efficiency.
The edge width and cutter ring shape critically influence stress distribution, fragmentation mode, and cutter wear. A well-designed cutter minimises energy waste while maximising penetration rate and durability. The combined effects of edge width and cutter ring shape on rock-breaking performance are costly to model in tests and complex theoretically. To address this challenge, this study established a two-dimensional DEM model by the Particle Flow Code 500 (PFC500) software. By varying the edge width and the cutting ring shape, the rock-breaking performance, including force and efficiency of disc cutters, was obtained. A systematic analysis was conducted for edge widths from 10 to 24 mm and three common disc cutters. The variation trends of the rock crack characterisation, stress distribution characteristics, crack number and distribution, force, and specific cutting energy were studied.
2. Methodology
2.1. Basic Principle of DEM
Rocks are structural bodies formed in a specific geological environment under tectonic actions, with anisotropy and strongly nonlinear behaviour. The discrete element method has significant advantages in simulating the rock-breaking process of disc cutters. The PFC empowers particle-wall and particle-particle contacts through built-in intrinsic models, uses boundary walls to constrain the kinematic behaviour of the medium, and determines the stress equilibrium state of the model in an iterative manner, thus enabling the fine-scale mechanical characteristics of the medium to map macroscopic physical-mechanical properties. There are two kinds of intrinsic models in PFC to simulate the particle bonding damage process: contact bond and parallel bond models [26,27]. This study adopts the parallel bond model to simulate the rock-breaking process of disc cutters. Figure 1 shows the particle contact method of the parallel bond model. The load acting on the particles is distributed to the contact spring and the parallel bonded spring to transmit forces and moments. When the normal or tangential stress exceeds the parallel bond strength, the particle bonds break down, generating tensile or shear cracks.
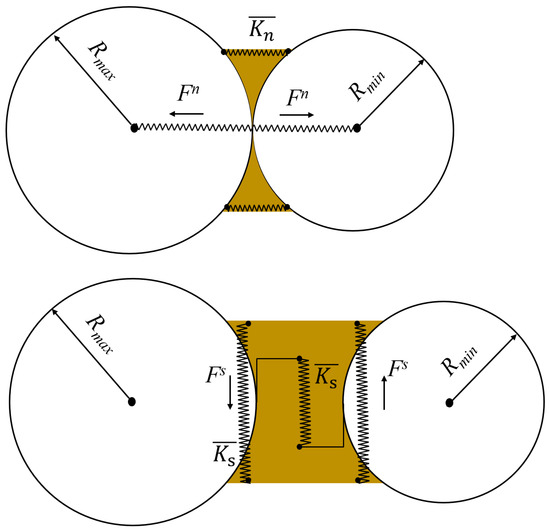
Figure 1.
Particle contact method of parallel bond model [28] (Rmax and Rmin are the maximum and minimum particle radii, respectively; Fn and Fs are the normal and tangential contact forces, respectively; and are the normal and tangential stiffnesses, respectively).
2.2. Calibration of Rock Micro-Parameters
The rock samples used in this test were obtained from a cross-sea tunnel in Shenzhen, China. Based on the International Society of Rock Mechanics (ISRM) testing protocols, specimens with a diameter of 50 mm and a height of 100 mm were used for uniaxial compression tests, and specimens with a diameter of 50 mm and a height of 25 mm were used for Brazilian splitting tests. As shown in Figure 2, the processed rock samples were tested on MTS815 to obtain mechanical parameters, including uniaxial compressive strength (UCS), Brazilian tensile strength (BTS), and elastic modulus for fine-scale parameter calibration of the DEM model. Tests were repeated more than three times to obtain the average value, thus reducing the test error. The average UCS of granite is 178 MPa, the average BTS is 16.4 MPa, and the average elastic modulus is 39.8 GPa.
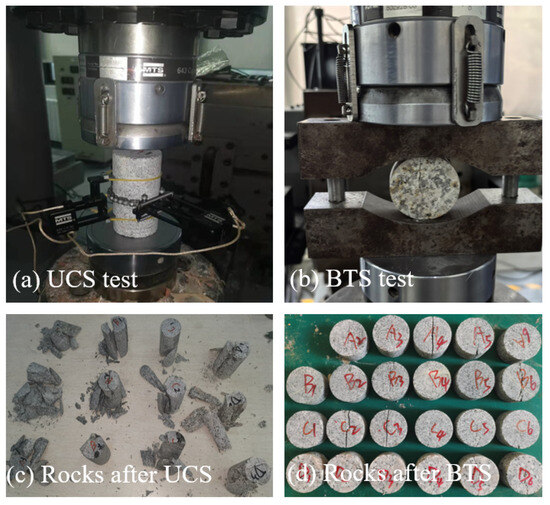
Figure 2.
Measurement of mechanical properties for rocks.
Since the parameters in the PFC model do not correspond to the actual macro-parameters of the rock, the ‘trial-and-error method’ is used to calibrate the particle parameters. Here the parameters such as BTS, UCS, and elastic modulus acquired from the PFC simulation are compared with the actual values measured in the experimental test, and the particle parameters are considered to meet the simulation requirements when the simulated values are close to or the same as the actual values. The Brazilian splitting and uniaxial compression models established during the parameter calibration process are shown in Figure 3. The Brazilian splitting model has a diameter of 50 mm (Figure 3a), and the uniaxial compression model has a size of ϕ50 mm × 100 mm (Figure 3b). A rigid wall is used to simulate the loading plate. The initial simulation was set with a particle porosity of 0.08, a maximum particle radius of 0.3 mm, and a minimum particle radius of 0.2 mm. The experiments were conducted by slowly loading the discs and columns through the walls at both ends with a constant velocity, and the stress and strain data were monitored based on the FISH language. A clear main crack formed in the radial direction of the disc in the Brazilian splitting test (Figure 3a), and an X-shaped crack formed on the surface of the model in the uniaxial compression (Figure 3b), which is basically the same as the damage characteristics of the rock specimens in the actual test.
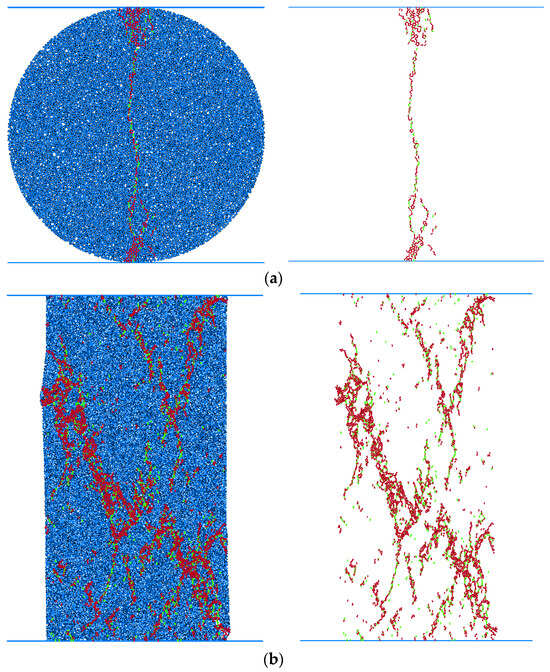
Figure 3.
Parameter calibration experiment of the parallel bond model. (a) Simulation calibration of Brazilian splitting test, (b) simulation calibration of uniaxial compression test.
The particle parameters that are most consistent with the actual rock macroscopic parameters were finally derived through continuous trial and error. The stress–strain curve shown in Figure 4 gave a UCS of 174 MPa, with an error of 2.2% from the actual UCS, and a BTS of 16.4 MPa, which is basically consistent with the actual BTS. Table 1 shows the determined particle parameters of the parallel bond model.
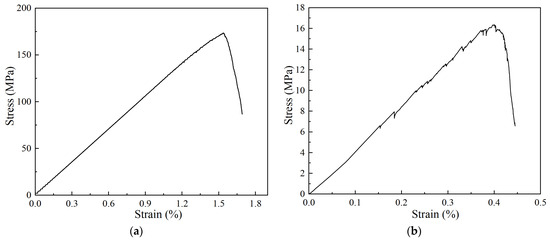
Figure 4.
Stress–strain curve. (a) UCS, (b) BTS.

Table 1.
Mesoscopic parameters of parallel bond model acquired from numerical calibration.
2.3. Numerical Case
The two-dimensional model can visualise the characteristics of rock crack evolution. As shown in Figure 5, the DEM model for disc cutter rock-breaking measures 500 mm in length and 200 mm in height. The two sides and the bottom of the model are constrained by boundary walls, while the upper part is the free surface. Since the strength of the rock is much less than that of the disc cutter, the deformation of the disc cutter is negligible in the model, so multiple sections of the wall are used to form the disc cutter model. A dxf file is exported after drawing the graphic in AutoCAD2021, and PFC models the disc cutter by calling this file. The model contains 31,719 particles. The loading process is simulated by giving the disc cutter wall a constant downward velocity, and the forces, cutting depth, energy, and number of cracks are recorded in real time using the history command until the disc cutter stops after it is loaded to the specified cutting depth.
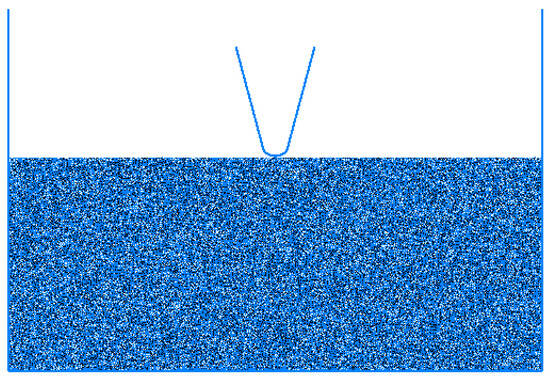
Figure 5.
Particle flow model diagram of rock-breaking by disc cutters.
This study focuses on the effects of disc cutter structural parameters—particularly cutter ring shape and edge width—on rock-breaking characteristics. Currently, the common disc cutter ring shapes include FEDC, REDC, and ATDC. Figure 6a shows a simplified schematic diagram of the different shapes of disc cutters, and the disc cutter is simplified to be composed of multiple segments of the wall. Here, the FEDC is simplified as a straight line, the REDC is simplified as a circular arc, and the ATDC is simplified as a conical shape. The edge width significantly influences the rock-breaking force and efficiency of disc cutters. Current shield machine applications employ widths ranging from 10 to 24 mm. Figure 6b–d show the FEDC, REDC, and ATDC with different edge widths, respectively, while Table 2 provides the specific numerical cases.
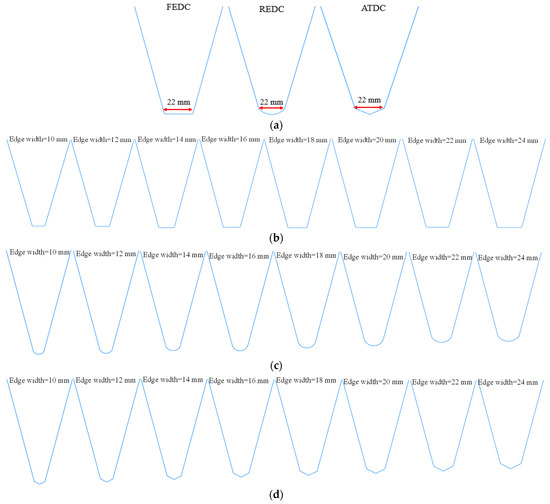
Figure 6.
Disc cutter model. (a) Disc cutter type, (b) FEDC with different edge widths, (c) REDC with different edge widths, (d) ATDC with different edge widths.
Table 2.
Numerical cases.
2.4. Calculation of Rock-Breaking Efficiency
Obtaining the rock-breaking efficiency index is one of the important elements in evaluating the rock-breaking performance of the disc cutter. The rock-breaking efficiency is usually characterised by the specific cutting energy (SE), which can be calculated by Equation (1). Since a two-dimensional model is used to simulate the rock-breaking process of disc cutters, the rock-breaking volume can be simplified to the rock-breaking area. The crushing work derived in the PFC software can be calculated via Equation (2) [29]. As the rock destruction process is manifested as the failure of inter-particle connecting bonds, the calculation of the rock-breaking area, defined as the cumulative area of all failed particles, can be calculated using Equation (3) [30].
where FR is the rolling force, L is the cutting length, V is the rock-breaking volume, S is the rock-breaking area, F is the normal force, u is the normal displacement, W is the crushing work, Fi is the normal force at the ith loading step, ui is the displacement at the ith loading step, n is the loading step, Si is the area of the ith particle, and Ri is the radius of the ith failed particle.
3. Effects of Cutter Ring Shape on Rock-Breaking Performance
3.1. Rock Crack Characterisation
Figure 7 illustrates the rock crack distribution of different disc cutters at an edge width of 22 mm, revealing distinct rock damage degrees caused by different disc cutters. After loading the rock with a REDC, the cracks produced are densely distributed directly below and on both sides of the disc cutter and gradually expand deeper into the rock with increasing cutting depth (Figure 7a). Notably, the cutting depth is the length to which the bottom of the disc cutters penetrates into the rock. After loading the rock with a FEDC, the cracks produced are densely distributed directly below the disc cutter and gradually expand deeper into the rock; the damage range of rocks is large (Figure 7b). After loading the rock with an ATDC, the cracks are densely distributed directly under and on both sides of disc cutters, did not expand deeper into the rock, but to the lateral direction, and the rock damage range is small (Figure 7c). Notably, the FEDC and the REDC are in face contact with the rock, which is extruded breaking, while the ATDC is in line contact with the rock, which is embedded breaking. The ATDC causes lateral damage, and the EFDC and REDC cause deeper damage. Overall, the rock damage range and crack extension follow: FEDC > REDC > ATDC.
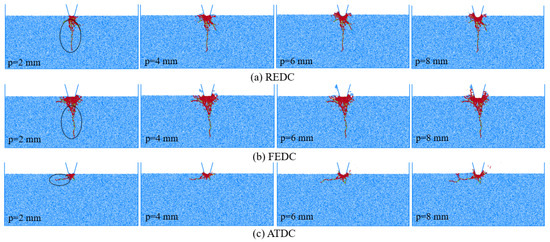
Figure 7.
Failure distribution of rocks for different disc cutters (edge width = 22 mm).
Figure 8 displays the force chain distribution of rocks for different disc cutters. The force chains become sparser with increasing distance from the cutter, while reaching maximum density directly beneath the cutter interface. The larger area of contact between the FEDC and the rock induces a greater degree of rock damage directly below the disc cutter, generating a denser distribution of force chains. Conversely, ATDC’s sharply tapered tip minimises rock contact area, resulting in confined damage and sparser force chains. The contact area between the REDC and the rock is intermediate, and the intensity of force chain distribution is moderate. Overall, the intensity of the force chain ranks: FEDC > REDC > ATDC.
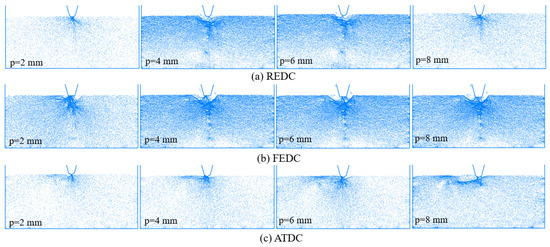
Figure 8.
Force chain distribution of rocks for different disc cutters (edge width = 22 mm).
3.2. Stress Distribution of Rocks
Figure 9 shows the stress distribution diagram of different disc cutters. There are differences in the stress distribution characteristics of different disc cutters. The stresses are mainly concentrated in the cutter-rock contact area and are generally transferred in all directions. There are positive and negative stress areas within the rock, and the negative stress area is small and concentrated in the contact rock directly beneath the disc cutter. The ATDC has a smaller area of stress concentration and a smaller maximum stress level. The stress of the REDC is more concentrated, and the maximum stress level is larger. The stress concentration area of the FEDC is larger, and the stress spreads to the surrounding area more extensively. Overall, the stress spreading range ranks: FEDC > REDC > ATDC.
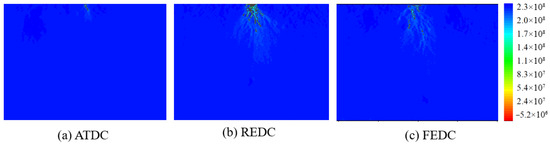
Figure 9.
Stress distribution state of rocks for different disc cutters in the axial direction (p = 2 mm, edge width = 22 mm).
3.3. Crack Number and Distribution
Figure 10 demonstrates the variation in the rock crack number of different disc cutters. With the increase in the cutting depth, the number of cracks initially rises, then stabilises, and the number of tensile cracks is greater than that of shear cracks. The FEDC has the highest number of cracks, the ATDC has the lowest number of cracks, and the REDC has the middle number of cracks. The percentage of tensile cracks is small for the EFDC and the REDC but large for the ATDC, indicating that the ATDC is predominantly failed by tensile cracks. A rose diagram of the rock crack distribution is shown in Figure 11. The ATDC has the lowest number of cracks, and the FEDC has the highest number of cracks. The ATDC’s cracks mainly extend laterally (20–40° and 120–140°), while the FEDC’s and the REDC’s cracks mainly extend directly underneath (60–100°). FEDC generates substantially more long cracks than ATDC, confirming greater rock damage extent. Notably, the percentage of tensile cracks in ATDC is significantly higher than that in FEDC and REDC, which indicates that ATDC is mainly dominated by embedded tensile damage.
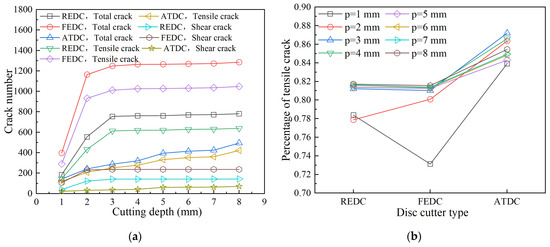
Figure 10.
Variation in the number of rock cracks for different disc cutters (edge width = 22 mm). (a) Crack number, (b) percentage of tensile crack.
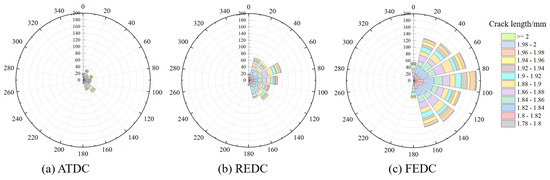
Figure 11.
Rose diagram of rock crack distribution for different disc cutters (p = 2 mm, edge width = 22 mm).
3.4. Rock-Breaking Force and Efficiency
The rock-breaking force and specific cutting energy changes in different disc cutters are shown in Figure 12. The FEDC and the REDC have an obvious peak force during the loading process, while the ATDC has no pronounced peak force. The peak force of the FEDC is much larger than that of the REDC and the ATDC, primarily due to the FEDC’s larger rock-contact area, which is difficult to intrude into the rock. The specific cutting energy ranks are FEDC > REDC > ATDC, which indicates that the rock-breaking efficiency of the FEDC is lower, but the rock-breaking efficiency of the REDC and the ATDC is higher. As shown in Figure 10b, the percentage of tensile cracks in the ATDC is significantly higher than that in the FEDC and the REDC, and less energy is consumed to produce tensile cracks, which is a key factor for the higher rock-breaking efficiency of the ATDC. Although the ATDC has high rock-breaking efficiency, it is prone to wear and tear and is not suitable for hard rock formations. According to reference [24], the REDC was considered a priority in hard rock formation, which is the same as the results acquired from this study.
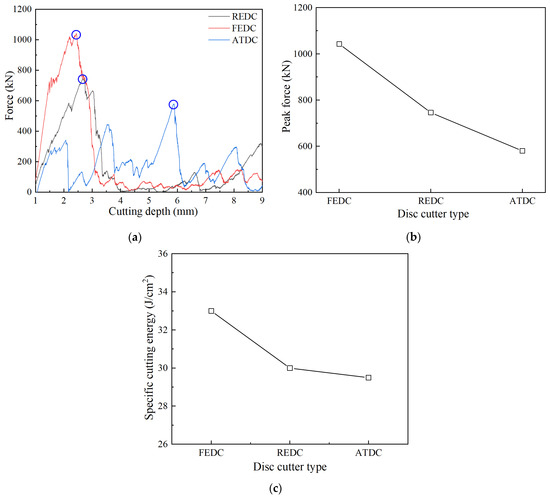
Figure 12.
Variations in force and specific cutting energy for different disc cutters (edge width = 22 mm). (a) Force, (b) peak force, (c) specific cutting energy.
4. Effects of Edge Width on Rock-Breaking Performance
4.1. Rock Crack and Stress Distribution Characterisation
To avoid excessive length of the paper, the REDC has been selected for analysis. Figure 13 illustrates the rock crack characterisation of the REDC with different edge widths, showing that the rock damage range gradually increases with the increasing edge width. Specifically, when the edge width is 10 mm, the rock damage beneath the disc cutter is less extensive, with some cracks extending laterally but with a shorter extension length. When the edge width is in the range of 12–16 mm, the rock damage range becomes larger, with small cracks extending to one side or downwards of the disc cutter. When the edge width is 18 mm, two elongated cracks are derived on both sides of the disc cutter with a short crack length. When the edge width is 20 mm, the rock damage range further increases, and the extended crack length increases towards the deeper parts of the rock. When the edge width is 22 mm, the number of cracks directly beneath the disc cutter increases, and the downward penetration of the cracks increases. When the edge width is 24 mm, the rock damage degree increases further.
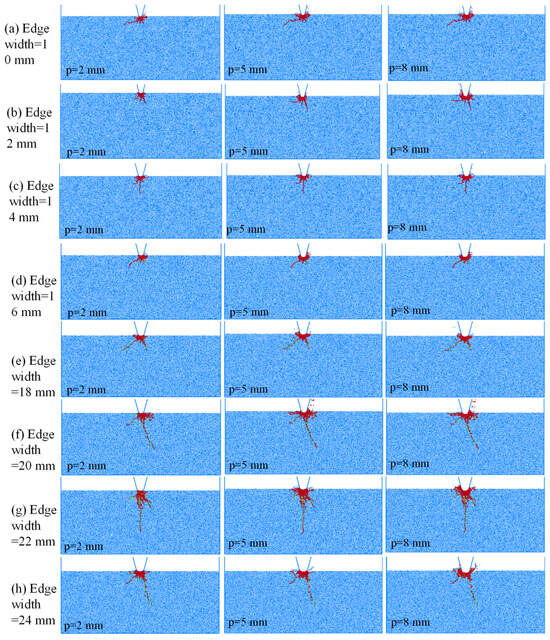
Figure 13.
Failure characteristics of rocks for REDC with different edge widths.
Figure 14 shows the force chain distribution of rocks for REDC with different edge widths. The cutter-rock contact part of the force chain distribution is more intensive. The density of the force chain distribution throughout the rock increases with increasing edge width. The internal stresses in the rock extend from the cutter-rock contact site in a fan-like manner in all directions, and the intensity of the force chain gradually decreases. Generally, with the edge width increasing, the contact area between the disc cutter and the rock increases, resulting in more difficult intrusion of the disc cutter into the rock, denser distribution of the force chain, more severe rock damage, and a larger number and length of cracks.
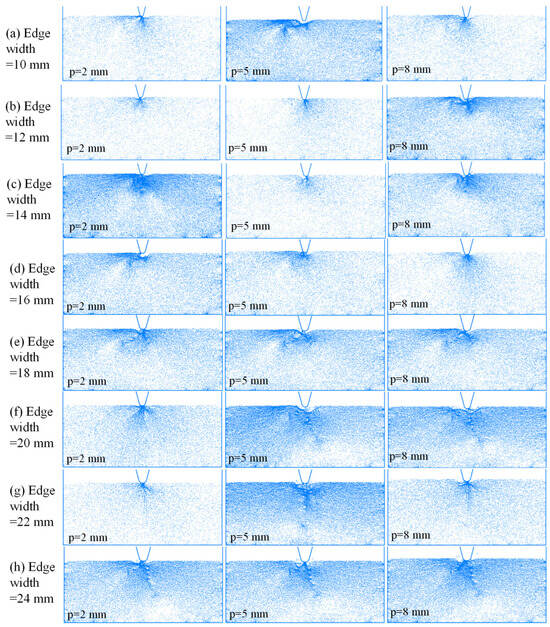
Figure 14.
Force chain distribution of rocks for REDC with different edge widths.
Figure 15 shows the stress distribution state of rocks for REDC with different edge widths at the cutting depth of 5 mm. The positive stress is distributed throughout the rock, while the negative stress is mainly distributed in the cutter-rock contact area. Specifically, the negative stress is distributed directly beneath the disc cutter, and the positive stress is distributed on both sides of the disc cutter. The closer the area is to the disc cutter, the greater the rock stress level. With the edge width increasing, the range of stress concentration areas, as well as the negative stress level, increases.
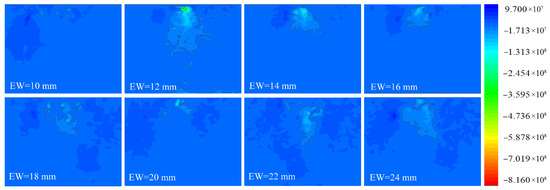
Figure 15.
Stress distribution state of rocks for REDC with different edge widths in the axial direction (p = 5 mm).
4.2. Crack Distribution of Rocks
Figure 16 shows the variation in rock crack number for REDC with different edge widths. The selected test data was elaborated and analysed while preserving trend integrity. The number of total cracks, shear cracks, and tensile cracks increases with increasing edge width. The number of rock cracks at different edge widths rises rapidly and then slowly after a cutting depth of about 3–4 mm. The percentage of tensile cracks decreases with the increase in edge width, indicating that the tensile-dominated damage decreases with increasing edge width. Figure 17 shows the rose diagram of rock crack distribution of the REDC with different edge widths. The edge width does not have a significant effect on the rock crack length distribution characteristics, while there are differences in the direction of rock crack expansion at different edge widths. When the edge width is small, the cracks are mainly expanded to the sides, but the cracks expand directly beneath the disc cutter as the edge width increases.
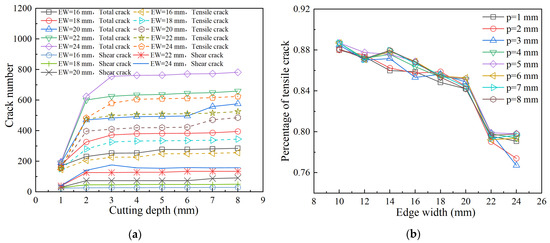
Figure 16.
Variation in the number of rock cracks for REDC with different edge widths. (a) Crack number, (b) percentage of tensile crack.
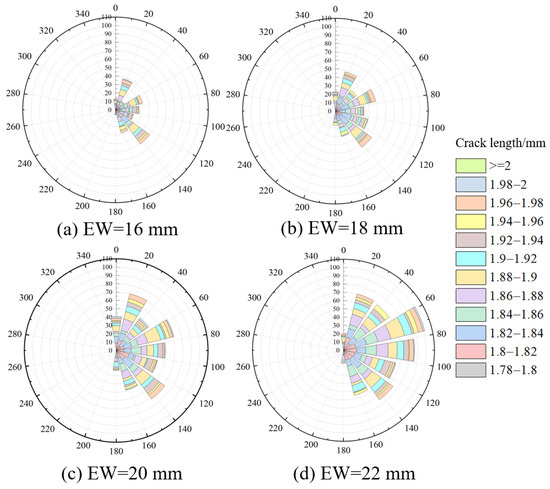
Figure 17.
Rose diagram of rock crack distribution for REDC with different edge widths (p = 2 mm).
4.3. Rock-Breaking Force and Efficiency
Figure 18 shows the variations in force and specific cutting energy for REDC with different edge widths. With the increase in the cutting depth, the force begins to increase sharply and then drops rapidly, followed by fluctuation-like changes. This indicates that the rock is capable of withstanding a certain level of external load. The rock is extensively damaged when the load exceeds the rock strength. As the disc cutter continues to intrude into the rock, the load required to break the rock decreases due to the cumulative damage effect in the rock. Figure 18b shows that the peak force increases abruptly with increasing edge width; the peak force at an edge width of 24 mm is approximately 3.5 times that of an edge width of 10 mm. The disc cutter is difficult to penetrate the rock as the edge width is larger; consequently, the peak force increases. Figure 18c shows that the specific cutting energy increases with increasing edge width, and the growth rate initially increases and then decreases. However, the rock-breaking efficiency increased and then decreased with increasing edge width according to reference [15]. This may be related to rock properties, and the rock-breaking efficiency was calculated by a double cutter rather than a single cutter in reference [15]. The rock-breaking differences between the double cutter and the single cutter will be considered in future work.
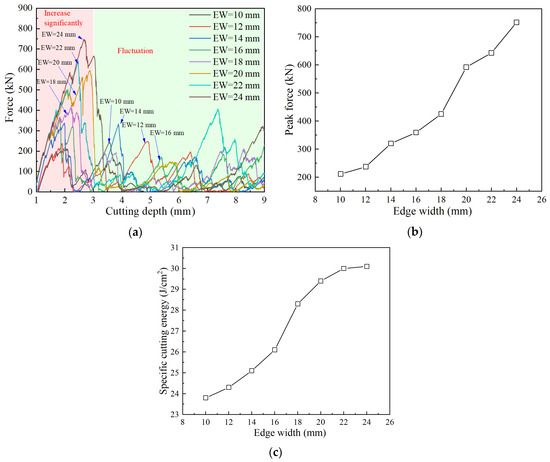
Figure 18.
Variations in force and specific cutting energy for REDC with different edge widths. (a) Force, (b) peak force, (c) specific cutting energy.
The analysis shows that the rock damage is mostly dominated by tensile cracks when the edge width is small. Due to the fact that rock exhibits high resistance to compressive stress but poor resistance to tensile stress, the energy required for the initiation and propagation of tensile cracks remains minimal, thereby contributing to a high rock-breaking efficiency.
5. Conclusions
In this paper, the effects of cutter ring shape and edge width on the rock-breaking performance of disc cutters were investigated by the DEM. A systematic analysis was conducted on three common disc cutter types, evaluating rock crack propagation, stress distribution, fracture patterns, cutting forces, and efficiency. The key findings are summarised as follows:
- (1).
- The cutter ring shape significantly influences rock-breaking performance. The FEDC and the REDC are in face-to-face contact with the rock, which is extruded breaking, while the ATDC is in line with the rock, which is embedded breaking. The crack extension range, the intensity of the force chain, and the stress spreading range rank: FEDC > REDC > ATDC.
- (2).
- The FEDC has the highest number of cracks, while the ATDC has the lowest number of cracks. The percentage of tensile cracks for ATDC is higher than that for REDC and FEDC. The crack direction shows a little difference for the three disc cutters. The FEDC has a greater number of long cracks, but the ATDC has a smaller number of long cracks. The peak force of the FEDC is much larger than that of the REDC and the ATDC. The rock-breaking efficiency of the FEDC is lower, while the rock-breaking efficiency of the REDC and the ATDC is higher.
- (3).
- The edge width significantly affects the rock-breaking performance of disc cutters. With the increase in edge width, the disc cutter intrudes into the rock more difficultly, the distribution of the force chain is more intensive, the internal damage of the rock rupture is more serious, and the number and length of the cracks become larger. The edge width affects the direction of rock crack extension. The crack mainly expands to the two sides of the disc cutter when the edge width is small but gradually expands to the lower part of the disc cutter with increasing edge width. The specific cutting energy of the disc cutter increases with increasing edge width. The peak force at an edge width of 24 mm is approximately 3.5 times that of an edge width of 10 mm.
- (4).
- This study used two-dimensional simulation to investigate the rock-breaking performance of disc cutters; the three-dimensional simulation will be carried out to precisely capture the crack patterns and stress distribution. Additionally, the cutter wear and rock types, significantly affecting the rock-breaking performance, will be considered in future work.
Author Contributions
J.-J.L., L.-C.D., W.X., J.Y., X.-Z.L. and T.-C.F. conceptualised the study. J.-J.L., L.-C.D. and W.X. conducted the data acquisition, preparation, and analysis. All authors contributed to the interpretation of results and manuscript preparation. All authors have read and agreed to the published version of the manuscript.
Funding
This research is supported by the Key Supported Project of the Joint Fund of the National Natural Science Foundation of China for Geology (No. U2444220), the National Key Research and Development Program of China (NO. 2022YFC3003304), the Key Research and Development Program of Yunlong Lake Laboratory of Deep Underground Science and Engineering (No. 104023006), Jiangsu Province Frontier Technology Research and Development Program (No. BF2024018) and the Engineering Innovation Center for Urban Underground Space Exploration and Evaluation, ministry of Natural Resources of the People’s Republic of China (No. USEEOS-2024-01).
Institutional Review Board Statement
Not applicable.
Informed Consent Statement
Not applicable.
Data Availability Statement
All data used in this study are true and reliable, and they are freely available through open data portals online.
Conflicts of Interest
The authors declare no conflicts of interest.
References
- Deng, L.C.; Zhang, F.B.; Li, X.Z.; Zhang, C.; Ji, Y.K.; Wu, Y. Experimental and numerical investigations on rock breaking of TBM disc cutter based on a novel platform with rotational cutting. Rock Mech. Rock Eng. 2023, 56, 1415–1436. [Google Scholar] [CrossRef]
- Deng, L.C.; Zhang, C.; Zhuang, Q.W.; Li, X.Z.; Yuan, Y.X. Development and application of a full-scale mechanical rock-cutting platform for measuring the cutting performance of TBM cutter. Measurement 2022, 204, 112036. [Google Scholar] [CrossRef]
- Deng, L.C.; Zhang, W.; Deng, L.; Shi, Y.H.; Zi, J.J.; He, X.; Zhu, H.H. Forecasting and early warning of shield tunnelling-induced ground collapse in rock-soil interface mixed ground using multivariate data fusion and Catastrophe Theory. Eng. Geol. 2024, 335, 107548. [Google Scholar] [CrossRef]
- Deng, L.C.; Li, X.Z.; Xu, W.T.; Zhang, C.; Zhuang, Q.W.; Li, F.Q.; Zhou, Q. Full-scale test of disc cutter rotary cutting in TBM tunnelling: A case study of Mawan granite in Shenzhen, China. Geomech. Geophys. Geo-Energy Geo-Resour. 2024, 10, 167. [Google Scholar] [CrossRef]
- Jiang, H.; Zhu, J.C.; Zhang, X.Y.; Zhang, J.; Li, H.; Meng, L. Wear mechanism and life prediction of the ripper in a 9 m-diameter shield machine tunneling project of the Beijing new airport line in a sand-pebble stratum. Deep Undergr. Sci. Eng. 2022, 1, 65–76. [Google Scholar] [CrossRef]
- Zhang, J.X.; Li, B.; Wang, G.H.; Jiang, Y.; Jiang, H.; Yin, M.; Sun, Z. Research on the design method for uniform wear of shield cutters in sand–pebble strata. Deep Undergr. Sci. Eng. 2024, 3, 11203. [Google Scholar] [CrossRef]
- Ren, T.; Yu, J.H.; Zhang, H.; Deng, L.; Okubo, S.; Elbaz, K. A new semi-theoretical disc cutter performance prediction model considering curvature radius. Rock Mech. Rock Eng. 2025, 58, 2055–2070. [Google Scholar] [CrossRef]
- Geng, Q.; Wei, Z.Y.; Meng, H. An experimental research on the rock cutting process of the gage cutters for rock tunnel boring machine (TBM). Tunn. Undergr. Space Technol. 2016, 52, 182–191. [Google Scholar] [CrossRef]
- Xu, H.G.; Geng, Q.; Sun, Z.C.; Qi, Z. Full-scale granite cutting experiments using tunnel boring machine disc cutters at different free-face conditions. Tunn. Undergr. Space Technol. Inc. Trenchless Technol. Res. 2021, 108, 103719. [Google Scholar] [CrossRef]
- Rostami, J. Study of pressure distribution within the crushed zone in the contact area between rock and disc cutters. Int. J. Rock Mech. Min. Sci. 2013, 57, 172–186. [Google Scholar] [CrossRef]
- Xu, H.Y.; Gong, Q.M.; Zhou, X.X.; Yang, F.; Han, B. Influence of the assisted kerf depth on cracks pattern and cutting performance of TBM cutter. Int. J. Rock Mech. Min. Sci. 2023, 170, 105516. [Google Scholar] [CrossRef]
- Pan, Y.C.; Liu, Q.S.; Liu, J.P.; Kong, X. Full-scale linear cutting tests in Chongqing Sandstone to study the influence of confining stress on rock cutting efficiency by TBM disc cutter. Tunn. Undergr. Space Technol. 2018, 80, 197–210. [Google Scholar] [CrossRef]
- Zhang, Z.H.; Wang, X.X.; Wang, B.S.; Zhuo, X.; Jia, L. Investigation into the rock-breaking forces of TBM disc cutters with diverse edge shapes. Rock Mech. Rock Eng. 2025. [Google Scholar] [CrossRef]
- Kang, Y.Q.; Shu, Y.S.; Yang, L.Y.; Yang, R.S.; Xu, Y.C.; Xie, Z.; Ren, K.Y. Numerical Study on the Influence of the Width of the SBM Disc Cutter on Rock Breaking. Korean Soc. Civ. Eng. J. Civ. Eng. 2023, 27, 4060–4070. [Google Scholar] [CrossRef]
- Shang, Y.; Sun, J.D.; Jiang, H.F.; Xu, S.H.; Duan, H.L.; Sun, C.Y. Research on disc cutter excavation characteristics for different blade width based on numerical simulations and experiments. Chin. J. Eng. 2025, 47, 13–24. [Google Scholar] [CrossRef]
- Xia, Y.M.; Zhang, X.H.; Tan, Q.; Zeng, G.Y.; Liu, J.; Lin, Q.B. Influence of rock breaking characteristics with disc cutter width under different confining pressure. J. Basic Sci. Eng. 2017, 25, 636–645. [Google Scholar] [CrossRef]
- Joe, R.; Tyler, S.; John, K.; Lindbergh, L. The current state of disc cutter design and development directions. In Proceedings of the 2008 North American Tunnelling Conference (NAT2008), Society for Mining, Metallurgy & Exploration, San Francisco, CA, USA, 7–11 June 2008; pp. 36–45. [Google Scholar]
- Agrawal, A.K.; Chattopadhyaya, S.; Murthy, V. Delineation of cutter force and cutter wear in different edge configurations of disc cutters—An analysis using discrete element method. Eng. Fail. Anal. 2021, 129, 105727. [Google Scholar] [CrossRef]
- Ning, B.; Xia, Y.; Lin, L.; Zhang, X.; He, Y.; Liu, Y. Experimental study on the adaptability of cutters with different blade widths under hard rock and extremely hard rock conditions. Acta Geotech. 2020, 15, 3283–3294. [Google Scholar] [CrossRef]
- Liu, Y.C.; Liu, B.; Jiang, Y.S.; Jiang, H.; Li, T. Research on rock-breaking effect of TBM hob and application of new type cutter. J. Min. Sci. Technol. 2023, 8, 357–369. [Google Scholar] [CrossRef]
- Gou, B.; Duan, W.J.; Mo, J.L.; Zhang, M.Q. Effects of TBM cutter profile on cutter-rock contact and damage behaviors. J. Chongqing Univ. Technol. (Nat. Sci.) 2022, 36, 269–280. [Google Scholar] [CrossRef]
- Zhou, P. Research on inserted-tooth roller cutter rock breaking mechanism based on discrete element method. Constr. Technol. 2024, 53, 96–102. [Google Scholar] [CrossRef]
- Gheng, C.; Guo, H.H.; Fu, J.; Luo, X.C. Comparative study on rock breaking performance of flat tooth and ball tooth inserted disc cutter. Yangtze River 2024, 55, 174–179. [Google Scholar]
- Zhang, M.Q.; Wang, Y.B.; Zhang, L.G.; Duan, W.; Su, Y.M.; Mo, J.L.; Zhou, Z.R. Effects of TBM cutter profile on rock fragmentation under different rock type and confining pressure conditions. J. Southwest Jiaotong Univ. 2023, 58, 332–339. [Google Scholar] [CrossRef]
- Gong, Q.M.; Wu, F.; Ma, S.; Zheng, Y.L.; Yin, L.J. Effect of cutter tip type parameters on rock-breaking by linear cutting experiments. J. Cent. South Univ. (Sci. Technol.) 2023, 54, 1098–1108. [Google Scholar] [CrossRef]
- Zhou, Y.; Wu, S.C.; Xu, X.L.; Sun, W.; Zhang, X.P. Particle flow analysis of acoustic emission characteristics during rock failure process. Chin. J. Rock Mech. Eng. 2013, 32, 951–959. [Google Scholar]
- Zhang, M.Q.; Gou, B.; Mo, J.L.; Duan, W.J.; Zhou, Z.R. Rock-cutting and wear performance of a novel TBM disc cutter with spiral grooves. Tunn. Undergr. Space Technol. Inc. Trenchless Technol. Res. 2022, 129, 104660. [Google Scholar] [CrossRef]
- Wang, A.X.; Lu, Y.Q.; Zhang, S.; Ma, J.; Yang, Z.; Fan, H.Y. Numerical simulation study on the optimal jet angle of water jet assisted disc cutter rock breaking. Coal Sci. Technol. 2024, 53, 95–104. [Google Scholar] [CrossRef]
- Cao, P.; Lin, Q.B.; Li, K.H.; Han, D.Y. Effects of joint angle and joint space on rock fragmentation efficiency by two TBM disc cutters. J. Cent. South Univ. (Sci. Technol.) 2017, 48, 1293–1299. [Google Scholar] [CrossRef]
- Zhang, H. Research on Rock Breaking Mechanism of Rolling Knives Based on Particle Mechanics and Complex Networks. Ph.D. Thesis, North University of China, Taiyuan, China, 2024. [Google Scholar]
Disclaimer/Publisher’s Note: The statements, opinions and data contained in all publications are solely those of the individual author(s) and contributor(s) and not of MDPI and/or the editor(s). MDPI and/or the editor(s) disclaim responsibility for any injury to people or property resulting from any ideas, methods, instructions or products referred to in the content. |
© 2025 by the authors. Licensee MDPI, Basel, Switzerland. This article is an open access article distributed under the terms and conditions of the Creative Commons Attribution (CC BY) license (https://creativecommons.org/licenses/by/4.0/).