Article

Modeling Spatial–Behavioral Dynamics in Cultural Exhibition Architecture Through Mapping and Regression Analysis

School of Architecture, Chang’an University, Xi’an 710061, China
*
Author to whom correspondence should be addressed.
Buildings 2025, 15(17), 3049; https://doi.org/10.3390/buildings15173049
Submission received: 6 August 2025 / Revised: 20 August 2025 / Accepted: 22 August 2025 / Published: 26 August 2025
(This article belongs to the Section Architectural Design, Urban Science, and Real Estate)

Abstract

The integration of virtual reality, digital twins, and spatial behavior-tracking technologies is reshaping cultural exhibition architecture, shifting the design focus from functional efficiency to immersive, user-centered experiences. However, the behavioral dynamics within these interactive environments remain insufficiently addressed. This study proposes a behavior-oriented spatial typology grounded in Bitgood’s attention–value model, which maps the psychological stages—Attraction, Hold, Engagement, and Exit—onto four spatial categories: Threshold Space, Transitional Space, Narrative Focus Space, and Closure Space. Each represents a distinct phase of perceptual and behavioral response along the exhibition sequence. A mixed-method approach was employed, combining eye-tracking experiments with structured questionnaires to capture both physiological reactions and subjective evaluations. Key spatial variables—enclosure (X1), visual corridors (X2), spatial scale (X3), and light–shadow articulation (X4)—were analyzed using multiple regression to assess their impact on interest and dwell time. The results show that enclosure (α = −0.094; β = −0.319) and light–shadow articulation (α = −0.057; β = 0.156), respectively, decreased interest and increased dwell time, while spatial scale (α = 0.042; β = 0.186) positively affected both. Visual corridors had minimal influence (α = −0.007; β = 0.022). These spatial effects align with the proposed typology: Threshold Spaces support rapid orientation and exploratory behavior, while Transitional Spaces aid navigation but reduce sustained attention. Narrative Focus Spaces enhance cognitive engagement and decision making, and Closure Spaces foster emotional resolution and extended presence. These findings validate the proposed typology and establish a quantifiable link between spatial attributes and visitor behavior, offering a practical framework for optimizing immersive exhibition sequences.

1. Introduction

The design of cultural exhibition architecture is undergoing a paradigm shift, moving beyond static object display toward spatial systems that emphasize narrative immersion, interactivity, and emotional resonance. This evolution aligns with emerging visitor expectations in the digital era, where cultural spaces are increasingly tasked with fostering engagement through perceptual and behavioral experience. This transformation is also reflected in cultural development strategies. For instance, China’s 14th Five-Year Plan for Public Cultural Services emphasizes the enhancement of cultural venues through digitalization and immersive technologies [1], while UNESCO’s Culture 2030 Indicators highlight the role of museums and exhibition spaces in promoting inclusive and sustainable urban development [2]. According to the China Statistical Yearbook 2023, the number of museums in China has exceeded 6000, indicating a growing demand for high-quality spatial experiences in cultural facilities [3]. Together, these trends highlight the societal importance of developing design strategies that enhance perceptual and behavioral engagement within cultural spaces.
Extensive research has demonstrated the influence of spatial geometry—particularly metrics such as integration and visual accessibility—on shaping visitor circulation patterns and emotional rhythms [4,5]. Concurrently, developments in immersive eye-tracking and virtual reconstruction technologies have enabled the empirical visualization of interactions between spatial characteristics and behavioral responses [6,7].
Digital twin and virtual reality (VR) technologies have redefined spatial logic in exhibition environments by enabling adaptive and interactive user experiences. Platforms such as Shanhai and the Palace Museum VR exemplify this shift toward responsive, feedback-oriented exhibitions that move beyond static, object-centered presentation [8,9,10]. However, the underlying relationship between spatial configuration and behavioral intention remains underexplored, largely due to the lack of integrated theoretical models and empirical evidence linking spatial design to user engagement.
Three key limitations persist in current spatial behavior research. First, existing studies often rely heavily on static visualizations—such as heatmaps or aggregated dwell-time maps—that can illustrate attention intensity but fail to capture the dynamic and sequential nature of visitor movement through space. For example, Shi et al. (2025) demonstrate how mobile eye tracking provides richer temporal information compared with static heatmaps, highlighting the limitations of traditional visualization approaches in reflecting sequential interaction [11]. Second, perceptual data (e.g., fixation counts or pupil diameter) and behavioral data (e.g., survey responses or movement trajectories) are frequently analyzed in isolation, restricting the formation of a closed-loop model that links spatial design, user feedback, and iterative improvement. This methodological fragmentation has been noted in recent evaluations of exhibition environments, where physiological tracking and subjective assessment were seldom integrated into a unified analytical framework [12]. Third, many modeling efforts prioritize content-related factors or visitor demographics, while the causal influence of spatial configuration and its contextual transferability remain insufficiently addressed. As Medaković et al. (2024) show, spatial layout strongly conditions visitor paths, yet such causal relationships are rarely incorporated into predictive models of cultural exhibition spaces [13]. Collectively, these gaps highlight the need for an integrated framework that systematically connects spatial configuration with perceptual and behavioral responses, which provides the conceptual basis for this study.
Bitgood’s attention–value model [14], initially formulated to describe exhibit-level attention processes, outlines four cognitive stages: Attraction, Hold, Engagement, and Exit. This study extends the model’s conceptual scope by spatializing these stages into a typological framework for cultural exhibition architecture. The resulting four spatial types—Threshold Space, Transitional Space, Narrative Focus Space, and Closure Space—correspond to distinct phases of perceptual and behavioral interaction along the exhibition sequence, offering a structured lens to interpret user engagement in spatial terms.
Against this policy and societal backdrop, this study not only addresses a pressing academic gap but also responds to the growing demand for cultural spaces that combine educational, experiential, and social functions. Building on this typological framework, the study constructs a spatial–behavioral mapping model through a mixed-method approach that integrates immersive eye-tracking experiments and structured questionnaires. Four perceptual variables—enclosure, visual corridors, spatial scale, and light–shadow articulation—are analyzed using multiple regression to examine their effects on dwell time and perceived interest. The resulting model provides a quantitative basis for linking spatial configuration to visitor behavior, thereby bridging the gap between perceptual theory and architectural practice, and offering design strategies for optimizing non-exhibit areas in cultural exhibition architecture.

2. Literature Review

2.1. Spatial Rhythm and Behavioral Sequencing in Exhibition Spaces

The spatial configuration of cultural exhibition architecture plays a critical role in guiding perception and shaping behavioral responses. Popelka and Vyslouzil [15] demonstrated that eye movement patterns are closely aligned with spatial legibility and orientation cues, suggesting that visual structure directly influences how visitors explore exhibition spaces. Raptis [16] further revealed that attentional shifts in interactive environments tend to follow predictable spatial sequences, reinforcing the view that physical layout serves as a scaffold for cognitive and behavioral engagement. Liu and Sutunyarak [17] emphasized that immersive spatial qualities—such as enclosure, lighting, and perceived scale—can significantly affect users’ focal attention and behavioral intention in exhibition settings.
From a curatorial perspective, Serrell [18] proposed that exhibitions function as rhythmic sequences, progressing from perceptual entry to stages of sustained engagement and interpretive closure. This idea of structured experiential flow is supported by digital simulation studies. For instance, van Maanen et al. [19] observed stable gaze trajectories across virtual museum tours, while Gong et al. [20] found that augmented spatial cues can effectively regulate visitor attention. Carrozzino and Bergamasco [21] demonstrated that virtual transitions can replicate the behavioral logic of real-world movement, and Charitonidou [22] described architectural space as an event-driven continuum that orchestrates both emotional and cognitive shifts.
These insights highlight the potential of spatial sequencing to influence visitor behavior across multiple media and formats. Drawing on Bitgood’s attention–value model [10]—which outlines four cognitive stages of Attraction, Hold, Engagement, and Exit—this study develops a corresponding spatial typology for exhibition environments. The four spatial types—Threshold Space, Transitional Space, Narrative Focus Space, and Closure Space—are designed to reflect distinct phases of perceptual orientation, attentional modulation, cognitive engagement, and emotional resolution. This typological framework serves as the theoretical foundation for analyzing spatial–behavioral relationships in cultural exhibition architecture.

2.2. Public Perception and Behavioral Response in Spatially Sequenced Exhibitions

As cultural exhibitions evolve toward immersive, participatory formats, spatial design increasingly shapes how visitors perceive, interpret, and emotionally respond to their surroundings. Rendell [23] emphasized that transitional spaces—such as corridors, thresholds, or spatial pauses—often trigger psychological shifts and emotional reorientation, functioning as perceptual mediators within architectural sequences. From a narrative design perspective, De Bleeckere and Gerards [24] suggested that spatial sequencing can be deliberately orchestrated to evoke interpretive depth and guide the visitor’s experiential rhythm.
Recent eye-tracking research reinforces this view. Rainoldi et al. [25] found that gaze fixations frequently concentrate at points of spatial transition, indicating elevated perceptual engagement and memory encoding. Tao et al. [26], examining post-industrial heritage spaces, argued that spatial rhythm serves not only an organizational role but also communicates cultural identity through sequential architectural experience. Complementing this, Wang [27] highlighted that spatial form itself—independent of exhibits—can convey semantic meaning and influence cognitive response.
Emotional and perceptual responses are also shaped by contextual familiarity. Bo and Abdul Rani [28] observed that visitors’ sense of attachment and preference is modulated by cultural familiarity and place-based associations, underscoring the subjective dimension of spatial experience.
These studies collectively suggest that perceptual variation across space types—whether in scale, enclosure, or cultural legibility—plays a significant role in shaping user behavior and emotional engagement. Building on this foundation, the present study incorporates both objective and subjective perceptual indicators to assess how spatial features influence interest levels and behavioral patterns across the exhibition sequence.

2.3. Integration and Modeling of Multi-Source Perceptual Data

Advances in spatial analytics and behavioral modeling have enabled increasingly granular investigations into how users perceive and interact with architectural environments. Liang et al. [29] applied space syntax analysis to industrial renewal and demonstrated that global integration values can predict movement density and spatial clustering in exhibition contexts, although such metrics often fail to capture localized perceptual variation. While such geometric metrics provide useful macro-level insights, they often fail to capture perceptual variation within localized spatial segments.
To address this limitation, recent studies have incorporated physiological and visual tracking methods to assess user response at the individual level. Shi, Ono, and Li [11] employed mobile eye tracking in museums to map sequential gaze distribution and learning-related attention. Marín-Morales et al. [30] integrated biometric signals with immersive VR navigation to evaluate emotional load and cognitive response during free exploration. Davis [31] examined the feasibility of combining VR and eye tracking with older and cognitively diverse visitors, delineating perceptual stages and highlighting how spatial engagement varies across profiles.
Semantic analysis complements physiological data by capturing perception through linguistic expression. Grootendorst [32] introduced the BERTopic model to extract environmental themes from user-generated content, providing a scalable semantic approach that complements physiological and spatial indicators. These multidimensional indicators can be further integrated through quantitative models. Banaei et al. [33] proposed regression frameworks that integrate gaze duration, spatial attributes, and biometric data to predict behavioral responses in interior settings. Earlier work by O’Neill [34] also confirmed that signage and floor plan configurations significantly affect wayfinding accuracy and decision making, underscoring spatial structure as a key behavioral determinant.
Together, these studies underscore the growing sophistication of spatial–behavioral modeling across semantic, visual, and physiological dimensions. Building on this foundation, the present research adopts a multimodal approach to evaluate how specific spatial characteristics—such as enclosure, visual continuity, scale, and lighting—affect interest and dwell behavior across a typology of exhibition spaces. However, the comparative scope of these methods has rarely been discussed; therefore, Table 1 provides a summary of their representative applications, applicable scenarios, and limitations.

2.4. Research Positioning and Methodological Strategy

Prior studies have independently highlighted the significance of spatial sequence, perceptual stimuli, and behavioral responses in shaping user experiences within exhibition environments. However, these dimensions often remain isolated, lacking a unified structure that systematically links spatial configurations to perceptual engagement and behavioral dynamics. While eye tracking, semantic analysis, and physiological monitoring each offer valuable insights, few studies have integrated these modalities into a cohesive, design-oriented evaluation model. Moreover, existing classifications of exhibition spaces primarily emphasize functional or curatorial dimensions, with limited attention to the perceptual–behavioral transitions that occur along the visitor journey.
To address this methodological fragmentation, this study proposes a spatial typology grounded in user experience, extending Bitgood’s attention–value model into four corresponding space types: Threshold Space, Transitional Space, Narrative Focus Space, and Closure Space. Each type is associated with distinct perceptual and behavioral roles—ranging from initial orientation to prolonged engagement and emotional resolution. To clarify the scope and application of this typology, Table 2 summarizes the four space types, specifying their typical scale, application scenarios, perceptual roles, and behavioral functions.
This typological overview provides a structured foundation for subsequent empirical analysis. By mapping physiological metrics (e.g., gaze patterns), spatial indicators (e.g., enclosure, visual corridors, spatial scale, and light–shadow articulation), and subjective responses (e.g., interest levels), the study develops a data-driven framework for assessing user interaction across these typologies. This approach not only integrates diverse perceptual data but also anchors them within a typological structure that aligns with design intentions. Multiple regression models are employed to quantify the influence of spatial attributes on two key behavioral outcomes: interest intensity and dwell duration. The resulting insights support a nuanced understanding of how architectural features modulate user attention, decision making, and emotional resonance within sequential exhibition spaces.

3. Materials and Methods

3.1. Study Context and Participants

To explore how spatial layout influences visitor engagement in cultural exhibition environments, this study began with a comparative analysis of twelve internationally recognized museums. The selection focused on architectural cases with distinctive circulation strategies, clear spatial progression, and alignment with the study’s research focus. From this set, three institutions were selected as primary research objects: the Nariwachō Art Museum (Japan), the National Museum of Western Art (Japan), and the East Building of the National Gallery of Art (United States). These museums offer structured spatial transitions and diverse exhibition approaches, making them suitable for analyzing the relationship between spatial configuration and visitor behavior.
A total of 60 students participated, comprising undergraduates (Years 2–5) and master’s students (Years 1–3) enrolled in programs related to the built environment: Architecture, Urban and Rural Planning, Landscape Architecture, Architectural Technology, Architectural History, and Architectural Design and Theory. The participants were 19–26 years old (mean approximately 22 years). Both sexes were represented in comparable numbers. Eligibility was limited to students currently enrolled in relevant degree programs; professional practitioners were excluded. For each participant, we also recorded whether prior environmental-perception training had been received, allowing comparisons between trained and untrained groups.

3.2. Overall Research Framework

This study centers on the examination of prototypical spatial sequences in cultural exhibition environments, with the goal of elucidating the coupling mechanisms between spatial configuration and visitor behavioral response. The research adopts an integrative methodological framework combining quantitative metrics with qualitative diagnostic tools to support evidence-based spatial optimization.
As illustrated in Figure 1, the research process is structured into three interrelated stages, integrating spatial modeling, experimental testing, and quantitative analysis to examine the relationship between spatial sequencing and visitor perception in cultural exhibition buildings.
(1)
Stage 1: Spatial Path Modeling and Experimental Material Development
Based on a literature review and case analysis, the exhibition sequences of museum buildings are categorized into five typical spatial nodes according to the “Threshold Space, Transitional Space, Narrative Focus Space, and Closure Space” narrative logic. Three selected buildings are modeled in 3D using their architectural plans. Fifteen high-fidelity panoramic views of spatial nodes are rendered using the D5 Engine, serving as visual stimuli for the immersive experiment [35].
(2)
Stage 2: Eye-Tracking Experiment and Subjective Data Collection
The panoramic images are imported into an eye-tracking platform. A total of 60 undergraduate and graduate students from diverse academic backgrounds participated in the experiment, simulating realistic visitor experiences [36]. The experiment collects two types of data simultaneously: eye-tracking metrics and subjective perception feedback, enabling the quantification of attention patterns and perceptual preferences.
(3)
Stage 3: Data Analysis and Model Construction
Based on the experimental data, a spatial–behavioral map is developed to visualize the average interest ratings and dwell time, and behavioral preferences associated with each spatial node. Multiple regression analysis is then used to quantitatively evaluate the influence of four spatial perception variables across four types of space (“Threshold Space”, “Transitional Space”, “Narrative Focus Space”, “Closure Space”) on spatial attractiveness and dwell behavior. The findings provide empirical support and design strategies for enhancing the spatial experience in cultural exhibition buildings.

3.3. Experimental Setup and Data Collection

  • Preparation of Experimental Materials:
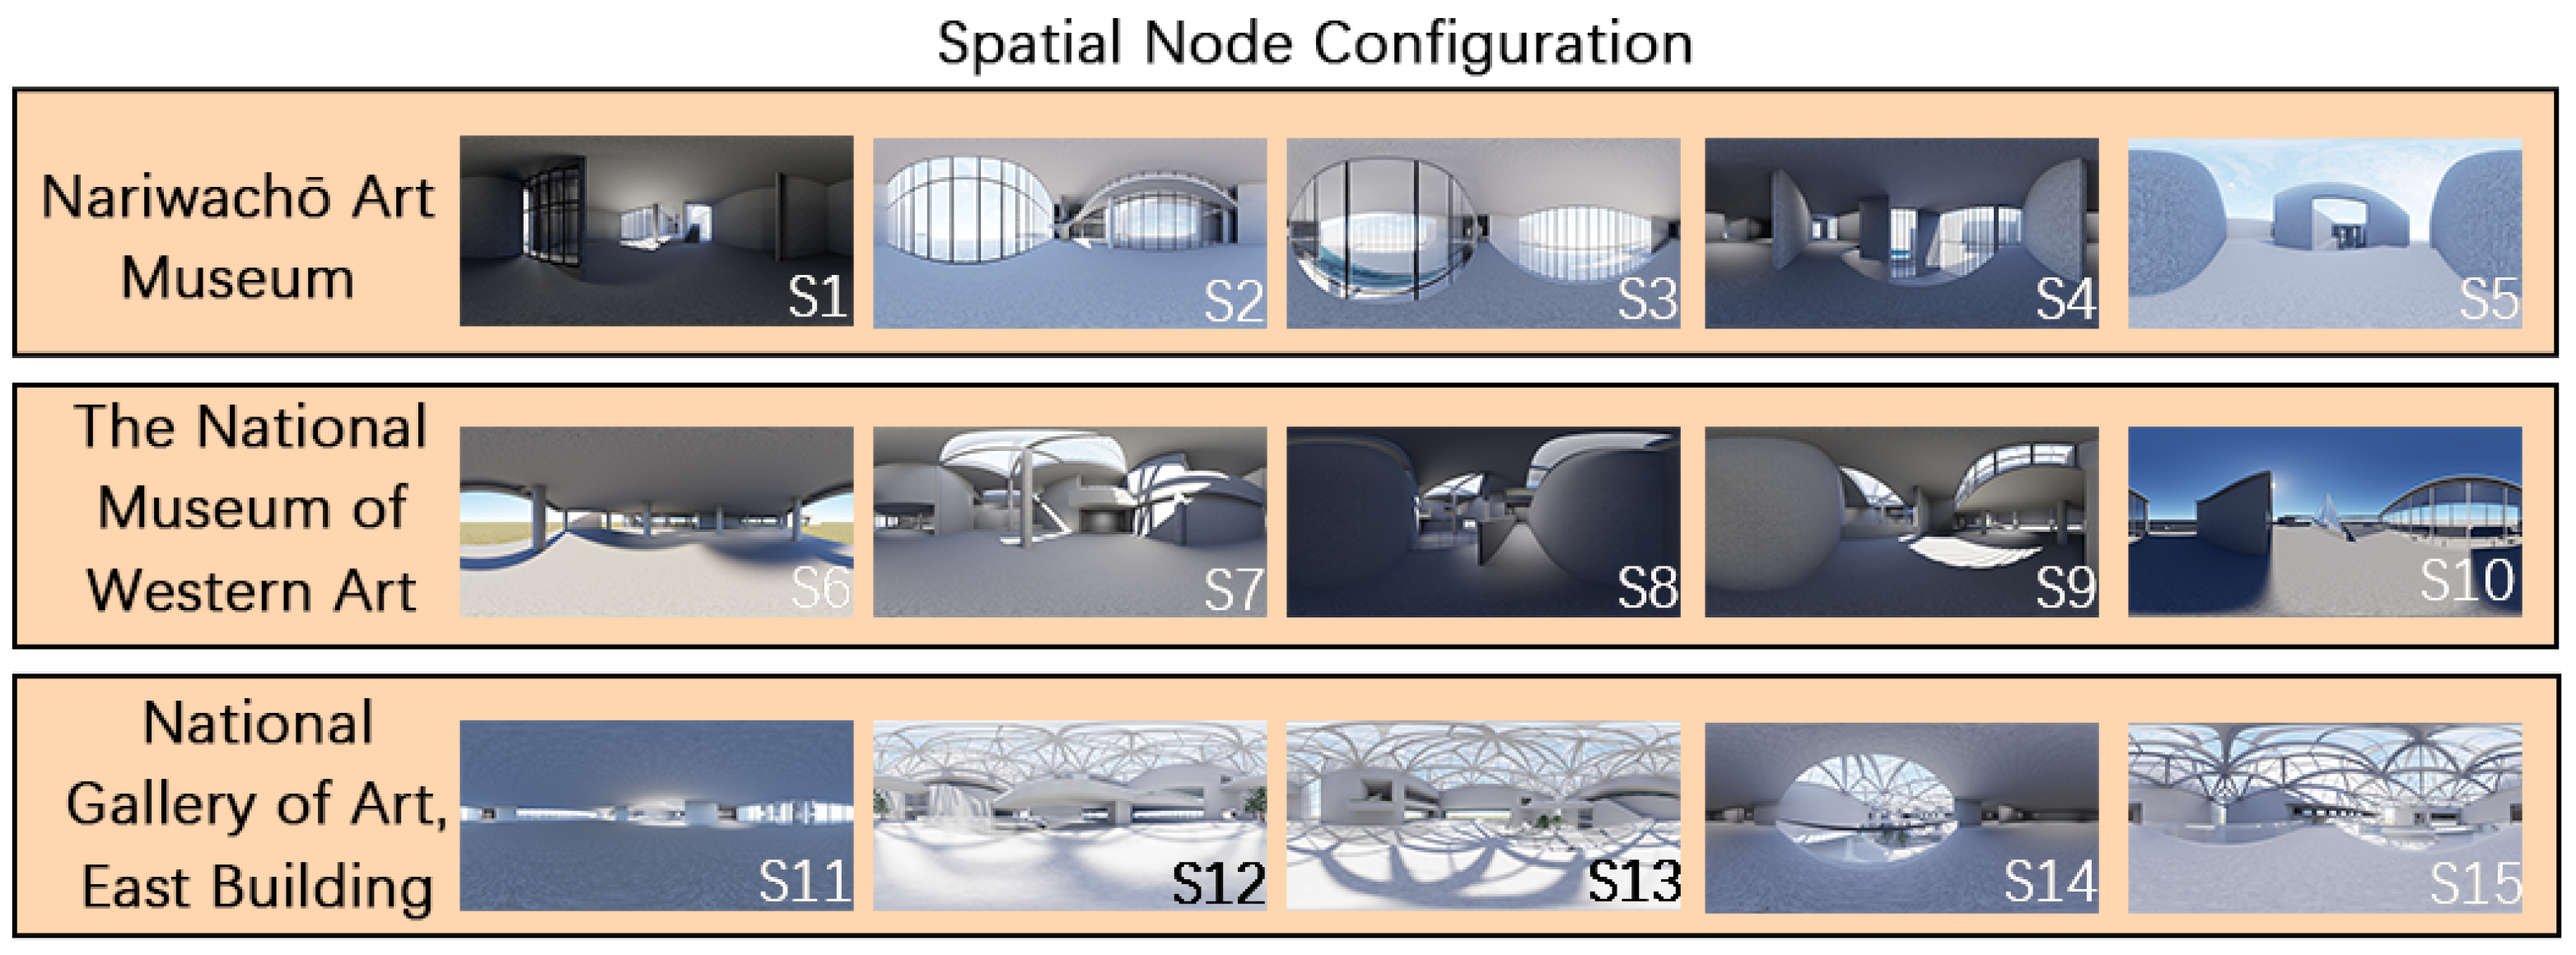
The study selected three representative museum buildings—Nariwachō Art Museum (S1–S5), National Museum of Western Art in Tokyo (S6–S10), and the East Building of the National Gallery of Art in Washington, D.C. (S11–S15). Five typical spatial nodes were extracted from each building, resulting in a total of 15 nodes. Based on 2D architectural plans, 3D models were constructed and rendered using the D5 Engine under a unified environmental setting [37], including standardized parameters such as human scale, concrete material textures, and consistent light–shadow articulation conditions. This normalization process eliminated potential distractions from color and material differences, allowing the experiment to focus on spatial configuration. It aligns with best practices in VR-based and eye-tracking experiments regarding variable control.
  • Questionnaire Design and Variable Indicators:
The questionnaire was structured around two core dimensions: spatial perception factors and behavioral response types. As seen in Table 3, each indicator within these dimensions was defined based on the established literature and measured using perceptual and behavioral attributes relevant to environmental experience.

3.4. Data Analysis

  • Interest Ratings of Spatial Perception Factors
Interest ratings were quantified with the Calt scoring method [48] seen in Table 4: −1 (not interested), 0 (unnoticed), 1 (neutral), 2 (somewhat interested), and 3 (highly interested). For each item, scores were assigned to participants’ selections, summed across respondents, and divided by the number of respondents to obtain the mean (per capita) interest score for that item.
  • Dwell Time of Spatial Nodes
In the eye-tracking experiment, the participants sequentially explored 15 virtual three-dimensional spatial nodes rendered with identical visual parameters. While the system automatically recorded eye-tracking and physiological data, the experimenter manually recorded the dwell time at each node. For each node, dwell times were averaged across the participants to yield the mean dwell time, reflecting the typical duration of spatial engagement.
  • Behavioral Response Types
Behavioral response types from the questionnaire were analyzed by counting the frequency of each selected option across all the participants and reporting both counts and percentages to facilitate comparisons among response categories.

4. Experimental Design

4.1. Theoretical Framework and Spatial Typology

This study extends Bitgood’s attention–value model from exhibit-level analysis to a continuous spatial framework. The four psychological stages—Attraction, Hold, Engagement, and Exit—are mapped to four spatial categories reflecting sequential visitor experience: Threshold Space (orientation), Transitional Space (movement adjustment), Narrative Focus Space (deep engagement), and Closure Space (emotional resolution). This typological reinterpretation offers a structured lens for analyzing behavior along exhibition paths.
To improve clarity, each spatial category is explained with its behavioral rationale: (i) Threshold Space serves as the orientation zone, attracting initial attention and preparing visitors for subsequent movement. (ii) Transitional Space adjusts movement and directs circulation, providing visual cues but often reducing sustained attention. (iii) Narrative Focus Space enables deep engagement and cognitive involvement, concentrating visitors’ perception and decision making. (iv) Closure Space facilitates emotional resolution and extended presence, providing a contemplative end to the exhibition sequence. This mapping of psychological processes to spatial categories provides a theoretical basis for the subsequent case analyses.

4.2. Definition of Spatial Nodes and Case Study Alignment

Based on the literature and typological synthesis [15,16,17,18,19,20,21,22], five spatial node types (S1–S5) were defined and aligned with the four-stage framework, forming a generalized model for cultural exhibition buildings. Three representative cases were analyzed: the Nariwachō Art Museum, the National Museum of Western Art, and the East Building of the National Gallery of Art.
In each case, spatial zones such as entry halls, atria, staircases, galleries, and terraces were assigned to categories according to their behavioral functions. For example, the Nariwachō Art Museum’s entry and stairs were classified as Threshold and Transitional Spaces, while its terrace served as a Closure Space. Similar mappings were observed in the other two museums, demonstrating the framework’s applicability to spatial–behavioral analysis.

4.3. Mapping and Visualization

To evaluate the robustness of the proposed typology, twelve additional cultural exhibition buildings were selected for comparative analysis. Key spatial nodes within these buildings were categorized according to the four defined spatial types, as summarized in Table 5. To enhance methodological transparency, panoramic images of selected nodes were included (Figure 2), enabling readers to more intuitively associate abstract spatial classifications with real-world architectural contexts.
These examples are drawn from three representative architectural cases: the Nariwachō Art Museum (s1–s5), the National Museum of Western Art in Tokyo (s6–s10), and the East Building of the National Gallery of Art (s11–s15). For each building, the selected spatial nodes are systematically organized according to the following spatial typology: Threshold Space, Transitional Space, Narrative Focus Space, and Closure Space. This sequencing not only reflects the underlying spatial logic of the classification system but also supports more effective cross-case architectural comparison by aligning abstract spatial categories with tangible, built environments.

5. Results

5.1. Results of Eye-Tracking Data Analysis

5.1.1. Analysis of Visual Attention: Heatmaps and Scan Paths

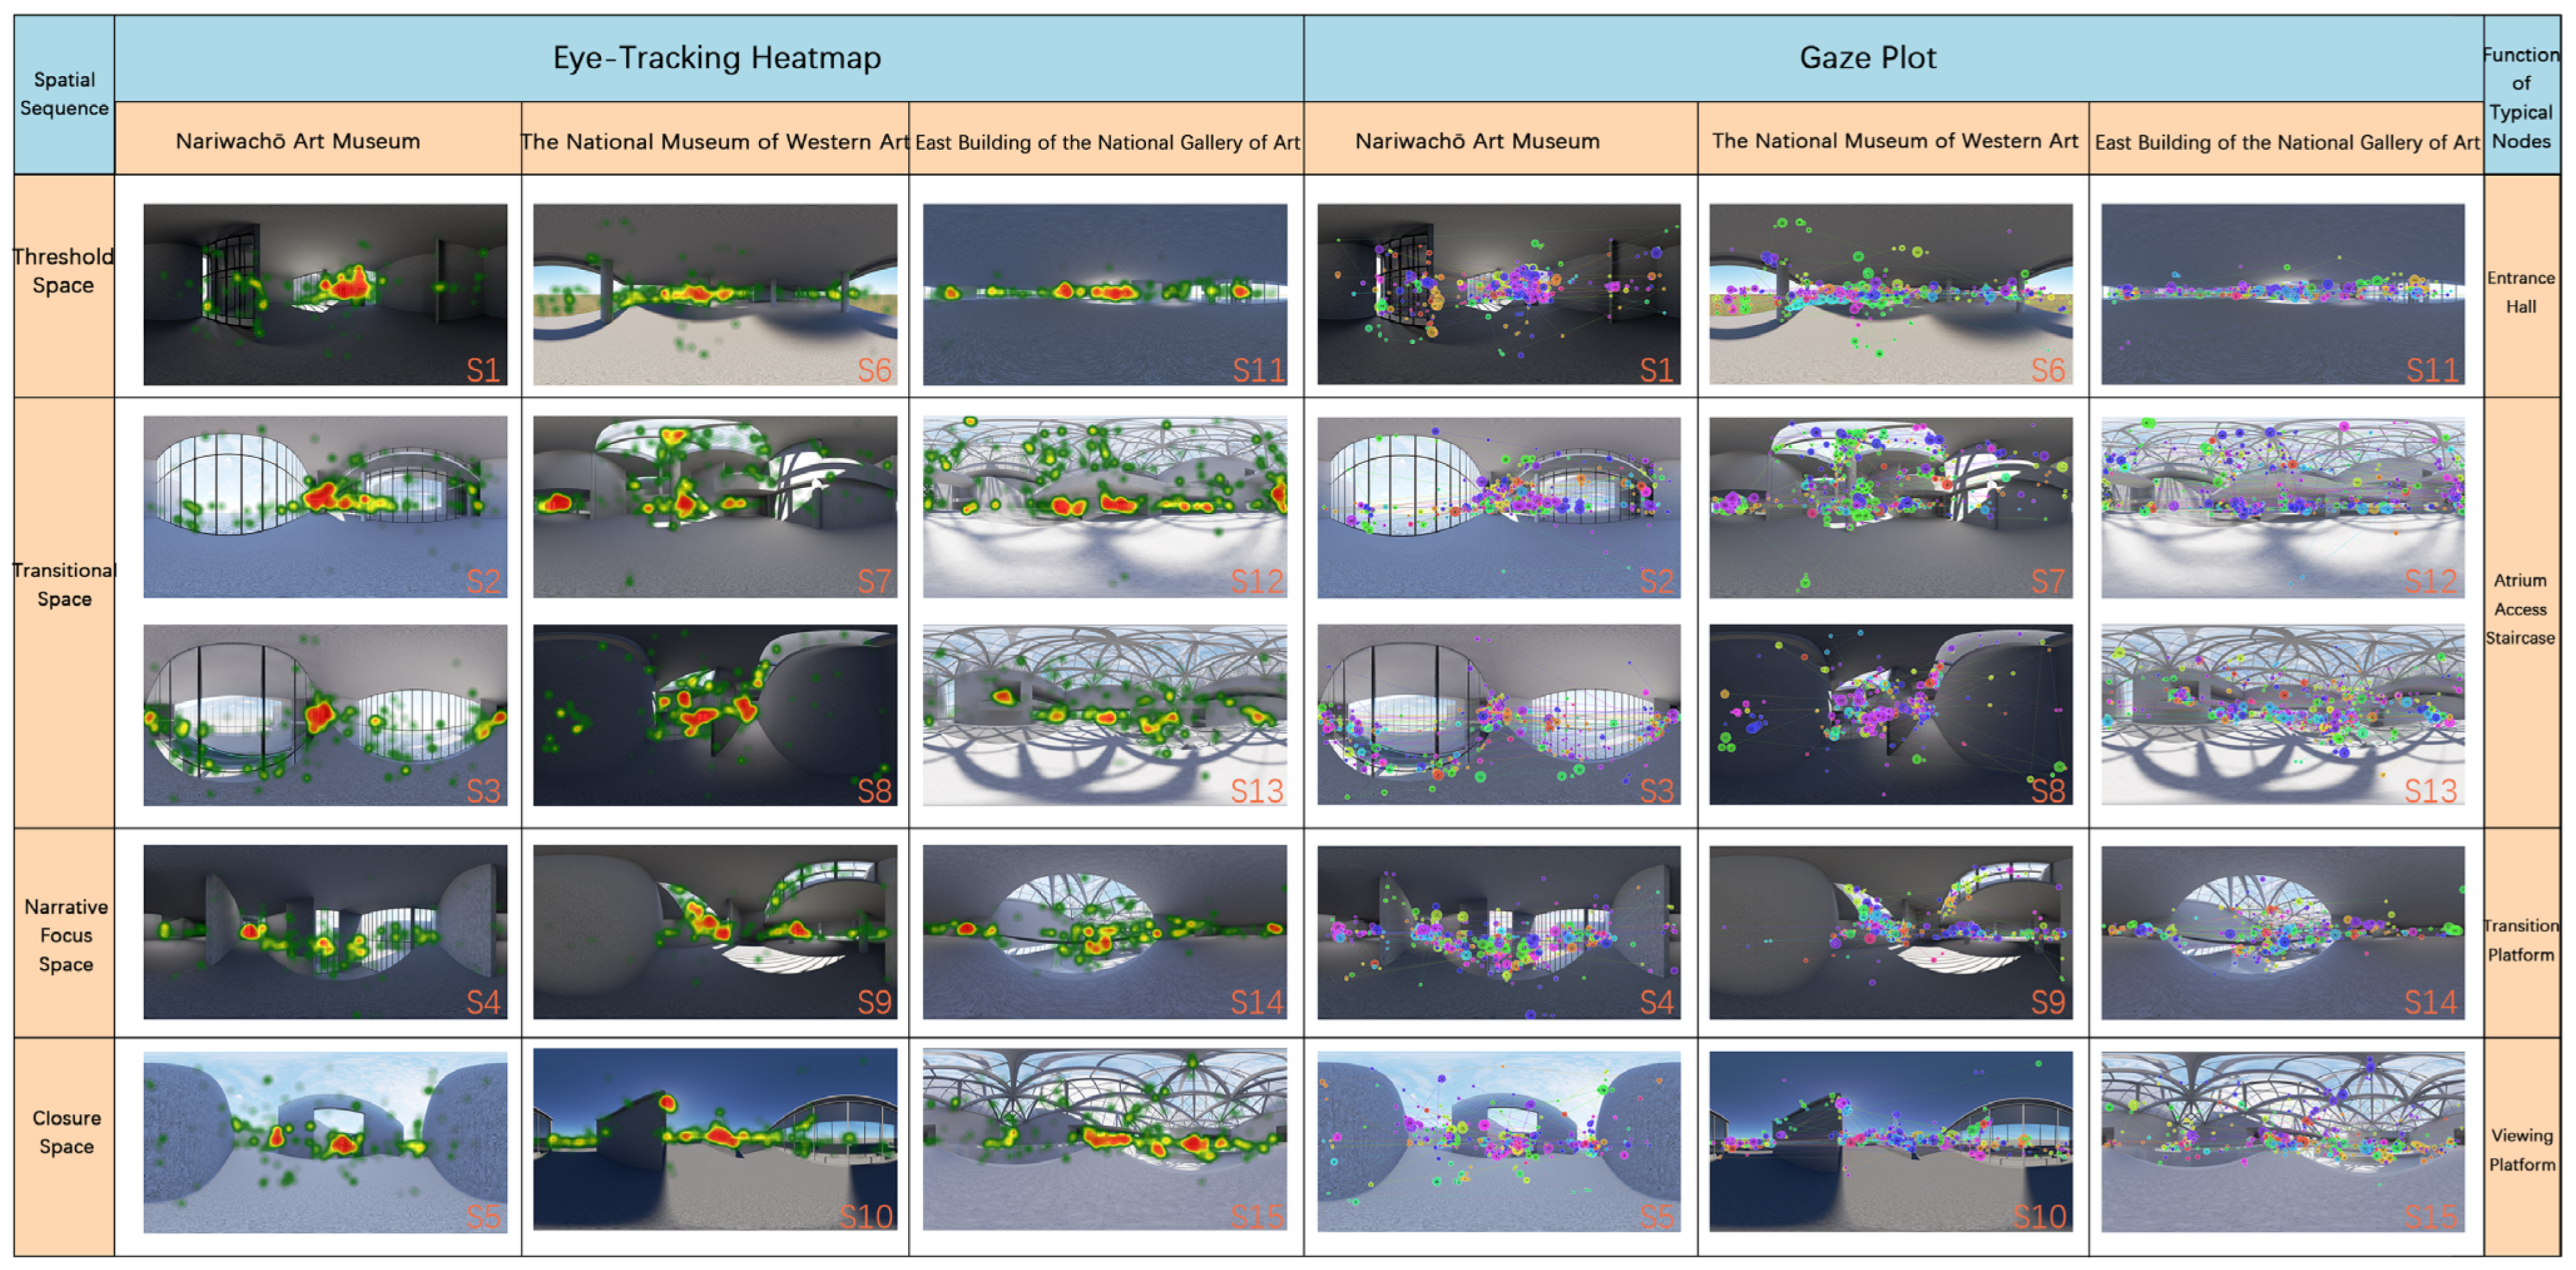
To evaluate the impact of spatial characteristics on visual attention, eye-tracking data were analyzed across four perception variables: enclosure, visual corridors, spatial scale, and light–shadow articulation. As shown in Figure 3, heatmaps reveal that spatial nodes S6, S8, and S9 concentrated a significantly higher density of visual fixations—approximately 1.8 times the sample mean. These nodes shared common features, including clearly defined visual corridors and high luminance contrast, which likely enhanced visual anchoring.
In contrast, nodes such as S2, S7, and S10 exhibited dispersed fixation distributions, with densities over 25% below the mean. These spaces were characterized by weak enclosure and an indistinct sense of spatial hierarchy, contributing to reduced perceptual salience.
The scan-path diagrams reveal that nodes S6 and S8 elicited significantly fewer saccadic movements—approximately 35% below the sample mean—suggesting more stable gaze trajectories and enhanced spatial coherence. In contrast, nodes S2 and S15 exhibited elevated gaze variability, with average saccadic amplitudes exceeding the mean by 28%. This pattern reflects a deficiency of salient visual cues and limited enclosure, leading to increased exploratory eye movements and reduced cognitive mapping efficiency.

5.1.2. Eye-Tracking Metrics Analysis

To further validate the psychological perception underlying visual behavior, this study introduces three key eye-tracking physiological indicators, as shown in Table 6.
The three eye-tracking physiological indicators—pupil diameter (PPD), blink count (BC), and saccade count (SC)—offer objective metrics for assessing users’ spatial perception and cognitive responses. An increased PPD typically indicates heightened cognitive load or emotional arousal, often triggered by visually rich or information-dense environments [50]. A higher BC may signal reduced attentional focus or the onset of visual fatigue, reflecting either diminished spatial coherence or a lack of directional cues [51]. Elevated SC values are generally associated with intensified visual search behavior, commonly occurring in spatial configurations with high complexity or dispersed focal elements [52]. Together, these physiological parameters form a quantitative foundation for interpreting perceptual demands, attentional engagement, and user interaction with varying spatial conditions.
Based on the spatial sequencing of the three selected buildings into the stages of “Threshold Space, Transitional Space, Narrative Focus Space, and Closure Space”, the influence of spatial perception factors on visual behavior and cognitive load exhibits distinct stage-based variations, as shown in Table 7. At the Threshold Space (S1, S6, S11), visual corridors and light–shadow articulation conditions are favorable, resulting in concentrated fixations and coherent gaze trajectories with relatively low cognitive load. At the Transitional Space (S2, S3, S7, S8, S12, S13), variations in enclosure and spatial scale increase visual jumping and spontaneous exploration, accompanied by elevated cognitive demand. Narrative Focus Space (e.g., S4, S9, S14) features localized light–shadow articulation contrasts that intensify visual focus and increase cognitive processing. At the Closure Space (S5, S10, S15), reduced enclosure and scale lead to more dispersed fixations and divergent gaze patterns, while cognitive load remains relatively high.
Heatmaps and eye-tracking trajectories visually illustrate the distribution of spatial attention, while physiological indicators effectively reflect cognitive states. The integration of both offers deeper insights into how spatial perception factors dynamically shape visual paths and psychological responses across architectural space sequences.

5.1.3. Ethics Statement

This study did not involve personal or sensitive data and, under the policies of the School of Architecture, Chang’an University, did not require formal ethical review. The experiment involved anonymous eye tracking of visual behavior during simulated exhibition experiences.
All the participants were informed of the study’s aims, procedures, and data handling protocols prior to participation. Written informed consent was obtained, and the participants were free to withdraw at any stage. No identifiable personal information was collected, and all data were anonymized before analysis.

5.2. Construction of the Spatial–Behavioral Mapping

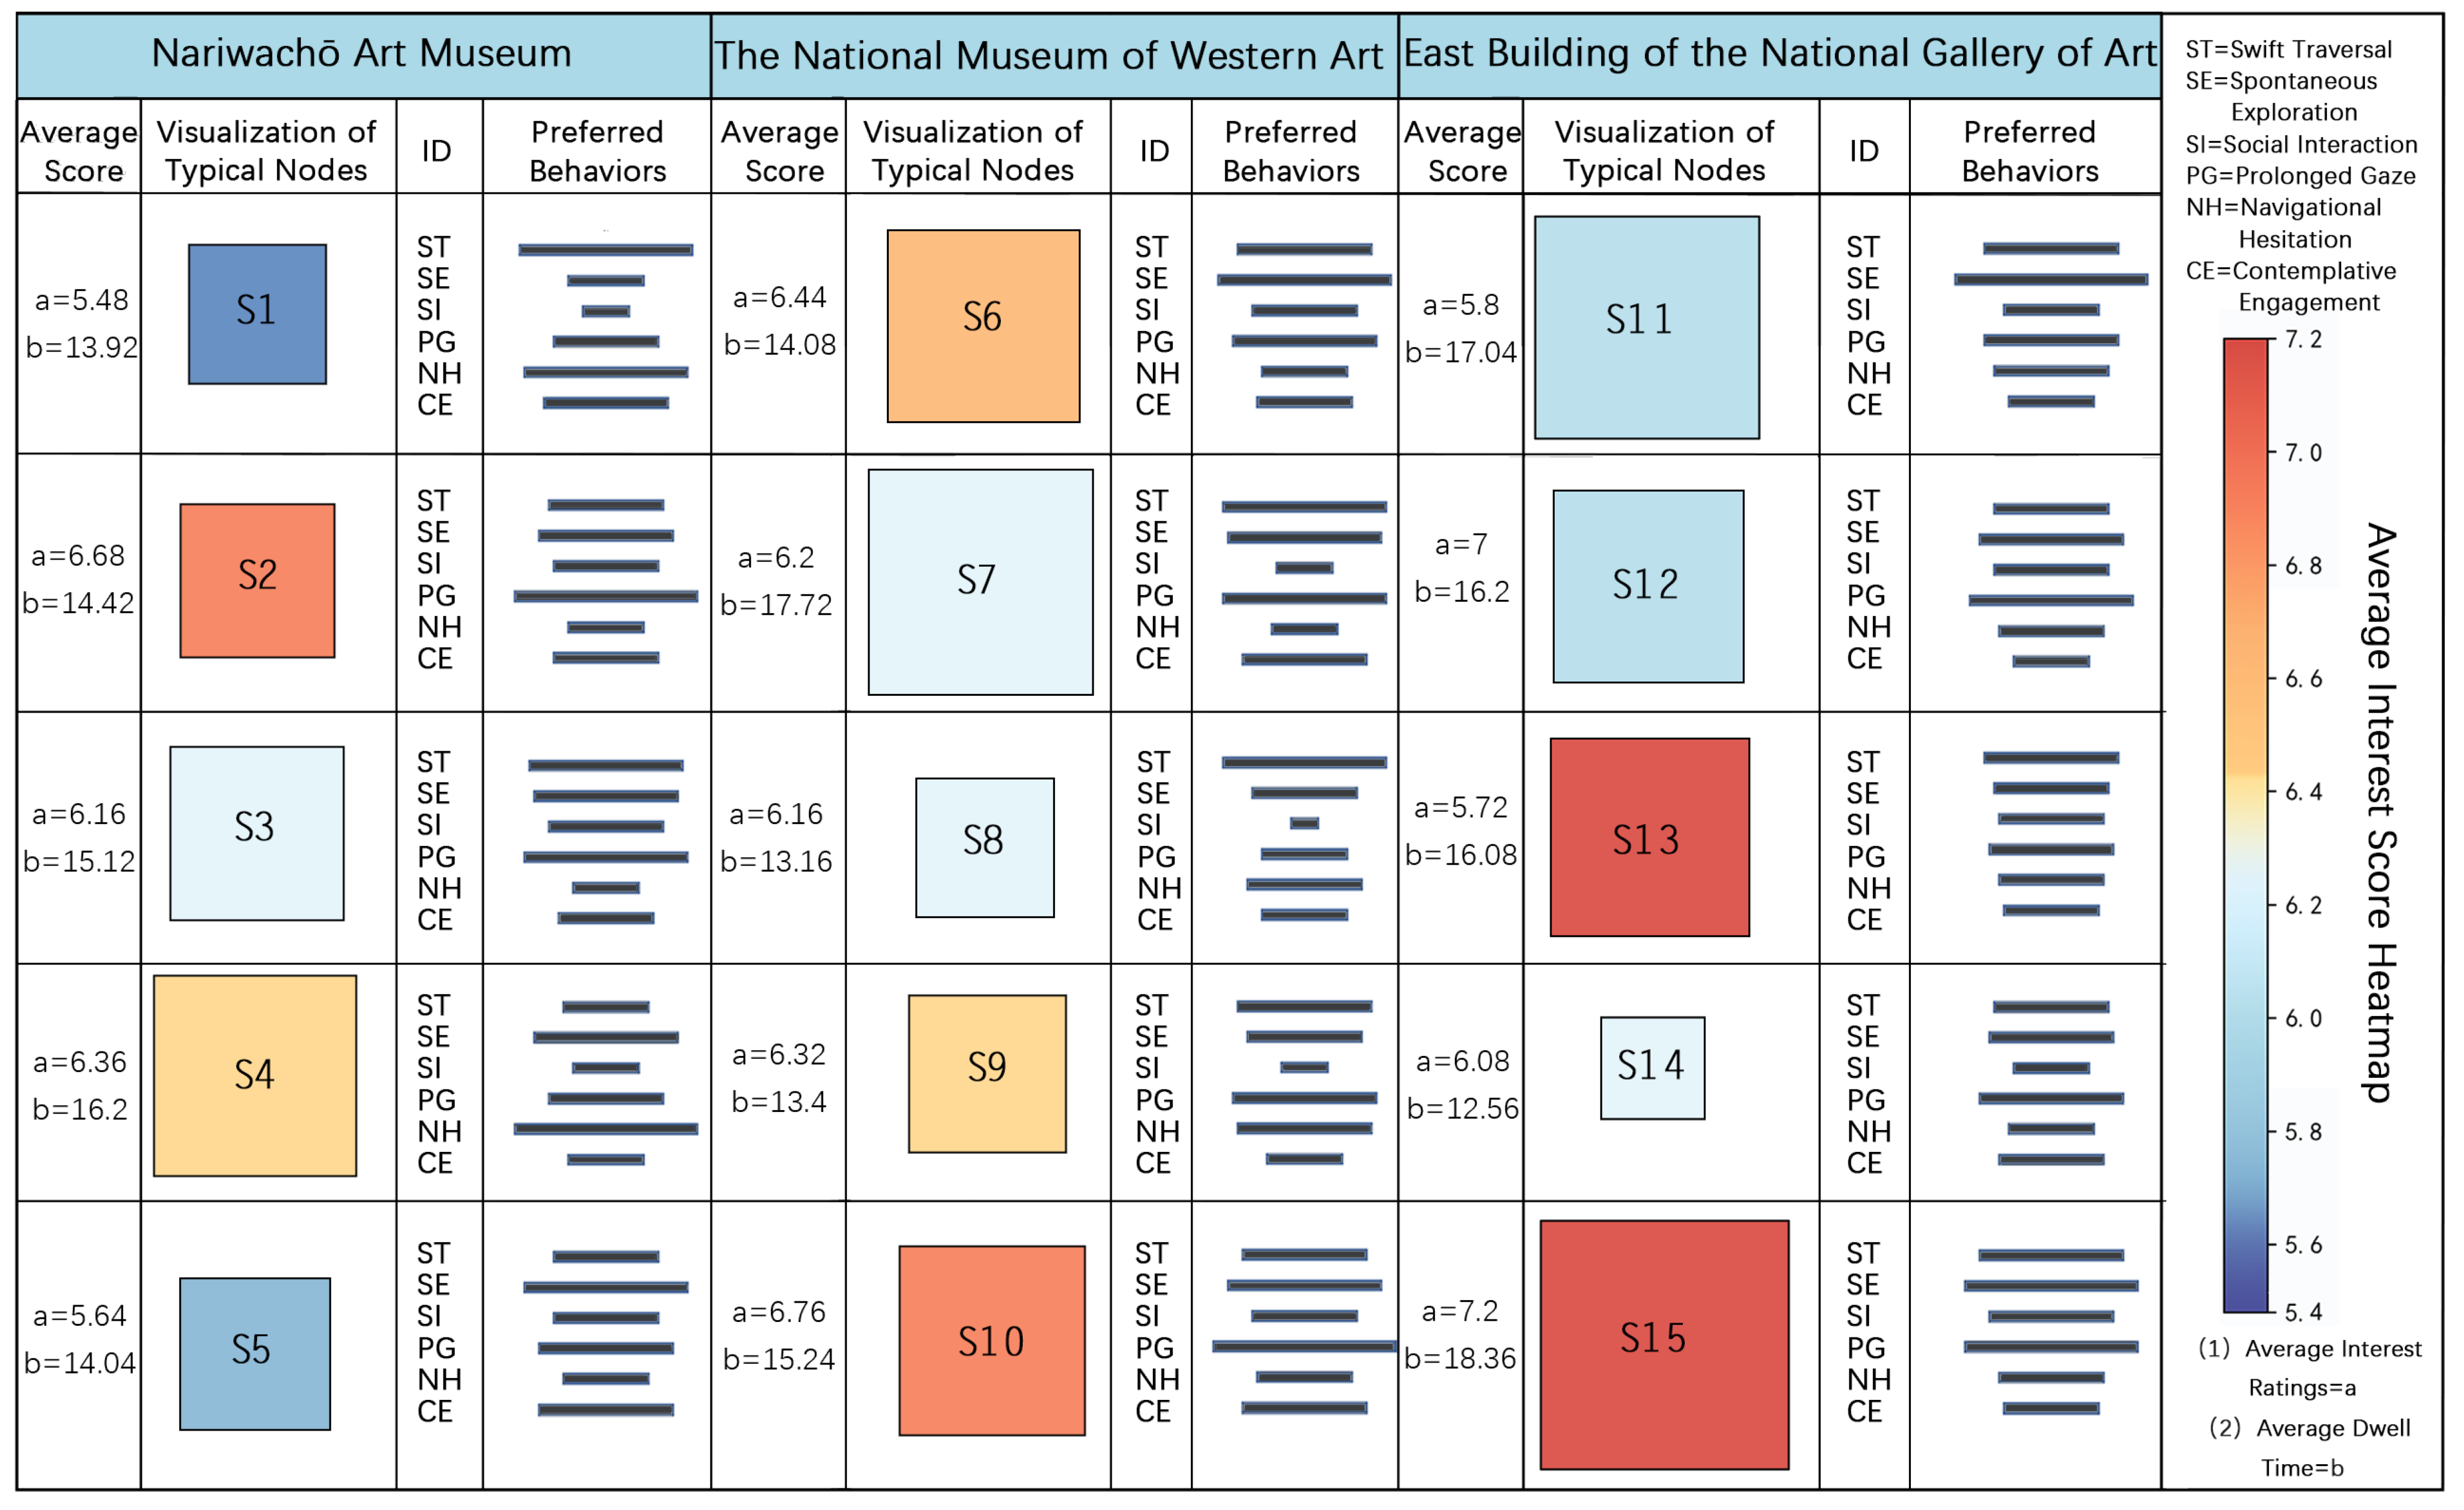
To visually represent the coupling between spatial configuration and behavioral preferences, a spatial–behavioral map was developed. In this map, node area indicates the dwell time, color intensity reflects the interest level, and bar charts display behavioral frequency. The mapping integrates the dwell-time data from eye-tracking experiments with behavioral preferences and interest ratings obtained from subjective questionnaires.

5.2.1. Analysis of Spatial Nodes Based on Interest Ratings and Dwell Time

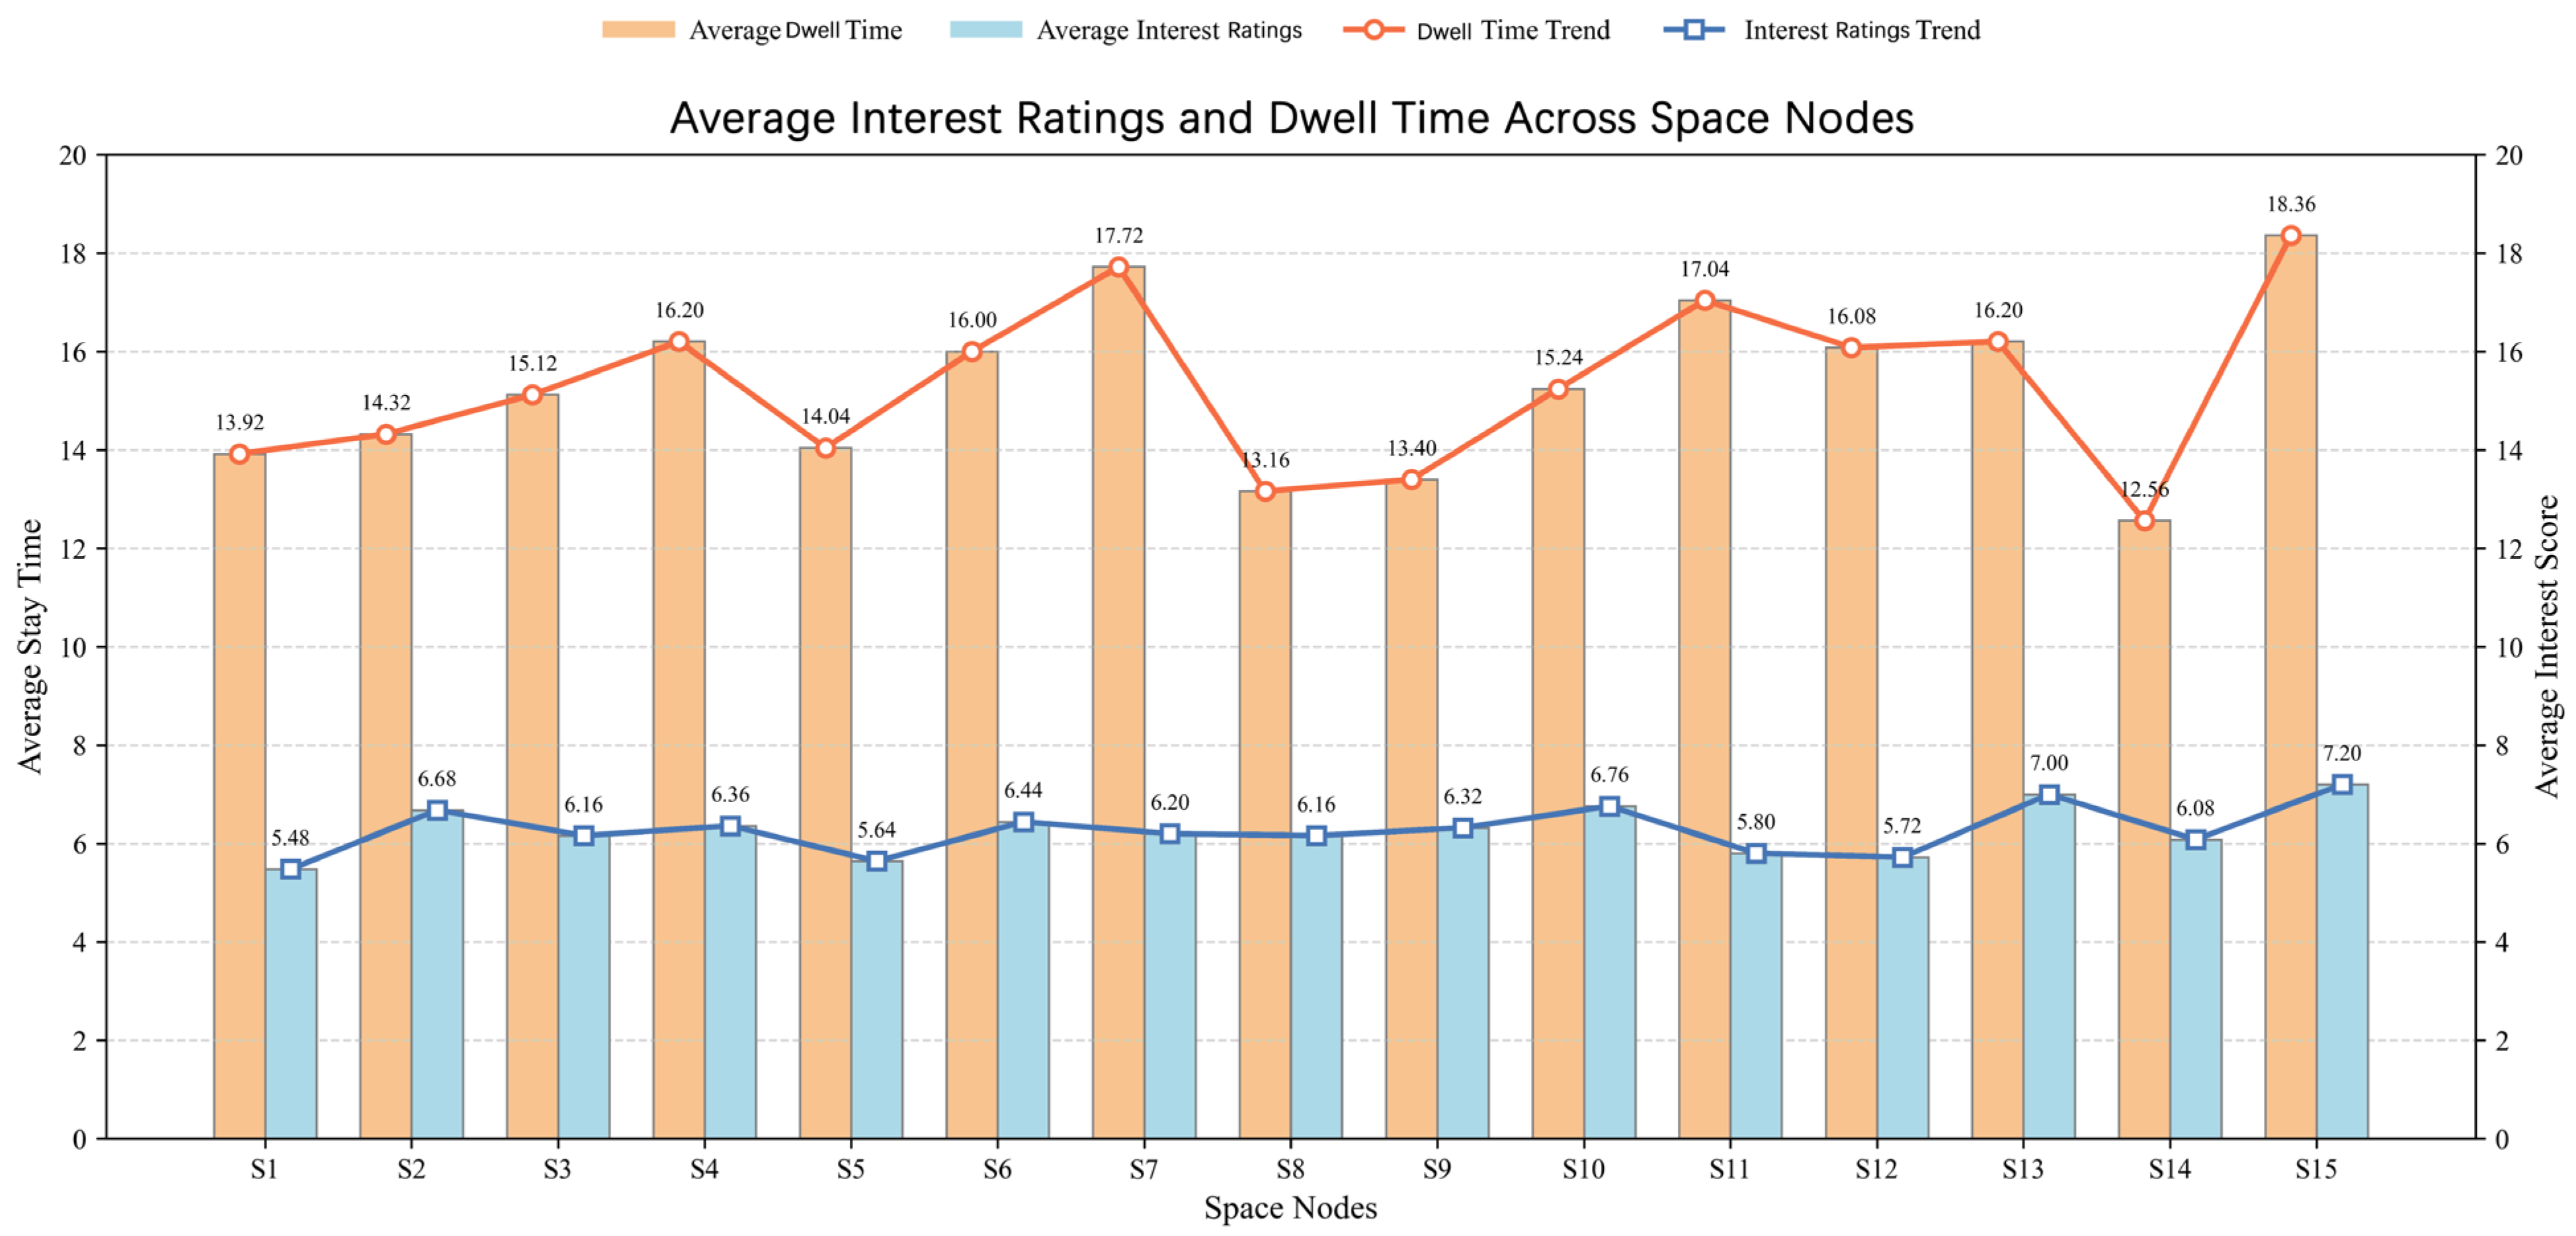
According to the data on the average dwell time across spatial nodes shown in Figure 4, Nodes S7 and S15 exhibited the longest dwell times, reaching 17.72 s and 18.36 s, respectively—among the highest across all nodes. In terms of average interest ratings, Nodes S13 and S15 received the highest ratings, at 7.0 and 7.2, indicating strong spatial appeal.
Despite a general alignment between dwell time and interest ratings, several nodes exhibit notable divergences. For instance, Node S3 shows an increase in dwell time from 14.32 to 15.12 s compared to S2, yet its interest rating declines to 6.16. Similarly, Node S7 ranks second in dwell time (17.72 s) but registers a moderate interest rating of 6.2. Node S11, with the third-longest dwell time (17.04 s), receives an interest rating of only 5.8—the second lowest among all nodes.
These discrepancies demonstrate that prolonged spatial engagement does not necessarily translate into heightened interest. Evidence from eye-tracking heatmaps further reinforces this observation. Zones of concentrated visual attention do not consistently align with higher subjective preference. Consequently, neither dwell time nor visual attention, when examined in isolation, offers a sufficient measure of spatial effectiveness. This underlines the need for multidimensional evaluation frameworks that integrate behavioral, perceptual, and attitudinal dimensions.
Drawing on the contrasts between the dwell time and interest ratings presented in Table 3, distinct mechanisms can be identified. At S3, a longer dwell time stemmed from confusion and forced exploration, reflected in heightened arousal yet accompanied by low preference. At S7, extended engagement was associated with active exploratory behavior, suggesting a degree of spatial attractiveness; however, the absence of pronounced highlights limited its impact, resulting in only moderate interest. At S11, a prolonged dwell time was guided by clear visual corridors and articulated light–shadow patterns, producing a coherent and fluent experience. Nevertheless, the relatively low arousal response indicates that, while legible, the space lacked sufficient stimulation to elevate interest.

5.2.2. Discussion and Analysis

As illustrated in Figure 5, the spatial–behavioral mapping, where dwell time and interest levels are visually encoded through the size and color intensity of each rectangular node, nodes S15, S7, and S11 exhibit the largest spatial footprints, corresponding to prolonged dwell times. Notably, S15 and S13 display the most saturated warm hues, indicating the highest average interest ratings among all observed nodes. Visitor’s behavior shows marked differences across the four spatial types, revealing spatial dependency in engagement patterns.
  • Threshold Spaces (S1, S6, S11) primarily elicited dynamic behaviors, notably spontaneous exploration and swift traversal. Static actions—such as visual fixation and navigational hesitation—occurred moderately, while social interaction and reflective pauses were rare.
  • Transitional Spaces (S2, S3, S7, S8, S12, S13) showed a more balanced behavioral profile. Dynamic activity remained dominant, especially quick movement and exploration, accompanied by intermittent visual fixation. Prolonged gaze and stationary engagement were limited, suggesting an emphasis on spatial flow over attentional depth.
  • Narrative Focus Spaces (S4, S9, S14) were associated with higher frequencies of static behaviors, particularly extended fixation and hesitation, reflecting increased cognitive engagement. Dynamic behaviors persisted, indicating a layered interaction mode.
  • Closure Spaces (S5, S10, S15) exhibited high levels of both exploration and prolonged gaze, suggesting intensified attention and reflective processing toward the end of the spatial sequence.
Across the typologies, the relative distribution of the six observed behavior categories is clearly spatially mediated. This spatial variance also influences the overall dynamic-to-static behavior ratio, offering a potential framework for optimizing the spatial rhythm and curatorial flow within exhibition design.

5.3. Results of Spatial Factor Analysis

To systematically investigate how spatial perception factors influence visitor interest and dwell behavior, this study employs multiple regression analysis to develop two models: the “Average Interest Ratings Model” and the “Average Dwell Time Model”. These models use average interest ratings and dwell time as dependent variables, and four core spatial perception variables as independent variables, to quantitatively analyze the impact paths of spatial attributes on both subjective perception and actual behavior. The average interest ratings reflect the perceived attractiveness of a spatial node, while the average dwell time measures its actual usage intensity. The regression results help identify the key spatial perception factors influencing visitor behavior, offering quantitative evidence and theoretical support for optimizing spatial nodes.

5.3.1. Statistical Results of the Regression Model

As shown in Table 8, the prediction model for average interest ratings (Y1 = α0 + ∑14αiXi + ε) demonstrates an excellent fit (R2 = 1.000), with all regression coefficients statistically significant (p ≈ 0), no multicollinearity (VIF < 2), and residuals approximately normally distributed. The model shows robustness and generalizability, with a five-fold cross-validated mean squared error (MSE) of 0.143. The results indicate that enclosure has a significant negative impact on interest (α = −0.094), suggesting that enclosed spatial structures may reduce perceived attractiveness. In contrast, visual corridors have a minor negative influence (α = −0.007), implying that visual corridors contribute little to interest enhancement. Spatial scale exhibits a positive effect (α = 0.042), indicating a positive correlation between appropriate spatial scale and user interest, where well-balanced proportions tend to increase spatial appeal.
In the model for average dwell time (Y2 = β0 + ∑14βiXi + ν), similarly high explanatory power is observed (R2 = 1.000), with all statistical indicators significant. Consistent with the interest model, enclosure exerts a strong negative effect on dwell time (β = −0.319), suggesting that enclosed environments may shorten visitor stay. In contrast, visual corridors show a positive influence (β = 0.022), indicating that spatial legibility and visual corridors positively contribute to extended dwell duration. Both regression models were developed using SPSS26.0 [53], and their strong explanatory performance provides empirical support for understanding how spatial features affect visitor responses.

5.3.2. Visualization of the Influence Trends of Spatial Factors

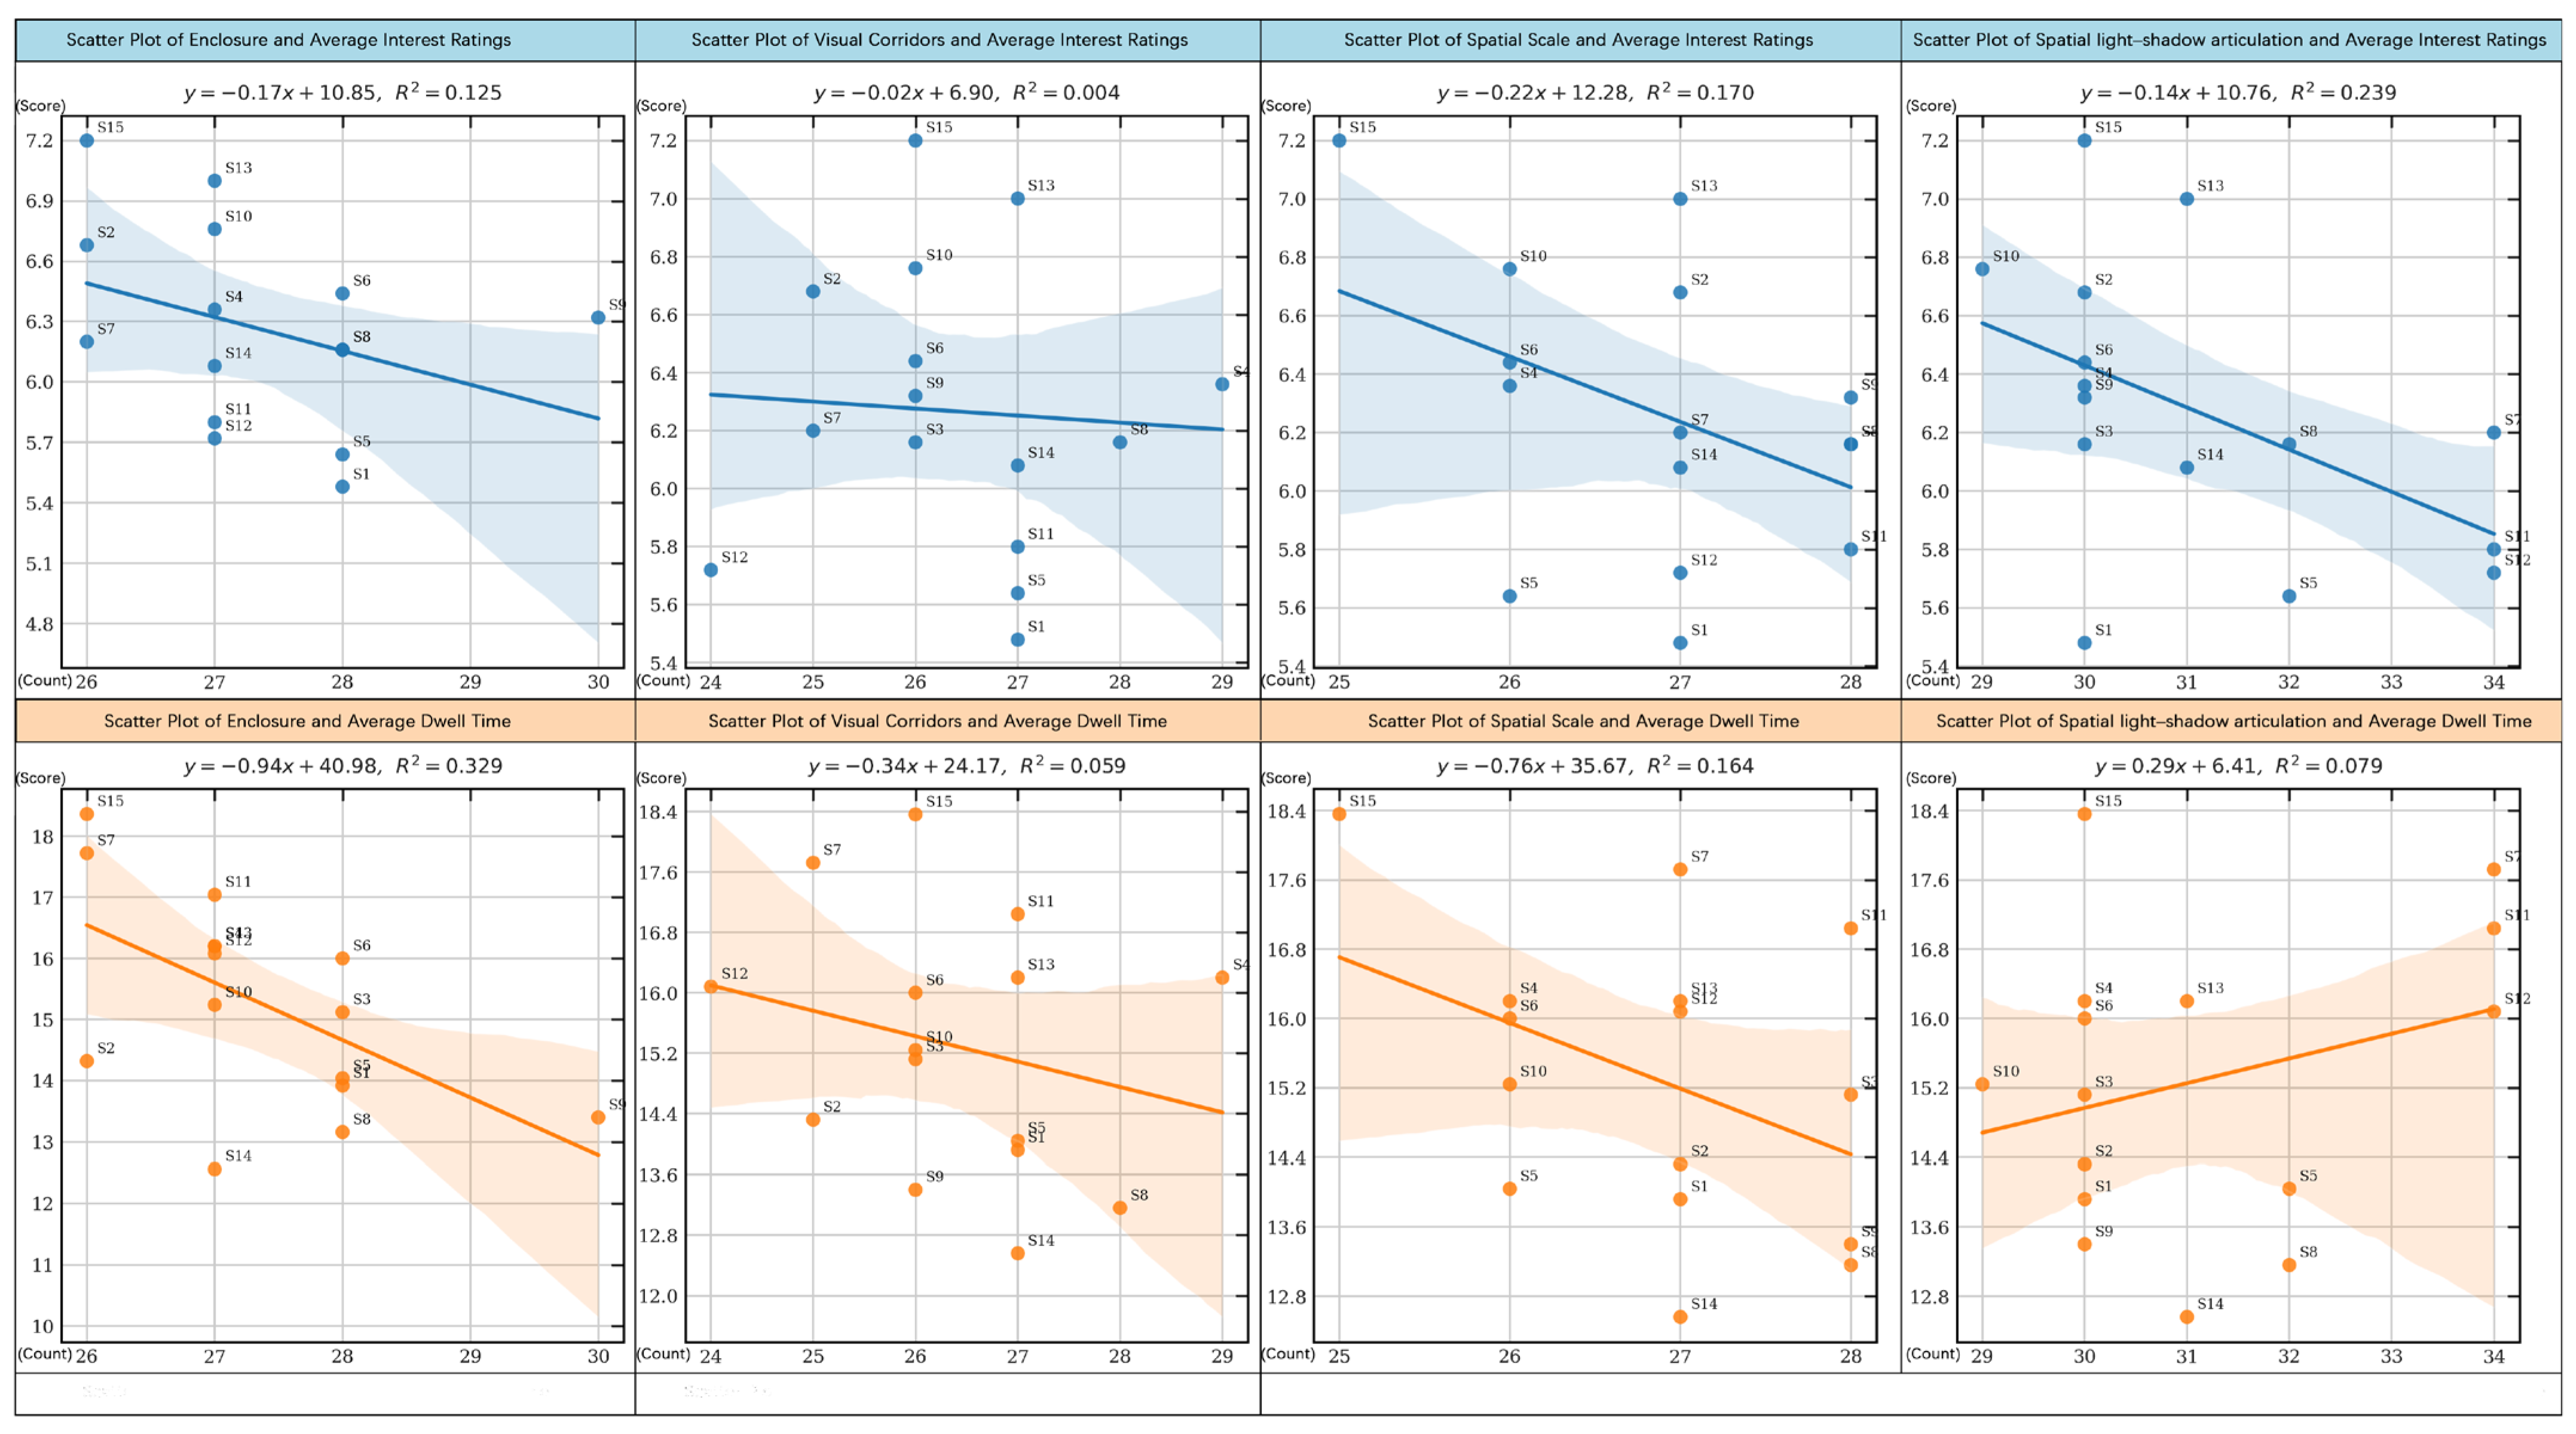
The chart and table group (Figure 6) illustrates the relationship between average interest ratings and spatial perception variables. Enclosure shows a negative impact, particularly evident at nodes S15 and S7 (R2 = 0.125 and 0.170), suggesting that a stronger enclosure may reduce visitor interest. Visual corridors’ influence is minimal; at node S6, it is nearly insignificant (R2 = 0.004), and a weak negative correlation is observed at node S15 (R2 = 0.004). A spatial scale also shows a negative correlation at nodes S6 and S14 (R2 = 0.170 and 0.239), indicating that a larger perceived scale may decrease visitor interest. The influence of light–shadow articulation follows a generally negative trend, with relatively strong negative correlations at nodes S2 and S15 (R2 = 0.239 and 0.170). Overall, enclosure and scale are the dominant factors affecting interest ratings, while light–shadow articulation design plays a weaker role in most cases, though it shows more pronounced negative effects at specific nodes such as S2 and S15.
Regarding the relationship between average dwell time and spatial perception variables, enclosure again exhibits a strong negative effect, especially at nodes S15 and S7 (R2 = 0.329 and 0.164). Visual corridors show little impact across most nodes; at S2, their influence is negligible (R2 = 0.059), while node S12 displays a slight negative effect (R2 = 0.079). A spatial scale is negatively correlated with dwell time, with node S10 showing a particularly notable effect (R2 = 0.164), indicating that larger spaces may reduce the duration of stay. The impact of light–shadow articulation on dwell time is more complex. While generally weak, a slight positive correlation appears at S10 (R2 = 0.079), whereas negative effects are observed at nodes S7 and S6. In summary, enclosure has the most significant influence on dwell time, while the effects of scale and light–shadow articulation are weaker and should be fine-tuned according to the characteristics of each spatial node.

5.3.3. Summary

In different spatial types, the participants’ interest ratings and dwell time were significantly influenced by specific spatial perception factors. In “Threshold Space” spaces, interest ratings were negatively affected by enclosure (α = −0.094), with enclosure also being the primary factor influencing dwell time (β = −0.319). In “Transitional Space” spaces, enclosure had the strongest negative effect on interest ratings, while perceived scale showed the most significant positive impact on dwell time (β = 0.186). In “Narrative Focus Space” spaces, perceived scale had the largest effect on interest ratings, while visual corridors influenced dwell time. In “Closure Space” spaces, light–shadow articulation conditions had a strong negative impact on interest ratings (α = −0.057), while both perceived scale and light–shadow articulation exerted positive effects on dwell time (β = 0.186 and 0.156, respectively).
Overall, enclosure showed a consistent and significant negative impact on both interest and dwell time, especially the latter. In contrast, perceived scale had a positive effect on both variables, indicating that greater spatial openness tends to increase dwell duration. Visual corridors had minimal influence and could be considered negligible. Light–shadow articulation conditions negatively affected interest ratings but positively influenced dwell time. In summary, enclosure plays a dominant role in reducing visitor engagement and retention, while perceived scale and light–shadow articulation conditions primarily contribute to extended dwell time through positive modulation.

5.3.4. Residual Diagnostics for Regression Assumption Validation

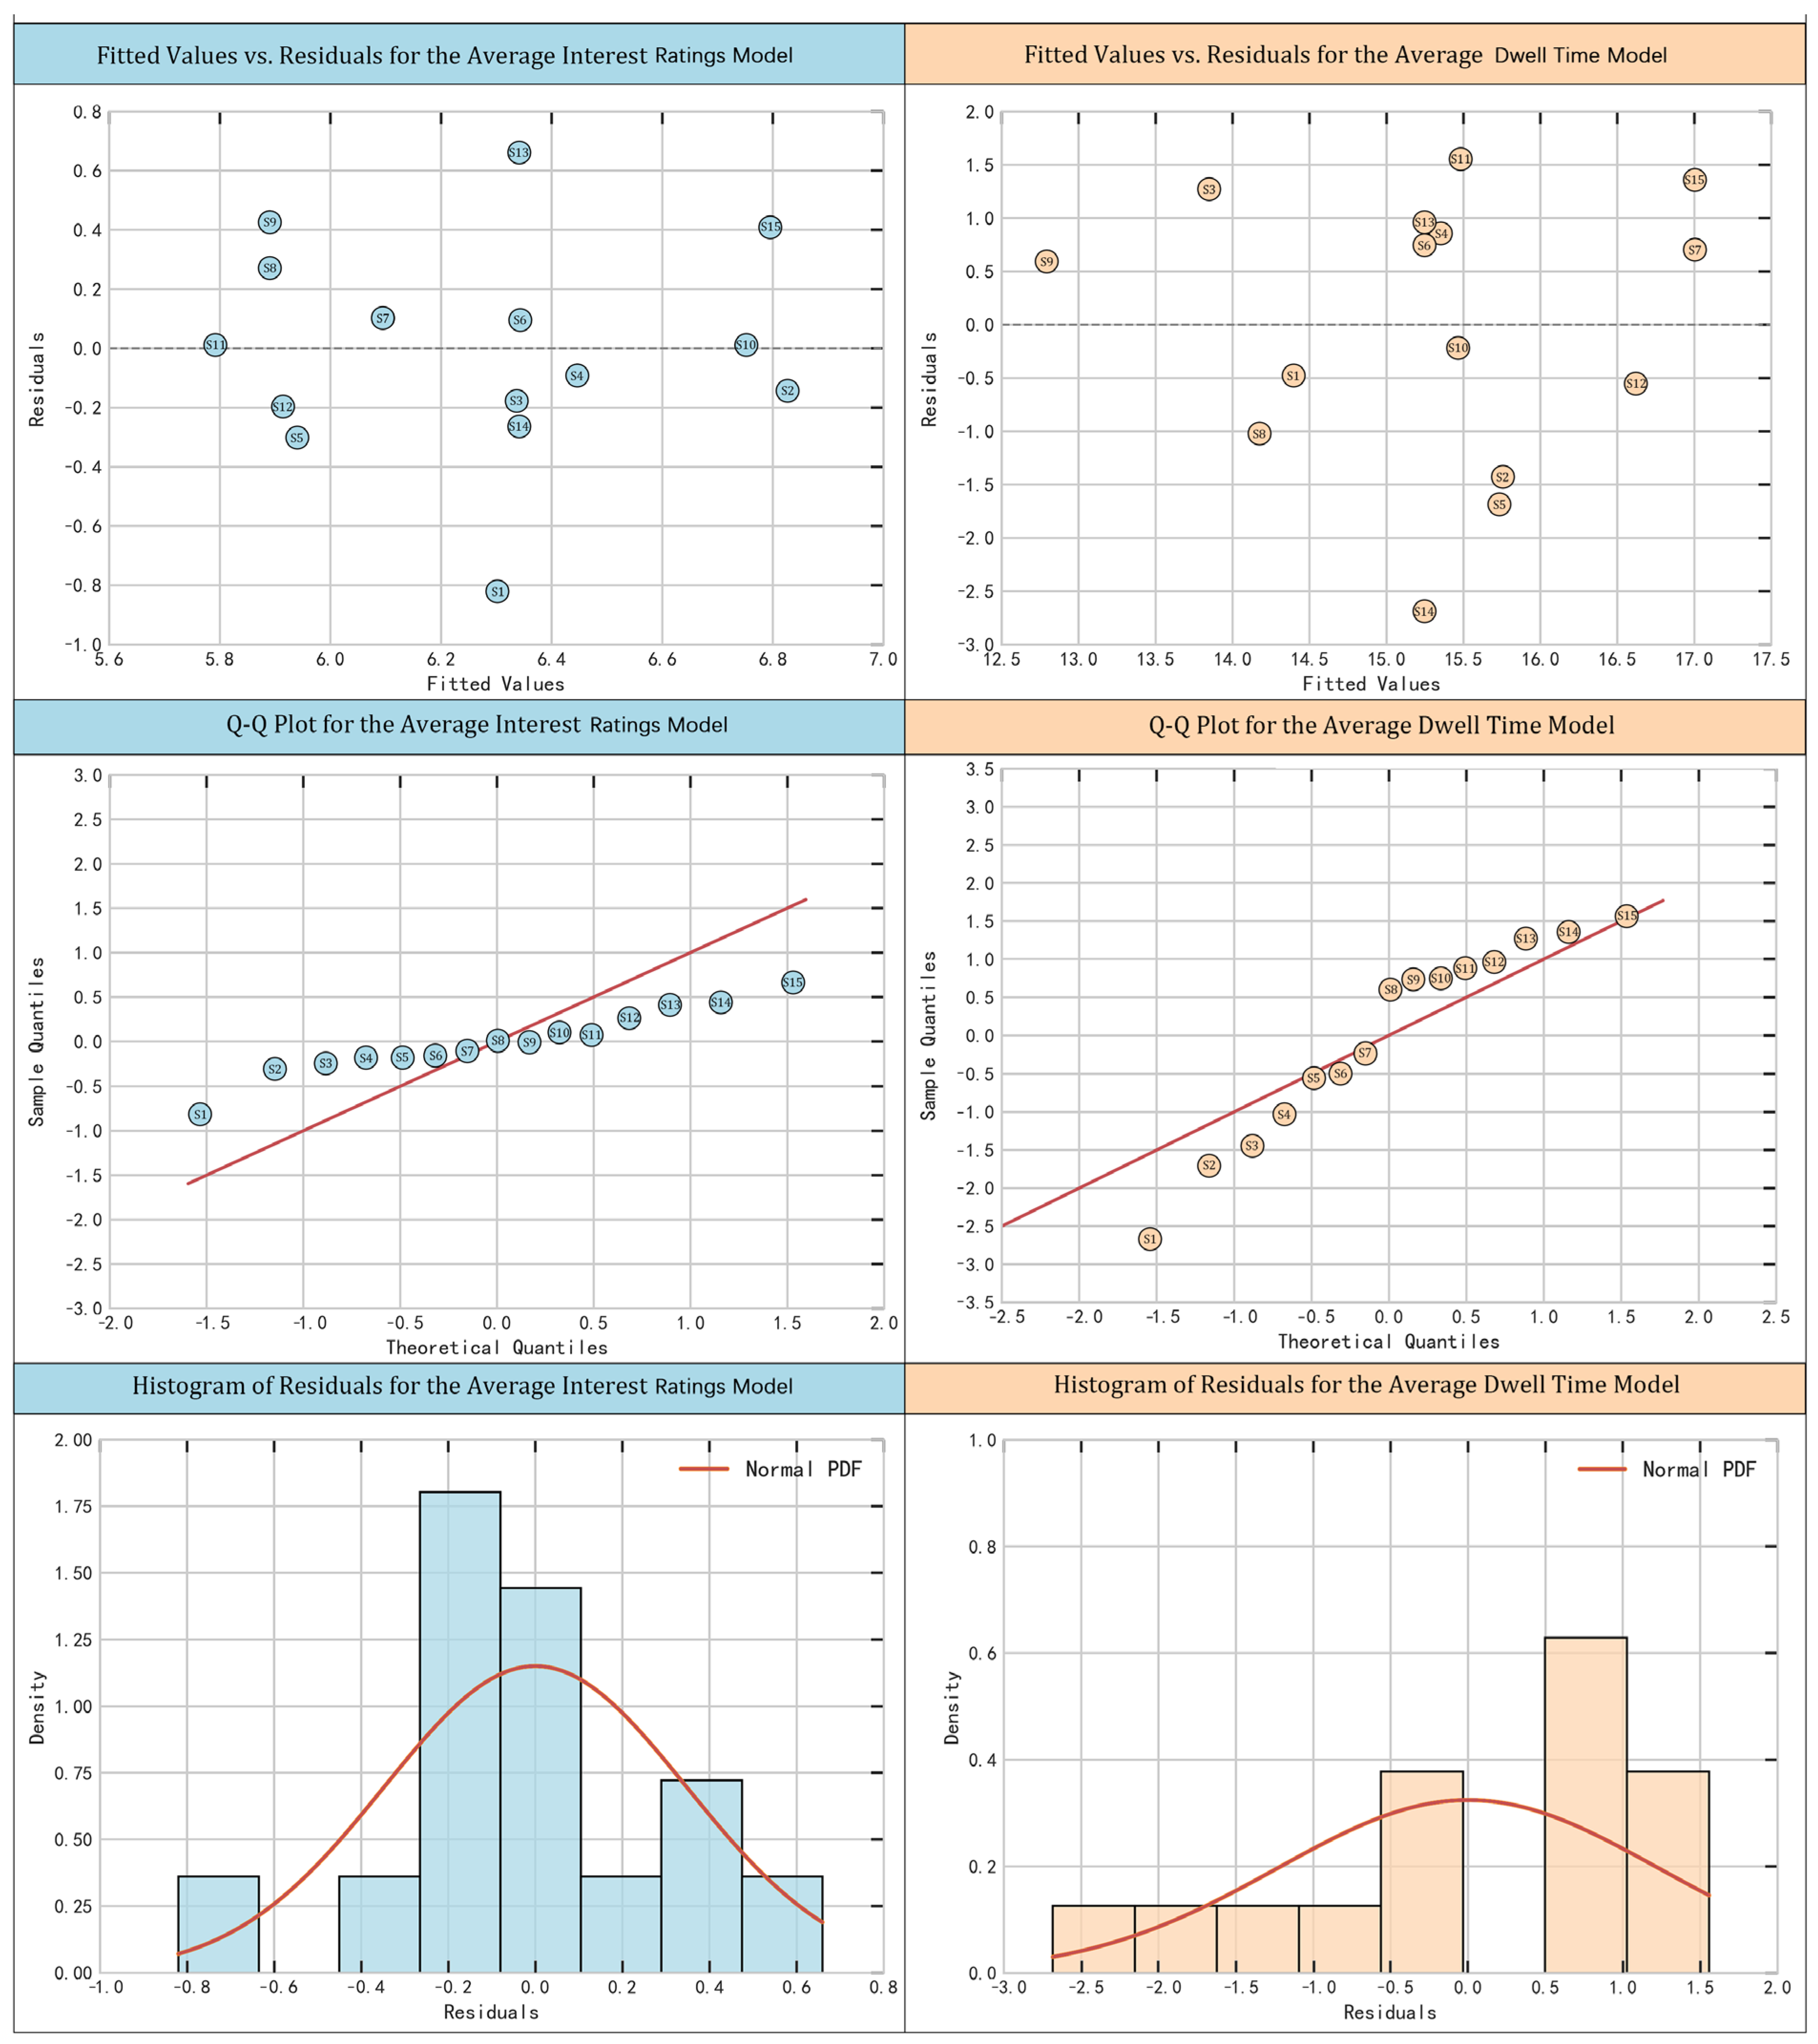
To ensure the statistical robustness of the regression models predicting visitor interest and dwell time, a series of residual diagnostics were conducted, including residuals-versus-fitted value plots, quantile–quantile (Q–Q) plots, and residual histograms overlaid with theoretical normal distributions (Figure 7). These visual assessments were employed to test the underlying assumptions of linearity, homoscedasticity, and normality.
  • Interest Ratings Model Validation:
For the interest ratings model, residuals are evenly dispersed around the zero baseline, exhibiting neither systematic curvature nor funnel-shaped patterns. This confirms both linearity and homoscedasticity. The residuals-versus-fitted plot shows a consistent horizontal band, with no outliers or high-leverage points among the spatial nodes (S1–S15).
The Q–Q plot displays a strong alignment of standardized residuals with the 45-degree reference line, indicating approximate normality. Minor deviations at the distribution tails fall within acceptable limits for moderate-sized samples. The residual histogram corroborates this, closely approximating a normal bell curve with slight variance. Collectively, these diagnostics support the conclusion that the core regression assumptions are sufficiently met for the interest model.
  • Dwell Time Model Validation:
The residuals-versus-fitted plot for the dwell time model shows general symmetry, but with a mild fanning pattern at higher fitted values, suggesting slight heteroscedasticity. This may reflect increased behavioral variability in spatial zones with extended engagement durations. A few spatial nodes exhibit larger residual spread, especially at the upper prediction range.
The Q–Q plot shows an overall linear trend, yet with noticeable heavy tails at both ends—indicative of potential deviations from normality. These outliers may arise from uneven dwell-time distributions across spatial types. The residual histogram echoes this, with a right-skewed and mildly flattened shape, diverging from the ideal Gaussian form.
Despite these moderate departures from ideal diagnostic profiles, the model remains statistically reliable. Consistent plotting formats and labeled spatial nodes across both models enhance visual interpretability and facilitate comparative assessment. While the dwell time model exhibits slightly greater variance, it retains practical validity for spatial–behavioral inference.

5.3.5. Reliability and Validity of the Questionnaire

  • Reliability Analysis
We assessed the internal consistency of the questionnaire using Cronbach’s alpha coefficient, which was 0.85, indicating high reliability. To further confirm the reliability, we calculated split-half reliability, yielding a correlation of 0.82, reinforcing the robustness of the instrument.
  • Factor Analysis
Exploratory factor analysis (EFA) was conducted to assess the questionnaire’s construct validity. The Kaiser–Meyer–Olkin (KMO) measure was 0.87, indicating that the sample size was suitable for factor analysis. Bartlett’s test of sphericity was significant (p < 0.001), confirming the appropriateness of the data. EFA identified three key factors: Interest in Enclosure, Perception of Visual Corridors, and Spatial Scale, accounting for 78.4% of the total variance, supporting the validity of the instrument.
  • Validity
Convergent Validity: High factor loadings (ranging from 0.71 to 0.89) confirm that the items within each factor are strongly correlated.
Discriminant Validity: Low inter-factor correlations (r < 0.3) confirm that the factors measure distinct constructs.
  • Statistical Significance
In the regression models, the coefficients for each spatial perception factor were statistically significant, as detailed below:
(a)
Enclosure: For the interest ratings model, the coefficient was −0.094 (t = −6.58, p < 0.001) with a 95% confidence interval from −0.118 to −0.070. For the dwell time model, the coefficient was −0.319 (t = −4.72, p < 0.001) with a confidence interval from −0.400 to −0.238.
(b)
Visual Corridors: For the interest ratings model, the coefficient was −0.007 (t = −0.92, p = 0.359) with a confidence interval from −0.019 to 0.005. For the dwell time model, the coefficient was 0.022 (t = 1.72, p = 0.085) with a confidence interval from 0.001 to 0.043.
(c)
Spatial Scale: For the interest ratings model, the coefficient was 0.042 (t = 4.83, p < 0.001) with a confidence interval from 0.029 to 0.056. For the dwell time model, the coefficient was 0.186 (t = 3.06, p = 0.003) with a confidence interval from 0.073 to 0.299.
(d)
Light–Shadow Articulation: For the interest ratings model, the coefficient was −0.057 (t = −1.47, p = 0.146) with a confidence interval from −0.127 to 0.014. For the dwell time model, the coefficient was 0.156 (t = 3.42, p = 0.001) with a confidence interval from 0.066 to 0.246.

6. Discussion and Conclusions

6.1. Theoretical and Empirical Insights

This study adopts the “Threshold Space, Transitional Space, Narrative Focus Space, and Closure Space” spatial sequence as an analytical lens to explore how spatial configuration influences visitor behavior in cultural exhibition spaces.
Drawing upon immersive eye-tracking experiments, subjective assessments, and cross-case analysis of three representative museums, a spatial–behavioral mapping model was developed. Using multiple linear regression, the study quantitatively assessed the effects of four key perceptual variables—enclosure, visual corridors, spatial scale, and light–shadow articulation—on two behavioral outcomes: interest ratings and dwell time.
  • In Threshold Space, both dwell time and interest were negatively correlated with enclosure, with visitor behavior primarily characterized by spontaneous exploration and swift traversal.
  • In Transitional Space, enclosure emerged as the strongest predictor of interest, while an increased spatial scale significantly extended dwell time. Visual corridors supported smooth transitions between dynamic and static engagement.
  • In Narrative Focus Space, rapid passage was dominant. Spatial scale positively influenced interest, whereas visual corridor depth primarily determined dwell duration.
  • In Closure Space, visitors displayed increased contemplative engagement and prolonged gaze. While light–shadow articulation negatively affected interest ratings, it—alongside spatial scale—positively contributed to extended dwell time.
These results build upon prior research on the influence of spatial geometry in shaping movement and emotional response [1,2], offering a more nuanced perspective: the impact of spatial attributes is highly context-dependent when embedded within sequential spatial narratives. For example, while enclosure may reduce dwell time in initiation spaces (Threshold Space), it can enhance perceptual focus and engagement in development spaces (Transitional Space). This underscores the non-linear and dynamic effects of spatial variables, in contrast to earlier studies that assessed such features in isolation or through static analytical tools like heatmaps.
Moreover, the study highlights spatial rhythm as a structuring mechanism for visitor behavior. The sequential transition from Threshold Space to Closure Space reveals a gradual shift from goal-directed navigation to immersive observation, suggesting that carefully orchestrated spatial sequencing can foster deeper and sustained engagement. This finding supports contemporary approaches in museum and experience design, where spatial narration complements curatorial content to enrich the overall visitor journey.

6.2. Practical Design Implications

Building upon the empirical results, this study proposes design guidelines tailored for architects, exhibition designers, and curators. The recommendations are organized according to the four spatial typologies—Threshold Space, Transitional Space, Narrative Focus Space, and Closure Space—each requiring distinct articulation aligned with visitor behaviors:
  • Threshold Space (Orientation and Entry)
    (a)
    Emphasize spatial legibility and permeability.
    (b)
    Adopt open layouts with reduced enclosure and minimal visual clutter.
    (c)
    Integrate intuitive wayfinding systems to support exploratory movement and smooth spatial entry.
  • Transitional Space (Pacing and Navigation)
    (a)
    Maintain controlled enclosure to sustain visitor attention.
    (b)
    Introduce semi-transparent partitions, overhead apertures, or rest zones for perceptual pacing.
    (c)
    Facilitate gradual immersion into the main exhibition sequence.
  • Narrative Focus Space (Engagement and Redirection)
    (a)
    Strengthen visual anchoring and reorientation cues.
    (b)
    Apply material contrasts, spatial compression and release, or directional lighting to guide focus.
    (c)
    Enhance cognitive engagement and decision making through spatial modulation.
  • Closure Space (Contemplation and Emotional Resonance)
    (a)
    Cultivate a cohesive and contemplative atmosphere.
    (b)
    Employ expansive volumes, integrated natural–artificial light schemes, and acoustic modulation.
    (c)
    Encourage prolonged presence and reflective engagement at the conclusion of the exhibition path.
Moreover, these design strategies explicitly correspond to the cognitive–behavioral stages described in Bitgood’s attention–value model. Threshold Spaces align with the Attraction stage, where spatial openness and visual accessibility invite initial orientation. Transitional Spaces parallel the Hold stage, sustaining attention through pacing and directional cues. Narrative Focus Spaces correspond to Engagement, where visual anchors and spatial contrasts foster deeper involvement and decision making. Finally, Closure Spaces resonate with the Exit stage, facilitating reflective consolidation and emotional resolution. This theoretical alignment strengthens the interpretive depth of the proposed typology and translates abstract behavioral stages into actionable spatial interventions. By explicitly mapping the four spatial categories to the cognitive–behavioral stages of Bitgood’s model, the proposed framework operationalizes abstract psychological constructs into tangible spatial tactics. This translation not only bridges theoretical models with design interventions but also provides practitioners with an evidence-based roadmap for curating visitor experiences in both physical and hybrid exhibition settings.
Together, these guidelines translate perceptual–behavioral insights into actionable design strategies. Rather than relying on universal prescriptions, they advocate a sequenced and differentiated calibration of space, bridging empirical findings with re-al-world curatorial and architectural practice.

6.3. Limitations and Future Research

Despite the theoretical contributions and empirical insights of this study, several limitations warrant acknowledgment. Recognizing these constraints is essential to refining future methodologies and strengthening the theoretical–practical bridge.
  • Virtual Environment Constraints:
While controlled virtual scenes ensured experimental consistency, the absence of multisensory cues (e.g., ambient sound, tactile stimuli, or temperature) may have limited the ecological validity. This simplification could influence perceptual responses and decision-making behavior. Future research should incorporate immersive, multisensory VR platforms or hybrid in situ studies to better capture the cognitive and affective dynamics outlined in Bitgood’s attention–value model.
  • Sample Size and Representativeness:
The relatively small and homogeneous sample constrains statistical inference and increases the susceptibility to model instability. Limited demographic diversity restricts the ability to detect subgroup-specific behavioral variations. The observed high R2 values suggest potential overfitting, mitigated in part by cross-validation (MSE = 0.143). Expanding the sample size and diversity in future studies will improve generalizability and allow comparative testing across cultural and demographic groups, addressing gaps highlighted in prior spatial-behavior research.
  • Omission of Individual-Level Control Variables:
The current model focused on spatial–perceptual variables (e.g., enclosure, scale, directionality) while omitting user-level attributes such as age, gender, cultural background, and architectural familiarity. These factors may influence attention and engagement, as suggested in earlier studies on visitor heterogeneity. Incorporating control variables into future research will allow for subgroup-specific behavioral models and more personalized design implications.
  • Mixed-Methods Integration Challenges:
Although both qualitative and quantitative data were collected, their integration lacked a formal weighting framework. This may have constrained the interpretive synergy between spatial metrics, physiological data, and subjective evaluations. Future research should develop advanced multimodal integration methods—such as Bayesian hierarchical modeling or structural equation frameworks—to strengthen the theoretical grounding of spatial sequencing models and extend their application to real-world exhibitions.
Looking ahead, future studies should aim to: (i) enhance ecological validity through multisensory and field-based studies; (ii) broaden participant diversity to uncover latent visitor typologies; (iii) integrate individual-level variables to deepen explanatory power; and (iv) refine cross-modal data fusion techniques to improve methodological robustness. Beyond these methodological improvements, future research should explicitly test how the spatial categories (Threshold, Transitional, Narrative Focus, Closure) operate across different cultural contexts and exhibition types, thereby validating and extending the theoretical contributions of this study. More broadly, these findings extend prior scholarship on spatial sequencing and visitor engagement by moving beyond static evaluations toward a dynamic, behavior-driven model. They also complement VR-based exhibition studies by demonstrating that virtual simulations, when systematically linked to cognitive behavioral theory, can generate insights with direct applicability to real-world exhibition planning.

Author Contributions

Conceptualization, X.C., W.P. and J.C.; methodology, X.C. and J.C.; software, X.C. and G.F.; validation, X.C. and J.C.; formal analysis, X.C.; investigation, X.C., J.C. and G.F.; resources, Z.L.; data curation, X.C. and G.F.; writing—original draft preparation, X.C. and J.C.; writing—review and editing, X.C. and J.C.; visualization, X.C.; supervision, X.C. and W.P.; project administration, X.C. and W.P.; funding acquisition, W.P. All authors have read and agreed to the published version of the manuscript.

Funding

This research was supported by the Xi’an Social Science Planning Fund Project “Research on the Dynamic Inheritance and Innovative Utilization of Folk Cultural Spaces along the Qin ling Mountain Range” (Grant No. 24QL46), and the Fundamental Research Funds for the Central Universities Project “Research on Hierarchical Protection and Micro-Intervention Methods for Historic Districts Based on Cultural Power Stratification Analysis” (Grant No. 300102410101).

Data Availability Statement

The data presented in this study are available on request from the corresponding author.

Conflicts of Interest

The authors declare no conflicts of interest.

References

  1. Ministry of Culture and Tourism of the People’s Republic of China. 14th Five-Year Plan for Public Cultural Services; Ministry of Culture and Tourism: Beijing, China, 2021. [Google Scholar]
  2. UNESCO. Culture 2030 Indicators; UNESCO Publishing: Paris, France, 2019. [Google Scholar]
  3. National Bureau of Statistics of China. China Statistical Yearbook 2023; China Statistics Press: Beijing, China, 2023.
  4. Hillier, B.; Hanson, J. The Social Logic of Space; Cambridge University Press: Cambridge, UK, 1984. [Google Scholar]
  5. Psarra, S. Museum layout, movement and meaning. In Proceedings of the 1st International Space Syntax Symposium; University College London: London, UK, 2001. [Google Scholar]
  6. Bianconi, F.; Filippucci, M.; Felicini, N. Immersive Wayfinding: Virtual Reconstruction and Eye-Tracking for Orientation Studies inside Complex Architecture. Int. Arch. Photogramm. Remote Sens. Spatial Inf. Sci. 2019, XLII-2/W9, 143–150. [Google Scholar] [CrossRef]
  7. Tural, A.; Tural, E. Exploring Sense of Spaciousness in Interior Settings: Screen-Based Assessments with Eye Tracking, and Virtual Reality Evaluations. Front. Psychol. 2024, 15, 1473520. [Google Scholar] [CrossRef]
  8. Borghini, E.; Coscia, C.; Valentini, V.; Moccia, A.; Baglivo, G. Digital Twins and Enabling Technologies in Museums and Cultural Heritage. Sensors 2023, 23, 1583. [Google Scholar] [CrossRef]
  9. Guo, Y.; Liu, L.; Huang, W.; Shen, M.; Yi, X.; Zhang, J.; Lu, S. Extending X-reality technologies to digital twin in cultural heritage risk management: A comparative evaluation from the perspective of situational awareness. Herit. Sci. 2024, 12, 245. [Google Scholar] [CrossRef]
  10. Scaggion, C.; Castelli, S.; Usai, D.; Artioli, G. Cultural Heritage Digital Twin: Modeling and Representing Visual and Intangible Aspects via Knowledge Representation. Soft Comput. 2024, 28, 13421–13438. [Google Scholar]
  11. Shi, W.; Mesmoudi, S.; Riveiro, M. Cognitive Insights into Museum Engagement: A Mobile Eye-Tracking Study. Electronics 2025, 14, 2208. [Google Scholar] [CrossRef]
  12. Lu, S.E.; Moyle, B.; Reid, S.; Yang, E.; Liu, B. Technology and Museum Visitor Experiences: A Four-Stage Model of Evolution. Inf. Technol. Tour. 2023, 25, 151–174. [Google Scholar] [CrossRef]
  13. Medaković, J.; Atanacković Jeličić, J.; Ecet, D.; Nedučin, D.; Krklješ, M. The Interplay between Spatial Layout and Visitor Paths in Modern Museum Architecture. Buildings 2024, 14, 2147. [Google Scholar] [CrossRef]
  14. Bitgood, S. An Attention–Value Model of Museum Visitors. Visit. Stud. Today 2002, 5, 20–24. [Google Scholar]
  15. Popelka, S.; Vyslouzil, J. Understanding Visitor Behavior in Geographic Exhibit with Eye-Tracking. In Proceedings of the 2025 Symposium on Eye Tracking Research and Applications (ETRA ‘25), Tokyo, Japan, 26–29 May 2025; ACM: New York, NY, USA, 2025; p. 87. [Google Scholar]
  16. Raptis, G.E. Exploring Cognitive Variability in Interactive Museum Games. Heritage 2025, 8, 267. [Google Scholar] [CrossRef]
  17. Liu, Q.; Sutunyarak, C. The Impact of Immersive Technology in Museums on Visitors’ Behavioral Intention. Sustainability 2024, 16, 9714. [Google Scholar] [CrossRef]
  18. Serrell, B. Exhibit Labels: An Interpretive Approach, 2nd ed.; Rowman & Littlefield: Lanham, MD, USA, 2015. [Google Scholar]
  19. van Maanen, L.; Janssen, C.; van Rijn, H. Personalization of a Virtual Museum Tour Using Eye-Gaze. In Proceedings of the 28th Annual Conference of the Cognitive Science Society; Sun, R., Miyake, N., Eds.; Cognitive Science Society: Vancouver, BC, Canada, 2006; pp. 2620–2625. [Google Scholar]
  20. Gong, Z.; Wang, R.; Xia, G. Augmented Reality (AR) as a Tool for Engaging Museum Experience: A Case Study on Chinese Art Pieces. Digital 2022, 2, 33–45. [Google Scholar] [CrossRef]
  21. Carrozzino, M.; Bergamasco, M. Beyond Virtual Museums: Experiencing Immersive Virtual Reality in Real Museums. J. Cult. Herit. 2010, 11, 452–458. [Google Scholar] [CrossRef]
  22. Charitonidou, M. Simultaneously Space and Event: Bernard Tschumi’s Conception of Architecture. Arena J. Archit. Res. 2020, 5, 5. [Google Scholar] [CrossRef]
  23. Rendell, J. May mo(u)rn: Transitional spaces in architecture and psychoanalysis—A site-writing. J. Archit. 2019, 24, 223–286. [Google Scholar] [CrossRef]
  24. De Bleeckere, S.; Gerards, S. Narrative Architecture: A Designer’s Story; Routledge: London, UK, 2017. [Google Scholar]
  25. Rainoldi, M.; Yu, C.-E.; Neuhofer, B. The Museum Learning Experience through the Visitors’ Eyes: An Eye-Tracking Exploration of the Physical Context. Front. Psychol. 2020, 11, 2043. [Google Scholar]
  26. Tao, H.; Wen, Y.; Liu, M.; Wu, Y. Industrial Heritage Protection from the Perspective of Spatial Narrative: A Case Study of Shougang Park. Land 2025, 14, 1105. [Google Scholar] [CrossRef]
  27. Wang, S. From Locality to Architectural Semantics. Architects 2014, 6, 4–7. (In Chinese) [Google Scholar]
  28. Bo, L.; Abdul Rani, M.F. The Value of Current Sense of Place in Architectural Heritage Studies: A Systematic Review. Buildings 2025, 15, 903. [Google Scholar] [CrossRef]
  29. Liang, Z.; Várady, G.; Zagorácz, M.B. Application of Space Syntax in the Renewal of Industrial Area Design: Case Study of Baosteel Zhanjiang Steel Co. Ltd. Pollack Period. 2022, 17, 13–27. [Google Scholar]
  30. Marín-Morales, J.; Higuera-Trujillo, J.L.; Greco, A.; Guixeres, J.; Llinares, C.; Gentili, C.; Botella, C.; Alcañiz, M. Real vs. Immersive-Virtual Emotional Experience: Analysis of Psycho-Physiological Patterns in a Free Exploration of an Art Museum. PLoS ONE 2019, 14, e0223881. [Google Scholar] [CrossRef]
  31. Davis, R.A. The Feasibility of Using Virtual Reality and Eye Tracking in Research With Older Adults With and Without Alzheimer’s Disease. Front. Aging Neurosci. 2021, 13, 607219. [Google Scholar] [CrossRef]
  32. Grootendorst, M. BERTopic: Neural Topic Modeling with Class-Based TF-IDF. arXiv 2022, arXiv:2203.05794. [Google Scholar] [CrossRef]
  33. Banaei, M.; Hatami, J.; Yazdanfar, S.-A.; Gramann, K. Behavioral, physiological, and psychological responses to architectural interiors. Environ. Behav. 2017, 49, 197–225. [Google Scholar]
  34. O’Neill, M.J. Effects of signage and floor plan configuration on wayfinding accuracy. Environ. Behav. 1991, 23, 553–574. [Google Scholar] [CrossRef]
  35. Ren, J.; Wang, Y.; Liu, Q.; Liu, Y. Numerical Study of Three Ventilation Strategies in a prefabricated COVID-19 inpatient ward. Build. Environ. 2021, 188, 107467. [Google Scholar] [CrossRef]
  36. Han, S.; Song, D.; Xu, L.; Ye, Y.; Yan, S.; Shi, F.; Zhang, Y.; Liu, X.; Du, H. Behaviour in public open spaces: A systematic review of studies with quantitative research methods. Build. Environ. 2022, 223, 109444. [Google Scholar] [CrossRef]
  37. Hou, N.; Nishina, D.; Sugita, S.; Jiang, R.; Kindaichi, S.; Oishi, H.; Shimizu, A. Virtual reality space in architectural design education: Learning effect of scale feeling. Build. Environ. 2024, 248, 111060. [Google Scholar] [CrossRef]
  38. Ewing, R.; Handy, S. Measuring the Unmeasurable: Urban Design Qualities Related to Walkability. J. Urban Des. 2009, 14, 65–84. [Google Scholar] [CrossRef]
  39. Benedikt, M.L. To Take Hold of Space: Isovists and Isovist Fields. Environ. Plan. B Plan. Des. 1979, 6, 47–65. [Google Scholar] [CrossRef]
  40. Meyers-Levy, J.; Zhu, R. Influence of Ceiling Height: The Effect of Priming on the Type of Processing That People Use. J. Consum. Res. 2007, 34, 174–186. [Google Scholar] [CrossRef]
  41. Flynn, J.E.; Spencer, T.J.; Martyniuk, O.; Hendrick, C. Interim Study of Procedures for Investigating the Effect of Light on Impression and Behavior. J. Illum. Eng. Soc. 1973, 3, 87–94. [Google Scholar] [CrossRef]
  42. Li, Z.; Wang, Y.; Yu, Y. The Characteristics of Visitor Behavior and Driving Factors in Urban Mountain Parks: A Case Study of Fuzhou, China. Land 2022, 11, 835. [Google Scholar]
  43. Han, Y.; Zhang, Y.; Zhang, Y.; Chen, J. Linking the Built Environment to Pedestrian Movement: A Systematic Review. Cities 2022, 131, 103921. [Google Scholar]
  44. Gehl, J. Life Between Buildings: Using Public Space; Island Press: Washington, DC, USA, 2011. [Google Scholar]
  45. Wiener, J.M.; Kranjec, J.; Zancanaro, A.; Hölscher, C. Visual Environment and Navigational Uncertainty: A Cognitive Framework. Nat. Commun. 2024, 15, 5631. [Google Scholar]
  46. Tang, Y.; Guo, F.; Liu, L.; Jiang, X. Eye Tracking in Environmental Psychology: A Review of Methods and Applications. J. Environ. Psychol. 2023, 86, 102026. [Google Scholar]
  47. Kaplan, R.; Kaplan, S. The Experience of Nature: A Psychological Perspective; Cambridge University Press: Cambridge, UK, 1989. [Google Scholar]
  48. Ho, M.-H.R.; Au, W.T. Scale Development for Environmental Perception of Public Space. Front. Psychol. 2020, 11, 596790. [Google Scholar] [CrossRef] [PubMed]
  49. Zou, Z.; Ergan, S. Evaluating the effectiveness of biometric sensors and their signal features for classifying human experience in virtual environments. Adv. Eng. Inform. 2021, 49, 101358. [Google Scholar] [CrossRef]
  50. Ktistakis, E.; Skaramagkas, V.; Manousos, D.; Tachos, N.S.; Tripoliti, E.; Fotiadis, D.I.; Tsiknakis, M. COLET: A dataset for COgnitive workLoad estimation based on eye-tracking. Comput. Methods Programs Biomed. 2022, 224, 106989. [Google Scholar] [CrossRef]
  51. Cho, Y. Rethinking eye-blink: Assessing task difficulty through physiological representation of spontaneous blinking. In Proceedings of the 2021 CHI Conference on Human Factors in Computing Systems, Virtual, 8–13 May 2021; pp. 1–12. [Google Scholar]
  52. Tanasković, I.; Miljković, N.; Stojmenova Pečečnik, K.; Sodnik, J. Saccade Identification During Driving Simulation from Eye Tracker Data with Low-Sampling Frequency. In Conference on Information Technology and Its Applications; Springer: Cham, Switzerland, 2023; pp. 30–39. [Google Scholar]
  53. Ross, S.R.; Melber, L.M.; Gillespie, K.L.; Lukas, K.E. The Impact of a Modern, Naturalistic Exhibit Design on Visitor Behavior: A Cross-Facility Comparison. Visit. Stud. 2012, 15, 3–15. [Google Scholar] [CrossRef]
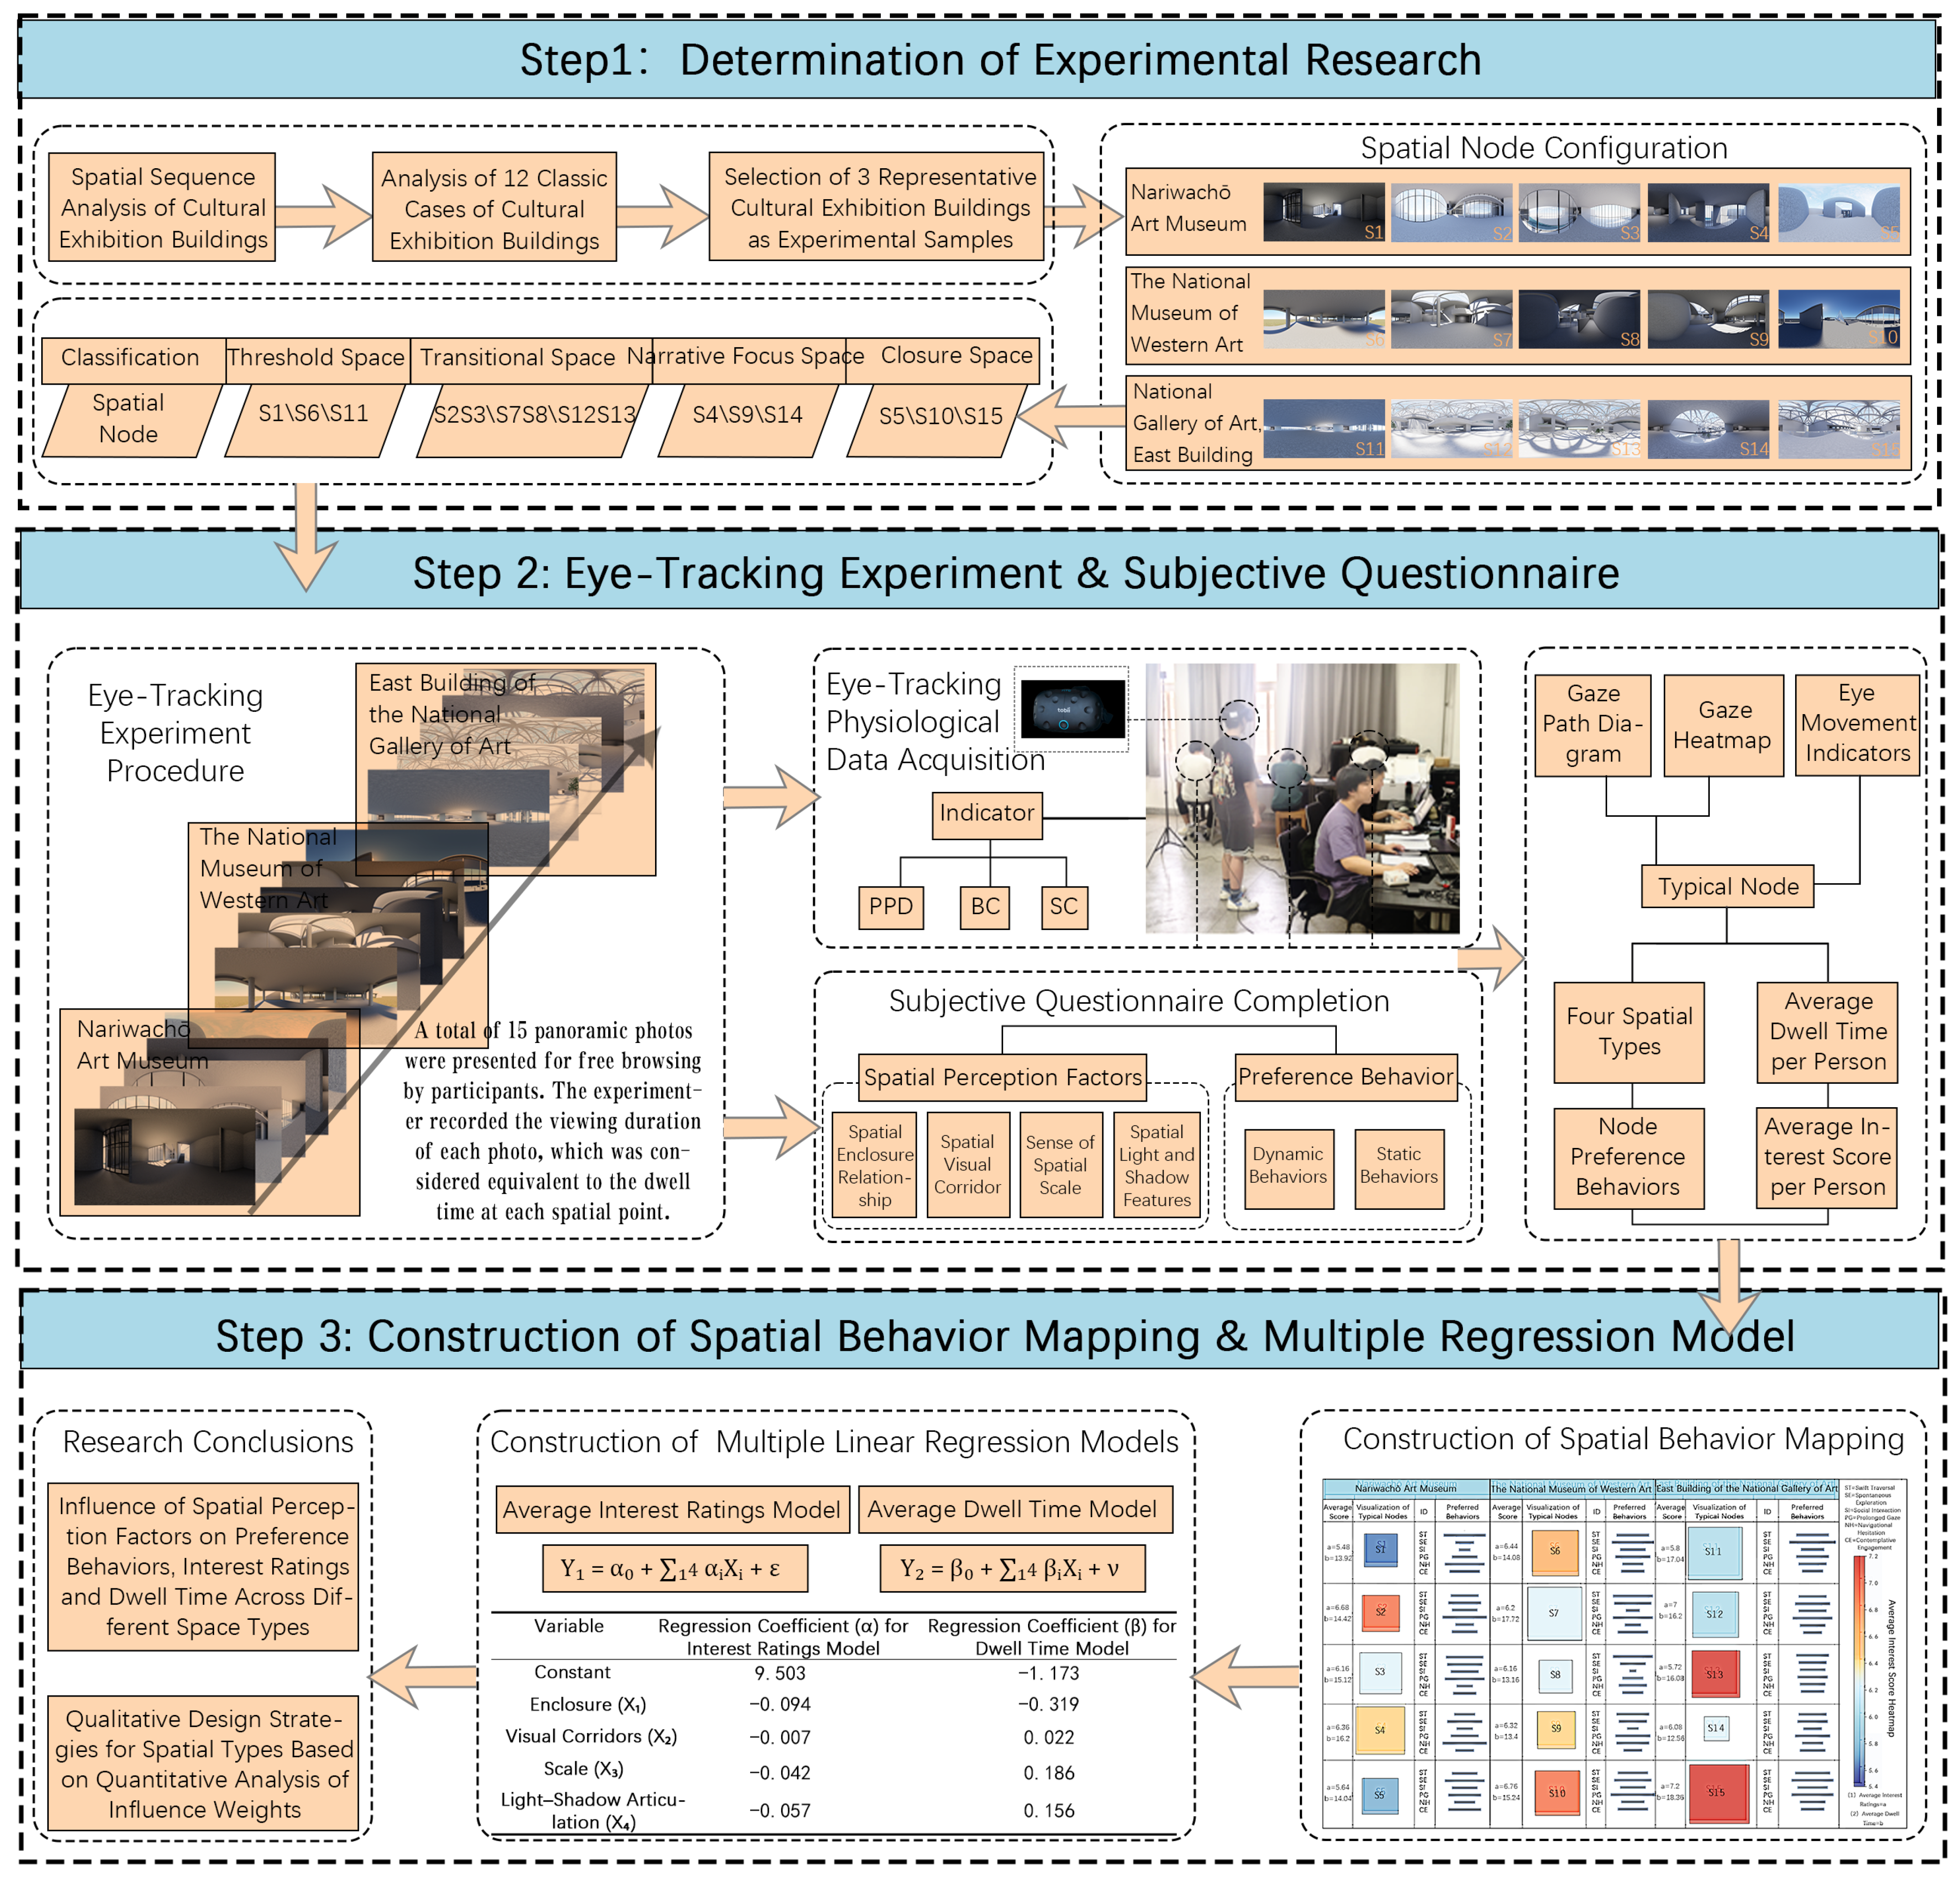
Figure 1. Research framework.
Buildings 15 03049 g001
Figure 2. Spatial node configuration through panoramic views.
Buildings 15 03049 g002
Figure 3. Heatmap and scan-path analysis.
Buildings 15 03049 g003
Figure 4. Matrix relationship among interest ratings, dwell time, and spatial nodes.
Buildings 15 03049 g004
Figure 5. Spatial–behavioral mapping.
Buildings 15 03049 g005
Figure 6. Regression analysis of spatial factors with average interest ratings and average dwell time.
Buildings 15 03049 g006
Figure 7. Combined diagnostic plots for the average interest ratings model and the average dwell time model.
Buildings 15 03049 g007
Table 1. Comparative overview of methods for multi-source perceptual data in exhibition research.
Method CategoryRepresentative StudiesApplicable ScenariosLimitations
Space syntax analysisLiang et al. [29]Macro-level prediction of movement density and clusteringLimited sensitivity to local/perceptual variation; ignores individual differences
Mobile/VR eye trackingShi et al. [11]; Davis [31]Sequential gaze mapping; feasibility across cognitive profilesEquipment-intensive; small n; ecological validity concerns
Biometric measures in VRMarín-Morales et al. [30]Emotional load/arousal during immersive navigationNoise-prone; influenced by lab settings
Semantic/UGC topic modelingGrootendorst [32]Large-scale perception themes from textsDependent on corpus quality; interpretability constraints
Regression/integrated modelsBanaei et al. [33]; O’Neill [34]Predicting behavior from spatial attributes; wayfinding effects of plan/signageRisk of overfitting; limited generalizability without multi-site validation
Table 2. Typological framework of exhibition spaces derived from the attention–value model.
Space TypeScale/Typical LocationScope of ApplicationPerceptual RoleBehavioral Role
Threshold SpaceEntrance zones, vestibulesInitial orientation, transition from outside to insideStimulates curiosity, provides first cuesTriggers exploratory behavior, rapid scanning
Transitional SpaceCorridors, connectorsLinking functional or thematic sectionsMaintains continuity, reduces cognitive loadFacilitates navigation, encourages forward flow
Narrative Focus SpaceGalleries, exhibition hallsMain thematic or interpretive nodesConcentrates attention, enhances cognitive depthSupports prolonged engagement, decision making
Closure SpaceTermination areas, exitsSummarizing or contemplative sectionsProvides emotional resolution, reinforces memoryEncourages reflection, extended dwell or pause
Table 3. Variable indicators and definitions used in the spatial–behavioral perception questionnaire.
DomainIndicatorDefinitionSource
Spatial perception factorSpatial EnclosureDegree of boundary closure (open, semi-enclosed, enclosed), shaping perceived openness, containment, and affect.[38] Ewing and Handy (2009)
Visual CorridorsPresence and strength of sight-line axes guiding attention, perspective, and route choice within the scene.[39] Benedikt (1979)
Spatial ScalePerceived size and proportion (large/medium/small) influencing intimacy, spaciousness, and sense of belonging.[40] Meyers-Levy and Zhu (2007)
Light–Shadow ArticulationPattern and contrast of illumination (e.g., dynamic, diffuse, high-contrast) modulating salience and mood.[41] Flynn et al. (1973)
Behavioral response typeSwift TraversalRapid passage through the space with minimal pausing or inspection.[42] Li and [43] Han et al. (2022)
Social InteractionConversational or group-oriented activity occurring within the space.[44] Gehl (2011)
Spontaneous ExplorationUnscripted movement to inspect features or areas of interest.[39] Benedikt (1979)
Navigational HesitationPauses and uncertainty when selecting direction or interpreting layout.[45] Wiener et al. (2024)
Prolonged GazeSustained visual attention to a focal object, exhibit, or vista.[46] Tang et al. (2023)
Contemplative EngagementReflective, stationary immersion associated with introspective experience.[47] Kaplan and Kaplan (1989)
Table 4. Relationship between interest level and scoring in the subjective questionnaire.
Interest LevelNot InterestedUnnoticedNeutralSomewhat InterestedHighly Interested
1−10123
Table 5. Classification of twelve representative cultural exhibition buildings.
Spatial Node TypeThreshold SpaceTransitional SpaceNarrative Focus SpaceClosure Space
Nariwachō Art MuseumEntrance HallAtrium, Vertical StaircaseTransitional PlatformViewing Terrace
National Museum of Western Art (Tokyo)Entrance HallAtrium, Zigzag StaircaseTransitional PlatformViewing Terrace
National Gallery of Art, East Building Entrance HallAtrium, Vertical StaircaseTransitional PlatformViewing Terrace
Wen Exhibition Seaside PavilionEntrance HallAtrium, Vertical StaircaseTransitional PlatformUpper-Level Platform
Chengdu Cultural Exhibition HallEntrance HallAtriumLinear Exhibition HallViewing Terrace
Guangzhou Contemporary Exhibition HallMain GateAtriumZigzag StaircaseTop Exhibition Hall
Mediterranean Museum of Modern ArtUnderground PassageAtriumLinear Exhibition HallUpper Exhibition Hall
MAXXI National Museum of 21st Century ArtsUpper-Level Entrance HallDouble-Layered PlatformSpiral Staircase/ConnectorTop Exhibition Hall
Museo Experimental El EcoMain Entrance HallSkylight CourtCorridor/Entrance HallTop Exhibition Hall
Muzeum SuschUnderground PassageCooling SpaceCorridor/Colonnade SpaceExhibition Hall
Oscar Niemeyer MuseumUnderground PassageHall under Water PoolGlass Corridor/StaircaseTop Exhibition Hall
Kunsthaus BregenzEntrance HallAtrium Exhibition HallCircular Path/StaircaseTop Exhibition Hall
Table 6. Eye-tracking physiological metrics.
IndicatorAbbreviationDescriptionUnit
Pupil DiameterPPDReflects cognitive load and psychological arousal level [49]mm
Blink CountBCIndicates visual fatigue or attention state [50]count
Saccade CountSCRepresents the level of visual search activity and information processing density [51]count
Table 7. Spatial perception factors, visual behavior characteristics, and eye-tracking physiological metrics across spatial sequences.
BuildingStageSpatial NodeSpatial Perception FeaturesVisual Characteristics (Gaze Path and Heatmap)Physiological Indicators (PPD/BC/SC)
Nariwachō Art MuseumThreshold SpaceS1Clear visual corridors, distinct light–shadow articulationFocused gaze, coherent pathLow PPD, Moderate BC, Low SC
Transitional SpaceS2, S3Low enclosure, unclear scaleDispersed gaze, frequent saccadesModerate PPD, Moderate BC, High SC
Narrative Focus SpaceS4Distinct light–shadow articulationNew gaze cluster formedModerate PPD, Moderate BC, Medium SC
Closure SpaceS5Low enclosure, unclear scaleDispersed gaze, divergent pathLow PPD, Moderate BC, Low SC
National Museum of Western ArtThreshold SpaceS6Clear visual corridors, distinct light–shadow articulationFocused gaze, concise pathLow PPD, Moderate BC, Low SC
Transitional SpaceS7, S8Low enclosure, moderate scaleRelatively focused gaze, active pathModerate PPD, Slightly High BC, Medium SC
Narrative Focus SpaceS9Strong light–shadow articulation, clear visual corridorsFocused gaze, new focus area formedHigh PPD, Moderate BC, Medium SC
Closure SpaceS10Low enclosure, unclear scaleDispersed gaze, divergent pathHigh PPD, Moderate BC, Low SC
National Gallery of Art, East BuildingThreshold SpaceS11Moderate visual corridors, distinct light–shadow articulationFocused gaze, coherent pathMedium PPD, Moderate BC, Low SC
Transitional SpaceS12, S13Low enclosure, unclear scaleDispersed gaze, frequent saccadesModerate PPD, Slightly High BC, High SC
Narrative Focus SpaceS14Distinct light–shadow articulationFocused gaze, locally coherent pathHigh PPD, Moderate BC, Medium SC
Closure SpaceS15Low enclosure, unclear scaleDispersed gaze, divergent pathHigh PPD, Moderate BC, High SC
Table 8. Regression coefficients of variables in the average interest ratings model and average dwell time model.
VariableRegression Coefficient (α) for Interest ModelRegression Coefficient (β) for Dwell Time Model
Constant9.503−1.173
Enclosure (X1)−0.094−0.319
Visual corridors (X2)−0.0070.022
Spatial Scale (X3)0.0420.186
Light–Shadow Articulation (X4)−0.0570.156
Disclaimer/Publisher’s Note: The statements, opinions and data contained in all publications are solely those of the individual author(s) and contributor(s) and not of MDPI and/or the editor(s). MDPI and/or the editor(s) disclaim responsibility for any injury to people or property resulting from any ideas, methods, instructions or products referred to in the content.