Article

Tilt Monitoring of Super High-Rise Industrial Heritage Chimneys Based on LiDAR Point Clouds

School of Geomatics and Urban Spatial Informatics, Beijing University of Civil Engineering and Architecture, Beijing 102616, China
*
Authors to whom correspondence should be addressed.
Buildings 2025, 15(17), 3046; https://doi.org/10.3390/buildings15173046
Submission received: 8 July 2025 / Revised: 13 August 2025 / Accepted: 24 August 2025 / Published: 26 August 2025

Abstract

The structural safety monitoring of industrial heritage is of great significance for global urban renewal and the preservation of cultural heritage. However, traditional tilt monitoring methods suffer from limited accuracy, low efficiency, poor global perception, and a lack of intelligence, making them inadequate for meeting the tilt monitoring requirements of super-high-rise industrial heritage chimneys. To address these issues, this study proposes a tilt monitoring method for super-high-rise industrial heritage chimneys based on LiDAR point clouds. Firstly, LiDAR point cloud data were acquired using a ground-based LiDAR measurement system. This system captures high-density point clouds and precise spatial attitude data, synchronizes multi-source timestamps, and transmits data remotely in real time via 5G, where a data preprocessing program generates valid high-precision point cloud data. Secondly, multiple cross-section slicing segmentation strategies are designed, and an automated tilt monitoring algorithm framework with adaptive slicing and collaborative optimization is constructed. This algorithm framework can adaptively extract slice contours and fit the central axes. By integrating adaptive slicing, residual feedback adjustment, and dynamic weight updating mechanisms, the intelligent extraction of the unit direction vector of the central axis is enabled. Finally, the unit direction vector is operated with the x- and z-axes through vector calculations to obtain the tilt-azimuth, tilt-angle, verticality, and verticality deviation of the central axis, followed by an accuracy evaluation. On-site experimental validation was conducted on a super-high-rise industrial heritage chimney. The results show that, compared with the results from the traditional method, the relative errors of the tilt angle, verticality, and verticality deviation of the industrial heritage chimney obtained by the proposed method are only 9.45%, while the relative error of the corresponding tilt-azimuth is only 0.004%. The proposed method enables high-precision, non-contact, and globally perceptive tilt monitoring of super-high-rise industrial heritage chimneys, providing a feasible technical approach for structural safety assessment and preservation.

1. Introduction

Industrial heritage is an important physical embodiment of urban development history, carrying unique historical memories and cultural values [1]. With the accelerating pace of urban renewal, preserving the original appearance of industrial heritage while ensuring its structural safety has become a focal issue of common concern across multiple fields, including urban planning, architectural conservation, and structural engineering [2,3]. As an important component of industrial heritage, super high-rise industrial heritage chimneys are highly susceptible to geometric deformation due to their large size, long service life, and vulnerability to wind loads [4,5,6]. This deformation mainly manifests as displacement and tilt of the central axis. If a super high-rise industrial heritage chimney is not promptly monitored and addressed after exhibiting a tilt, it may result in severe structural damage or even collapse, potentially leading to serious safety incidents [7,8]. Traditional tilt monitoring methods, such as theodolites, plumb lines, and tape measurements, have become inadequate for meeting the practical demands of tilt monitoring for super-high-rise industrial heritage chimneys due to their limited accuracy, low efficiency, poor global perception, and lack of intelligence [9,10,11]. Therefore, the development of a tilt monitoring method for super-high-rise industrial heritage chimneys, which integrates modern sensing technologies and data processing methods to enable high-precision, non-contact, and globally perceptive tilt monitoring, is of great significance for structural safety assessment, risk warning, and life extension management of industrial heritage.
Currently, research on high-precision tilt monitoring mainly focuses on two aspects: first, the intelligence and integration of monitoring instruments [12,13,14], and second, the optimization of data processing algorithms [15,16,17]. The former aims to enhance the accuracy and automation level of data acquisition, while the latter focuses on rapidly extracting high-precision tilt information from complex observational data.
In terms of the intelligence and integration of monitoring instruments, both contact and non-contact types are included. For research on the intelligence and integration of contact monitoring instruments, Zhang G et al. [18] designed a real-time monitoring device for the tilt posture and foundation status of transmission towers based on inertial sensors. The device collects acceleration and angular velocity data using a triaxial inertial sensor and calculates the tilt angle using a complementary filtering algorithm. By applying a multi-sensor cooperative detection and correction method, the measured tilt angle had a relative error of as low as 1.03%. Zhou M et al. [19,20] developed a verticality detection system for construction tower cranes based on GNSS intelligent monitoring technology. By installing monitoring devices at the top of the tower and establishing a ground reference station, the system enables accurate monitoring of both lateral and full-circle verticality of the tower body. Experimental results show that the horizontal and elevation accuracies are better than 3 cm and 4 cm, respectively. Abbas S et al. [21] developed and validated a tree monitoring system that integrates smart sensing technologies with big data analytics. By combining a large-scale smart sensor network with GIS technology, the system enables continuous monitoring and modeling of urban tree tilt by deploying multiple smart sensing devices across both urban and rural areas of Hong Kong. Gao M et al. [22] utilized fiber optic sensing technology to install fiber Bragg grating biaxial tilt sensors at the tower top and at the mid-tower position two-thirds up from the ground on a 110 kV transmission line tower. By networking these sensors through OPGW cables, they achieved long-distance online monitoring and real-time analysis of the tower tilt angle and stress deformation. Choi S et al. [23] used GPS to measure the lateral displacement changes of a high-rise building before and after the installation of outrigger trusses, and verified the accuracy and feasibility of the GPS measurement system through a free vibration test of an experimental model, subsequently monitoring continuous lateral displacements in the high-rise building. Although the above studies have achieved good results in tilt monitoring of tall structures, they all belong to contact-based destructive monitoring and generally rely on discrete sensor deployment with stringent requirements on installation locations, making it difficult to achieve a global perception of the entire target. In recent years, the development of non-contact monitoring instruments has provided non-destructive means for tilt monitoring of high-rise structures. Zhang X et al. [24] proposed a transmission line tower tilt detection method based on BeiDou positioning signals and unmanned aerial vehicle (UAV) inspection images. This method obtains positional information using BeiDou antennas installed on towers, combines YOLOv4 to identify towers in images, and calculates the tilt angle through image processing. Experimental validation showed that after 100 training epochs, the network loss value decreased to 0.06, demonstrating the effectiveness of the proposed method in detecting the tower tilt status and determining the tilt angles. Siwiec J et al. [25] proposed a point cloud integration method combining terrestrial laser scanning (TLS) and structure from motion, achieving high-precision 3D modeling of reinforced concrete industrial chimneys, with a fitting deviation of only 8.15 mm for the integrated point cloud circle. Popović J et al. [26] utilized multi-temporal TLS data combined with 3D parametric modeling and standard deviation analysis to quantitatively reveal the long-term inclination evolution trend of cylindrical towers, with the standard deviation of the base center coordinates at 0.04 mm and the standard deviations of the shaft tilt azimuth and tilt angle at 13.6″ and 0.40″, respectively, demonstrating high-precision monitoring capability. Zrinjski M et al. [27] independently obtained point clouds using a total station and UAV photogrammetry, and established a reference model based on total station data for geometric analysis of industrial masonry chimneys. The UAV photogrammetry point cloud model achieved an accuracy of 25.5 mm, with an average axis fitting deviation ranging from 3.7 to 15.3 mm, effectively supporting the assessment of the inclination of the masonry structure. Pleterski Z et al. [28] employed RANSAC combined with least squares fitting to detect chimney non-verticality, achieving a coefficient of determination as high as 0.9795, indicating good fitting stability. Although the above studies achieved non-contact and non-destructive tilt monitoring, they primarily relied on post-processing of point cloud data and have yet to realize 5G remote real-time transmission of monitoring data, BeiDou/GNSS station-by-station positioning and registration, and the integration of ground-based LiDAR measurement systems combining BeiDou/GNSS positioning and 5G communication.
Regarding the optimization of data processing algorithms for rapidly extracting high-precision tilt information from complex contact-based observation data, Chang L et al. [29] proposed a BooBag method based on modified boosting and bagging. By generating multiple artificial labels, this method accurately identifies and distinguishes low-reliability data during tunnel construction, thereby enhancing the prediction accuracy of building tilt rates. Jiang T et al. [30] proposed and validated a Rotation Angle Approximation shape reconstruction method that integrates the inverse finite element method, isogeometric analysis, and differential geometry. This method constructs a least-squares error functional incorporating analytical curvature and sectional curvature to solve for the rotation angles of the tower axis, thereby capturing the torsional and tilt variations of wind turbine towers. Górski P [31] combined the Frequency Domain Decomposition and Enhanced Frequency Domain Decomposition algorithms to improve the accuracy of structural vibration parameter identification based on GPS dynamic displacement data, and validated the results through finite element analysis and the Random Decrement Method, analyzing the dynamic characteristics and displacement monitoring of a tall industrial chimney. Dawood A et al. [32] combined computational fluid dynamics to simulate wind load distribution under different wind speeds and performed a comparative analysis using the ASCE7-10 standard method. They also developed a 3D structural model based on finite element analysis to investigate the maximum deflection of chimneys under gravity and wind load. Cazzaniga N et al. [33] applied the discrete Fourier transform and least squares interpolation methods to perform frequency analysis on GPS-measured displacement data. Changes and trends in structural vibration modes were identified through time series statistical tests, enabling real-time monitoring and early warning of the chimney. Although the above studies have made significant progress in optimizing data processing algorithms, the quality of the acquired data is easily affected by the observation environment due to the limitations of collecting complex contact-based observation data. To rapidly extract high-precision tilt information from non-contact complex observation data, Cheng S et al. [34] and Ding K et al. [35] conducted multi-point measurements of target structures using a non-contact total station and analyzed the verticality of the targets with a robust least squares method, achieving high-precision detection of the tilt state of the structures. Bian F et al. [36] proposed a stereo vision-based health monitoring method for wind turbine towers. The method extracts the tower’s central axis based on structural information and employs the RANSAC algorithm to optimize axis fitting, enabling non-contact and long-distance monitoring of the tilt angle of the tower. Kurdi F et al. [37] improved the determination method of the rotational axis based on LiDAR data, automatically generated cross-sections, and filled point cloud gaps to build a matrix model of rotational buildings, with the minimum cell width and height of the model being 0.26 m and 0.01 m, respectively. Helming P et al. [38] proposed a two-dimensional dynamic deformation monitoring method for wind turbine towers based on a horizontally aligned ground-based laser scanner in line-scanning mode. This method determines the tower’s axial and lateral displacements by fitting the scanned point clouds using the least-squares method, enabling single-point position measurements at distances exceeding 150 m. Schneider [39] proposed a structural deformation monitoring method based on highly redundant unstructured laser-scanning point clouds. This method divides the 3D point cloud into several thin layers based on height and projects each layer onto a 2D plane. By fitting circular contours, the center coordinates are obtained, and then the center points at different height levels are connected to reconstruct the structural bending line, thereby enabling the measurement of bending deformation. Muszynski Z et al. [40] utilized TLS technology to acquire three-dimensional point cloud data of an industrial chimney and applied the least squares method to fit vertical cylinders to each cross section. The vertical deviation of the main axis of the chimney was determined by comparing the cylinder axis coordinates at different height levels with those at the base level. Although the above studies achieved non-contact monitoring and optimization of data processing algorithms, they did not evaluate the impact of different algorithm segmentation strategies on tilt monitoring results.
Given the advantages of LiDAR point cloud monitoring methods, including high precision, high efficiency, non-contact operation, and non-destructive inspection [41,42,43,44], the use of LiDAR for tilt monitoring of high-rise structures has become a research hotspot and an important technological support for structural safety assessment and maintenance [45,46]. Kaszowska O et al. [47] utilized ground-based 3D laser scanning technology to acquire point cloud data and construct a 3D model of a chimney. The center positions of cross-sections at different heights were analyzed to determine the magnitude and direction of the chimney’s deflection at various elevations, enabling monitoring and analysis of the chimney’s deformation. Głowacki T et al. [48] performed high-precision 3D measurements of the W-1 cooling tower using laser scanning technology. The deviations of the actual shape of the tower from the designed shape were calculated to assess the deformation of the cooling tower. Kregar K et al. [49] employed a ground-based laser scanner to collect point cloud data of the chimney surface. A cylindrical model was fitted using the least-squares method to calculate the inclination angle of the chimney’s central axis. Daliga K et al. [50] used a laser scanner to measure the local axis of a stainless steel chimney. The cross-sectional radius and center offset were calculated to evaluate the applicability of the method under high-reflectivity metal surface conditions. Although the above technical approaches have achieved certain practical applications in tilt monitoring of high-rise structures, they have not explored the collaborative optimization of adaptive slicing, residual feedback, and dynamic weight updating, or the intelligent extraction of the unit direction vector of the central axis.
To address the above issues, this study proposes a tilt monitoring method for super-high-rise industrial heritage chimneys based on LiDAR point clouds, which was validated through experimental field testing. The main contributions of this study are as follows: (1) Achieving non-contact and globally perceptive acquisition of point cloud data: a ground-based LiDAR measurement system integrating BeiDou/GNSS positioning and 5G communication [51] was employed to scan the super high-rise industrial heritage chimney. The system transmits data remotely and in real time to a remote terminal for data preprocessing, resulting in a high-precision surface point cloud model; (2) designing multiple cross-section slicing segmentation strategies: various cross-section slicing segmentation schemes are designed based on the structural characteristics of the industrial heritage chimney, and the effects of different strategies on the stability of tilt monitoring parameters are analyzed; (3) constructing an automated tilt monitoring algorithm framework with adaptive slicing and collaborative optimization: After inputting the sliced point cloud data into the framework, the algorithm can adaptively extract slice contours and fit the central axis based on the number of slices determined by different cross-section slicing segmentation strategies. Through the collaborative optimization of adaptive slicing, residual feedback, and dynamic weight updating, the framework enables the high-precision and intelligent extraction of tilt information for super-high-rise industrial heritage chimneys. (4) Field validation and performance evaluation: On-site tests are conducted on a super-high-rise industrial heritage chimney, a comparative analysis is performed with the traditional method, and the effectiveness and feasibility of the proposed method are verified, thereby demonstrating its scientific novelty.
The remainder of this paper is organized as follows. Section 2 introduces the detailed content of the tilt monitoring method for super-high-rise industrial heritage chimneys based on LiDAR point clouds. Section 3 describes the experimental scheme, data preprocessing, and design of the cross-section slicing segmentation strategies. Section 4 presents the results of tilt monitoring. Section 5 discusses the research findings and provides recommendations for segmentation strategies. Section 6 summarizes the conclusions of this study and provides an outlook on future research.

2. Methods

The concept of the tilt monitoring method for super-high-rise industrial heritage chimneys based on LiDAR point clouds is as follows:
Firstly, point cloud data acquisition and 3D reconstruction are performed. A ground-based LiDAR measurement system integrating BeiDou/GNSS positioning and 5G communication is deployed to collect raw point cloud data of the surface of the industrial heritage chimney. The 5G communication module transmits raw data from each station to a remote terminal in real time. Upon receiving the data from each station, the remote terminal employs a data preprocessing program [52] to perform point cloud registration between stations (coarse registration of the raw point cloud is first performed by sequentially superimposing the data from each station based on the station coordinates provided by BeiDou/GNSS positioning, followed by fine registration using the improved Iterative Closest Point (ICP) algorithm [53]), denoising, and redundancy removal. After these preprocessing steps, 3D reconstruction is performed to obtain valid high-precision point cloud data.
Secondly, the unit direction vector of the central axis is intelligently extracted. Multiple cross-section slicing segmentation strategies are designed, and an automated tilt monitoring algorithm framework with adaptive slicing and collaborative optimization is developed. The algorithm framework adaptively determines the number of slices and spatial coordinates of the point clouds within each slice based on the sliced point cloud data. The contour of each slice is fitted using the least-squares method based on the point cloud coordinates, the corresponding geometric center coordinates are extracted, and the extracted 2D geometric center coordinates are converted into 3D spatial coordinates to construct a set of 3D geometric center coordinates. The central axis is fitted using the Iteratively Reweighted Least Squares (IRLS) method, and its unit direction vector is intelligently extracted. Throughout the entire process, the algorithm framework achieves collaborative optimization through adaptive slicing, residual feedback, and dynamic weight updating, ensuring high precision and automation in tilt monitoring.
Finally, the tilt monitoring parameters are calculated, and the accuracy is evaluated. Vector operations are performed separately with the x- and z-axes in the station-center space coordinate system to obtain the tilt monitoring parameters, such as the tilt-azimuth, tilt-angle, verticality, and verticality deviation [54] of the central axis of the industrial heritage chimney and to carry out an accuracy assessment. The flowchart of the proposed method is shown in Figure 1.

2.1. Acquisition and 3D Reconstruction of Point Cloud Data

2.1.1. Acquisition of Raw Point Cloud Data

A ground-based LiDAR measurement system integrating Bei-Dou/GNSS positioning and 5G communication is deployed in a line-of-sight configuration to perform complete circumferential scanning of the surface of the industrial heritage chimney and acquire raw point cloud data. A 5G communication module is used to transmit the raw point cloud data from each station to a remote terminal in real time. The ground-based LiDAR measurement system integrates a LiDAR sensor, a BeiDou/GNSS receiver module, a high-precision motor, and a 5G communication module.

2.1.2. 3D Reconstruction of Point Cloud Data

Based on the station location information provided by the BeiDou/GNSS receiver module, the raw point cloud data from each station is coarsely registered at the remote terminal using a data preprocessing program. The coarse registration results are then refined using an improved ICP algorithm. Subsequently, the point cloud data is transformed from the polar coordinate system to the station-center space coordinate system, o-xyz, to obtain a complete high-precision 3D point cloud model. Finally, the 3D point cloud model undergoes preprocessing steps, such as denoising, redundancy removal, and segmentation, to obtain valid high-precision point cloud data within the station-center space coordinate system o-xyz. The point cloud data in the station-center space coordinate system o-xyz is expressed in Equation (1).
p = ( x , y , z ) = ( S cos ω cos α , S cos ω sin α , S sin ω ) ,
where p represents the point cloud data. S represents the measured distance from the LiDAR beam to the industrial heritage chimney surface. α represents the deflection angle of the LiDAR beam in the horizontal direction. ω represents the deflection angle of the LiDAR beam in the vertical direction.

2.2. Extraction of Slice Shape Contours and Geometric Center Coordinates

2.2.1. Cross-Section Slicing Segmentation of the Point Cloud

In the station-center space coordinate system o-xyz, the preprocessed point cloud model of the industrial heritage chimney surface is horizontally sliced along the z-axis at predefined height intervals to obtain the sliced point cloud data. Based on the sliced point cloud data, the number of slices and the spatial coordinates of the point clouds within each slice are adaptively determined. Each cross-section slice has a range of [ z j Δ h 2 , z j + Δ h 2 ] , where z j represents the height of the j cross-section slice, with j = 1 , 2 , , m . Here, m represents the total number of cross-section slices. Δ h represents the predefined thickness of the point cloud slice. The point cloud set contained within the j slice can be expressed as Equation (2).
P j = p i = ( x i , y i , z i ) z j Δ h 2 z i z j + Δ h 2 ,
where Pj represents the point cloud data set of the j slice. Pi represents the i 3D point cloud data within the slice, with i = 1 , 2 , , n j . n j denotes the number of point cloud data points contained within the j slice.

2.2.2. Projection of Point Cloud Data onto the Slice Plane

To simplify the contour fitting calculation for each slice, the 3D point cloud data Pi = (Xi, Yi, Zi) within each slice is projected onto the xy-plane. The resulting set of planar projected point cloud data is represented by Equation (3).
L j = l i = x i , y i l i P j ,
where L j denotes the set of planar projected point cloud data for the j slice. l i represents the i planar point cloud within the projected slice.

2.2.3. Extraction of Slice Shape Contours

For the multiple cross-section slicing segmentation strategies, the least squares method [55] is employed to fit the planar projected point cloud data set L j to extract the slice shape contours. Depending on the industrial heritage chimney’s surface geometry, the slice shape contours correspond to specific types. This study takes the circular slice contour as an example and presents the specific fitting and extraction steps as follows:
First, the implicit equation of a circle in two dimensions is defined as Equation (4).
( x a ) 2 + ( y b ) 2 = R 2 ,
where ( x , y ) represents any point on the circle. ( a , b ) represents the coordinates of the circular center. R represents the radius of the circle.
To facilitate linear modeling and solution, Equation (4) is expanded and rearranged into the standard quadratic form, as shown in Equation (5).
x 2 + y 2 + D x + E y + F = 0 ,
where D = 2 a , E = 2 b , F = a 2 + b 2 R 2 .
Next, a least squares system of equations is constructed by substituting the coordinates of the n j projected points into Equation (5), forming a linear system. Its matrix form is shown in Equation (6).
A θ = g ,
where A = x 1 y 1 1 x n j y n j 1 , θ = D , E , F T , g = x 1 2 + y 1 2 , , x n j 2 + y n j 2 T .
To obtain parameter estimates that minimize the sum of squared residuals, the standard least squares method is employed, and the optimal solution is given in Equation (7).
θ = D , E , F T = ( A T A ) 1 A T g ,
Finally, based on the obtained least squares solution θ , the corresponding planar circular center coordinates and radius are derived in reverse, as shown in Equation (8).
( a , b ) = ( D 2 , E 2 ) , R = a 2 + b 2 F ,

2.2.4. Calculation of the Geometric Center Coordinates of the Contour

By combining the height interval [ z j Δ h 2 , z j + Δ h 2 ] of the j slice, the 2D circular center coordinates ( a j , b j ) are restored to the 3D geometric center coordinates o j .The midpoint height z j is taken as the z-coordinate of the 3D contour’s geometric center. Therefore, the geometric center coordinates can be expressed as Equation (9).
Oj = (aj, bj, zj),
According to Equation (9), the m cross-section slices yield m shape contours, and the corresponding m geometric center coordinates can be represented as the set in Equation (10).
O = o 1 , , o j , , o m = a 1 , b 1 , z 1 , , a j , b j , z j , , a m , b m , z m ,

2.3. Extraction of the Unit Direction Vector of the Central Axis

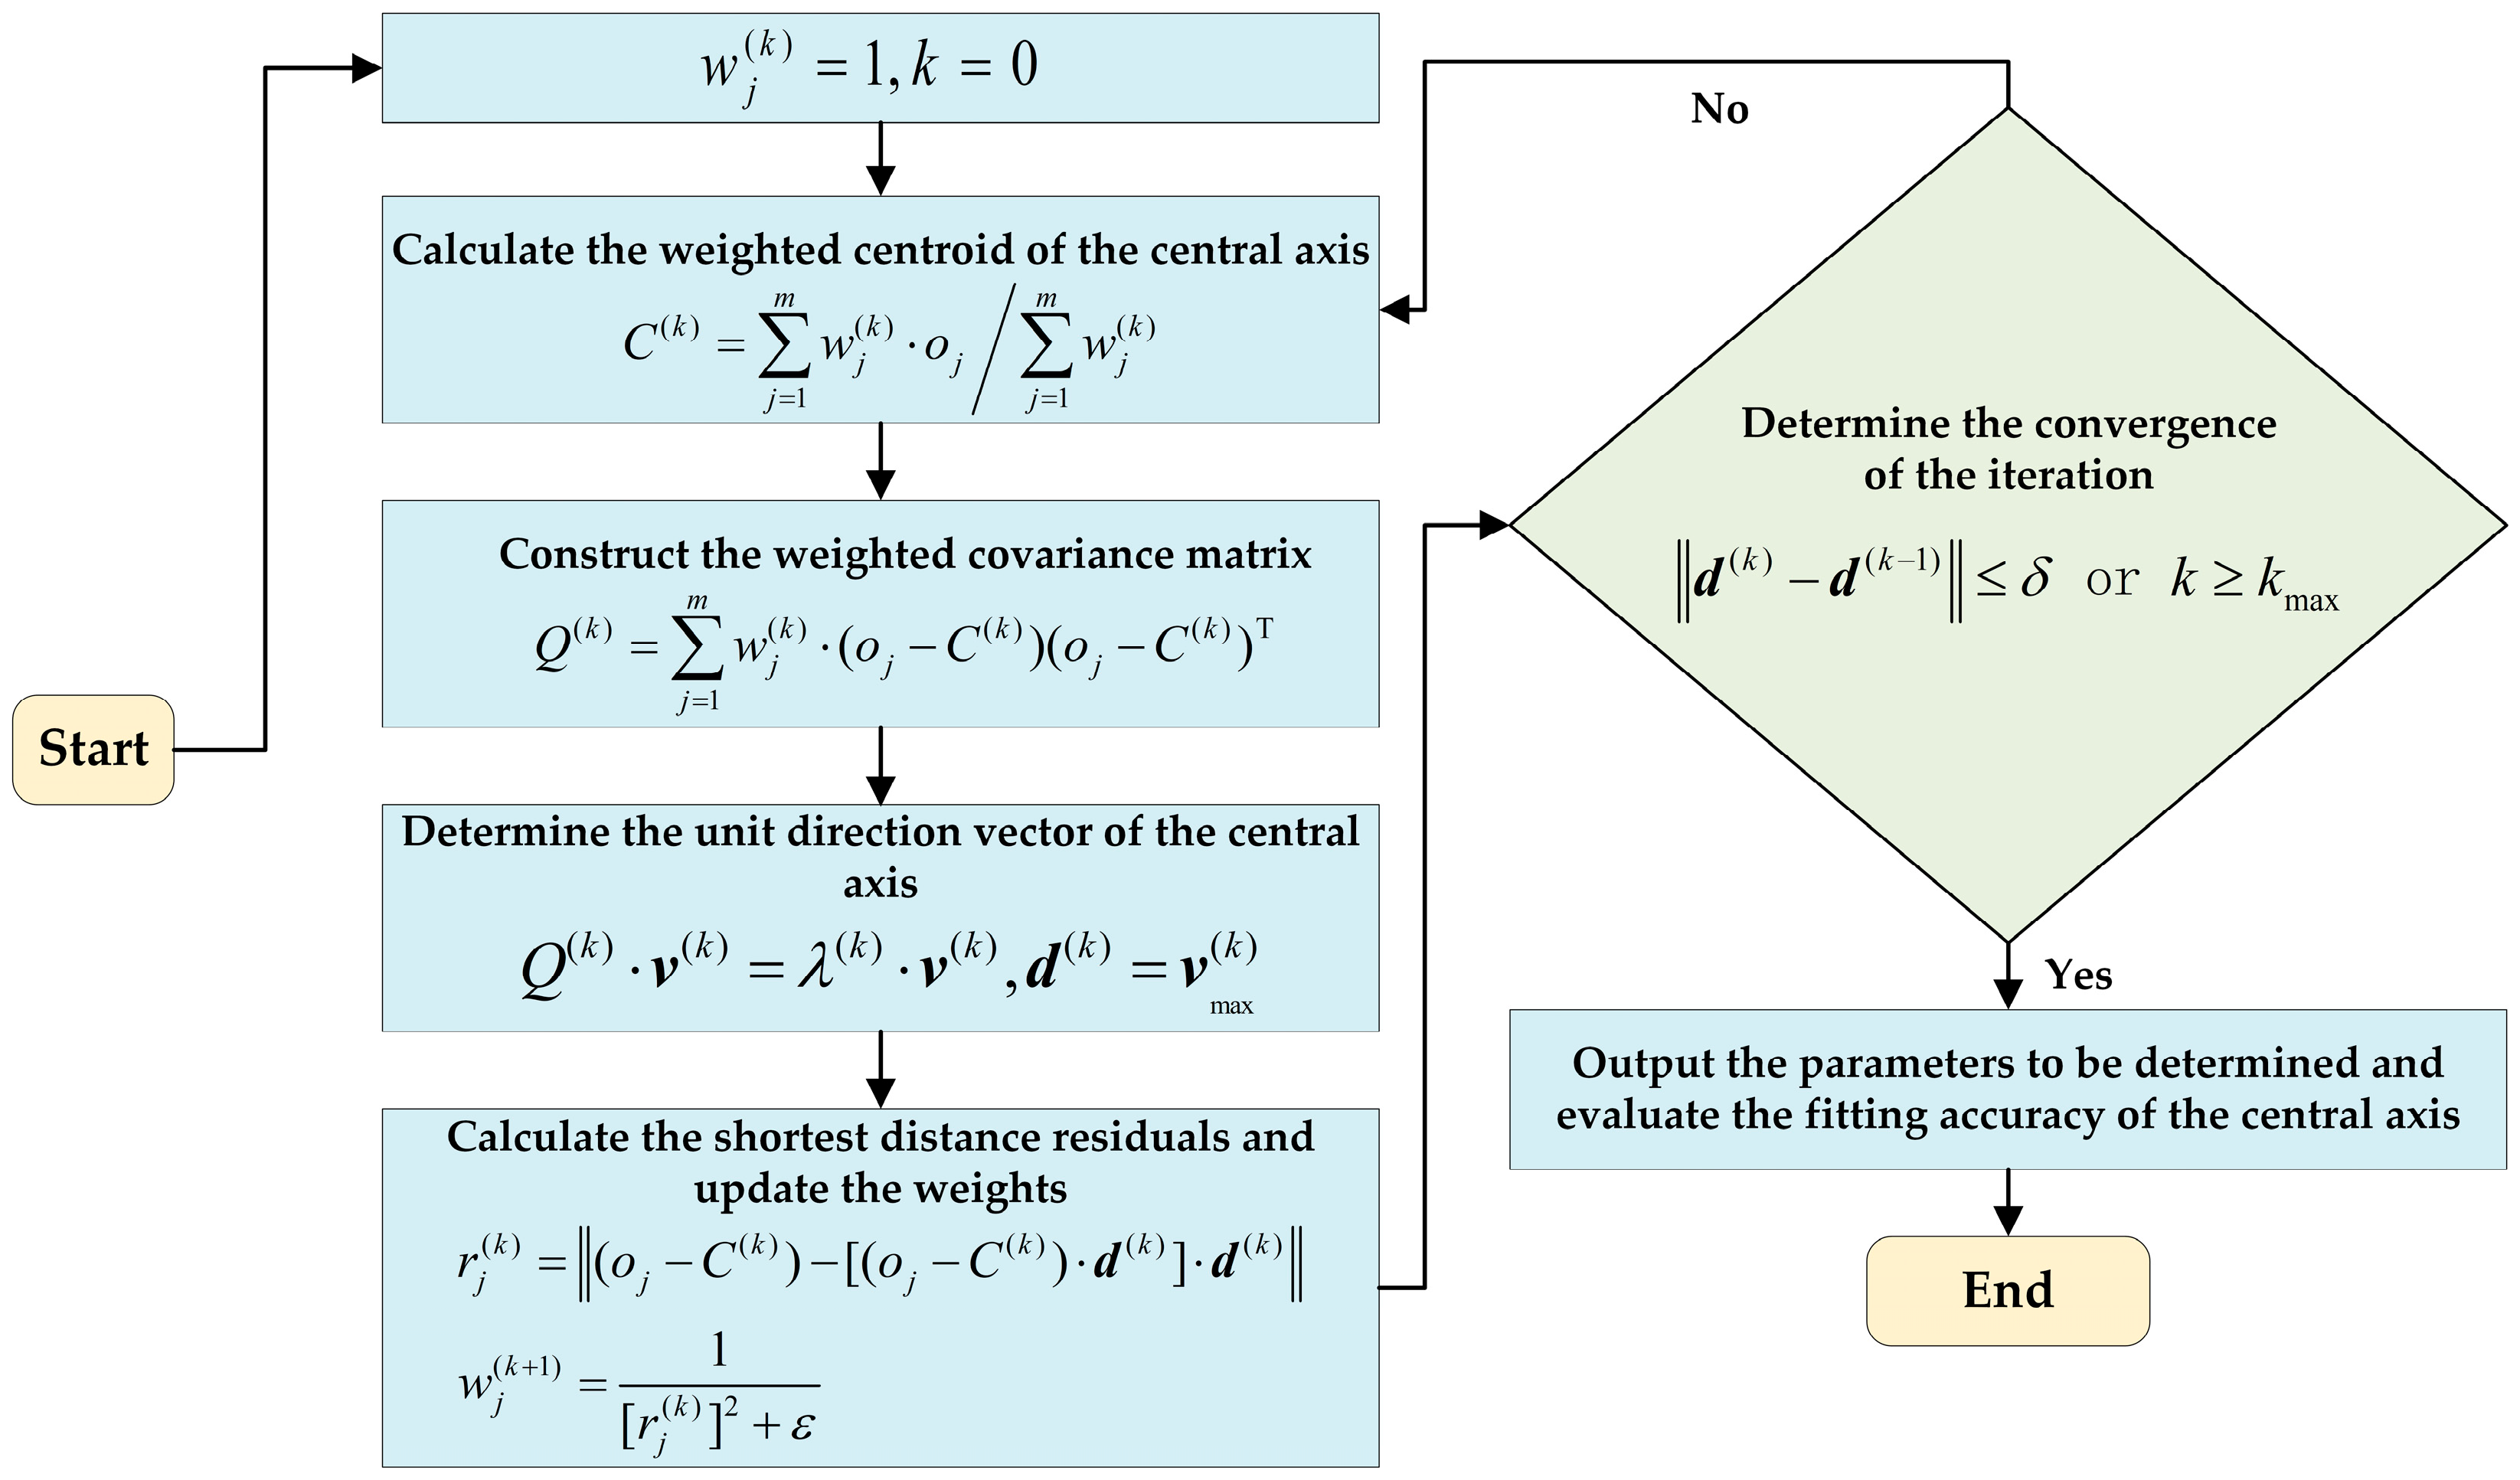
Based on the set of geometric center coordinates of the contours in Equation (10), and considering that the IRLS method can effectively suppress the interference of outliers and local noise on the fitting results [56], this study employs the IRLS method to extract the unit direction vector of the central axis of the industrial heritage chimney. The detailed process is shown in Figure 2.
According to the algorithm flowchart shown in Figure 2, the corresponding implementation steps are as follows:

2.3.1. Listing of the Equation Expression of the Central Axis

According to the intrinsic definition of a line in Euclidean geometry, the general expression of the central axis is given by Equation (11).
L ( t ) = C + t d ,
where L ( t ) represents the 3D coordinates of any point on the central axis. C represents the weighted centroid. d represents the unit direction vector of the central axis. t represents a real-valued parameter (the displacement factor along the unit direction vector d ). When t > 0 , it represents a point on the central axis moving forward from C along d . When t < 0 , it represents a point on the central axis moving backward from C along d . When t = 0 , the point on the central axis coincides with C itself.
At the initial iteration, the weights of all contour geometric centers are set equally, as shown in Equation (12).
w j ( k ) = 1 ,
where w j ( k ) represents the weight of the j contour geometric center in the current iteration. k represents the iteration number, with k = 0 indicating the initial state.

2.3.2. Calculation of the Weighted Centroid of the Central Axis

The weighted centroid of the contour geometric centers is computed using the current weights, as shown in Equation (13).
C ( k ) = j = 1 m w j ( k ) o j / j = 1 m w j ( k ) ,
where C ( k ) denotes the weighted centroid of all contour geometric centers in the current iteration, serving as the spatial reference point through which the line passes.

2.3.3. Construction of the Weighted Covariance Matrix

Subtracting the 3D coordinates of the weighted centroid from each contour geometric center yields the weighted covariance matrix, as shown in Equation (14).
Q ( k ) = j = 1 m w j ( k ) ( o j C ( k ) ) ( o j C ( k ) ) T ,
where Q ( k ) represents the weighted covariance matrix of the set of contour geometric center coordinates O in the current iteration, which reflects the distribution and variation of the contour geometric centers in different directions within the 3D space.

2.3.4. Calculation of the Unit Direction Vector of the Central Axis

The weighted covariance matrix is subjected to eigenvalue decomposition, and the unit eigenvector corresponding to the largest eigenvalue is taken as the unit direction vector of the central axis, as shown in Equation (15).
Q ( k ) v ( k ) = λ ( k ) v ( k ) , d ( k ) = v max ( k ) ,
where v ( k ) is an eigenvector of the current iteration’s covariance matrix Q ( k ) , representing the principal distribution trend of the data in a certain direction. λ ( k ) represents the eigenvalue corresponding to the eigenvector v ( k ) , reflecting the degree of data dispersion along direction v ( k ) . d ( k ) represents the unit direction vector of the central axis in the current iteration. v max ( k ) represents the eigenvector that maximizes the eigenvalue λ ( k ) in the current iteration.

2.3.5. Calculation of the Shortest Distance Residuals and Updating of the Weights

The shortest distance residual from each contour’s geometric center to the spatial line is calculated, and the residual feedback adjustment method is used to dynamically update the weights, as shown in Equation (16).
r j ( k ) = ( o j C ( k ) ) [ ( o j C ( k ) ) d ( k ) ] d ( k ) , w j ( k + 1 ) = 1 [ r j ( k ) ] 2 + ε ,
where r j ( k ) represents the shortest spatial distance from the j contour geometric center to the currently spatial fitting line in the current iteration. “‖⋅‖” denotes the vector norm. w j ( k + 1 ) represents the updated weight of the j contour geometric center in the current iteration, adjusted according to the inverse residual principle. ε is a very small constant to prevent division by zero (set as 10−6 in this study).

2.3.6. Convergence Criterion of Iteration

When the change in the unit direction vector of the central axis between two consecutive iterations is less than a preset threshold or the maximum number of iterations is reached, the algorithm is considered to have converged. Iteration is then terminated, and the current unit direction vector of the central axis is output, thereby achieving intelligent extraction of the unit direction vector of the central axis; otherwise, the iteration count is incremented by one ( k = k + 1 ) and returns to Equation (14). The convergence condition is given in Equation (17).
d ( k ) d ( k 1 ) δ   or   k k max ,
where δ represents the threshold for the change in the unit direction vector of the central axis between two consecutive iterations. k max represents the preset maximum number of iterations.

2.3.7. Evaluation of Fitting Accuracy

To evaluate the application effect of the iteratively reweighted least squares method in fitting the central axis, the mean deviation and root mean square error of the fitting results are calculated based on the shortest distance residuals, as shown in Equation (18).
M D = 1 m j = 1 m r j ( k ) ,   R M S E = 1 m j = 1 m [ r j ( k ) ] 2 ,
where M D represents the fitting mean deviation of the central axis. R M S E represents the fitting root mean square error of the central axis.

2.4. Calculation of the Tilt Monitoring Parameters of the Central Axis

The tilt monitoring parameters of the industrial heritage chimney’s central axis include tilt-azimuth, tilt-angle, verticality, and verticality deviation.

2.4.1. Calculation of the Tilt Azimuth of the Central Axis

In the station-center space coordinate system o-xyz, the unit direction vector of the x-axis is X = 1 , 0 , 0 . The tilt-azimuth β of the central axis is the horizontal angle between the vector d and the vector X, which can be obtained through vector operations, as shown in Equation (19).
β = arc cos X d X d ,

2.4.2. Calculation of the Tilt-Angle of the Central Axis

In the station-center space coordinate system o-xyz, the unit vector of the z-axis is Z = [0, 0, 1]. The tilt-angle φ of the central axis is the vertical angle between the vector d and the vector Z , which can be obtained through vector operations, as shown in Equation (20).
φ = arc cos Z d Z d ,

2.4.3. Calculation of the Verticality of the Central Axis

According to the definition of verticality, the verticality of the central axis can be calculated using Equation (20), as shown in Equation (21).
I = tan ( φ ) ,

2.4.4. Calculation of the Verticality Deviation of the Central Axis

The verticality deviation Δ I is the horizontal offset of the industrial heritage chimney at a specific height H relative to its base [54]. It can be obtained according to Equation (21), as shown in Equation (22).
Δ I = H I ,

2.5. Accuracy Assessment of the Tilt Monitoring of the Central Axis

To evaluate the performance of the proposed method, an accuracy analysis was conducted on the obtained tilt monitoring parameters. Relative error was used as the evaluation metric by comparing each tilt monitoring parameter with its corresponding reference value. The formula for calculating relative error is given in Equation (23).
R E = 100 % × X X ˜ / X ˜ ,
where R E represents the relative error. X represents the calculated value of each tilt monitoring parameter. X ˜ represents the corresponding reference value, which can be determined by other methods.

3. Experiment

3.1. Experimental Design

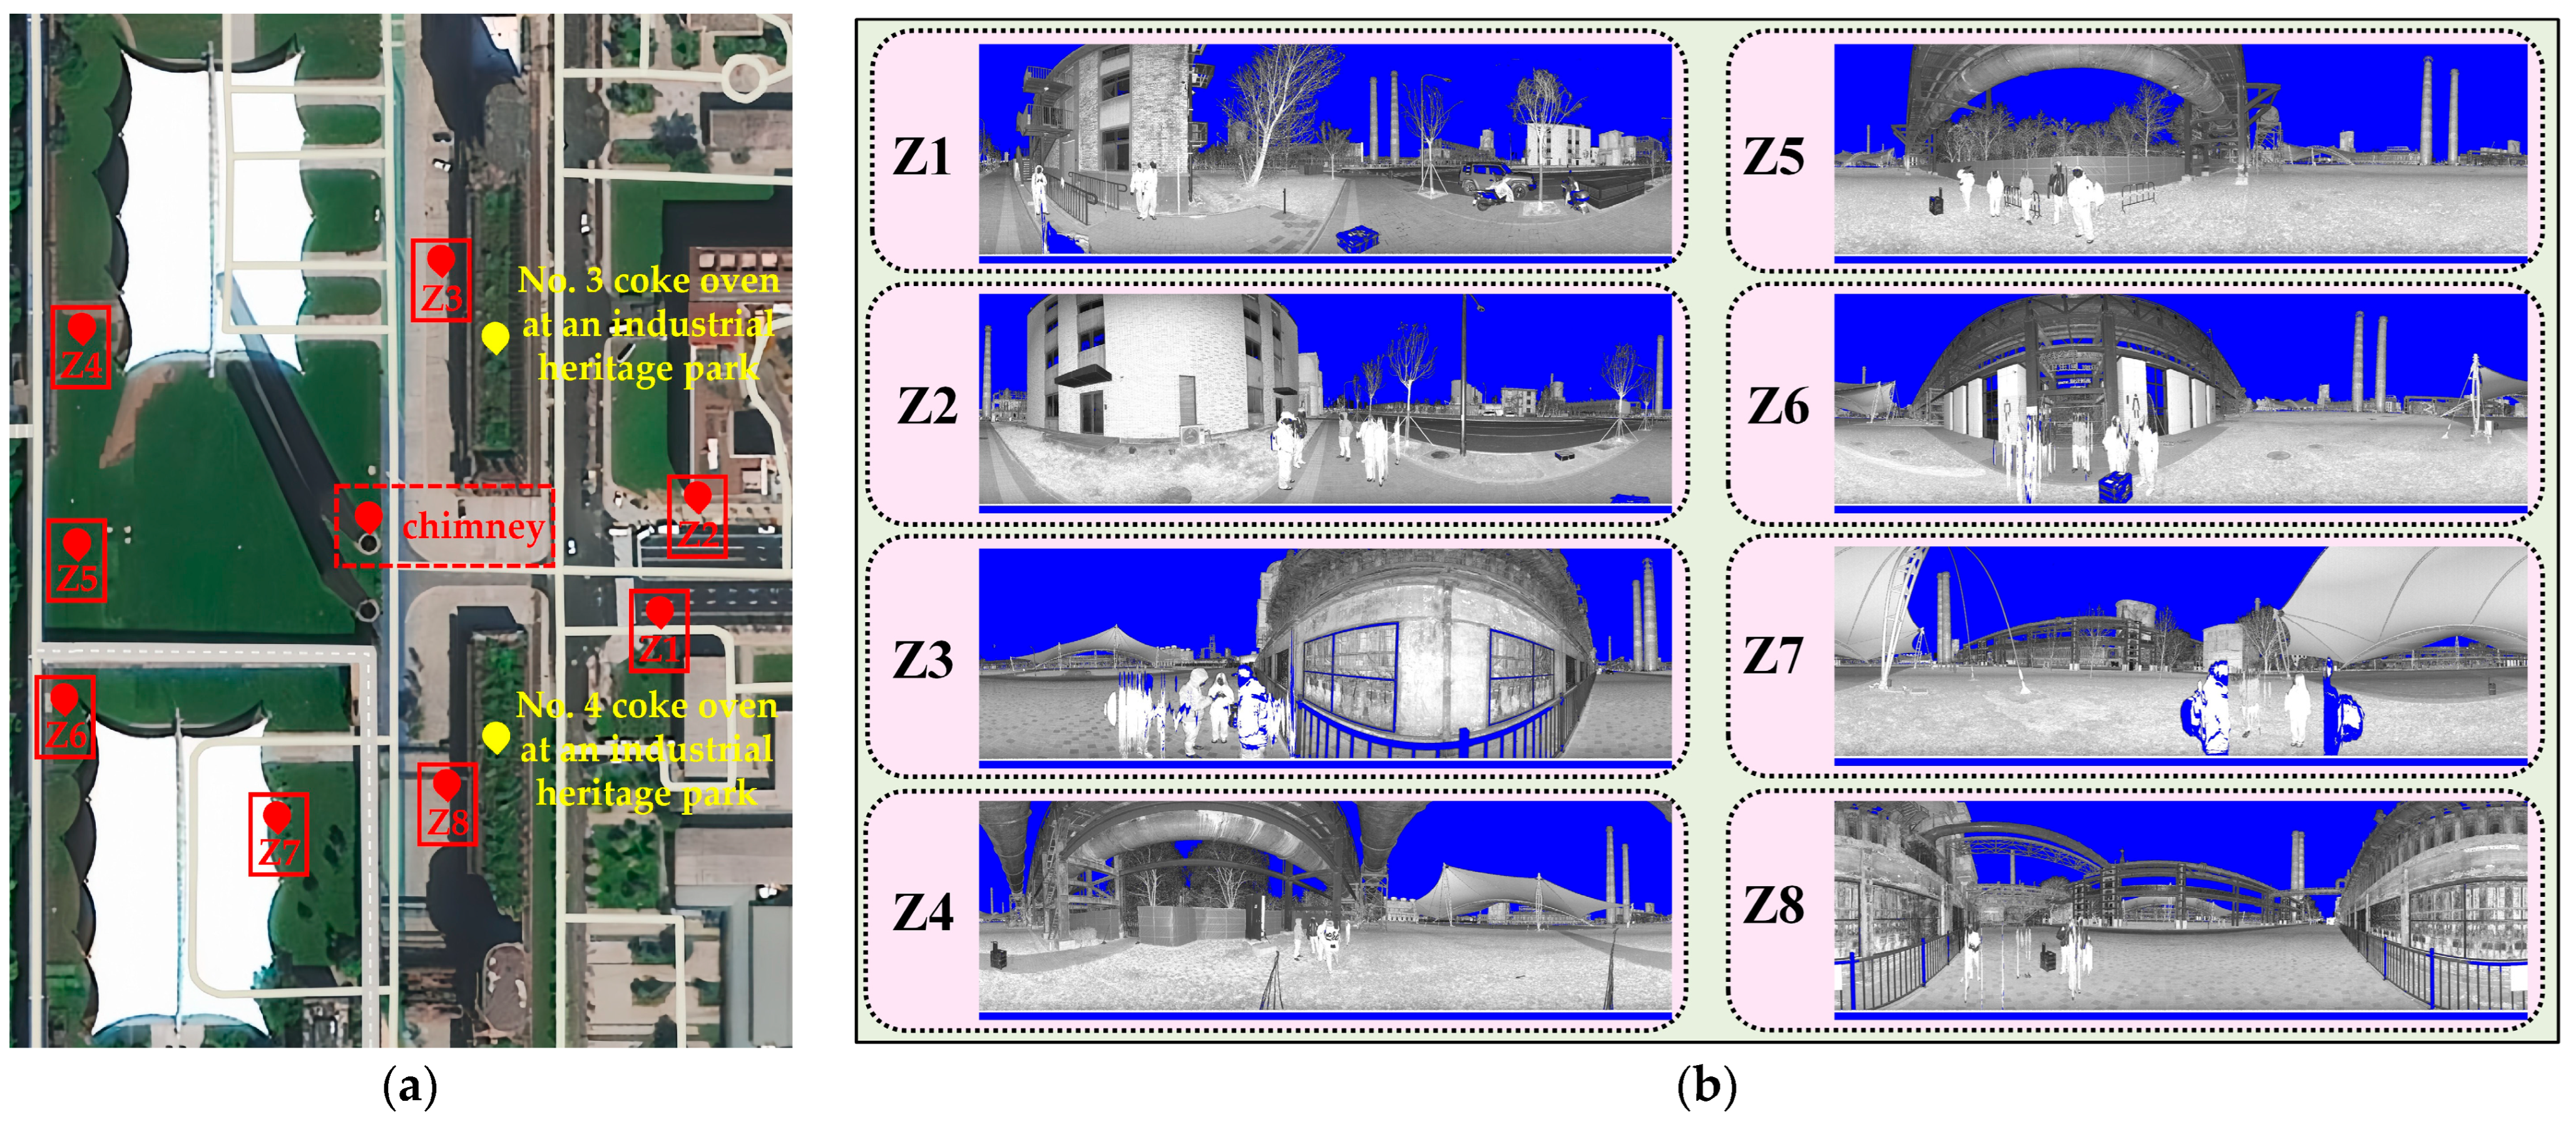
To verify and analyze the correctness and feasibility of the proposed method, an automated tilt monitoring algorithm framework with adaptive slicing and collaborative optimization was developed in MATLAB R2023b based on the conceptual design and implementation process. A super high-rise industrial heritage concrete chimney within a park in Beijing was selected as the experimental object for on-site verification and analysis. The test industrial heritage chimney has an overall height of approximately 110 m, with the top maintenance platform section about 8 m high, the bottom spotlight section about 2 m high, and the chimney cylinder section about 100 m high. The ground-based LiDAR measurement system, which integrated BeiDou/GNSS positioning and 5G communication, was deployed at eight suitable line-of-sight locations approximately 200–300 m from the industrial heritage chimney. The LiDAR sensor used is the HS1200 3D laser scanner (Jiangxia Dist., Wuhan, China), featuring a ranging accuracy of 5 mm at 100 m, vertical and horizontal angle resolutions of 0.001°, 3D coordinate measurement accuracy of (5.3, 5.3, 1.7) mm at 100 m, a data acquisition speed of 500,000 points per second, and a built-in automatic leveling system. Complete circumferential scanning was conducted to acquire the raw point cloud data of the industrial heritage chimney, with a corresponding measurement accuracy of approximately 1.5–2.3 cm. A schematic diagram of the measurement stations at the experimental site is shown in Figure 3.

3.2. Point Cloud Data Preprocessing

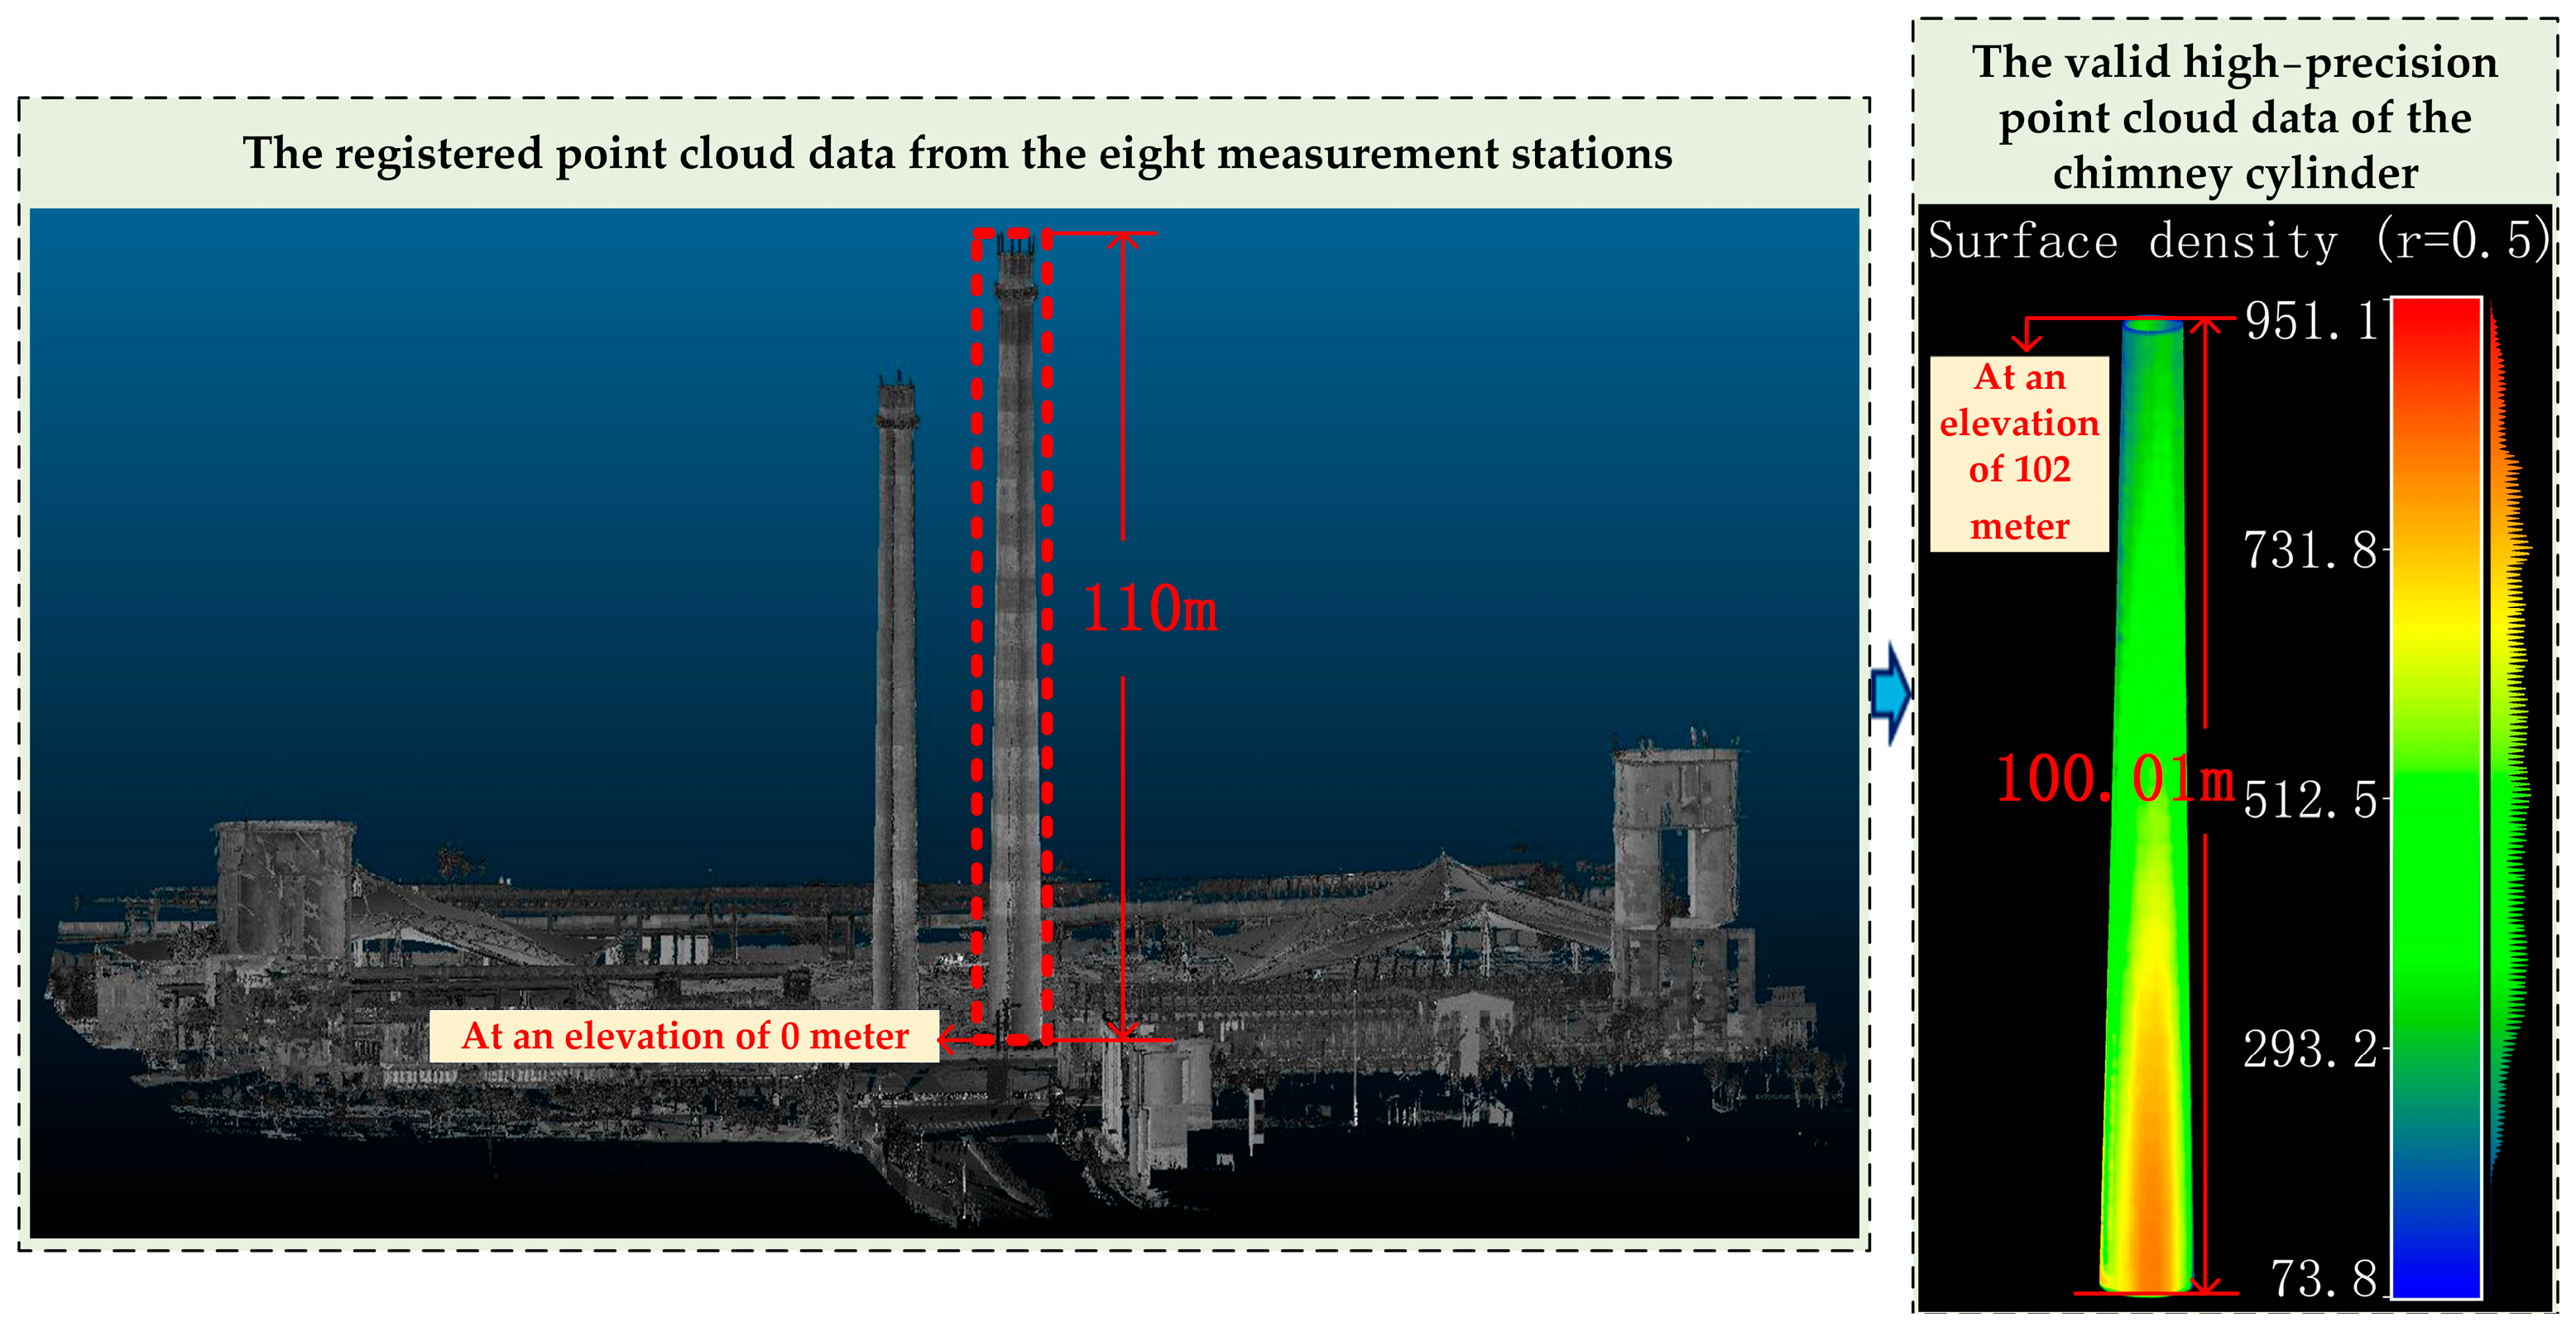
The data preprocessing program in the ground-based LiDAR measurement system performs point cloud registration, denoising, and redundancy removal on the raw point cloud data from each station, resulting in valid high-precision point cloud data of the industrial heritage chimney cylinder with a truncated height of 100.01 m in LAS format, as shown in Figure 4.

3.3. Design of Cross-Section Slicing Segmentation Strategies

To comparatively analyze the impact of multiple cross section slicing segmentation strategies designed using the proposed method on the stability of industrial heritage chimney tilt monitoring parameters, this study sets the slice thickness Δh = 1 cm and designs five experimental schemes and one control scheme based on the high-precision valid point cloud data at the industrial heritage chimney cylinder height of 100.01 m shown in Figure 4.
1.
Scheme A: Using the proposed method, the chimney cylinder is sliced horizontally along the z-axis at 1 m intervals. The contours of each slice are extracted to obtain its geometric center coordinates. These centers are then used to fit the central axis, and the corresponding unit direction vector is determined.
2.
Scheme B: Using the proposed method, the chimney cylinder is sliced horizontally along the z-axis at 5 m intervals. The contours of each slice are extracted to obtain its geometric center coordinates. These centers are then used to fit the central axis, and the corresponding unit direction vector is determined.
3.
Scheme C: Using the proposed method, the chimney cylinder is sliced horizontally along the z-axis at 10 m intervals. The contours of each slice are extracted to obtain its geometric center coordinates. These centers are then used to fit the central axis, and the corresponding unit direction vector is determined.
4.
Scheme D: Using the proposed method, the chimney cylinder is sliced horizontally along the z-axis at 20 m intervals. The contours of each slice are extracted to obtain its geometric center coordinates. These centers are then used to fit the central axis, and the corresponding unit direction vector is determined.
5.
Scheme E: Using the proposed method, one horizontal slice is taken at each end along the z-axis. The contours of these slices are extracted to obtain their geometric center coordinates. The direction vector of the central axis is then directly calculated from these center coordinates, and after normalization, the corresponding unit direction vector is obtained.
6.
Scheme F: Using the traditional method described in reference [9], one horizontal slice is taken at each end along the z-axis. The contours of these slices are extracted, and the center coordinates are obtained by averaging the vertex coordinates of each contour. The direction vector of the central axis is then directly calculated from these centers, and after normalization, the corresponding unit direction vector is obtained.

4. Results

4.1. Extraction Results of Slice Contours

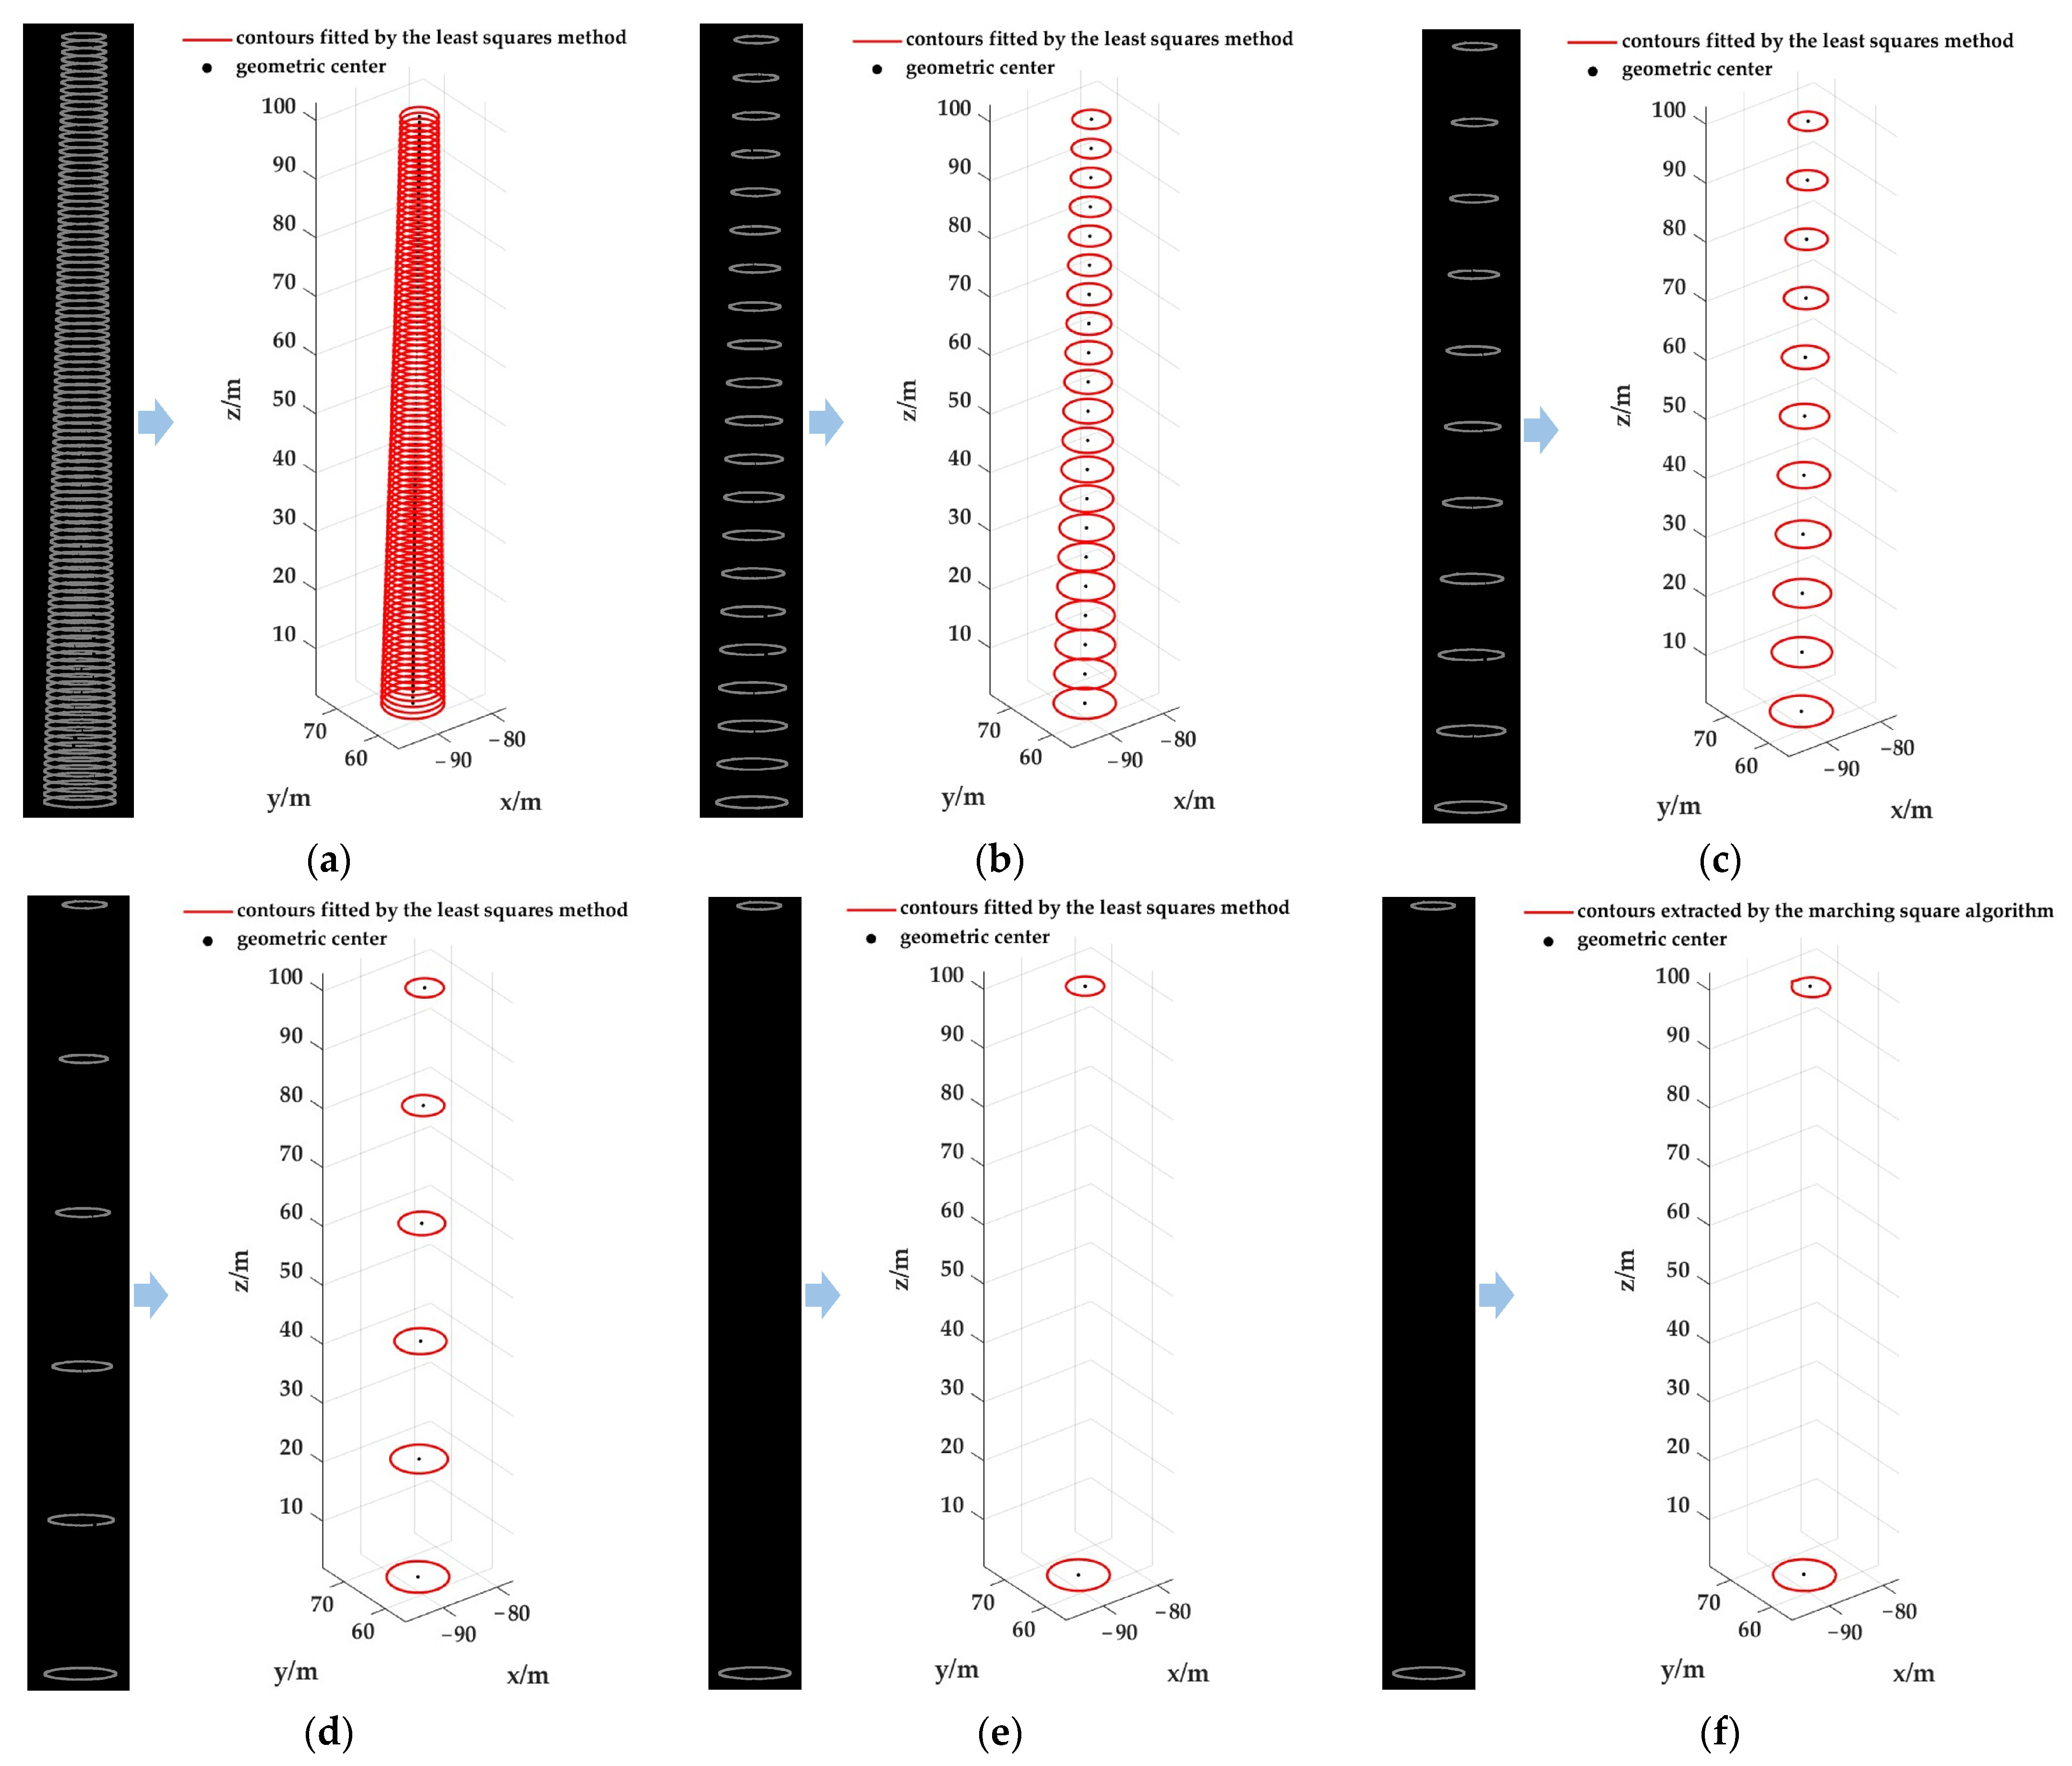
The extraction results of point cloud slices and contours obtained from the first five schemes based on the proposed method, as well as from scheme F based on the method in reference [9], are shown in Figure 5.
As shown in Figure 5, Scheme A slices the point cloud horizontally along the z-axis at 1 m intervals, resulting in 91 cross-section slices, contours, and corresponding geometric centers. Scheme B slices the point cloud horizontally along the z-axis at 5 m intervals, resulting in 21 cross-section slices, contours, and corresponding geometric centers. Scheme C slices the point cloud horizontally along the z-axis at 10 m intervals, resulting in 11 cross-section slices, contours, and corresponding geometric centers. Scheme D slices the point cloud horizontally along the z-axis at 20 m intervals, resulting in six cross-section slices, contours, and corresponding geometric centers. Schemes E and F each slice one cross-section at the top and one at the bottom, resulting in two cross-section slices, contours, and corresponding geometric centers.

4.2. Results of Tilt Monitoring Parameters

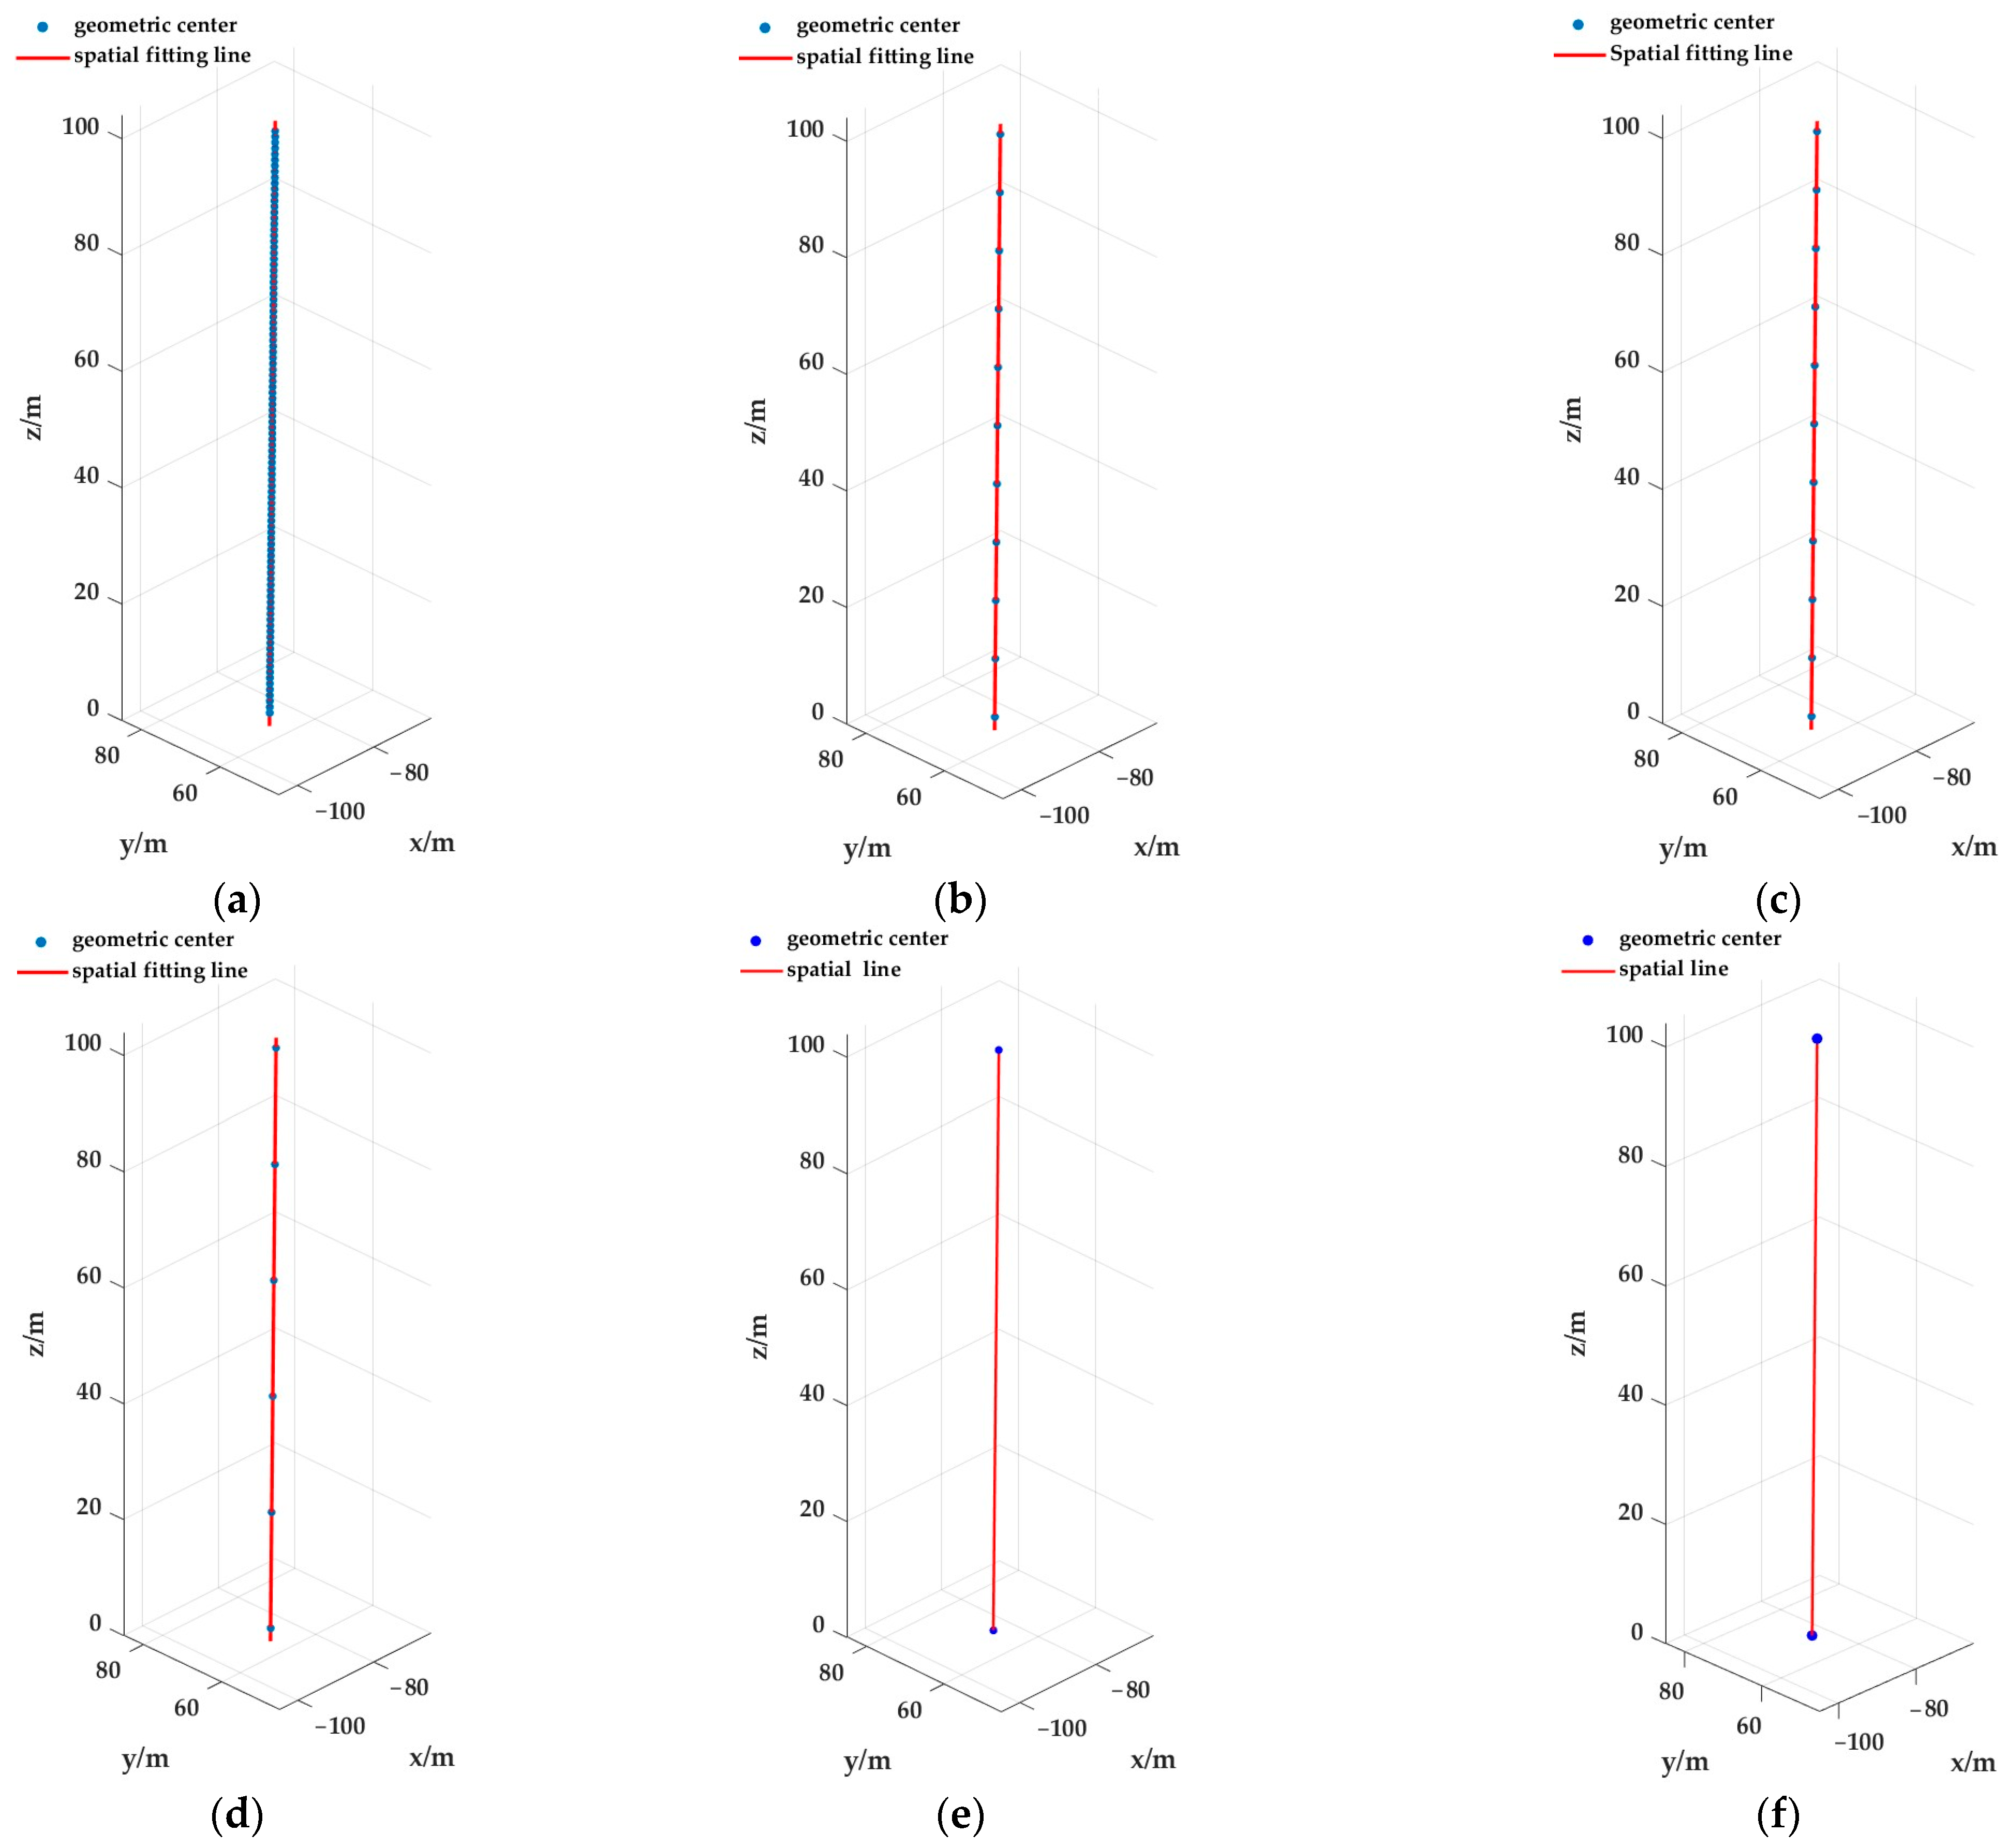
The proposed method was used to fit the central axes for the first four schemes, while the central axes for the last two schemes were obtained by direct calculation. The extraction results for the central axis are shown in Figure 6. In the process of fitting the central axis using the iterative reweighted least squares method, the iteration termination criteria were set as the difference between the unit direction vectors of two consecutive iterations falling below a predefined threshold or reaching a maximum of 100 iterations, at which point the algorithm is considered converged.
To comparatively analyze the application effect of the IRLS method in central axis fitting, this study conducted a numerical statistical analysis of the central axis fitting accuracy for each scheme. The results are shown in Table 1.
As shown in Table 1, the IRLS method plays a positive role in dynamically adjusting the weights of the geometric center points, and the average mean deviation and average root mean error of the center axis for Schemes A, B, C, and D are 1.21 cm and 1.47 cm, respectively. Since the measurement accuracy of the point cloud itself from the LiDAR device within a scanning range of 200–300 m is 1.5 to 2.3 cm, this indicates that the central axis fitting accuracy of each scheme in this study is in good agreement with the inherent measurement accuracy of the point cloud.
The unit direction vectors of the central axis obtained from the six schemes are subjected to vector operations with the x- and z-axes in the station-center space coordinate system o-xyz, yielding the tilt-azimuth, tilt-angle, verticality, and verticality deviation at the industrial heritage chimney height of 102 m, as shown in Table 2.
As shown in Table 2, Scheme A includes 101 cross-section slices, contours, and corresponding geometric centers, yielding a tilt-azimuth of 90°25′15″, tilt angle of 0°34′58″, verticality of 10.17‰, and verticality deviation of 1.0373 m. Scheme B includes 21 cross-section slices, contours, and corresponding geometric centers, yielding a tilt-azimuth of 90°25′14″, tilt angle of 0°34′48″, verticality of 10.12‰, and verticality deviation of 1.0322 m. Scheme C includes 11 cross-section slices, contours, and corresponding geometric centers, yielding a tilt-azimuth of 90°25′14″, a tilt angle of 0°34′51″, a verticality of 10.14‰, and a verticality deviation of 1.0343 m. Scheme D includes six cross-section slices, contours, and corresponding geometric centers, yielding a tilt-azimuth of 90°25′09″, tilt angle of 0°34′27″, verticality of 10.02‰, and verticality deviation of 1.0220 m. Scheme E includes two cross-section slices, contours, and corresponding geometric centers, yielding a tilt-azimuth of 90°24′58″, tilt angle of 0°33′53″, verticality of 9.86‰, and verticality deviation of 1.0057 m. Scheme F includes two cross-section slices, contours, and corresponding geometric centers, yielding a tilt-azimuth of 90°24′57″, tilt angle of 0°31′45″, verticality of 9.23‰, and verticality deviation of 0.9415 m. The tilt monitoring parameters of the industrial heritage chimney obtained using the first five schemes based on the proposed method were generally consistent, with only slight differences compared with those obtained from Scheme F using the method in [9]. In terms of the slicing workload, Scheme A is 4.8 times that of Scheme B, 9.2 times that of Scheme C, 16.8 times that of Scheme D, and 50.5 times that of Schemes E and F. Scheme B is 1.9 times that of Scheme C, 3.5 times that of Scheme D, and 10.5 times that of Schemes E and F. Scheme C is 1.8 times that of Scheme D, and 5.5 times that of Schemes E and F. Scheme D is 3 times that of Schemes E and F.

4.3. Accuracy Analysis of Tilt Monitoring Parameters

To compare and evaluate the accuracy of the tilt monitoring parameters across different schemes, the results of Scheme F obtained using the method in [9] are used as reference values. The monitoring accuracy of each scheme was comparatively analyzed using Equation (23), and the accuracy evaluation results of the tilt monitoring parameters of the industrial heritage chimney are presented in Table 3. According to the [54], the allowable verticality deviation of the central axis of a concrete chimney cylinder is 60 mm at an elevation of 100 m and 65 mm at an elevation of 120 m. Using linear interpolation, the allowable verticality deviation at an elevation of 102 m is calculated as 60.5 mm.
As shown in Table 3, the mean values of the tilt monitoring parameters of the industrial heritage chimney obtained from the five schemes using the proposed method are as follows: a tilt-azimuth of 90°25′10″ (with a relative error of 0.004%), a tilt angle of 0°34′45″ (with a relative error of 9.45%), a verticality of 10.06‰ (with a relative error of 9.45%), and a verticality deviation of 1.0263 m (with a relative error of 9.45%). This indicates that the tilt monitoring results obtained using the proposed method are in good agreement and consistent with those obtained using the method from reference [9], validating the effectiveness of the proposed method. However, a relative error of 9.45% still existed between the two methods in terms of tilt angle, verticality, and verticality deviation. This is because of the difference in how the contour centers are determined: Reference [9] uses the Marching Square algorithm to extract each contour and determines its center point based on the average coordinates of the contour vertices (closer to the centroid), whereas the proposed method employs the least squares method to fit each contour and determine its circular center (closer to the geometric center, which more accurately reflects the actual conditions of the industrial heritage chimney tilt monitoring). Additionally, reference [9] fits a spatial line through the centers using the traditional least-squares method, while the proposed method applies the IRLS method, which offers greater robustness against outliers and higher fitting accuracy [57]. The mean verticality deviation of the industrial heritage chimney monitored using the proposed method is 1.0263 m, which exceeds the allowable deviation value of 0.0605 m at the 102 m elevation specified in the [54]. This indicates a potential tilt risk in the test industrial heritage chimney, and it is recommended that the relevant authorities conduct further tilt monitoring.

5. Discussion

Notably, among the five experimental schemes using the proposed method, Scheme A slices the point cloud horizontally along the z-axis at 1 m intervals, resulting in the largest number of slices, the most redundant observations, and the highest reliability. Compared to the results obtained using the method in reference [9], the relative errors in tilt-azimuth, tilt-angle, verticality, and verticality deviation are 0.006%, 10.13%, 10.13%, and 10.13%, respectively. However, Scheme A also involved the highest slicing workload and the lowest efficiency. Scheme B, which slices the point cloud horizontally along the z-axis at 5 m intervals, offers an advantage over Scheme A by reducing the slicing workload by a factor of 4.8. Compared with the results obtained using the method in reference [9], the relative errors in tilt-azimuth, tilt-angle, verticality, and verticality deviation are 0.005%, 9.60%, 9.60%, and 9.60%, respectively. However, Scheme B reduces the number of redundant observations to some extent, thereby slightly lowering the overall reliability. Scheme C, which slices the point cloud horizontally along the z-axis at 10 m intervals, offers an advantage over Scheme A by reducing the slicing workload by a factor of 4.8. Compared with the results obtained using the method in reference [9], the relative errors in the tilt-azimuth, tilt-angle, verticality, and verticality deviation are 0.005%, 9.76%, 9.76%, and 9.76%, respectively. However, Scheme C significantly reduced the number of redundant observations, resulting in lower overall reliability. Scheme D, which slices the point cloud horizontally along the z-axis at 10 m intervals, offers an advantage over Scheme A by reducing the slicing workload by a factor of 16.8. Compared with the results obtained using the method in [9], the relative errors in tilt-azimuth, tilt-angle, verticality, and verticality deviation were 0.004%, 8.5%, 8.5%, and 8.5%, respectively. However, Scheme D further reduces the number of redundant observations, resulting in lower reliability. Scheme E, which slices the point cloud horizontally along the z-axis at the top and bottom, offers an advantage over Scheme A by reducing the slicing workload by a factor of 50.5. Compared with the results obtained using the method in reference [9], the relative errors in tilt-azimuth, tilt-angle, verticality, and verticality deviation were 0%, 6.71%, 6.71%, and 6.71%, respectively. However, the disadvantage of Scheme E is the lack of redundant observations, leading to poor reliability.
Therefore, the recommended segmentation strategy for tilt monitoring of super-high-rise industrial heritage chimneys using the proposed method is as follows:
If workload is not a limiting factor, it is advisable to adopt horizontal slicing along the z-axis at intervals of 1 to 5 m to extract tilt monitoring parameters, as this ensures the highest reliability.
If it is necessary to reduce the workload appropriately, the slicing interval along the z-axis can be increased to extract tilt monitoring parameters, which still ensures good reliability and accuracy.
If rapid extraction of tilt monitoring parameters is required, one horizontal slice should be taken at both the top and bottom along the z-axis to extract these parameters, which can significantly reduce the slicing workload and enhance efficiency.

6. Conclusions and Outlook

This study proposes a tilt monitoring method for super-high-rise industrial heritage chimneys based on LiDAR point clouds, which achieves efficient data acquisition and remote transmission, completes intelligent extraction of the central axis, and improves the automation level of tilt monitoring. The accuracy of fitting the central axis using the IRLS method is in good agreement with the inherent measurement accuracy of the point cloud, ensuring high-precision intelligent extraction of the central axis. The proposed method was validated through field experiments on a super-high-rise industrial heritage chimney, demonstrating its effectiveness and practicality. Compared with the traditional method, the relative errors of the tilt angle, verticality, and verticality deviation of the industrial heritage chimney obtained by the proposed method are only 9.45%, and the relative error of the tilt-azimuth is only 0.004%. This verified the effectiveness of the proposed method, demonstrating its capability for high-precision, non-contact, and globally perceptive tilt monitoring of super-high-rise industrial heritage chimneys and highlighting its scientific novelty. Using the proposed method, the verticality deviation at the 102 m elevation of the industrial heritage chimney was measured to be 1.0263 m (with a corresponding tilt-azimuth of 90°25′10″ and tilt angle of 0°34′45″), which exceeds the allowable verticality deviation value of 0.0605 m specified in the [54]. This indicates a tilt risk in the test industrial heritage chimney and provides data support for its realignment, reinforcement, and anti-corrosion treatment.
The industrial heritage chimney in this study was originally designed as a typical conical shaft with a circular cross-section. Therefore, we selected a circular fitting approach to extract the horizontal slice contours, which aligns with its design characteristics. However, we fully acknowledge that over time, the structure may undergo deformation or aging, causing the actual cross-sections to deviate from a perfect circle. The proposed method in this study is also applicable to the analysis of non-circular cross-sections, and future research will introduce fitting models, such as ellipses or splines, to represent irregular cross-sections more accurately. Meanwhile, the proposed method will be extended to a wider range of high-rise structures, with comparative testing and analysis conducted under various complex scenarios to comprehensively evaluate its general adaptability to different structural types and environmental conditions. In addition, by conducting regular LiDAR scans and repeated measurements, the proposed method can be extended to achieve time-series dynamic tracking and structural health monitoring. Future research will focus on verifying the structural health monitoring capability through time-series tracking with predefined sampling intervals.

Author Contributions

Conceptualization, M.Z. and Y.Q.; methodology, M.Z. and Y.Q.; software, Y.Q. and Z.Z.; formal analysis, Q.X. and Q.S.; data curation, Q.X. and Q.S.; writing—original draft preparation, Y.Q., S.L. and L.Q.; writing—review and editing, M.Z., G.W. and P.Y.; visualization, M.Z., Y.Q. and Z.Z.; supervision, project administration, and funding acquisition, M.Z. All authors have read and agreed to the published version of the manuscript.

Funding

This research was funded by the Supply-Demand Matching Employment and Education Program of the Ministry of Education of the People’s Republic of China, grant number [2024010466760; 2023122666177]; and the General Research Project on Digital Education of Beijing Municipality, grant number [BDEC2024YB130].

Data Availability Statement

The data presented in this study are available in the article.

Conflicts of Interest

The authors declare no conflict of interest.

References

  1. Gao, Y.; Chung, W. Optimization of building thermal environment in industrial heritage landscape regeneration design simulation based on image visual visualization. Therm. Sci. Eng. Prog. 2024, 56, 103024. [Google Scholar] [CrossRef]
  2. Bertacchini, E.; Frontuto, V. Economic valuation of industrial heritage: A choice experiment on Shanghai Baosteel industrial site. J. Cult. Herit. 2024, 66, 215–228. [Google Scholar] [CrossRef]
  3. Zhong, D.; Huang, P.; Xiong, G.; Li, H. Renewal strategies of industrial heritage based on placeness theory: The case of Guangzhou, China. Cities 2024, 155, 105407. [Google Scholar] [CrossRef]
  4. Zhou, Y.; Chang, M.; Wu, H.; Zhuo, Y.; Djerrad, A.; Lu, X. Numerical investigation on the characteristics of dynamic response and damage of a RC tall chimney considering vertical ground motions. Soil Dyn. Earthq. Eng. 2023, 175, 108224. [Google Scholar] [CrossRef]
  5. Bhatt, M. Sectional properties and overall performance of FRP-wrapped RC chimneys. Structures 2025, 76, 108938. [Google Scholar] [CrossRef]
  6. Su, N.; Li, Z.; Peng, S.; Uematsu, Y. Interference effects on aeroelastic responses and design wind loads of twin high-rise reinforced concrete chimneys. Eng. Struct. 2021, 233, 111925. [Google Scholar] [CrossRef]
  7. Johnston, D.S. Chimney Fires: Causes, Effects & Evaluation; Chimney Safety Institute of America: Plainfield, IN, USA, 2007; pp. 11–35. [Google Scholar]
  8. Zheng, S.; Ma, D.; Zhang, Z.; Hu, H.; Gui, L. A novel measurement method based on silhouette for chimney quasi-static deformation monitoring. Measurement 2012, 45, 226–234. [Google Scholar] [CrossRef]
  9. Zhou, M.; Qin, Y.; Zhang, W.; Xu, X.; Zhou, Q. LiDAR-based non-destructive detection algorithm of tower crane verticality. Bull. Surv. Mapp. 2024, 2, 90–94. [Google Scholar]
  10. Zhou, M.; Qin, Y.; Meng, Q.; Xu, X.; Liu, M.; Song, Q.; Wang, J. A LiDAR inspection method of tower verticality based on marching cubes algorithm. Sci. Surv. Mapp. 2025, 50, 123–131. [Google Scholar]
  11. Zheng, J.; Lu, W.; Hu, W.; Teng, J. Real-time estimation method for horizontal displacement of high-rise buildings based on fusion of inclination and acceleration monitoring data. J. Build. Eng. 2025, 103, 112083. [Google Scholar] [CrossRef]
  12. García-Nieto, M.C.; Huesca-Tortosa, J.A.; Martínez-Segura, M.A.; Gea, A.E.; Navarro, M. Structural deformation monitoring using UAV photogrammetry to assess slender historic buildings. J. Build. Eng. 2025, 100, 111766. [Google Scholar] [CrossRef]
  13. Guo, M.; Sun, M.; Huang, M.; Yan, B.; Zhou, Y.; Zhao, Y. High-precision measurement of steel structure based on LiDAR and UAV. Opt. Precis. Eng. 2021, 29, 989–998. [Google Scholar] [CrossRef]
  14. Guo, M.; Yan, B.; Zhou, T.; Chen, Z.; Zhang, C.; Liu, Y. Application of LiDAR Technology in Deformation Analysis of Yingxian Wooden Pagoda. J. Archit. Civ. Eng. 2020, 37, 109–117. [Google Scholar]
  15. Dabrowski, P.S. Novel PCSE-based approach of inclined structures geometry analysis on the example of the Leaning Tower of Pisa. Measurement 2022, 189, 110462. [Google Scholar] [CrossRef]
  16. Zhou, Y.; Luo, X.; Zhang, W.; Ye, P.; Chen, J.; Du, Z. Improvement of axial deformation prediction in high-rise buildings with field monitoring and adaptive unscented Kalman filter. J. Build. Eng. 2024, 83, 108432. [Google Scholar] [CrossRef]
  17. Zhou, Y.; Luo, X.; Ye, P.; Zhang, W.; Qin, L.; Du, Z. Bayesian-based prediction and real-time updating of axial deformation in high-rise buildings during construction. Eng. Struct. 2023, 297, 116992. [Google Scholar] [CrossRef]
  18. Zhang, G.; Liu, M.; Cheng, S.; Wang, M. Research on transmission line tower tilting and foundation state monitoring technology based on multi-sensor cooperative detection and correction. Energy Eng. 2023, 121, 169–185. [Google Scholar] [CrossRef]
  19. Zhou, M.; Ma, B.; Bao, H.; Shi, J.; Luo, D. GNSS-based verticality intelligent detection in rounds for construction tower crane. J. Data Acquis. Process. 2020, 35, 223–230. [Google Scholar]
  20. Zhou, M.; Bao, H.; Zhang, W.; Ma, B. GNSS-based lateral perpendicularity intelligent detection for construction tower crane. Laser J. 2021, 42, 26–31. [Google Scholar]
  21. Abbas, S.; Kwok, T.; Hui, W.; Li, H.; Chin, C.W.; Ju, S.; Heo, J.; Wong, S. Tree tilt monitoring in rural and urban landscapes of Hong Kong using smart sensing technology. Trees For. People 2020, 2, 100030. [Google Scholar] [CrossRef]
  22. Gao, M.; Zhao, Z.; Li, Y.; Xu, X.; Li, C.; Zhang, J. Monitoring and research on tilt of transmission line tower based on optical fiber sensing. J. Electron. Meas. Instrum. 2018, 32, 51–59. [Google Scholar]
  23. Choi, S.; Kim, I.; Park, J.; Kim, Y.; Sohn, H.; Park, H. Evaluation of Stiffness Changes in a High-Rise Building by Measurements of Lateral Displacements Using GPS Technology. Sensors 2013, 13, 15489–15503. [Google Scholar] [CrossRef]
  24. Zhang, X.; Yang, M.; Wang, D.; Chen, B.; Song, K. A transmission line tower tilt detection method based on BeiDou positioning signals and UAV inspection images. J. Radiat. Res. Appl. Sci. 2024, 17, 101192. [Google Scholar] [CrossRef]
  25. Siwiec, J.; Lenda, G. Integration of terrestrial laser scanning and structure from motion for the assessment of industrial chimney geometry. Measurement 2022, 199, 111404. [Google Scholar] [CrossRef]
  26. Popović, J.; Pandžić, J.; Pejić, M.; Vranić, P.; Milovanović, B.; Martinenko, A. Quantifying tall structure tilting trend through TLS-based 3D parametric modelling. Measurement 2022, 188, 110533. [Google Scholar] [CrossRef]
  27. Zrinjski, M.; Tupek, A.; Barkovic, D.; Polovic, A. Industrial Masonry Chimney Geometry Analysis: A Total Station Based Evaluation of the Unmanned Aerial System Photogrammetry Approach. Sensors 2021, 21, 6265. [Google Scholar] [CrossRef] [PubMed]
  28. Pleterski, Ž.; Rak, G.; Kregar, K. Determination of Chimney Non-Verticality from TLS Data Using RANSAC Method. Remote Sens. 2024, 16, 4541. [Google Scholar] [CrossRef]
  29. Chang, L.; Zhao, L. Modified boosting and bagging for building tilt rate prediction in tunnel construction. Autom. Constr. 2023, 155, 105059. [Google Scholar] [CrossRef]
  30. Jiang, T.; Lv, P.; Li, D. A new shape reconstruction method for monitoring the large deformations of offshore wind turbine towers. Ocean Eng. 2024, 312, 119253. [Google Scholar] [CrossRef]
  31. Górski, P. Dynamic characteristic of tall industrial chimney estimated from GPS measurement and frequency domain decomposition. Eng. Struct. 2017, 148, 277–292. [Google Scholar] [CrossRef]
  32. Dawood, A.; Sangoor, A.; Al-Rkaby, A. Behavior of tall masonry chimneys under wind loadings using CFD technique. Case Stud. Constr. Mater. 2020, 13, e00451. [Google Scholar] [CrossRef]
  33. Cazzaniga, N.; Pinto, L.; Forlani, G.; Abruzzi, P. Monitoring Oscillations of Slender Structures with GPS and Accelerometers. In Proceedings of the From Pharaohs to Geoinformatics FIG Working Week 2005 and GSDI-8, Cairo, Egypt, 16–21 April 2005. [Google Scholar]
  34. Cheng, S.; Mi, K.; Li, X.; Shu, J.; Chen, C.; Lan, H.; Wang, J. Application of robust least-square in perpendicularity analysis of wind turbine tower. Therm. Power Gener. 2021, 50, 152–159. [Google Scholar]
  35. Ding, K.; Liu, M.; Liu, Y.; Bao, D.; Dong, J. Research on non-contact rapid inspection method of high pier bridge verticality and its precision analysis. Bull. Surv. Mapp. 2019, 6, 121–125. [Google Scholar]
  36. Bian, F.; Zhao, H.; Liu, Z.; Su, Z.; Guan, B.; Zhang, D.; Yu, Q. Stereo vision-based health monitoring method for wind turbine towers. Measurement 2024, 226, 114148. [Google Scholar] [CrossRef]
  37. Kurdi, F.; Lewandowicz, E.; Gharineiat, Z.; Shan, J. Modeling Multi-Rotunda Buildings at LoD3 Level from LiDAR Data. Remote Sens. 2023, 15, 3324. [Google Scholar]
  38. Helming, P.; Poeck, N.; Freyberg, A.; Sorg, M.; Fischer, A. Dynamic optical deformation measurements on wind turbines. J. Phys. Conf. Ser. 2022, 2265, 022100. [Google Scholar] [CrossRef]
  39. Schneider, D. Terrestrial laser scanning for area based deformation analysis of towers and water damns. In Proceedings of the 3rd IAG/12th FIG Symposium, Baden, Austria, 22–24 May 2006. [Google Scholar]
  40. Muszynski, Z.; Milczarek, W. Application of Terrestrial Laser Scanning to Study the Geometry of Slender Objects. IOP Conf. Ser. Earth Environ. Sci. 2017, 95, 042069. [Google Scholar] [CrossRef]
  41. Ma, B.; Zheng, X.; Li, J.; Pan, C.; Li, J.; He, C.; Yan, D.; Chen, Y.; Pan, Q.; Hou, Z.; et al. Long-term high-precision monitoring system for laser parameters in large-aperture dual-wavelength LiDAR. Opt. Laser Technol. 2025, 182, 112200. [Google Scholar] [CrossRef]
  42. Luo, R.; Zhou, J.; Chu, X.; Ma, W.; Meng, J. 3D deformation monitoring method for temporary structures based on multi-thread LiDAR point cloud. Measurement 2022, 200, 111545. [Google Scholar] [CrossRef]
  43. Han, J.; Guo, J.; Jiang, Y. Monitoring tunnel deformations by means of multi-epoch dispersed 3D LiDAR point clouds: An improved approach. Tunn. Undergr. Space Technol. 2013, 38, 385–389. [Google Scholar] [CrossRef]
  44. Liu, X.; Cai, D.; Wang, R. Bridge Pier Verticality Detection Considering Surface Point Cloud Curvature Characteristics. Sens. Mater. 2024, 36, 5395–5410. [Google Scholar] [CrossRef]
  45. Gražulis, Ž.; Krikštaponis, B.; Neseckas, A.; Popovas, D.; Putrimas, R.; Šlikas, D.; Zigmantiene, E. The Horizontal Deformation Analysis of High-rise Buildings. In Proceedings of the 10th International Conference, Environmental Engineering, Vilnius, Lithuania, 27–28 April 2017. [Google Scholar]
  46. Barazzetti, L.; Previtali, M.; Roncoroni, F. The use of terrestrial laser scanning techniques to evaluate industrial masonry chimney verticality. Int. Arch. Photogramm. Remote Sens. Spat. Inf. Sci. 2019, XLII-2/W11, 173–178. [Google Scholar] [CrossRef]
  47. Kaszowska, O.; Gruchlik, P.; Mika, W. Industrial chimney monitoring—Contemporary methods. E3S Web Conf. 2018, 36, 01005. [Google Scholar] [CrossRef]
  48. Głowacki, T.; Grzempowski, P.; Sudoł, E.; Wajs, J.; Zając, M. The assessment of the application of terrestrial laser scanning for measuring the geometrics of cooling towers. Geomat. Landmanag. Landsc. 2016, 4, 49–57. [Google Scholar] [CrossRef]
  49. Kregar, K.; Ambrožic, T.; Kogoj, D.; Vezocnik, R.; Marjetic, A. Determining the inclination of tall chimneys using the TPS and TLS approach. Measurement 2015, 75, 354–363. [Google Scholar] [CrossRef]
  50. Daliga, K.; Kurałowicz, Z. Comparison of Different Measurement Techniques as Methodology for Surveying and Monitoring Stainless Steel Chimneys. Geosciences 2019, 9, 429. [Google Scholar] [CrossRef]
  51. Guo, M.; Qi, H.; Guo, K.; Zhou, Y.; Li, D. Ground-based LiDAR measurement system integrating BeiDou/GNSS positioning and 5G communication. Opt. Precis. Eng. 2023, 31, 450–458. [Google Scholar] [CrossRef]
  52. Guo, M.; Qi, H.; Zhou, Y.; Liu, Y.; Wang, J.; Zhao, J.; Zhang, Y. Design and Management of a Spatial Database for Monitoring Building Comfort and Safety. Buildings 2023, 13, 2982. [Google Scholar] [CrossRef]
  53. Zhou, M.; Wang, H.; Wang, G.; Guo, M.; Liu, Y. Research on installation surveying method of steel structures in architecture engineering for site protection. Geotech. Investig. Surv. 2020, 48, 52–56,74. [Google Scholar]
  54. GB/T 50051-2021; Technical Standard for Chimney Engineering. Ministry of Housing and Urban-Rural Development of the People’s Republic of China, China Planning Press: Beijing, China, 2021.
  55. Ahn, S.J.; Rauh, W.; Warnecke, H. Least-squares orthogonal distances fitting of circle, sphere, ellipse, hyperbola, and parabola. Pattern Recognit. 2001, 34, 2283–2303. [Google Scholar] [CrossRef]
  56. Chen, X.; Zhao, H.; Wei, W. The performance analysis of extending iterative reweighted least squares algorithm compressed sensing theory. Acta Sci. Nat. Univ. Sunyatseni 2014, 53, 23–28. [Google Scholar]
  57. Huber, P.J. Robust Statistics; Wiley, John & Sons Inc. Pub.: New York, NY, USA, 1981; p. 28. [Google Scholar]
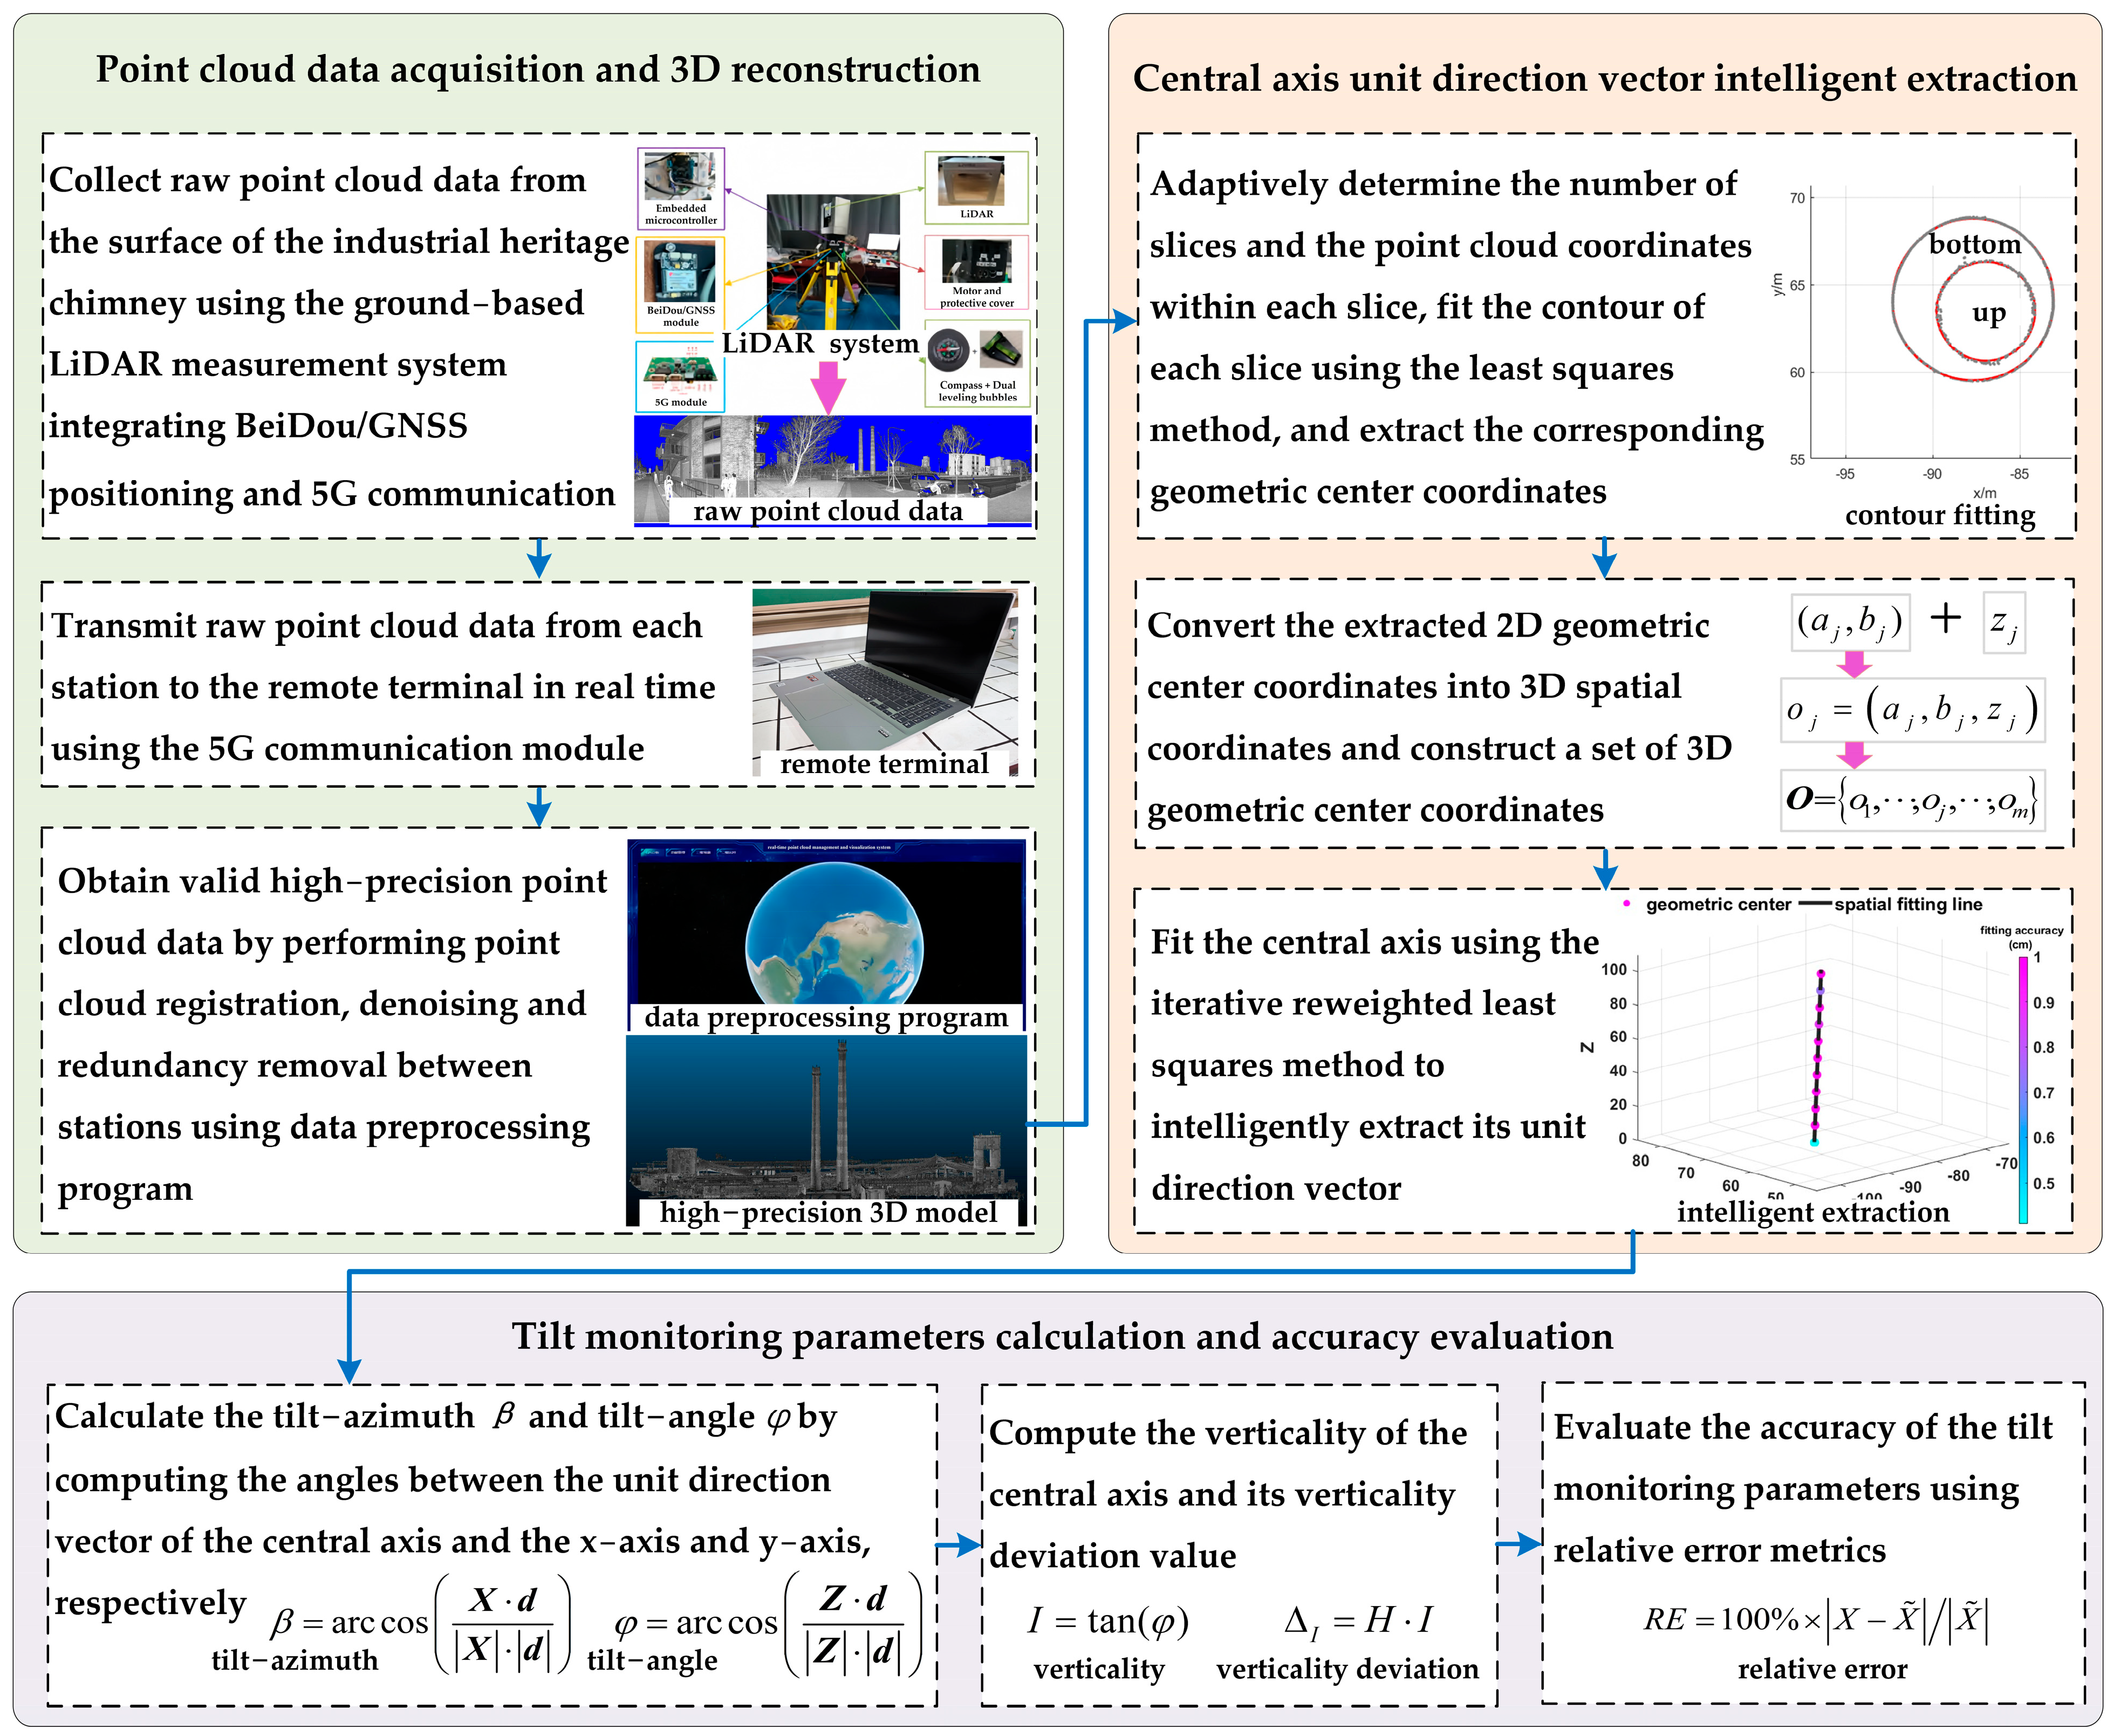
Figure 1. The proposed method flowchart.
Buildings 15 03046 g001
Figure 2. Algorithm flowchart for extracting the unit direction vector of the central axis.
Buildings 15 03046 g002
Figure 3. Schematic diagram of the measurement stations at the experimental site: (a) Planar distribution of measurement stations; (b) Raw point cloud data from eight measurement stations.
Buildings 15 03046 g003
Figure 4. Industrial heritage chimney point cloud data.
Buildings 15 03046 g004
Figure 5. The contour extraction results of each scheme: (a) The contour extraction result of scheme A; (b) The contour extraction result of scheme B; (c) The contour extraction result of scheme C; (d) The contour extraction result of scheme D; (e) The contour extraction result of scheme E; (f) The contour extraction result of scheme F.
Buildings 15 03046 g005
Figure 6. The extraction results of the central axis for each scheme: (a) The extraction result of the central axis for scheme A; (b) The extraction result of the central axis for scheme B; (c) The extraction result of the central axis for scheme C; (d) The extraction result of the central axis for scheme D; (e) The extraction result of the central axis for scheme E; (f) The extraction result of the central axis for scheme F.
Buildings 15 03046 g006
Table 1. Fitting accuracy of the central axis for each scheme.
IndicatorScheme AScheme BScheme CScheme DScheme EScheme F
Number of geometric centers involved in the fitting1012111622
Number of fitting iterations2224-- *--
Update weight ratio of geometric centers21.8%19.0%27.3%33.3%----
Mean deviation and its average value (mm)11.0 12.3 13.1 12.1 ----
12.1----
Root mean square error and its average value (mm)13.3 15.4 15.7 14.4 ----
14.7----
* “--” indicates no value.
Table 2. Results of the tilt monitoring parameters of the industrial heritage chimney’s central axis.
IndicatorScheme AScheme BScheme CScheme DScheme EScheme F
Number of cross-section slices 1012111622
Number of slice contour 1012111622
Number of
geometric centers of contour
1012111622
Unit direction vector of the central axis[0.00734720,
−0.00703179, 0.99994828]
[0.00733996,
−0.00697344, 0.99994874]
[0.00733933,
−0.00699452, 0.99994860]
[0.00731785,
−0.00684513, 0.99994979]
[0.00726479,
−0.00666181, 0.99995142]
[0.00725774,
−0.00570779, 0.99995737]
Tilt monitoring parametersTilt-azimuth90°25′15″90°25′14″90°25′14″90°25′09″90°24′58″90°24′57″
Tilt-angle0°34′58″0°34′48″0°34′51″0°34′27″0°33′53″0°31′45″
Verticality 10.17‰10.12‰10.14‰10.02‰9.86‰9.23‰
Verticality deviation 1.0373 m1.0322 m1.0343 m1.0220 m1.0057 m0.9415 m
Table 3. Accuracy analysis results of tilt monitoring parameters.
IndicatorScheme AScheme BScheme CScheme DScheme E
Tilt-azimuth and its mean value90°25′15″90°25′14″90°25′14″90°25′09″90°24′58″
90°25′10″
Reference value of the tilt-azimuth90°24′57″
Relative error (%) of the tilt-azimuth and its mean value0.0060.0050.0050.0040
0.004
Tilt-angle and its mean value0°34′58″0°34′48″0°34′51″0°34′27″0°33′53″
0°34′45″
Reference value of the tilt-angle0°31′45″
Relative error (%) of the tilt-angle and its mean value10.139.609.768.506.71
9.45
Verticality and its mean value (‰)10.1710.1210.1410.029.86
10.06
Reference value of verticality (‰)9.23
Relative error (%) of verticality and its mean value10.139.609.768.506.71
9.45
Verticality deviation and its mean value (m)1.03731.03221.03431.02201.0057
1.0263
Reference value of verticality deviation (m)0.9415
Relative error (%) of verticality deviation and its mean value10.139.609.768.506.71
9.45
Allowable verticality deviation (m)0.0605
Disclaimer/Publisher’s Note: The statements, opinions and data contained in all publications are solely those of the individual author(s) and contributor(s) and not of MDPI and/or the editor(s). MDPI and/or the editor(s) disclaim responsibility for any injury to people or property resulting from any ideas, methods, instructions or products referred to in the content.