Article

Advanced Hybrid Modeling of Cementitious Composites Using Machine Learning and Finite Element Analysis Based on the CDP Model

1
Department of Civil Engineering, Sakarya University, 54050 Sakarya, Türkiye
2
Department of Environmental Engineering, Sakarya University of Applied Sciences, 54050 Sakarya, Türkiye
3
Maali Çelik Ar-Ge Danışmanlık Müh. Inş Taah. Tarım ve Hayvancılık Company Atateknokent, 25050 Erzurum, Türkiye
4
Department of Civil Engineering, Erzurum Technical University, 25050 Erzurum, Türkiye
*
Author to whom correspondence should be addressed.
Buildings 2025, 15(17), 3026; https://doi.org/10.3390/buildings15173026
Submission received: 24 July 2025 / Revised: 19 August 2025 / Accepted: 22 August 2025 / Published: 25 August 2025
(This article belongs to the Section Building Energy, Physics, Environment, and Systems)

Abstract

This study aims to investigate the mechanical behavior of cement mortar and concrete through a hybrid approach that integrates artificial intelligence (AI) techniques with finite element modeling (FEM). Support Vector Machine (SVM) models with Radial Basis Function (RBF) and polynomial kernels, along with Multilayer Perceptron (MLP) neural networks, were employed to predict the compressive strength (Fc) and flexural strength (Fs) of cement mortar incorporating nano-silica (NS) and micro-silica (MS). The dataset comprises 89 samples characterized by six input parameters: water-to-cement ratio (W/C), sand-to-cement ratio (S/C), nano-silica-to-cement ratio (NS/C), micro-silica-to-cement ratio (MS/C), and curing age. Simultaneously, the axial compressive behavior of C20-grade concrete was numerically simulated using the Concrete Damage Plasticity (CDP) model in ABAQUS, with stress–strain responses benchmarked against the analytical models proposed by Mander, Hognestad, and Kent–Park. Due to the inherent limitations of the finite element software, it was not possible to define material models incorporating NS and MS; therefore, the simulations were conducted using the mechanical properties of conventional concrete. The SVM-RBF model demonstrated the highest predictive accuracy with RMSE values of 0.163 (R2 = 0.993) for Fs and 0.422 (R2 = 0.999) for Fc, while the Mander model showed the best agreement with experimental results among the FEM approaches. The study demonstrates that both the SVM-RBF and CDP-based modeling approaches serve as robust and complementary tools for accurately predicting the mechanical performance of cementitious composites. Furthermore, this research addresses the limitations of conventional FEM in capturing the effects of NS and MS, as well as the existing gap in integrated AI-FEM frameworks for blended cement mortars.

1. Introduction

Cement mortar is an essential cementitious material with a composite structure that exhibits diverse properties due to the incorporation of different admixtures. The mechanical properties of cement mortars are influenced by multiple parameters, including the water-to-cement ratio (W/C), aggregate-to-cement ratio (Agg/C), age, and the type of admixture [1]. Compressive and flexural strengths are key mechanical properties that govern the structural performance and durability of cement mortar and concrete in construction applications. Each strength parameter plays a specific role in evaluating the material’s capacity to withstand various loads and stresses. Concrete and similar cementitious materials are inherently strong under compressive loading conditions. Fc is defined as the maximum load a material can withstand per unit area under compressive force [2,3]. Materials with higher Fc generally exhibit better resistance to environmental challenges, such as freezing, thawing, and chemical attacks. The Fc of concrete and cement mortar is directly linked to their composition. In recent years, researchers have explored the use of additives in concrete and mortar mixtures to enhance their mechanical properties. In recent years, there has been increasing interest in incorporating nanomaterials, particularly nano-silica (NS) and micro-silica (MS), into cement-based composites due to their superior performance characteristics [4]. NS and MS act as pozzolanic materials, reacting with calcium hydroxide to form C-S-H, which refines the microstructure and enhances compressive strength. NS also improves the paste–aggregate bond, leading to higher flexural strength. The small size of NS and MS particles allows them to fill the pores in the matrix, reducing the overall porosity of the material. This increases the concrete’s density and its resistance to cracking and damage over time. By altering the rheological properties, NS particles improve workability, although the effect can vary with the quantity of NS used [5]. MS, also known as silica fume, improves early-age strength due to its high fineness and reactivity [6]. It enhances the microstructure of concrete, increasing its resistance to chemical attacks, such as sulfate attack and alkali–silica reaction (ASR). Additionally, the reduction in permeability further enhances the material’s durability against water infiltration and reinforcement corrosion. Using MS can mitigate shrinkage and reduce cracking, leading to improved long-term stability of the material. MS improves both strength and durability, but its fine particles may lower workability. To address this, additional water or superplasticizer could be required [7,8]. NS is especially effective in improving early-age strength and reducing porosity, while MS excels at increasing long-term strength and enhancing durability. The finer particles of NS help fill small pores more effectively, contributing to a denser and stronger matrix. MS generally enhances toughness and crack resistance, whereas NS accelerates chemical reactions, improving early-stage performance. Various AI-based methods, such as SVM, MLP, RBF, GEP, GRNN, and fuzzy logic, are increasingly used to predict the mechanical properties of concrete and cement mortar [9]. SVM and MLP are widely recognized for their accuracy in modeling and predicting the compressive and flexural strengths of different concrete and cement mortar types [10]. MLP and SVM have shown strong potential for accurately predicting concrete and mortar strength [11,12]. SVM is a supervised AI method used for classification and regression, known for its high accuracy in prediction and outlier detection. SVM involves training and testing phases and, unlike RBF and MLP networks that minimize errors, it minimizes classification risk by constructing an N-dimensional hyperplane to separate data into two classes. SVM models resemble neural networks, using a sigmoid kernel similar to a dual-layer NN, while MLP is a popular ANN architecture excelling in supervised learning tasks like classification and regression. Its proficiency in modeling complex and nonlinear relationships makes it a valuable tool for engineering problems, such as predicting the strength of concrete and cement mortar. MLP has shown superior performance compared to traditional regression methods due to its ability to capture complex interactions in the data. MLP is a structured ANN effective for prediction. This study is the first to simultaneously model the Fc and Fs of cement mortar containing NS and MS using SVM, MLP, and finite element modeling. Machine learning (ML) is increasingly used in civil engineering because traditional empirical methods often cannot accurately capture the complex, nonlinear influences of factors like W/C ratio, admixtures, curing age, and aggregates on cementitious materials. To address these challenges, ML tools have emerged as robust and reliable predictive frameworks. Among the various ML techniques, ANN, MLP and SVM are particularly notable for their ability to model highly complex and nonlinear systems. These methods provide more accurate and versatile predictions compared to conventional regression-based models, especially when dealing with large datasets or datasets with irregular patterns. Researchers have applied AI and ML algorithms to predict mechanical properties of concrete and mortar and their use in civil and structural engineering.
Jueyendah et al. [13] demonstrated that SVR effectively predicts the Fc and Fs of cement mortar. Jueyendah and Humberto Martins [14] developed a hybrid SVM-RBF and optimization method for reliable, adaptable welded structure design. Jueyendah et al. [15] conducted a comparative study of linear and nonlinear ML algorithms for cement mortar strength estimation and showed that NN_tanh_lbfgs achieved the best predictive performance (R2 = 0.9946). Dong [11] showed MLP effectively predicts high-performance concrete’s compressive strength by capturing complex input-property relationships. Alhassan et al. [16] demonstrated that the SRG bond capacity is governed by fabric width, displacement rate, and load eccentricity, while their ANN model achieved excellent predictive accuracy (R2 > 0.95). Bayram et al. [17] compared MLP and RBF neural networks for construction cost estimation in Türkiye, demonstrating their effectiveness in modeling complex costs. Ghazanfari et al. [18] assessed concrete strength and workability using GMDH and MLP methods. Eskandari and Kazemi [19] used ANN to show that including cement strength class improves compressive strength predictions of hardened mortar. Nasir Amin et al. [20] studied waste glass powder’s effect on cement mortar’s Fs using experiments and ML. Saridmir [21] employed ANN and fuzzy logic techniques to predict the Fc of cement mortar containing metakaolin. The Fc of self-compacting concrete (SCC) containing fly ash was predicted by Siddique et al. [22] using ANN. Alahmari et al. [23] predicted the Fc of fiber-reinforced self-consolidating concrete using a hybrid ML approach. Maabreh and Almasabha [24] evaluated and predicted the shear strength of deep steel fiber-reinforced concrete beams (SFRC-DBs) without stirrups using ML techniques. Salah Jamal and Najah Ahmed [25] used ML to estimate high-performance concrete’s Fc, finding Bayesian optimization and more K-folds improved model accuracy. Van Thi Mai et al. [26] compared Decision Tree, LightGBM, and XGBoost to predict Fc of fiber-reinforced self-compacting concrete, with XGBoost showing the best performance and stability. Kashem et al. [27] predicted the Fc of ultra-high-performance concrete using hybrid data-driven methods, employing SHAP and PDP analyses. Kashem et al. [28] predicted the Fc prediction of sustainable concrete incorporating rice husk ash (RHA) using hybrid ML algorithms and parametric analyses. Shafighfard et al. [29] applied a chained ML model to predict the load capacity and ductility of steel fiber–reinforced concrete beams. F. Isleem et al. [30] employed finite element models (FEMs), along with both traditional and innovative ML techniques, to develop accurate models for predicting the bearing capacity and ultimate limit strain of structures under axial loads. Raju et al. [31] utilized ML techniques to accurately predict the Fc of pozzolanic concrete. Tahir Altuncı [32] conducted comprehensive analyses to predict the Fc of concrete using ML models. Ali and Suthar [33] used RF and M5P algorithms to predict compressive strength of concrete with solid wastes, with RF outperforming M5P. Jain et al. [34] used ML techniques to analyze and predict the properties of plastic waste composite building materials. Guan et al. [35] utilized ML strategies to evaluate the influence of waste marble and glass powder on the Fc of self-compacting concrete. A. Iannuzzo [36] used a neural network-based automated methodology to identify the causes of cracks in masonry structures. Megahed et al. [37] employed ML models to estimate the capacity of rectangular concrete-filled steel tubular columns. Biswas et al. [38] predicted the Fc of fly ash-based concrete using a novel deep neural network. Alghrairi et al. [39] used ML-based methods to estimate the Fc of nanomaterial-modified lightweight concrete. In addition to the machine learning models, this study incorporates finite element modeling (FEM) using the Concrete Damage Plasticity (CDP) approach in ABAQUS to simulate the nonlinear compressive behavior of concrete. The CDP model enables the representation of complex failure mechanisms, including cracking under tension and crushing under compression, which are essential for realistically predicting the structural response of cementitious composites under axial loads. By applying established constitutive models such as Mander, Hognestad, and Kent–Park, this approach provides an in-depth understanding of the stress–strain behavior, damage evolution, and post-peak ductility of conventional concrete. While the current simulation excludes NS and MS due to software limitations, FEM serves as a robust comparative tool to complement the AI-based predictions and validate experimental trends. This research is the first to integrate artificial intelligence (SVM and MLP) with finite element modeling using the CDP approach in ABAQUS to simultaneously predict the Fc and Fs of cement mortars incorporating NS and MS. While previous studies have focused on either AI or FEM approaches individually, this study adopts a hybrid methodology that leverages the predictive power of data-driven models and the mechanistic insights of FEM. Due to software limitations in representing NS/MS at the material level, the AI-FEM integration offers a practical alternative that enhances both interpretability and modeling scope. By coupling statistical learning (SVM and MLP) with mechanics-based simulation (CDP), the proposed framework not only improves prediction accuracy but also provides a multi-scale understanding of stress–strain behavior and damage evolution in cementitious composites. This interdisciplinary methodology addresses a critical gap in the literature and offers both practical and theoretical advancements in modeling modern blended mortars. In recent studies, the integration of AI and FEMs has shown promising results in predicting the mechanical behavior of cement-based materials. For instance, the SVM-RBF model demonstrated the highest predictive accuracy, achieving RMSE values of 0.163 (R2 = 0.993) for Fs and 0.422 (R2 = 0.999) for Fc. Among the FEM-based models, the Mander model exhibited the best agreement with experimental results, particularly in capturing confined concrete behavior under axial loading.

2. Data Description

A total of 12 cylindrical concrete specimens, each measuring 100 mm in diameter and 200 mm in height, were prepared and cast in the civil engineering laboratories at Sakarya university. The specimens were demolded 24 h after casting and then cured in a water tank for 28 days to facilitate proper hydration and strength development. After the curing period, the specimens were removed from the water tank and air-dried for 24 h prior to testing. Sulfur capping was applied to the loading surfaces to ensure uniform stress distribution during compressive loading. The capping compound was prepared by melting a mixture of 70% yellow sulfur and 30% graphite powder at 300 °C, producing a smooth and level surface to facilitate effective load transfer (Figure 1). Uniaxial compressive loading was applied to the specimens at a constant displacement rate of 4 mm/min, continuing until failure occurred.
Figure 1 illustrates the preparation process of the cylindrical concrete specimens used in this study. Each specimen has a diameter of 100 mm and a height of 200 mm. The demolded cylinders are shown 24 h after casting, ready for curing in a water tank for 28 days. Sulfur capping, made from 70% yellow sulfur and 30% graphite powder, is applied to the top and bottom surfaces to ensure uniform stress distribution. The smooth, leveled surfaces of the capped specimens facilitate effective load transfer during uniaxial compressive testing. In this study, 30 flexural data and 59 compressive data were collected from article [40]. Inputs are W/C, S/C, NS/C, MS/C, and age; outputs are Fc and Fs, as shown in Table 1. This study used DTREG software (v8.6; DTREG, USA, https://www.dtreg.com/, accessed 21 August 2025) to predict Fc and Fs of cement mortar containing NS and MS, employing various models such as SVM, neural networks, GMDH, and genetic programming for data analysis and prediction. DTREG supports time series analysis and uses grid search and pattern search to optimize model parameters [41]. Grid search evaluates parameter values across the search area, while pattern search explores steps from the center. Models were built using SVM (RBF and polynomial kernels) and MLP, with 80% of data for training and 20% for testing. The input and output parameters considered in the statistical analysis are indicated in Table 1.
Table 1 summarizes the statistical characteristics of both input and output parameters used in the compressive and flexural strength datasets. The input parameters include water-to-cement ratio (W/C), sand-to-cement ratio (S/C), nano-silica-to-cement ratio (NS/C), micro-silica-to-cement ratio (MS/C), and age. W/C values vary between 0.396 and 0.632 for compressive data and 0.380–0.632 for flexural data, showing slightly lower averages in flexural mixes. S/C ranges from 2.220 to 4.492 for compressive data and from 2.222 to 4.650 for flexural data, with higher mean values observed in flexural specimens. NS/C is included up to 0.110% in compressive mixes and 0.111% in flexural mixes, indicating relatively low dosages of nano-silica. MS/C extends up to 0.388% in both datasets, with compressive data showing a slightly higher mean compared to flexural data. The age parameter, recorded only for compressive tests, ranges between 3 and 28 days with an average of 14.7 days. The output parameter for compressive data is the 28-day compressive strength (Fc28), which shows a wide range from 5.65 MPa to 87.90 MPa. For flexural data, the output parameter is the 28-day flexural strength (Fs28), ranging between 3.60 MPa and 9.21 MPa. Table 1 reflects a broad variability in mix proportions and mechanical performance, providing a reliable basis for statistical analysis and predictive modeling.

3. Methods

In this study, Support Vector Machines (SVM) and Multi-Layer Perceptrons (MLP) were selected based on their effectiveness in handling small-to-medium-sized datasets and modeling nonlinear relationships. SVM provides strong generalization performance and is particularly well-suited for limited data scenarios due to its margin-maximizing nature. MLP, as a feedforward neural network, offers flexibility in approximating complex patterns with relatively low computational demands. In contrast, ensemble models such as random forests and gradient boosting can be more prone to overfitting in small datasets without extensive tuning. Convolutional neural networks (CNNs), while powerful for spatial data, are not optimal for structured tabular inputs and require substantially larger datasets. Therefore, SVM and MLP were identified as the most appropriate models for predicting the mechanical properties of NS/MS-modified cementitious composites in this study. All input variables—water-to-cement ratio (W/C), sand-to-cement ratio (S/C), nano-silica-to-cement ratio (NS/C), micro-silica-to-cement ratio (MS/C), and curing age—were normalized using min-max scaling to a [0, 1] range. This step ensures that no single feature dominates model training due to scale differences. Feature selection was based on domain knowledge and prior literature, and therefore automated methods were not applied. Each of the five selected parameters is known to influence the mechanical behavior of cementitious composites, and excluding any of them could compromise the predictive performance, especially given the limited dataset size. Hyperparameter tuning was conducted to enhance model performance and avoid overfitting. For the SVM models (with RBF and polynomial kernels), grid search was employed to optimize the penalty parameter (C), kernel coefficient (γ), epsilon (ε), and polynomial degree (d). For the MLP model, architectural elements—including the number of hidden layers, neurons per layer, and activation functions—were optimized through iterative experimentation using DTREG software. To ensure robustness and generalizability, 10-fold cross-validation was applied to the training data, helping to mitigate overfitting and evaluate the stability of model performance.

3.1. Support Vector Machine

SVM is a popular method for data classification that finds an optimal separating hyperplane with maximum margin using quadratic programming [42]. For nonlinear data, SVM uses kernel functions to map data into higher-dimensional spaces where it becomes linearly separable. SVM classifies data by finding the optimal hyperplane with the maximum margin, using support vectors—data points closest to this boundary. For nonlinear data, slack variables handle misclassifications. Compared to other neural networks, SVM offers a stronger theoretical foundation, better performance, and clear geometric interpretation, making it a cost-effective alternative to extensive experiments [43]. This fact proves that SVM is one of the advanced methods for data mining and machine learning, along with some other soft computational methods, such as fuzzy systems and NNs. SVM is essentially introduced by Boser et al. [44,45], and was the first time offered at the computational learning conference (COLT) at 1992. The basic properties of this approach are now available in the literature and have been used in machines learning such as large margin hyper plane in the entrance space since the 1960s [45,46]. The support vector model (SMV) has been used in many engineering applications such as civil engineering [47]. There are two margins in SVM, which is the soft and hard margin. The hard margin cannot be applied in related software because the upper bound of this type of margin is not defined. The soft margin classification for the first time by Cortes and Vapnik generalized for nonlinear states. In 1995, the SVM algorithm expanded to the regression model. Support Vector Regression (SVR), a type of SVM, models and predicts continuous functions in both linear and nonlinear forms. It uses kernels like RBF, linear, polynomial, and sigmoid. SVR’s ε-insensitive loss function ignores errors within a set margin around the predicted value. The linear ε -insensitive loss function L ( t i , y i ) which shown in Equation (1).
L ε ( t i , y i ) = 0 t i y i ε ζ i = t i y i ε otherwise
where ti is desired output, y is real value function (model output), ε (insensitive loss function) denotes the difference between desired output and model output, ζ is the cost of not categorizing correctly. The quadratic ε insensitive loss function is defined as shown in Equation (2).
L 2 ε ( t i , y i ) = 0 t i y i 2 ε ζ i = t i y i 2 ε otherwise
Equation (3) shows the primal form of SVR which should be changed it to dual form:
min 1 2 w T w + c i N ( ζ i + ζ i + ) s u b j e c t   t o t i + y i + ε + ζ i + 0 , t i y i + ε + ζ i 0 & ζ i , ζ i + 0 i
The operational risk formula can be expressed as shown in Equation (4).
R e m p = 1 N i = 1 N ( ζ i + + ζ i )
In the above equations N is number of training data. The solution to the problem of optimization can be found by transforming it into a dual problem. To this end, the Lagrange formula can be applied as shown in Equation (5).
y = w T x + b = i = 1 n S V ( α i + α i ) x i T x + b = i = 1 n S V ( α i + α i ) k ( x i , x ) + b s u b j e c t . t o 0 α i + c , 0 α i c
where y, w, c, k b and nSV indicate the real value function, normal vector, penalty coefficient, kernel function, real constant, and number of support vectors, respectively. The accuracy of the model and the results depends on parameters of coefficient (c), epsilon (ε), the degree of the polynomial (d) and gamma (γ). Choosing the type of kernel function is also very effective for model accuracy. For instance, the RBF kernel function is more accurate and gives better results than other types of kernels. Linear, polynomial, RBF and sigmoid kernels of SVM are given in Equations (6)–(9)
k ( x i , x j ) = x i T x j
k ( x i , x j ) = ( 1 + x i T x j ) p
k ( x i , x j ) = exp ( 1 2 σ 2 x i x j 2 )
k ( x i , x j ) = φ ( β 0 + β 1 x i T x j )
where xi, xj, σ, d, β, β0 and φ indicate the training, test patterns, the global basis function width, dimension of the input vector, coefficients of sigmoid kernel and tangent hyperbolic, respectively.

3.2. Multilayer Perceptron Neural Network

A multilayer perceptron (MLP) is a type of artificial neural network consisting of multiple layers of nodes (neurons), with each layer connected to the next by weighted connections. Widely applied in classification, regression, and pattern recognition, the MLP usually consists of three types of layers: The input layer receives features (parameters) from the dataset, with each neuron representing a single input variable. These hidden layers perform computations by applying a weighted sum of the inputs, followed by an activation function. An MLP can consist of one or more hidden layers, with the number of neurons in each layer adjustable to match the complexity of the problem. The output layer is the final layer of the network, generating predictions or classification results based on the transformations carried out by the previous layers. MLPs use backpropagation as a training algorithm, where weights are iteratively updated to minimize the error between the predicted and actual outputs. Activation functions, such as ReLU and sigmoid, are applied in the hidden layers to introduce nonlinearity, enabling the network to model complex relationships between input and output variables. MLP neural networks are increasingly applied in civil engineering for tasks such as material prediction, structural monitoring, optimization, and risk assessment. Their ability to model complex, nonlinear relationships makes them valuable tools for enhancing the efficiency and safety of civil engineering projects. However, successful implementation requires careful consideration of data quality, interpretability, and computational resources. MLPs require large, high-quality datasets for training, which can be challenging in civil engineering, where data may often be limited or noisy [48]. MLPs can automate complex tasks such as damage detection, cost estimation, and design optimization, helping to save time and reduce human error. MLPs can achieve high accuracy in predicting outcomes from large datasets, particularly when the system is too complex for traditional analytical methods.

3.3. Statistical Parameters for Model Evaluation

The models were evaluated using the coefficient of determination (R2), root mean square error (RMSE), mean square error (MSE), and the mean absolute percentage error (MAPE) are used by Equations (10)–(12). R2 is a statistical metric that measures the accuracy of predictions by comparing the predicted values with the actual data. It represents the proportion of the variance in the dependent variable that is explained by the independent variable, and it ranges from 0 to 1. A higher R2 value indicates greater prediction accuracy. RMSE evaluates the quality of a regression model by measuring the square root of the MSE, which represents the average squared differences between predicted and actual values. RMSE always produces non-negative values, and lower MSE and RMSE values indicate higher model accuracy. On the other hand, MAPE quantifies the prediction error as a percentage, calculated by averaging the differences between actual and predicted values. A lower MAPE value signifies better prediction accuracy.
R 2 = 1 i = 1 n ( y i p i ) i = 1 n ( y i y i )
M S E = 1 n i = 1 n ( y i p i ) 2 , R M S E = M S E
M A P E = 1 n i = 1 n y i p i y i
where n, y, p, and y represent the total number of data (observations), the experimental (actual) value, the predicted response value, and the mean of the actual values, respectively.

3.4. Finite Element Model Development

A three-dimensional finite element model was developed using Abaqus/Standard 2025 (Dassault Systems, USA, https://www.3ds.com/, accessed 21 August 2025) to simulate the compressive response of the composite specimens under experimental loading conditions. The CDP model available in the ABAQUS 2025 material library was selected due to its capability to accurately capture the crushing and cracking behavior of concrete under compressive loading.

3.4.1. Implementation of the CDP Model

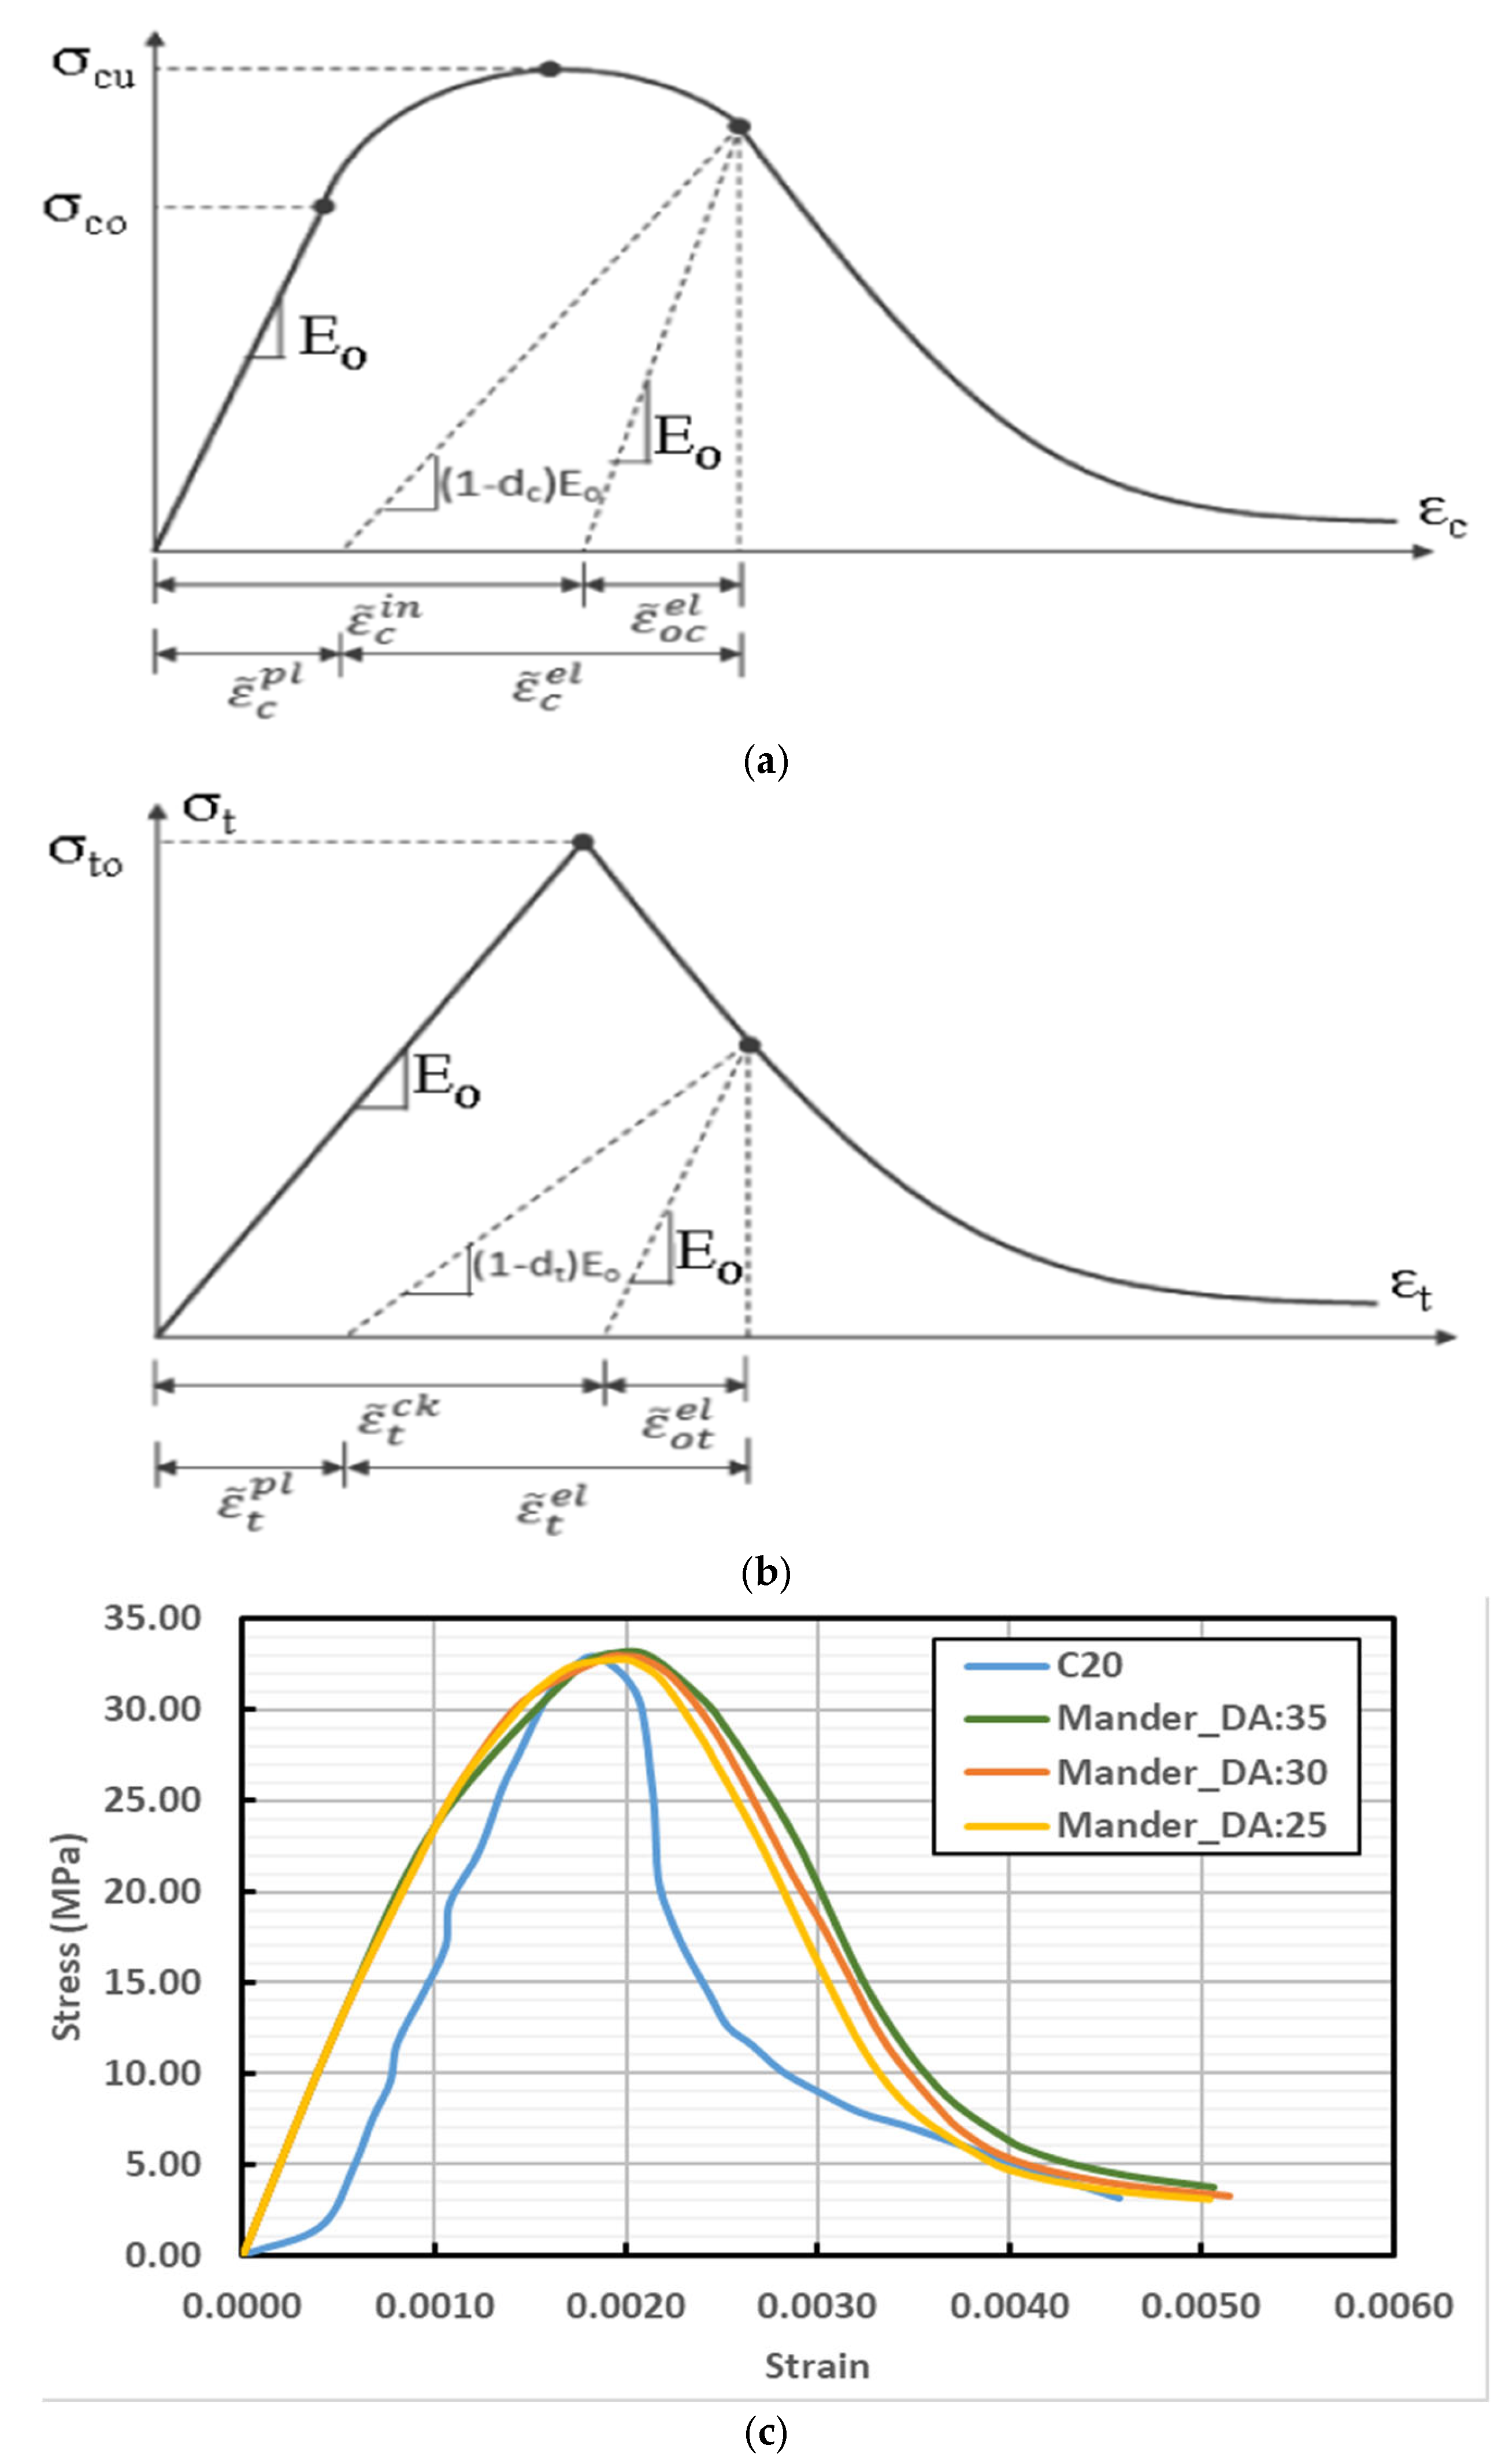
Concrete demonstrates complex nonlinear behavior under compressive loading, which is most effectively captured through constitutive modeling approaches based on damage mechanics, plasticity theory, or an integrated damage-plasticity framework. In this study, the CDP model was employed due to its ability to incorporate both damage evolution and plastic deformation mechanisms. Although the model does not explicitly track discrete crack propagation at the integration points, it captures tensile cracking behavior by assuming that cracking initiates once the maximum principal strain exceeds zero. Plastic deformation denotes the irreversible strain remaining after unloading, while damage manifests as a reduction in elastic stiffness. CDP model considers two primary failure modes: compressive crushing and tensile cracking of concrete. Two damage variables for tension and compression, ranging from zero (undamaged) to one (complete loss of strength), describe the degradation of elastic stiffness along the stress–strain curve. Figure 2a,b illustrates the concrete response, with the CDP model capturing its inelastic behavior by integrating isotropic damage and isotropic tensile and compressive plasticity concepts. Figure 2 shows the concrete CDP model under tension and compression. Figure 2a,b shows the compressive and tensile behaviors, capturing nonlinear inelastic response and crack initiation. Figure 2c,d shows the effects of varying the dilation angle and the mesh sensitivity analysis, highlighting the model’s accuracy and computational efficiency.
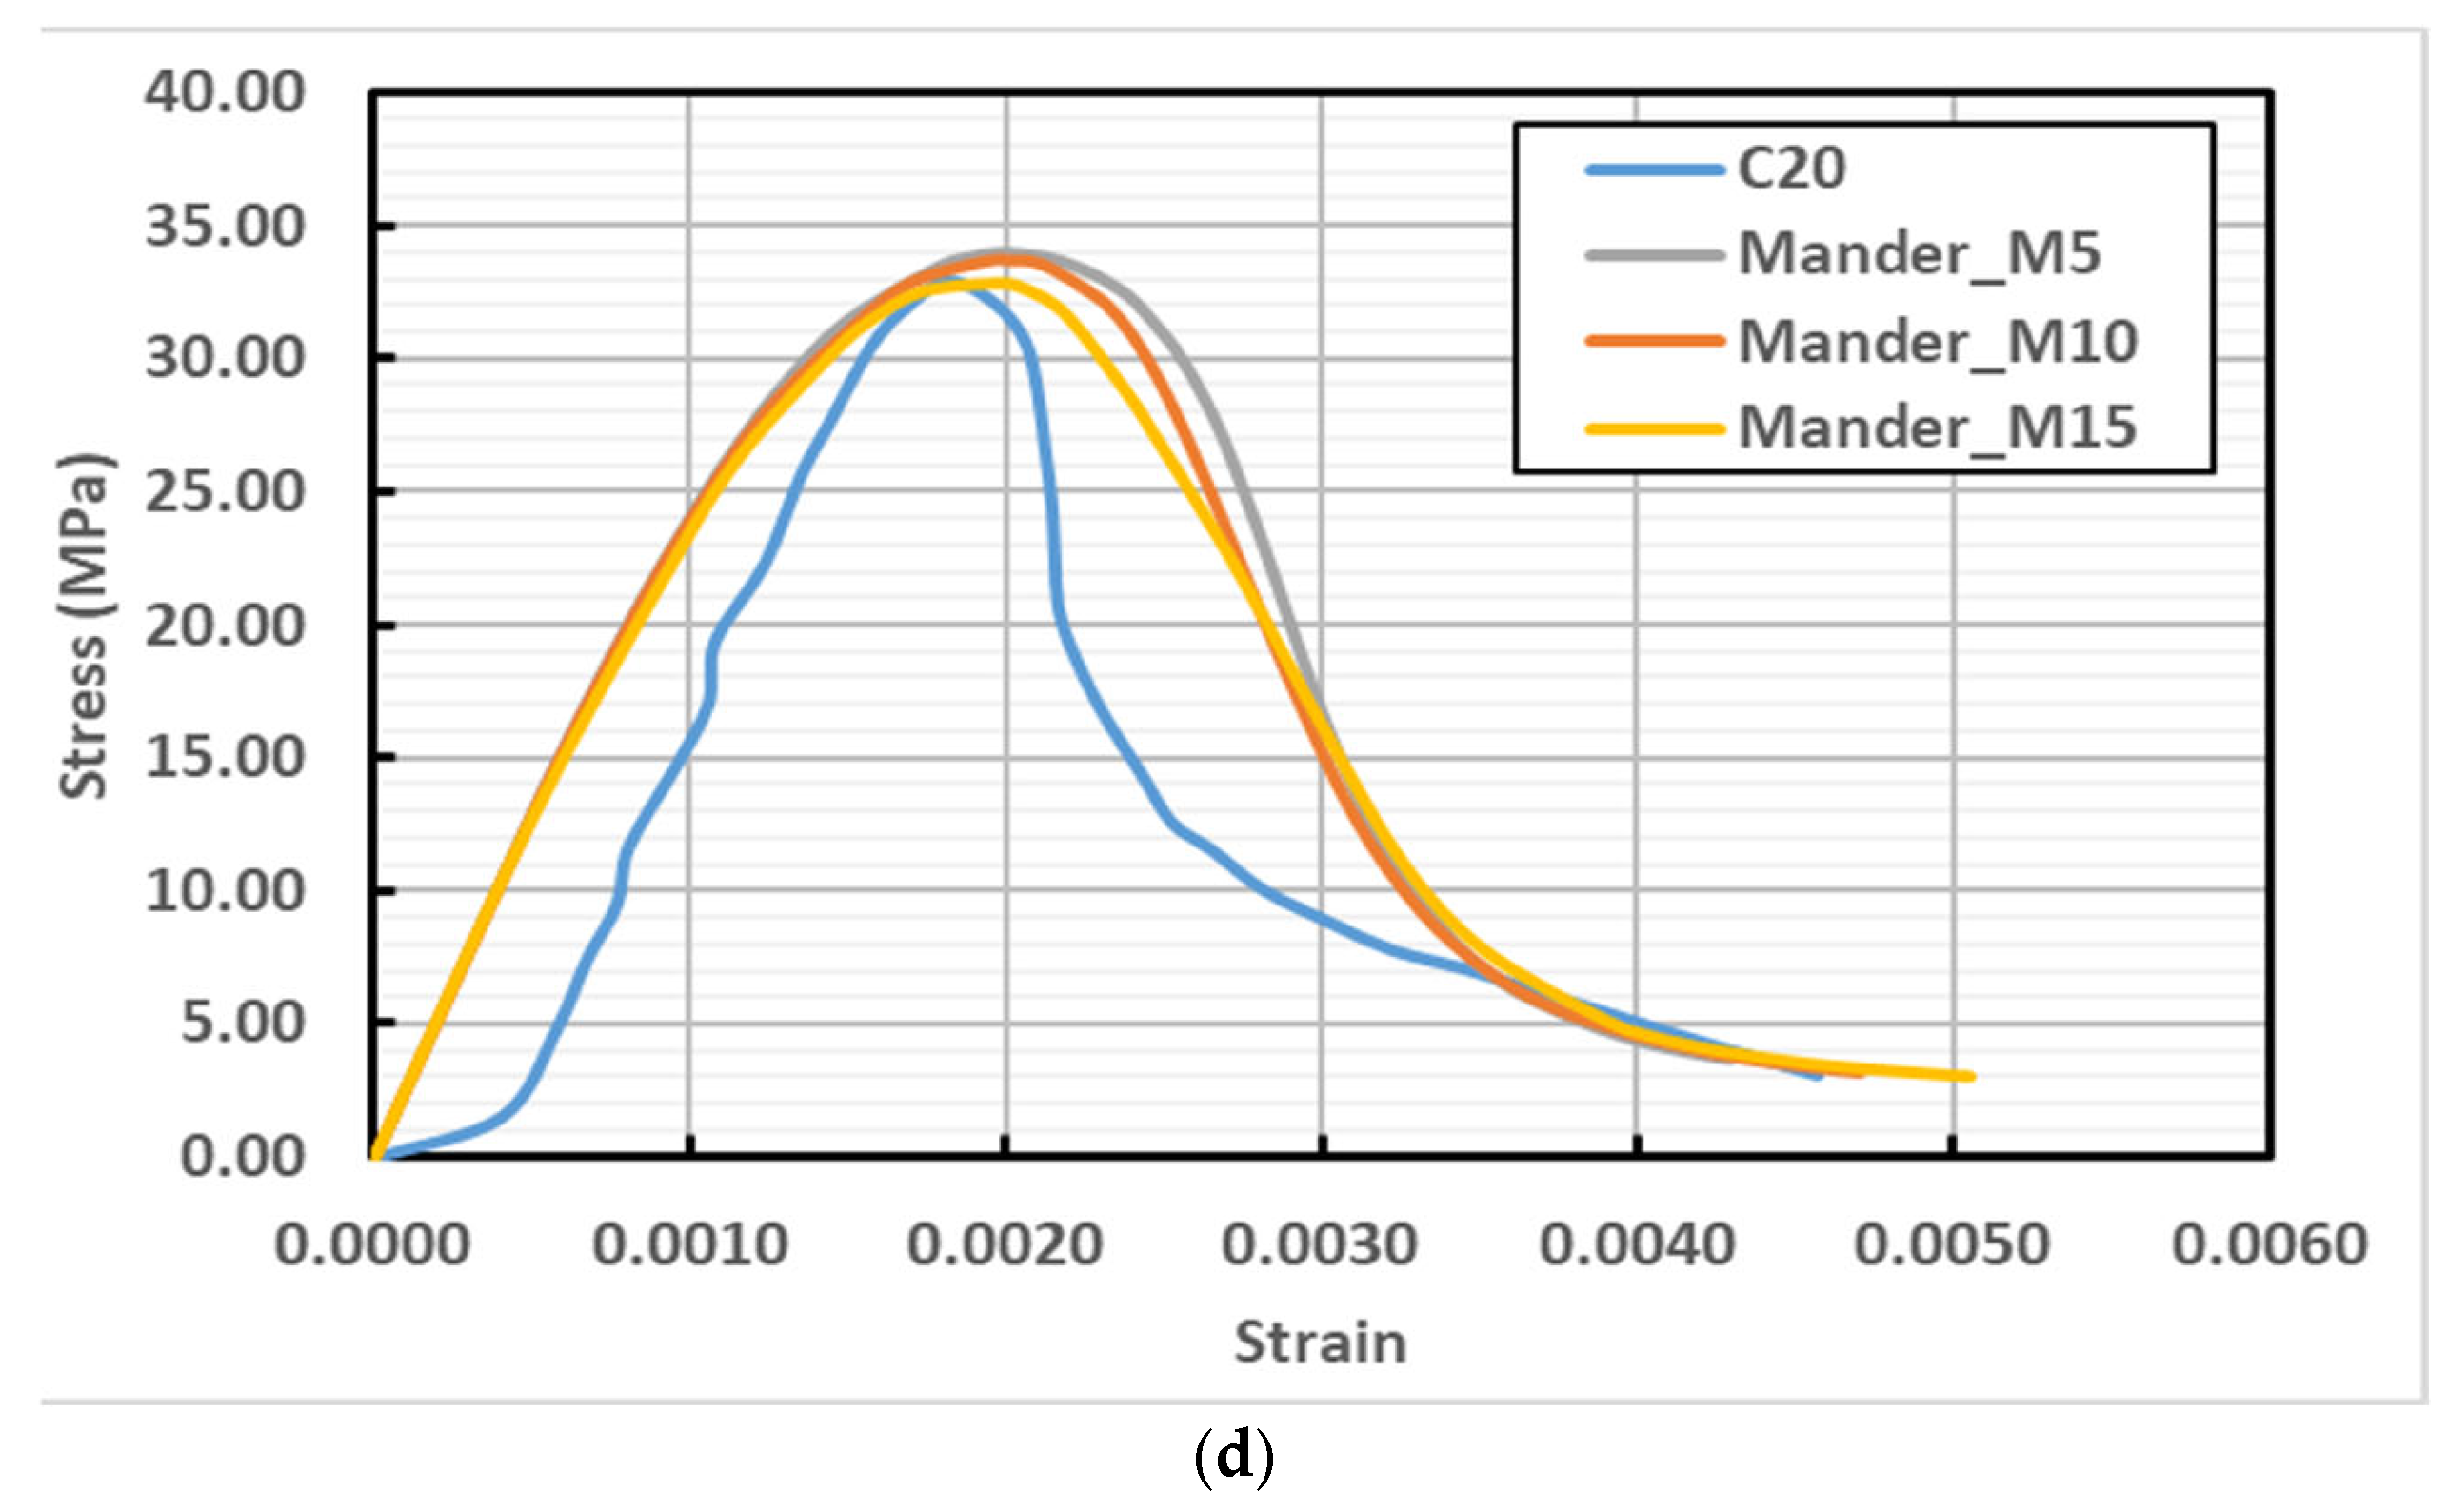
Figure 2 illustrates the behavior and key analyses of the concrete CDP model under tension and compression. Figure 2a shows the compressive response of concrete, capturing nonlinear inelastic behavior, including plastic deformation and stiffness degradation. Figure 2b presents the tensile behavior, highlighting the initiation of cracking when the maximum principal strain exceeds zero, as represented by the damage variable. Figure 2c depicts the effect of varying the dilation angle on the model’s response, demonstrating that changes in this parameter have negligible influence, which justified using the default value of 30° for subsequent simulations. Figure 2d presents the results of the mesh sensitivity analysis using eight-node reduced integration brick elements (C3D8R) with element sizes of 5 mm, 10 mm, and 15 mm, showing that the 15 mm mesh provides a good balance between computational efficiency and accuracy. Together, these subfigures validate the CDP model’s ability to capture the essential mechanical behavior of concrete while ensuring reliable finite element simulations.

3.4.2. Key Parameters of the CDP Model

The essential parameters defining the yield surface and flow rule in the CDP model comprise the dilation angle (ψ) in degrees, the eccentricity of the plastic potential surface (ε), the ratio of initial biaxial to uniaxial compressive yield stresses (σb0c0), and the shape factor (Kc) governing the yield surface geometry in the deviatoric plane. The default values of 30, 0.1, 1.16, and 2/3 were assigned to these parameters, with particular focus on optimizing the dilation angle; however, sensitivity analysis indicated that variations in this parameter had negligible impact on the results, leading to the adoption of the default 30 value for subsequent analyses (Figure 2c). Eight-node reduced integration brick elements (C3D8R) were employed to model the concrete and steel components, and mesh sensitivity analysis was conducted using element sizes of 5 mm, 10 mm, and 15 mm, with the 15 mm mesh—featuring an aspect ratio of one—identified as optimal based on a balance between computational efficiency and agreement with experimental results (Figure 2d). Supports were fully fixed at the base, and displacement-controlled loading was applied incrementally to the top surface, with reaction forces and mid-point displacements recorded at each step to replicate the experimental setup.

3.4.3. Uniaxial Material Characteristics of Concrete

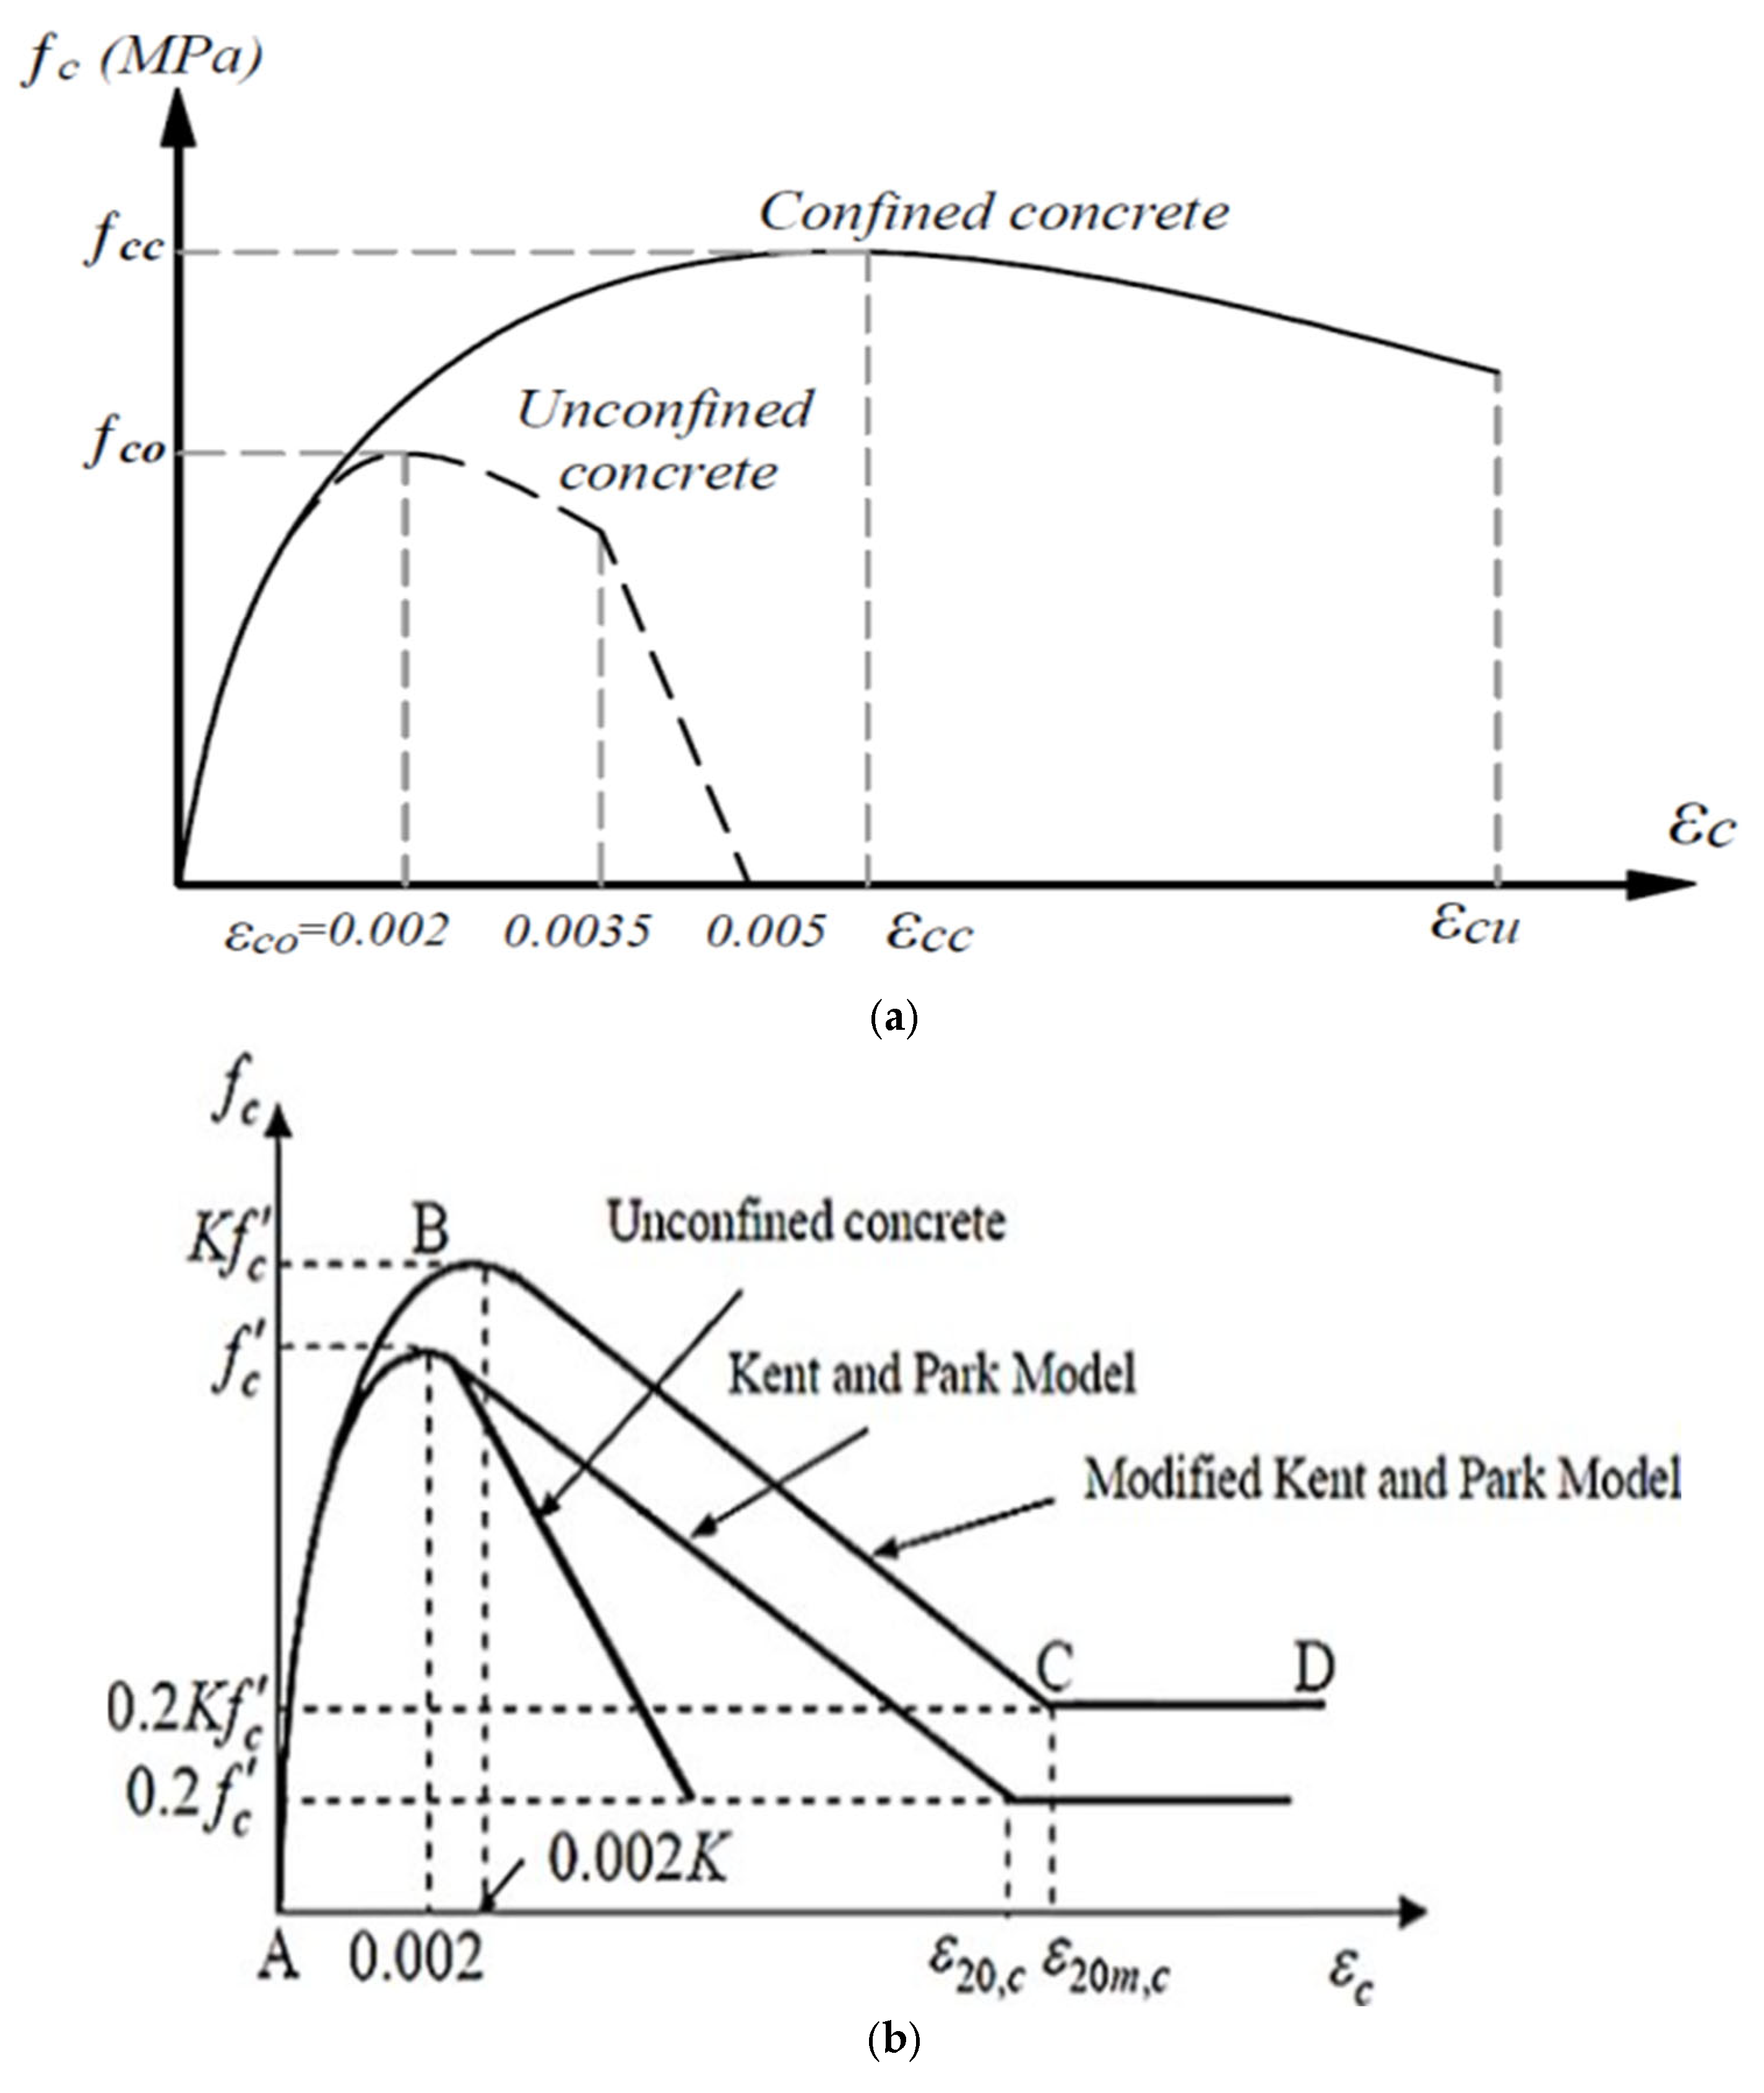
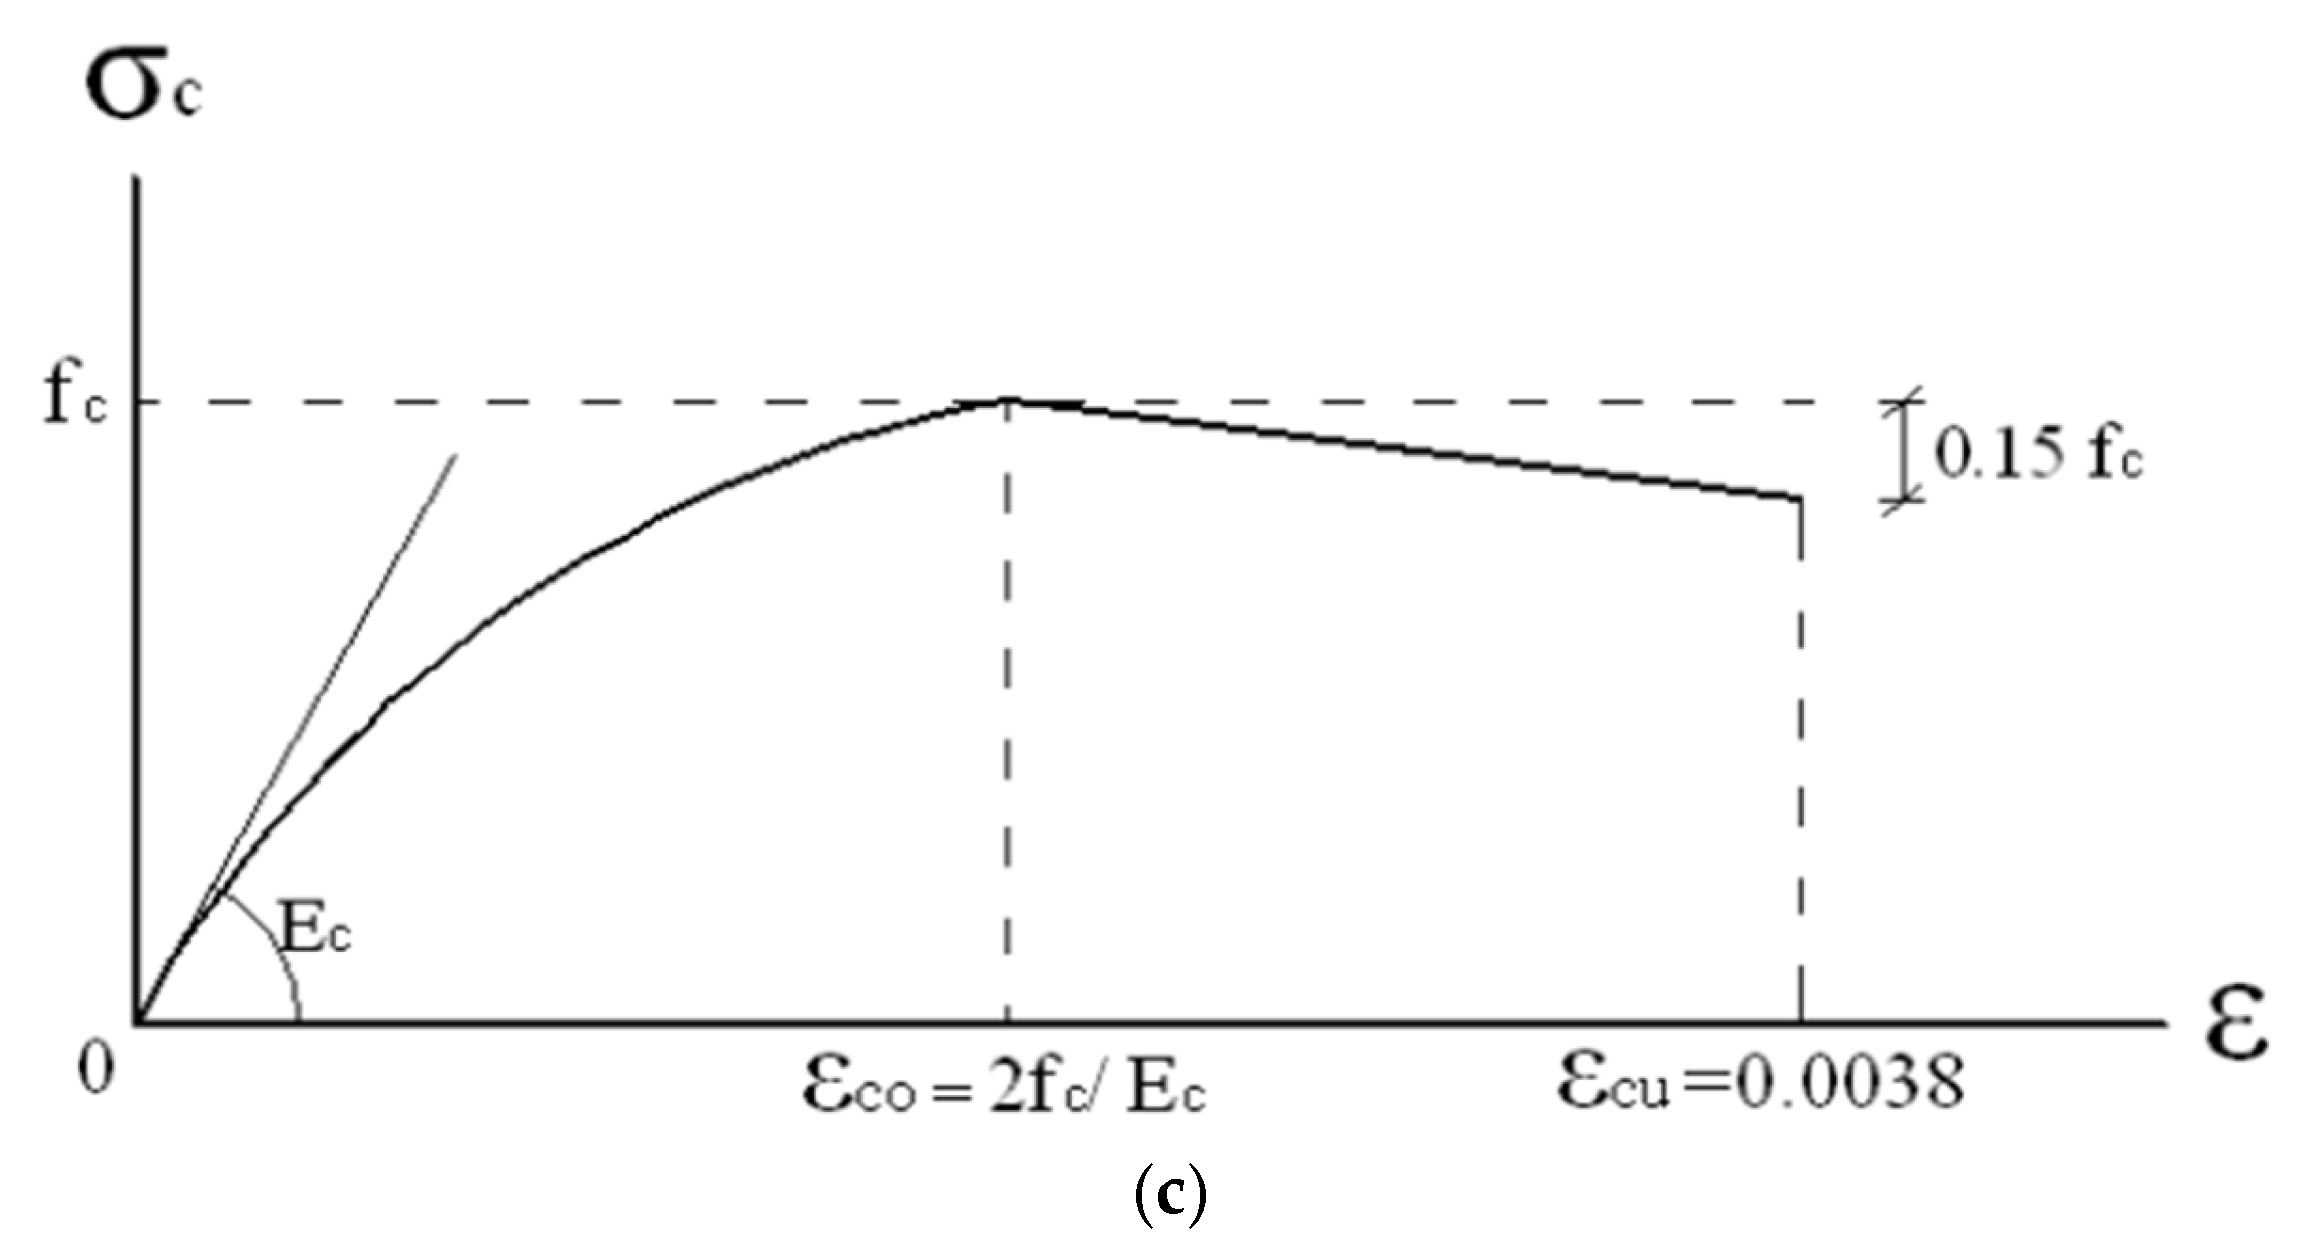
Concrete’s uniaxial stress–strain behavior in tension and compression was characterized using well-established models from the literature, where the compressive response—capturing nonlinear behavior—is represented by parabolic ascending and descending branches according to the formulations of Mander, Kent–Park, and Hognestad. Figure 3a–c presents the stress–strain curves from these models, while tensile behavior was represented by a bilinear model (Figure 4a) with fracture characterized by the crack opening displacement, defined as the energy required to form a unit crack area. The tensile fracture energy (GF), calculated as a function of compressive strength (fc) and a coefficient related to aggregate size (GF0), alongside the CDP model’s yield surface incorporating tensile and compressive failure (Figure 4b), was calibrated together with dilation angle, mesh sensitivity, and aggregate size parameters to ensure numerical stability and accuracy for each concrete model. Figure 3 shows models of concrete behavior under uniaxial compression. Figure 3a is the Mander Concrete model, Figure 3b is the Kent and Park Concrete model, and Figure 3c is the Hognestad Concrete model.
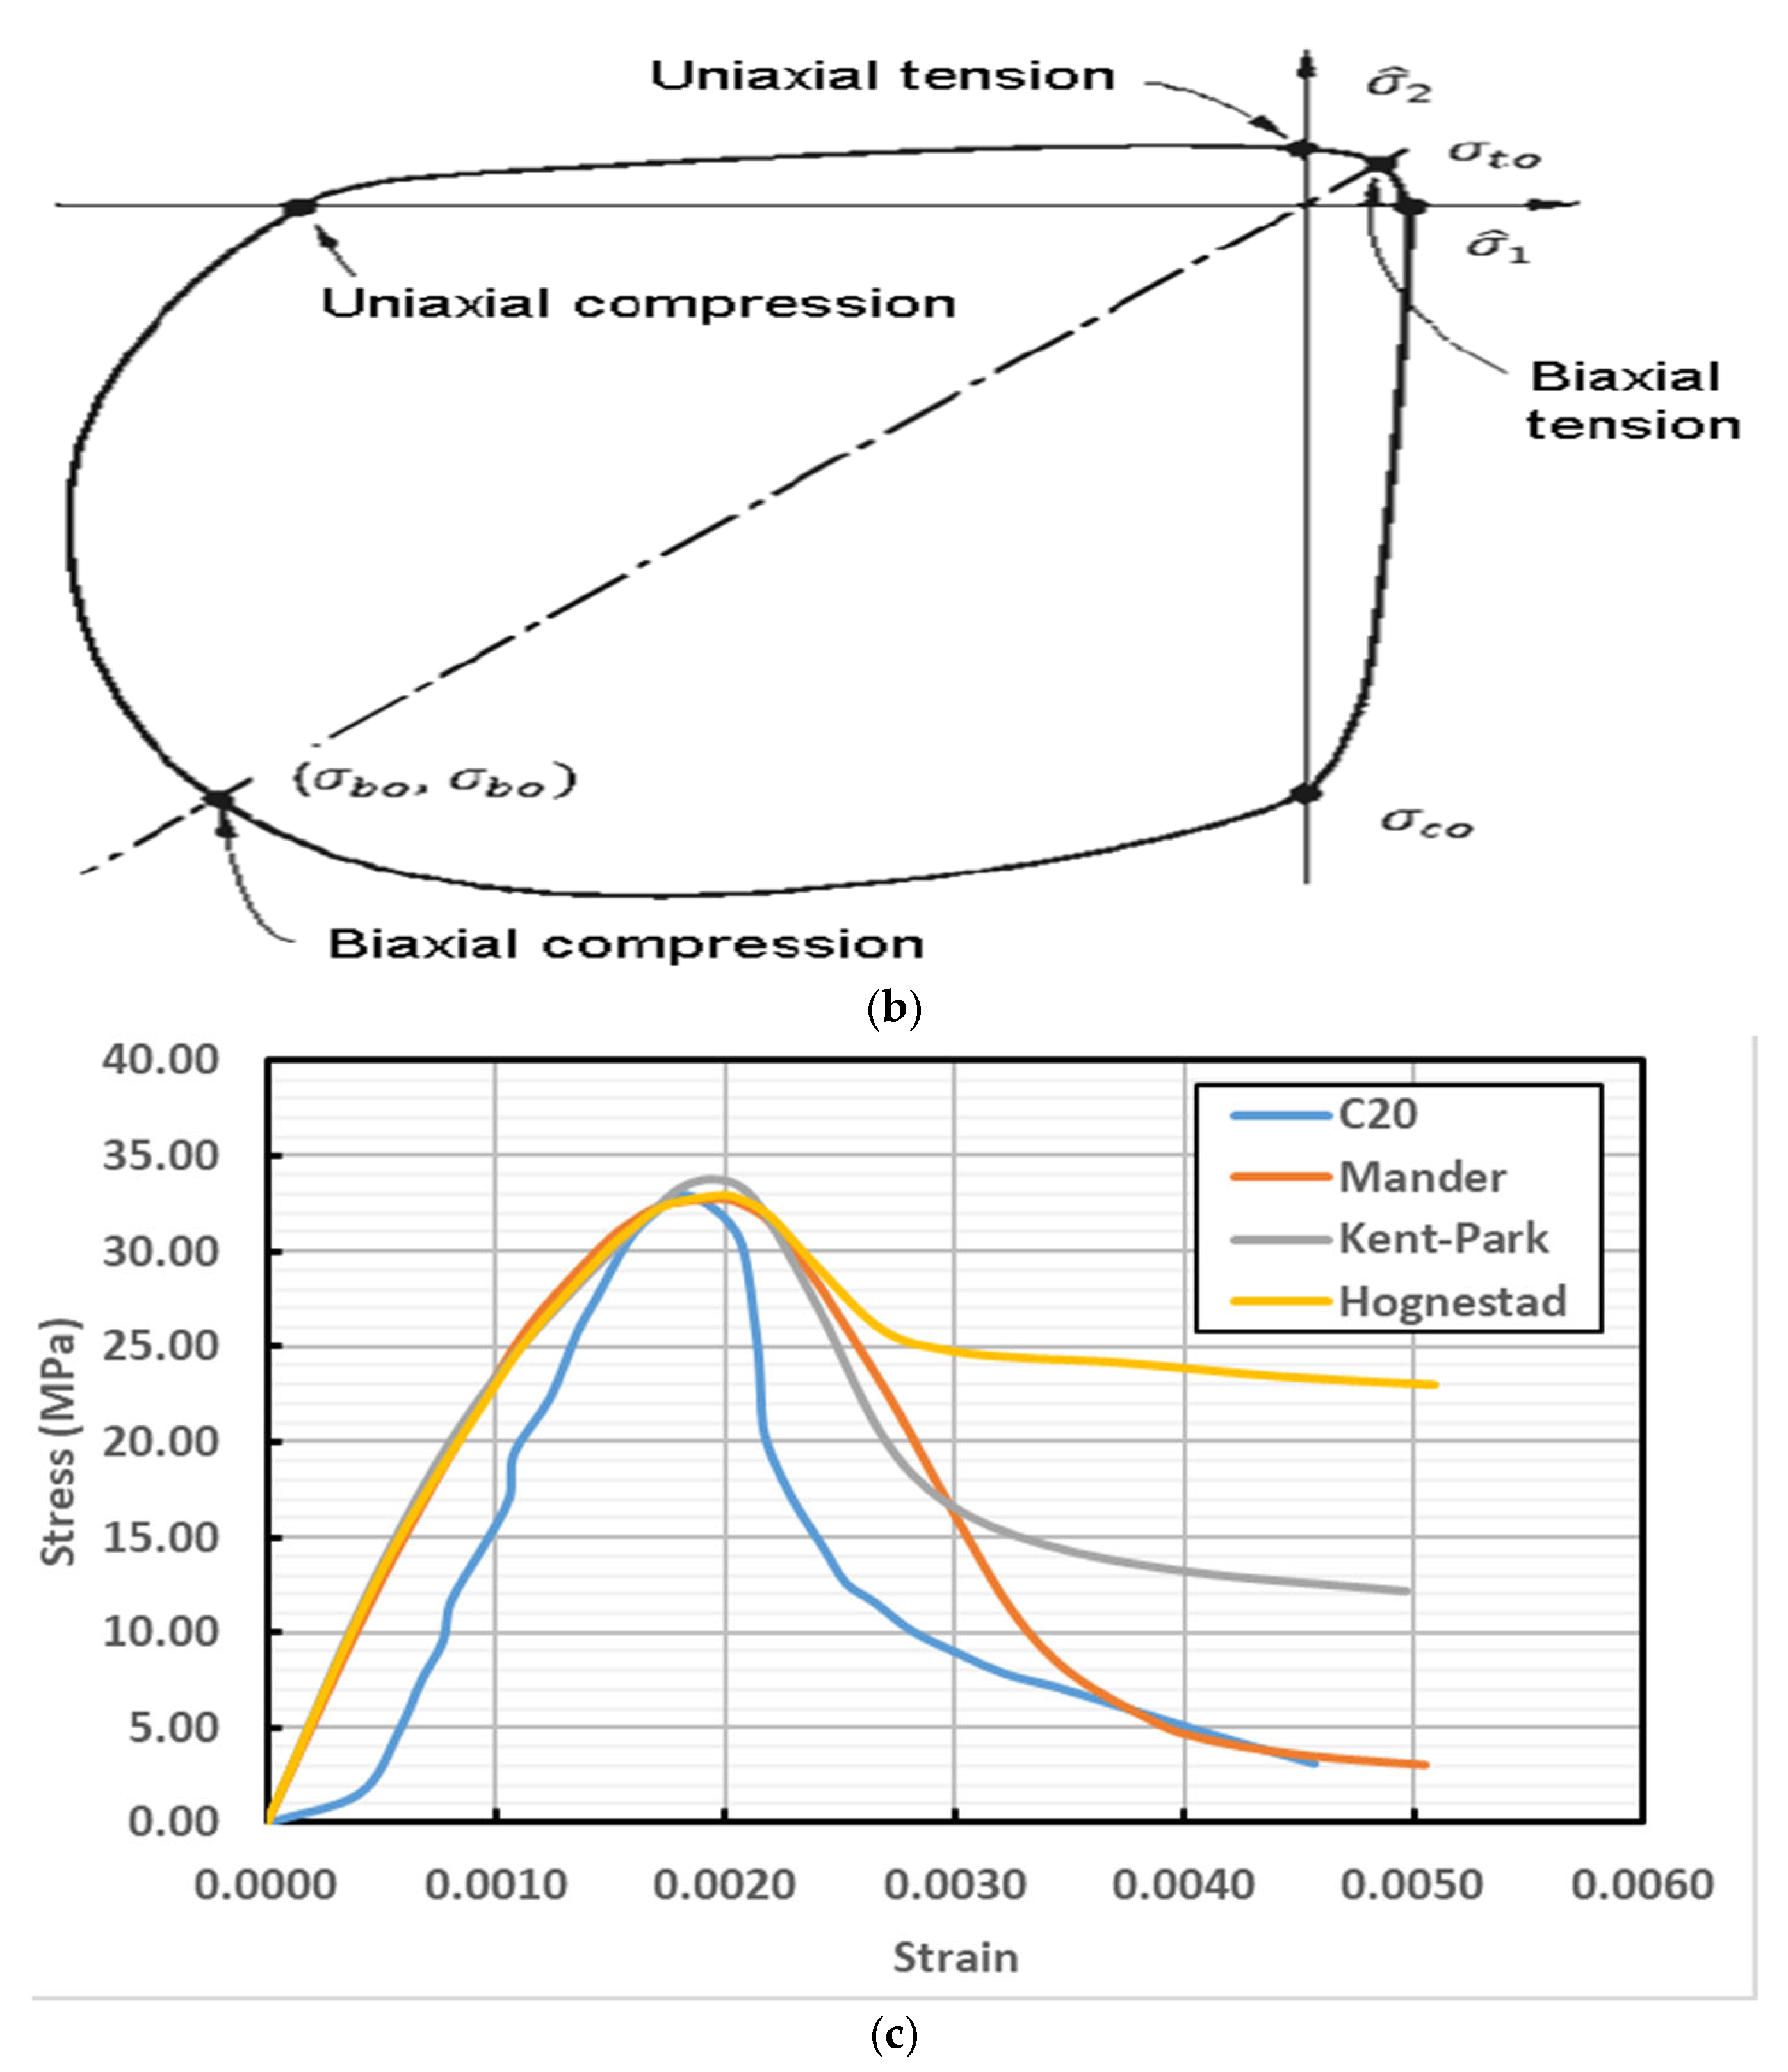
Figure 3 illustrates the models of concrete behavior under uniaxial compression. Figure 3a shows the Mander concrete model, which captures the nonlinear stress–strain response of confined concrete and accounts for the effects of confinement on peak strength and ductility. Figure 3b presents the Kent and Park concrete model, representing both the ascending and descending branches of the stress–strain curve, and is commonly used for modeling reinforced concrete structures. Figure 3c depicts the Hognestad concrete model, which characterizes the compressive behavior of concrete up to and beyond the peak stress, emphasizing post-peak softening. These models provide different approaches to simulate concrete’s mechanical response, helping to predict structural performance accurately. Overall, they serve as essential tools in finite element analysis and design of concrete structures. Figure 4 shows the concrete behavior model under uniaxial tension. Figure 4a shows the bilinear tensile behavior, capturing both the elastic response and post-cracking softening. Figure 4b shows the biaxial yield surface in the CDP model, while Figure 4c shows the stress–strain relationship for C20 concrete. Together, these subfigures highlight the failure mechanisms and the evolution of damage and plasticity under tensile loading.
Figure 4 illustrates the concrete behavior model under uniaxial tension. Figure 4a shows the bilinear tensile behavior, capturing both the initial linear elastic response and the strain-softening after cracking. Figure 4b presents the biaxial yield surface of concrete in the CDP model, which defines the interaction of multiaxial stress states and governs the onset of plastic deformation. Figure 4c depicts the stress–strain models for C20 class concrete, representing the full tensile response, including post-cracking softening. Together, these subfigures demonstrate the failure mechanisms, damage evolution, and plastic deformation in concrete under tension. This comprehensive representation highlights how the CDP model and constitutive stress–strain relationships can accurately simulate concrete’s tensile behavior for finite element analyses.
Mander et al. [49] proposed a unified stress–strain model for confined concrete applicable to circular and rectangular sections with transverse reinforcement. Figure 3a illustrates the model’s parabolic ascending branch followed by a ductile post-peak response, with the vertical axis representing the concrete compressive stress; here, Fcc denotes the compressive strength of confined concrete, whereas Fco corresponds to that of unconfined concrete. The Hognestad model describes a linear strain decrease following an initial parabolic rise to peak stress, remaining valid up to a final strain of 0.0038. The equations governing this curve are presented in Figure 3b. Here, σc represents concrete stress, εc stands for concrete strain, and εcu is the strain at which maximum stress is attained by unconfined concrete. The stress–strain relationship in the unconfined Kent and Park model [50] features a parabolic ascent to peak stress, followed by a linear decline until reaching  ε 50 u . Figure 4c displays the stress–strain curves for each of the three models. Figure 4c compares finite element results for C20 concrete using the Mander, Hognestad, and Kent–Park models, with the Mander model showing the closest agreement to experimental data in peak strength and post-peak softening; the Hognestad model exhibited a stiffer ascending branch, while the Kent–Park model underestimated ultimate strain, emphasizing the critical role of accurate material model calibration in concrete compression simulations. Mander et al. [49] unified model describes confined concrete with a parabolic rise and ductile post-peak behavior (Fcc vs. Fco), while the Hognestad model features a linear strain decrease after a parabolic peak. Valid to a strain of 0.0038 (Figure 3b), the model defines σc, εc, and εcu, while the Kent and Park model [50] shows a parabolic rise to peak stress then a linear drop to ε50u. Figure 4c compares the stress–strain curves from finite element analyses of C20 concrete using the Mander, Hognestad, and Kent–Park models. The Mander model exhibited the highest fidelity to experimental results, accurately capturing peak compressive strength and post-peak softening, whereas the Hognestad model produced a comparatively stiffer ascending branch and the Kent–Park model underestimated the ultimate strain capacity, highlighting the critical importance of precise material model calibration in finite element simulations of concrete compression behavior.

4. Results and Discussion

In this section, the performance and accuracy of RBF, polynomial kernels of SVM and MLP in predicting the Fc and Fs of cement mortar are evaluated. The results and optimal modeling parameters for the Fc and Fs of cement mortar are presented in Table 2. The parameters C, ε, γ, and d are known as model parameters. Regardless of the target and input variables, these model parameters are essential in the SVM model. In other words, to predict the values of the target variables (Fc and Fs) based on the input variables (W/C, S/C, NS/C, MS/C, and age) using SVM, it is crucial to specify the values of these model parameters. The selection of optimal model parameters plays a crucial role in determining the accuracy and precision of the SVM model. Note that d represents the degree of the polynomial in the SVM polynomial kernel. Additionally, the architectural parameters of the MLP neural network are presented in Table 2.
For predicting Fc in MLP, the network consists of input, hidden, and output layers. The input layer has 5 neurons, the hidden layer contains 4 neurons, and the output layer has 1 neuron. The logistic activation function is applied to both the hidden and output layers, as shown in Table 2. For predicting Fs in MLP, the network includes input, hidden, and output layers. The input layer has 4 neurons, the hidden layer contains 3 neurons, and the output layer has 1 neuron. The logistic activation function is applied to both the hidden and output layers. The type of activation function used in an MLP significantly impacts the network’s ability to learn and model complex patterns. The choice of activation function influences the network’s behavior, learning efficiency, and overall performance. The Fc of cement mortar containing NS and MS was predicted and modeled using the RBF and polynomial kernels of SVM, as well as MLP method. The results are presented in Table 3 and Table 4 and Figures 6–8. R2, MSE, RMSE, and MAPE for the SVM and MLP methods in predicting Fc and Fs, including both training and testing results, are shown in Table 3 and Table 4.
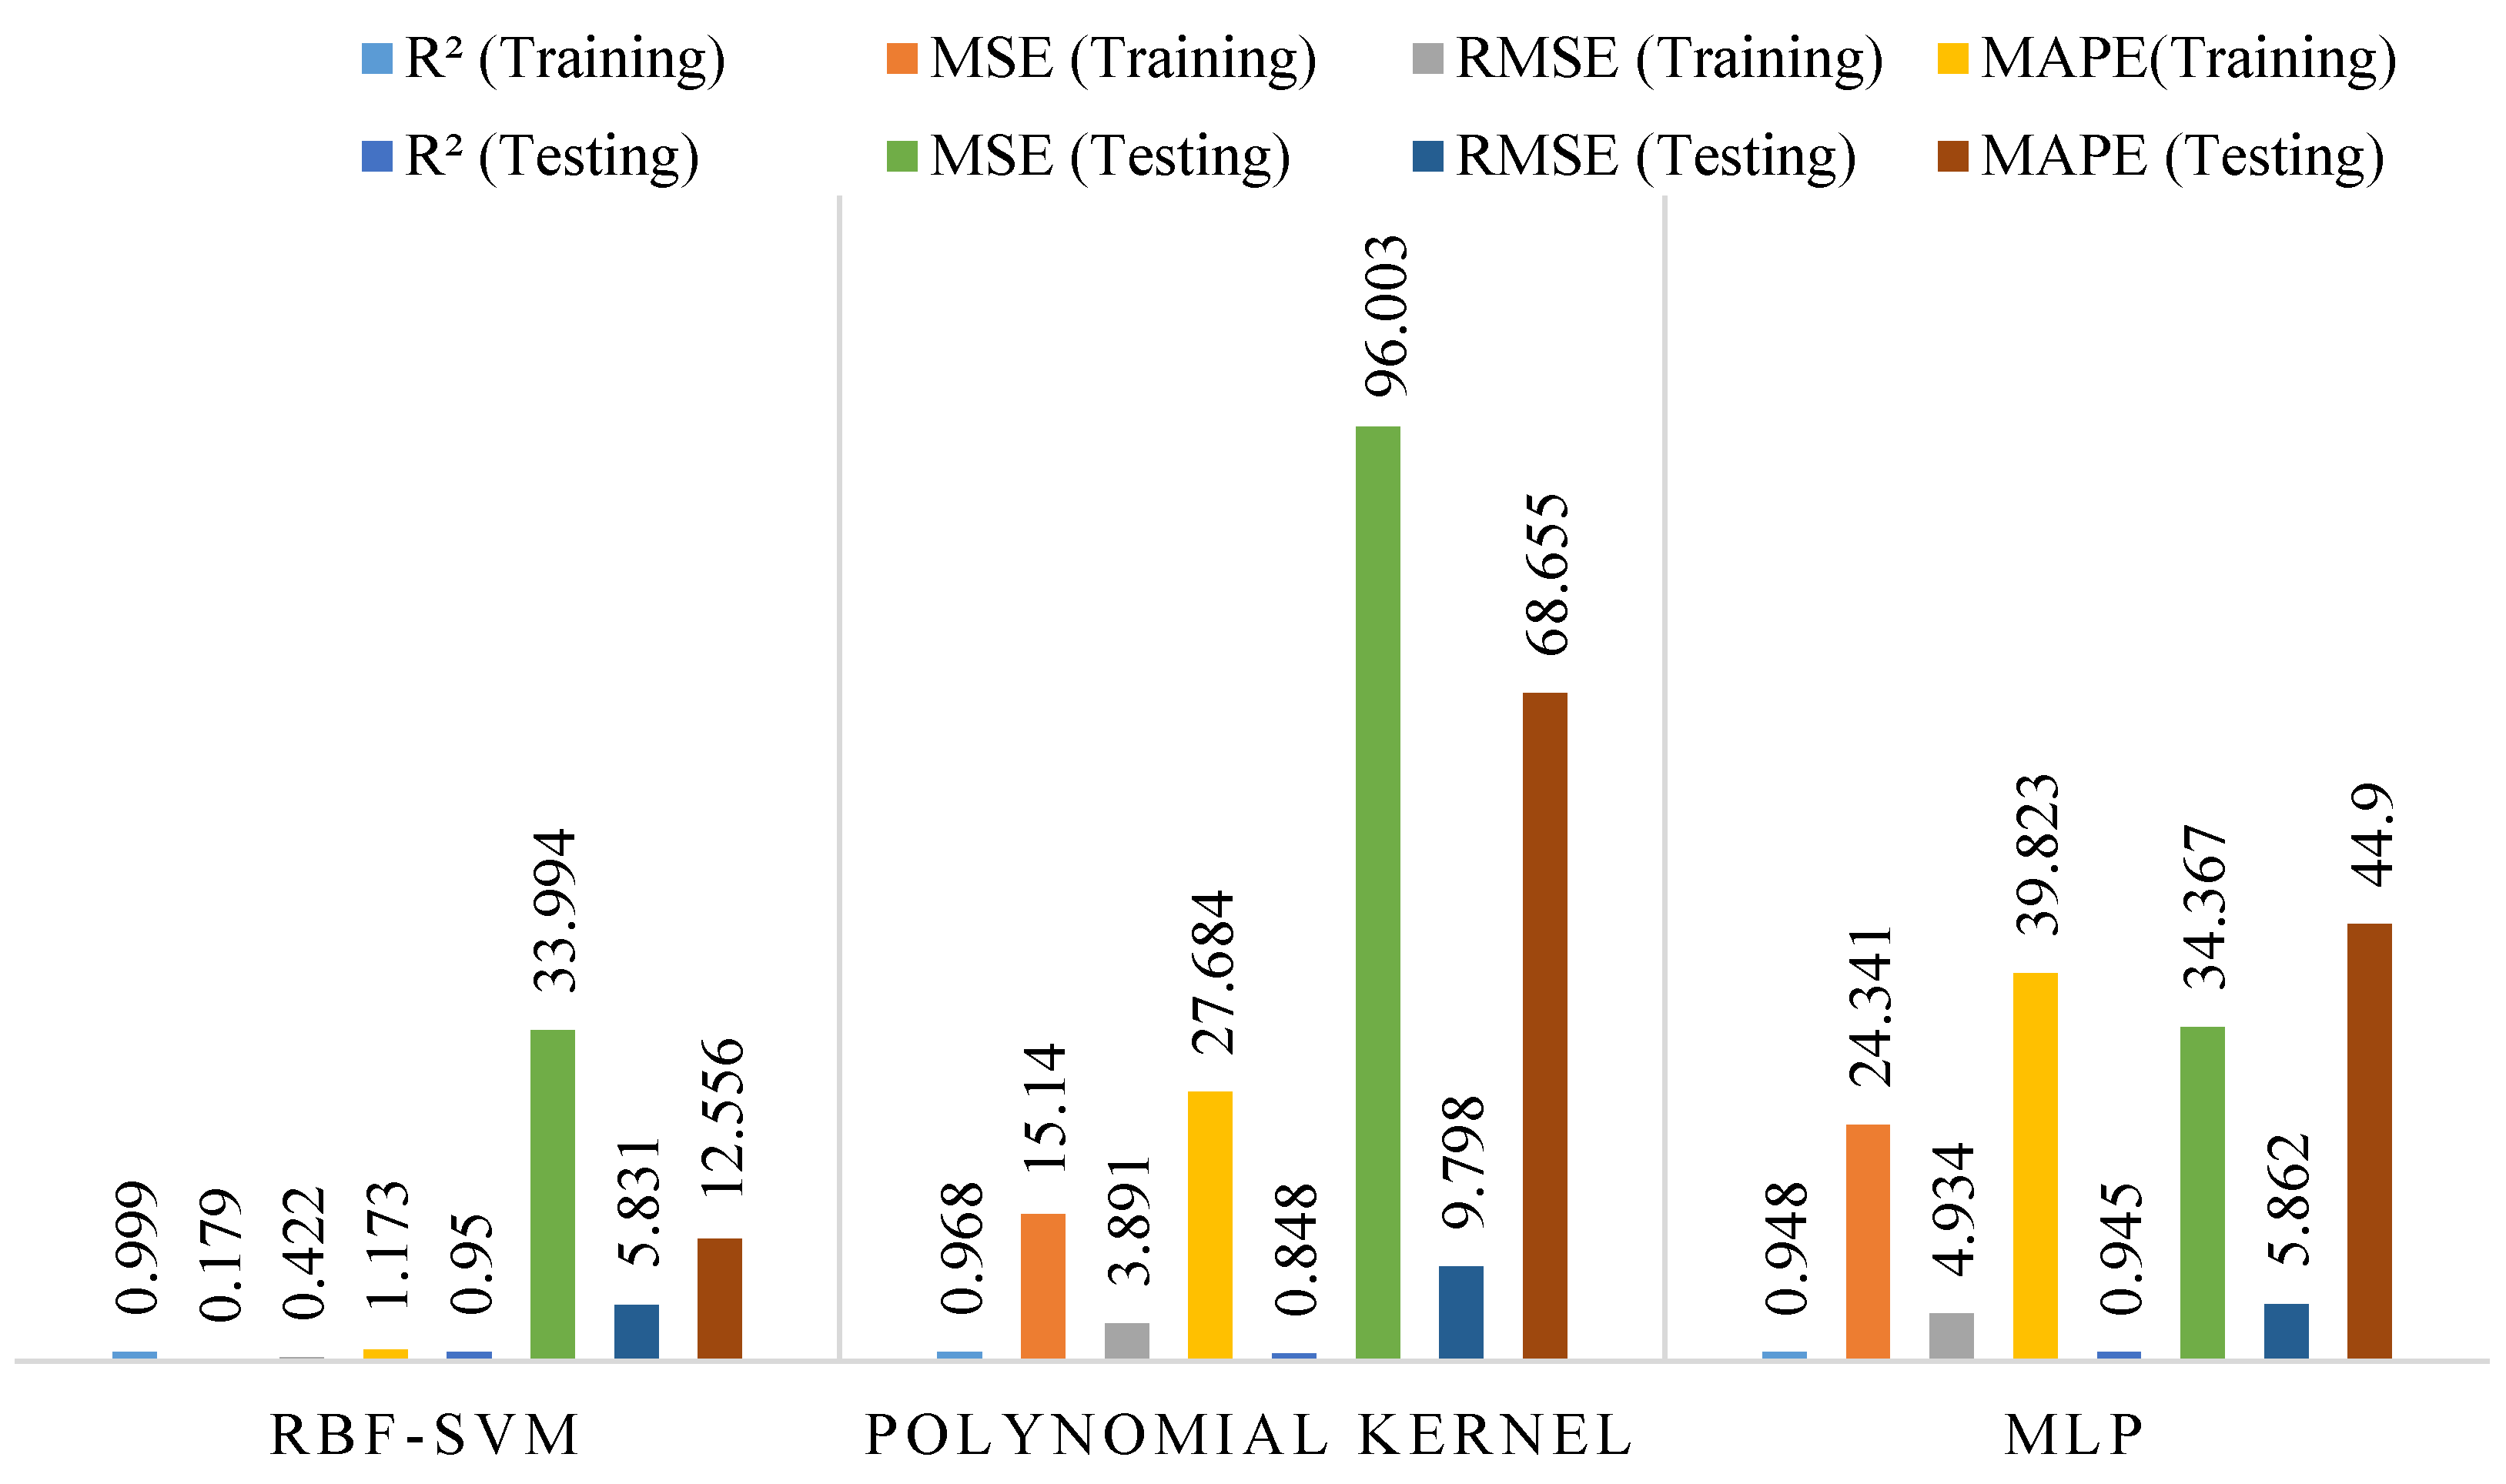
Table 3 shows that the SVM-RBF kernel achieves a correlation coefficient of R2 = 0.999 (MAPE = 1.173%, RMSE = 0.422, and MSE = 0.179) for Fc. This kernel’s performance is more accurate than the SVM–polynomial kernel (R2 = 0.968, MAPE = 27.684%, RMSE = 3.891, and MSE = 15.140) and MLP (R2 = 0.948, MAPE = 39.823%, RMSE = 4.934, and MSE = 24.341) in the training case. In the testing case, the SVM-RBF kernel achieves a correlation coefficient of R2 = 0.95 (MAPE = 12.556%, RMSE = 5.831, and MSE = 33.994) for Fc. This kernel’s performance is more accurate than the SVM–polynomial kernel (R2 = 0.848, MAPE = 68.655%, RMSE = 9.798, and MSE = 96.003) and MLP (R2 = 0.945, MAPE = 44.9%, RMSE = 5.862, and MSE = 34.3367). Figure 5 presents the evaluation metrics used to assess the performance of SVM and MLP models in predicting the Fc of cement mortar. Both training and testing results are included to demonstrate the models’ ability to learn from data and generalize to unseen samples. The SVM model was evaluated using both RBF and polynomial kernels to analyze the effect of kernel selection on predictive performance. The MLP model was trained with different network architectures to optimize its ability to capture nonlinear relationships in the dataset. Key metrics such as R2, RMSE, and MAE were used to quantify the accuracy and reliability of each model. Higher R2 values indicate a stronger correlation between experimental and predicted results, while lower RMSE and MAE values reflect smaller prediction errors. Figure 6 allows direct visual comparison of predicted versus experimental values, highlighting the performance of each model. The results show that both SVM and MLP can reliably predict Fc, although their performance varies depending on model type and parameter selection. Training results demonstrate the models’ capacity to fit the data closely, whereas testing results highlight their ability to generalize. Figure 5 and Figure 6 emphasize the importance of proper hyperparameter selection, including the kernel type for SVM and the number of hidden layers for MLP.
Overall, these results confirm the effectiveness of machine learning models in predicting cement mortar Fc. Figure 5 provides a clear overview of model performance and supports the use of SVM and MLP as reliable predictive tools in cement mortar studies.
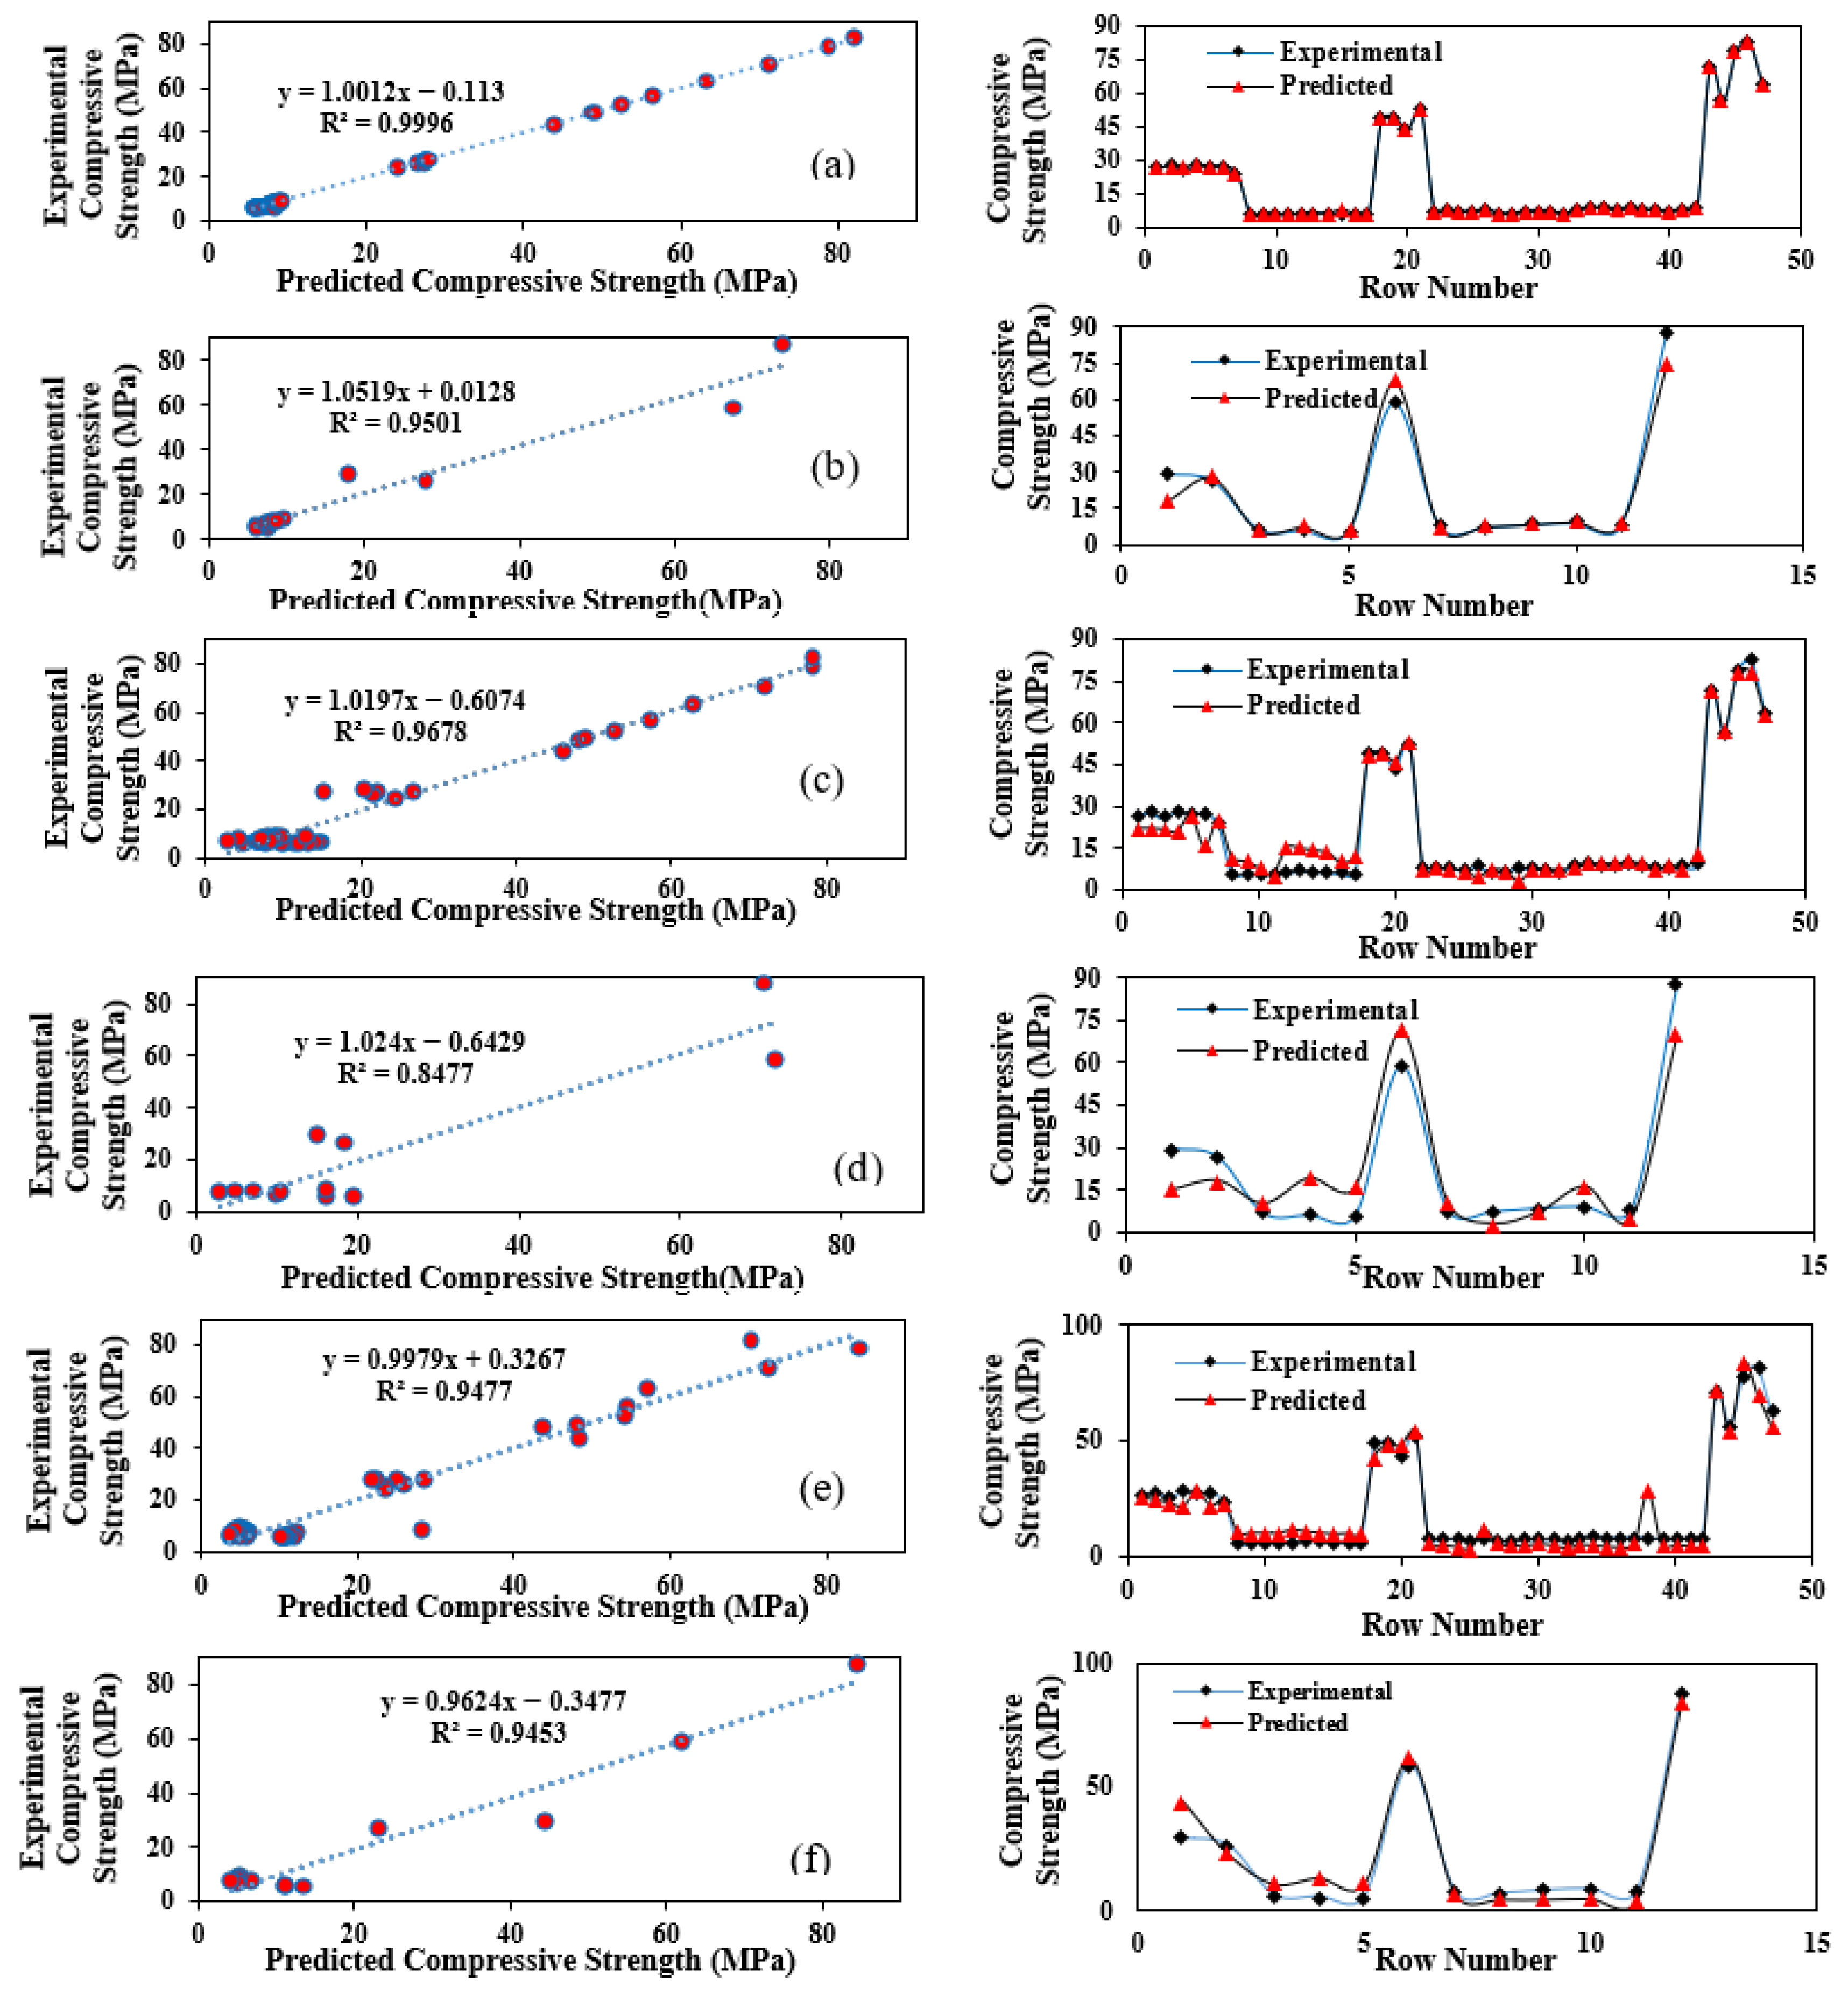
It is worth noting that the horizontal and vertical axes represent the experimental and predicted values of Fc, respectively. The relationships between the predicted and experimental values of Fc (or Fs) for the training and testing data are shown in Figure 6, Figure 7 and Figure 8. In part B of Figure 6, Figure 7 and Figure 8 the horizontal axis represents the amount of data in the training or testing models, while the vertical axis shows the predicted and experimental values of Fc or Fs, respectively. Figure 6 shows the relationship between the experimental and predicted Fc of cement mortar. Figure 6a,b presents the results of the SVM-RBF model for training and testing, respectively, illustrating the model’s accuracy in predicting Fc. Figure 6c,d shows the SVM with polynomial kernel results for training and testing, highlighting its predictive performance. Figure 6e,f depicts the MLP model outcomes for training and testing, demonstrating the neural network’s ability to capture nonlinear trends. The figure emphasizes the close agreement between experimental data and model predictions across all methods, particularly in Figure 6a,b. These results confirm the reliability of the machine learning models in predicting cement mortar compressive strength.
Figure 6 presents the comparison between experimental and predicted compressive strength (Fc) of cement mortar. Figure 6a,b shows the SVM-RBF model predictions for training and testing, indicating high accuracy. Figure 6c,d displays the SVM with polynomial kernel results, highlighting its ability to capture the underlying trends. Figure 6e,f illustrates the MLP model predictions for training and testing, demonstrating its capability to model nonlinear behavior. Together, Figure 6 demonstrates the effectiveness of all models in predicting cement mortar compressive strength. It is clear from Figure 5 and Figure 6, as well as from Table 3, that the SVM-RBF kernel accurately predicts the Fc of cement mortar, demonstrating excellent performance and superior accuracy compared to the SVM polynomial kernel and the MLP method. R2, MSE, RMSE, and MAPE for the SVM and MLP methods in predicting Fs, including both training and testing results, are shown in Table 4 and Figure 7 and Figure 8
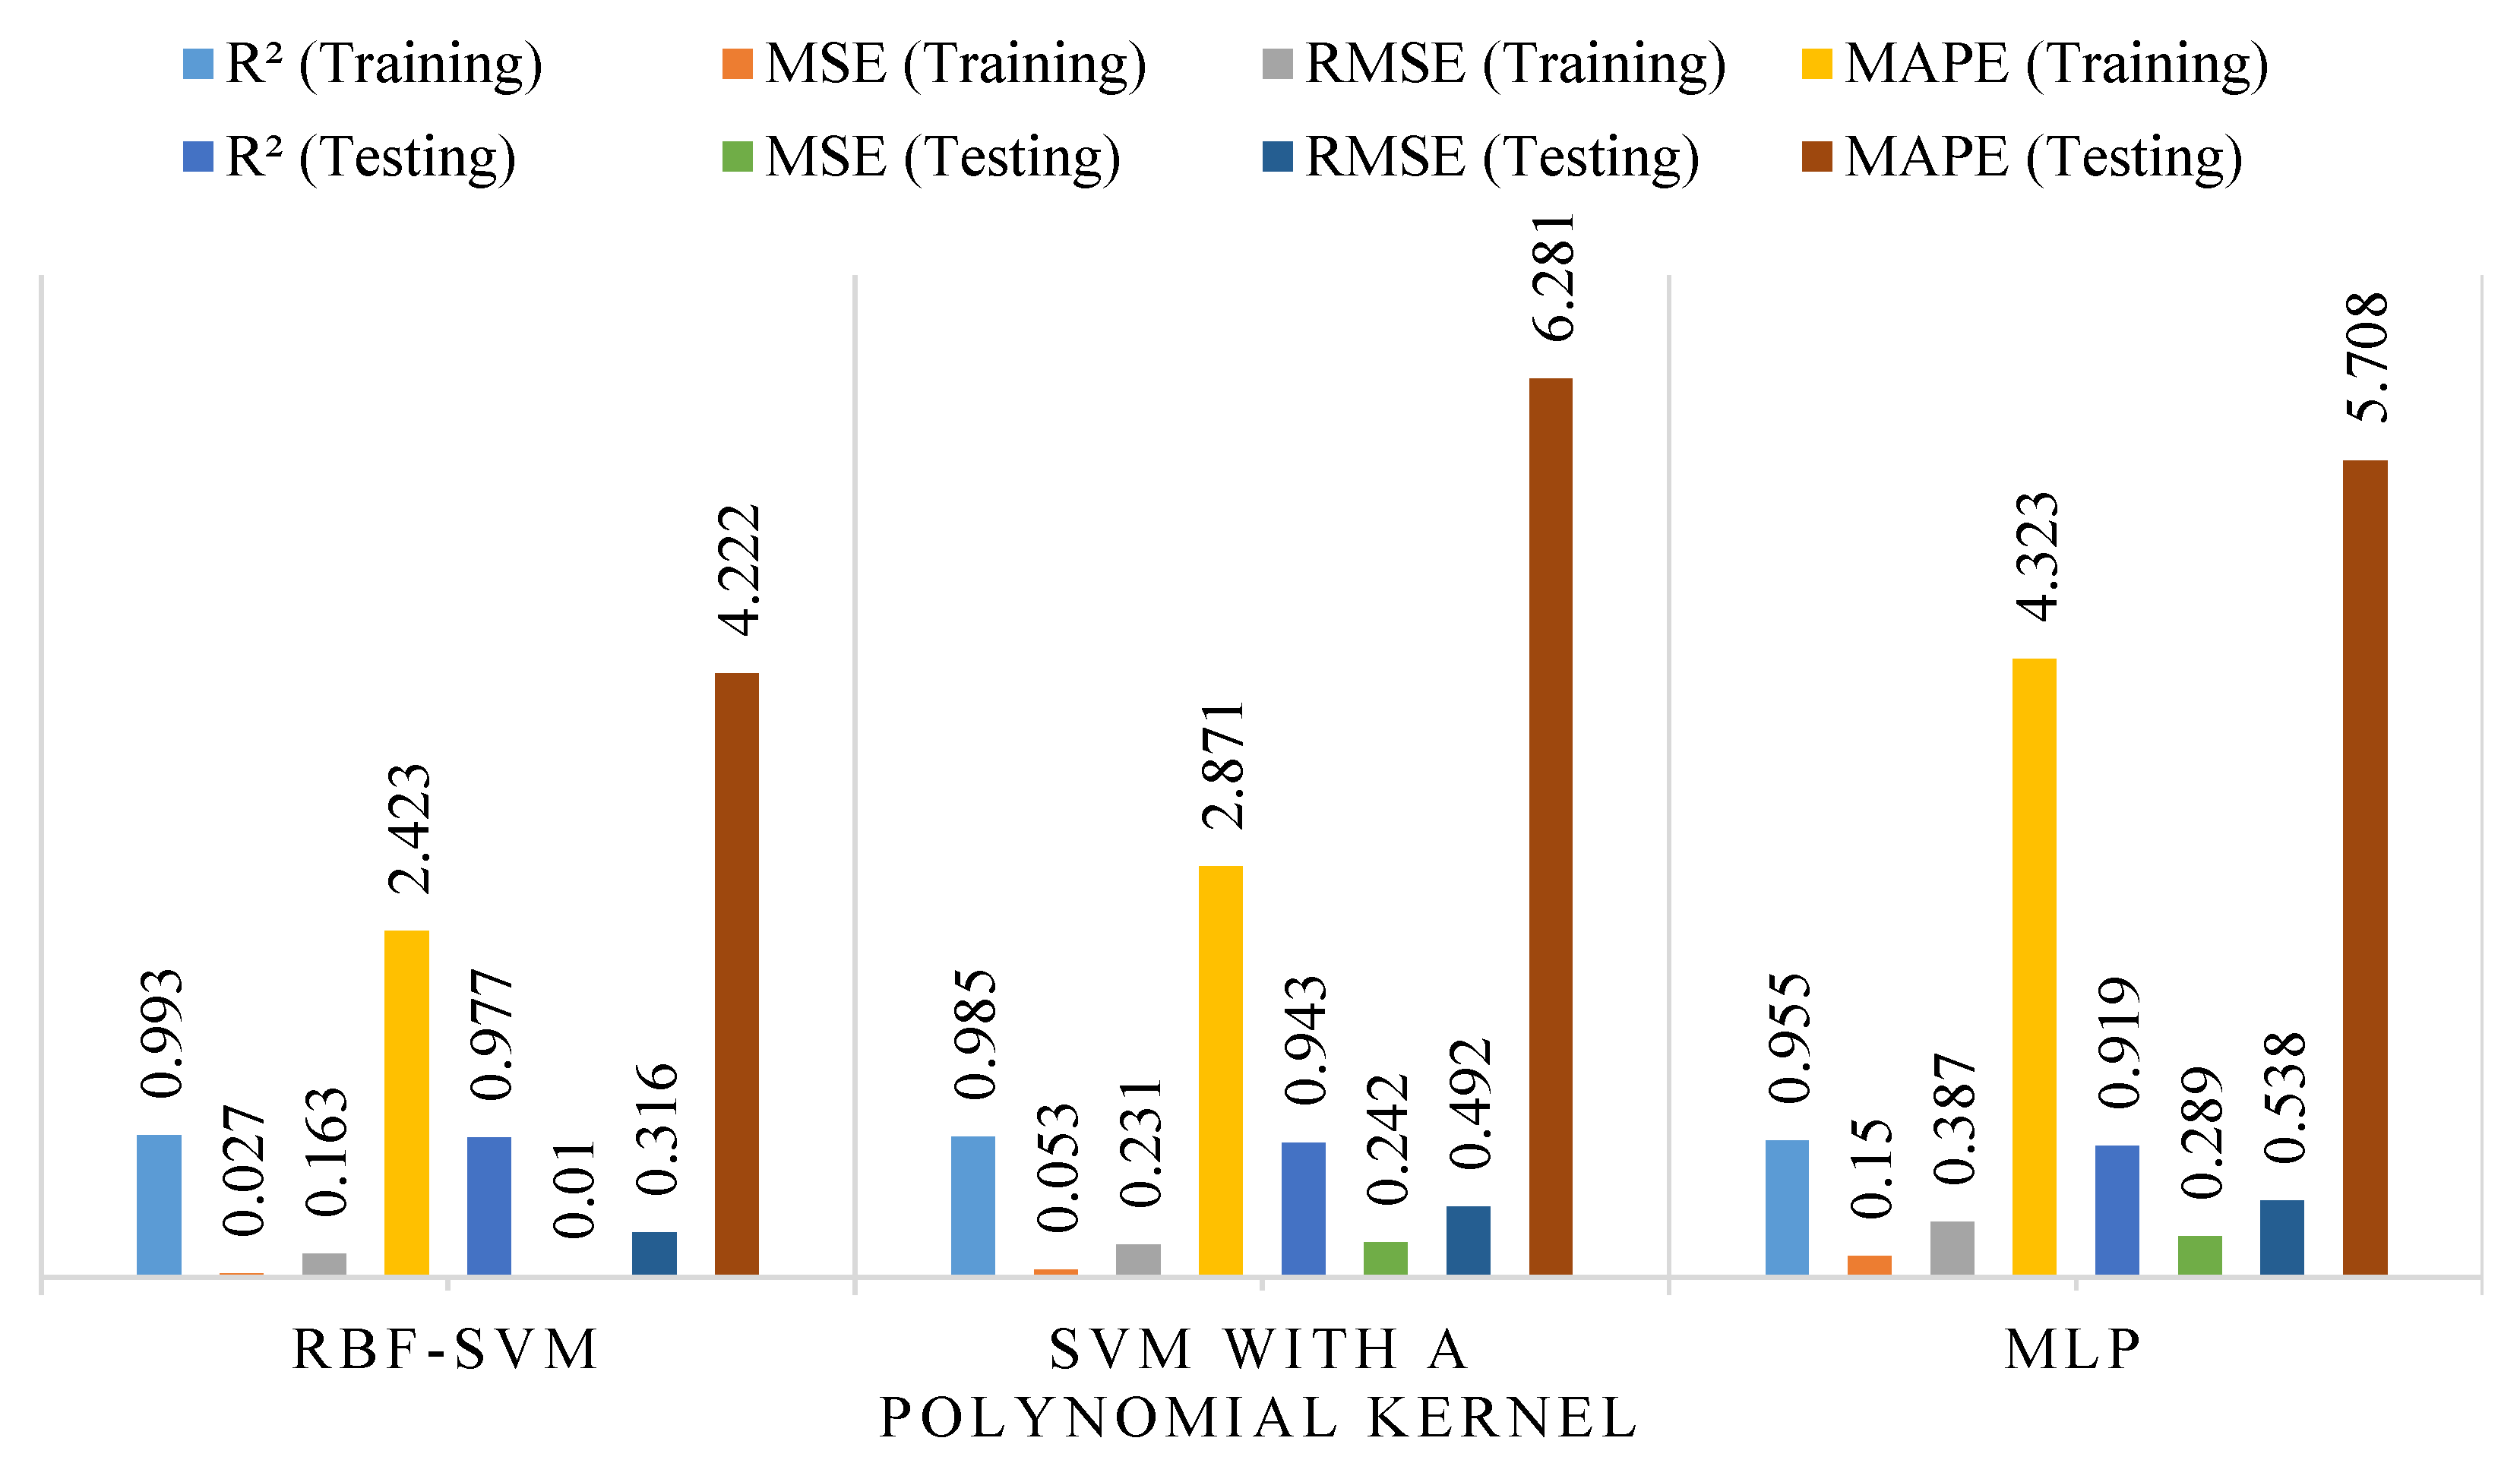
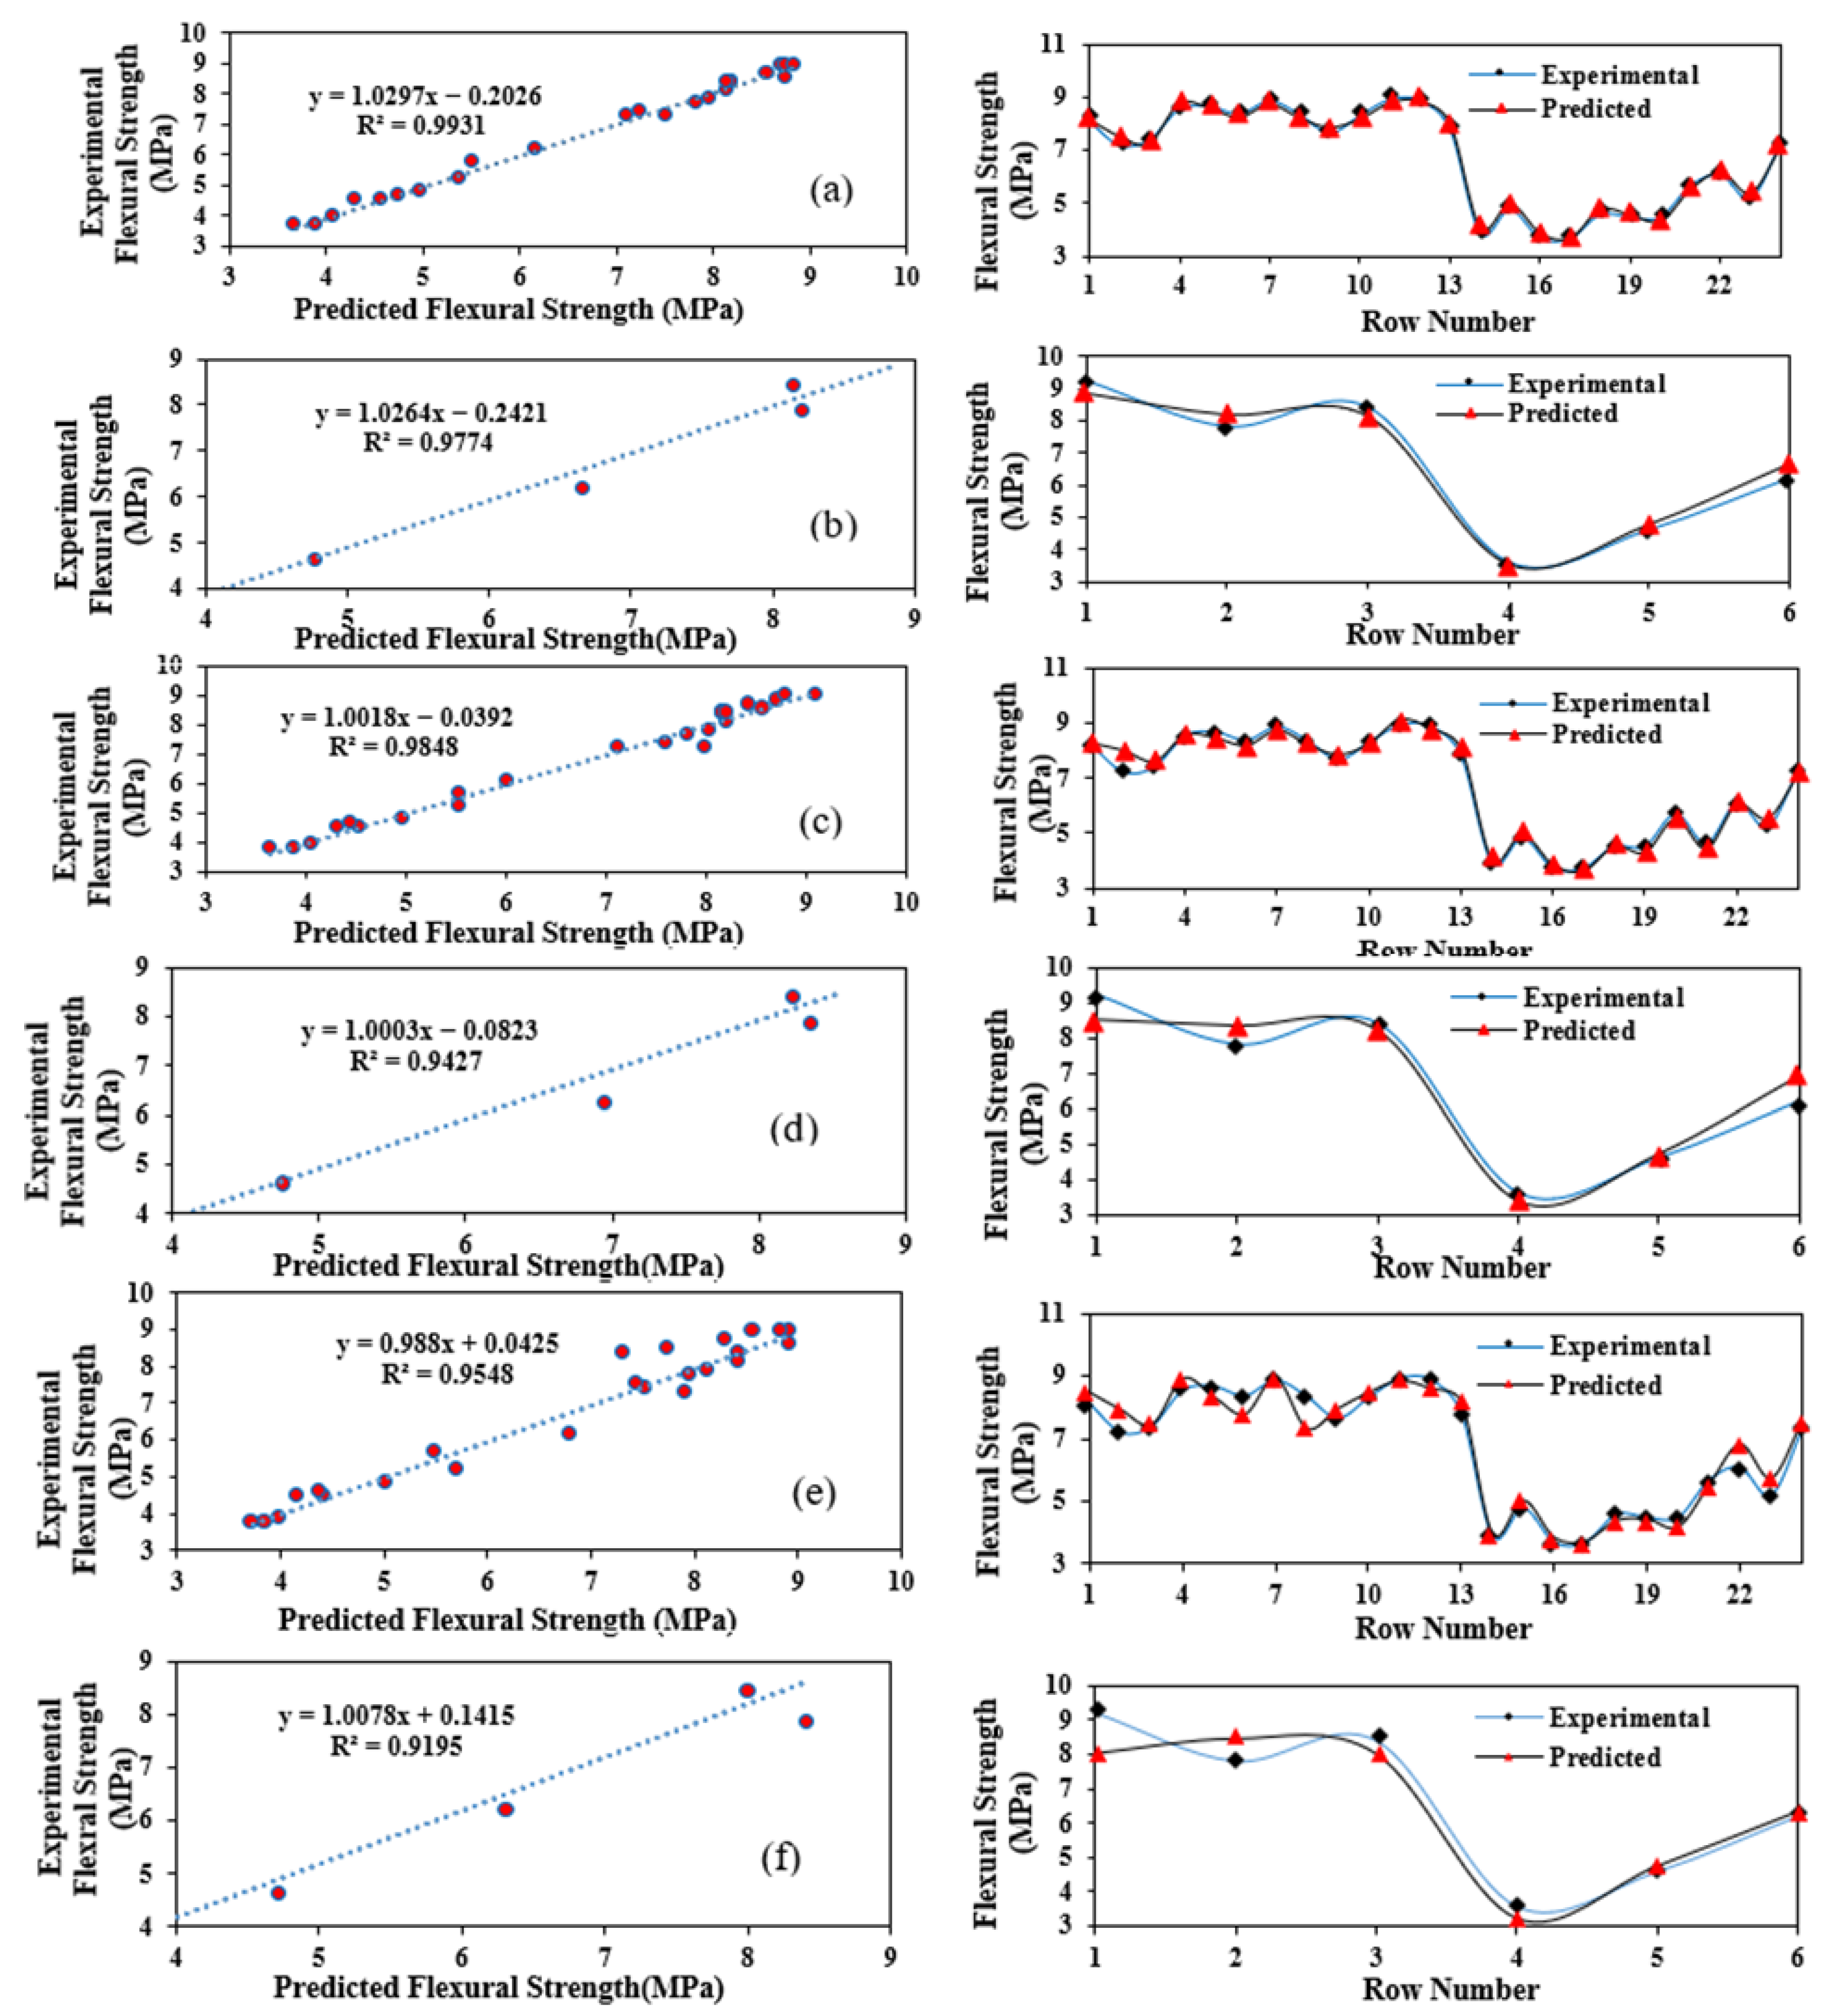
Figure 7 shows the evaluation metrics of SVM and MLP models for predicting the Fs of cement mortar. Both training and testing results are included to assess the models’ accuracy and generalization capabilities. The metrics, such as R2, RMSE, and MAE, provide a quantitative comparison of model performance. The figure highlights the effectiveness of SVM and MLP methods in capturing the relationship between input parameters and Fs. Figure 7 and Table 4 compare SVM and MLP models in predicting the Fs of cement mortar during training and testing. The SVM with RBF kernel consistently outperforms MLP, achieving the highest R2 values (0.993 training, 0.977 testing) and lowest error metrics (RMSE of 0.163 training, 0.316 testing). This superior performance highlights the SVM-RBF model’s ability to capture complex nonlinear relationships in mortars containing nano- and micro-silica. In contrast, the SVM–polynomial and MLP models show lower accuracy and higher errors. The results confirm the robustness and reliability of the SVM-RBF model for predicting the mechanical properties of modified cement mortar. The MLP model demonstrated moderate predictive performance, with R2 values of 0.955 during training and 0.919 in testing, accompanied by relatively higher error metrics (RMSE of 0.387 training and 0.538 testing). The SVM model with a polynomial kernel showed better accuracy than MLP but was inferior to the SVM-RBF model, achieving R2 values of 0.985 (training) and 0.943 (testing), with RMSE values of 0.231 (training) and 0.492 (testing). Both models exhibited lower reliability and higher prediction errors compared to the SVM-RBF, highlighting their limitations in capturing the complex behavior of Fs in cement mortar. Figure 8 illustrates the correlation between experimental and predicted Fs values for different models and phases. Figure 8a,b shows that the SVM-RBF model achieves a strong agreement in both training and testing, indicating high predictive accuracy. In contrast, the SVM–polynomial kernel (Figure 8c,d) and MLP (Figure 8e,f) models exhibit greater scatter, reflecting comparatively lower prediction precision.
Figure 8 shows the relationship between experimental and predicted Fs of cement mortar. Figure 8a,b presents the SVM-RBF model results for training and testing, demonstrating accurate predictions. Figure 8c,d shows the SVM with polynomial kernel outcomes, highlighting its predictive performance. Figure 8e,f depicts the MLP model results for training and testing, confirming the models’ ability to capture nonlinear trends in Fs. As shown in Table 4 and Figure 7 and Figure 8, the SVM-RBF kernel achieves a correlation coefficient of R2 = 0.993 (MAPE = 2.423%, RMSE = 0.163, and MSE = 0.027) for Fs, outperforming the SVM–polynomial kernel (R2 = 0.985, MAPE = 2.871%, RMSE = 0.231, and MSE = 0.053) and MLP (R2 = 0.955, MAPE = 4.323%, RMSE = 0.387, and MSE = 0.150) in the training case. In the testing case, the SVM-RBF kernel achieves a correlation coefficient of R2 = 0.977 (MAPE = 4.222%, RMSE = 0.316, and MSE = 0.01) for Fs, showing superior accuracy compared to the SVM–polynomial kernel (R2 = 0.943, MAPE = 6.281%, RMSE = 0.492, and MSE = 0.242) and MLP (R2 = 0.919, MAPE = 5.708%, RMSE = 0.538, and MSE = 0.289). The SVM-RBF kernel consistently outperforms both the SVM–polynomial kernel and the MLP method in predicting flexural and compressive strengths. As shown in Table 3 and Table 4, and Figure 5, Figure 6, Figure 7 and Figure 8 the SVM-RBF kernel achieves superior accuracy, with higher correlation coefficients and lower error metrics (MAPE, RMSE, and MSE) in both training and testing cases.
Cement-based composites have yielded notable improvements in both material performance and modeling techniques. Rheological assessments have advanced 3D concrete printing technologies [51], while discrete element modeling has enhanced understanding of geosynthetic-reinforced embankments [52]. The use of thermally activated recycled powders [53], nano-SiO2, and mPCM additives [54] has improved microstructure and durability. Bio-based calcium carbonate encapsulation [55] and deep learning-based plastic damage prediction [56] have further optimized mechanical performance. Additionally, studies on pore structure and high-temperature resistance [57], mesoscale modeling [58], FRP–concrete interface behavior via cohesive zone models [59], seismic behavior of strengthened RC columns [60], and lateral drift in precast frames with plastic hinges [61] have contributed to both microstructural and structural advancements in cementitious systems.
Figure 9 presents a comparative analysis of finite element simulation results for C20 grade concrete using the Mander, Hognestad, and Kent–Park models. Figure 9a shows the experimental sample alongside the FEM results using the Mander model, capturing stress distribution, compressive damage, and tensile damage contours. Figure 9b depicts the Hognestad model results compared with the experimental view, highlighting differences in stress localization and damage evolution. Figure 9c shows the Kent–Park model outcomes alongside the experimental sample, illustrating variations in failure patterns. All three models successfully replicate the overall axial compression failure mode, but differences in stress patterns and damage progression are evident. Maximum compressive stresses are concentrated in the central region of the specimens, consistent with the expected axial failure mechanism. Compressive damage contours indicate high damage values near unity in the core, reflecting severe crushing where confinement is minimal. Tensile damage contours reveal minor cracking near lateral surfaces due to Poisson’s effect and stress redistribution. Figure 9 demonstrates the critical influence of constitutive model selection on accurately simulating concrete behavior and the CDP model’s capability to capture both compressive and tensile damage modes. Figure 9 compares FEM results for C20 concrete using the Mander, Hognestad, and Kent–Park models alongside experimental samples. All models capture the overall axial compression failure, with differences in stress distribution and damage progression. Maximum compressive damage occurs in the specimen’s core, while minor tensile cracking appears near lateral surfaces due to Poisson’s effect. The figure highlights the importance of constitutive model selection and shows the CDP model’s ability to simulate both compressive and tensile damage.
Figure 9 presents a comparative analysis of finite element simulation results for C20 grade concrete using the Mander, Hognestad, and Kent–Park models. Figure 9a shows the experimental sample alongside the FEM results using the Mander model, capturing stress distribution, compressive damage, and tensile damage contours. Figure 9b depicts the Hognestad model results compared with the experimental view, highlighting differences in stress localization and damage evolution. Figure 9c shows the Kent–Park model outcomes alongside the experimental sample, illustrating variations in failure patterns. All three models successfully replicate the overall axial compression failure mode, but differences in stress patterns and damage progression are evident. Maximum compressive stresses are concentrated in the central region of the specimens, consistent with the expected axial failure mechanism. Compressive damage contours indicate high damage values near unity in the core, reflecting severe crushing where confinement is minimal. Tensile damage contours reveal minor cracking near lateral surfaces due to Poisson’s effect and stress redistribution. Figure 9 demonstrates the critical influence of constitutive model selection on accurately simulating concrete behavior and the CDP model’s capability to capture both compressive and tensile damage modes. Literature indicates that many experimental studies have been validated through the development of corresponding finite element models [62,63,64,65,66]. The Mander model exhibited a more ductile stress distribution, with stress and damage spreading more uniformly across the specimen, as depicted in Figure 9. This aligns with the model’s incorporation of confinement effects, which enhance strain capacity and mitigate brittle failure. The damage distribution for the Mander model reveals a wider compression damage zone with smoother degradation, reflecting its enhanced ductility and confinement efficiency. Tensile damage is primarily observed as minor cracking along the lateral surfaces, resulting from lateral dilation. In contrast, the Kent–Park model shows a sharply concentrated damage region near the core and a rapid decline in stress beyond the peak, indicating a brittle response. The corresponding tensile damage is more localized and limited, consistent with the model’s reduced strain capacity and lower energy absorption characteristics. The Hognestad model exhibited intermediate behavior between the Mander and Kent–Park models. Stress contours revealed localized high-stress regions with moderate dispersion. The compression damage was concentrated in the core but less extensive than in the Mander model, indicating limited confinement effects. Likewise, the tensile damage was more dispersed than in the Kent–Park model but still relatively restrained. This suggests that while the Hognestad model accurately captures peak strength, it underestimates post-peak ductility and energy dissipation. The results indicate that the Mander model offers a more realistic representation of stress redistribution and progressive damage evolution in confined concrete, particularly under compressive loading. In contrast, the Kent–Park and Hognestad models display more brittle responses, with limited stress diffusion and concentrated damage zones. The simulated stress and damage distributions closely align with experimentally observed failure patterns, reinforcing the reliability and suitability of the CDP model for capturing the nonlinear behavior of concrete subjected to axial loading.

5. Conclusions

This study successfully demonstrated the advantages of combining artificial intelligence and finite element modeling to evaluate the mechanical behavior of cement mortars containing nano- and micro-silica. The integration of data-driven and physics-based approaches provided both accurate predictions and deeper mechanistic understanding.
The main findings of this study can be summarized as follows:
  • The SVM model with the RBF kernel demonstrated superior accuracy in predicting the Fc and Fs of cement mortars containing NS and MS, outperforming both the SVM–polynomial kernel and MLP models. This highlights SVM-RBF as a robust and efficient alternative to conventional experimental testing, offering potential for cost- and time-effective material design.
  • The Mander model within the CDP framework most accurately simulated the compressive behavior of concrete, effectively capturing peak strength, post-peak softening, and ductile damage distribution. In contrast, the Kent–Park and Hognestad models exhibited limitations in representing post-peak ductility and ultimate strain capacity, underscoring the importance of model selection in finite element analysis.
  • Integrating AI-driven prediction with mechanics-based FEM provides complementary strengths: AI enables rapid, accurate property estimation across mixture designs, while FEM offers mechanistic insights into damage evolution and stress distribution. This hybrid approach enhances interpretability and supports multi-scale evaluation of cementitious composites.
  • The proposed framework has practical applications in accelerating the development and optimization of cement mortar formulations, potentially reducing reliance on costly and labor-intensive experimental procedures.
  • A notable limitation of this study is the relatively small experimental dataset, which constrains the generalizability of the predictive models. To address this, future research should focus on expanding dataset size and diversity, including external validation with independent experimental data to improve robustness.
  • Further advancement could be achieved by refining FEM constitutive models and incorporating advanced AI techniques such as deep learning or transfer learning, aiming to improve predictive accuracy and broaden applicability to a wider range of cementitious materials.
In future studies, it is recommended to incorporate additional influential parameters such as porosity, ambient temperature, and curing conditions, as these factors significantly affect the strength development of cementitious composites and could further improve the robustness and accuracy of AI-based predictive models. This study underscores the effective integration of artificial intelligence and finite element modeling for evaluating NS and MS modified cement mortars, thereby providing a solid foundation for developing more reliable and scalable predictive tools in concrete technology. Despite the limited dataset, the results demonstrate the promising potential of the hybrid AI–FEM approach. Future research will prioritize expanding the dataset, validating the models across a broader range of mix designs, and employing advanced feature importance techniques—such as SHAP values, permutation importance, and partial dependence plots—to enhance model interpretability and facilitate informed mix optimization.

Author Contributions

Conceptualization, E.A., S.J. and Z.Y.; methodology, S.J. and Y.S.; software, S.J. and Y.S.; validation, S.J., formal analysis, S.J.; investigation, E.A., S.J. and Z.Y.; resources, E.A., S.J. and Z.Y.; data curation, S.J.; writing—original draft preparation, E.A., S.J., Z.Y. and Y.S.; writing—review and editing, E.A., S.J., Z.Y., Y.S. and M.M.; visualization, S.J.; supervision, E.A., S.J. and Z.Y.; project administration, E.A., S.J., Z.Y. and M.M. All authors have read and agreed to the published version of the manuscript.

Funding

This research received no external funding.

Data Availability Statement

In this study, 30 flexural strength data and 59 compressive strength data were collected from previously published article [40].

Acknowledgments

The authors are fully responsible for the content of this publication. The authors would like to express their sincere gratitude to Maali Çelik Ar-Ge Danışmanlık, Mühendislik, İnşaat Taahhüt, and Tarım ve Hayvancılık Company, located at Atateknokent, Erzurum, Turkey, for their valuable support and contribution to this study.

Conflicts of Interest

The authors declare that the research was conducted in the absence of any commercial or financial relationships that could be construed as a potential conflict of interest.

References

  1. Emamian, S.A.; Eskandari-Naddaf, H. Effect of porosity on predicting compressive and flexural strength of cement mortar containing micro and nano-silica by ANN and GEP. Constr. Build. Mater. 2019, 218, 8–27. [Google Scholar] [CrossRef]
  2. Singh, S.B.; Munjal, P.; Thammishetti, N. Role of water/cement ratio on strength development of cement mortar. J. Build. Eng. 2015, 4, 94–100. [Google Scholar] [CrossRef]
  3. Moses, O.; Samson, D.; Waila, O. Compressive strength characteristics of kenaf fibre reinforced cement mortar. Adv. Mater. 2015, 4, 6–10. [Google Scholar] [CrossRef]
  4. Mohamed, A.M. Influence of nano materials on flexural behavior and compressive strength of concrete. HBRC J. 2016, 12, 212–225. [Google Scholar] [CrossRef]
  5. Berra, M.; Carassiti, F.; Mangialardi, T.; Paolini, A.E.; Sebastiani, M. Effects of nanosilica addition on workability and compressive strength of Portland cement pastes. Constr. Build. Mater. 2012, 35, 666–675. [Google Scholar] [CrossRef]
  6. Li, L.; Zhu, J.; Huang, Z.; Kwan, A.; Li, L. Combined effects of micro-silica and nano-silica on durability of mortar. Constr. Build. Mater. 2017, 157, 337–347. [Google Scholar] [CrossRef]
  7. Seifan, M.; Mendoza, S.; Berenjian, A. Mechanical properties and durability performance of fly ash based mortar containing nano-and micro-silica additives. Constr. Build. Mater. 2020, 252, 119121. [Google Scholar] [CrossRef]
  8. Massana, J.; Reyes, E.; Bernal, J.; León, N.; Sánchez-Espinosa, E. Influence of nano-and micro-silica additions on the durability of a high-performance self-compacting concrete. Constr. Build. Mater. 2018, 165, 93–103. [Google Scholar] [CrossRef]
  9. Raheem, A.; Ikotun, B.; Oyebisi, S.; Ede, A. Machine learning algorithms in wood ash-cement-Nano TiO2-based mortar subjected to elevated temperatures. Results Eng. 2023, 18, 101077. [Google Scholar] [CrossRef]
  10. Garcia, J.; Villavicencio, G.; Altimiras, F.; Crawford, B.; Soto, R.; Minatogawa, V.; Franco, M.; Martínez-Muñoz, D.; Yepes, V. Machine learning techniques applied to construction: A hybrid bibliometric analysis of advances and future directions. Autom. Constr. 2022, 142, 104532. [Google Scholar] [CrossRef]
  11. Dong, C. Compressive strength prediction of high-performance concrete using MLP model. Smart Sci. 2024, 13, 137–166. [Google Scholar] [CrossRef]
  12. Gayathri, R.; Rani, S.U.; Čepová, L.; Rajesh, M.; Kalita, K. A comparative analysis of machine learning models in prediction of mortar compressive strength. Processes 2022, 10, 1387. [Google Scholar] [CrossRef]
  13. Jueyendah, S.; Lezgy-Nazargah, M.; Eskandari-Naddaf, H.; Emamian, S.A. Predicting the mechanical properties of cement mortar using the support vector machine approach. Constr. Build. Mater. 2021, 291, 123396. [Google Scholar] [CrossRef]
  14. Jueyendah, S.; Martins, C.H. Optimal Design of Welded Structure Using SVM. Comput. Eng. Phys. Model. 2024, 7, 84–107. [Google Scholar]
  15. Jueyendah, S.; Yaman, Z.; Dere, T.; Çavuş, T.F. Comparative Study of Linear and Non-Linear ML Algorithms for Cement Mortar Strength Estimation. Buildings 2025, 15, 2932. [Google Scholar] [CrossRef]
  16. Ombres, L.; Aiello, M.A.; Cascardi, A.; Verre, S. Modeling of steel-reinforced grout composite system-to-concrete bond capacity using artificial neural networks. J. Compos. Constr. 2024, 28, 04024034. [Google Scholar] [CrossRef]
  17. Bayram, S.; Ocal, M.E.; Laptali Oral, E.; Atis, C.D. Comparison of multi layer perceptron (MLP) and radial basis function (RBF) for construction cost estimation: The case of Turkey. J. Civ. Eng. Manag. 2016, 22, 480–490. [Google Scholar] [CrossRef]
  18. Ghazanfari, N.; Gholami, S.; Emad, A.; Shekarchi, M. Evaluation of GMDH and MLP networks for prediction of compressive strength and workability of concrete. Bull. Soc. R. Sci. Liège 2017, 86, 855–868. [Google Scholar] [CrossRef]
  19. Eskandari-Naddaf, H.; Kazemi, R. ANN prediction of cement mortar compressive strength, influence of cement strength class. Constr. Build. Mater. 2017, 138, 1–11. [Google Scholar] [CrossRef]
  20. Amin, M.N.; Alkadhim, H.A.; Ahmad, W.; Khan, K.; Alabduljabbar, H.; Mohamed, A. Experimental and machine learning approaches to investigate the effect of waste glass powder on the flexural strength of cement mortar. PLoS ONE 2023, 18, e0280761. [Google Scholar] [CrossRef]
  21. Sarıdemir, M. Predicting the compressive strength of mortars containing metakaolin by artificial neural networks and fuzzy logic. Adv. Eng. Softw. 2009, 40, 920–927. [Google Scholar] [CrossRef]
  22. Siddique, R.; Aggarwal, P.; Aggarwal, Y. Prediction of compressive strength of self-compacting concrete containing bottom ash using artificial neural networks. Adv. Eng. Softw. 2011, 42, 780–786. [Google Scholar] [CrossRef]
  23. Alahmari, T.S.; Ashraf, J.; Sobuz, M.H.R.; Uddin, M.A. Predicting the compressive strength of fiber-reinforced self-consolidating concrete using a hybrid machine learning approach. Innov. Infrastruct. Solut. 2024, 9, 446. [Google Scholar] [CrossRef]
  24. Maabreh, M.; Almasabha, G. Machine Learning Regression Algorithms for Shear Strength Prediction of SFRC-DBs: Performance Evaluation and Comparisons. Arab. J. Sci. Eng. 2024, 49, 4711–4727. [Google Scholar] [CrossRef]
  25. Jamal, A.S.; Ahmed, A.N. Estimating compressive strength of high-performance concrete using different machine learning approaches. Alex. Eng. J. 2025, 114, 256–265. [Google Scholar] [CrossRef]
  26. Nguyen, M.H.; Ly, H.-B. Development of machine learning methods to predict the compressive strength of fiber-reinforced self-compacting concrete and sensitivity analysis. Constr. Build. Mater. 2023, 367, 130339. [Google Scholar]
  27. Kashem, A.; Karim, R.; Malo, S.C.; Das, P.; Datta, S.D.; Alharthai, M. Hybrid data-driven approaches to predicting the compressive strength of ultra-high-performance concrete using SHAP and PDP analyses. Case Stud. Constr. Mater. 2024, 20, e02991. [Google Scholar] [CrossRef]
  28. Kashem, A.; Karim, R.; Das, P.; Datta, S.D.; Alharthai, M. Compressive strength prediction of sustainable concrete incorporating rice husk ash (RHA) using hybrid machine learning algorithms and parametric analyses. Case Stud. Constr. Mater. 2024, 20, e03030. [Google Scholar] [CrossRef]
  29. Shafighfard, T.; Kazemi, F.; Bagherzadeh, F.; Mieloszyk, M.; Yoo, D.Y. Chained machine learning model for predicting load capacity and ductility of steel fiber–reinforced concrete beams. Comput.-Aided Civ. Infrastruct. Eng. 2024, 39, 3573–3594. [Google Scholar] [CrossRef]
  30. Isleem, H.F.; Qiong, T.; Chukka, N.D.K.R.; Kumar, R.; Nagaraju, T.V.; Hamed, A.Y. Machine learning and nonlinear finite element analysis of fiber-reinforced polymer-confined concrete-steel double-skin tubular columns under axial compression. Struct. Concr. 2025, 26, 248–292. [Google Scholar] [CrossRef]
  31. Raju, M.R.; Rahman, M.; Islam, M.M.; Hasan, N.M.S.; Hasan, M.M.; Sharmily, T.; Hosen, M.S. A Comparative Analysis of Machine Learning Approaches for Evaluating the Compressive Strength of Pozzolanic Concrete. IUBAT Rev. 2024, 7, 90–122. [Google Scholar] [CrossRef]
  32. Altuncı, Y.T. A Comprehensive Study on the Estimation of Concrete Compressive Strength Using Machine Learning Models. Buildings 2024, 14, 3851. [Google Scholar] [CrossRef]
  33. Ali, I.; Suthar, M. Comparison between Random forest and M5P to predict the compressive strength of concrete modified with solid wastes. IOP Conf. Ser. Earth Environ. Sci. 2023, 1110, 012085. [Google Scholar] [CrossRef]
  34. Jain, D.; Bhadauria, S.S.; Kushwah, S.S. Analysis and prediction of plastic waste composite construction material properties using machine learning techniques. Environ. Prog. Sustain. Energy 2023, 42, e14094. [Google Scholar] [CrossRef]
  35. Guan, Q.T.; Tong, Z.L.; Amin, M.N.; Iftikhar, B.; Qadir, M.T.; Khan, K. Analyzing the efficacy of waste marble and glass powder for the compressive strength of self-compacting concrete using machine learning strategies. Rev. Adv. Mater. Sci. 2024, 63, 20240043. [Google Scholar] [CrossRef]
  36. Iannuzzo, A.; Musone, V.; Ruocco, E. A neural network-based automated methodology to identify the crack causes in masonry structures. Comput.-Aided Civ. Infrastruct. Eng. 2024, 39, 3769–3785. [Google Scholar] [CrossRef]
  37. Megahed, K.; Mahmoud, N.S.; Abd-Rabou, S.E.M. Application of machine learning models in the capacity prediction of RCFST columns. Sci. Rep. 2023, 13, 20878. [Google Scholar] [CrossRef]
  38. Biswas, R.; Kumar, M.; Kumar, D.R.; Samui, P.; Rajak, M.K.; Armaghani, D.J.; Singh, S. Application of novel deep neural network on prediction of compressive strength of fly ash based concrete. Nondestruct. Test. Eval. 2024, 1, 1–31. [Google Scholar] [CrossRef]
  39. Alghrairi, N.S.; Aziz, F.N.; Rashid, S.A.; Mohamed, M.Z.; Ibrahim, A.M. Machine learning-based compressive strength estimation in nanomaterial-modified lightweight concrete. Open Eng. 2024, 14, 20220604. [Google Scholar] [CrossRef]
  40. Bahaa, T. Effect of utilizing nano and micro silica on early properties of cement mortar. World Appl. Sci. J. 2014, 29, 370–382. [Google Scholar]
  41. Sherrod, P. DTREG Predictive Modeling Software. Manual for Software. 2008. Available online: www.dtreg.com (accessed on 21 August 2025).
  42. Moguerza, J.M.; Muñoz, A. Support vector machines with applications. Stat. Sci. 2006, 21, 322–336. [Google Scholar] [CrossRef]
  43. Joachims, T. Text categorization with support vector machines: Learning with many relevant features. In Proceedings of the European Conference on Machine Learning, Chemnitz, Germany, 21–23 April 1998; Springer: Berlin/Heidelberg, Germany, 1998; pp. 137–142. [Google Scholar]
  44. Boser, B.E.; Guyon, I.M.; Vapnik, V.N. A training algorithm for optimal margin classifiers. In Proceedings of the Fifth Annual Workshop on Computational Learning Theory, Pittsburgh, PA, USA, 27–29 July 1992; ACM: New York, NY, USA, 1992; pp. 144–152. [Google Scholar]
  45. Sonebi, M.; Cevik, A.; Grünewald, S.; Walraven, J. Modelling the fresh properties of self-compacting concrete using support vector machine approach. Constr. Build. Mater. 2016, 106, 55–64. [Google Scholar] [CrossRef]
  46. Cristianini, N.; Shawe-Taylor, J. An Introduction to Support Vector Machines and Other Kernel-Based Learning Methods; Cambridge University Press: Cambridge, UK, 2000. [Google Scholar]
  47. Salcedo-Sanz, S.; Rojo-Álvarez, J.L.; Martínez-Ramón, M.; Camps-Valls, G. Support vector machines in engineering: An overview. Wiley Interdiscip. Rev. Data Min. Knowl. Discov. 2014, 4, 234–267. [Google Scholar] [CrossRef]
  48. Sopelsa Neto, N.F.; Stefenon, S.F.; Meyer, L.H.; Bruns, R.; Nied, A.; Seman, L.O.; Gonzalez, G.V.; Leithardt, V.R.Q.; Yow, K.-C. A study of multilayer perceptron networks applied to classification of ceramic insulators using ultrasound. Appl. Sci. 2021, 11, 1592. [Google Scholar] [CrossRef]
  49. Mander, J.B.; Priestley, M.J.; Park, R. Theoretical stress-strain model for confined concrete. J. Struct. Eng. 1988, 114, 1804–1826. [Google Scholar] [CrossRef]
  50. Kent, D.C.; Park, R. Flexural members with confined concrete. J. Struct. Div. 1971, 97, 1969–1990. [Google Scholar] [CrossRef]
  51. Yang, L.; Gao, Y.; Chen, H.; Jiao, H.; Dong, M.; Bier, T.A.; Kim, M. Three-dimensional concrete printing technology from a rheology perspective: A review. Adv. Cem. Res. 2024, 36, 567–586. [Google Scholar] [CrossRef]
  52. Wang, K.; Cao, J.; Ye, J.; Qiu, Z.; Wang, X. Discrete element analysis of geosynthetic-reinforced pile-supported embankments. Constr. Build. Mater. 2024, 449, 138448. [Google Scholar] [CrossRef]
  53. Wei, M.; Chen, L.; Lei, N.; Li, H.; Huang, L. Mechanical properties and microstructures of thermally activated ultrafine recycled fine powder cementitious materials. Constr. Build. Mater. 2025, 475, 141195. [Google Scholar] [CrossRef]
  54. Liu, F.; Tang, R.; Li, Q.; Wang, H.; Zou, Y.; Yuan, X. Improved thermal performance, frost resistance, and pore structure of cement–based composites by binary modification with mPCMs/nano–SiO2. Energy 2025, 332, 137166. [Google Scholar] [CrossRef]
  55. Zheng, M.; Zhang, Y.; Yan, S.; Wu, Z.; Li, X.; Wu, D.; Xiong, L. Effect of carrier-encapsulated microbial calcium carbonate on the performance of cement mortar. Constr. Build. Mater. 2025, 483, 141579. [Google Scholar] [CrossRef]
  56. Niu, Y.; Wang, W.; Su, Y.; Jia, F.; Long, X. Plastic damage prediction of concrete under compression based on deep learning. Acta Mech. 2024, 235, 255–266. [Google Scholar] [CrossRef]
  57. Huang, Z.; Luo, Y.; Zhang, W.; Ye, Z.; Li, Z.; Liang, Y. Thermal insulation and high-temperature resistant cement-based materials with different pore structure characteristics: Performance and high-temperature testing. J. Build. Eng. 2025, 101, 111839. [Google Scholar] [CrossRef]
  58. Sun, L.; Wang, X.; Zhang, C. Three-dimensional high fidelity mesoscale rapid modelling algorithm for concrete. Structures 2024, 70, 107561. [Google Scholar] [CrossRef]
  59. Zhang, W.; Lin, J.; Huang, Y.; Lin, B.; Liu, X. State of the art regarding interface bond behavior between FRP and concrete based on cohesive zone model. Structures 2025, 74, 108528. [Google Scholar] [CrossRef]
  60. Huang, H.; Guo, M.; Zhang, W.; Huang, M. Seismic behavior of strengthened RC columns under combined loadings. J. Bridge Eng. 2022, 27, 05022005. [Google Scholar] [CrossRef]
  61. Huang, H.; Li, M.; Yuan, Y.; Bai, H. Theoretical analysis on the lateral drift of precast concrete frame with replaceable artificial controllable plastic hinges. J. Build. Eng. 2022, 62, 105386. [Google Scholar] [CrossRef]
  62. Yaman, Z.; Sümer, Y.; Ağcakoca, E.; Maali, M.; Aydın, A.C. Behavioral analysis of steel I-beams under repeated dynamic loads: Impact of various impactor head types. Dev. Built Environ. 2025, 21, 100620. [Google Scholar] [CrossRef]
  63. Dikmen Coşkun, K.; Yaman, Z.; Maali, M.; Ağcakoca, E.; Sadid, M.S. The effects of corrosion damage on the square hollow steel section (SHSS) profiles: An experimental and numerical investigation. Arab. J. Sci. Eng. 2024, 49, 6125–6144. [Google Scholar] [CrossRef]
  64. Nasery, M.M.; Ağcakoca, E.; Yaman, Z. Experimental and numerical analysis of impactor geometric shape effects on steel beams under impact loading. Structures 2020, 27, 1118–1138. [Google Scholar] [CrossRef]
  65. Maali, M.; Ağcakoca, E.; Nasery, M.M.; Macit, F.; Aydin, A.C. Post fire performance of galvanized cylindrical shells for buckling failure. Arch. Civ. Mech. Eng. 2024, 24, 125. [Google Scholar] [CrossRef]
  66. Aydin, A.C.; Yaman, Z.; Ağcakoca, E.; Kiliç, M.; Maali, M.; Aghazadeh Dizaji, A. CFRP effect on the buckling behavior of dented cylindrical shells. Int. J. Steel Struct. 2020, 20, 425–435. [Google Scholar] [CrossRef]
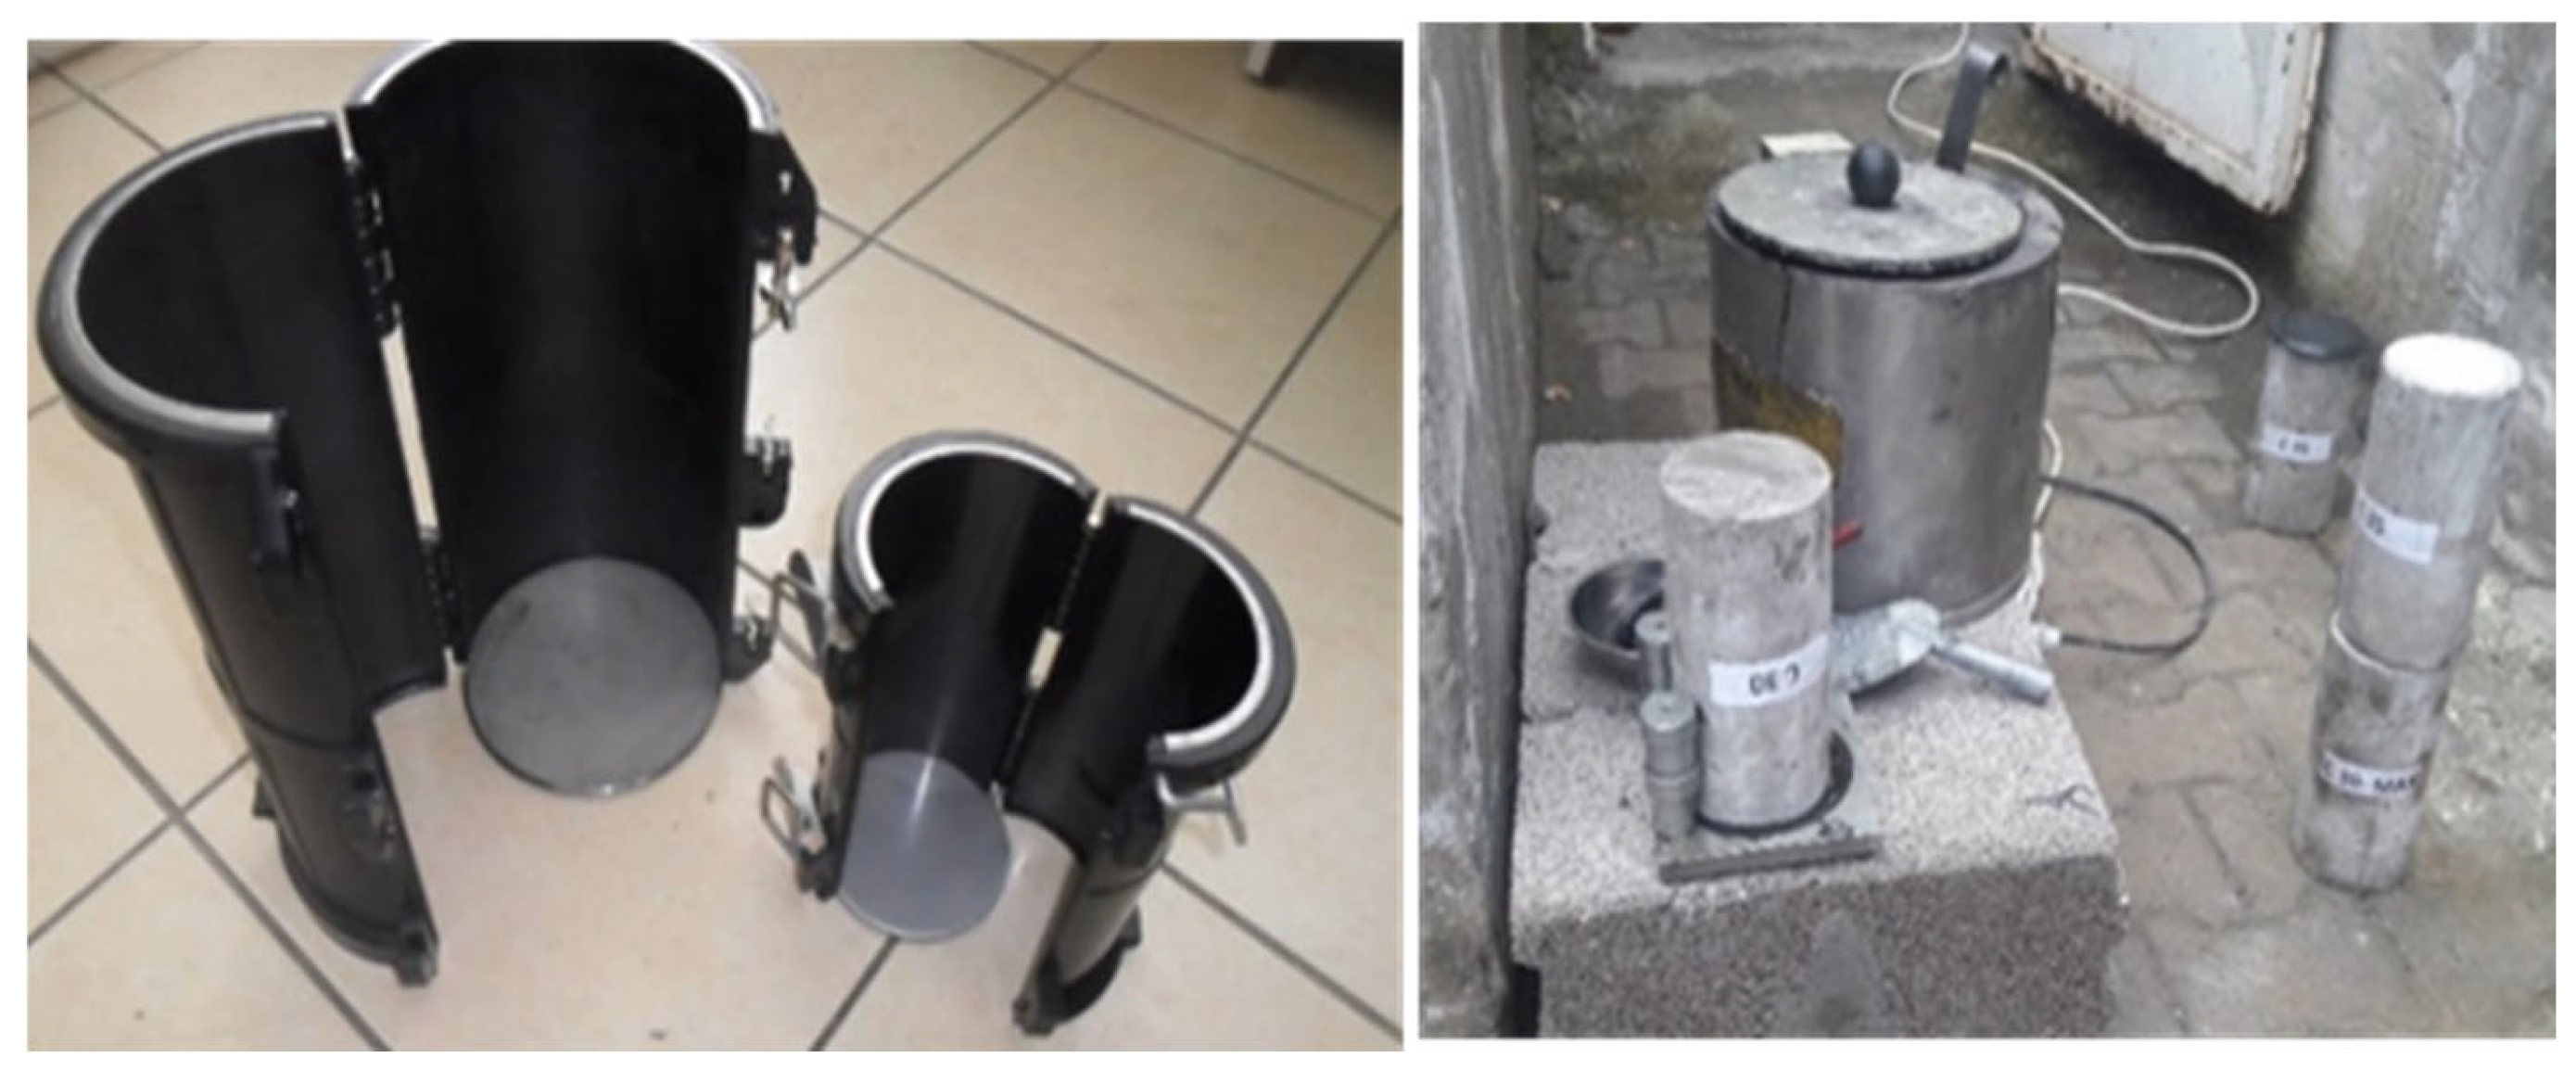
Figure 1. Preparation of concrete samples.
Buildings 15 03026 g001
Figure 2. Concrete CDP model under tension and compression, showing: (a) compressive behavior, (b) tensile behavior, (c) results of varying the dilation angle, and (d) mesh sensitivity analysis of the finite element model.
Buildings 15 03026 g002aBuildings 15 03026 g002b
Figure 3. Models of concrete behavior under uniaxial compression: (a) Mander concrete model, (b) Kent and Park concrete model, and (c) Hognestad concrete model.
Buildings 15 03026 g003aBuildings 15 03026 g003b
Figure 4. Concrete behavior model under uniaxial tension, illustrating: (a) bilinear tensile behavior, (b) biaxial yield surface of concrete in the CDP model, and (c) stress–strain models for C20 class concrete.
Buildings 15 03026 g004aBuildings 15 03026 g004b
Figure 5. The evaluation metrics of SVM and MLP methods for Fc including training and testing.
Buildings 15 03026 g005
Figure 6. Relation between the experimental and predicted Fc, using: SVM-RBF training (a), testing (b), SVM–polynomial kernel training (c), testing (d), and MLP training (e), testing (f).
Buildings 15 03026 g006
Figure 7. The evaluation metrics of SVM and MLP methods for Fs including training and testing.
Buildings 15 03026 g007
Figure 8. Relation between the experimental and predicted Fs, using: SVM-RBF training (a), testing (b), SVM–polynomial kernel training (c), testing (d), and MLP training (e), testing (f).
Buildings 15 03026 g008
Figure 9. Results from different concrete models for C20 class concrete: (a) experimental view and FEM results with the Mander model, (b) experimental view and FEM results with the Hognestad model, and (c) experimental view and FEM results with the Kent and Park model.
Buildings 15 03026 g009
Table 1. Input and output parameters employed in statistical analysis.
VariableCompressive DataFlexural Data
MinimumMaximumMeanStd. Dev.MinimumMaximumMeanStd. Dev.
W/C0.3960.6320.5320.0530.3800.6320.4870.082
S/C2.2204.4923.2910.4852.2224.6503.4960.534
NS/C (%)00.1100.0420.02800.1110.0330.032
MS/C (%)00.3880.0750.09700.3880.0580.102
Age (day)32814.6959.800
Fc28 (MPa)5.65087.90020.68422.307
Fs28 (MPa) 3.6009.2106.7051.894
Table 2. Values of various optimal model parameters of SVM and MLP architecture parameters.
MethodsRBF KernelPolynomial KernelMLP
Model parametersCγεCγdLayerNeuronsActivation
Fc7230.420.830.001487.090.2243input5Passthru
hidden4Logistic
output1Logistic
Fs49.941.060.0016.470.2243input4Passthru
hidden3Logistic
output1Logistic
Table 3. R2, MSE, RMSE, and MAPE of SVM and MLP methods for Fc including training and testing.
MethodsTraining ResultsTesting Results
R2MSERMSEMAPE (%)R2MSERMSEMAPE (%)
SVMRBF0.9990.1790.4221.1730.95033.9945.83112.556
Polynomial0.96815.1403.89127.6840.84896.0039.79868.655
MLP0.94824.3414.93439.8230.94534.3675.86244.900
Table 4. R2, MSE, RMSE, and MAPE of SVM and MLP methods for Fs including training and testing.
MethodsTraining ResultsTesting Results
R2MSERMSEMAPE (%)R2MSERMSEMAPE (%)
SVMRBF0.9930.0270.1632.4230.9770.0100.3164.222
Polynomial0.9850.0530.2312.8710.9430.2420.4926.281
MLP0.9550.1500.3874.3230.9190.2890.5385.708
Disclaimer/Publisher’s Note: The statements, opinions and data contained in all publications are solely those of the individual author(s) and contributor(s) and not of MDPI and/or the editor(s). MDPI and/or the editor(s) disclaim responsibility for any injury to people or property resulting from any ideas, methods, instructions or products referred to in the content.