Article

Building Energy Assessment of Thermal and Electrical Properties for Compact Cities: Case Study of a Multi-Purpose Building in South Korea

by
Jaeho Lee
and
Jaewan Suh
*
Department of Electrical Engineering, College of Engineering, Incheon National University, Incheon 22035, Republic of Korea
*
Author to whom correspondence should be addressed.
Buildings 2025, 15(17), 3023; https://doi.org/10.3390/buildings15173023 (registering DOI)
Submission received: 19 June 2025 / Revised: 6 August 2025 / Accepted: 12 August 2025 / Published: 25 August 2025
(This article belongs to the Special Issue Study on Building Energy Efficiency Related to Simulation Models)

Abstract

This study conducts a simulation-based assessment of a recently commissioned office building in the Republic of Korea, representing a typical public office facility. The building was modeled using EnergyPlus 23.1.0 after construction, although no validation was performed due to the absence of metered consumption data. Previous approaches relying on simplified methods such as the Radiant Time Series (RTS), which neglect dynamic building behavior, have often led to overestimated cooling and heating loads. This has emerged as a major obstacle in designing energy-efficient buildings within the context of compact and smart cities pursuing carbon neutrality. Consequently, the trend in building performance analysis is shifting toward dynamic simulations and digital twin-based design methodologies. Furthermore, electrification of buildings without adequate thermal load assessment may also contribute to overdesign, irrespective of urban environmental characteristics. From an urban planning standpoint, there is a growing need for performance criteria that reflect occupant behavior and actual usage patterns. However, dynamics-based building studies remain scarce in the Republic of Korea. In this context, the present study demonstrates that passive design strategies, implemented through systematic changes in envelope materials, HVAC operational standards, and compliance with ASHRAE 90.1 criteria, can significantly enhance thermal comfort and indoor air quality. The simulation results show that energy consumption can be reduced by over 36.21% without compromising occupant health or comfort. These findings underscore the importance of thermal load understanding prior to electrification and highlight the potential of LEED-aligned passive strategies for achieving high-performance, low-energy buildings.

1. Introduction

Owing to the global demand to achieve carbon neutrality and concerns about energy security, efforts to achieve carbon neutrality have become paramount. A recent report by the World Nuclear Association (WNA) reveals that fossil fuel-based generation resources accounted for 40% of carbon emissions as of May 2021, with densely populated cities contributing 60% [1]. As one of the measures, smart cities oriented towards introducing energy-saving opportunities have been actively and voluntarily developed in member states of the European Union (EU) [2,3]. However, voluntary participation in smart city initiatives cannot be achieved solely through the compulsion of authorities, such as the forced curtailment of energy demand by sacrificing occupants’ comfort. Thus, leadership initiatives in smart cities have asserted the need to develop balanced energy-saving strategies in the building sector without compromising comfort [4,5,6]. However, because these measures have focused on building operations as active measures when a building is commissioned, they have not considered the potential greenhouse gas (GHG) emissions from the lifecycle perspective of the building.
In the United States, building operations contribute to 40% of the total energy consumption, and the building energy sector is responsible for 29% of all GHG emissions. Before the emergence of attention to climate change due to GHG emissions, such emissions from direct energy consumption were considered [7,8].
However, the trends towards considering GHG emissions have begun shifting to include GHG emissions from the perspective of the entire life cycle, considering the production of building materials [9,10]. Therefore, the calculation of carbon emissions includes emissions during the use of a building and emissions generated during the design and construction processes before commercial operation.
Consequently, GHG emissions from buildings contribute to 48% of the total annual emissions in the United States, with 36% originating from building operations and 12% from construction. These emissions fall under the category of embodied carbon emissions per building, as outlined by Shingler [11].
As the focus on sustainable development increases in consideration of energy-saving opportunities from passive design factors in buildings, Leadership in Energy and Environmental Design (LEED) criteria have emerged as generalizable standards for building operations throughout the entire life cycle [12,13]. A major reason for designating LEED criteria in simulation environments is their alignment with the environmental and energy requirements of smart cities [14,15]. Table 1 compares the registration criteria of LEED with the principles of smart cities. It assesses energy efficiency, environmental impact, and ethical benefits for residents and neighbors. This analysis combines the planning philosophies of sustainability and smart city concepts [16,17].
As evidenced by the numerous smart city projects worldwide, many buildings have obtained LEED certification. The city of Songdo, Republic of Korea, near the metropolitan city of Incheon, is actively participating in the state-launched smart city initiative and has drawn considerable attention, particularly in the green building industry, owing to its high concentration of LEED certifications [18]. Because the ultimate design motto of a smart city revolves around sustainable infrastructure for coexistence, where smartness does not necessarily imply sustainability, the design motto of a LEED city was deemed appropriate for the current simulation [19,20].
In addition to cases reported in the Republic of Korea, LEED cities have been developed in Brazil, Russia, India, and China (BRICS) to participate in sustainable development [21,22]. Currently, such federations are known as nations disinterested in achieving carbon neutrality owing to greater dependency upon the generation resources by fossil fuels by considering nation-varying economic reasons [23]. However, introducing a standardized framework for passive building designs could contribute to the requirements for thermal load in terms of building operations, regardless of energy security [24].
In addition to the passive factors that exacerbate reduction opportunities for GHG and energy consumption, initiatives such as the green button focused on active measures have been promoted in very recent periods [25]. One of the significant factors in green button initiatives to minimize is the energy consumption of heating, ventilation, and air conditioning (HVAC) operations [26,27]. However, because of their highly nonlinear characteristics and complicated operational mechanisms, volunteers find it challenging to develop and diagnose measures applicable to their buildings [28]. Thus, precise energy consumption assessments must be conducted using a simulation tool that can provide component-wise responses [29]. However, these initiatives also focus on active measures that control electrical loads when the building is commissioned.
Moreover, despite efforts towards the promotion of voluntary participation in active measurements by controlling the electrical load resources by providing additional incentives proportional to its curtailed kilowatt capacity, the stakeholders responsible for the consultancy of the potential curtailment capability have been registering the availability of curtailment capacity by considering only the nominal capacity of the devices on the nameplate [30,31].
General operations of HVAC with constant air volume (CAV) systems, commonly installed owing to their cost, have demonstrated that the electrical load is highly dependent on thermal energy consisting of human activities, ventilation requirements, and weather conditions, which are passive factors [32,33]. Hence, exhuming the energy-saving potential without a precise diagnosis of the system is virtually impossible, and the passive factors in the building have been considered as influential factors for the thermal gains and losses that determine HVAC efficiency [34,35]. Therefore, control logic and diagnosis in steps capable of incorporating passive and active measures must be developed [36,37]. EnergyPlus 23.1.0 is considered a reliable engine that can provide solutions of the desired quality. In contrast, the widely utilized radiant time sites (RTSs) cannot perform precise simulations based on the structural environment of the actual site [38,39].
Moreover, most previous studies focused on the operational logic of HVAC with variable air volume (VAV) systems, whereas HVAC with CAV systems is dominant in land markets because of its cost efficiency. Furthermore, previous studies related to energy-saving potential from the perspective of thermal and electrical energy have dealt with the analysis in a separate manner, without a system-wide integrative and interactive analysis of the design phases and components of HVAC. For instance, Abuseif et al. [40], Song et al. [41], Edun et al. [42], Chen et al. [43], and Navia-Osorio et al. [44] reported the effect of changing the roof envelope as a passive measure and observed its effects on the electrical load. However, critical design parameters as passive measures in a building are not restricted by envelopes alone.
From the perspective of active measures, Queiroz et al. [45], Zhang et al. [46] and Xie et al. [47] studied ventilation strategies and their effects on thermal load calculations. However, these analyses were limited to the effects of ventilation on active measures, without considering passive measures.
The adaptation of digital-twin-driven building designs that consider dynamics has recently attracted interest, whereas the majority of previous design methods were based on steady-state or RTS-driven approaches. Thus, this paper presents the effectiveness of a building design method that incorporates dynamic characteristics during the initial design phases but considers potential effects during the operational phase of the building.
The major contributions of this paper are summarized as follows:
  • Technical necessities and contributions from digital-twin-based building designs from the perspective of urban planning are discussed.
  • A methodology for assessing passive and active energy curtailment capability in design phases is proposed.
  • The impact of changes in design criteria on occupant thermal comfort.
  • CO2 discomfort standards are analyzed.
From a governmental standpoint, where generalizable and standardized instruction dissemination is prioritized, the use of simplified cooling load estimation methods remains a preferred approach for designers due to its intuitive applicability. One such method, the Radiant Time Series (RTS) method developed by ASHRAE, serves as a conventional baseline in estimating peak cooling loads. The RTS method distributes internal and external heat gains over time using standardized profiles, offering a straightforward and consistent framework for early-stage design.
However, reliance on this method has led to systematic overestimations of building system capacities, particularly in cases where energy-efficient design strategies are employed. This is primarily due to the RTS method’s inherent limitations in capturing the dynamic and transient behaviors of real buildings. In contrast, simulation tools such as EnergyPlus incorporate real-time control strategies, thermal mass interactions, and ventilation dynamics, offering a more nuanced and temporally resolved representation of thermal loads. Therefore, the comparative analysis between RTS-based estimations and EnergyPlus-based simulations reveals critical discrepancies, emphasizing the need for dynamic modeling in accurately assessing energy performance.
Table 2 provides comparative analysis between the previous studies and the proposed study that were performed from the perspective of the whole-building analysis. The proposed study focuses on a university campus building in South Korea, providing insight into the energy dynamics of education facilities. In contrast, Camblong et al. [48] analyze a real residential or mixed-use building in Europe, while Pérez-Carramiñana et al. [49] examine a real office building in Spain. This variation in building typologies enables a diverse understanding of energy consumption patterns across different functional categories.
From the perspectives of load characteristics, evaluating both electricity and thermal energy requirement, particularly emphasizing HVAC performance. Camblong et al. [48] focus on photovoltaic integration and EMSs (Energy Management Systems) to enhance self-consumption. Pérez-Carramiñana et al. [49] primarily address heating energy and thermal comfort, especially under regulatory changes triggered by geopolitical events.
A key strength of the proposed analysis is its use of EnergyPlus and OpenStudio, industry-standard simulation tools that offer detailed thermodynamic modeling. Camblong et al. [48] apply a rule-based EMS, while Pérez-Carramiñana et al. [49] adopt a simulation-based assessment framework tailored to policy evaluation. Each tool is selected to suit the study’s objectives that are control logic vs. performance benchmarking vs. code compliance.
The proposed study adheres to LEED v4.1 [50] and ASHRAE 55 [51], ensuring international standardization and comparability. Camblong et al. [48] implement PV self-consumption regulations, likely aligned with EU directives. Pérez-Carramiñana et al. [49] evaluate the Spanish energy-saving standards (2022), revealing how national regulations impact comfort and performance. This policy diversity illustrates how energy performance is shaped by both global and local frameworks.
Comfort in the proposed analysis is quantified using PMV (Predicted Mean Vote), RH (Relative Humidity), and CO2 concentration, covering both thermal and indoor air quality. Camblong et al. [48] focus on electricity optimization, indirectly improving comfort by stabilizing supply. Pérez-Carramiñana et al. [49] specifically assess PMV and temperature satisfaction, linking regulatory heating limitations to occupant well-being.
The three studies collectively contribute to the evolving discourse on building energy efficiency. While differing in scope and tools, they all emphasize the importance of integrating local climate conditions, occupant comfort, and regulatory compliance into performance-based energy design. The proposed analysis uniquely bridges passive and active design strategies using LEED-compliant simulations, providing a robust and transferable framework for education and public buildings across temperate climates.
This paper presents a structured analysis using EnergyPlus that considers the criteria set by LEED and the coordination of a HVAC system with CAV and a dedicated outdoor air system (DOAS), considering the characteristics of multipurpose buildings capable of generalization. The remainder of this paper is organized as follows: Section 2 describes the applicable LEED protocols in the present case study and the simulation environment for each case. Section 3 presents and discusses the results. Finally, Section 4 concludes the paper.

2. Materials and Methods

Assessments of building energy consumption generally follow the protocols set by either the American Society of Heating, Refrigerating, and Air-Conditioning Engineers (ASHRAE) or specific LEED versions. LEED protocols are often derived from the ASHRAE standards, as in LEED v4.1, which uses ASHRAE 90.1-2016 as a benchmark for evaluating building performance improvements.

2.1. LEED Criteria and Design Strategies

LEED Building Design and Construction (BD+C) is primarily applied during the design and construction phase of new buildings or major renovations, focusing on proactive integration of sustainability from the outset. In contrast, LEED Existing Building Operation and Maintenance (EBOM) targets existing buildings that have been in operation for at least two years, emphasizing performance-based assessments and ongoing operational improvements with minimal structural alterations that are typically under 50%.
As shown in Table 3, each protocol encompasses distinct eligibility criteria, intervention strategies, and performance metrics that must be considered independently when evaluating sustainability outcomes. EBOM was considered eligible for this simulation because it aligns with the qualification criteria. Table 3 shows the overlaps between BD+C and EBOM criteria. Key aspects such as Indoor Air Quality (IAQ), Thermal comfort (TC), and Energy Efficiency (EE) under indoor environmental quality (IEQ) are consistent across both protocols, adhering to the baseline standard 90.1-2016. This case study focused on modifications in the envelope properties from the initial design, without considering the properties of ASHRAE 90.1-2016, IAQ, TC, and EE, following the specified design densities. EBOM primarily aims to enhance IAQ by setting minimum standards to improve occupant health and comfort. For the subject building, compliance with the ASHRAE Standard 62.1-2016 [52] is required in the states or equivalent CEN standards elsewhere. This study selected the ASHRAE Standard 62.1-2016, aligning with the building envelope changes considered.
The design flow considered in the simulation is presented in Table 4. It contrasts a standard reference case with three distinct scenarios: active, passive, and integrated measures, all set against a backdrop of consistent initial conditions, such as operation under a CAV system and fixed utility tariffs.
The set-point controller for each thermal zone was designed for zone-average conditioning because of the technical characteristics of CAV-HVAC. The temperature ranges for the reference cases were designed to comply with the local recommendations of the government. For the reference case, the winter temperature was set to be between 17 and 23 °C, whereas the summer values were between 26 and 28 °C. Additionally, a night cycle operation schedule was applied in the simulation. The climate environment was considered accordingly to the conditions represented in Appendix A.
Relevant thermal comfort set-points for the breathing zones considered in the cases in compliance with LEED v4.1 are based on a Predicted Mean Vote (PMV) range of −0.5 to 0.5, with relative humidity (RH) levels selected for occupant health. Air velocity in breathing zones was set to 0.2 m/s, accounting for occupant clothing schedules that were 0.5 in summer and 1.0 in winter. The metabolic rates of the occupants from 1.0 to 1.3 met were considered suitable for office work and low-demand physical activity. Temperatures for cold and heat stress thresholds were considered to be at 22 °C, at which elderly occupants would begin feeling discomfort, and 27 °C, which is the initial temperature for the stress chart.

2.2. Building Envelope

The subject education hall in Siheung, Republic of Korea, part of the university campus in the present simulation, was commissioned in 2020. Figure 1a shows the education hall. The subject education hall consisted of 10 stories, an underground parking lot, and a centralized HVAC control room. The hall was constructed in compliance with the design regulations applicable for construction in the metropolitan area of Incheon, as specified by the Ministry of Land, Transportation, and Infrastructure (MOLIT) in the Republic of Korea, and a centralized HVAC control room. The hall was constructed in compliance with the design regulations applicable for construction in the metropolitan area of Incheon, as specified by the Ministry of Land, Transportation, and Infrastructure (MOLIT) in the Republic of Korea.
The actual material properties of the education hall considered in the simulation are listed in Table 5. Because of the wide variety of material properties at the site, the material properties most commonly used in each space type, considered thermal zones as occupant spaces, were considered representative properties in each space in the simulation.
The properties of each material were obtained from references provided by the material standards established by MOLIT in the Republic of Korea. The specifications of the doors were not considered, except for the thickness and types of material, because the material properties were absent. The thickness represented in Table 5 is not the value from the regulation but was directly measured from the site using laser-guided measurement tools.

2.3. Internal Heat Gain

The input parameters in Table 6 were obtained directly from the actual parameters applied for the initial design phase of the subject education hall. Computer laboratories and coffee stations were considered part of classrooms and cafeterias in space types.
For replacement by the ASHRAE Baseline 90.1-2016 criteria, the coffee stations and computer laboratories considered to be cafeterias and classrooms were reconfigured separately as the space types of lounges and laboratories. Currently, no applicable or relevant ventilation standards exist for the operation of buildings in the Republic of Korea regarding the concentration level of CO2. Thus, recommendations from municipal health organizations were introduced. As the library was originally designed for an administrative office, the design density used for the initial phase analysis was the same as the parameters for the administrative office.
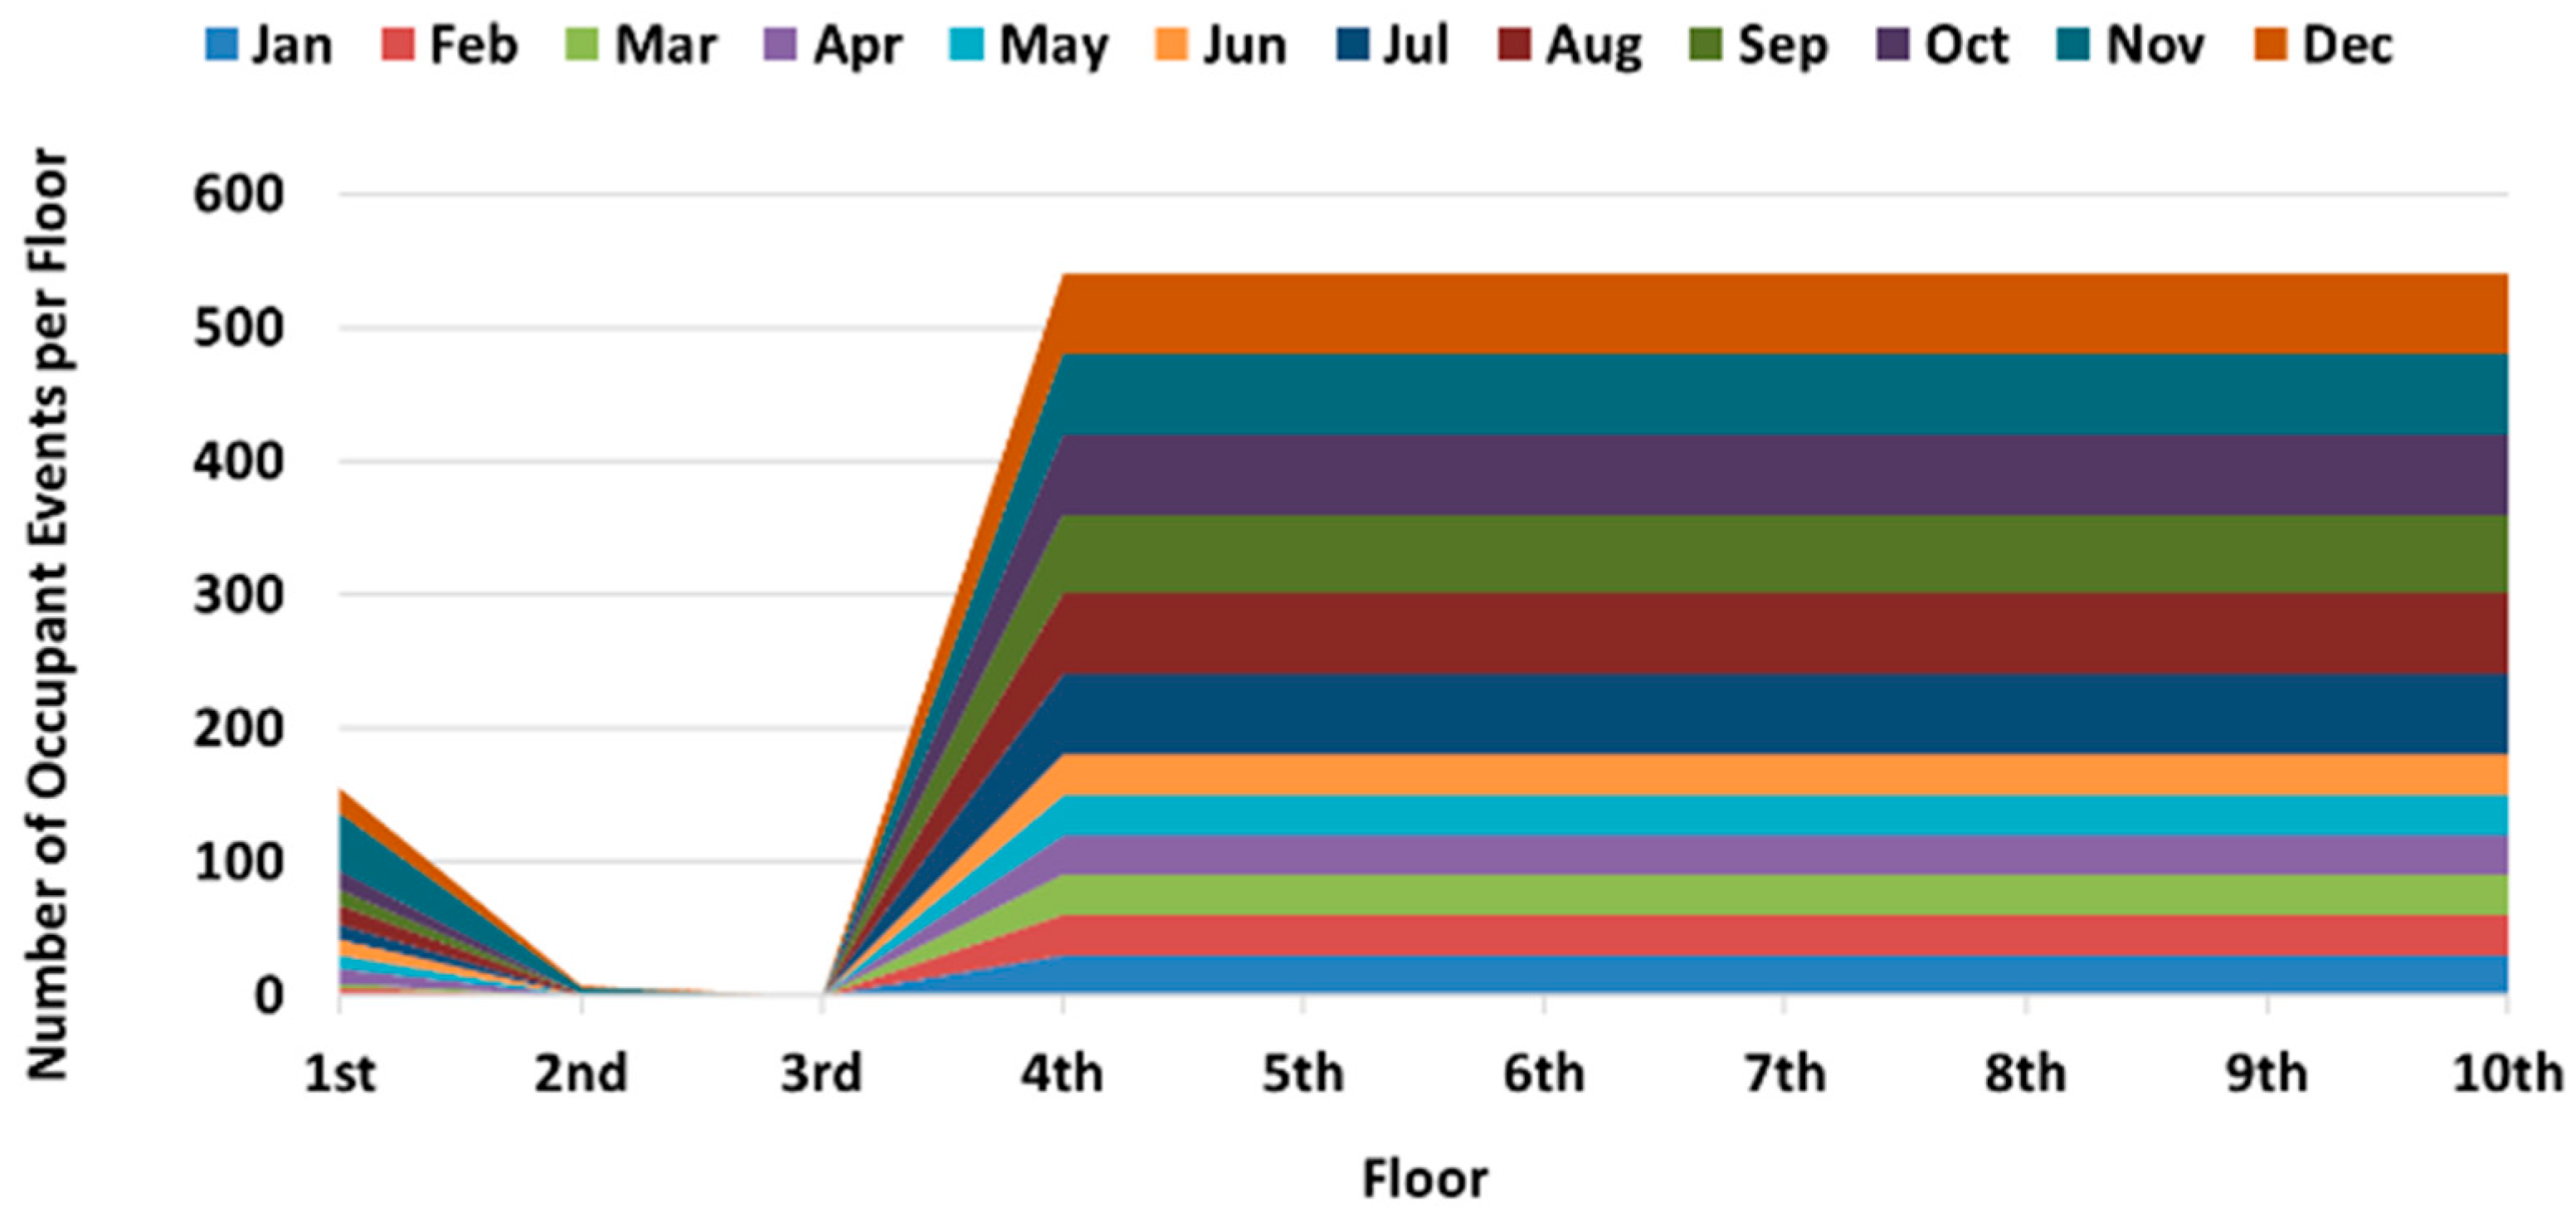
Figure 2 shows the occupation history of the entire subject education hall from July 2020 to December 2021. As illustrated, the occupancies were concentrated in the 4th to 10th stories. Regarding the events in the 4th to 10th stories, the frequencies were considered equal for each story because the central HVAC operators were requested to run the facility at the occupants’ request as long as the inhabitants resided in the stories. Furthermore, considering the purpose of the 7th to 9th stories, they were connected with open staircases. The 7th to 10th stories were utilized for administrative work. In contrast, the 1st to 3rd stories were primarily for the lobby with small meeting rooms in an open space with broad access to outdoor air and were not often occupied. The number of occupancy events effective for outdoor-air-handling-unit (OHU) schedules was postulated to be the day excluding official holidays in the Republic of Korea.
Because of the absence of occupational histories with hourly granularity, references provided by the Department of Energy (DOE) were considered. Therefore, the simulation considered ruleset schedules applicable to colleges from references provided by the DOE. Additionally, the occupant comfort model of ASHRAE 55 [51] with clothing schedules was considered in the simulation to be comparable with LEED criteria.

2.4. Central HVAC System

The flow of the heat source installed in the system is shown in Figure 3. Water resources for the education hall have been supplied through two separate supply pipelines. The cold water for domestic use has been supplied by the local water resources entity supplied by Korea Water Resources Corporation (K-water), and the hot water at 115 °C has been supplied by Korea District Heating Corporation (KDHC). Furthermore, because the primary purpose of the present study was not to discover the energy-saving capability through a simple postulation by replacing the heat sources for ease of simulation, an HVAC system with absorption chillers was considered to maximize the applicability of the present model in compliance with local regulations.
In the current operation, the flow meters installed at the entrances of the supply and discharge pipes are the only measurements available in the current system. However, the operators did not record the history, and access to it was limited to the simulation. Thus, the intraday amount of water resources required was postulated to be auto-sized by EnergyPlus based on the heating and cooling demands of the subject education hall.
In addition, for the digital twin to be eligible for LEED certification, the HVAC system must be auto-sized. The central conditioning system separately processes the hot water supplied primarily by KDHC, whether the water resources are for air conditioning or domestic water use. The HVAC system, operated by medium-hot and chilled water in the subject education hall, consists of separate water circulation loops for each fan coil unit (FCU), OHU, and domestic water resource.
Considering the local operational instructions for the central HVAC system, the hot water loop (HWL) supplying hot water to the OHUs and FCUs was scheduled to be off from June to August. The intraday operation window was set to shut down the system at 21:00 and turn it on at 06:00, considering the intraday end of the occupancy schedules and preheating procedures that generally turn on the HVAC system an hour ahead.

2.5. Utility Environment

The utility tariff applied in the simulation consisted of a tariff on water resources regulated by the KDHC. For the utilization prices of water resources for the conditioning processes, the end-user may select the options to participate in the time-variant tariff or the uniform tariff system depending on the type of HVAC system, whether it is a centralized or decentralized system, as summarized in Table 7. Table 8 presents seasonal time-of-use (TOU) tariff standards for the electricity consumption.

3. Results and Discussion

This section analyzes the simulation results for the CAV HVAC system at the test site equipped with an absorption chiller and heat exchangers. Given the primary function of the test site on the university campus, the work efficiency schedule was set to zero. Section 3.1 evaluates the economic viability of the HVAC system, including its energy efficiency and impact on thermal comfort. Section 3.2 assesses thermal comfort breaches, detailing hourly and annual fluctuations in Mean Air Temperature (MAT) and RH. Section 3.3 describes the IAQ.
It should be acknowledged that simulation-based results may deviate from actual building performance due to uncertainties in input assumptions, occupant behavior, and operational schedules. In the absence of post-occupancy validation data, the outcomes presented in this study should be interpreted as indicative estimates rather than precise predictions. Nonetheless, the modeling approach followed established standards and design documentation, ensuring a reasonable degree of representativeness. Future studies incorporating monitored data would help narrow the performance gap and further enhance the reliability of simulation-based assessments.

3.1. Economic Feasibility

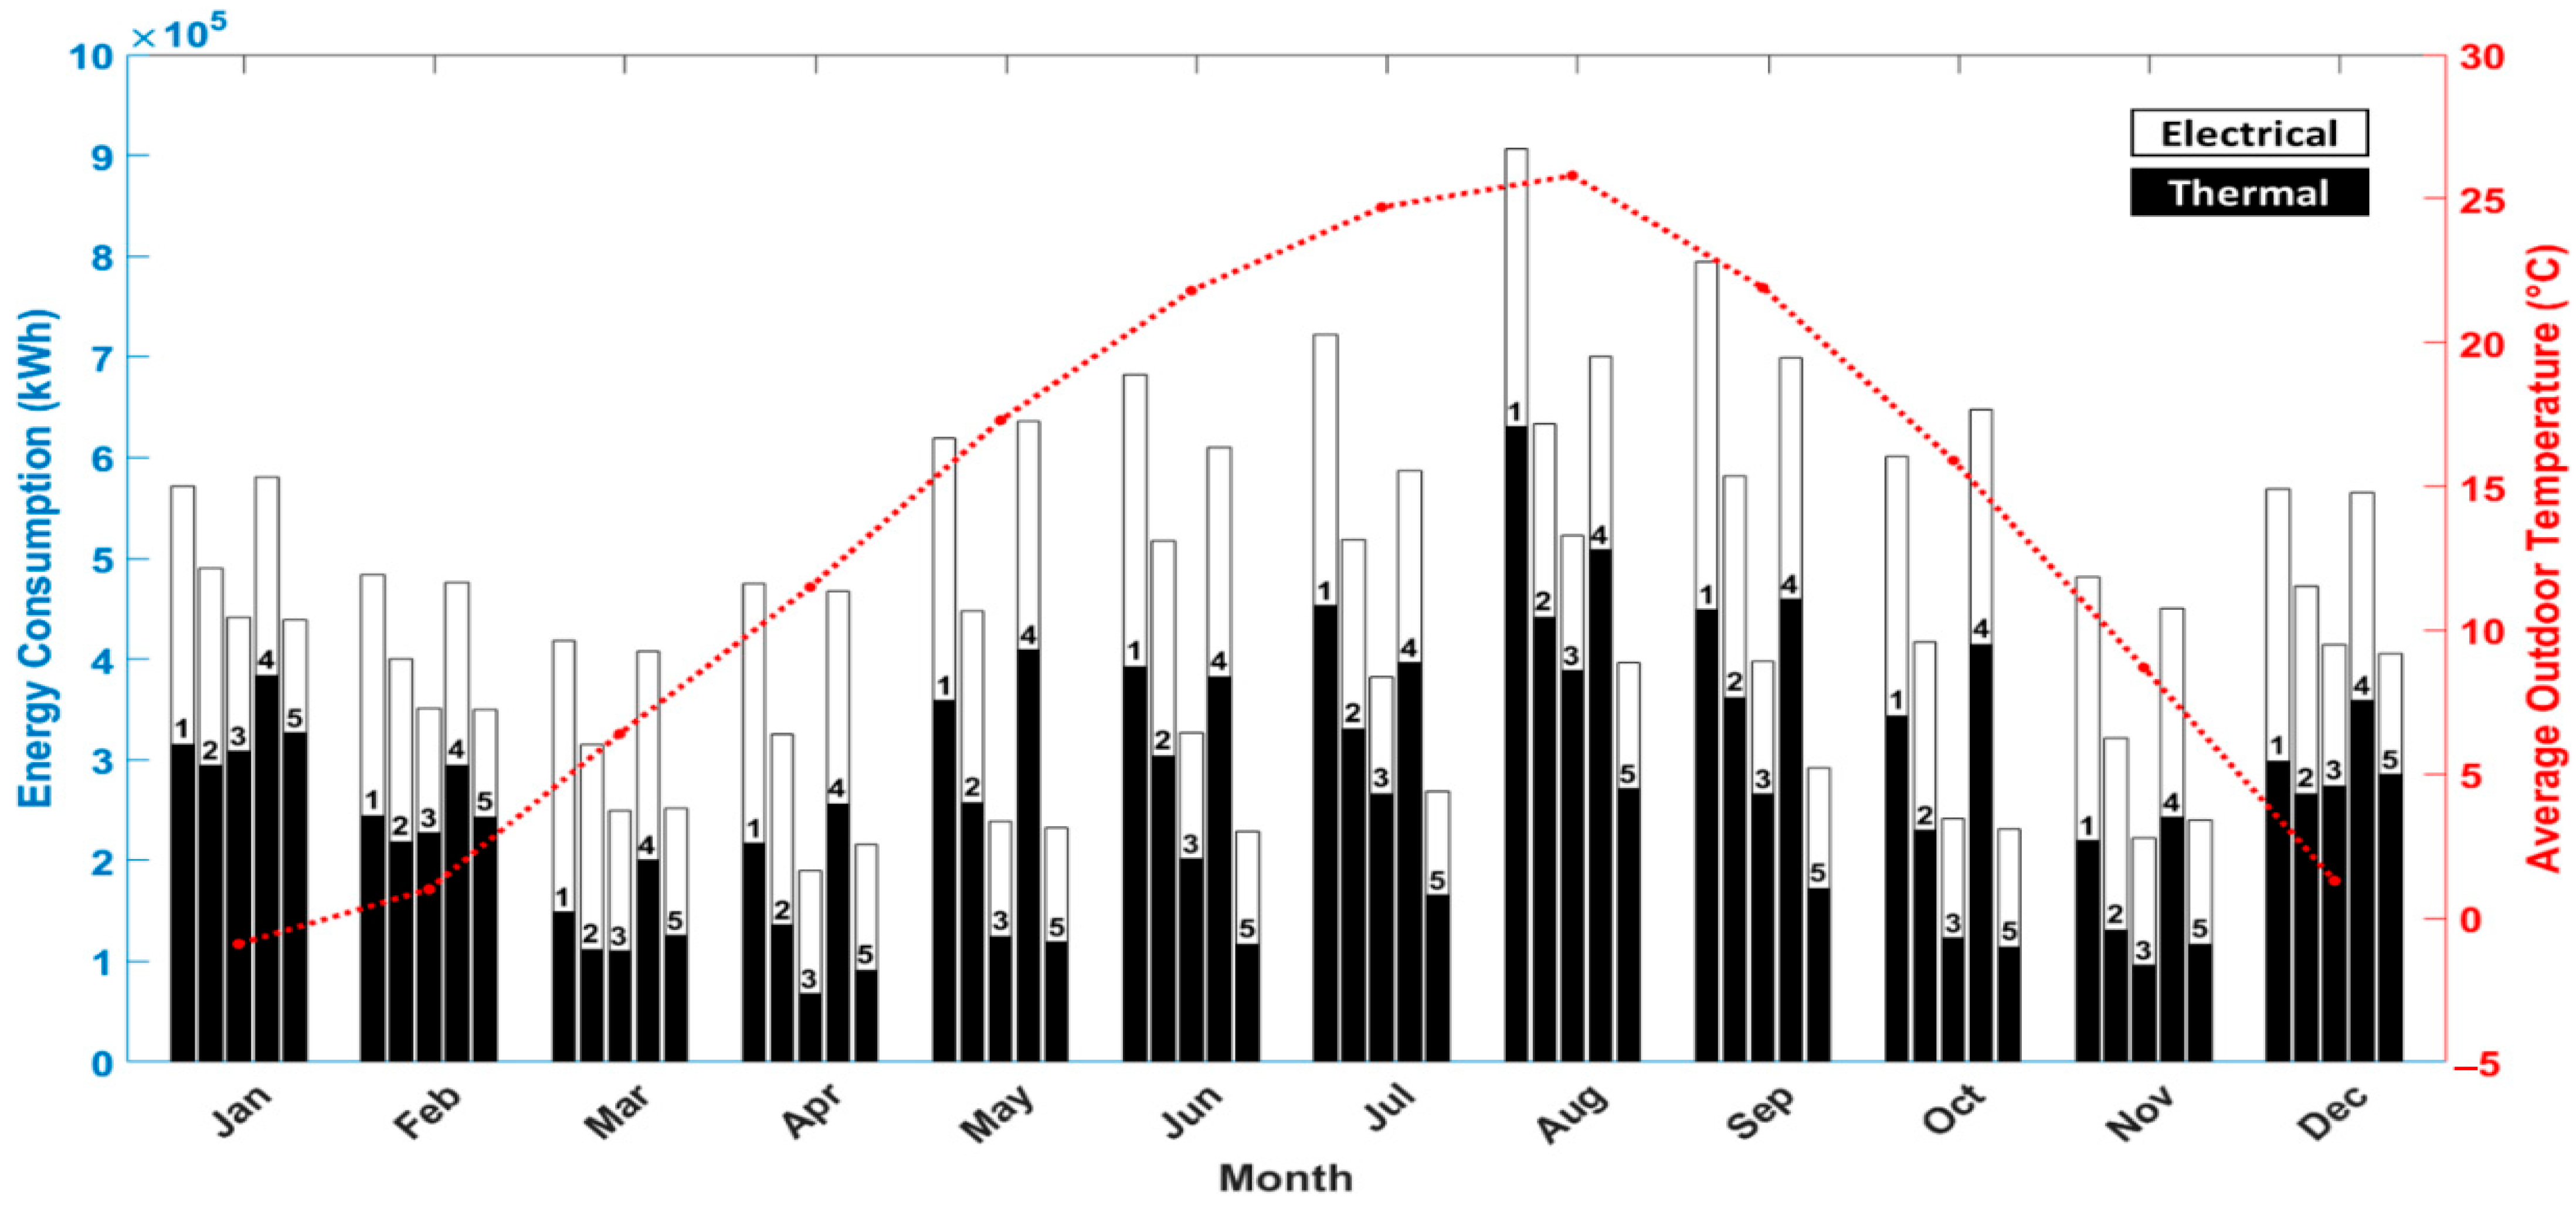
Figure 4 shows the energy consumption from the thermal and electric loads differentiated by black and white segments for thermal and electrical energy, respectively. The stacked bars indicate the energy usage across various case scenarios. Case 1, the reference scenario, recorded the highest energy consumption of 7,323,502 kWh, whereas Case 3 had the lowest energy consumption of 3,978,263 kWh owing to internal heat parameter adjustments. The data across all cases indicate the need for revisions in building codes in the Republic of Korea owing to the observed reductions in total energy consumption.
Excluding Case 5, in which the comprehensive LEED v4.1 design conditions were implemented, the ratio of thermal to electrical consumption was maintained at approximately 60% to 40%. In contrast, a significant shift was observed in Case 5, where 46% of the energy consumption was attributed to thermal use and 54% to electrical use, resulting in a 36.21% reduction in annual energy consumption. The most substantial energy reductions were recorded in Case 5 during the summer peak season, which is typically the most challenging period for system operators, with a 59.19% decrease compared with the reference case. From the perspective of electricity use, reductions of 22% and 53.09% were achieved in Cases 5 and 3, respectively, even in the absence of demand response measures.
During the peak summer periods, the lowest electrical energy consumption was recorded in Case 5, with a reduction of 58.16%. In terms of thermal energy, the lowest consumption was also demonstrated by Case 5, with 436,228 kWh consumed, in contrast to 903,519.45 kWh in Case 4 and 654,794.17 kWh in Case 3, both of which were characterized by adjusted design parameters. The importance of holistic design modifications in achieving optimal energy efficiency was underscored.
Table 9 shows the annual energy requirements for the heat rejection processes in the cooling tower across different scenarios and the correlation between consumption and monthly outdoor air temperature (OAT). Heat rejection involves dissipating excess thermal energy from the cooling system, which serves as an indicator of HVAC system efficiency. The effectiveness of the cooling tower in expelling thermal energy was determined by the energy received from the chiller and the energy used by its fans. This relationship mirrors the fluctuations in the annual energy consumption.
The monthly thermal-energy demand is shown in Figure 4. Notably, Case 5 achieved a significant reduction in thermal energy dissipation, approximately 67.12% less annually than in Case 1. Additionally, the energy used by the fans at the cooling tower in Case 5 was 72.13% lower than that in Case 1, indicating marked improvements in energy efficiency.
Case 5, in which all LEED v4.1 criteria were implemented, was demonstrated to be the most robust against fluctuations in the OAT, whereas Case 1 was found to be highly sensitive. In Case 4, the thermal energy consumption was less dependent on the OAT owing to the improvement in ventilation through the active utilization of outdoor air. However, this approach resulted in increased electricity consumption by primary HVAC components.
Cases 2 and 3, which incorporated envelope retrofits and internal heat gain design densities based on local code requirements, respectively, indicated that the effectiveness of the design adaptations is strongly influenced by these regulatory codes. Modifications of the envelope alone were insufficient to maximize the energy performance benefits without the inclusion of additional retrofitting measures. Overall, the correlation data from Cases 2 to 4 suggested that improved robustness to OAT variations was achieved. Nonetheless, the findings emphasize that a combination of passive and active strategies is essential to fully optimize energy performance outcomes.
Table 10 presents the heat transfer data observed during the summer period from May to August and the winter periods from January to April and September to December, thereby illustrating the influence of geological and climatic conditions on the building energy performance. Effective heat management strategies were identified, including expulsion of heat during summer and retention of heat during winter. The internal heat gains resulting from the density of occupants and electronic devices were found to have minimal impact on the envelope heat transfer, as evidenced by the limited seasonal variation observed in Cases 3 and 4.
In Case 5, which included comprehensive renovation measures, heat transfer was optimized most effectively. During summer, the exterior window in Case 5 was found to gain 51.89% less heat than that in Case 1, whereas its exterior surface demonstrated a heat absorption capacity that was five times greater. These results indicated that windows, which are key contributors to the greenhouse effect, play a more significant role than walls in regulating heat gain. During the winter, the materials used for the exterior wall in Case 5 retained 39.84% more heat than those in Case 1. In conclusion, the seasonal difference between heat gain and heat loss was optimally balanced in Case 5, corresponding with the primary operational objectives designated for each season.

3.2. Thermal Comfort in the Primary Breathing Zones

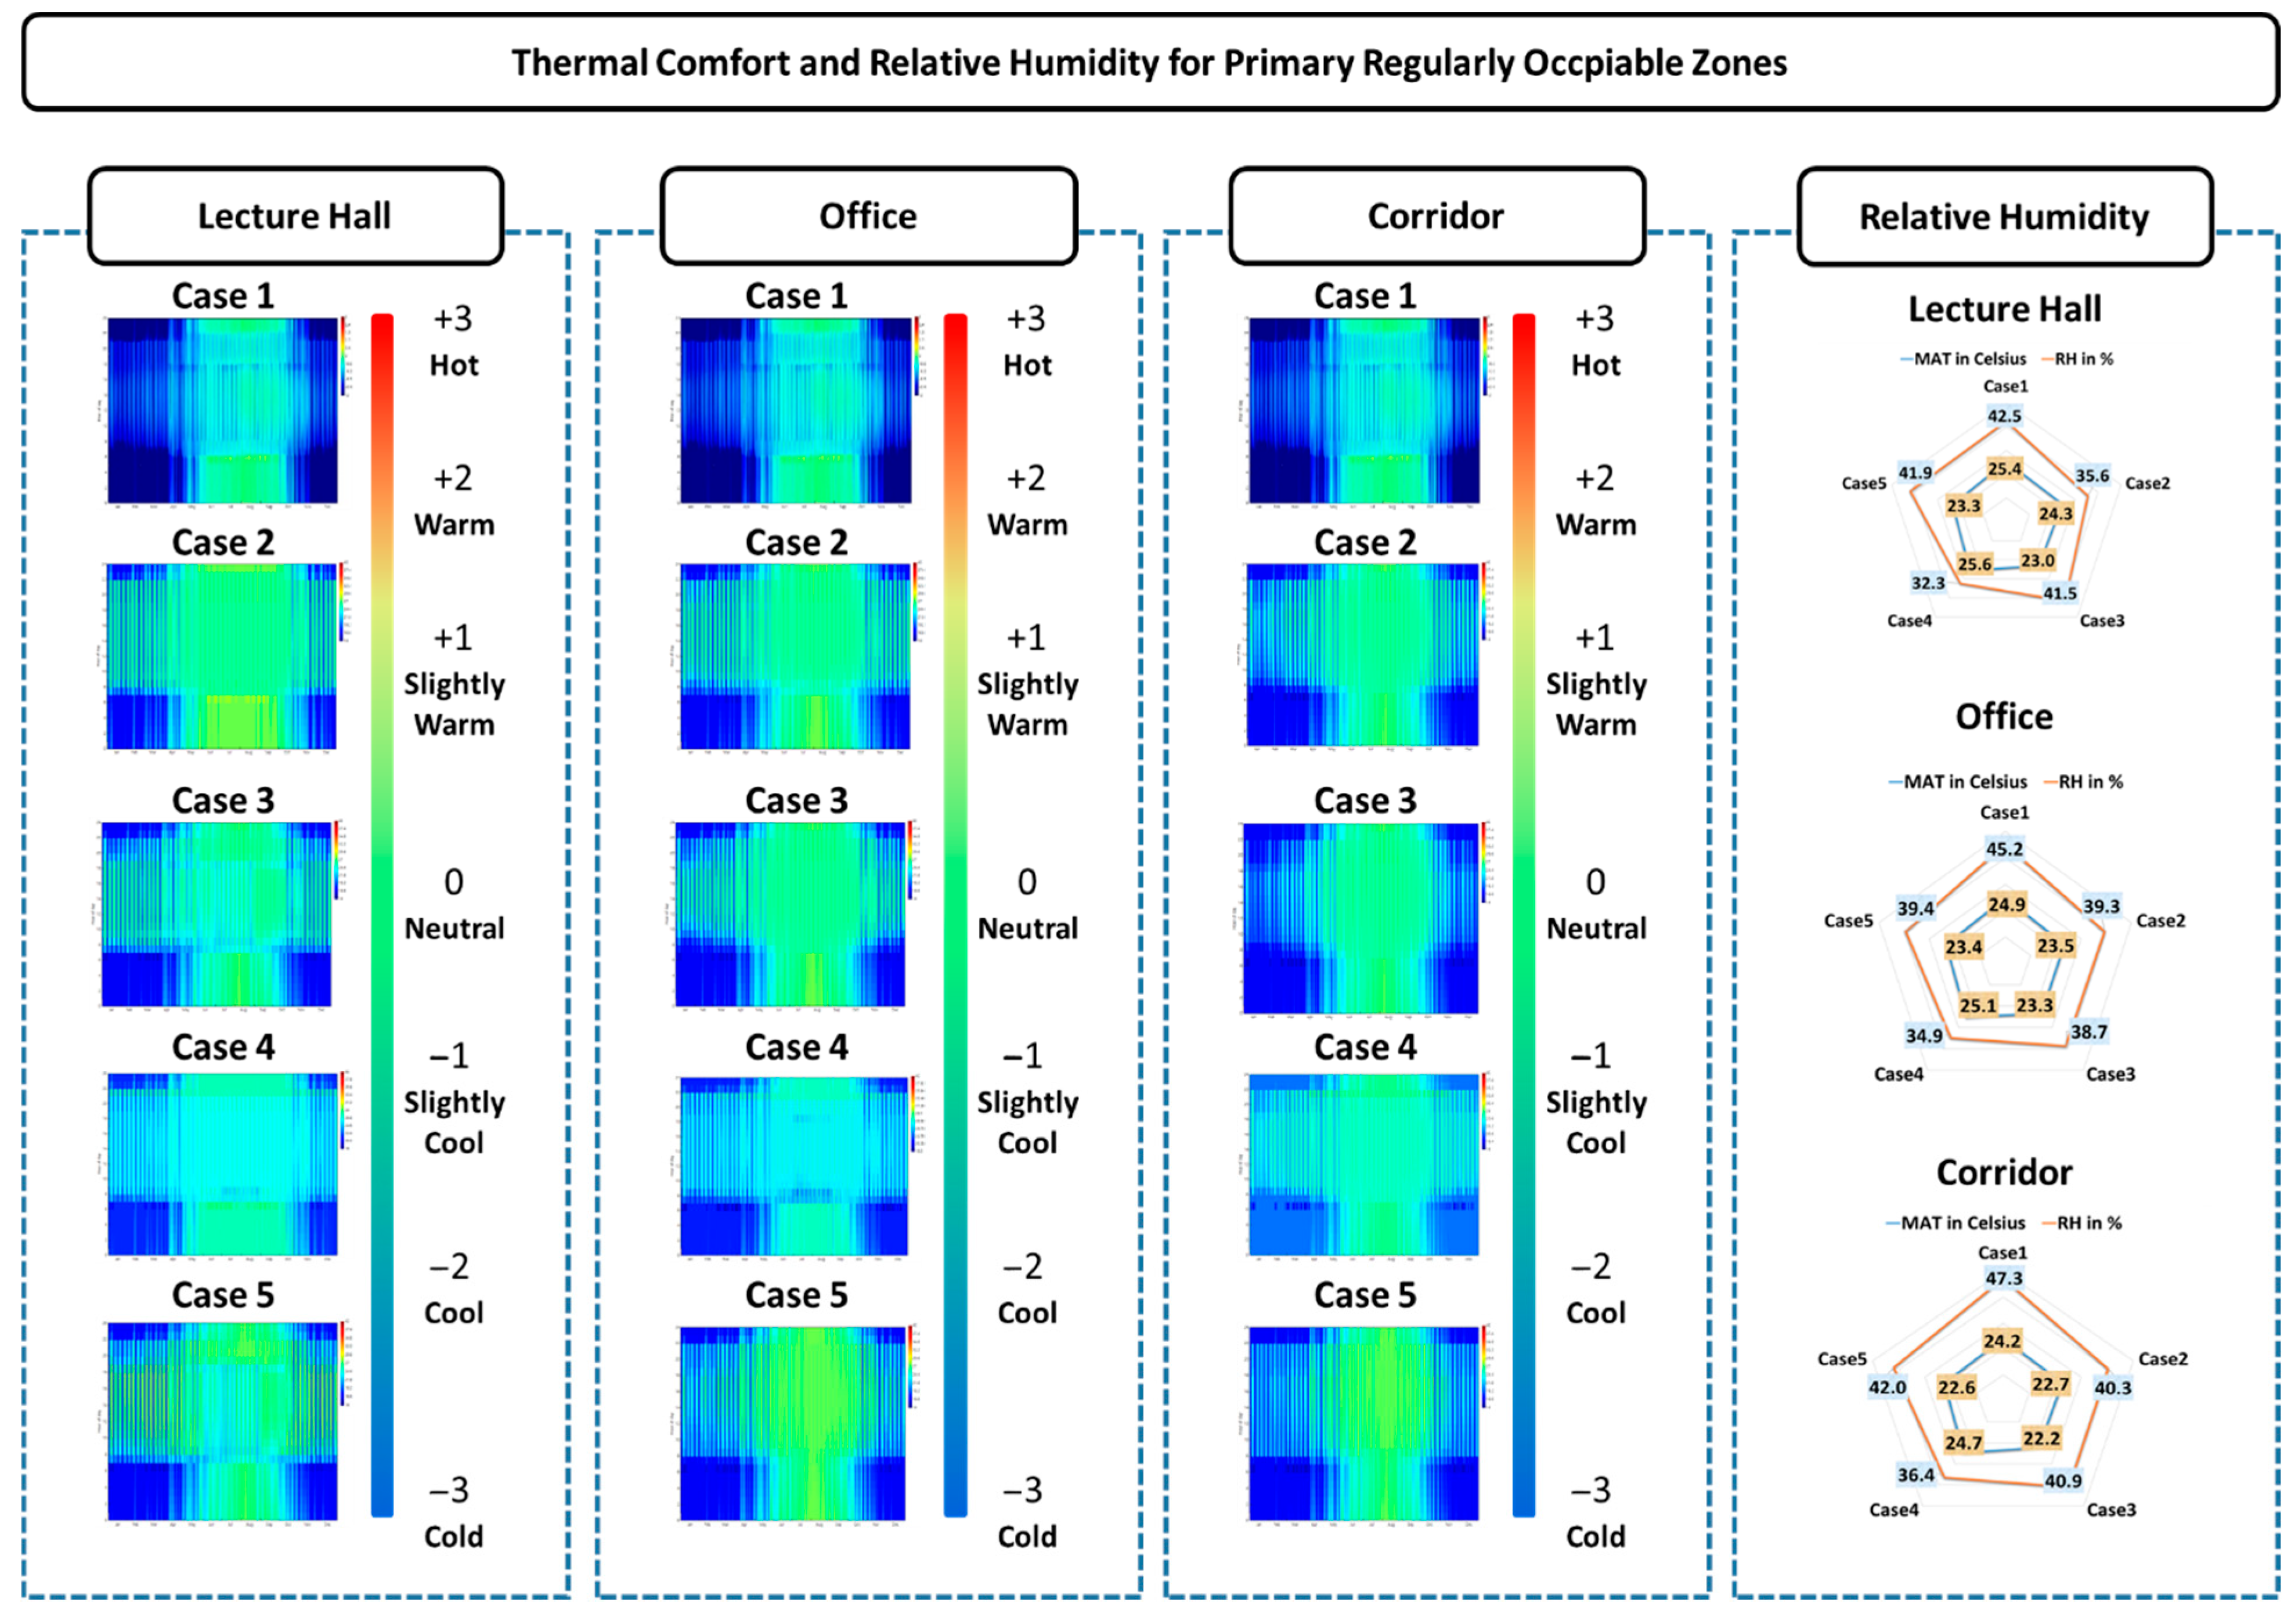
Figure 5 presents the simulation results of the PMV during operational hours in lecture halls with moderate occupant densities and regular schedules, with thermal comfort evaluated according to ASHRAE 55 standards. The X and Y axis in each heat map represent hours from 00 to 24 and months from January to February. The lines illustrated in the section dedicated for average relative humidity represent average zonal air temperature, whereas the lines in sky-blue represent average zonal relative humidity.
Lecture halls, offices, and corridors were selected based on design considerations. The lecture hall was characterized by the highest design occupant density, fixed occupancy schedules, and significant internal electric loads. Offices and corridors were categorized as regularly occupied zones with fixed schedules and moderate occupant densities. Across all cases, satisfactory comfort levels were achieved, with a closer alignment to the thermal neutrality index observed in cases where optimized ventilation strategies were applied, particularly in Case 5. Case 3 was notably influenced by the OAT owing to higher ventilation demand, resulting in significant indoor temperature fluctuations—cooler conditions during winter and warmer conditions during summer—owing to increased conditioning loads. This effect was also evident in summer operations, during which the central HVAC system remained active overnight to enhance operational efficiency.
According to ASHRAE Standard 55 for thermal comfort, a thermal index value closer to the neutral index indicates a better comfort condition for occupants. Given the regularity of occupancy schedules, lecture rooms were designed to accommodate the highest occupant densities. As illustrated in Figure 5, it is evident that thermal comfort conditions were satisfied in all simulation cases.
A comparison between Case 1 and Case 5 illustrates that the frequency of occurrence for the neutral thermal index increases, as shown in the heat map. In Case 3, where a higher ventilation rate was applied without complementary adjustments to other influencing factors, the hourly indoor air temperature was more strongly affected by outdoor air infiltration. This led to lower indoor temperatures during winter and increased cooling demands during summer. As a result, the central HVAC system was simulated to operate during the night cycle in summer to maintain efficiency.
Further analysis in Figure 5 confirms that thermal zones complied with ASHRAE 90.1 comfort standards, maintaining MATs between 20 and 26 °C and RH between 30% and 50%. Ventilation adjustments were found to significantly affect RH levels; increased ventilation in Cases 2, 3, and 5 resulted in RH reductions, whereas in Case 4, RH increased solely owing to ventilation modifications.
Temperature variations based on the scale distribution between 17 and 40 °C were most noticeable in key areas such as lecture halls, offices, and corridors with regular occupancy schedules, where temperature decreased by 8.3%, 6.0% and 6.4% with enhanced passive and active measures in Case 5, whereas the annual MAT in Case 4 considered that only the modification of ventilation increased by 0.8%, 0.8%, and 2.3% in the lecture halls, offices, and corridors, respectively. These findings highlight that LEED criteria implementation does not compromise thermal comfort but effectively reduces energy consumption. Significant thermal load adjustments were evident in lecture rooms for Case 3, where modifications in occupant density from 0.5 to 1.5 ppl/m2 resulted in a 9.4% temperature rise and a 2.4% drop in RH, underscoring the critical interaction between design regulations and thermal management.

3.3. Indoor Air Quality

Figure 6 depicts the indoor air quality from the perspective of occupant health. According to the standards for indoor CO2 concentrations set by ASHRAE and the WHO in Europe, Japan, and the Republic of Korea, concentrations should be maintained below 1000, 920, 1000, and 1000 ppm, respectively.
Consequently, the simulation, which assumed the renovation of the building from design to operational schemes, did not indicate potential violations of the design criteria of the building regarding CO2 levels. In the simulation, the occupant schedule for the library was set to be the same as that of the classroom because the original design purpose of the spaces allocated for the library was classrooms.
Because the concentration level of outdoor CO2 varied roughly between 426.3 and 475.7 ppm, a smaller difference between them could be perceived as a better indoor environment for the occupants’ health. The average concentration difference in Case 5 was simulated to be the lowest in every space type designed to be breathing zones, whereas the differences from Cases 1 to 4 were greater in every space type, regardless of the operation schedule of the building. Notably, IAQ management in Cases 5 and 3 was determined to be the lowest, whereas IAQ management in Case 4, which was expected to be the lowest with changes in the ventilation requirement, tended to function less effectively with greater differences in concentrations simulated in the corridor, laboratory, and lecture hall.
As shown in Figure 6, the concentration differences during break periods with less pressurization of the building, including Case 5 with all possible modifications and Case 3 with the modified internal heat parameters, exhibited the lowest concentration level from September to December. Notably, IAQ management in Cases 5 and 3 was determined to be the lowest, whereas IAQ management in Case 4, which was expected to be the lowest with changes in the ventilation requirement, tended to function less effectively with greater differences in concentrations simulated in the corridor, laboratory, and lecture hall.

4. Conclusions

This study examined the impact of passive design modifications, specifically internal heat gains, building envelope, and ventilation strategies, on thermal comfort, indoor air quality, and HVAC performance in a multipurpose education building based on a real floor plan.
By introducing the LEED baseline, 36.21% of the potential energy-saving opportunities for thermal load in building operations were estimated in comparison with the thermal energy requirements simulated based on the current passive design criteria in the commission. Despite the passive design criteria being replaced by the LEED baseline, it did not exhibit any significant difference in the indoor air quality, thermal comfort of the occupants, unmet hours, or ventilation requirements, but rather a decrease in the thermal energy required to condition the building in the proper ranges.
Because the building envelope and factors related to the internal heat gains are the design criteria heavily relevant to the local construction regulations, the passive elements in building design in consideration of energy efficiency were the most critical design philosophy before the introduction of active energy-saving measures for building operations, whereas the ventilation strategy could be considered as one of the active and flexible measures for building management after commissioning, which was simulated not to be as influential as the results from changes in the passive criteria.
Hence, including standardized regulations in the local regulation of building designs applicable to buildings intended to participate in smart cities or green button initiatives could be reasonable and critical to maximizing energy-saving opportunities without sacrificing the voluntary will of participation. However, the most critical outcome of the present study is that all possible measures must be taken together without simply modifying several design parameters to maximize the benefits of LEED v4.1 and actualize the authentic purpose of green buildings.
Although this study does not include a detailed assessment of economic trade-offs such as retrofit costs or LEED implementation expenses, it is important to note that the observed improvements in thermal comfort and indoor air quality were achieved without the need for significant structural modifications or investment in active systems. Apart from the building envelope, no additional implementation measures were introduced. This indicates that passive design strategies, when appropriately applied and simulated, can yield substantial environmental benefits at minimal cost, particularly in existing buildings where financial resources may be constrained. These findings highlight the practical feasibility of applying non-invasive strategies to improve building performance, and they may serve as a valuable reference for future low-cost retrofit initiatives.
One notable limitation of this study is the absence of validation against actual energy or water consumption data. Although the simulation results offer valuable insights into the performance of passive design strategies, empirical validation would have strengthened the credibility and applicability of the findings. Unfortunately, the building operators did not systematically record flow meter or sub-metering data during the monitoring period, making direct comparison with real-world performance infeasible. This limitation has been acknowledged in the discussion, and future research should incorporate measured consumption data to enhance the robustness of the analysis.
Although this study is based on a single building, the underlying approach that combines passive design strategies with a simulation-based assessment of thermal comfort and indoor air quality offers a replicable framework that can be applied to a wide range of building types with similar functional and environmental requirements. The methodology is particularly adaptable to education facilities that seek to enhance indoor environmental performance through non-mechanical, climate-responsive interventions. By adjusting design inputs and climate data, this framework could be extended to other typologies and geographic regions, allowing for comparative analysis across diverse climatic and architectural contexts. Furthermore, the proposed methodology may serve as a foundation for future integration with digital twin technologies, wherein real-time sensor data can be continuously fed into the simulation environment. This integration would not only support ongoing performance monitoring but also enable hourly or sub-hourly optimization of indoor environmental parameters, thereby facilitating adaptive building operation and more efficient energy management throughout the building lifecycle.

Author Contributions

Conceptualization, J.L.; methodology, J.L.; software, J.L.; validation, J.L.; formal analysis, J.L.; investigation, J.L.; resources, J.L.; data curation, J.L.; writing—original draft preparation, J.L.; writing—review and editing, J.S.; visualization, J.L.; supervision, J.S.; project administration, J.S.; funding acquisition, J.S. All authors have read and agreed to the published version of the manuscript.

Funding

This research was supported by the KERI Primary Research Program of MSIT/NST (No. 25A01074).

Data Availability Statement

The original contributions presented in this study are included in the article. Further inquiries can be directed to the corresponding author.

Acknowledgments

During the preparation of this manuscript/study, the authors used OpenStudio 3.6.0 for the purpose of energy simulation. The authors have reviewed and edited the output and take full responsibility for the content of this publication.

Conflicts of Interest

The authors declare no conflicts of interest.

Abbreviations

The following abbreviations are used in this manuscript:
RTSRadiant time series
DOASDedicated outdoor air system
HVACHeating, ventilation, and air conditioning
LEED Leadership in Energy and Environmental Design
MOLITMinistry of Land, Infrastructure and Transportation
ASHRAEAmerican Society of Hearing, Refrigerating and Air Conditioning Engineers
WHOWorld Health Organization
IAQIndoor air quality
RHRelative humidity
OATOutdoor air temperature
CAVConstant air volume
MATMean air temperature
PMVPredicted mean vote
OHUOutdoor air handling unit
FCUFan coil unit
AHUAir handling unit
KDHCKorea District Heating Corporation
KEPCOKorea Electric Power Corporation
TCThermal comfort
IEQIndoor environmental quality
EEEnergy efficiency
K-waterKorea Water Resources Corporation
BD+CBuilding Design and Construction
EBOMExisting Building Operation and Maintenance
CENEuropean Committee for Standardization
CO2Carbon dioxide
PFPhenolic foam
GHGGreenhouse gas
WNAWorld Nuclear Association

Appendix A

Table A1 below represents the classification of ASHRAE climate zones with environmental conditions based on latitudes. In the case of the present simulation environment, the climate zone can be classified as climate zone (CZ) 4. The letter codes noted by A, B, and C represent the atmospheric conditions that are humid, dry, and marine, respectively. Heating degree day (HDD) and cooling degree day (CDD) represent the days required to heat and cool the buildings to maintain thermal comfort for the inhabitants. The other types of buildings willing to simulate and create LEED report may utilize the information provided by the climate conditions in Table A1.
Table A1. Classification of climate zones after ASHRAE codes for the simulation.
Climate ConditionZonal IndexThermal Condition
Cool5A/B/CCDD_10 < 3500 and 2000 < HDD_18 < 4000
Mixed4A/B/CCDD_10 < 3500 and 2000 < HDD_18 < 3000
Warm3A/B/CCDD_10 < 3500 and HDD_18 < 2000
Hot2A/B3500 < CDD_10 < 5000
Figure A1a,b illustrate the buffer zone specified for the climate condition considered not to vary significantly and the location of the subject building. Because the subject building is located within the buffer, the cooling and heating degree days can be calculated by averaging the sum of the differences between the average temperature on the target day and the standard temperature specified by HDD and CDD.
Figure A1. Illustration of the simulation environment on the atmospheric condition: (a) buffer zones for ASHRAE climate zones [61]; (b) location of the reference climate zone in the Republic of Korea.
Buildings 15 03023 g0a1
Regarding the atmospheric conditions in Siheung, where the candidate building is located, the number of CDD and HDD was defined by the municipal climate center as 50.1 and 2646.4, respectively. Thus, the subject location was concluded to belong to ASHRAE Climate Zone 4C, representing the marine environment surrounding the building. For the zone referenced in Figure A1a, the climate conditions in the subject area were postulated not to differ significantly from the conditions in Incheon, where the reference data are available for EnergyPlus.

References

  1. Carbon Dioxide Emissions from Electricity. World Nuclear Association. Available online: https://world-nuclear.org/information-library/energy-and-the-environment/carbon-dioxide-emissions-from-electricity (accessed on 4 May 2025).
  2. Angelidou, M.; Politis, C.; Panori, A.; Bakratsas, T.; Fellnhofer, K. Emerging Smart City, transport and energy trends in urban settings: Results of a pan-European foresight exercise with 120 experts. Technol. Forecast. Soc. Change 2022, 183, 121915. [Google Scholar] [CrossRef]
  3. Mosannenzadeh, F.; Di Nucci, M.R.; Vettorato, D. Identifying and prioritizing barriers to implementation of Smart Energy City Projects in Europe: An empirical approach. Energy Policy 2017, 105, 191–201. [Google Scholar] [CrossRef]
  4. Mousavi, S.; Gheibi, M.; Wacławek, S.; Behzadian, K. A novel smart framework for optimal design of green roofs in buildings conforming with energy conservation and Thermal Comfort. Energy Build. 2023, 291, 113111. [Google Scholar] [CrossRef]
  5. Almeida, R.; Georgieva, P.; Martins, N. Heating setpoint recommendation strategy for Thermal Comfort and energy consumption optimization. Energy Build. 2023, 296, 113406. [Google Scholar] [CrossRef]
  6. Wang, C.; Zhu, Y.; Guo, X. Thermally responsive coating on building heating and cooling energy efficiency and indoor comfort improvement. Appl. Energy 2019, 253, 113506. [Google Scholar] [CrossRef]
  7. Picard, T.; Hong, T.; Luo, N.; Lee, S.H.; Sun, K. Robustness of energy performance of zero-net-energy (ZNE) homes. Energy Build. 2020, 224, 110251. [Google Scholar] [CrossRef]
  8. Wang, W.; Zmeureanu, R.; Rivard, H. Applying multi-objective genetic algorithms in green building design optimization. Build. Environ. 2005, 40, 1512–1525. [Google Scholar] [CrossRef]
  9. Rabani, M.; Madessa, H.B.; Ljungström, M.; Aamodt, L.; Løvvold, S.; Nord, N. Life Cycle Analysis of GHG emissions from the building retrofitting: The case of a Norwegian office building. Build. Environ. 2021, 204, 108159. [Google Scholar] [CrossRef]
  10. Shi, L.; Qi, X.; Yang, Z.; Tao, L.; Li, Y.; Qiu, J.; Jiang, X. Comparative study of greenhouse gas emission calculations and the environmental impact in the life cycle assessment of buildings in China, Finland, and the United States. J. Build. Eng. 2023, 70, 106396. [Google Scholar] [CrossRef]
  11. Shingler, J. Long Term Study of Pennsylvania’s Low Income Usage Reduction Program: Results of Analyses and Discussion; Penn State University: University Park, PA, USA, 2009. [Google Scholar]
  12. Apostolopoulos, V.; Mamounakis, I.; Seitaridis, A.; Tagkoulis, N.; Kourkoumpas, D.S.; Iliadis, P.; Angelakoglou, K.; Nikolopoulos, N. An Integrated Life Cycle Assessment and life cycle costing approach towards sustainable building renovation via a dynamic online tool. Appl. Energy 2023, 334, 120710. [Google Scholar] [CrossRef]
  13. Echarri-Iribarren, V.; Echarri-Iribarren, F.; Rizo-Maestre, C. Ceramic panels versus aluminium in buildings: Energy consumption and environmental impact assessment with a new methodology. Appl. Energy 2019, 233–234, 959–974. [Google Scholar] [CrossRef]
  14. Eicker, U.; Monien, D.; Duminil, É.; Nouvel, R. Energy performance assessment in urban planning competitions. Appl. Energy 2015, 155, 323–333. [Google Scholar] [CrossRef]
  15. Alidadi, M.; Sharifi, A. The extent of inclusion of smart city indicators in existing Urban Sustainability Assessment Tools. In Urban Climate Adaptation and Mitigation; Elsevier: Amsterdam, The Netherlands, 2023; pp. 175–198. [Google Scholar] [CrossRef]
  16. O’Dwyer, E.; Pan, I.; Acha, S.; Shah, N. Smart Energy Systems for Sustainable Smart Cities: Current Developments, trends and Future Directions. Appl. Energy 2019, 237, 581–597. [Google Scholar] [CrossRef]
  17. Rastogi, A.; Choi, J.-K.; Hong, T.; Lee, M. Impact of different LEED versions for Green Building Certification and Energy Efficiency Rating System: A multifamily Midrise case study. Appl. Energy 2017, 205, 732–740. [Google Scholar] [CrossRef]
  18. Carrera, B.; Peyrard, S.; Kim, K. Meta-regression framework for energy consumption prediction in a smart city: A case study of Songdo in South Korea. Sustain. Cities Soc. 2021, 72, 103025. [Google Scholar] [CrossRef]
  19. Ahvenniemi, H.; Huovila, A.; Pinto-Seppä, I.; Airaksinen, M. What are the differences between sustainable and Smart Cities? Cities 2017, 60, 234–245. [Google Scholar] [CrossRef]
  20. Abu-Rayash, A.; Dincer, I. Development of Integrated Sustainability Performance Indicators for better management of Smart Cities. Sustain. Cities Soc. 2021, 67, 102704. [Google Scholar] [CrossRef]
  21. Obata, S.H.; Agostinho, F.; Almeida, C.M.V.B.; Giannetti, B.F. LEED certification as booster for sustainable buildings: Insights for a Brazilian context. Resour. Conserv. Recycl. 2019, 145, 170–178. [Google Scholar] [CrossRef]
  22. Balachandra, P.; Ravindranath, D.; Ravindranath, N.H. Energy efficiency in India: Assessing the policy regimes and their impacts. Energy Policy 2010, 38, 6428–6438. [Google Scholar] [CrossRef]
  23. Vaisi, S.; Varmazyari, P.; Esfandiari, M.; Sharbaf, S.A. Developing a multi-level Energy Benchmarking and certification system for office buildings in a cold climate region. Appl. Energy 2023, 336, 120824. [Google Scholar] [CrossRef]
  24. Ferreira, A.; Pinheiro, M.D.; de Brito, J.; Mateus, R. Retail Buildings’ sustainability assessment tools: A critical analysis of LEED, BREEAM and dgnb. SSRN Electron. J. 2022. [Google Scholar] [CrossRef]
  25. Luo, N.; Pritoni, M.; Hong, T. An overview of data tools for representing and managing building information and Performance Data. Renew. Sustain. Energy Rev. 2021, 147, 111224. [Google Scholar] [CrossRef]
  26. Neukomm, M.; Nubbe, V.; Fares, R. Grid-Interactive Efficient Buildings Technical Report Series: Overview of Research Challenges and Gaps; National Renewable Energy Laboratory: Golden, CO, USA, 2019. [Google Scholar] [CrossRef]
  27. Hult, E.; Granderson, J.; Mathew, P. Energy Management in Small Commercial Buildings: A Look at How HVAC Contractors Can Deliver Energy Efficiency to This Segment; Lawrence Berkeley National Laboratory: San Francisco, CA, USA, 2014. [Google Scholar]
  28. Homod, R.Z.; Gaeid, K.S.; Dawood, S.M.; Hatami, A.; Sahari, K.S. Evaluation of energy-saving potential for optimal time response of HVAC control system in Smart Buildings. Appl. Energy 2020, 271, 115255. [Google Scholar] [CrossRef]
  29. Taheri, S.; Hosseini, P.; Razban, A. Model predictive control of heating, ventilation, and air conditioning (HVAC) systems: A state-of-the-art review. J. Build. Eng. 2022, 60, 105067. [Google Scholar] [CrossRef]
  30. Müller, F.L.; Jansen, B. Large-scale demonstration of precise demand response provided by residential heat pumps. Appl. Energy 2019, 239, 836–845. [Google Scholar] [CrossRef]
  31. Menezes, A.C.; Cripps, A.; Buswell, R.A.; Wright, J.; Bouchlaghem, D. Estimating the energy consumption and power demand of small power equipment in office buildings. Energy Build. 2014, 75, 199–209. [Google Scholar] [CrossRef]
  32. Massidda, L.; Marrocu, M. Total and thermal load forecasting in residential communities through probabilistic methods and causal machine learning. Appl. Energy 2023, 351, 121783. [Google Scholar] [CrossRef]
  33. Jung, W.; Jazizadeh, F. Human-in-the-loop HVAC operations: A Quantitative Review on occupancy, comfort, and energy-efficiency dimensions. Appl. Energy 2019, 239, 1471–1508. [Google Scholar] [CrossRef]
  34. Razmara, M.; Maasoumy, M.; Shahbakhti, M.; Robinett, R.D. Optimal exergy control of building HVAC system. Appl. Energy 2015, 156, 555–565. [Google Scholar] [CrossRef]
  35. Kong, M.; Dong, B.; Zhang, R.; O’Neill, Z. HVAC Energy Savings, thermal comfort and air quality for occupant-centric control through a side-by-side experimental study. Appl. Energy 2022, 306, 117987. [Google Scholar] [CrossRef]
  36. Huang, K.-T.; Hwang, R.-L. Future trends of residential building cooling energy and passive adaptation measures to counteract climate change: The case of Taiwan. Appl. Energy 2016, 184, 1230–1240. [Google Scholar] [CrossRef]
  37. Chen, X.; Yang, H. Integrated energy performance optimization of a passively designed high-rise residential building in different climatic zones of China. Appl. Energy 2018, 215, 145–158. [Google Scholar] [CrossRef]
  38. Kwak, Y.; Shin, H.; Kang, M.; Mun, S.H.; Jo, S.K.; Kim, S.H.; Huh, J.H. Energy modeling of pig houses: A South Korean feasibility study. Energy Strategy Rev. 2021, 36, 100672. [Google Scholar] [CrossRef]
  39. Abdel-Aal, M.F.; Maarouf, I.; El-Sayary, S. Wakala buildings of Mamluk era in Cairo, Egypt and how far they meet the rating criteria of LEED V4. Alex. Eng. J. 2018, 57, 3793–3803. [Google Scholar] [CrossRef]
  40. Abuseif, M.; Dupre, K.; Michael, R.N. The effect of green roof configurations including trees in a subtropical climate: A co-simulation parametric study. J. Clean. Prod. 2021, 317, 128458. [Google Scholar] [CrossRef]
  41. Song, R.; Liu, D.; Pan, Y.; Cheng, Y.; Meng, C. Container FARMS: Energy modeling considering crop growth and energy-saving potential in different climates. J. Clean. Prod. 2023, 420, 138353. [Google Scholar] [CrossRef]
  42. Edun, A.; Hachem-Vermette, C. Post-consumer waste recycling for high performance building envelopes in cold climates: Assessing Energy and Environmental impacts. J. Clean. Prod. 2022, 372, 133686. [Google Scholar] [CrossRef]
  43. Chen, J.; Gong, Q.; Lu, L. Evaluation of passive envelope systems with radiative sky cooling and thermally insulated glazing materials for cooling. J. Clean. Prod. 2023, 398, 136607. [Google Scholar] [CrossRef]
  44. Navia-Osorio, E.G.; Porras-Amores, C.; Mazarrón, F.R.; Cañas, I. Impact of climate change on sustainable production of sherry wine in nearly zero energy buildings. J. Clean. Prod. 2023, 382, 135260. [Google Scholar] [CrossRef]
  45. Queiroz, N.; Westphal, F.S.; Ruttkay Pereira, F.O. A performance-based design validation study on EnergyPlus for daylighting analysis. Build. Environ. 2020, 183, 107088. [Google Scholar] [CrossRef]
  46. Zhang, R.; Lam, K.P.; Yao, S.; Zhang, Y. Coupled EnergyPlus and computational fluid dynamics simulation for natural ventilation. Build. Environ. 2013, 68, 100–113. [Google Scholar] [CrossRef]
  47. Xie, X.; Luo, Z.; Grimmond, S.; Sun, T. Impact of building density on natural ventilation potential and cooling energy saving across Chinese climate zones. Build. Environ. 2023, 244, 110621. [Google Scholar] [CrossRef]
  48. Camblong, H.; Zapirain, I.; Curea, O.; Ugartemendia, J.; Boussaada, Z.; Zamora, R. Rule-Based Energy Management System to Enhance PV Self-Consumption in a Building: A Real Case. Energies 2024, 17, 6099. [Google Scholar] [CrossRef]
  49. Pérez-Carramiñana, C.; Sabatell-Canales, S.; González-Avilés, Á.B.; Galiano-Garrigós, A. Influence of Spanish Energy-Saving Standard on Thermal Comfort and Energy Efficiency Owing to the War in Ukraine: Case Study of an Office Building in a Dry Mediterranean Climate. Buildings 2023, 13, 2102. [Google Scholar] [CrossRef]
  50. United States Green Building Council. LEED v4.1 Building Design and Construction: Getting Started Guide for Beta Participants; USGBC: Washington, DC, USA, 2020. [Google Scholar]
  51. ASHRAE Standard-55; Thermal Environment Conditions for Human Occupancy. American Society of Heating, Refrigerating and Air-Conditioning Engineers: Peachtree Corners, GA, USA, 2017.
  52. ASHRAE 62.1; Ventilation for Acceptable Indoor Air Quality. American Society of Hearing, Refrigerating and Airconditioning Engineers: Peachtree Corners, GA, USA, 2016.
  53. Worden, K.; Hazer, M.; Pyke, C.; Trowbridge, M. Using LEED Green rating systems to promote Population Health. Build. Environ. 2020, 172, 106550. [Google Scholar] [CrossRef]
  54. “LEED v4.1,” LEED v4.1|U.S. Green Building Council. Available online: https://www.usgbc.org/leed/v41 (accessed on 11 August 2025).
  55. Prototype building models [WWW Document], n.d. Prototype Building Models|Building Energy Codes Program. Available online: https://www.energycodes.gov/prototype-building-models#Commercial (accessed on 11 August 2025).
  56. Calculations [WWW Document], n.d. Minimum Indoor Air Quality Performance Prerequisite Ref Guide EBOM|U.S. Green Building Council. Available online: https://www.usgbc.org/node/2767360 (accessed on 11 August 2025).
  57. United States Green Building Council. LEED v4.1 Building Design and Construction; USGBC: Washington, DC, USA, 2023. [Google Scholar]
  58. Design Specification of the Education Hall of Seoul National University at Siheung; Seoul National University: Siheung, Republic of Korea, 2018.
  59. Korean District Heating Corp. Available online: https://www.kdhc.co.kr/eng/main/main.do (accessed on 4 May 2025).
  60. Kepco. Available online: https://home.kepco.co.kr/kepco/EN/F/htmlView/ENFBHP00101.do?menuCd=EN060201 (accessed on 4 May 2025).
  61. Kim, H.-M.; Park, W.-J.; Kim, Y.-C.; Kim, H.-J. Comparative climate reference point analysis of domestic energy efficiency system and ASHRAE standard by GIS. KIEAE J. 2019, 19, 47–52. [Google Scholar] [CrossRef]
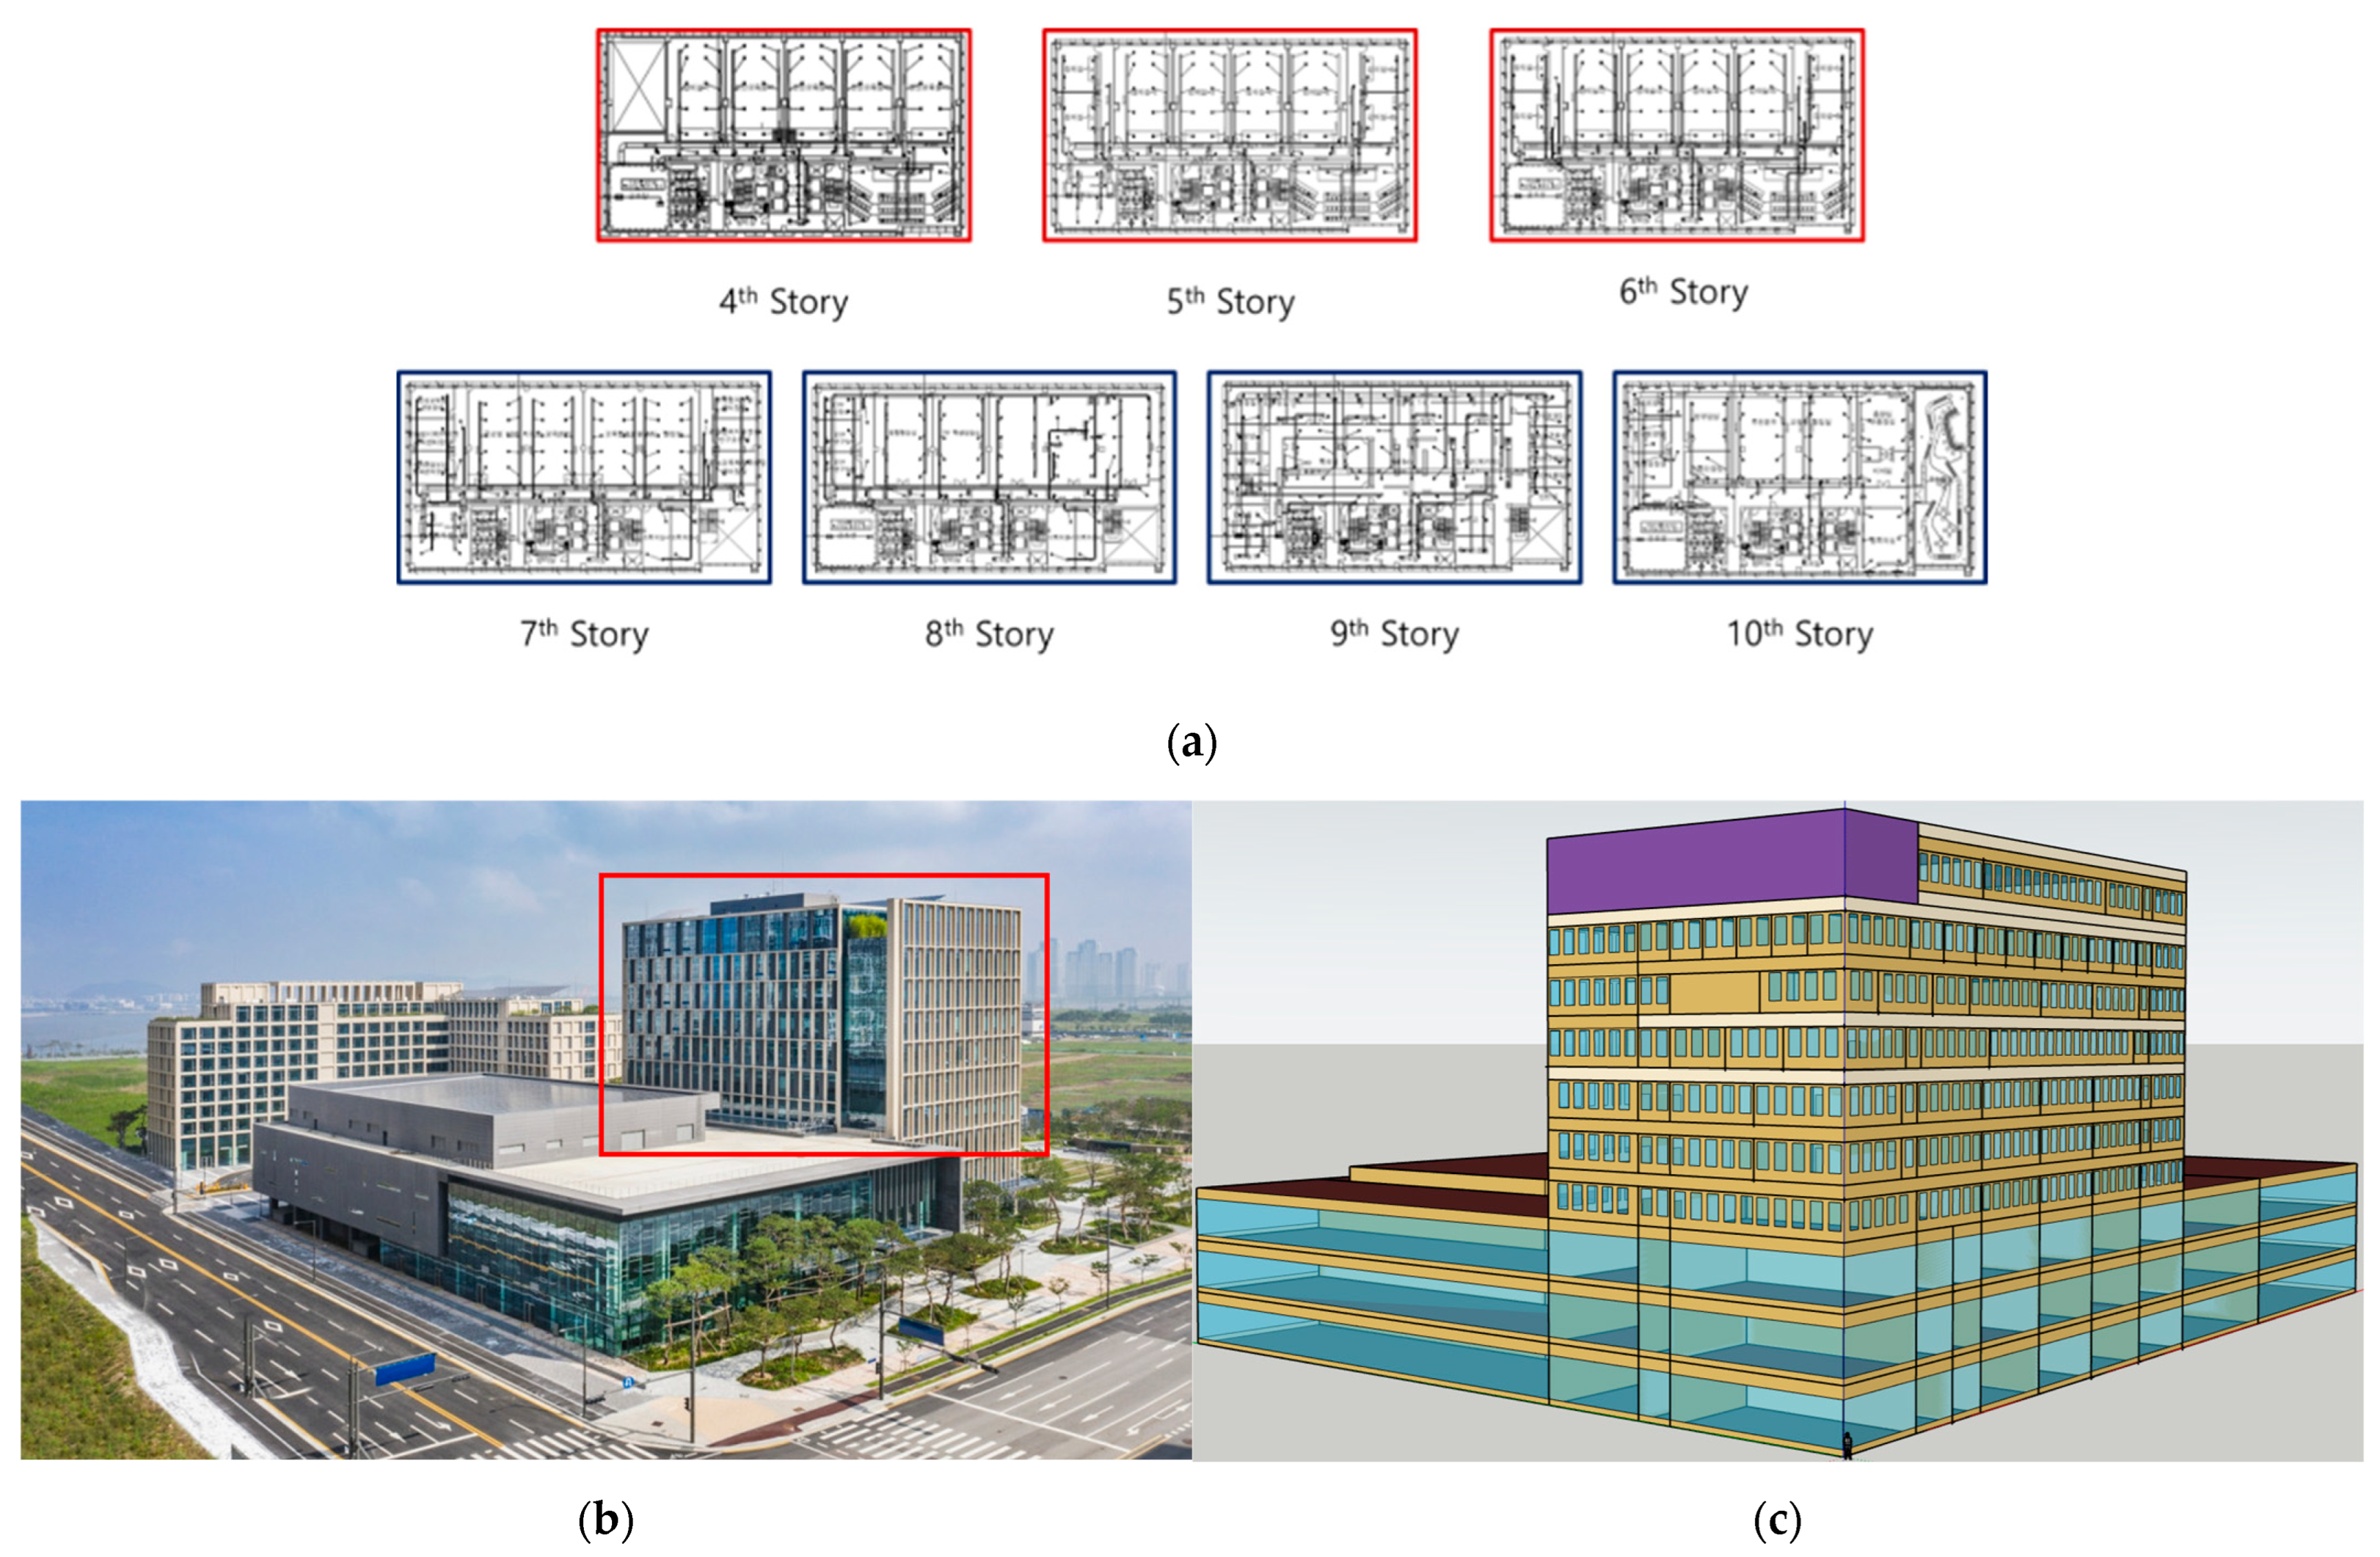
Figure 1. Environment of the test site: (a) floor-plans of the test sites; (b) illustration of the test site; (c) test site reconstructed as a digital twin.
Buildings 15 03023 g001
Figure 2. Occupant schedules in binary values from 2020 to 2021.
Buildings 15 03023 g002
Figure 3. Flow of the central heat sources in the central system.
Buildings 15 03023 g003
Figure 4. Monthly energy consumption by the simulated HVAC operations.
Buildings 15 03023 g004
Figure 5. PMV and RH for the zones with the regular occupant schedules.
Buildings 15 03023 g005
Figure 6. Monthly average CO2 concentration level in ppm simulated in the indoor environment.
Buildings 15 03023 g006
Table 1. Comparisons of design criteria of LEED and smart cities.
CriteriaLEED CriteriaSmart Cities
InfrastructureFlexibleHigh technology required
DefinitionClearVaries upon organizations
RecognitionClear by creditsSubtle and esoteric
Primary PurposeSustainabilitySmartness
Table 2. Comparison of the Previous Studies on the Influences from the Standards.
CategoryProposed AnalysisCamblong et al. [48]Pérez-Carramiñana et al. [49]
Case BasisUniversity campus buildingReal buildingReal office building
Energy FocusElectricity + ThermalPhotovoltaics + EMSHeating energy consumption and thermal comfort
Analysis ToolsEnergyPlus, OpenStudioRule-based EMSSimulation-based assessment
Policies/StandardsLEED v4.1, ASHRAE 90.1PV self-consumption
regulations
Spanish energy-saving standards
Comfort MetricsPMV, RH, CO2Electricity use optimizationPMV and temperature satisfaction
Climate ZoneASHRAE 4C (Incheon)European temperate climateDry Mediterranean climate
Table 3. Criteria for LEED BD+C and EBOM applicable to commercial buildings.
CriteriaBD+CEBOMReferences
Protocol eligibilityDesign phaseOperations period > 2 years[53,54,55]
Design changeDesign phaseAlterations under 50%
Energy and atmosphereGrid harmonization/Enhanced/Fundamental refrigerant management/
Energy performance/Energy efficiency best management practices
Materials and resourcesConstruction and demolition waste management/
Building life-cycle impact reduction
Indoor
environmental quality
Minimum indoor air quality/Environment tobacco smoke control/
Indoor environmental quality performance
Table 4. Types of the LEED Protocols Applicable in the Proposed Design [56,57].
Case EnvironmentProtocolReplacementDescription of Replacement
Case 1Reference designNo-changeSpecification in Table 5 and Table 6
as current material properties
Case 2LEED v4.1
BD+C/Baseline by
ASHRAE 90.1-2016
External
envelope
Material property and
air infiltration rate per area
referenced by baseline 90.1-2016
LEED v4.1 BD+C/Baseline by
ASHRAE 90.1-2016
Case 3Grid harmonization/Enhanced and fundamental refrigerant management/Energy
efficiency
Design densities of electric equipment and occupants after space types
Case 4LEED v4.1 EBOM
(Commissioning)
Indoor air qualityMinimum OA requirement for each person specified by EBOM
Thermal comfortRange of TC specified by EBOM
Case 5Whole-in-One
(Commissioning)
All changes adaptedReplacement in case environment
from Cases 2 to 5
Table 5. Representative Material Properties of the Building Envelope of the Test Site [58].
SpaceMaterial
(Type)
Thickness
(mm)
Conductivity
(W/m·K)
Density
(kg/m3)
Specific Heat
(J/kg·K)
Exterior WallPF1000.189391400
Gypsum250.260784.90830
Interior WallGypsum2000.3510001090
Exterior DoorWood250.156081630
Interior Door
Exterior Window
(Aluminum Frame)
1st Frame (Low-E)61.414-
Argon16
2nd Frame6
Exterior RoofConcrete w/o Frame1501.622001000
Concrete w/Frame2001.622001000
Extrusion Protection1800.02735837
Interior CeilingGypsum9.50.260784.90830
Air281---
Gypsum9.50.260784.90830
Interior FloorCement Mortar w/
Carpet Tiles
1001.420001000
Table 6. Electric and light load density in a reference case [58].
Space TypeOccupant (ppl/m2)Light Load
(W/m2)
Equipment
(W/m2)
Ventilation
(CMH/ppl)
Office0.2151536
Lecture Room0.5304036
Classroom0.5151036
Corridor0.120036
Library0.2151536
Conference Room0.5151036
Coffee Station0.225036
Elevator0.120036
Computer Laboratory0.5151036
Server Room0.1207036
Entrance 0.120036
Restroom0.120036
Table 7. Utility environment for the district heat sources in the simulation [59].
CriteriaApplicable Elements in the Simulation
Utility CompanyKorea District Heating Corporation
ResourceConditioning
SeasonalityUniform
Demand Charge361.98 KRW/(Mcal/h)
Utilization PriceKRW/Mcal
Table 8. Tariff criteria for the electric load applicable to the subject education hall [60].
Utility CompanySeasonHoursUtilization PriceDemand Charge
Korea Electric
Power Corporation
Spring
Fall
Summer
Peak Load (A–B)
A: 10:00–12:00
B: 13:00–17:00
80.1 KRW/kWh
(Spring/Fall)
155.8 KRW/kWh
(Summer)
6980
KRW/kW
Mid-peak Load (A–C)
A: 09:00–10:00
B: 12:00–13:00
C: 17:00–23:00
89.9 KRW/kWh
(Spring/Fall)
59.6 KRW/kWh
(Summer)
Light Load (A–B)
A: 10:00–12:00
B: 13:00–17:00
45.2 KRW/kWh
WinterPeak Load (A–C)
A: 10:00–12:00
B: 17:00–20:00
C: 22:00–23:00
127.1 KRW/kWh
Mid-peak Load (A–C)
A: 09:00–10:00
B: 12:00–17:00
C: 20:00–22:00
88.4 KRW/kWh
Light Load (A)
A: 23:00–09:00
49.2 KRW/kWh
Table 9. Correlation between monthly outdoor temperature and energy consumption.
Energy from Cooling TowerCase 1Case 2Case 3Case 4Case 5
Cooling Tower Fan
Electricity Energy (kWh)
91,56360,91839,26692,21925,520
Chiller Condenser
Heat Transfer Energy (kWh)
4,645,3743,194,1402,195,2034,441,7871,527,306
Correlation between OATCase 1Case 2Case 3Case 4Case 5
Electricity Consumption0.5170.5720.1680.607−0.389
Thermal Energy Consumption0.7560.166−0.4100.367−0.061
Table 10. Monthly average heat transfers through external surfaces in MWh.
Transfer TypeSeasonSurface TypeCase 5Case 4Case 3Case 2Case 1
Heat GainSummerExternal Window21.3343.8744.6221.6344.34
External Wall8.001.331.528.031.40
WinterExternal Window19.0444.2946.3218.9146.27
External Wall8.070.290.428.010.36
Heat LossSummerExternal Window8.546.745.738.666.17
External Wall8.457.726.458.497.05
WinterExternal Window29.7122.8918.2530.3419.51
External Wall13.7126.2421.1513.3122.79
Disclaimer/Publisher’s Note: The statements, opinions and data contained in all publications are solely those of the individual author(s) and contributor(s) and not of MDPI and/or the editor(s). MDPI and/or the editor(s) disclaim responsibility for any injury to people or property resulting from any ideas, methods, instructions or products referred to in the content.