The Impact of Built Environment on Urban Vitality—A Multi-Scale Geographically Weighted Regression Analysis in the Case of Shenyang, China
Abstract
1. Introduction
- Offering a thorough and practical strategy at the planning unit level to achieve the objective of influencing urban characteristics. This study presents a strategy that could be applied in real-world planning scenarios to shape urban features.
- Developing a multifaceted, composite, and integrative framework within the indicator system that manifests urban vitality. This approach was more representative compared to the typical methods that usually depended on a single data source for assessing vitality.
- Using MGWR to reveal the varied influences of built environment elements on urban vitality and making advancements in terms of spatial scale and statistical significance. This study employs MGWR to gain new insights into how different built-environment elements impacted urban vitality.
- Based on the summary of contributing elements, analyzing additional spatial characteristics and the mechanisms behind various spatial heterogeneity impacts. This study explores in depth the spatial aspects and the reasons for different spatial patterns of influence.
2. Literature Review
2.1. Urban Vitality
2.2. Built Environment Factors
3. Data and Method
3.1. Research Basis
3.1.1. Research Area
3.1.2. Data Acquisition
3.1.3. Data Processing
3.2. Factor Quantization
3.2.1. Urban Vitality and Quantifying Factor Measures
3.2.2. Quantification of the Built Environment
| Primary Indicator | Secondary Indicator | Indicator Meaning | Calculation Method | |||
|---|---|---|---|---|---|---|
| Code | Name | Code | Name | Formula | Code | |
| X1 | Land-Use Mixed Degree | X11 | Functional Mixture Degree | Reflects land use diversity | ||
| where Hi represents the entropy value of the i-th research unit, which indicates the degree of functional mixing, and Pij represents the proportion of the j-th type of functional facility within the i-th research unit. | ||||||
| X2 | Development Intensity | X21 | Building Density | Reflects building coverage | ||
| where D represents the building density, n is the total number of buildings, Bi represents the projection area of the i-th building, and S represents the total area of the research unit. | ||||||
| X22 | FAR | Reflects land use intensity | ||||
| where P represents the plot ratio, n represents the total number of buildings, Bi represents the projection area of the i-th building, Hi represents the number of floors of the i-th building, and S represents the total area of the study unit. | ||||||
| X3 | Functional Facilities Supporting | X31 | Commercial Facility Density | Reflects the distribution density of commercial facilities | ||
| X32 | Business Facility Density | Reflects the distribution density of business office facilities | ||||
| X33 | Public Facility Density | Reflects the distribution density of public service facilities | ||||
| X34 | Living Facility Density | Reflects the distribution density of life service facilities | where f represents the functional density of the study unit, Ni is the number of functional facility points of a certain category, and Si represents the area of the study unit. | |||
| X35 | Leisure facility density | Reflects the distribution density of leisure and entertainment facilities | ||||
| X4 | Road Traffic Configuration | X41 | Bus Stop Density | Reflects the distribution density of bus stops | ||
| X42 | Subway Station Density | Reflects the distribution density of subway stations | where D represents the density of bus/subway stations, ni represents the number of bus/subway stations within the buffer zone of the i-th study unit, and Si is the area of the buffer zone of the study unit. | |||
| X43 | Road Density | Reflects the distribution density of roads within units | ||||
| where R represents the road density of the study unit, n represents the total number of roads within the study unit, Li represents the length of the ith road within the study unit, and S represents the area of the study unit. | ||||||
| X44 | Road Intersection Density | Reflects the distribution density of road intersections within units | ||||
| where D represents the road intersections of the study unit, n represents the number of road intersections coverage area within the study unit, and S represents the area of the study unit. | ||||||
| X5 | Ecological Greening Environment | X51 | Park Square Density | Reflects the distribution density of parks and squares within units | ||
| X52 | Vegetation Coverage | Reflects the degree of vegetation coverage within units | where D represents the parks/vegetation coverage of the study unit, n represents the number of parks/vegetation coverage area within the study unit, and S represents the area of the study unit. | |||
3.3. Methods of Spatial Analysis
3.3.1. Ordinary Least Squares Regression Model
3.3.2. Multi-Scale Geographic Weighted Regression
4. Results
4.1. Vitality Spatial Pattern
4.2. Built Environment Impact Factors
4.2.1. Factors Quantitative
4.2.2. Factors Collinearity Diagnosis
4.2.3. Coefficient of Factors Regression
4.3. Spatial Heterogeneity
4.3.1. Spatial Auto-Correlation
4.3.2. Multi-Scale Geographically Weighted Regression
4.3.3. Regression Factor Results
- (1)
- Land-use Mixed Degree
- (2)
- Development Intensity
- (3)
- Functional Facilities Supporting
- (4)
- Road Traffic Configuration
- (5)
- Ecological Greening Environment
5. Discussion
5.1. Land-Use Mixed Degree
5.2. Development Intensity
5.3. Functional Facilities Supporting
5.4. Road Traffic Configuration
5.5. Ecological Greening Environment
6. Conclusions
- (1)
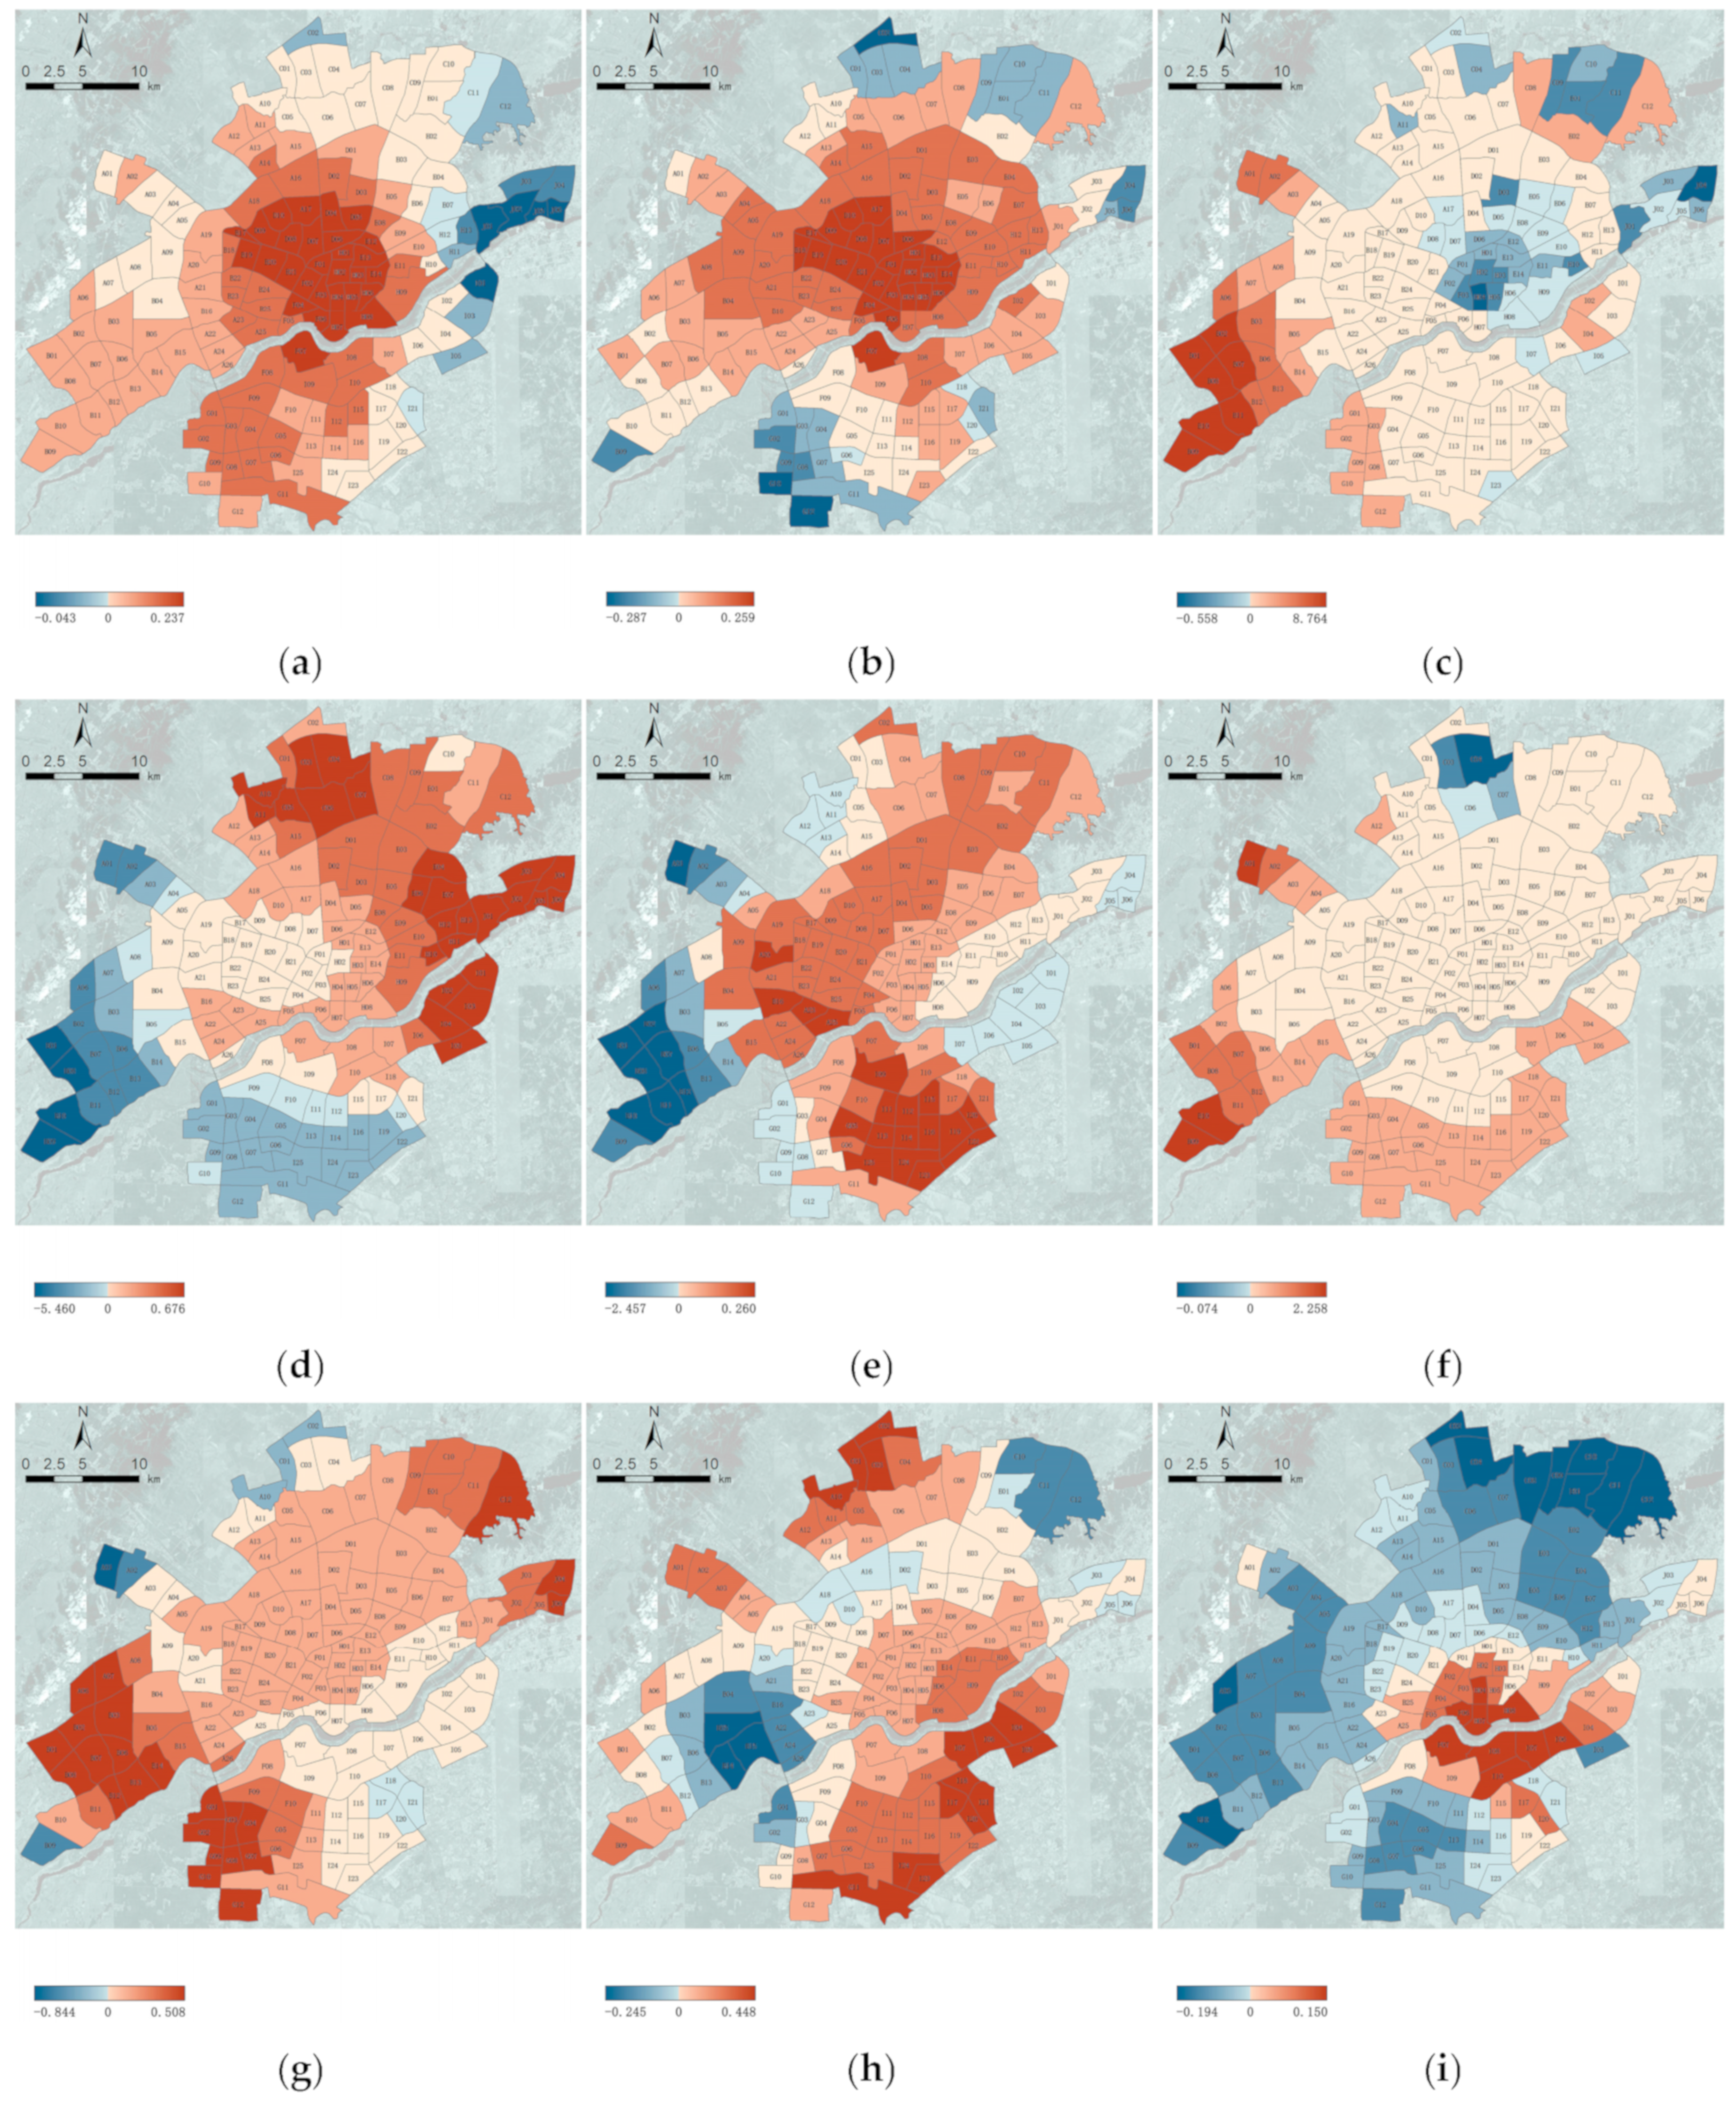
- Overall influences: Functional Mixture Degree, Bus Stop Density, and Subway Station Density all positively influenced the central urban area of Shenyang.
- (2)
- Location influences: FAR and Vegetation Coverage significantly enhanced the center area (exhibiting a diametrically opposite effect in peripheral area), whereas Commercial Facility Density and Road Density notably influenced the periphery region (exhibiting an opposite effect in center area).
- (3)
- Specific influences: Public Facility Density and Bus Stop Density exerted a substantial favorable influence on the industrial functional area.
Author Contributions
Funding
Conflicts of Interest
References
- Caprotti, F.; Cowley, R.; Datta, A.; Broto, V.C.; Gao, E.; Georgeson, L.; Joss, S. The New Urban Agenda: Key Opportunities and Challenges for Policy and Practice. Urban Res. Pract. 2017, 10, 367–378. [Google Scholar] [CrossRef]
- National Bureau of Statistics. Statistical Bulletin of People’s Republic of China’s National Economic and Social Development in 2020; People’s Publishing House: Beijing, China, 2021.
- Zhang, Y.C.; Tu, T.Q.; Long, Y. Inferring Ghost Cities on the Globe in Newly Developed Urban Areas Based on Urban Vitality with Multi-Source Data. Habitat Int. 2025, 158, 103350. [Google Scholar] [CrossRef]
- Landry, C. Urban Vitality: A New Source of Urban Competitiveness; Archis Foundation: Amsterdam, The Netherlands, 2000; pp. 8–13. [Google Scholar]
- Pakoz, M.Z.; Isik, M. Rethinking Urban Density, Vitality and Healthy Environment in the Post-Pandemic City: The Case of Istanbul. Cities 2022, 124, 103598. [Google Scholar] [CrossRef]
- Tang, S.; Ta, N. How the Built Environment Affects the Spatiotemporal Pattern of Urban Vitality: A Comparison Among Different Urban Functional Areas. Comput. Urban Sci. 2022, 2, 39. [Google Scholar] [CrossRef] [PubMed]
- Jacobs, J. The Death and Life of Great American Cities; Random House: New York, NY, USA, 1961. [Google Scholar]
- Jiang, D.F. The Theory of City Form Vitality; Southeast University Press: Nanjing, China, 2007. [Google Scholar]
- Zhe, C.; Ma, S. Research on the Vitality of Urban Streets. Archit. J. 2009, S2, 121–126. [Google Scholar]
- Jiang, D.F.; Li, J.X. Several Thoughts About the Making of Vitality in Contemporary Cities. New Archit. 2016, 26, 21–25. [Google Scholar]
- Chen, Y.; Yu, B.; Shu, B.; Yang, L.; Wang, R. Exploring the Spatiotemporal Patterns and Correlates of Urban Vitality: Temporal and Spatial Heterogeneity. Sustain. Cities Soc. 2023, 91, 104440. [Google Scholar] [CrossRef]
- Doan, Q.C.; Ma, J.; Chen, S.; Zhang, X. Nonlinear and Threshold Effects of the Built Environment, Road Vehicles and Air Pollution on Urban Vitality. Landsc. Urban Plan. 2025, 253, 105204. [Google Scholar] [CrossRef]
- Li, X.; Li, Y.; Jia, T.; Zhou, L.; Hijazi, I.H. The Six Dimensions of Built Environment on Urban Vitality: Fusion Evidence from Multi-Source Data. Cities 2022, 121, 103482. [Google Scholar] [CrossRef]
- Boessen, A.; Hipp, J.R.; Butts, C.T.; Nagle, N.N.; Smith, E.J. The Built Environment, Spatial Scale, and Social Networks: Do Land Uses Matter for Personal Network Structure? Environ. Plan. B Urban Anal. City Sci. 2018, 45, 400–416. [Google Scholar] [CrossRef]
- Gong, H.; Wang, X.; Wang, Z.; Liu, Z.; Li, Q.; Zhang, Y. How Did the Built Environment Affect Urban Vibrancy? A Big Data Approach to Post-Disaster Revitalization Assessment. Int. J. Environ. Res. Public Health 2022, 19, 12178. [Google Scholar] [CrossRef]
- Jia, J.Y.; Song, J.F. Identifying the Relationship Between Urban Vitality and the “3D” Characteristics of Built Environment: A Case Study of Wuhan, China. Mod. Urban Res. 2020, 8, 59–66. [Google Scholar]
- Cao, Z.M.; Zhen, F.; Li, Z.X.; Lobsang, T. Urban Temporal Vibrancy Mode and Its Influencing Factors Based on Mobile Signaling Data: A Case Study of Nanjing, China. Hum. Geogr. 2022, 37, 109–117. [Google Scholar] [CrossRef]
- Sung, H.; Lee, S. Residential Built Environment and Walking Activity: Empirical Evidence of Jane Jacobs’ Urban Vitality. Transp. Res. Part D Transp. Environ. 2015, 41, 318–329. [Google Scholar] [CrossRef]
- Ta, N.; Zeng, Y.T.; Zhu, Q.Y.; Wu, J. Relationship Between Built Environment and Urban Vitality in Shanghai Downtown Area Based on Big Data. Sci. Geogr. Sin. 2020, 40, 60–68. [Google Scholar] [CrossRef]
- Yu, L.; Sheng, Y.H.; Liu, X.Y. A Method for Evaluating Urban Vitality Using the RAGA-PPM Model: A Case Study of Central Nanjing. J. Geo-Inf. Sci. 2024, 26, 2567–2582. [Google Scholar]
- Arbia, G. Spatial Econometrics: Statistical Foundations and Applications to Regional Convergence; Springer Science & Business Media: Berlin, Germany, 2006. [Google Scholar]
- Piketty, T.; Saez, E. Income Inequality in the United States, 1913–1998. Q. J. Econ. 2003, 118, 1–41. [Google Scholar] [CrossRef]
- Lee, S.; Kang, J.E. Impact of Particulate Matter and Urban Spatial Characteristics on Urban Vitality Using Spatiotemporal Big Data. Cities 2022, 131, 104030. [Google Scholar] [CrossRef]
- Mouratidis, K.; Poortinga, W. Built Environment, Urban Vitality and Social Cohesion: Do Vibrant Neighborhoods Foster Strong Communities? Landsc. Urban Plan. 2020, 204, 103951. [Google Scholar] [CrossRef]
- Chen, Y.; Yang, J.; Yu, W.; Ren, J.; Xiao, X.; Xia, J.C. Relationship Between Urban Spatial Form and Seasonal Land Surface Temperature Under Different Grid Scales. Sustain. Cities Soc. 2023, 89, 104374. [Google Scholar] [CrossRef]
- Yang, Y.; Wang, H.; Qin, S.; Li, X.; Zhu, Y.; Wang, Y. Analysis of Urban Vitality in Nanjing Based on a Plot Boundary-Based Neural Network Weighted Regression Model. ISPRS Int. J. Geo-Inf. 2022, 11, 624. [Google Scholar] [CrossRef]
- Zhang, A.; Li, W.; Wu, J.; Lin, J.; Chu, J.; Xia, C. How Can the Urban Landscape Affect Urban Vitality at the Street Block Level? A Case Study of 15 Metropolises in China. Environ. Plan. B Urban Anal. City Sci. 2021, 48, 1245–1262. [Google Scholar] [CrossRef]
- Zhang, A.; Li, W.; Wu, J.; Lin, J.; Chu, J.; Xia, C. Spatial Features of Urban Vitality and the Impact of Built Environment on Them Based on Multi-Source Data: A Case Study of Shenzhen. Trop. Geogr. 2021, 41, 1280–1291. [Google Scholar]
- Shi, Y.; Zheng, J.; Pei, X. Measurement Method and Influencing Mechanism of Urban Subdistrict Vitality in Shanghai Based on Multisource Data. Remote Sens. 2023, 15, 932. [Google Scholar] [CrossRef]
- Portugali, J. What Makes Cities Complex? In Complexity, Cognition, Urban Planning and Design; Portugali, J., Stolk, E., Eds.; Springer International Publishing: Cham, Switzerland, 2016; pp. 3–19. [Google Scholar] [CrossRef]
- Zhu, T.T.; Tu, W.; Le, Y.; Zhong, C.; Zhao, T.; Li, Q.; Li, Q. Sensing Urban Vibrancy Using Geo-Tagged Data. Acta Geod. Cartogr. Sin. 2020, 49, 365–374. [Google Scholar]
- Sun, H.H.; Jiang, Y.P. Spatial Heterogeneity of the Impact of Built Environment on Urban Vitality: A Case Study of the Central Urban Area of Nanjing. Geogr. Res. 2024, 43, 1700–1714. [Google Scholar]
- Wang, X.; Zhang, Y.; Yu, D.; Qi, J.; Li, S. Investigating the Spatiotemporal Pattern of Urban Vibrancy and Its Determinants: Spatial Big Data Analyses in Beijing, China. Land Use Policy 2022, 119, 106162. [Google Scholar] [CrossRef]
- Lynch, K. Good City Form; MIT Press: Cambridge, MA, USA, 1984. [Google Scholar]
- Gehl, J. Life Between Buildings: Using Public Space; Island Press: Washington, DC, USA, 2011. [Google Scholar]
- Tong, M. How Urban Fabric Can Help Sustain the Vitality of Cities. Urban Plan. Forum 2014, 21, 85–96. [Google Scholar]
- Jin, Y.J. Study on Urban Economic Vitality Index in China. Sci. Geogr. Sin. 2007, 27, 9–16. [Google Scholar]
- Della Spina, L. Multidimensional Assessment for “Culture-Led” and “Community-Driven” Urban Regeneration as Driver for Trigger Economic Vitality in Urban Historic Centers. Sustainability 2019, 11, 7237. [Google Scholar] [CrossRef]
- Wu, W.; Dang, Y.; Zhao, K.; Chen, Z.; Niu, X. Spatial Nonlinear Effects of Urban Vitality Under the Constraints of Development Intensity and Functional Diversity. Alex. Eng. J. 2023, 77, 645–656. [Google Scholar] [CrossRef]
- Wang, Z.; Wang, X.; Liu, Y.; Zhu, L. Identification of 71 Factors Influencing Urban Vitality and Examination of Their Spatial Dependence: A Comprehensive Validation Applying Multiple Machine-Learning Models. Sustain. Cities Soc. 2024, 108, 105491. [Google Scholar] [CrossRef]
- Kim, Y.L. Seoul’s Wi-Fi Hotspots: Wi-Fi Access Points as an Indicator of Urban Vitality. Comput. Environ. Urban Syst. 2018, 72, 13–24. [Google Scholar] [CrossRef]
- Meng, Y.; Xing, H. Exploring the Relationship Between Landscape Characteristics and Urban Vibrancy: A Case Study Using Morphology and Review Data. Cities 2019, 95, 102389. [Google Scholar] [CrossRef]
- Tu, W.; Zhu, T.; Xia, J.; Zhou, Y.; Lai, Y.; Jiang, J.; Li, Q. Portraying the Spatial Dynamics of Urban Vibrancy Using Multisource Urban Big Data. Comput. Environ. Urban Syst. 2020, 80, 101428. [Google Scholar] [CrossRef]
- Guo, J.; Wang, J.; Xu, C.; Song, Y. Modeling of spatial stratified heterogeneity. GISci. Remote Sens. 2022, 59, 1660–1677. [Google Scholar] [CrossRef]
- Yue, Y.; Zhuang, Y.; Yeh, A.G.O.; Xie, J.-Y.; Ma, C.-L.; Li, Q.-Q. Measurements of POI-Based Mixed Use and Their Relationships with Neighbourhood Vibrancy. Int. J. Geogr. Inf. Sci. 2017, 31, 658–675. [Google Scholar] [CrossRef]
- Li, M.; Liu, J.; Lin, Y.; Xiao, L.; Zhou, J. Revitalizing Historic Districts: Identifying Built Environment Predictors for Street Vibrancy Based on Urban Sensor Data. Cities 2021, 117, 103305. [Google Scholar] [CrossRef]
- Yang, J.; Cao, J.; Zhou, Y. Elaborating Non-Linear Associations and Synergies of Subway Access and Land Uses with Urban Vitality in Shenzhen. Transp. Res. Part A Policy Pract. 2021, 144, 74–88. [Google Scholar] [CrossRef]
- Chen, T.; Hui, E.C.M.; Wu, J.; Lang, W.; Li, X. Identifying Urban Spatial Structure and Urban Vibrancy in Highly Dense Cities Using Georeferenced Social Media Data. Habitat Int. 2019, 89, 102005. [Google Scholar] [CrossRef]
- Lu, S.; Huang, Y.; Shi, C.; Yang, X. Exploring the Associations Between Urban Form and Neighbourhood Vibrancy: A Case Study of Chengdu, China. ISPRS Int. J. Geo-Inf. 2019, 8, 165. [Google Scholar] [CrossRef]
- Xiao, L.; Lo, S.; Liu, J.; Zhou, J.; Li, Q. Nonlinear and Synergistic Effects of TOD on Urban Vibrancy: Applying Local Explanations for Gradient Boosting Decision Tree. Sustain. Cities Soc. 2021, 72, 103063. [Google Scholar] [CrossRef]
- Wang, B.; Lei, Y.; Xue, D.; Liu, J.; Wei, C. Elaborating Spatiotemporal Associations Between the Built Environment and Urban Vibrancy: A Case of Guangzhou City, China. Chin. Geogr. Sci. 2022, 32, 480–492. [Google Scholar] [CrossRef]


| Name of Data | Source of Data | Remarks |
|---|---|---|
| Spatial Distribution Data on Population Density | Oak Ridge National Laboratory (ORNL) | The spatial resolution is 1 km. |
| Night Light Data | National Oceantic and Atmospheric Administration | This study used DMSP/OLS and NPP/VIIRS Night Light Data |
| GDP Kilometric Grid Data | Geographical Information Monitoring Cloud Platform | Utilizing diverse spatial data, including height and topography, it produces 1 km × 1 km GDP raster data for each industry |
| POI data | amap | Data encompassing 23 primary categories, numerous secondary categories, and myriad tertiary categories. |
| Building Data | amap | The data includes raster boundaries of building outlooks and height features |
| Road Data | Open street map | The data includes details regarding road location, layout, and length. |
| Normalized Difference Vegetation Index | NASA | The spatial resolution of the data is 250 m. |
| Item | Weights | |
|---|---|---|
| Social Vitality | Degree of population agglomeration | 0.2258 |
| Intensity of spatial interaction between residents and the urban environment | 0.217 | |
| Economic Vitality | Spatial distribution of GDP | 0.317 |
| Cultural Vitality | Distribution of cultural facilities | 0.2402 |
| Primary Indicator | Secondary Indicator | Before Test | After Test | ||||
|---|---|---|---|---|---|---|---|
| Code | Name | Code | Name | VIF Value | Tolerance | VIF Value | Tolerance |
| X1 | Land-use Mixed Degree | X11 | Functional Mixture Degree | 1.363 | 0.733 | 1.276 | 0.783 |
| X2 | Development Intensity | X21 | Building Density | 10.012 | 0.1 | -- | -- |
| X22 | FAR | 12.044 | 0.083 | 3.625 | 0.276 | ||
| X3 | Functional Facilities Supporting | X31 | Commercial Facility Density | 17.735 | 0.056 | 8.424 | 0.119 |
| X32 | Business Facility Density | 3.786 | 0.264 | -- | -- | ||
| X33 | Public Facility Density | 10.437 | 0.096 | 6.337 | 0.158 | ||
| X34 | Living Facility Density | 26.316 | 0.038 | -- | -- | ||
| X35 | Leisure Facility Density | 20.745 | 0.048 | 9.16 | 0.109 | ||
| X4 | Road Traffic Configuration | X41 | Bus Stop Density | 7.698 | 0.13 | 6.264 | 0.16 |
| X42 | Subway Station Density | 4.123 | 0.243 | 3.31 | 0.302 | ||
| X43 | Road Density | 18.023 | 0.055 | 4.991 | 0.2 | ||
| X44 | Road Intersection Density | 23.825 | 0.042 | -- | -- | ||
| X5 | Ecological Greening Environment | X51 | Park Square Density | 1.714 | 0.584 | -- | -- |
| X52 | Vegetation Coverage | 4.688 | 0.213 | 3.893 | 0.257 | ||
| X11 | X22 | X31 | X33 | X35 | X41 | X42 | X43 | X52 | |
|---|---|---|---|---|---|---|---|---|---|
| Functional Mixture Degree | FAR | Commercial Facility Density | Public Facility Density | Leisure Facility Density | Bus Stop Density | Subway Station Density | Road Intersection Density | Vegetation Coverage | |
| Robust_Pr | 0.0482 * | 0.0000 * | 0.3365 | 0.0052 * | 0.0759 | 0.0000 * | 0.0302 * | 0.0342 * | 0.6934 |
| Coefficient | 0.0848 | 0.1789 | −0.0798 | 0.1705 | 0.1210 | 0.2802 | 0.0854 | 0.1275 | 0.0228 |
 |  |  |  |  |  |  |  |  |
| Moran I | Z Value | p Value |
|---|---|---|
| 0.6011 | 34.9972 | 0.0000 |
| Factors | MGWR Results | OLS Results |
|---|---|---|
| AICc | −1384.51 | −394.477622 |
| R2 | 0.970255 | 0.900181 |
| Adjust R2 | 0.969663 | 0.893898 |
| Explanation Variables | Mean | Minimum | Lower Quartile | Median | Upper Quartile | Maximum | |
|---|---|---|---|---|---|---|---|
| CODE | NAME | ||||||
| X11 | Functional Mixture Degree | 0.098 | −0.051 | 0.04 | 0.084 | 0.148 | 0.355 |
| X22 | FAR | 0.049 | −0.431 | −0.034 | 0.073 | 0.143 | 0.372 |
| X31 | Commercial facility density | 0.364 | −3.437 | −0.051 | 0.104 | 0.406 | 8.764 |
| X33 | Public facility density | 0.079 | −5.46 | 0.06 | 0.188 | 0.344 | 1.462 |
| X35 | Leisure facility density | −0.079 | −6.905 | −0.041 | 0.054 | 0.116 | 0.496 |
| X41 | Bus stop density | 0.258 | −0.806 | 0.164 | 0.234 | 0.309 | 2.258 |
| X42 | Subway station density | 0.135 | −0.844 | 0.058 | 0.093 | 0.178 | 1.542 |
| X43 | Road Intersection density | 0.122 | −0.245 | 0.042 | 0.109 | 0.199 | 0.755 |
| X52 | Vegetation coverage | −0.067 | −0.283 | −0.121 | −0.072 | −0.008 | 0.156 |
Disclaimer/Publisher’s Note: The statements, opinions and data contained in all publications are solely those of the individual author(s) and contributor(s) and not of MDPI and/or the editor(s). MDPI and/or the editor(s) disclaim responsibility for any injury to people or property resulting from any ideas, methods, instructions or products referred to in the content. |
© 2025 by the authors. Licensee MDPI, Basel, Switzerland. This article is an open access article distributed under the terms and conditions of the Creative Commons Attribution (CC BY) license (https://creativecommons.org/licenses/by/4.0/).
Share and Cite
Lu, X.; Huang, S.; Xie, W.; Sun, Y. The Impact of Built Environment on Urban Vitality—A Multi-Scale Geographically Weighted Regression Analysis in the Case of Shenyang, China. Buildings 2025, 15, 2989. https://doi.org/10.3390/buildings15172989
Lu X, Huang S, Xie W, Sun Y. The Impact of Built Environment on Urban Vitality—A Multi-Scale Geographically Weighted Regression Analysis in the Case of Shenyang, China. Buildings. 2025; 15(17):2989. https://doi.org/10.3390/buildings15172989
Chicago/Turabian StyleLu, Xu, Shan Huang, Wuqi Xie, and Yuhang Sun. 2025. "The Impact of Built Environment on Urban Vitality—A Multi-Scale Geographically Weighted Regression Analysis in the Case of Shenyang, China" Buildings 15, no. 17: 2989. https://doi.org/10.3390/buildings15172989
APA StyleLu, X., Huang, S., Xie, W., & Sun, Y. (2025). The Impact of Built Environment on Urban Vitality—A Multi-Scale Geographically Weighted Regression Analysis in the Case of Shenyang, China. Buildings, 15(17), 2989. https://doi.org/10.3390/buildings15172989


