Article

Low-Emission Cement Mortars with Superplasticizer: Temperature-Dependent Performance

by
Beata Łaźniewska-Piekarczyk
Department of Building Processes and Building Physics, Faculty of Civil Engineering, The Silesian University of Technology, Akademicka 5, 44-100 Gliwice, Poland
Buildings 2025, 15(17), 2987; https://doi.org/10.3390/buildings15172987
Submission received: 25 June 2025 / Revised: 21 July 2025 / Accepted: 9 August 2025 / Published: 22 August 2025
(This article belongs to the Special Issue Advanced Studies in Cement-Based Materials)

Abstract

The environmental impact of cement production is strongly associated with the high clinker content and its corresponding CO2 emissions. This study examines the performance of low-emission cement mortars incorporating supplementary cementitious materials (SCMs), such as ground granulated blast-furnace slag (GGBFS) and fly ash, which partially replace clinker and contribute to CO2 reduction. Six cement types (CEM I, CEM II/B-V, CEM II/B-S, CEM III/A, CEM V/A (S-V), and CEM V/B (S-V)) were assessed in 104 mortar formulations using a polycarboxylate-based superplasticizer, under varied curing temperatures (10 °C, 20 °C, 29 °C, and 33 °C). The present study is an experimental analysis of the impact of different plasticising and superplasticising admixtures on the demand for admixtures to achieve high flowability and low air content in cement-standardised mortar for admixture testing. PN-EN 480-1. The results indicate that mortars containing CEM III/A and CEM V/B (S-V) exhibited compressive strengths comparable to or superior to CEM I at 28 days, with strength gains exceeding 60 MPa at 20 °C. Workability retention at elevated temperatures was most effective in slag-rich cements. The plasticizing efficiency of the admixture decreased at temperatures above 29 °C, especially in fly ash-rich systems. The incorporation of SCMs resulted in an estimated reduction of up to 60% in clinker, with a corresponding potential decrease in CO2 emissions of 35–45%. These findings demonstrate the technical feasibility of using low-clinker, superplasticized mortars in varying thermal environments, supporting the advancement of sustainable cementitious systems.

1. Introduction

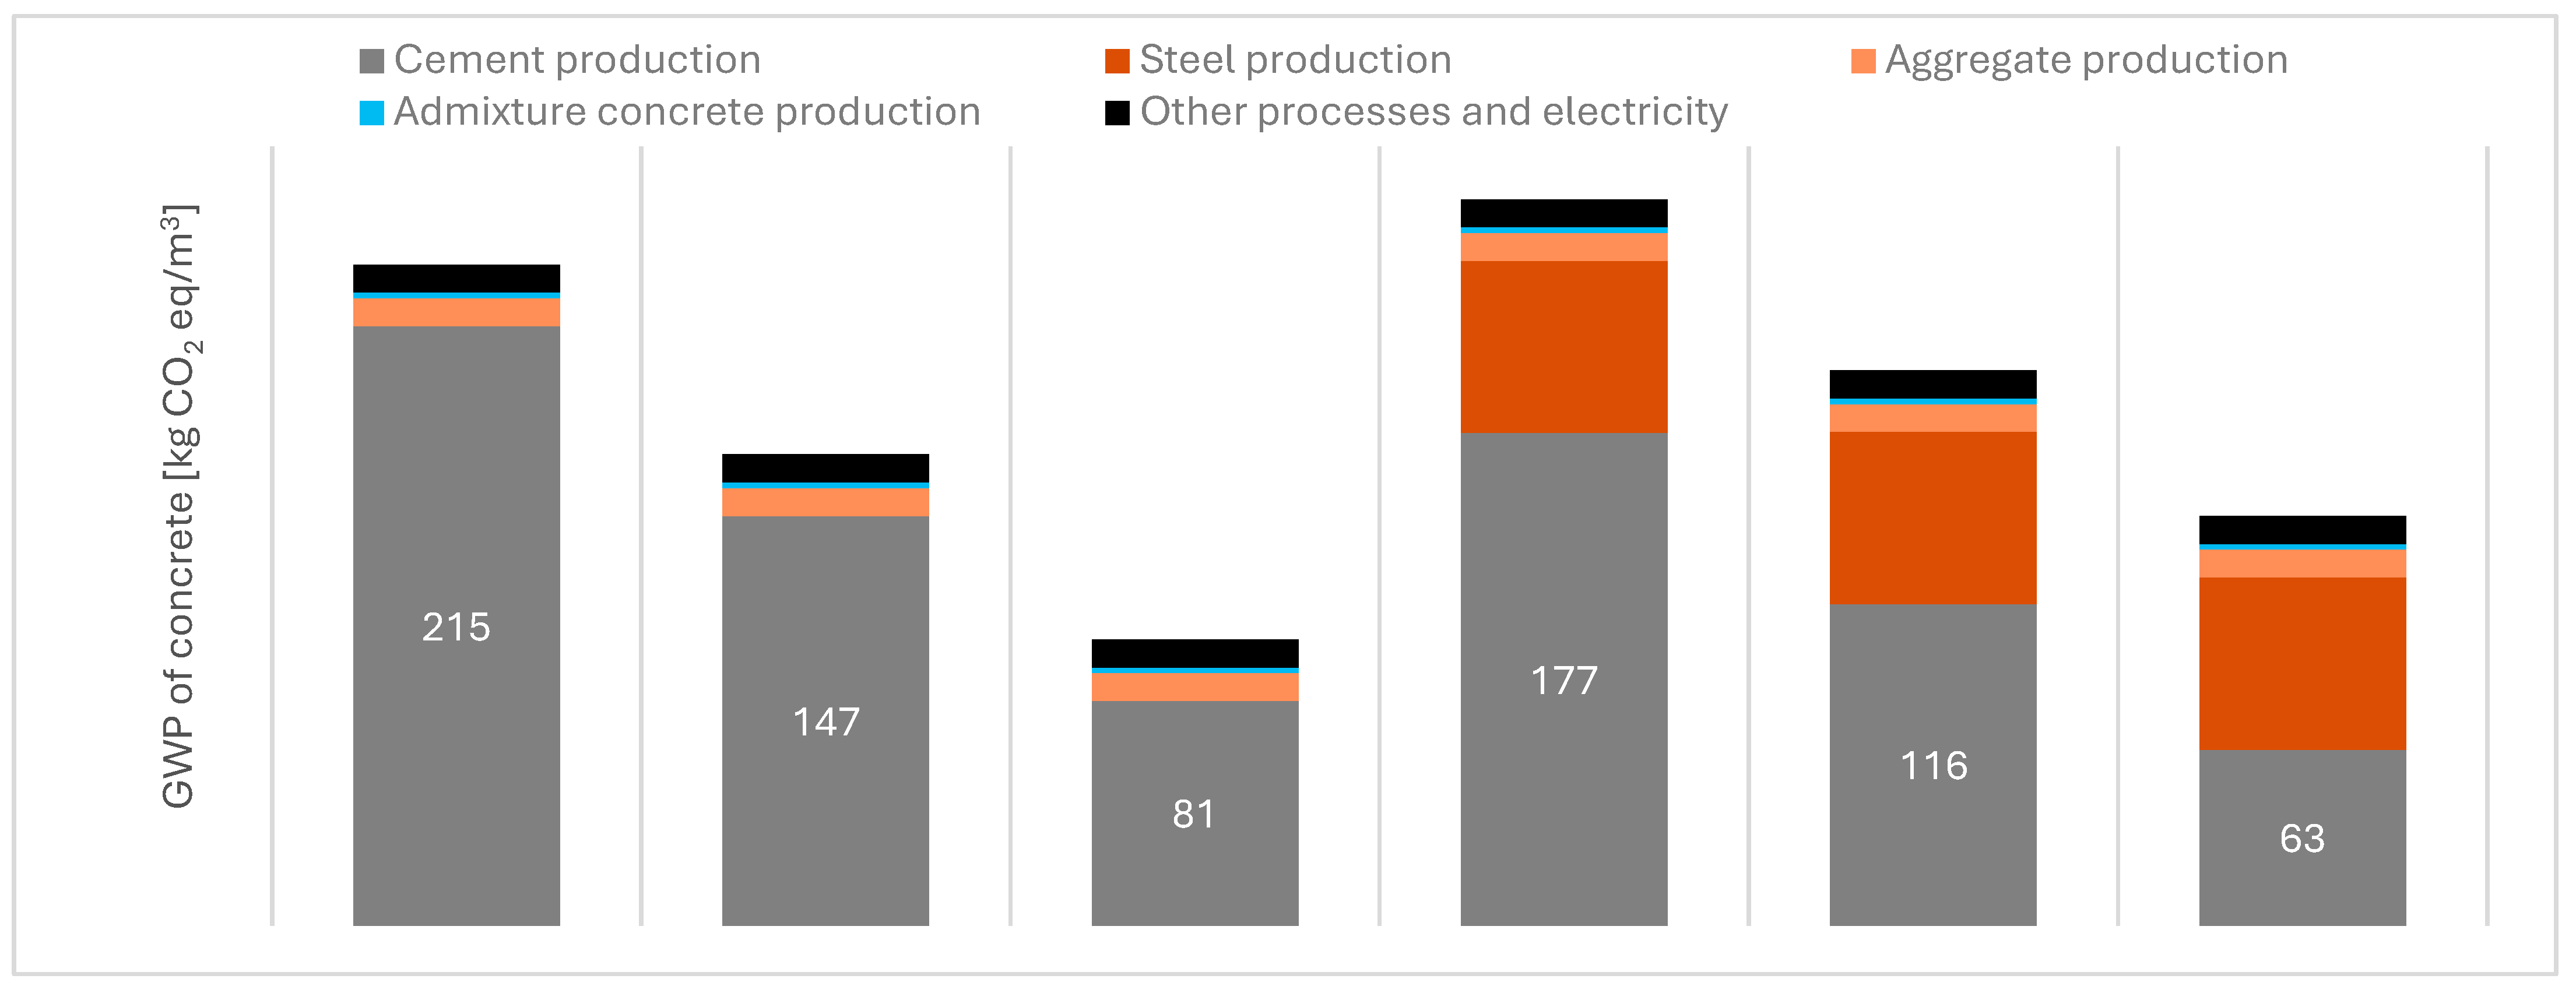
The European Cement Industry Association, CEMBUREAU, has prepared a Roadmap [1] that assumes CO2 emissions by cement and concrete producers will increase by approximately 40% and achieve climate neutrality by 2050. This goal will be achieved, among other things, by reducing the amount of clinker in cement because Portland clinker is responsible for cement’s high carbon footprint (Figure 1) [1,2,3].
Portland cement technology has evolved over the years. In 2017, the clinker-to-cement ratio in Europe was reduced to 77%. This means that, on average, 23% of Portland clinker was replaced with other ingredients, such as fly ash, blast furnace slag, or limestone, which led to the most effective and realistic way of reducing the environmental burden associated with cement production (and, consequently, concrete). Using ingredients other than Portland clinker is indispensable due to the increasing requirement to reduce CO2 emissions and the need to reduce the clinker/cement ratio to 0.60 ÷ 0.65 by 2050. Considering the increase in demand for cement, it is expected that emissions from the cement sector in 2030 will amount to 2.21 Gt CO2, and in 2050, the annual cement production will amount to 4682 Mt, and the clinker-to-cement ratio of 0.60 may lead to a further reduction in emissions to 488 kg CO2/Mg cement. Replacing just 1% of Portland clinker in cement with ash or slag reduces CO2 emissions by 9.0 kg/Mg of cement. The production of CEM II/A Portland cement with an addition of 18% slag or ash, and CEM II/B with an addition of 33% slag or ash, reduces CO2 emissions by 162 kg per Mg of cement, compared to CEM I Portland cement. The production of CEM II/B Portland cement with a 33% addition of slag or ash reduces CO2 emissions by 297 kg per metric ton of cement, compared to CEM I Portland cement. For Portland cement multi-component CEM II/B-M 42.5 R, the total GWP emission is 562 kg CO2 per ton of cement, which is as much as 1.54 times lower than in the case of CEM I 42.5 R. Production of metallurgical cement: CEM III/A containing 61% slag, CEM III/B containing 76% slag and CEM III/C with 90% slag content, allows for reducing CO2 emissions by approximately 65, 80 and 95% per Mg of cement, respectively, compared to CEM I Portland cement. CEM IVA and CEM IV/B pozzolanic cement containing 33 and 52% of pozzolanic components reduce CO2 emissions by approximately 35 and 55% per Mg of cement, respectively, compared to CEM I Portland cement. However, the production of CEM V/A (S-V) multi-component cement and CEM V/B (S-V), which contain 56% and 76% of ingredients other than clinker, respectively, reduces CO2 emissions by approximately 60% and 80% per Mg of cement, compared to CEM Portland cement. If we assume the amount of cement in concrete at the level of 300 kg/m3 and the percentage impact of individual concrete components on its resulting carbon footprint, then in the case of CEM I (with CO2 emission = 855 kg/Mg of cement)—is the carbon footprint of unreinforced concrete will amount to almost 240 kg CO2eq/1m3, while in the case of low-emission types of cement it will be only 100 kg CO2eq/1m3 [1,2,3].
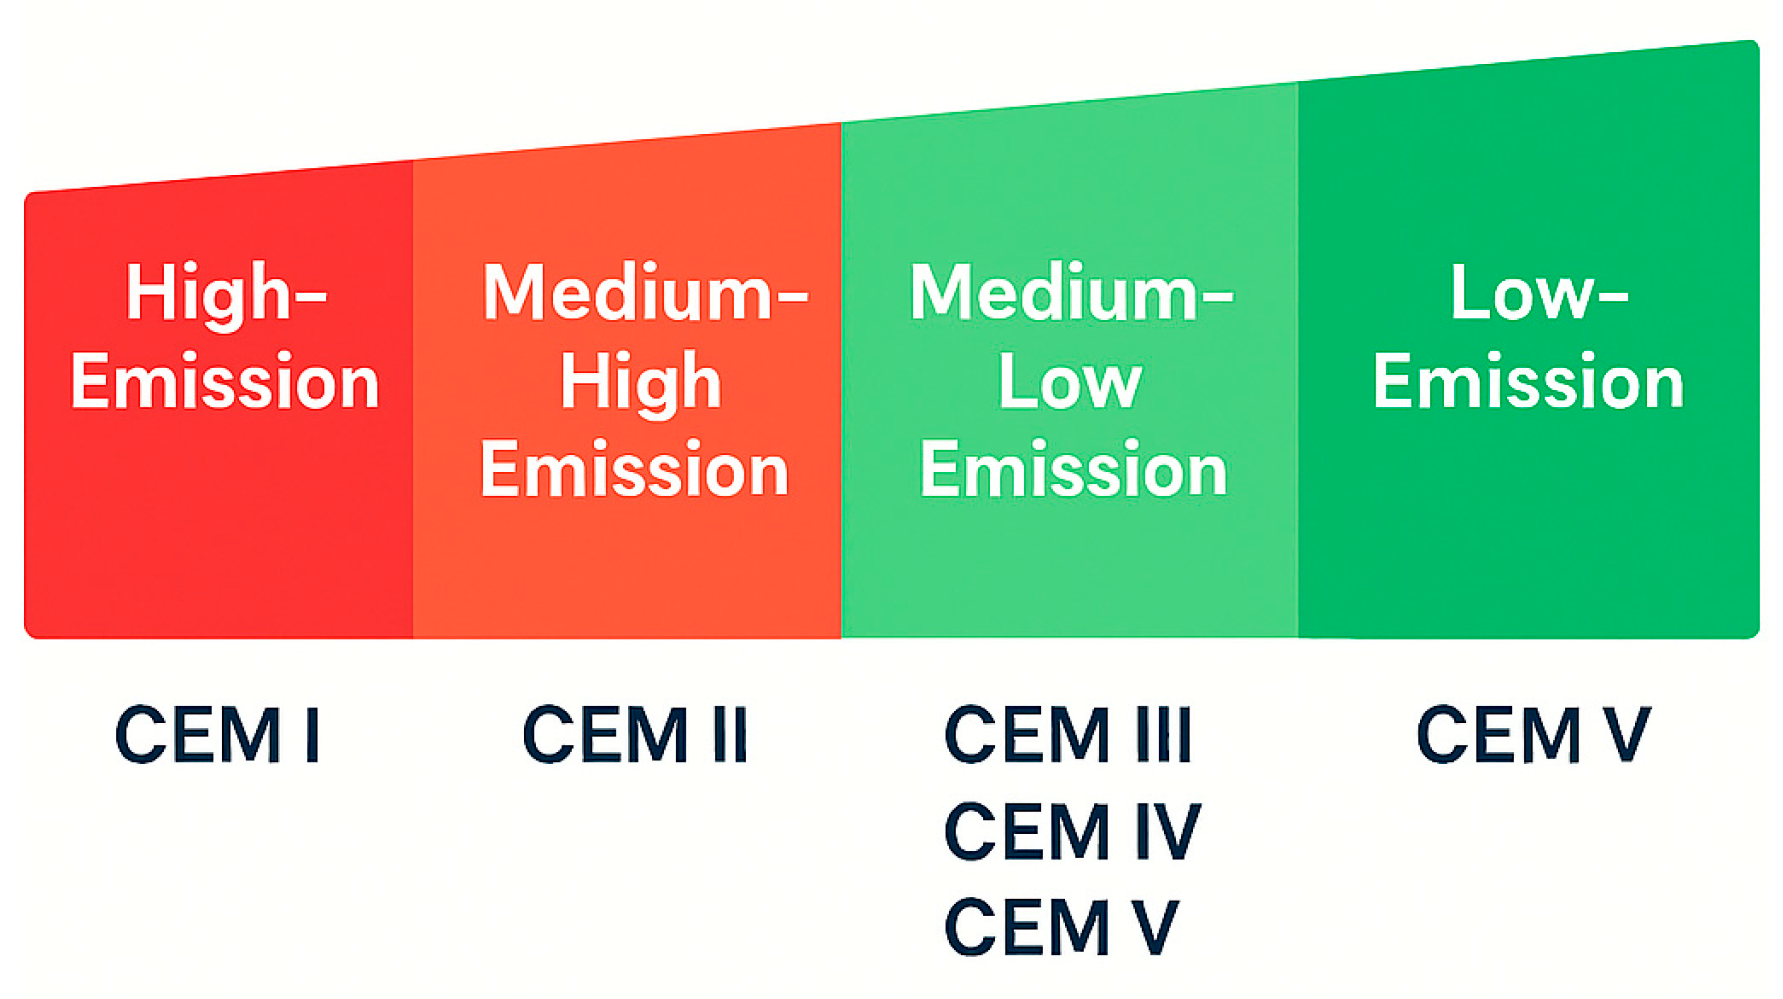
Therefore, low-emission cement in terms of CO2 is the basis for reducing the carbon footprint of concrete (over 85%). A global definition of low-emission cement has not yet been established. Low-emission cement includes cement whose emission is no more than 65% of the Portland cement CEM I emission (Figure 2). Moreover, by replacing clinkers with other ingredients, we contribute to managing post-industrial and other by-products, so we act in sustainable development, the economy, and a closed-loop (circular economy) approach.
The use of low-CO2 cement has been proven and widely practiced globally for decades, and low-emission cement concrete has advantages over Portland cement concrete in many exposure classes. (including better consistency, workability of concrete, resistance to sulphates, protection against alkaline corrosion, long-term strength, higher tightness, and low shrinkage). However, concrete with low-emission cement requires special attention due to its durability in frost [4,5,6,7,8] and carbonate exposure classes [9], as well as the protection of steel against corrosion. Problems with frost resistance may occur even in moderate frost conditions, especially when exposed to de-icing salts [3,5,6,10].
Currently, concrete with a low carbon footprint is characterized by a meagre w/c ratio [3,11,12,13,14]. An essential factor inhibiting the development of CO2-low multi-component cement production so far is the difficulty of using it in practice due to the reduction of consistency and workability, especially in maintaining these properties over time. Concrete admixtures enhance the workability of the concrete mix with a low water-to-cement (w/c) ratio, but only if they are appropriately selected for the type of cement [15,16]. The kind of cement affects the physical and chemical requirements of a given type of admixture.
The severe second obstacle in using a concrete mixture containing a liquefying admixture is the destructive effect of increased temperature on its efficiency [17,18,19,20,21].
Another difficulty is the side effects of some superplasticizers, which increase the air content in the concrete mix and consequently in the concrete [15,16,17,18,19,20,21,22,23,24].
The present study is an experimental analysis of the impact of different types of plasticising and superplasticizer admixtures on the admixture demand to achieve high flowability and low air content in cement mortar. PN-EN 480-1 [25] (counterpart ASTM C1384—12a [26]). with varying types of cement: CEM I, CEM II/B-V, CEM II/B-S, CEM III/A and CEM V/A (S-V), CEM V/B (S-V). In the second step of the study, the impact of temperatures 12.0 ± 1 °C and 29.0 ± 1 °C was compared, despite the fluidity and air content of mortar with the most compatible superplasticizing admixture, achieved in the previous step. Finally, the effect of temperatures of 10, 20 and 33 °C for the same cement (CEM I) and selected types of admixtures chosen in the previous stages of the study were examined. Research in the scope presented in the article has not been conducted before.

2. Materials and Methods

2.1. Materials

Six types of low-emission cements were used: CEM I 42.5R, CEM II/B-V 42.5R, CEM II/B-S 42.5N, CEM III/A 42.5N, CEM V/A (S-V) 42.5N and CEM V/B (S-V) 42.5N, all supplied by a certified manufacturer (according to PN-EN 197-1 [27]). The binders contained various proportions of clinker substitutes, including ground granulated blast-furnace slag and siliceous fly ash (Class F).
The admixture applied in all mortar mixes was a high-performance polycarboxylate ether (PCE)-based superplasticizer with a declared solid content of 30%, a density of 1.08 g/cm3, and a pH range of 6.5–8.5.

2.1.1. Cement Types

The following cement was tested as models: Portland cement CEM I—multi-component Portland cement: CEM II/B-V, CEM II/B-S, CEM II/B-M (S-V)—metallurgical cement CEM III/A. All cement was produced on a semi-technical scale from pre-ground raw materials. The cements were made of industrial clinker with an average phase composition containing 62% C3S and 14% C2S, as well as 8.5% C3A and 8.5% C4AF, respectively. The composition of types of cement for testing is listed in Table 1.
The materials used to prepare mortar mixtures were CEM I, CEM II/B-V, CEM II/B-S, CEM III/A, CEM V/A and CEM V/B, classified in the PN-EN 197-1 [27], each 450 g standardized sand (Figure 3), 1350 g and distilled water 225 g (0.496 lb.). The composition and methodology of mortar preparation were based on the guidelines of PN-EN 480-1 [25].

2.1.2. Admixtures Type

Table 2 lists the admixtures used in the studies. They were characterized by different chemical (base) compositions and effectiveness in action: superplasticizers (PCE, PCP, MN, PC, CLAP, AAP) and plasticizers (NSF, SMF, and MGL). The approximate (provided by the manufacturer) compositions and properties of the admixtures are listed in Table 3, Table 4 and Table 5.

2.1.3. Temperature

For comparison of the influence of temperature on flowability and air content in mortars, the most compatible (without “air-entraining” effect and with high-flowability effect) with cement CEM I, CEM II, CEM III, and CEM V: PCE-1 admixture was chosen. Mortars (Table 6) were tested at 12.0 ± 2 °C, 21.0 ± 1 °C, and 29.0 ± 2 °C.
The effects of temperature on mortar properties with CEM I and compatible admixtures (those that do not cause excessive air content) were also compared (see Table 7). In this case, the 10, 20, and 33 °C temperature ranges were more differentiated to further contrast the effect of admixtures.
Finally, in the research, 90 types of mortars were evaluated (including a reference mortar without admixture) at normal temperature (Table 2) and 12 additional mortars at different temperatures (12 and 29 °C) (Table 6), as well as six additional mortars at 10 and 33 °C (Table 7).

2.2. Methods

Cement and Mortar Research Methods

The physical properties of cement, characterized in Section 2.1, were investigated. The procedures of PN-EN 197-1 [27] and PN-EN 196-6 [28] were used to determine the specific surface area and water demand, using a procedure similar to that for determining the setting time of grout according to PN-EN 196-3 [29].
The experimental program was conducted in accordance with the PN-EN 480 and PN-EN 196 standards. The tests were conducted using standardized laboratory equipment. All mortars were prepared with tap water. Where applicable, the chemical reagents (e.g., for pH or setting time tests) were of analytical grade, with a minimum purity of 98%. Mortars were mixed using a standard laboratory mixer compliant with EN 196-1. The superplasticizer admixture was pre-mixed with the mixing water at the beginning of the mixing process to enhance its dispersion and efficiency, in line with current best practices. In contrast, plasticizers of earlier generations were added during the pause in mixing, following the standardized procedure. This approach was adopted to better align with current knowledge on maximizing the effectiveness of water-reducing admixtures and to reflect their specific dispersion characteristics.
The consistency of the mortars was determined acc. to PN-EN 1015-3 [30] while the air content acc. to PN-EN 1015-7 [31] after 5 min.

3. Research Results

3.1. Cement Properties

Table 8 lists the physical properties of cement, as described in Section 2.1.1. Multi-component cement (except CEM V and CEM II/B-V) are characterized by a significantly larger specific surface area than CEM I, but with lower water demand. This difference results from the physicochemical properties of additives other than clinker, affecting the adsorption of water by them. According to the PN-EN 206 [32] standard provisions, the water/cement ratio (w/c) is the effective water content ratio to the concrete mix’s cement content. The effective water content should be understood as the difference between the total amount of water and the amount of water absorbed by the aggregate, which, in practice, is treated as the difference in the amount of water resulting from the aggregate’s moisture and absorbability. According to the definition, for the correct calculation of the w/c ratio, the amount of water that the aggregate will contribute to the composition of the concrete mix and the mixing water added to the mixture should be considered.
Considering the above remarks, the adequate water content is calculated using the formula:
Wef = K·(Wg − Nw) + Wd
Wd = W-K·(Wg − Nw)
where:
  • W—amount of water in the concrete mixture recipe [kg],
  • Wef—effective water content [kg],
  • K—aggregate mass [kg],
  • Wg—aggregate moisture [%],
  • Nw—aggregate water absorption by weight [%],
  • We—added water [kg].
According to the author, the hygroscopicity of components other than clinker or cement, with their participation, especially CEM IV, should also be considered to determine the amount of adequate water in concrete. Failure to consider this feature may lead to a lower consistency than the concrete production technology requires and, consequently, too high dosing of liquefying admixtures.

3.2. Mortar Properties with Different Types of Superplasticizers

Table 9 presents the results of determining the diameter of mortar flow, and Table 10 presents the air content in its volume.

3.3. Mortar Properties at Different Temperatures

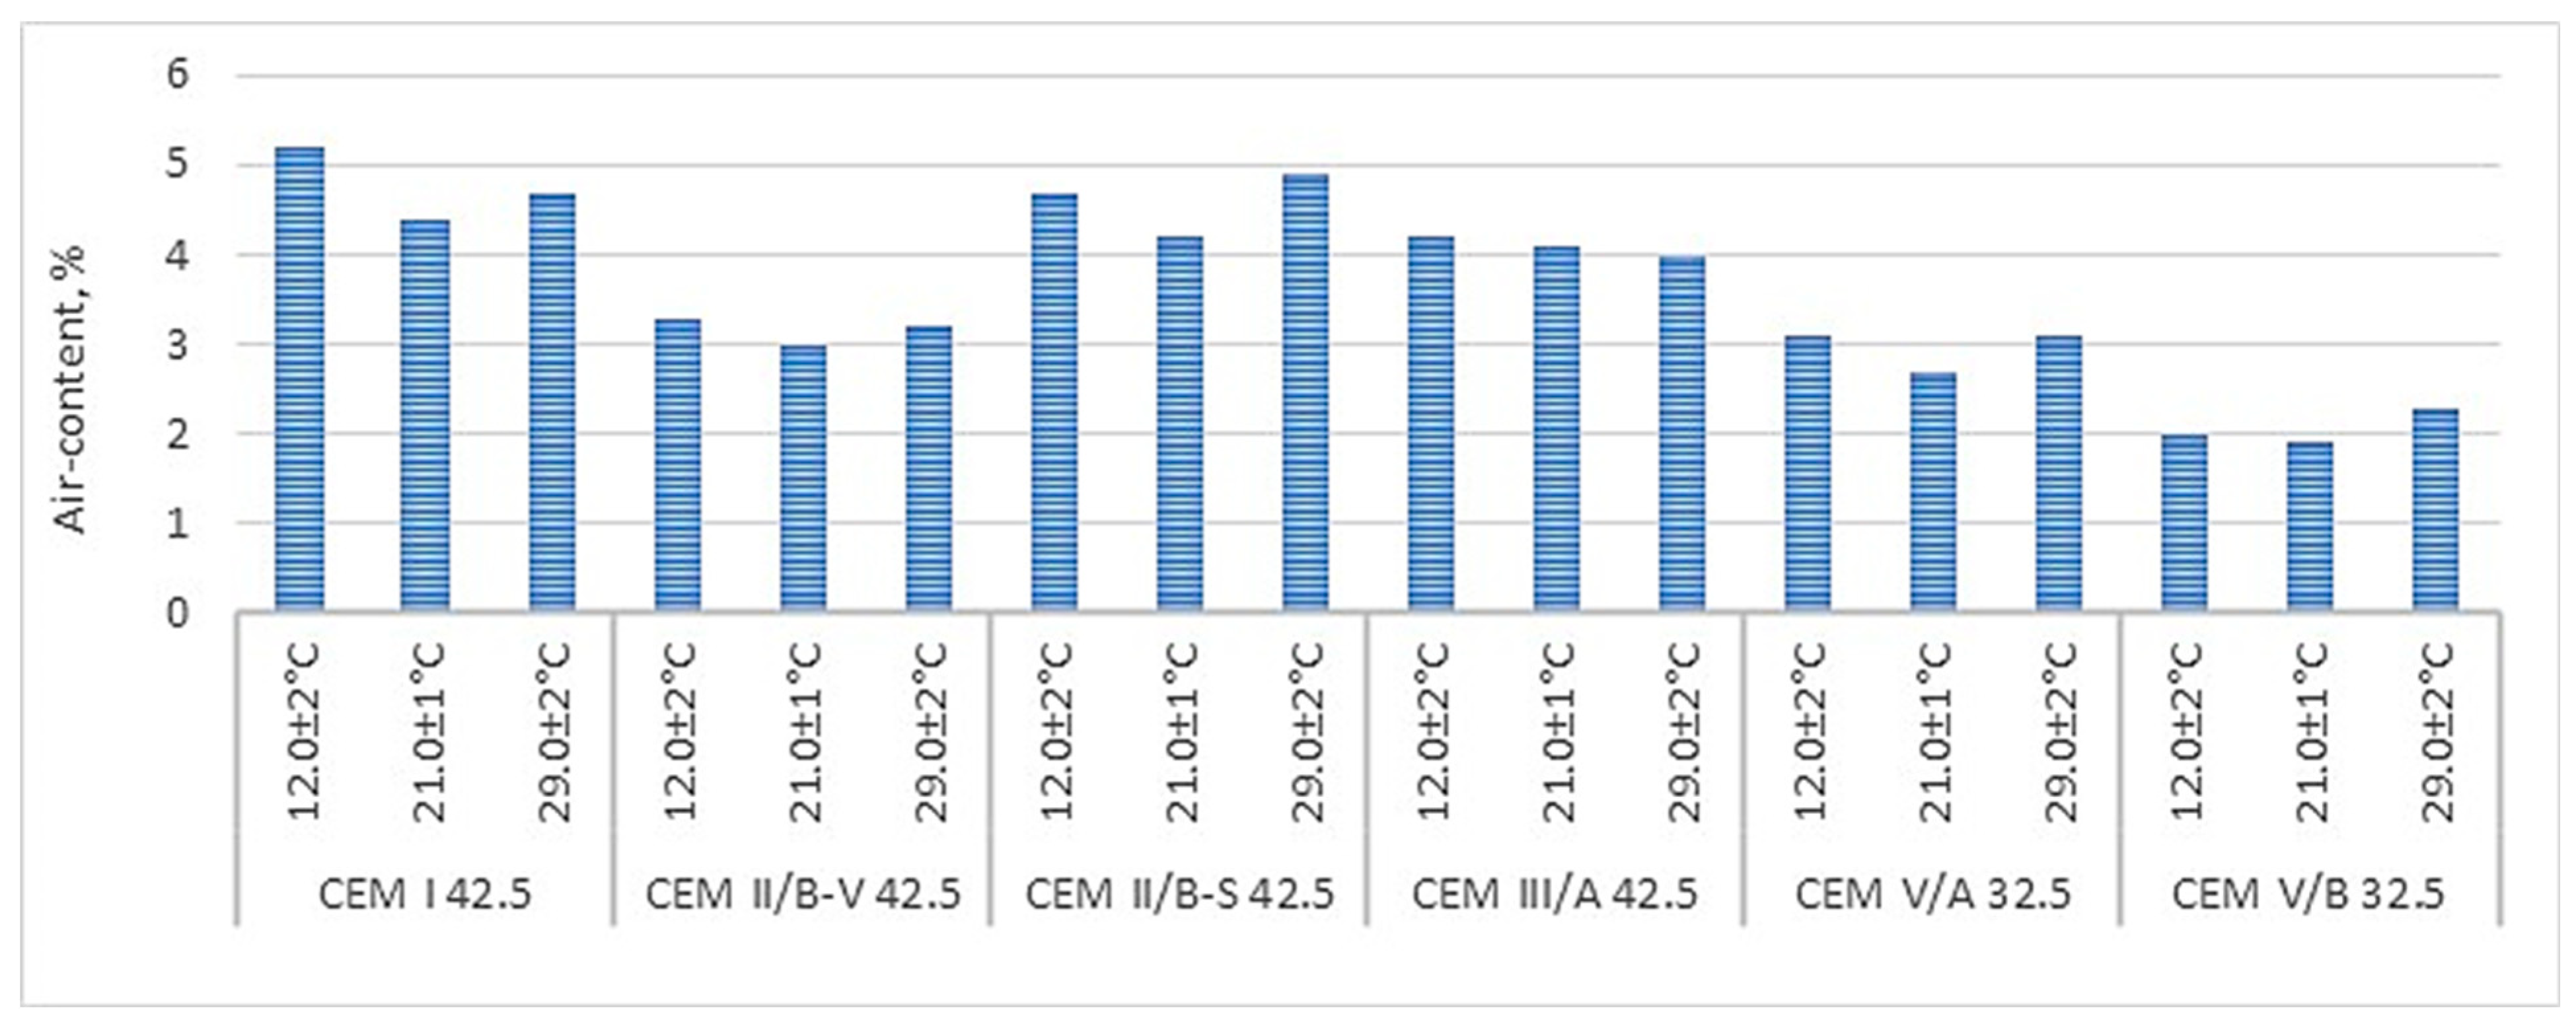
Table 11 presents the results of determining the air content in the mortar and its flow depending on the type of cement and admixture used. The data in this table provides valuable insights into the influence of different cement types and admixtures on mortar properties at varying temperatures. Table 12 complements these findings by showing the results of the flow and aeration of mortars with CEM I and various admixtures for lower, average and elevated temperatures.
When calculating the w/c ratio, it is necessary to consider the amount of added chemical admixtures in liquid form, especially when some producers of admixtures are increasingly reducing their concentration for economic reasons. Currently, the polymer concentration is only 20%. If we assume that the amount of cement in the mortar is 450 g, and the number of admixtures used for superplasticizers was from 0.214 to 0.590% of body weight (Table 12), then for 350 kg of cement per 1 m3 (according to the guidelines for model concrete PN-EN 480-1), the demand for liquefying admixtures (superplasticizers) is from 0.746 kg/m3 to 2.065 kg m/3. Following the requirements of PN-EN 206, if their amount exceeds three l/m3 of concrete [32].

4. Results Analysis

4.1. Properties of Mortar with Different Types of Superplasticizers

Figure 4 compares the demand for liquefaction or plasticizing admixture, depending on the type of cement, and Figure 5 and Figure 6 compare the air content in mortars with the resulting flow diameter.
The analysis of the test results presented in Figure 5 and Figure 6 indicates that reducing the amount of clinkers in cement promotes the consistency of the mortar and the air content in its volume. In the case of CEM V/A (S-V) cement, the largest flow diameters were obtained, with the smallest amount of admixture required among low-emission cement (Figure 4) and the lowest air compactness. And so, replacing Portland cement with cement with reduced emissions CEM II -CEM V/B (S-V) requires a much larger, more than twice the amount of the plasticizing admixture (SNF, SMF and MGL). However, in the case of more effective liquefaction admixtures, the amount required depends on the type of cement (Table 9 and Figure 4). For example, CEM II/B involves doubling liquefaction impurities compared to CEM I, like CEM II/B-S. On the other hand, CEM III/A required a lower requirement for liquefaction admixture than CEM II/B-V and CEM II/B-S. Comparing the demand for liquefying admixture in the case of CEM III/A, it is concluded that in the case of CEM III/A, the amount of liquefying admixture is lower to obtain a similar mortar flow. On the other hand, CEM V/A (S-V) AND CEM V/B (S-V) required a smaller amount of liquefaction admixture than CEM II/B-S and CEM II/B-V but more than CEM I.
The changes mentioned above in demand for the superplasticizing admixture result from the change in the specific surface area of the analyzed cement (Table 7). The larger the specific surface area of the cement, the more theoretically it requires an increase in the amount of liquefying admixture, with the same w/c of mortar (Table 13 and Table 14). As shown in Table 7, CEM II/B cement has the highest specific surface area; in this case, the required amount of liquefaction admixture was the highest. Therefore, the developed surface of cement can be a determinant for correlating the dosage of liquefying admixtures with the same w/c of mortar or concrete. Omitting this relationship during concrete design, as practice shows, leads to an uncontrolled increase in the amount of water during its construction, especially with low-emission cement with a high content of additives other than clinker. This, in consequence, leads to a significant reduction in the strength of concrete, especially its strength. The increased specific surface area is mainly characterized by low-emission CEM IV/A and CEM IV/B cement, whose specific surface area, according to Blaine, is 4146 and 5200 cm2/g (!). In their case, the demand for liquefaction is exceptionally high; therefore, they require a very effective selection. As shown in Figure 4, each type of cement requires an individual selection of the type and amount of liquefaction admixture.
It should be mentioned here that a lower specific density than Portland cement characterizes multi-component cement:
-
for CEM I: 3.10–3.15 g/cm3,
-
for CEM II/B: 2.90–3.02 g/cm3,
-
for CEM III/A: 2.98–3.05 g/cm3,
-
for CEM V/A (S-V): 2.85–3.00 g/cm3,
-
for CEM V/B (S-V): 2.80–2.95 g/dm3,
Depending on the degree of clinker milling and other components (Table 1) and their mutual proportions. Consequently, the lower the clinker content, and thus the lower the CO2 emission of cement, the more we gain a larger volume of grout with the same cement mass. This promotes the consistency of the mortar (Figure 5) and concrete. This is undoubtedly a great advantage of using low-emission cement in practice, a fact that this research demonstrates.
Figure 6 shows the results of measurements of the air content and flow diameter of mortars with CEM I and different admixtures. These results demonstrate that some new generations of superplasticizers can significantly increase the air volume in previously air-entrained cement-based mortars. The latest generation of admixtures substantially increases air content. The air content increases three times compared to previously aerated mortar. Many inorganic electrolytes and polar organic materials affect the foaming ability of surfactants [22,33]. The impact of other chemical admixtures on air entrainment is complex. Generally, most organic chemical admixtures can enhance air entrainment. The test results [33] show that the superplasticizer can reduce water’s surface tension similarly to admixture (AEA). The surface tension of the PCP superplasticizer solution is very low, approaching the level corresponding to the aeration admixture [33,34]. It should be noted here that the value of the surface tension of the superplasticizer’s aqueous solution is closely related to its foaming activity.
The results of tests [33] indicated that the different types of high-range water-reducing admixtures influence surface tension, foaming, and stability of air bubbles differently. The new generation of liquefaction admixtures comprises compounds made from polycarboxylates (PC), copolymers of acrylic acid with acrylates (CAE), or cross-linked acrylic polymers (CLAP). The chemical basis of these superplasticizers is primarily polyacrylates or methacrylates modified with various side chains attached to the main chain [34]. They operate according to the so-called steric mechanism. Their high efficiency in liquefying the concrete mix results from their characteristic structure. These superplasticizers have a high molecular weight and spatially developed polymer chains, creating a physical barrier between them by adsorbing onto cement grains, thus preventing cement flocculation [35,36]. These polymers often have hydrophilic groups in their structure; therefore, in addition to the spatial effect, electrostatic interactions are also observed in the case below. The combined effect of both allows the concrete mix to liquefy by up to 40%. Some types of superplasticizers affect the surface tension of the liquid phase of the cement paste. The presence of functional groups (oxygen in the form of etheric group (–O–), hydroxyl group (–OH) and carboxyl group) produces a decrease in water surface tension, producing flocculation of associated molecules and an increase in moisture of not only grains of cement but also the whole mineral framework [37]. In the SPs group, some show only dispersion functioning, not decreasing surface tension [38]. They are hydrocarboxylic acid salts, sulphonic melamine-formaldehyde resins, formaldehyde picodensate salts of beta-naphthalensulphonic acid. The research results [39,40]. Demonstrate that the surface tension changes significantly over time, depending on the combination of powder and superplasticizer. The change appears to be caused by sorption, which includes both chemical and physical adsorption and absorption. Among the three types of sorption, the absorption of superplasticizer by the powder hinders the function of the superplasticizer. The tendency was that absorption could occur in the paste, as indicated by the flowability test of the paste.
Plasticizers, on the other hand, are based on sulfonated melamine-formaldehyde polycondensates (SMF) and sulfonated naphthalene-formaldehyde polycondensates (SNF) and work according to a lubricating or electrostatic mechanism. In both cases, the superplasticizer molecules adsorb onto the cement grains, increasing their wetting and causing the cement agglomerates to break down. In the case of more frequent electrostatic interactions, superplasticizers containing SO3 and COO– COO-functional groups in their chains, when adsorbed on cement grains, impart a negative charge to them and cause the cement grains to repel each other [34]. In addition, first-generation superplasticizers include modified lignosulfonates (MLS) and other compounds, e.g., sulfonated aromatic amines (AS) [41]. Lignosulfonate compounds have a bipolar (dipole) structure. The negatively charged pole is hydrophobic and oriented towards the surface of the water molecule, while the positively charged pole connects to the cement particle. Cement conglomerates break down into smaller particles; the surface tension on the surface of grains wetted by mixing water decreases, and refined cement grains move more efficiently relative to one another. This effect will prove beneficial in cases of elevated temperatures, as demonstrated in the following subsection of the article.

4.2. Properties of Mortar at Different Temperatures

As evidenced by the research results in Figure 7 and Figure 8, the type of superplasticizer has a significant impact on the demand for the fluidizing admixture and the consistency of cement mortar at various temperatures. This practical implication of the research is also confirmed by the results of tests on non-aerated mortars conducted by Schmidt [42]. With the increase in temperature, the required amount of PCE-1 admixture multiplies to the greatest extent in the case of CEM I. The fewer Portland clinkers there were, the less admixture had to be increased, along with reducing the amount of Portland clinker in the cement mass.
As shown by the analysis of the results presented in Figure 7, the type of cement is crucial for maintaining mortar consistency at different temperatures. CEM V/B (S-V) cement, with the lowest content of Portland clinker, is the least susceptible to changes in consistency. Cement with S slag is more vulnerable to temperature changes than cement with V fly ash. CEM III/A achieved the most significant reduction in mortar fluidity under the influence of elevated temperature, but less than in the case of CEM I.
As shown in the analysis of the test results in Figure 9, the type of admixture affects the degree of change in mortar flow reduction with increasing temperature. A minor decrease in flow was obtained in the case of lignosulfonate admixtures, which are used in the case of concretes with higher requirements than one would expect, e.g., in the case of self-compacting concretes [40,43,44]. In practice, in the case of elevated temperatures, they are added as consistency precursors before dosing a newer generation of compatible liquefaction admixture.
Reduction of mortar flow under the influence of elevated temperature is more critical in the case of mortars with a superplasticizer than in the case of mortars with a plasticizer (Figure 9).
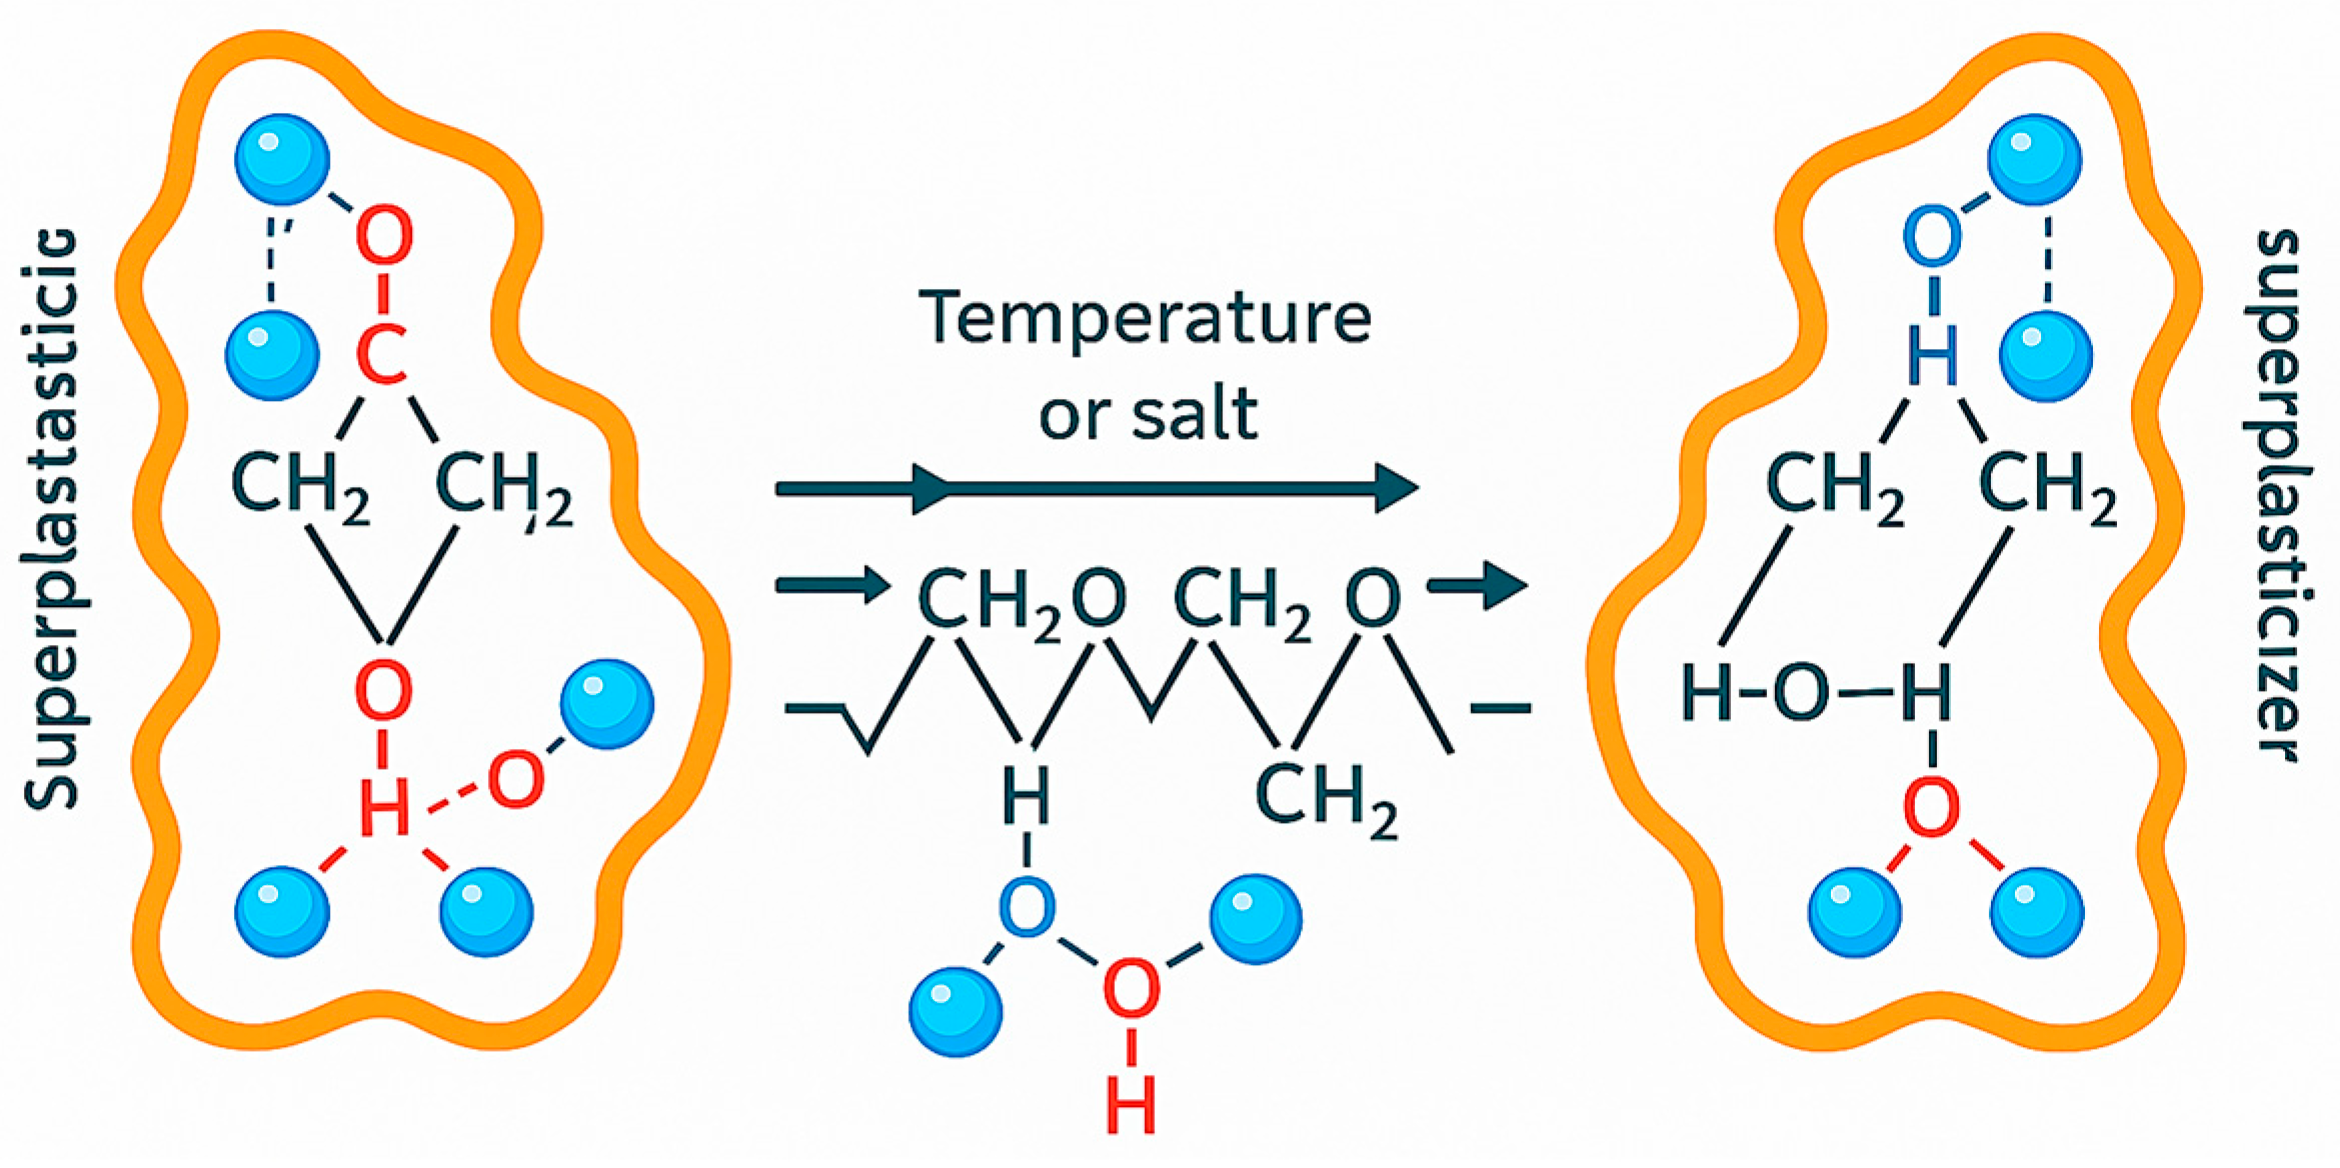
The study’s results are consistent with those of Ghafoori and Diawar [45], who found that above 20 °C, the flow of the non-aerated mixture decreases with increasing temperature. Additionally, research results [46] demonstrate that an increase in ambient temperature leads to a decrease in mortar flow, with the degree of reduction depending on the proportion of superplasticizer in the cement mass and the type of superplasticizer or plasticizer used. The results indicate that an increase in temperature leads to an increase in the saturation dose of the mortar with the admixture. The lignosulfonate plasticizer exhibited the most pronounced efficacy reduction with increasing temperature, followed by polycarboxylate and naphthalene, which showed the best effectiveness. The publication draws attention to the fact that under the influence of temperature increase or the presence of ions from salts that easily dissociate in water (for example, as is the case with aluminosilicate binders (geopolymers) [24] hydrogen bonds connecting the polyether chain with water are broken (Figure 10), as a result of which the chain becomes tangled. The spherical blockade gradually decreases until it disappears completely.
Different performances of these types of superplasticizers can be achieved depending on the type of polymer (MPEG, HPEG, IPEG, etc.), as well as the ionic power and acidity of the cement slurry (pH). Also, depending on the structure of the superplasticizer and, more precisely, on the quantitative content of individual types of polymers in the blocks, it is possible to influence the effectiveness of these superplasticizers in cement. The effect of temperature on the effectiveness of acrylic superplasticizers is related to the change in the degree of hydration of polyether chains within the polymer system of the superplasticizer, as well as the corresponding change in the extent of steric lock on cement grains with increasing temperature. Exceeding the temperature at which the steric blockage on cement grains is insufficient to deflocculated cement grains due to a decrease in the degree of hydration of polyether chains causes a loss of slurry fluidity. According to Plank and Hirsch [47], ettringite can adsorb significant amounts of negatively charged superplasticizer due to its highly positive ζ-potential, which increases with temperature. When the appropriate number of superplasticizer adsorption fields appears in the pore solution of the cement slurry, the superplasticizer’s efficiency increases, and thus, the diameter of the mixture flows [48,49]. According to Yoshioka [49], most superplasticizers are absorbed by ferrite and aluminum. The primary products of early hydration are Ca(OH)2, C-S-H, I-phase AFm, and AFph. According to Plank and Hirsch [47], the amount of superplasticizer absorbed depends strongly on the zeta potential of the hydration products. Ettringite can adsorb large quantities of negatively charged superplasticizers. This results in a more excellent dispersion of mixtures. As the temperature increases, the amount of ettringite increases, thus the mixtures’ fluidity. However, in the analyzed research results, it was not observed that the temperature rise caused an increase in the fluidity of the mortars. Studies [46] have shown that naphthalene-based admixtures have the best efficiency in increasing the fluidity of mortars at higher temperatures, resulting in a low air content in the volume.
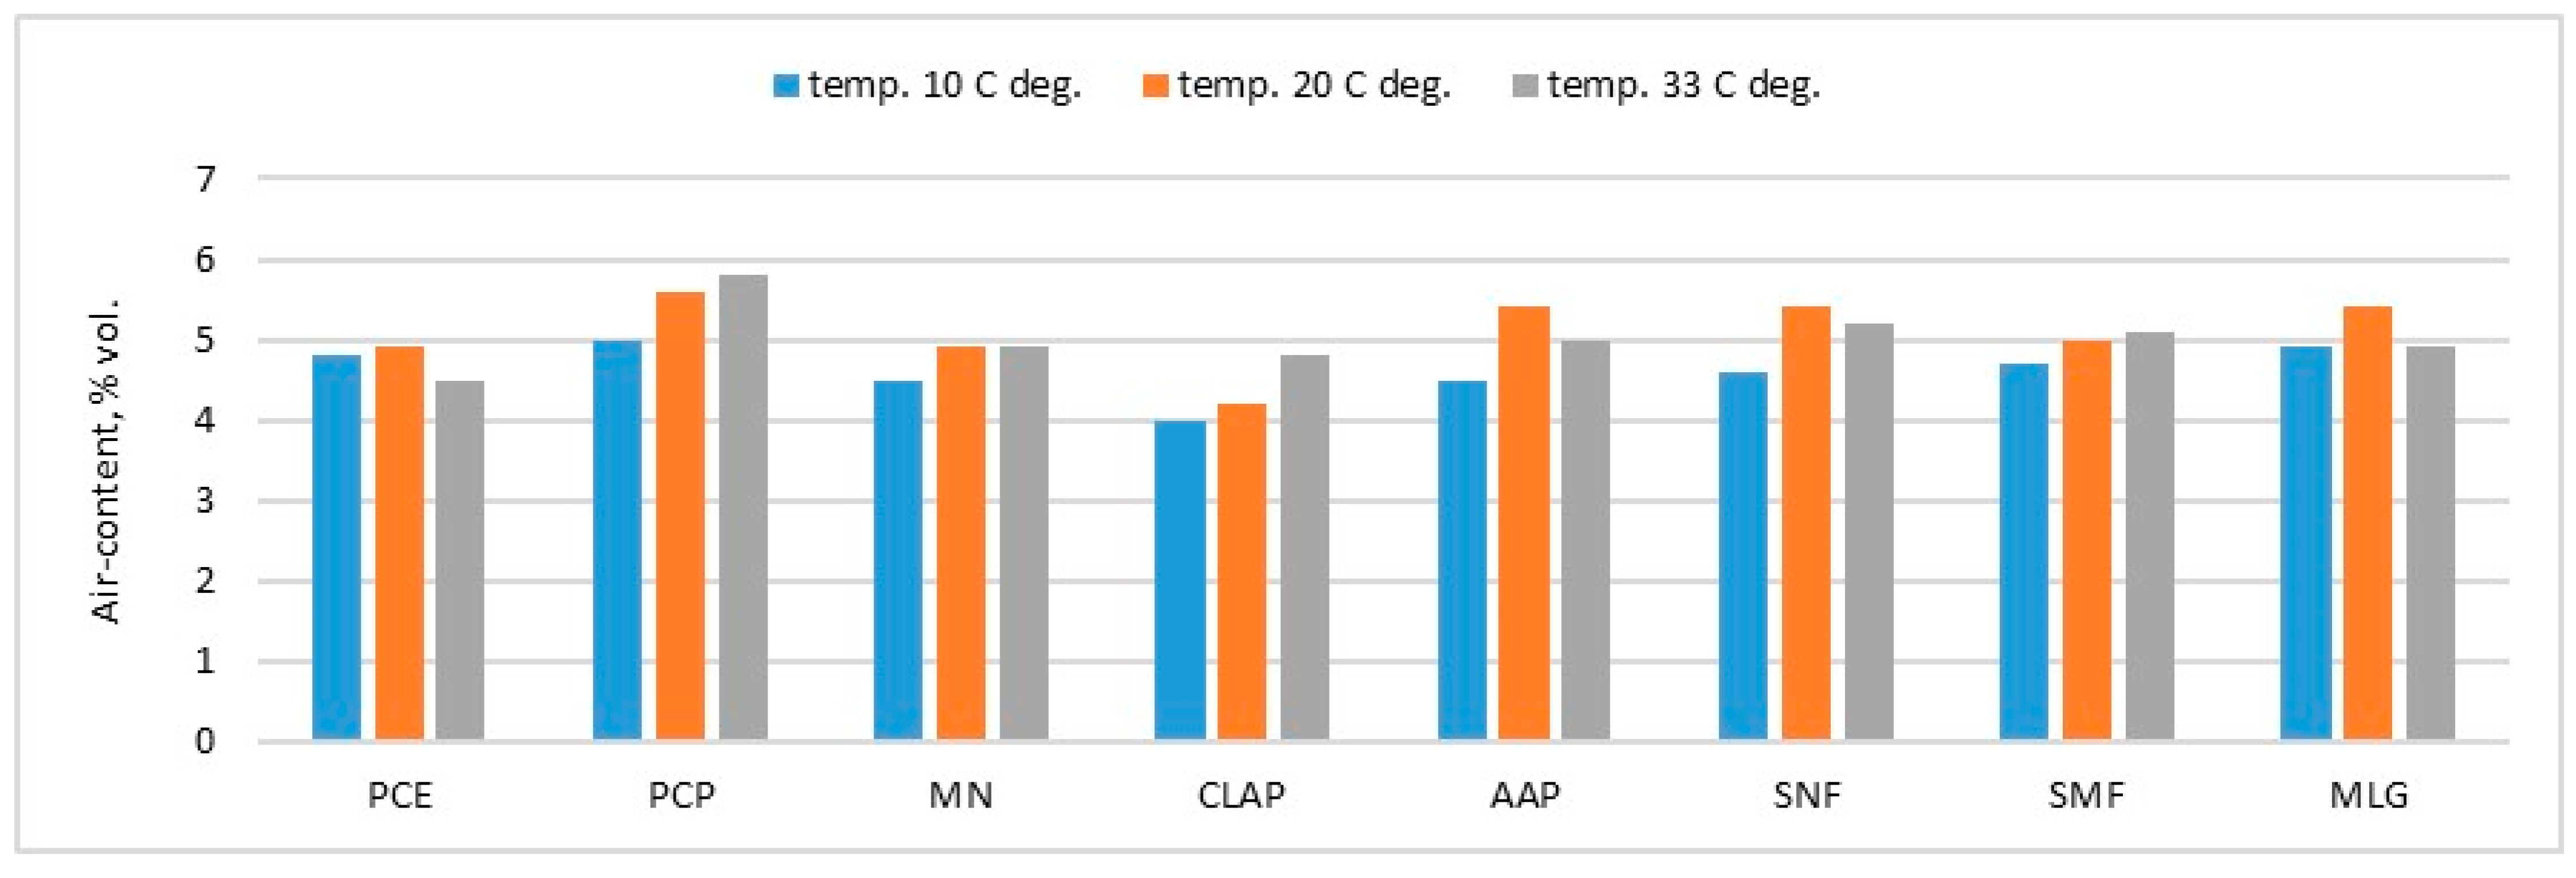
On the other hand, the effect of temperature on the aeration of mortars with various admixtures is not unambiguous [4,38,50,51,52]. In this case, it is impossible to form a constant relationship, as was previously the case with PCE 1 (Figure 10). The air content in the mortar under the influence of temperature depends both on the consistency of the mortar (yield limit and plastic viscosity) [19,34,53,54,55,56], but also on the value of the surface tension of the pore liquid of the cement slurry in the presence of a given type of admixture [57,58,59,60].
Some of the superplasticizers used in the mortar compositions included accelerating agents intended to enhance early hydration and strength development. It was observed that, under elevated temperature conditions, these admixtures contributed to a slight increase in air content in the mixtures. This effect is likely due to the combined influence of accelerated hydration heat and changes in surface tension, which facilitate the entrapment and stabilization of fine air voids during the mixing process. Although these admixtures are not classified as air-entraining agents, their formulation may produce similar side effects. As such, their impact on the total air content should be considered, especially in systems with low water-to-cement ratios or when evaluating temperature-sensitive performance.
In the case of superplasticizers with an increased side effect associated with excessive “aeration” of the mortar, the aeration of the mortar may increase with an increase in temperature as the superficial tension decreases, which is already relatively low [33]. The new generation of superplasticizers, which is based, in part, on the mechanism of lowering the surface tension of the liquid (PCP, PCE in Figure 11) [20,21,56], works more effectively as the temperature of the mortar increases because the surface tension value decreases with the rise in temperature. These superplasticizers and surfactants form an adsorption layer on the water’s surface, reducing surface tension and improving the wetting of the cement grain. Neutral admixtures, resulting from the aeration of the liquefied mortar, include liquefying admixtures F (based on modified phosphonates) and N (based on modified naphthalene), as well as traditional plasticizers, which have a less intense effect on the surface tension of water than PCE or PCP. Naphthalene and melamine plasticizers, as well as MLS-modified calcium or sodium lignosulfonates, and other products, such as formic acid copolymers with naphthalene sulfonic acid or methylnaphthalene sulfonic acid, also reduce the surface tension of water relative to cement and microfilters [57,58,59,60,61,62,63,64]. It is associated with more significant adsorption of the PCE superplasticizer on cement particles and cement hydration products.
The analysis of the effect of temperature on the air content in mortars with various liquefying admixtures is not as straightforward as the influence of temperature on consistency.
The dependence of the surface tension of a liquid on temperature is described by the equation [62] derived by Eötvös:
σ M d 2 3 = K ( T k T δ )
where:
  • σ—surface tension of the solution,
  • M—stands for molar mass,
  • D—density of the liquid (hence M/d—is the volume of one mole),
  • Tk—critical temperature,
  • δ—is a correction of about 6 degrees (it turns out that the disappearance of surface tension occurs at a temperature slightly lower than Tk).
An increase in temperature should reduce the air content in the mortar, as higher temperatures lead to faster water evaporation, thereby reducing the viscosity of the concrete mix. As a result, it is more difficult to keep air bubbles in it, which escape more easily from the concrete [4]. The viscosity of the cement slurry decreases as the temperature increases, so the air content should be lower. The effect of temperature on the air content of air-entrained mortar matches that observed in the publication [23]. Analyzing the impact of temperature on the behavior of cement paste, which is contained in its composition SP, can be traced to some analogy in the behavior of the liquid. The air molecules and the pressure can be calculated using equation [4]:
p V = n R T p V = n R T
For the vapour phase, the pressure is described using the Kelvin equation [63,64]:
p = p e 2 γ V m / r R T p = p e 2 γ V m / r R T
where:
  • p*—the vapour pressure of the liquid in the absence of additional pressure,
  • γ—the surface tension,
  • Vm—the molar volume,
  • r—the radius of the air bubble,
  • R—the gas constant,
  • T—the temperature in Kelvin.
Considering an air bubble in the fresh concrete, with an increase in temperature in concrete, n and T increase in Equation (4). Similarly, γ and T increase in Equation (5). These changes require a concurrent shift in p or V or both. When a liquid heats up, its molecules become excited and move. The energy of this movement is enough to overcome the forces that bind the molecules together, allowing the liquid to become more fluid and decreasing its viscosity. Because the paste pressure balances the internal pressure of air bubbles, it accumulates atmospheric and gravitational forces. It may thus change only slightly due to an increase in the paste’s viscosity [4,65,66,67,68,69]. As a result, the bubbles must expand their volume quite significantly. The outcome is a decrease in entrained air content and larger bubble sizes in fresh concrete whose temperature is higher than when it was initially mixed [63,68,69].
Nevertheless, the temperature of the concrete mixture can affect the air content in several ways. First, as it is well known, the higher temperature of water leads to the lower solubility of air in water [65,66,67]. At the same slump value, the mixture with a higher temperature consistently exhibits higher viscosity, and for the mix with higher viscosity, entraining air becomes more complex [69,70,71]. The low temperature decreases the yield stress and viscosity of concrete. Yield stress and viscosity of concrete mixtures act as energy barriers for air bubble formation. The higher the slump, the easier the gas dispersion in the mixture would be, and probably more giant air bubbles would result. The conclusion is consistent with the test results summarized in Figure 11. In the case of concrete, an increase in a slump from 75 to 150 mm (with all other mixture parameters remaining the same) will increase the air content [57,67,68,69]; however, above a slump of 150 mm, the large air bubbles become less stable due to buoyancy forces and the air content drops. According to the author, this may explain the difference in the impact of air temperature on the air contents of air-entrained concrete and air-entrained and plasticized concrete. As mentioned earlier, the SP type undoubtedly affects the direction of change in concrete consistency. For other kinds of SP than those analyzed, there may be another change of air entrainment in concrete under the influence of temperature [66]. Thus, the type of admixture significantly affects the resulting air content and consistency in the mortar at different temperatures; therefore, the resulting air content does not decrease with increasing temperature. This would be the case if the measurements were carried out with the same mortar flow at different temperatures and for the same admixture.
As shown by the analysis of the research results presented in Figure 12, the lower the clinker and blast furnace slag content in the cement, the lower the air content in the mortar at elevated temperatures (Figure 12).

5. Conclusions

Within the scope of the research, it was found that:
  • For each low-emission cement, the choice of amount and type of plasticizer or superplasticizer, due to the required aeration and consistency of the mixture, can be successfully carried out only based on the experimental comparison.
  • The choice of liquefying admixture should also consider its effect on the air content of the mortar or concrete. Some types of PCE and PCP admixtures excessively increase the air content in the mortar volume, which reduces its strength. Plasticizing dopants, except for lignosulfonate, do not have such an effect.
  • Reducing the amount of clinker in the cement promotes the consistency of the mortar and the air content in its volume. In the case of CEM V/A (S-V) cement, the largest flow diameters were obtained, with the smallest amount of admixture required among low-emission cement and the lowest air content. With the increase in the specific surface area of cement, there is an increased demand for the superplasticizing admixture, which is why CEM II/B cement is characterized by a much higher demand for a superplasticizer than CEM III/A and CEM V/A (S-V) cement, which shows only a slightly higher demand for a superplasticizer compared to CEM I. The demand for a liquefying admixture, depending on the type of cement, averages from 0.213 to 0.590% of the weight of the tested cement at a water-to-cement ratio (w/c) of 0.50. In the case of a CEM IV with a significantly expanded specific surface area, the effect will be much more pronounced.
  • With the increase in temperature, the mortar flow invariably decreases, but the air content decreases or increases, depending on the liquefaction used. A mortar modified with plasticizers is more resistant to reducing its flow with increasing temperature than a mortar made with superplasticizers. Under the influence of high temperatures, the hydrogen bonds connecting the polyether chain to water are broken, causing the chain to tangle (the more so, the higher the temperature). As a result, the spherical blockade gradually decreases until it disappears completely. Concrete with a low carbon footprint, made during a period of elevated temperatures, becomes non-workable. It requires a significant increase in liquefaction admixture, which is especially effective at low w/c (to increase the rate of development of its strength, especially durability).
  • The type of admixture significantly affects the resulting air content in the mortar at different temperatures and consistency; therefore, the resulting air content does not decrease with increasing temperature. This would be the case if the measurements were carried out with the same mortar flow at different temperatures and for the same admixture.
  • The admixture type significantly affects the mortar’s consistency at different temperatures. In the case of admixtures characterized by a side increase in the air content in the mortar, the increase in the mortar’s temperature contributes to a reduction in its flow. The oldest lignosulfonate plasticizing admixtures are the most “resistant” admixtures to the impact of elevated temperatures. In construction practice, in such cases, lignosulfonate admixtures are used, according to the results of research presented by the author, as “precursors” to the proper liquefaction of concrete through a more effective superplasticizer, enabling the production of concrete at a higher temperature.
Finally, it should be noted that modern concrete technology with a low carbon footprint requires that the amount of water in the concrete be minimized as much as possible. Hence, the search for an effective plasticizing admixture without side effects remains valid. Many admixtures guarantee plasticization in a significantly reduced time with a reduced amount of water [7,8,14]. This issue requires experimental research.
Moreover, in the author’s opinion, the selection of cement admixtures should be verified at much lower w/c (acc. to author opinion- maximum 0.37) than assumed by the guidelines of the international standards [25,26,27], as this allows for a more accurate comparison of their effectiveness in action, which is particularly important in modern concrete technology with a low carbon footprint.

Funding

This research received no external funding.

Institutional Review Board Statement

Not applicable.

Informed Consent Statement

Not applicable.

Data Availability Statement

Not applicable.

Conflicts of Interest

The author declares no conflict of interest.

Abbreviations

Subscripts and superscripts used in the article:
A. Cement Types (According to PN-EN 197-1 Standard):
AbbreviationFull NameDescription
CEM IPortland CementTraditional cement is mainly made of Portland clinker.
CEM II/B-VPortland-composite Cement with Fly AshContains up to 35% fly ash.
CEM II/B-SPortland-composite Cement with SlagContains up to 35% blast furnace slag.
CEM III/ABlast Furnace CementContains 36–65% blast furnace slag.
CEM V/A (S-V)Composite Cement with Slag and Fly AshMulti-component cement with ~56% non-clinker components (slag and fly ash).
CEM V/B (S-V)Composite Cement with Slag and Fly AshHigh-volume replacement cement (~76% non-clinker components).
B. Admixture type:
PCEPolycarboxylate EtherHigh-performance superplasticizer
PCPPolycarboxylate Polymer (Modified)Modified version of PCE
MNModified NaphthaleneTraditional plasticizer
PCPolycarboxylateGeneral polycarboxylate type
CLAPCross-Linked Acrylic PolymerAdvanced acrylic polymer
AAPAminophosphonate-based AdmixtureHigh-performance plasticizer
SNFSulfonated Naphthalene FormaldehydeOlder generation superplasticizer
SMFSulfonated Melamine FormaldehydeCondensation product-based plasticizer
MGLModified LignosulfonatesFirst-generation plasticizer

References

  1. CEMBUREAU. Mapping the Road to Climate Neutrality by 2050; CEMBUREAU: Brussels, Belgium, 2018; Available online: https://lowcarboneconomy.cembureau.eu/wp-content/uploads/2018/09/Gospodarka-niskoemisyjna-2050-Sektor-cementowy.pdf (accessed on 18 July 2025).
  2. Baran, T.; Garbarcik, A.; Ostrowski, M.; Radelczuk, H. Methods of Production of Low Emission Portland Clinker. In Proceedings of the Dni Betonu Conference, Wisła, Poland, 1–2 July 2016. [Google Scholar]
  3. Schneider, M. The Cement Industry on the Way to a Low-Carbon Future. Cem. Concr. Res. 2019, 124, 105792. [Google Scholar] [CrossRef]
  4. Du, L.; Folliard, K.J. Mechanisms of Air Entrainment in Concrete. Cem. Concr. Res. 2005, 35, 1463–1471. [Google Scholar] [CrossRef]
  5. Fagerlund, G. Durability of Concrete Structures; Arkady: Warsaw, Poland, 1999. [Google Scholar]
  6. Kqlaots, I.; Hurt, R.H.; Suuberg, E.M. Size Distribution of Unburned Carbon in Coal Fly Ash and Implications. Fuel 2004, 83, 223–230. [Google Scholar] [CrossRef]
  7. Pigeon, M.; Plante, P.; Plante, M. Air-Void Stability, Part I: Influence of Silica Fume and Other Parameters. ACI Mater. J. 1989, 86, 482–490. [Google Scholar]
  8. Lebedeva, R.L.; Skripkiunas, G.; Kičaitė, A. Influence of Mineral Additives on Environmental Resistance of Concrete. Constr. Sci. 2016, 18, 10–16. [Google Scholar] [CrossRef]
  9. Lech, M.; Juszczak, T.; Wawrzeńczyk, J. A Study on Carbonation Depth Prediction for Concrete Made with GBFS Cement and FA Addition. Struct. Environ. 2022, 14, 1–10. [Google Scholar] [CrossRef]
  10. Molendowska, A.; Wawrzeńczyk, J. Freeze-Thaw Resistance of Air-Entrained High Strength Concrete. Struct. Environ. 2017, 9, 25–33. [Google Scholar]
  11. Bhandari, I.; Kumar, R.; Sofi, A.; Nighot, N.S. A Systematic Study on Sustainable Low Carbon Cement–Superplasticizer Interaction: Fresh, Mechanical, Microstructural and Durability Characteristics. Heliyon 2023, 9, e19176. [Google Scholar] [CrossRef] [PubMed]
  12. Zivica, V. Effects of the Very Low Water/Cement Ratio. Constr. Build. Mater. 2009, 23, 3579–3582. [Google Scholar] [CrossRef]
  13. Gao, B.; Xu, L.; Tang, T.; Su, K.; Chi, Y.; Huang, L. Development of Low-Carbon Ultra-High Performance Concrete with Low Cement Content: Workability, Mechanical Properties, and Microstructure Characterization. J. Build. Eng. 2024, 94, 109907. [Google Scholar] [CrossRef]
  14. An, M.; Liu, Y.; Zhang, G.; Wang, Y. Properties of Cement-Based Materials with Low Water–Binder Ratios and Evaluation Mechanism under Further Hydration Effect. Appl. Sci. 2023, 13, 9946. [Google Scholar] [CrossRef]
  15. Mosquet, M. A New Generation of Admixtures. Constr. Technol. Archit. 2003, SP-2003, 21–23. [Google Scholar]
  16. Dodson, V.H. Concrete Admixtures; Van Nostrand Reinhold: New York, NY, USA, 1990. [Google Scholar]
  17. Grzeszczyk, S.; Sudoł, M. The Influence of Temperature on the Performance of Next-Generation Superplasticizers. Cem. Lime Concr. 2003, 6, 325–331. [Google Scholar]
  18. Xie, Z.; Tian, Y.; Li, Y.; Hu, J.; Jamaa, G.M.; Yuan, Q.; Zhu, X. Understanding the Temperature-Dependent Workability of Cement Paste with Polycarboxylate Superplasticizer. J. Build. Eng. 2023, 76, 107408. [Google Scholar] [CrossRef]
  19. John, E.; Gettu, R. Effect of Temperature on Flow Properties of Superplasticized Cement Paste. ACI Mater. J. 2014, 111, 67–76. [Google Scholar] [CrossRef]
  20. Łaźniewska-Piekarczyk, B. Effect of Superplasticizer Type and Antifoam Admixtures on Air-Content and Properties of Self-Compacting Concrete Mix. Cem. Lime Concr. 2009, 3, 133–145. [Google Scholar]
  21. Łaźniewska-Piekarczyk, B. The Influence of Admixtures Type on the Air-Void Parameters of Non-Air-Entrained and Air-Entrained High Performance SCC. Constr. Build. Mater. 2013, 41, 109–124. [Google Scholar] [CrossRef]
  22. Hanehara, S.; Yamada, K. Interaction Between Cement and Chemical Admixture from the Point of Cement Hydration, Absorption Behaviour of Admixture, and Paste Rheology. Cem. Concr. Res. 1999, 29, 1159–1165. [Google Scholar] [CrossRef]
  23. Newlon, H.; Mitchell, T.M. Freezing and Thawing. In Significance of Test and Properties of Concrete and Concrete-Making Materials; Klieger, P., Lamond, J.F., Eds.; ASTM International: West Conshohocken, PA, USA, 1994. [Google Scholar]
  24. Partschefeld, S.; Tutal, A.; Halmanseder, T.; Schneider, J.; Osburg, A. Investigations on Stability of Polycarboxylate Superplasticizers in Alkaline Activators for Geopolymer Binders. Materials 2023, 16, 5369. [Google Scholar] [CrossRef]
  25. PN-EN 480-1+A1:2012; Admixtures for Concrete, Mortar and Grout—Test Methods—Part 1: Reference Concrete and Test Mortar. PKN: Warsaw, Poland, 2012.
  26. ASTM C1384-12a; Standard Specification for Admixtures for Masonry Mortars. ASTM: West Conshohocken, PA, USA, 2012.
  27. PN-EN 197-1:2012; Cement—Part 1: Composition, Requirements and Conformity Criteria for Common Cements. PKN: Warsaw, Poland, 2012.
  28. PN-EN 196-6; Cement Test Methods—Determination of the Degree of Grinding. PKN: Warsaw, Poland, 2018.
  29. PN-EN 196-3; Cement Test Methods—Determination of Setting Time and Volume Constancy. PKN: Warsaw, Poland, 2016.
  30. PN-EN 1015-3:1999; Methods of Test for Mortar for Masonry. Determination of Consistency of Fresh Mortar (by Flow Table). PKN: Warsaw, Poland, 1999.
  31. PN-EN 1015-7:1999; Methods of Test for Mortar for Masonry. Determination of Air Content of Fresh Mortar. PKN: Warsaw, Poland, 1999.
  32. PN-EN 206:2013; Concrete—Specification, Performance, Production and Conformity. PKN: Warsaw, Poland, 2013.
  33. Szwabowski, J.; Łaźniewska-Piekarczyk, B. Increasing the Aeration of the SCC Mixture under the Influence of Carboxylate Superplasticizers. Cem. Lime Concr. 2008, 4, 205–215. [Google Scholar]
  34. Jolicoeur, C.; Simard, M.A. Chemical Admixture-Cement Interactions: Phenomenology and Physico-Chemical Concepts. Cem. Concr. Compos. 1998, 20, 87–101. [Google Scholar] [CrossRef]
  35. Kobayashi, M.; Nakakuro, E.; Kodama, K.; Negami, S. Frost Resistance of Superplasticized Concrete; ACI Special Publication; American Concrete Institute: Farmington Hills, MI, USA, 1981; Volume SP-68, pp. 223–234. [Google Scholar]
  36. Aïtcin, P.C. Admixtures: The Most Important Component of Modern Concrete. Cem. Lime Concr. 2006, 5, 45–55. [Google Scholar]
  37. Kucharska, L. Traditional and Modern Water Reducing Concrete Admixtures. Cem. Lime Concr. 2000, 2, 46–61. [Google Scholar]
  38. Ley, M.T.; Folliard, K.J.; Hover, K.C. The Physical and Chemical Characteristics of the Shell of Air-Entrained Bubbles in Cement Paste. Cem. Concr. Res. 2009, 39, 417–425. [Google Scholar] [CrossRef]
  39. Reknes, K.; Peterson, B.G. Self-Compacting Concrete with Lignosulphonate-Based Superplasticizer. In Proceedings of the 3rd International SCC Conference, Reykjavik, Iceland, 17–20 August 2003; pp. 184–189. [Google Scholar]
  40. Kucharska, L. Traditional and Contemporary Concrete Admixtures to Reduce the Amount of Mixing Water. Cem. Lime Concr. 2000, 2, 46–61. [Google Scholar]
  41. Schmidt, W. Design Concepts for the Robustness Improvement of Self-Compacting Concrete—Effects of Admixtures and Mixture Components on the Rheology and Early Hydration at Varying Temperatures. Ph.D. Thesis, Eindhoven University of Technology, Eindhoven, The Netherlands, 2014. [Google Scholar]
  42. Jun, S.D. Effect of Newly Developed Lignosulphonate Superplasticizer on Properties of Cement Pastes and Mortars. Ph.D. Thesis, National University of Singapore, Singapore, 2008. [Google Scholar]
  43. Reknes, K. The Performance of a New Lignosulphonate Plasticising Admixture and Its Sensitivity to Cement Composition. In Proceedings of the 29th Conference on Our World In Concrete and Structures, Singapore, 25–26 August 2004; pp. 441–447. [Google Scholar]
  44. Ghafori, N.; Diawara, H. Influence of Temperature on Fresh Performance of Self-Consolidating Concrete. Constr. Build. Mater. 2010, 24, 946–955. [Google Scholar] [CrossRef]
  45. Silva, W.R.L.; Prudêncio Jr., L.R.; Oliveira, A.L.; Damo, G.; Tochetto, E. Influence of Air Temperature on the Performance of Different Water-Reducing Admixtures with Respect to the Properties of Fresh and Hardened Mortar. Adv. Civ. Eng. 2010, 2010, 560405. [Google Scholar] [CrossRef]
  46. Plank, C.; Hirsch, C. Impact of Zeta Potential of Early Cement Hydration Phases on Superplasticizer Adsorption. Cem. Concr. Res. 2007, 37, 537–542. [Google Scholar] [CrossRef]
  47. Erdogdu, S. Compatibility of Superplasticizers with Cements Different in Composition. Cem. Concr. Res. 2000, 30, 767–773. [Google Scholar] [CrossRef]
  48. Yoshioka, K.; Tazawa, E.-I.; Kawai, K.; Enohata, T. Adsorption Characteristics of Superplasticizers on Cement Component Minerals. Cem. Concr. Res. 2002, 32, 1507–1513. [Google Scholar] [CrossRef]
  49. Pleau, R.; Pigeon, M.; Saucier, F.; Banthia, N. Air Voids in Concrete: A Study of the Influence of Superplasticizers by Means of Scanning Electron Microscopy and Optical Microscopy; ACI Special Publication; American Concrete Institute: Farmington Hills, MI, USA, 1990; Volume SP-122, pp. 215–238. [Google Scholar]
  50. MacInnis, C.; Racic, D. The Effect of Superplasticizers on the Entrained Air-Void System in Concrete. Cem. Concr. Res. 1986, 16, 345–352. [Google Scholar] [CrossRef]
  51. Gorzelańczyk, T.; Hoła, J. Pore Structure of Self-Compacting Concretes Made Using Different Superplasticizers. Arch. Civ. Mech. Eng. 2011, 11, 611–621. [Google Scholar] [CrossRef]
  52. Baalbaki, M.; Aitcin, P.C. Cement/Superplasticizer/Air-Entraining Agent Compatibility. ACI Special Publication; American Concrete Institute: Farmington Hills, MI, USA, 1994; Volume SP-148, pp. 47–62. [Google Scholar] [CrossRef]
  53. Zhang, D.S. Air Entrainment in Fresh Concrete with PFA. Cem. Concr. Compos. 1996, 18, 409–416. [Google Scholar] [CrossRef]
  54. Plante, P.K.; Pigeon, M.; Saucier, F. Air-Void Stability, Part II: Influence of Superplasticizers and Cement. ACI Mater. J. 1989, 86, 491–496. [Google Scholar] [CrossRef]
  55. Yang, Q.I. Stability of Air Bubbles in Fresh Concrete. Master’s Thesis, Chalmers University of Technology, Gothenburg, Sweden, 2012. [Google Scholar]
  56. Ozyildirim, C. Comparison of the Air Contents of Freshly Mixed and Hardened Concretes. Cem. Concr. Aggreg. 1991, 13, 11–17. [Google Scholar] [CrossRef]
  57. Zhang, S.; Wang, K. Effects of Materials and Mixing Procedures on Air Void Characteristics of Fresh Concrete. In Proceedings of the International Conference on Recent Advances in Concrete Technology, Washington, DC, USA, 19–21 September 2005. [Google Scholar]
  58. Chang, D.Y.; Chan, S.Y.N.; Zhao, R.P. The Combined Admixture of Calcium Lignosulphonate and Sulphonated Naphthalene Formaldehyde Condensates. Constr. Build. Mater. 1995, 8, 37–42. [Google Scholar] [CrossRef]
  59. Pigoń, K.; Róziewicz, Z. Chemia Fizyczna; Wydawnictwa Naukowe PWN: Warsaw, Poland, 1980. [Google Scholar]
  60. Atkins, P.W. Physical Chemistry, 15th ed.; W.H. Freeman and Company: New York, NY, USA, 1994. [Google Scholar]
  61. Sakai, E.; Kasuga, T.; Sugiyama, T.; Asaga, K.; Daimon, M. Influence of Superplasticizers on the Hydration of Cement and the Pore Structure of Hardened Cement. Cem. Concr. Res. 2006, 36, 2049–2053. [Google Scholar] [CrossRef]
  62. Saucier, F.; Pigeon, M.; Plante, P. Air-Void Stability, Part III: Field Tests of Superplasticized Concretes. ACI Mater. J. 1990, 87, 499–506. [Google Scholar] [CrossRef] [PubMed]
  63. Siebel, E. Air-Void Characteristics and Freezing and Thawing Resistance of Superplasticized Air-Entrained Concrete with High Workability. In Proceedings of the Third International Conference on Superplasticizers and Other Chemical Admixtures in Concrete, ACI SP-119, Ottawa, ON, Canada, 1 September 1989; Malhotra, V.M., Ed.; American Concrete Institute: Farmington Hills, MI, USA, 1989; pp. 297–319. [Google Scholar]
  64. Baekmark, K.; Hansen, H.; Reichart, J. Stabilized Air Void System in Superplasticized Concrete; ACI Special Publication; American Concrete Institute: Farmington Hills, MI, USA, 1994; Volume SP-144, pp. 177–190. [Google Scholar]
  65. Whiting, D.A.; Nagi, M.A.; Mohamad, A. Manual on Control of Air Content in Concrete; EB116; National Ready Mixed Concrete Association and Portland Cement Association: Skokie, IL, USA, 1998; 42p. [Google Scholar]
  66. Safiuddin, M.; Raman, S.N.; Jumaat, M.Z. Air-Void Stability in Fresh Self-Consolidating Concretes Incorporating Rice Husk Ash. In Advances in Engineering Structures, Mechanics & Construction; Springer: Dordrecht, The Netherlands, 2006; pp. 129–138. [Google Scholar]
  67. Hover, K. Air Bubbles in Fresh Concrete. Concr. Constr. Mag. 1993, 148–152. [Google Scholar]
  68. Khayat, K.H.; Nasser, K.W. Comparison of Air Contents in Fresh and Hardened Concretes Using Different Airmeters. Cem. Concr. Aggreg. 1991, 13, 16–17. [Google Scholar] [CrossRef]
  69. Liu, Z.; Hansen, W.; Meng, B. Characterisation of Air-Void Systems in Concrete. Mag. Concr. Res. 2015, 68, 186–197. [Google Scholar] [CrossRef]
  70. Reidenouer, D.R.; Howe, R.H. Air Content of Plastic and Hardened Concrete; Final Report PDT-73-1; National Technical Information Service: Springfield, VA, USA, 1975. [Google Scholar]
  71. Matsuzawa, K.; Shimazaki, D.; Kawakami, H.; Sakai, E. Effect of Non-Adsorbed Superplasticizer Molecules on Fluidity of Cement Paste at Low Water–Powder Ratio. Cem. Concr. Compos. 2019, 97, 218–225. [Google Scholar] [CrossRef]
Figure 1. The carbon footprint of concrete depends on the type of cement of the same strength class (assumed 300 kg of cement/m3 of concrete) [3].
Buildings 15 02987 g001
Figure 2. Cement CO2 emissions classification.
Buildings 15 02987 g002
Figure 3. Grain size of standard sand according to PN-EN 197-1.
Buildings 15 02987 g003
Figure 4. Comparison of the need for a plasticizer or superplasticizer depending on its type and the type of cement used.
Buildings 15 02987 g004
Figure 5. Comparison of mortar flow depending on the type of cement used and plasticizing or superplasticizing admixture.
Buildings 15 02987 g005
Figure 6. The air content in mortar depends on the admixture type and the cement type.
Buildings 15 02987 g006
Figure 7. Requirement for superplasticizer PCE-1 amount in mortar with varying temperatures, % by mass (c.m.).
Buildings 15 02987 g007
Figure 8. Effect of cement type on mortar flow with PCE-1 (without “air-entraining” effect).
Buildings 15 02987 g008
Figure 9. Comparison of the influence of temperature on the air content of mortar using various types of liquefying and plasticizing admixtures.
Buildings 15 02987 g009
Figure 10. Dehydration of polyether chains under the influence of temperature or salt (e.g., in the case of alkaline activated geopolymers materials) [17].
Buildings 15 02987 g010
Figure 11. The relationship between the mortar flow at 10, 20 and 33 °C and the resulting air content in its volume.
Buildings 15 02987 g011
Figure 12. Effect of cement type on-air content in PCP-1 mortar.
Buildings 15 02987 g012
Table 1. Cement composition.
Cement TypeCement Components, % by Weight
Portland Clinker
SS * = 3321
Silica Ash V,
SS = 3061
Blast Furnace Slag S, SS = 3800SO3 Content [% by Mass of Cement]
CEM I 42.595--5
CEM II/B-V 42.56333-5
CEM II/B-S 42.562-335
CEM III/A 42.543-525
CEM V/A (S-V) 32.54326265
CEM V/B (S-V) 32.51938385
* SS—specific surface cm2/g.
Table 2. The type and amounts of admixtures used in research; % mass of CEM I. Temperature of mortar = 21.0 ± 1 °C.
SymbolCEM ICEM B-VCEM II/B-SCEM III/ACEM V/A (S-V)CEM V/B (S-V)
PCE-10.220.450.460.450.340.42
PCE-20.220.460.450.330.330.51
PCE-30.220.440.450.440.360.44
PCE-40.220.460.320.330.330.33
PCP-10.220.490.460.430.330.45
PCP-20.110.320.460.450.340.46
MN0.220.440.490.490.310.71
PC0.250.560.930.890.910.99
CLAP0.230.560.90.900.801.00
AAP0.440.961.561.571.481.56
SNF-10.440.921.561.571.521.56
SNF-20.451.411.461.411.41.57
SMF0.441.411.461.451.341.52
MLG-10.441.431.451.441.341.53
MLG-20.220.450.460.450.340.42
Table 3. Properties of admixtures.
Technical DataPCE-1PCE-2PCE-3PCE-4PCP-2
Chemical basepolycarboxylate etherpolycarboxylate etherpolycarboxylate etherpolycarboxylate ethermodified polycarboxylates
Formliquidliquidliquidliquidliquid
Colourbrownyellowyellowbrowngreen
Density (at 20 °C), kg/dm31.06 ± 0.021.07 ± 0.021.09 ± 0.021.08 ± 0.021.06 ± 0.02
pH (at 20 °C):6.0 ± 1.06.5 ± 1.55.5 ± 1.04.5 ± 1.07.5 ± 1.0
Chloride content Cl acc. EN 480-10, % of mass≤0.1≤0.1≤0.1≤0.1≤0.1
Alkali Content Na2O acc. EN 480-12, % of mass≤0.6≤1.7≤0.5≤0.8≤1.5
Type of admixture according. ASTM C494F and EGF and EGG
Type of admixture according. PN-EN 934-2SPSPSPSPSP
Conventional dry material content EN 480-8, %37.0 ± 1.538.0 ± 1.239.0 ± 1.936.0 ± 1.736.0 ± 1.6
Table 4. Properties of admixtures.
Technical DataPCP-1PCCLAPAAPMN
Chemical basemodified polycarboxylatesmodified polycarboxylatescross-linked polymers, acrylicmodified amino phosphonatesmodified naphthalene
Formliquidliquidliquidliquidpowder
Colouramber amberwhite to yellowBrown
Density (at 20 °C/68 °F), kg/dm31.04 ± 0.021.101.07 ± 0.021.06 ± 0.010.60
pH (at 20 °C):6.5 ± 16.06.0 ± 1.04.0 ± 0.55.0
Chloride content Cl acc. EN 480-10, % of mass≤0.1≤0.1≤0.1≤0.1≤0.1
Alkali Content Na2O acc. EN 480-12, % of mass≤1.0≤3.0≤3.0≤3.0≤3.0
Type of admixture according. ASTM C494GType A and FF and EGF
Type of admixture according. PN-EN 934-2SPP and SPSPSPSP
Conventional dry material content EN 480-8, %37.0 ± 1.533.0 ± 1.635.0 ± 1.731.0 ± 1.5100.0
Table 5. Properties of admixtures.
Technical DataSNF-1SNF-2SMFMGL-1MGL-2
Chemical basesulfonated naphthalene-formaldehyde resinssulfonated naphthalene-formaldehyde resinssulfonated melamine formaldehydemodified lignosulfonatesmodified lignosulfonates/carbohydrates of natural origin
FormLiquidLiquidLiquidLiquidLiquid
ColourbrownbrowncolourlessbrownDark brown
Density (at 20 °C), kg/dm31.17 ± 0.031.191.13 ± 0.031.13 ± 0.031.17 ± 0.02 kg/dm3
pH (at 20 °C/68 °F):6.56.07.010.0 ± 1.04.5 ± 1.0
Chloride content Cl acc. EN 480-10, % of mass≤0.1≤0.1≤0.1≤0.1≤0.1
Alkali Content Na2O acc. EN 480-12, % of mass≤4.5≤4.5≤5.0≤6.5≤0.8
Type of admixture according. ASTM C494D and FA, and FA and FAA
Type of admixture according. PN-EN 934-2P and SPP and SPP and SPPP
Conventional dry material content EN 480-8, %34.5 ± 1.730.0 ± 1.528.0 ± 1.627.0 ± 1.436.0 ± 1.8
Table 6. Dosage of PCE-1 in the case of different types of cement.
Temperature, °CSP, % Cement Mass (c.m)
CEM I12.0 ± 20.334
21.0 ± 10.700
29.0 ± 20.900
CEM II/B-V12.0 ± 20.222
21.0 ± 10.444
29.0 ± 20.738
CEM II/B-S12.0 ± 20.111
21.0 ± 10.444
29.0 ± 20.556
CEM III/A12.0 ± 20.111
21.0 ± 10.444
29.0 ± 20.556
CEM V/A (S-V)12.0 ± 20.111
21.0 ± 10.444
29.0 ± 20.556
CEM V/B (S-V)12.0 ± 2 °C0.111
21.0 ± 1 °C0.444
29.0 ± 2 °C0.556
Table 7. Amount of superplasticizer and plasticizer (% c.m.) used in mortars with CEM I at 10, 20 and 33 °C.
Admixture TypeAmount of Admixture, % c.m.
Reference-
PCE0.22
PCP0.22
N0.11
A0.22
F0.22
SNF0.44
SMF0.44
LG0.44
Table 8. Summary of the results of the specific surface area and water requirements of cement.
Cement TypeSpecific Surface Area of Cement, According to Blein, cm2/gWater Demand, %
CEM I380027.1
CEM II/B-V354027.2
CEM II/B-S403026.1
CEM III/A400026.5
CEM V/A (S-V)381026.5
CEM V/B (S-V)372027.0
Table 9. The diameter of mortar flow (cm) at a temperature of 21 °C, depending on the type of cement and the admixture used.
SymbolCEM ICEM/II B-VCEM II/B-SCEM III/ACEM V/A (S-V)CEM V/B (S-V)
-16.0017.0017.1017.7016.7518.30
PCE-122.1524.2524.0526.626.226.45
PCE-221.0026.5525.1526.4524.3526.05
PCE-319.9026.6025.8026.3521.4027.50
PCE-419.9023.5023.6023.1022.1024.65
PCP-118.9526.2023.7022.0521.0025.35
PCP-219.8521.9024.8025.3022.2527.10
MN18.1523.2022.2521.6519.4023.05
PC20.2023.9517.1018.0021.1022.60
CLAP21.8523.3521.2522.822.1022.75
AAP18.8519.7520.4520.2519.6020.25
SNF-118.5523.3019.9520.8019.8521.30
SNF-218.0021.5020.3520.5019.3021.40
SMF18.3518.919.0518.6016.7518.30
MLG-119.4021.4518.1518.4518.218.45
MLG-219.0520.7020.8017.3517.3516.05
Table 10. Air content (%) in the volume of mortar at a temperature of 21 °C, depending on the type of cement and the admixture used.
SymbolCEM ICEM/II B-VCEM II/B-SCEM III/ACEM V/A (S-V)CEM V/B (S-V)
Reference3.92.43.93.83.41.9
PCE-13.23.52.62.52.41.4
PCE-24.73.82.52.04.43.5
PCE-34.54.34.24.64.23.4
PCE-45.64.85.24.64.53.6
PCP-15.74.94.94.73.23.0
PCP-24.93.43.53.34.03.0
MN5.64.33.94.52.62.4
PC4.24.54.54.13.32.7
CLAP5.44.74.54.52.52.9
AAP5.04.04.84.02.53.0
SNF-15.43.54.43.83.33.0
SNF-25.02.94.84.54.73.0
SMF5.63.43.93.84.23.1
MLG-14.74.54.63.74.24.0
MLG-23.94.24.53.84.44.0
Table 11. The research results of air content in mortar volume (%) independence on cement type and temperature.
Cement TypeTemperature, °CSP, % c.m.Flow Diameter, cmAir-Content, %
CEM I12.0 ± 20.33419.45.2
21.0 ± 10.70016.04.4
29.0 ± 20.90013.23.7
CEM II/B-V12.0 ± 20.22218.73.6
21.0 ± 10.44416.63.0
29.0 ± 20.73814.42.2
CEM II/B-S12.0 ± 20.11119.25.2
21.0 ± 10.44417.04.7
29.0 ± 20.55614.73.9
CEM III/A12.0 ± 20.11118.44.1
21.0 ± 10.44417.43.5
29.0 ± 20.55614.53.5
CEM V/A (S-V)12.0 ± 20.11118.43.3
21.0 ± 10.44418.43.2
29.0 ± 20.55614.92.6
CEM V/B (S-V)12.0 ± 20.11118.42.7
21.0 ± 10.44418.31.9
29.0 ± 20.55616.42.0
Table 12. Amount of superplasticizer and plasticizer (% w.c.) used in CEM I mortars.
Admixture TypeQuantity, % c.m.Temperature 10 °CTemperature 20 °CTemperature 33 °C
Flow Diameter, cmAir-Content, % vol.Flow Diameter, cmAir-Content, % of vol.Flow Diameter, cmAir-Content, % of vol.
PCE0.2220.94.820.504.918.94.5
PCP0.2221.955.020.505.618.45.8
MN0.1122.704.521.004.917.44.9
CLAP0.2224.204.023.854.217.34.8
AAP0.2221.004.518.855.416.05.0
SNF0.4423.204.618.005.418.45.2
SMF0.4420.004.718.355.018.05.1
MLG0.4420.204.918.405.418.34.9
Table 13. Comparison of the results of the specific surface area, water requirements and average demand for plasticizers for the type of cement.
Cement TypeSpecific Surface Area, According to Blein, cm2/gWater Demand, %Average (According to Table 9) Demand for Plasticizers, % of Cement Weight
CEM I380027.10.442
CEM II/B-V354027.21.226
CEM II/B-S403026.11.498
CEM III/A400026.51.488
CEM V/A (S-V)381026.54.000
CEM V/B (S-V)372027.03.408
Table 14. Comparison of the results of the specific surface area, water requirements and average demand for superplasticizers for the type of cement.
Cement TypeSpecific Surface Area, According to Blein, cm2/gWater Demand, %Average (According to Table 9) Demand for Plasticizers, % m.c.
CEM I380027.10.213
CEM II/B-V354027.20.462
CEM II/B-S403026.10.444
CEM III/A400026.50.406
CEM V/A (S-V)381026.50.439
CEM V/B (S-V)372027.00.590
Disclaimer/Publisher’s Note: The statements, opinions and data contained in all publications are solely those of the individual author(s) and contributor(s) and not of MDPI and/or the editor(s). MDPI and/or the editor(s) disclaim responsibility for any injury to people or property resulting from any ideas, methods, instructions or products referred to in the content.