Article

Cost Calculation Model for Engineering Structures Based on a Life Cycle Perspective

1
Institute of Structural Engineering, Zhejiang University, Hangzhou 310058, China
2
Zhejiang Institute of Communications Co., Ltd., Hangzhou 310030, China
3
Shanghai Construction No. 2 (Group) Co., Ltd., Shanghai 200080, China
*
Author to whom correspondence should be addressed.
Buildings 2025, 15(16), 2923; https://doi.org/10.3390/buildings15162923
Submission received: 4 July 2025 / Revised: 5 August 2025 / Accepted: 12 August 2025 / Published: 18 August 2025
(This article belongs to the Section Construction Management, and Computers & Digitization)

Abstract

A comprehensive life cycle cost (LCC) calculation model for engineering structures is proposed, in which economic, environmental, and social cost components are systematically integrated within a unified framework. Unlike traditional LCC approaches that primarily emphasize direct economic expenditures, the model is designed to incorporate pollutant emissions and social externalities, thereby enabling a more holistic evaluation of sustainability over the entire lifespan of the structure. The effectiveness of the model has been demonstrated through application to case studies, where long-term cost implications were captured and sustainable design and maintenance decisions were supported. This integrated framework represents an advancement over existing LCC methodologies by providing a more comprehensive and practical tool for the evaluation of engineering structures.

1. Introduction

After construction, engineering structures are expected to serve for several decades or even over a century, during which they are subjected to numerous unpredictable challenges, such as environmental corrosion, insufficient maintenance, improper human usage, and sudden geological damage [1]. These issues are often overlooked in conventional design approaches, resulting in long-term deterioration of structural performance. When decisions focus solely on minimizing initial construction costs, low-standard structural solutions may be selected, leading to substantially increased maintenance expenses during the operational phase. The life cycle of engineering structures typically encompasses design and construction, operation, inspection and maintenance, repair and reinforcement, as well as demolition and recycling. The life cycle cost (LCC) management approach is, therefore, advocated to comprehensively account for the degradation patterns, maintenance strategies, and associated costs across different stages, enabling scientifically informed decisions to ensure long-term performance with reasonable economic input [2]. Such a systematic management method is recommended to be adopted by stakeholders to control upfront investment while effectively reducing subsequent maintenance costs, ultimately enhancing the overall project economy.
Life cycle cost is one of the most intuitive indicators for evaluating the life cycle performance of structures, and the minimization of LCC is commonly adopted as a key criterion in life cycle design schemes. Considerable progress has been made in the development of life cycle cost calculation models, providing systematic approaches for life cycle assessment (LCA) [3,4,5,6]. Mithraratne [7] proposed a life cycle analysis method for individual buildings in New Zealand based on operational energy demands and life cycle costs over a building’s service life. Verbeeck [8] conducted a comparative life cycle inventory study of four typical Belgian residential buildings, demonstrating that the energy consumption during the usage phase far exceeds the embodied energy in construction, thus validating the overall energy-saving benefits of low-energy buildings. Dong [9,10] developed a bridge deterioration assessment framework incorporating multiple hazard factors, establishing a multidimensional sustainability evaluation system by quantifying environmental indicators, such as energy consumption and carbon emissions alongside social impact parameters including downtime and casualties. García-Segura [11] proposed an optimization method for bridge design that simultaneously considers structural reliability and sustainability, with particular attention to vehicle operating costs, traffic delay costs, and additional carbon emissions caused by detours in the sustainability assessment. Jebelli [12] introduced a bi-objective heuristic optimization framework based on life cycle design aimed at balancing initial construction costs and long-term maintenance costs of steel structures. Ping [13] focused on environmental costs by developing a life cycle cost assessment framework integrating seismic losses and environmental impacts, quantifying economic and carbon emission effects across different steel frame structures through case studies. However, existing studies generally evaluate economic, environmental, and social impacts as separate indicators, resulting in limitations in the comprehensiveness of these models.
To overcome these limitations, some researchers have attempted to integrate multiple factors for a multidimensional evaluation. For instance, Kendall [14] developed a combined LCA-LCC model that systematically quantifies three types of costs, namely institutional costs (including materials, equipment, and labor), social costs (covering traffic delays, vehicle wear, and accident risks), and environmental costs (accounting for six air pollutants and three greenhouse gases causing environmental damage). Al-Kabaha [15] employed a multi-objective optimization approach, integrating EnergyPlus, jEPlus + EA, and NSGA-II software, to optimize the LCC of residential buildings, achieving significant reductions in energy consumption and costs. Dervishaj [16] compared the functionalities and limitations of CAD, BIM, and computational design plugins, highlighting the potential and future development directions of BIM-LCA integration for sustainable design. Boje [17,18] proposed a novel framework incorporating digital twins and building information modeling (BIM), targeting environmental, social, and economic sustainability, and conducted real-world case studies. Alsaffar [19] systematically reviewed applications of digital twin technology in construction and asset management, exploring its potential to advance building intelligence and the Fourth Industrial Revolution. However, current research still exhibits several deficiencies. First, the scope of evaluation systems is limited. For example, environmental cost analyses mainly focus on air pollution, neglecting water pollution and solid waste impacts; social cost accounting often omits negative regional economic effects, such as disruption of commercial activities and fiscal revenue losses. Second, quantification methods lack consistency. Environmental costs use markedly different valuation standards for prevention and damage, while a systematic monetization model for social costs is yet to be established. These limitations compromise the comprehensiveness and comparability of assessment results.
Therefore, to address these issues, this study integrates key elements of economic input, environmental impact, and social benefits over the entire life cycle of structures to construct a comprehensive LCC assessment framework and explores its engineering applications. Regarding environmental costs, a quantitative model based on pollutant emissions is developed, focusing on the pollution impacts of concrete structures on air, water, and soil media, while incorporating additional emissions caused by traffic congestion during construction. Environmental damage and mitigation cost rates for different pollutants are established, and a comparative analysis of environmental costs between two design schemes is conducted based on a real bridge project. In social cost assessment, a stakeholder analysis approach is employed to systematically quantify multiple factors across direct economic losses and indirect social impacts, including personal safety risks, psychological effects, time costs, and property value losses. A systematic measurement model is developed to provide methodological support for social benefit assessments in similar projects.

2. Life Cycle Economic Costs of Engineering Structures

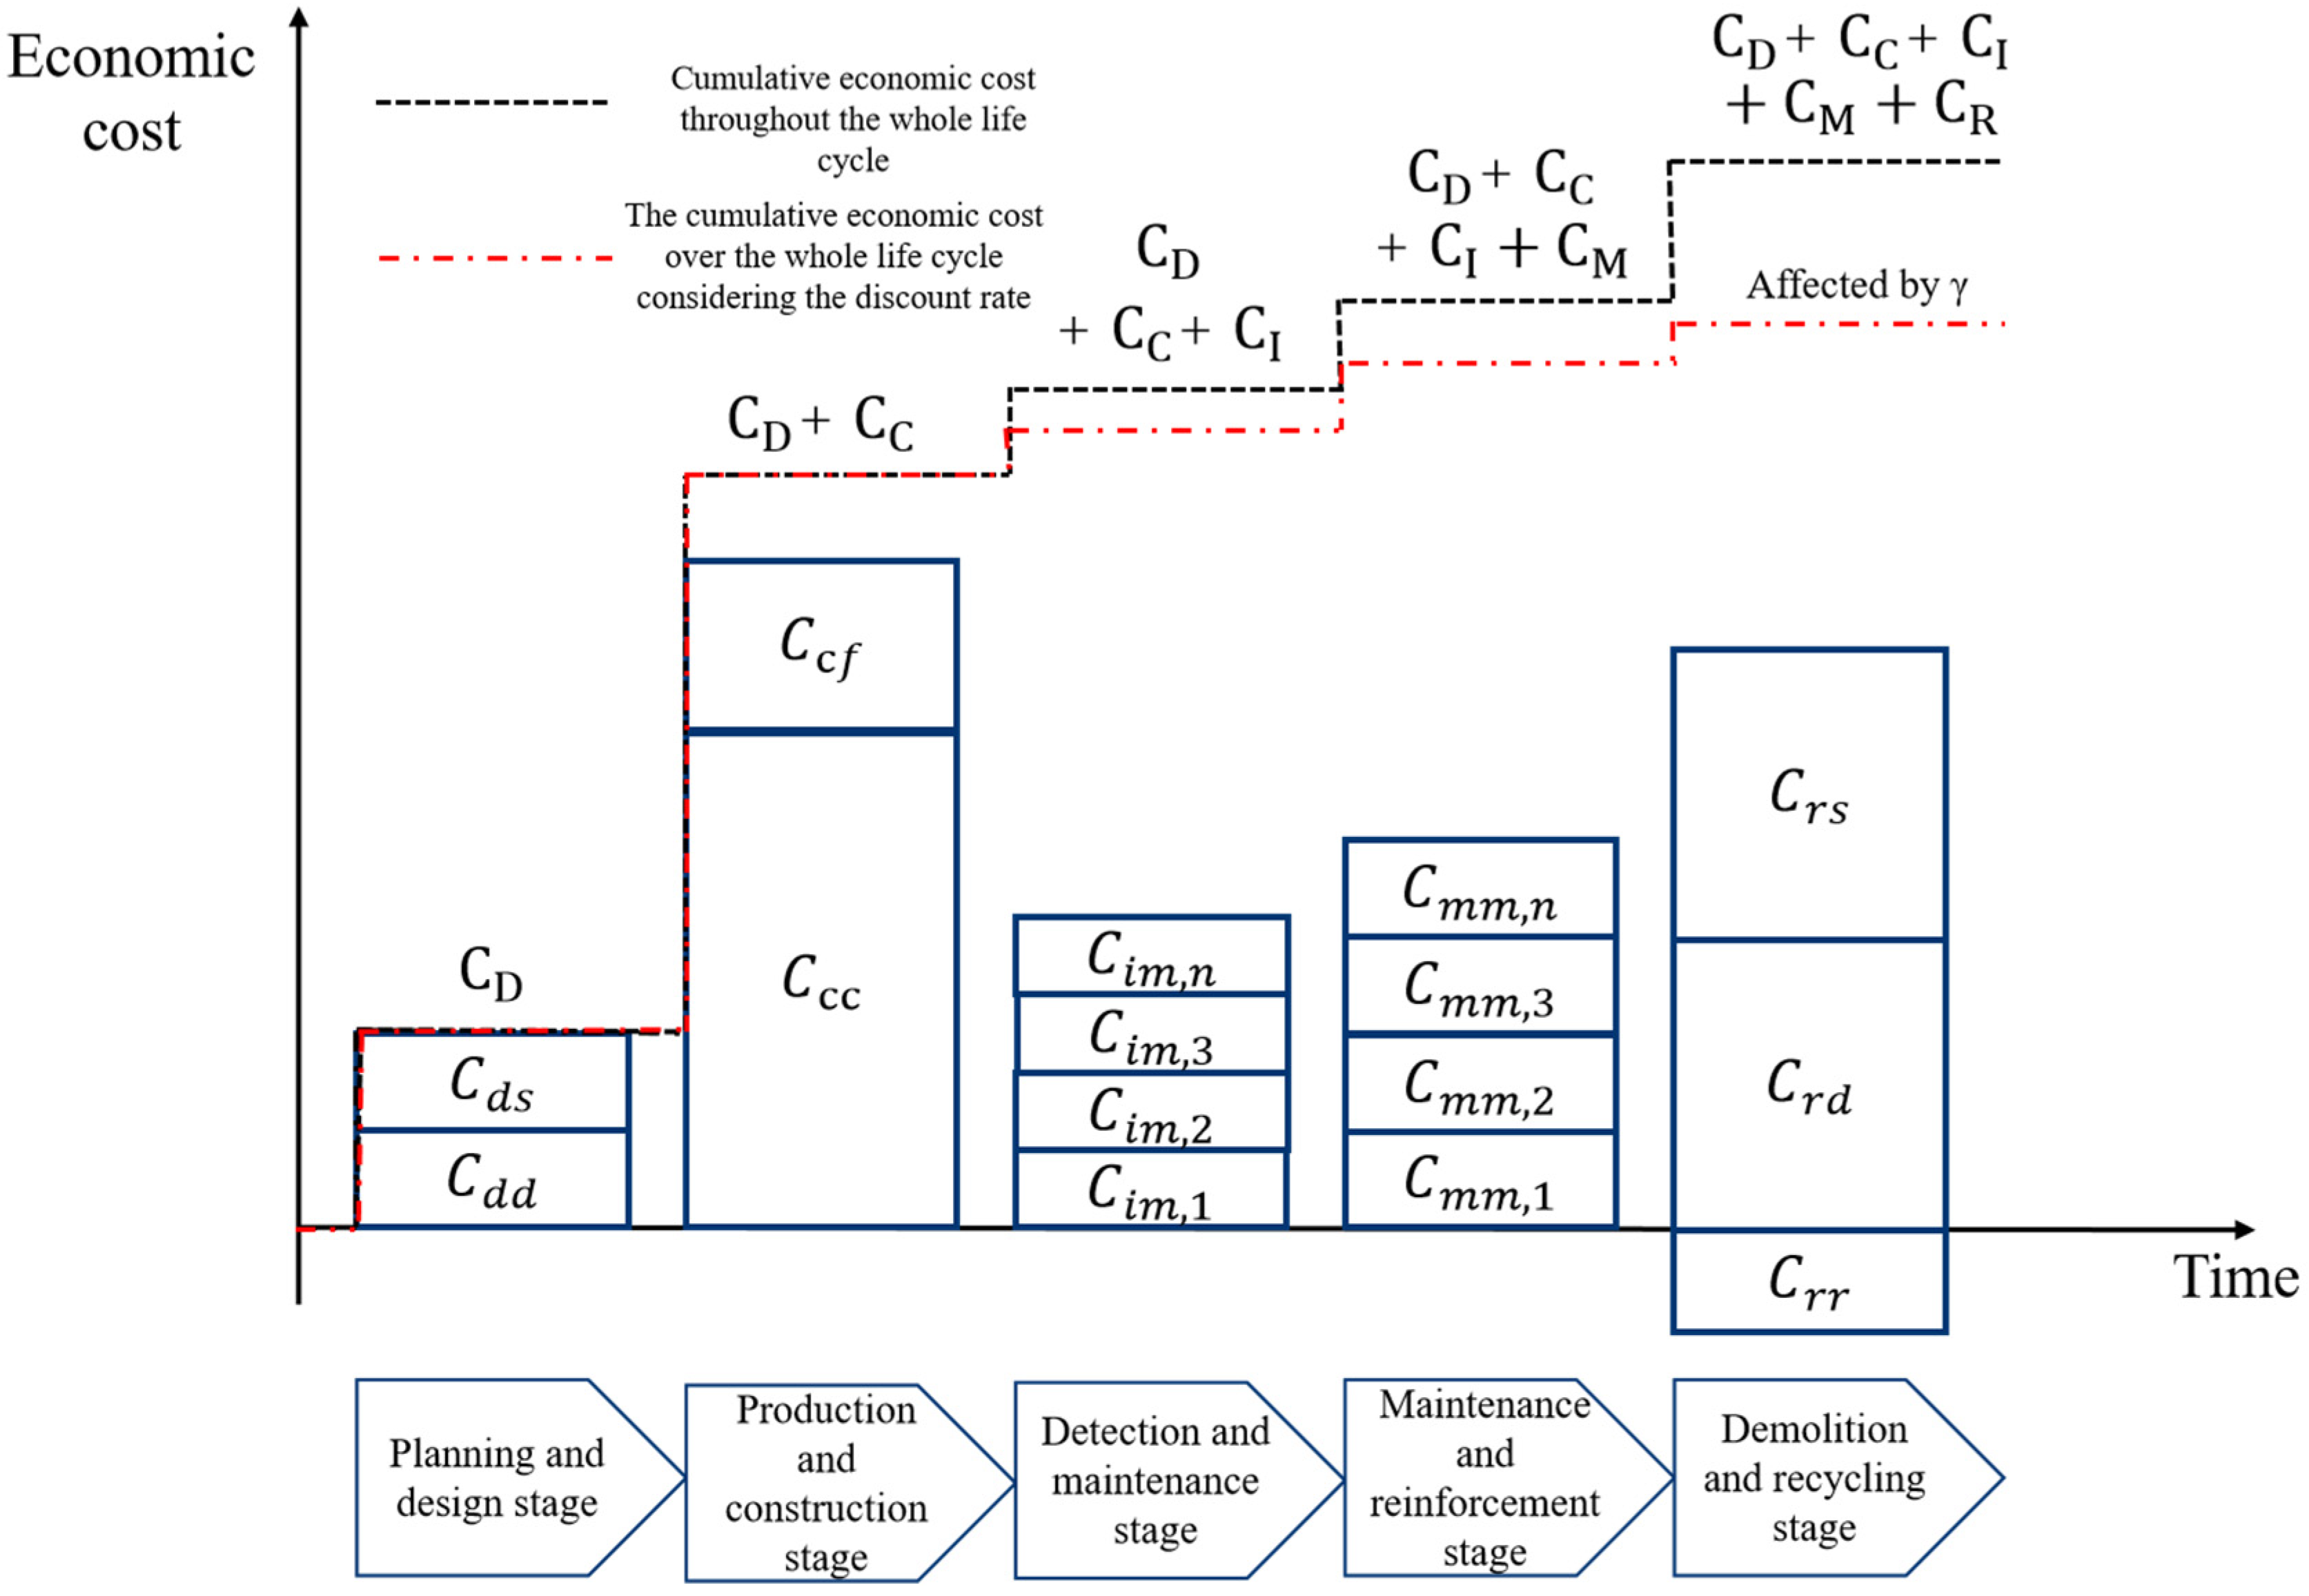
The economic costs of engineering structures are comprised of all monetizable capital expenditures incurred throughout the entire life cycle, including initial construction investments, maintenance expenses during the operational phase, and decommissioning or renovation costs at the end-of-life stage, as illustrated in Figure 1. These direct financial outlays form the foundation of a comprehensive life cycle financial evaluation.
To ensure accurate accounting, economic costs are categorized based on the distinct characteristics of each life cycle phase. Given that engineering structures typically remain in service for several decades from construction to demolition, the time value of money is considered a critical factor. Consequently, appropriate discount rates are applied during the operational and decommissioning stages to accurately reflect long-term cost-effectiveness. Through this dynamic evaluation approach, capital value fluctuations over time are more realistically represented.

2.1. Discount Rate

The discount rate is regarded as a pivotal economic parameter that reflects the time value of money. Influences, such as economic growth, inflation, and various uncertainties, including natural disasters, armed conflicts, and public health emergencies, cause variations in the real value of a fixed monetary amount across different time periods. Therefore, the discount rate is incorporated as a fundamental variable when assessing the life cycle economic cost of concrete construction projects. This incorporation enables the conversion of all cash flows—from construction and operation to decommissioning and recycling—into a common temporal reference point, thereby ensuring comparability and accuracy in long-term economic evaluations.
Both the expected return on capital and the underlying supply–demand dynamics in financial markets are captured by the discount rate. Its magnitude is strongly influenced by a country’s stage of economic development, prevailing interest-rate environment, and macroeconomic policies. Fiscal, monetary, and industrial policies are utilized by governments to regulate liquidity and maintain the discount rate within a reasonable and stable range. As a result, the discount rate serves as a core metric in national economic appraisals and project-level investment decisions.
In practice, reference discount rates are proposed by public authorities based on opportunity-cost capital, social time preference, and anticipated investment returns. For example, the Institute of Standards and Quotas of the Ministry of Housing and Urban–Rural Development in China issues the Economic Evaluation Methods and Parameters for Construction Projects, which prescribes calculation frameworks, such as the capital-output and social time-preference approaches. Based on theoretical models and Delphi expert surveys, a social discount rate ( γ s ) of 7–8% is recommended for the construction sector, reflecting domestic capital scarcity and the pursuit of high-quality growth.
Internationally, social discount rates are aligned with each nation’s economic maturity, long-term development strategy, and demographic profile. Advanced economies, such as the United States and Germany, typically adopt rates around 3%, while Japan, affected by prolonged deflationary pressure, sets a rate near 4%. The European Union applies a median rate of approximately 5% to accommodate differences among member states. In China, the selection of an appropriate discount rate requires balancing evolving capital return characteristics under the “dual-circulation” development paradigm with the need for international comparability. The establishment of a dynamic adjustment mechanism is recommended to ensure that evaluation results remain consistent with domestic realities while aligning with global investment appraisal standards.
As the economy evolves, fluctuations in the time value of money are observed, and increases in the costs of labor, materials, and equipment associated with construction projects are typically experienced. Following project completion, prices of various resources utilized throughout the life cycle are not considered fixed but are generally subject to incremental rises over time. To more accurately capture the effects of inflation and risk factors on pricing, it is necessary to incorporate the growth rate of the Producer Price Index ( f p ) as an economic parameter alongside the social discount rate when determining the appropriate discount rate for construction projects. As a key indicator for tracking price fluctuations, formulating economic policy, and conducting national economic accounting, the PPI complements the social discount rate in evaluating long-term project costs. According to economic theory, the final discount rate applicable to construction projects can be derived by integrating these two parameters, as follows:
γ = γ s f p 1 + f p
where   γ is the adjusted discount rate, accounting for project-specific factors; γ s is the base social discount rate; f p is the growth rate of the Producer Price Index (PPI), reflecting inflation and price changes over time.
For engineering structures, performance degradation and increased failure probability are observed over time. Therefore, the discount rate applied in life cycle cost assessments should be adjusted to reflect this upward trend in risk. Following comprehensive evaluation, it is recommended that the discount rate for engineering structures be set within the range of 2% to 3% to appropriately account for long-term risk variations.

2.2. Life Cycle Economic Cost Calculation Model

2.2.1. Calculation Model in Planning and Design Stage

During the planning and design phase, economic costs primarily comprise surveying fees, design expenses, and related costs, such as drawing reviews and bidding agency fees. These costs are closely tied to the construction entity and can be expressed as follows:
C D = t = 1 m C d s + C d d 1 + γ t 1
where C D is the planning and designing economic cost; C d s is the engineering investigation cost during year t ; C d d is the engineering design cost during year t ; m is the continuous year of planning and design stage.   γ is the discount rate for construction projects.

2.2.2. Production and Construction Stage Calculation Model

In the production and construction phase, economic costs consist mainly of construction and installation expenditures, along with supporting fees, such as supervision, consultation, and auditing. Construction and installation costs are further subdivided into labor, material, and machinery usage expenses. These costs can be calculated as:
C C = t = 1 a C c c + C c f 1 + γ t 1
where C C is the economic cost of production and construction; C c c is the engineering construction and installation cost during year t ; C c f is the ancillary cost of engineering construction and installation during year t .   a is the continuous year of production and construction stage.   γ is the discount rate for construction projects.

2.2.3. Inspection, Maintenance, and Reinforcement Phase Cost Models

The economic costs incurred during the inspection and maintenance phase, as well as those arising from the maintenance and reinforcement phase, are determined by the adopted strategies, the timing of interventions, and the frequency of the associated activities. Given that inspection and maintenance tasks differ in nature and timing from reinforcement works, their costs are modeled separately to accurately capture their individual contributions.
The total discounted cost of inspection and maintenance is calculated as follows:
C I = j = 1 n C i m , j × 1 1 + γ j
where C I represents the inspection and maintenance economic costs; C i m , j is the one-time cost of the inspection and maintenance work in the Jth year after the structure is completed; γ is the discount rate for construction projects; n is the total number of years from the completion of the structure to its demolition.
Similarly, the economic cost of maintenance and reinforcement is expressed as follows:
C M = j = 1 n C m m , j × 1 1 + γ j
where C M is the economic cost of maintenance and reinforcement; C m m , j is the cost of the first maintenance and reinforcement work in the Jth year after the structure is completed; γ is the discount rate for construction projects; n is the total number of years from the completion of the structure to its demolition.

2.2.4. Disposal and Recycling Phase Cost Model

At the end of the service life, dismantling and environmentally responsible disposal of the structure are required. Recoverable materials and components are recycled, and when recycling revenues exceed dismantling and treatment costs, the residual value offsets total life cycle economic costs. The net discounted cost of disposal and recycling is calculated as follows:
C R = ( C r d + C r s C r r ) × 1 1 + γ n
where C R is the dismantling and recycling costs; C r d is the construction cost of the project demolition; C r s is the cost of harmless treatment of demolition materials; C r r is the revenue from the recycling of engineering materials. γ is the discount rate for construction projects; n is the total number of years from the completion of the structure to its demolition.
Based on the above analysis, the calculation model of economic cost throughout the entire life cycle of the engineering structure can be obtained:
C L C = C D + C C + C I + C M + C R = t = 1 m C d s + C d d 1 + γ t 1 + t = 1 a C c c + C c f 1 + γ t 1 + j = 1 n C i m , j × 1 1 + γ j + j = 1 n C m m , j × 1 1 + γ j + ( C r d + C r s C r r ) × 1 1 + γ n
where C L C is the total life cycle economic cost of the engineering structure.
To sum up, the composition of the economic cost of the engineering structure over its entire life cycle can be summarized as shown in Figure 2.

2.3. Sensitivity Analysis of Discount Rate

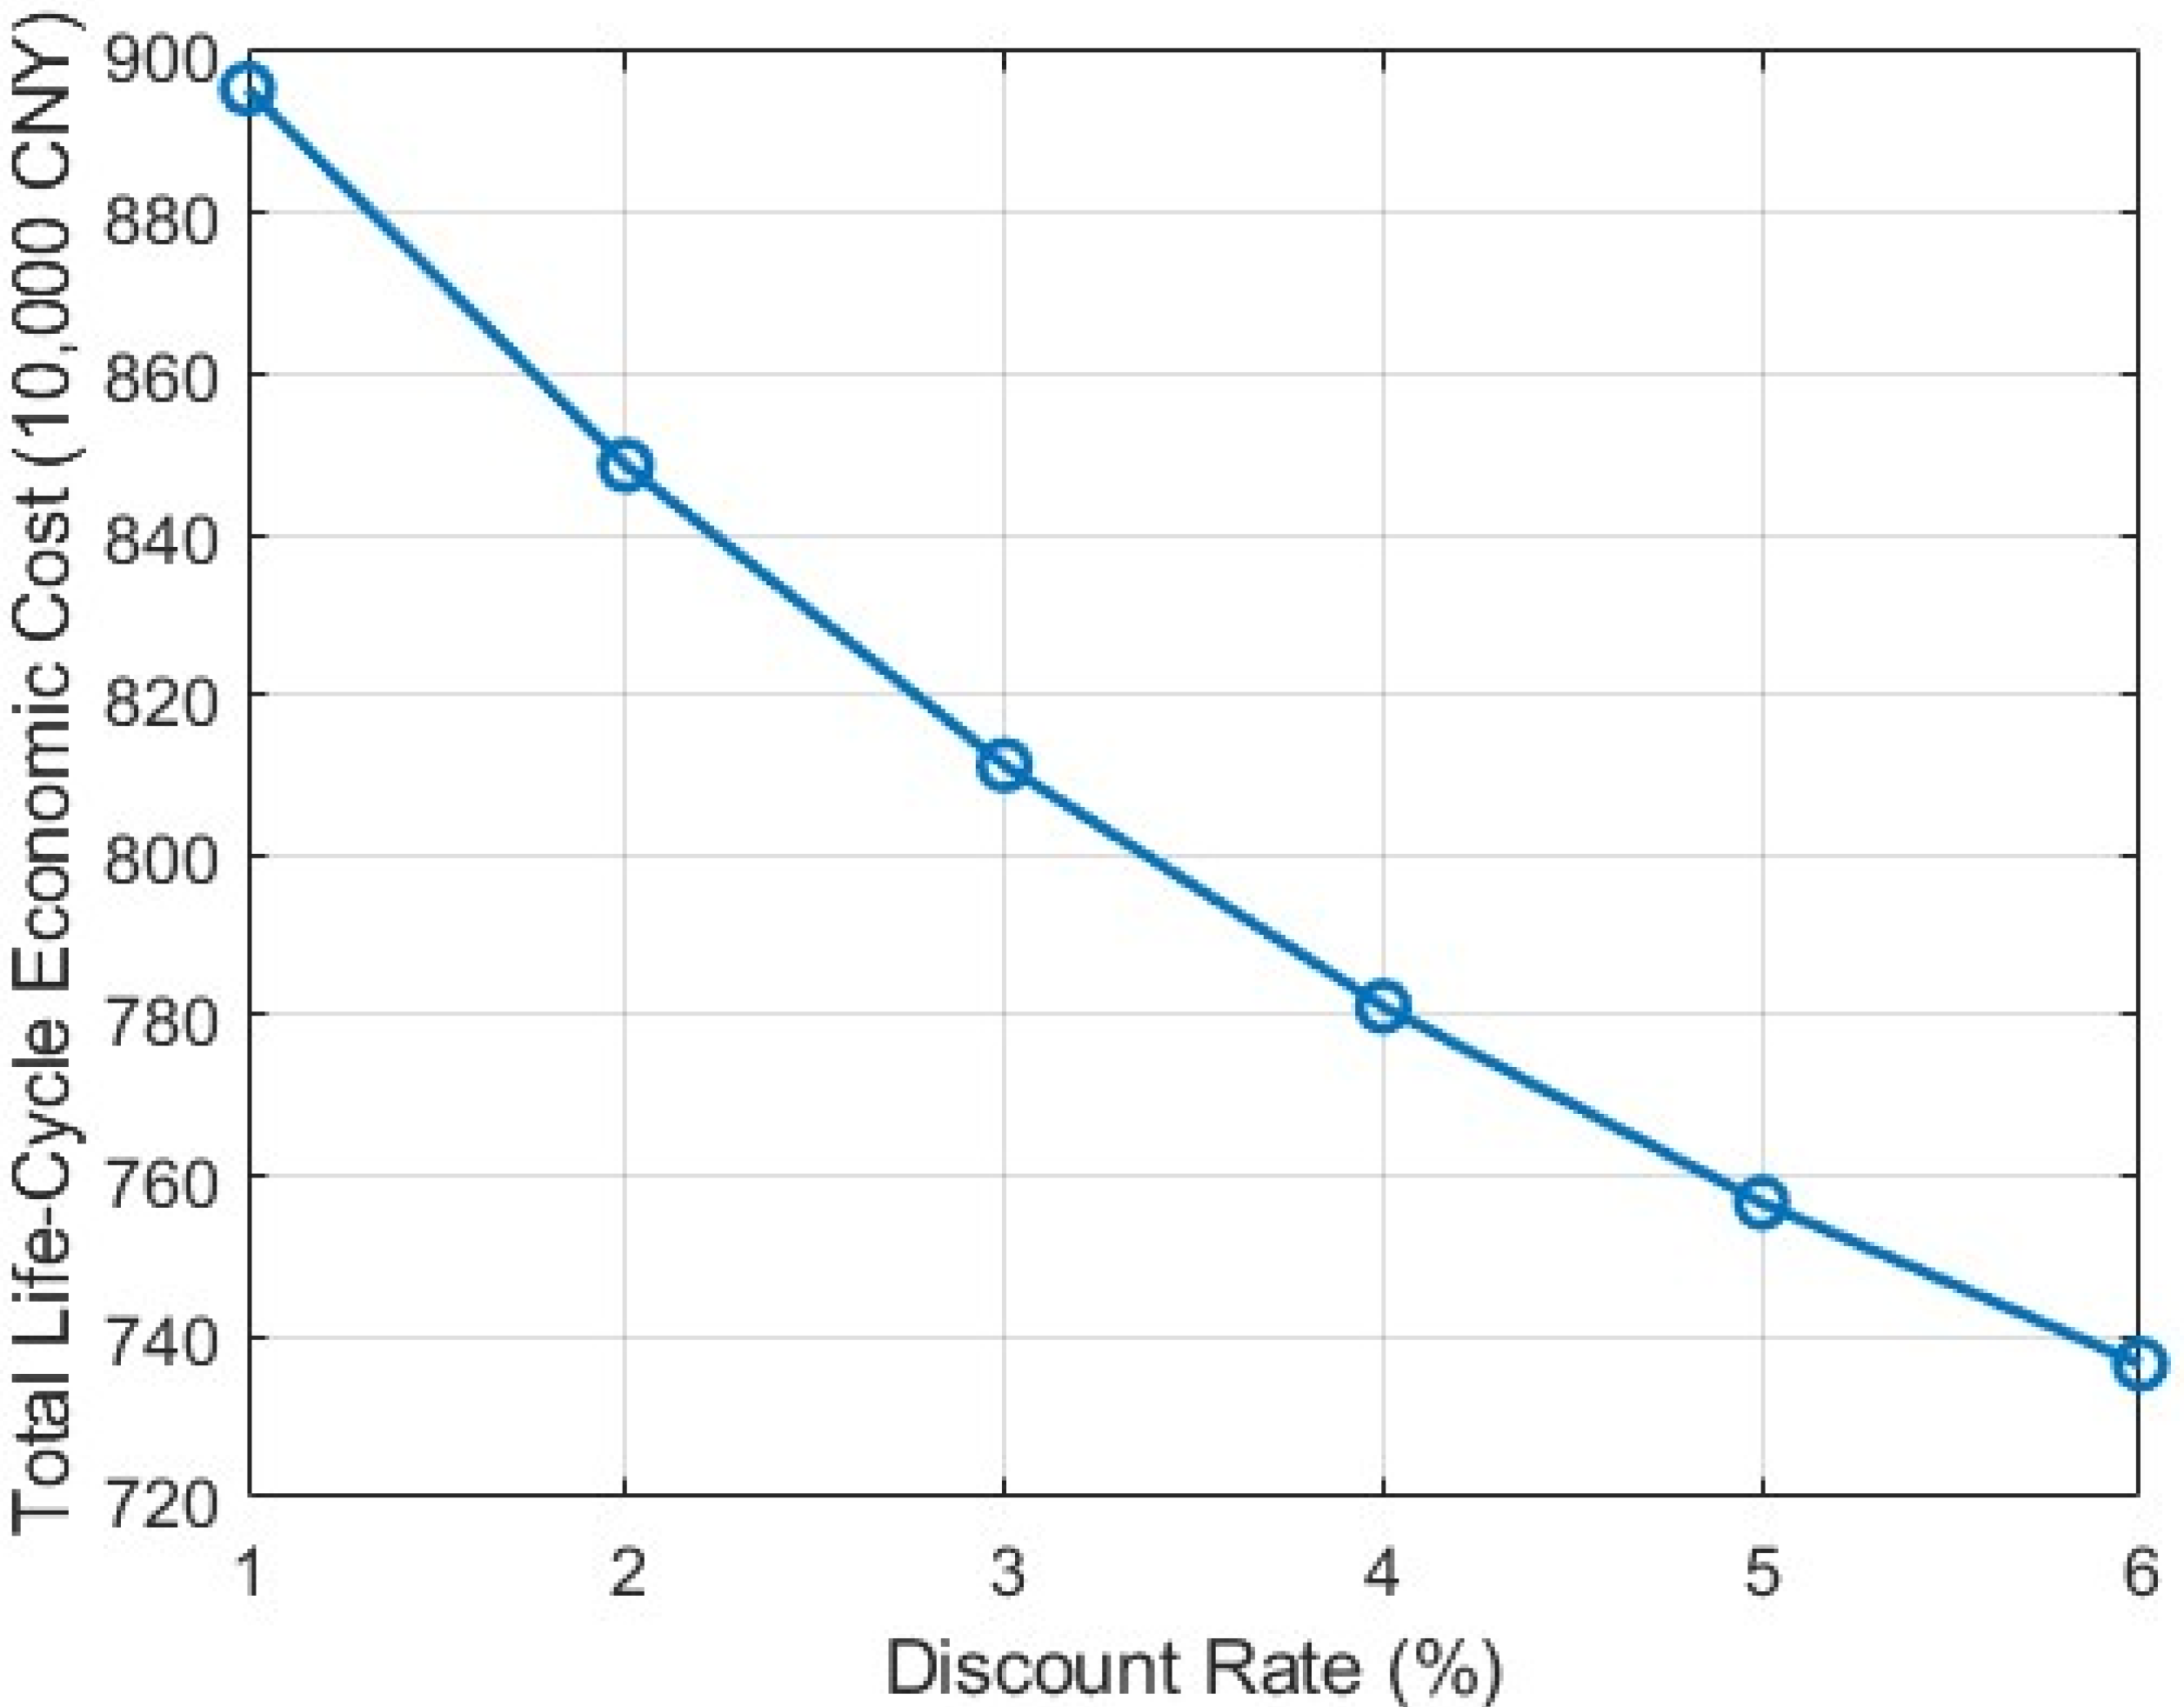
To examine the sensitivity of the model to assumptions regarding the discount rate, a stepwise sensitivity analysis was conducted by varying the discount rate γ from 1% to 6%. Cost parameters for each stage (in 10,000 yuan) were assigned as follows: design and survey costs of 20/10 and 15/10 in years 1 and 2, respectively; construction costs of 300/200 and 50/40 in years 1 and 2, respectively; inspection costs of 20 at years 10, 20, and 30; maintenance costs of 30 at years 5, 10, 15, 20, 25, and 30; and demolition-related costs of 80, 10, and 20 at year 30.
The resulting life cycle cost (LCC) variation with respect to the discount rate is presented in Table 1 and Figure 3. The results indicate that as the discount rate increases, the present values of future-stage expenses, such as inspection, maintenance, and demolition, rapidly decrease, leading to a significant reduction in total LCC. This demonstrates that the discount rate parameter is highly sensitive in economic evaluations. Therefore, it is recommended that a reasonable discount rate be selected in engineering practice and decision making, with sensitivity analyses conducted to verify the robustness and scientific validity of the evaluation outcomes.

3. Life Cycle Environmental Costs of Engineering Structures

3.1. Composition of Environmental Costs

Environmental costs are defined as the monetized impacts caused by pollutant emissions and resource consumption throughout the entire life cycle of engineering structures. These costs are typically categorized by pollutant type and environmental medium and are quantified based on emission sources during material production, construction, maintenance, and demolition. In this section, the components of environmental costs and the analytical approach used for their evaluation are described.

3.1.1. Existing Environmental Cost Analysis Methods

Environmental costs arising from structural engineering activities are primarily quantified as the monetized impact of pollutant emissions and associated ecological damages. Various methods and models have been proposed to evaluate these costs, as summarized in Table 2.
An integrated evaluation framework is herein introduced to systematically quantify environmental costs, providing a basis for informed structural design and management decisions. The research concentrates on three primary pollutant categories—air pollutants, sewage, and solid waste—and translates their environmental damages into monetized cost indicators.

3.1.2. The Composition of Environmental Costs

Environmental costs are delineated as the monetary quantification of environmental impacts, consistent with whole-life cost models and assessment methodologies. For bridge structures, environmental impacts encompass emissions to air, water, and soil, [28,29] with engineering costs linked to harmful emissions and their subsequent environmental consequences (Figure 4).
The U.S. Environmental Protection Agency (EPA) has established air quality standards for six common pollutants [30], namely particulate matter (PMs), ground-level ozone, sulfur dioxide (SO2), nitrogen dioxide (NO2), lead (Pb), and carbon monoxide (CO). In addition, harmful emissions also include greenhouse gases (e.g.,CO2, CH4) and ozone-depleting substances (e.g., CFCs and halons). This section’s environmental cost model focuses on typical air pollutants, such as CO2, CO, SO2, nitrogen oxides (NOx), PMs, volatile organic compounds (VOCs), and Pb. Regarding water pollution, industrial effluents and domestic wastewater are the primary sources, with discharges that can alter the chemical, physical, and ecological characteristics of water bodies. This chapter specifically examines wastewater generated during the production of steel and concrete, with total suspended solids (TSS) and biochemical oxygen demand (BOD) identified as the main pollution indicators [31,32,33]. As for solid waste, it mainly consists of non-hazardous materials (NSWs), such as concrete debris, bricks, wood, and tiles produced during construction and demolition activities. The environmental cost of such waste is primarily determined by the volume requiring landfill disposal.

3.2. Environmental Cost Calculation Model

The environmental costs caused by engineering activities are usually calculated based on the amount of pollutant emissions and their corresponding cost rates [34].
C E C = k i E A , i k · c E A , i + j E W , j k · c E W , j + l E L , l k · c E L , l
where C E C is the total life cycle environmental cost of the engineering structure; E A , i k is the i-th type of air pollutant emissions generated by the k-th engineering activity throughout the entire life cycle; E W , j k is the j-th type of sewage discharge generated by the k = th engineering activity; E L , l k is the discharge volume of non-toxic solid waste generated by the k-th engineering activity; c E A , i is the environmental cost rate of the i-th type of air pollutant; c E W , j is the environmental cost rate of the i-th type of air pollutant; c E L , l is the environmental cost rate of non-toxic solid waste.
The environmental cost rate per unit of pollutant is a key parameter for environmental cost accounting. This study, based on prior research, has tallied the prevention and control cost rates and environmental damage cost rates for three categories of pollutants (Table 3). These figures are then used in Formula (8) to calculate the unit prices for pollution prevention, control, and environmental damage related to building materials and energy (see Table 4). The scope of the material environmental cost rate includes production, transportation, and associated electricity and oil consumption. Variability in environmental damage cost rates is acknowledged, being strongly influenced by spatiotemporal heterogeneity and population density; higher rates are recommended for densely populated urban areas, whereas lower rates may be applied in suburban regions.

3.3. Case Study on Environmental Costs

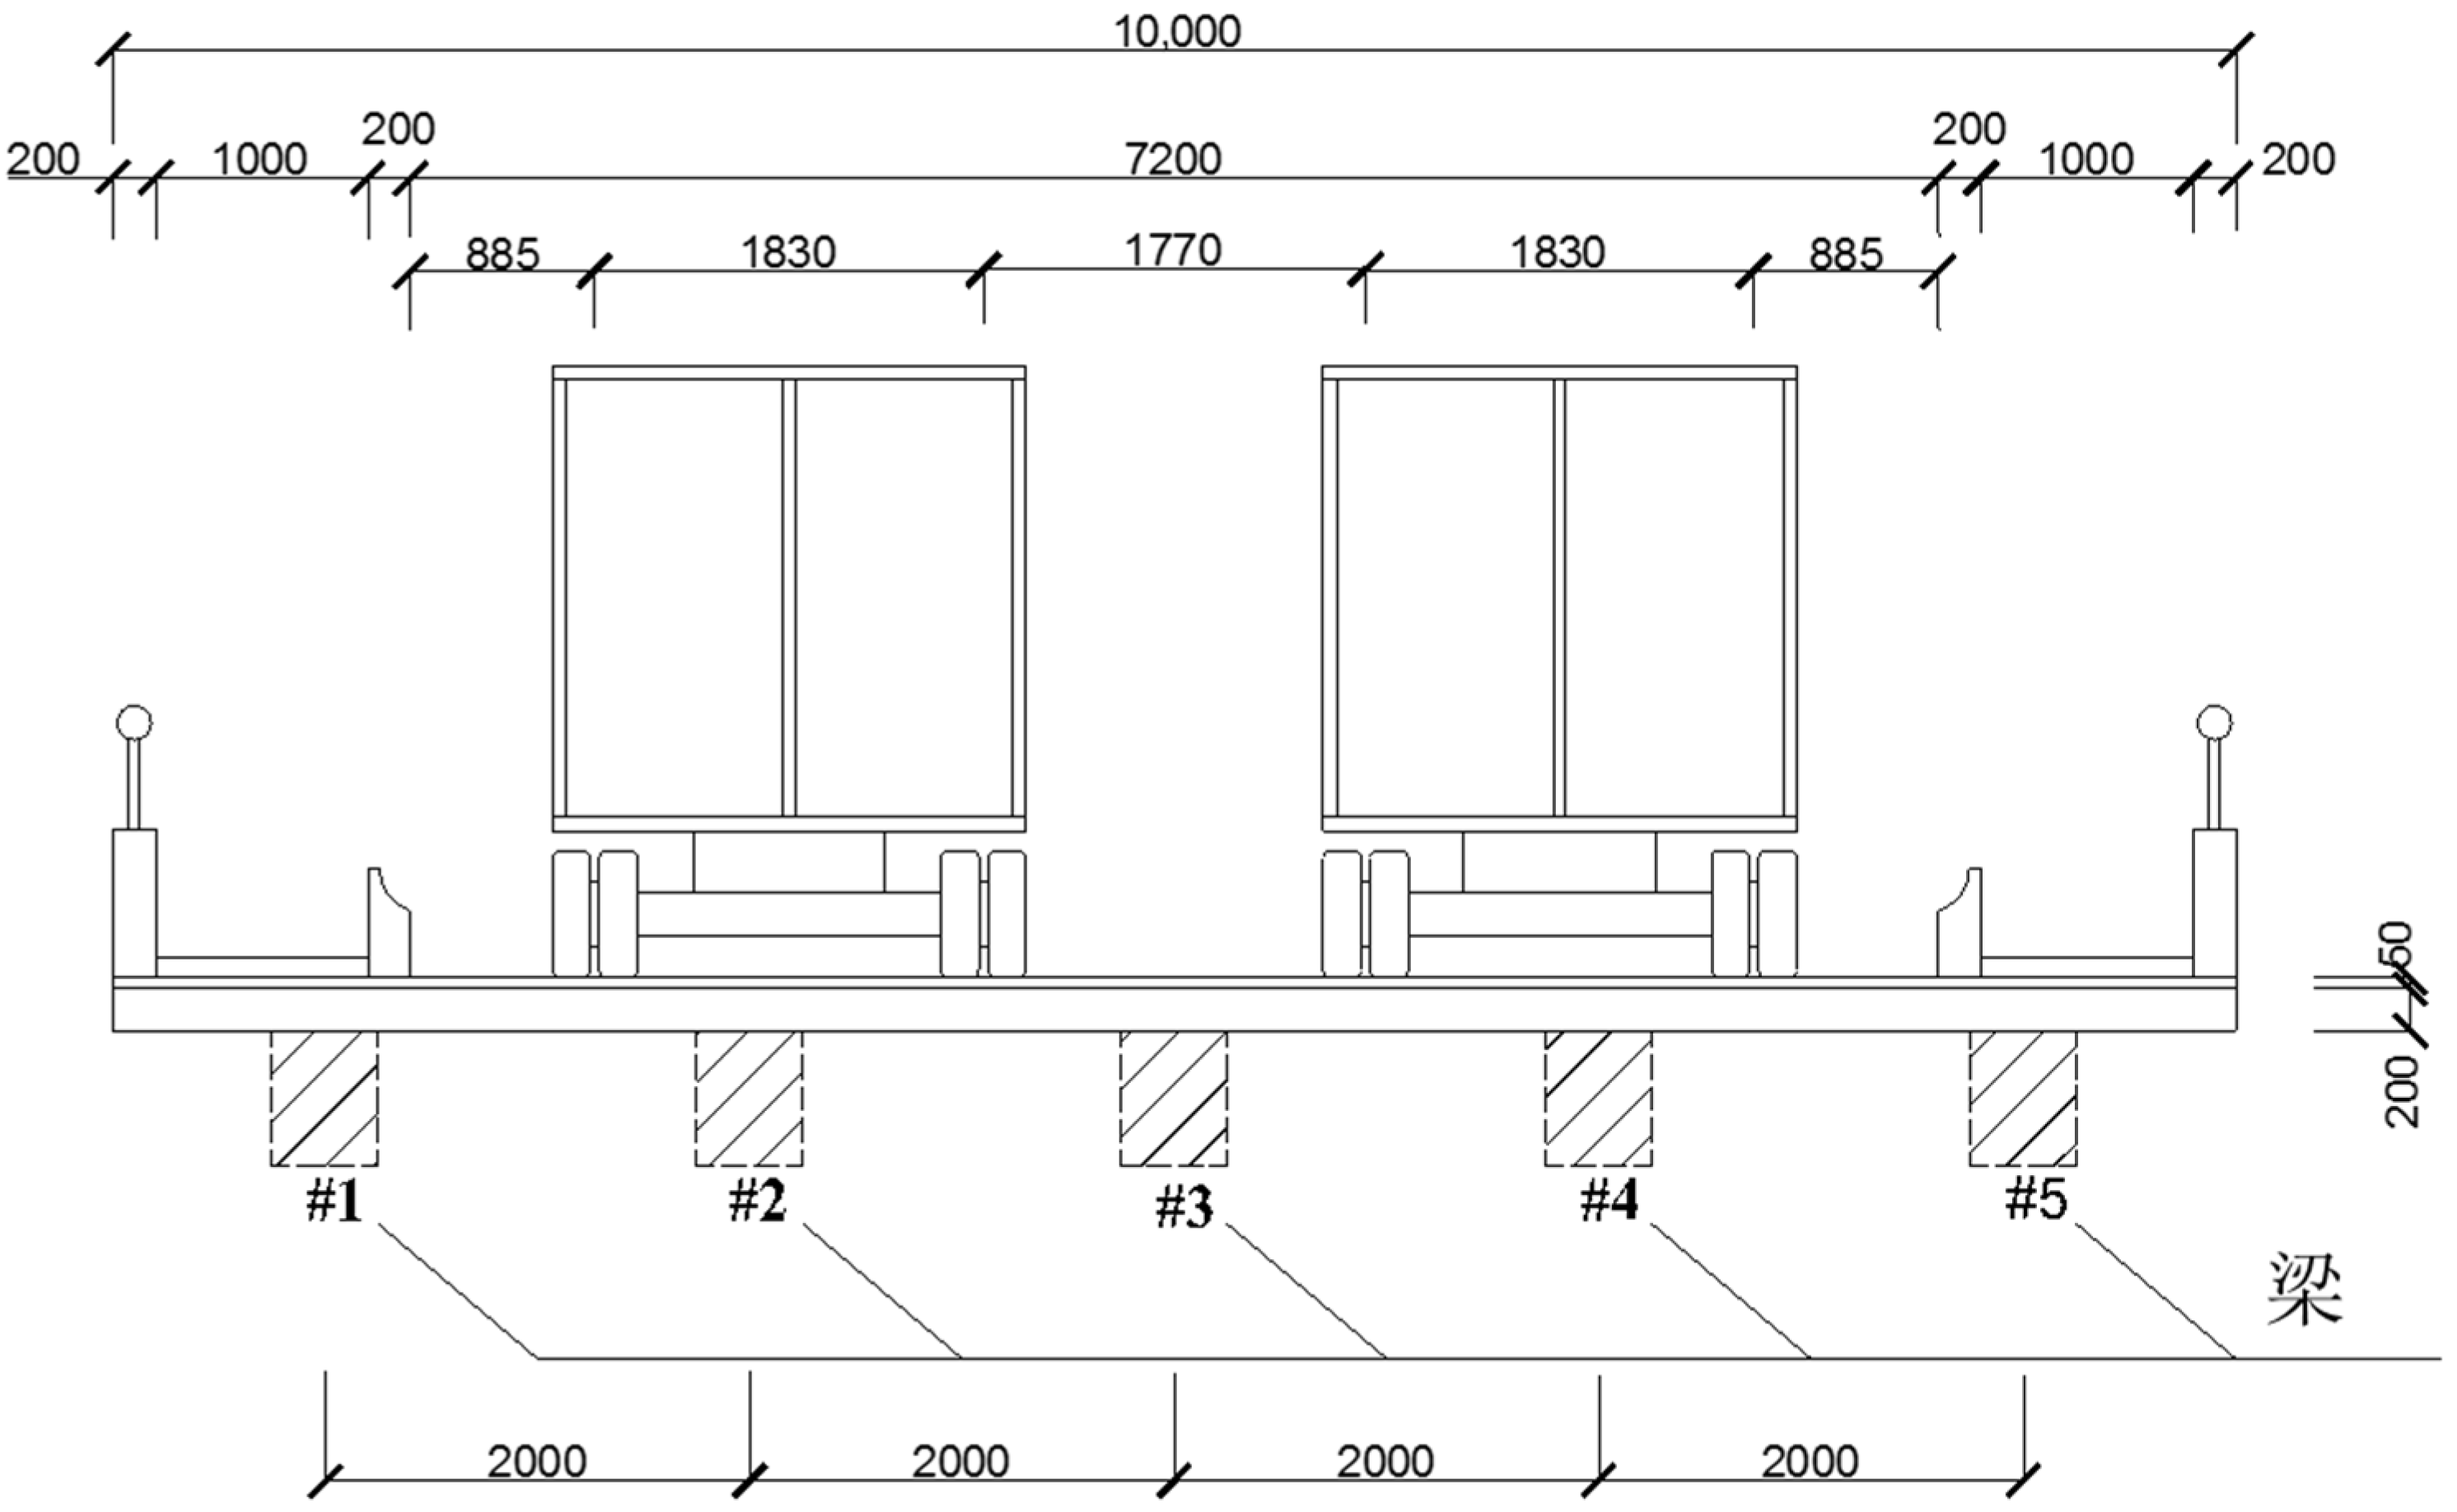
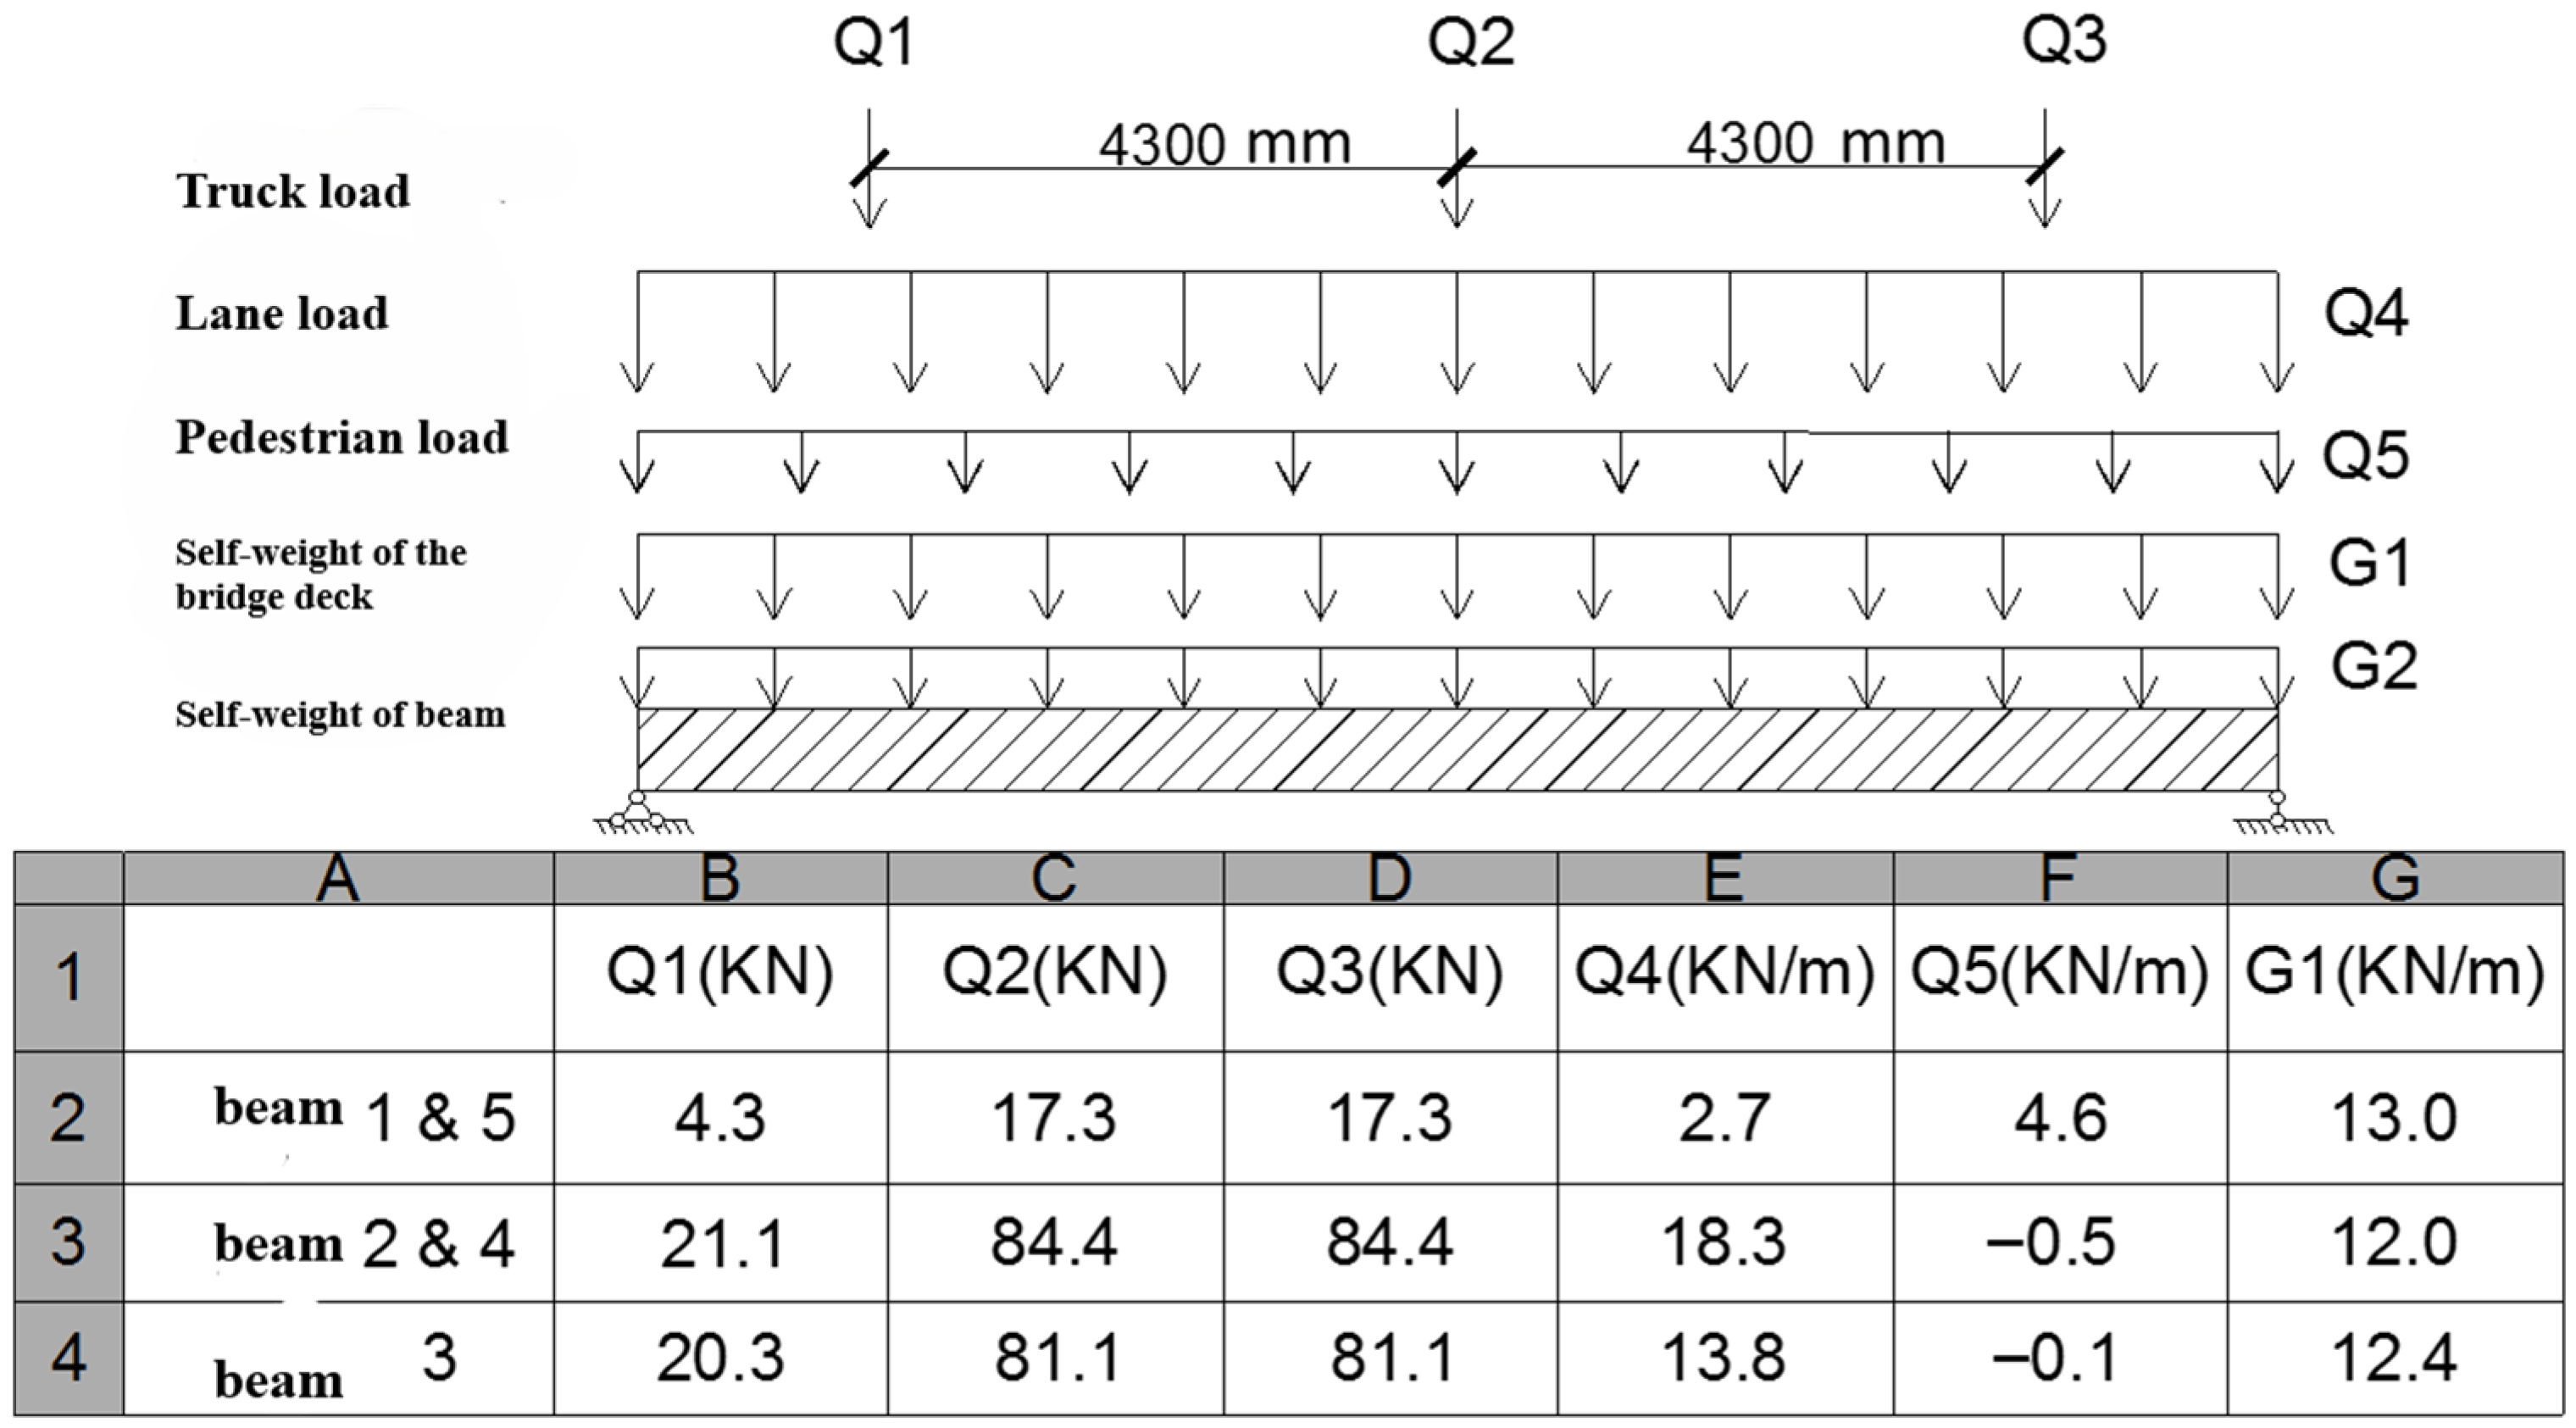
The life cycle economy of steel and prestressed concrete beams was compared for a simply supported bridge with a 12 m span. The design service life of the bridge structure is specified as 75 years. The steel beams are subjected to uniform corrosion caused by the marine environment, and routine maintenance, including recoating of the steel beams, is required every 15 years. As illustrated in Figure 5, the bridge’s superstructure comprises duplicated carriageways, each 3.6 m wide, and footpaths, each 1 m wide. Design loads are specified to include HS20-44 standard lane loads, tandem-axle truck loads, and pedestrian live loads. Structural design was conducted in accordance with AASHTO’s Strength I load combination requirements, whereby combinations of dead loads, vehicular loads, and crowd loads—as depicted in Figure 6—were considered.
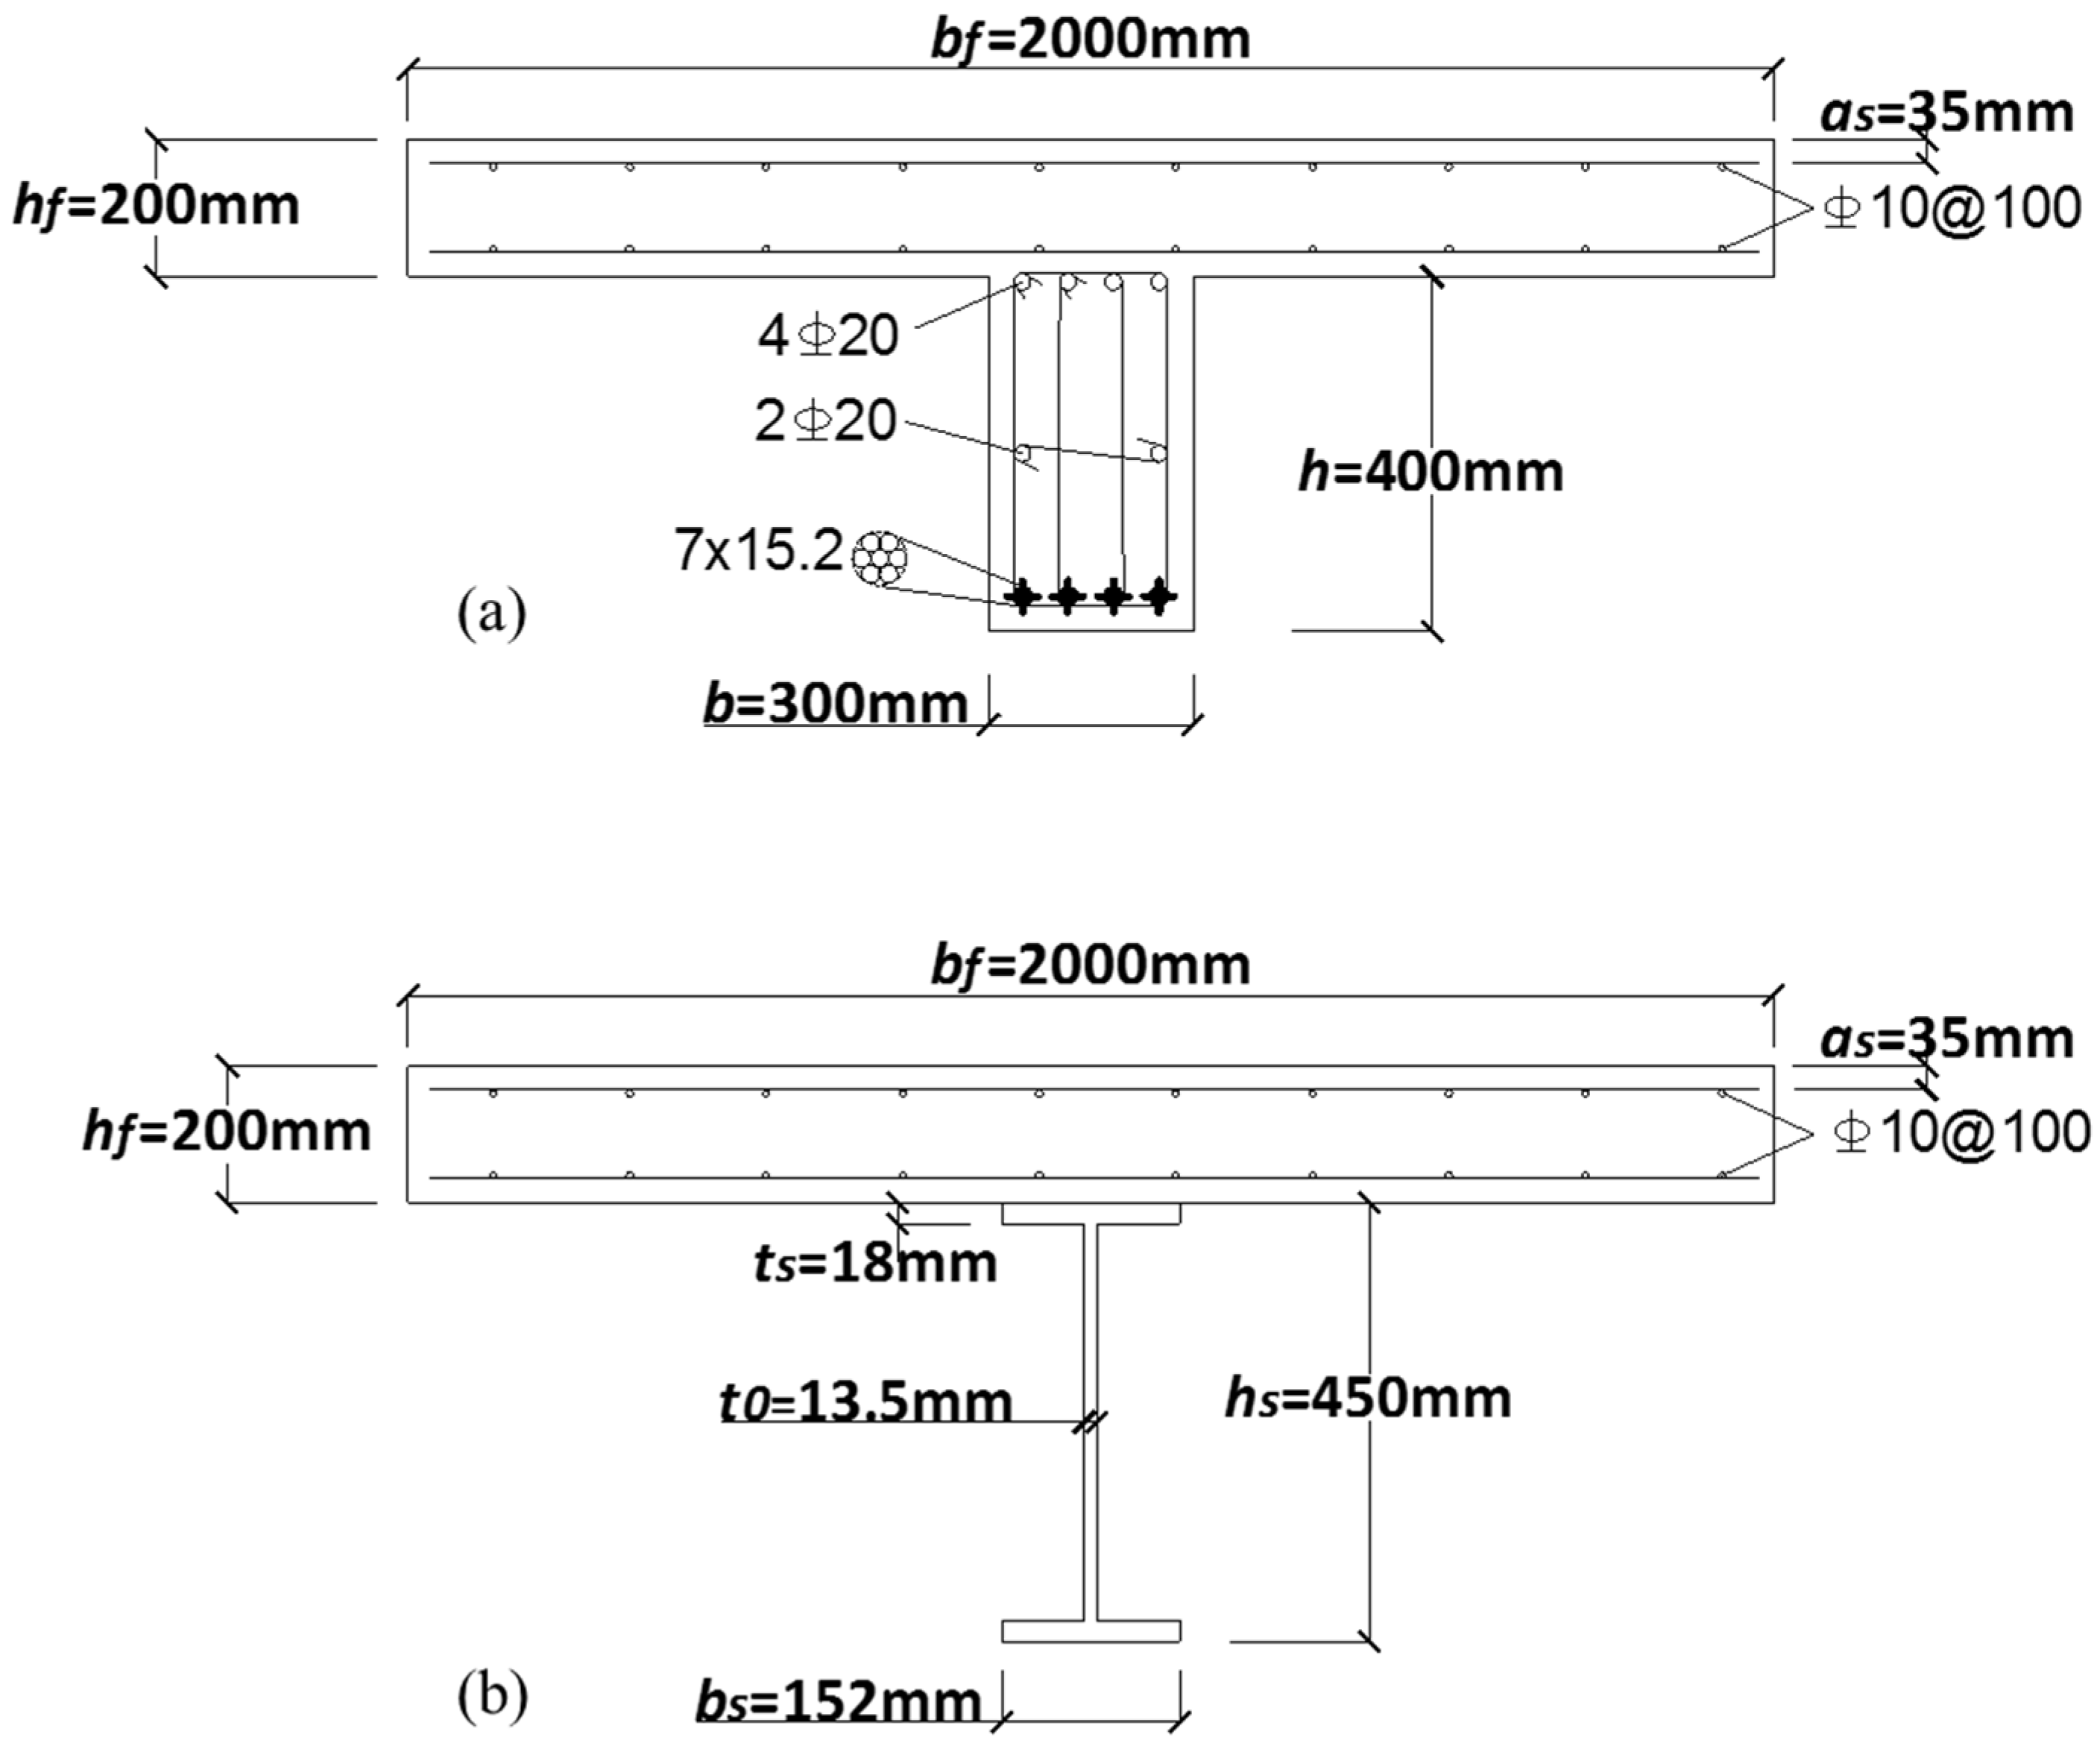
A steel–concrete composite beam design was employed, wherein I-shaped steel beams were effectively connected to the concrete bridge deck through shear connectors. Structural stability was ensured through the installation of stiffeners at the steel beam ends. As shown in Figure 7, the design parameters for the two beam types were as follows.
The steel beam incorporated I-shaped sections measuring 450 mm × 152 mm × 13.5 mm, with a self-weight of 0.857 kN/m per unit length.
The prestressed concrete beam featured a rectangular cross-section of 300 mm × 400 mm, reinforced by four strands of prestressed steel wire with a total cross-sectional area of 5081 mm2, a yield strength of 1960 MPa, and a unit weight of 6 kN/m.
An analysis was conducted based on the following construction assumptions for cost calculation purposes: medium-sized trucks were employed for the transportation of building materials. The transportation distances were set at 13.68 km for steel bars and steel beams and 7.24 km for concrete, and workers’ commuting was facilitated by public buses over a one-way distance of 4.82 km. The construction of steel beams involved hoisting, anchoring, and welding operations, requiring the deployment of 35 on-site workers over a construction period of 3 days. Mechanical equipment was operated for 8 h per beam during this phase. Conversely, the construction of prestressed concrete beams encompassed formwork engineering, prestressed tendon tensioning, pouring, and curing processes, also necessitating 35 workers. The construction duration for concrete beams was extended to 30 days, with mechanical equipment operation lasting up to 24 h per beam. Material loss was accounted for with loss rates calculated at 3% for steel and concrete; steel waste was assumed to be fully recyclable. The loss rate for concrete formwork was estimated at 15%, with resultant waste concrete and formwork required to be landfilled. Based on these parameters, the economic and environmental costs associated with the two structural forms are summarized in Table 5. Labor costs were excluded from the analysis due to significant regional variability.
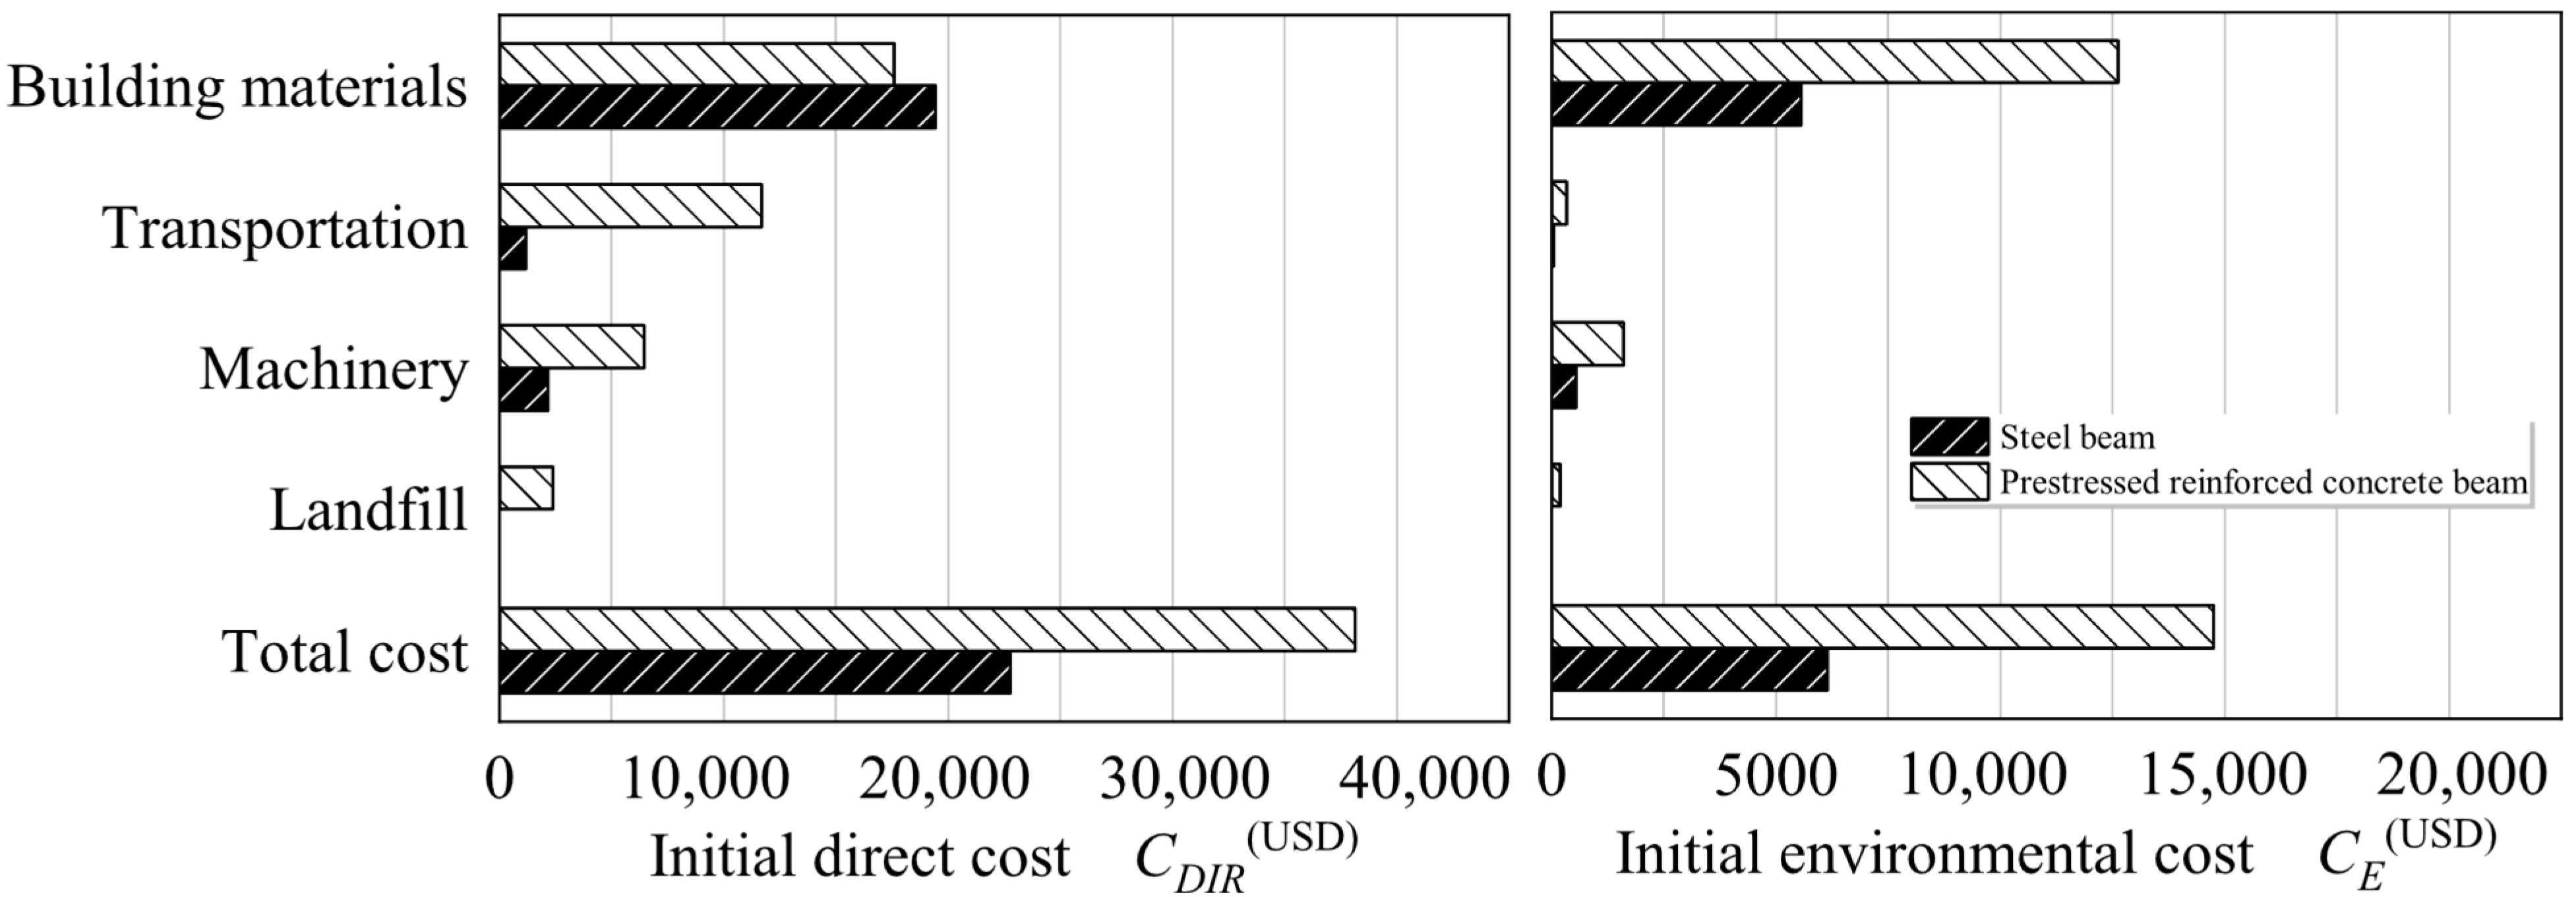
Significant differences in initial costs between the steel beam system and the prestressed concrete beam system have been identified based on the cost composition analyses presented in Figure 8. The steel beam scheme was found to consume 5.4 tons of structural steel, resulting in direct material costs slightly exceeding those of the prestressed concrete beam system, which was observed to consume 7.2 tons of concrete and 3.9 tons of reinforcing steel. However, transportation costs were reduced by approximately 60% due to the inherent lightweight properties of steel beams when compared to concrete beams. Construction expenses were substantially decreased for the steel beam system, attributable to a shortened construction duration of 3 days and reduced machinery requirements. Furthermore, waste generated from steel beam construction was fully recycled, whereas the prestressed concrete beam system produced waste concrete and formwork with an estimated loss rate of 15%, necessitating landfill disposal and thereby increasing waste treatment costs. Consequently, the steel beam scheme was demonstrated to possess a marked economic advantage during the initial phase.
With respect to environmental costs, steel beams were shown to provide more pronounced benefits. Environmental costs associated with prestressed concrete beams were predominantly attributed to concrete materials, amounting to 8585.4 yuan—surpassing the total material-related environmental costs of steel beams. When accounting for reinforcing steel, the material environmental costs of prestressed concrete beams were calculated to be more than double those of steel beams, as detailed in Table 5 and Figure 8. Additionally, the concrete beam scheme exhibited significantly elevated environmental costs in transportation, construction, and waste landfilling processes. Taken together, these comprehensive assessments indicate that steel beams not only offer superior initial economic efficiency relative to prestressed concrete beams but also exhibit enhanced environmental performance.
The environmental cost composition of steel and prestressed concrete beams, segmented into air pollutants, wastewater, and solid waste, is compared in Table 6. Near-complete recyclability of solid waste generated by steel beams results in negligible landfill treatment costs. Environmental costs for steel beams were primarily attributed to air pollutants (77.3%) and water pollutants (22.7%). Conversely, while air pollution costs constituted the majority of environmental expenses for prestressed concrete beams, costs associated with wastewater and solid waste were found to contribute approximately 7% of the total—an extent considered non-negligible in environmental evaluations.

3.4. Sensitivity Analysis of Steel Recovery Rate

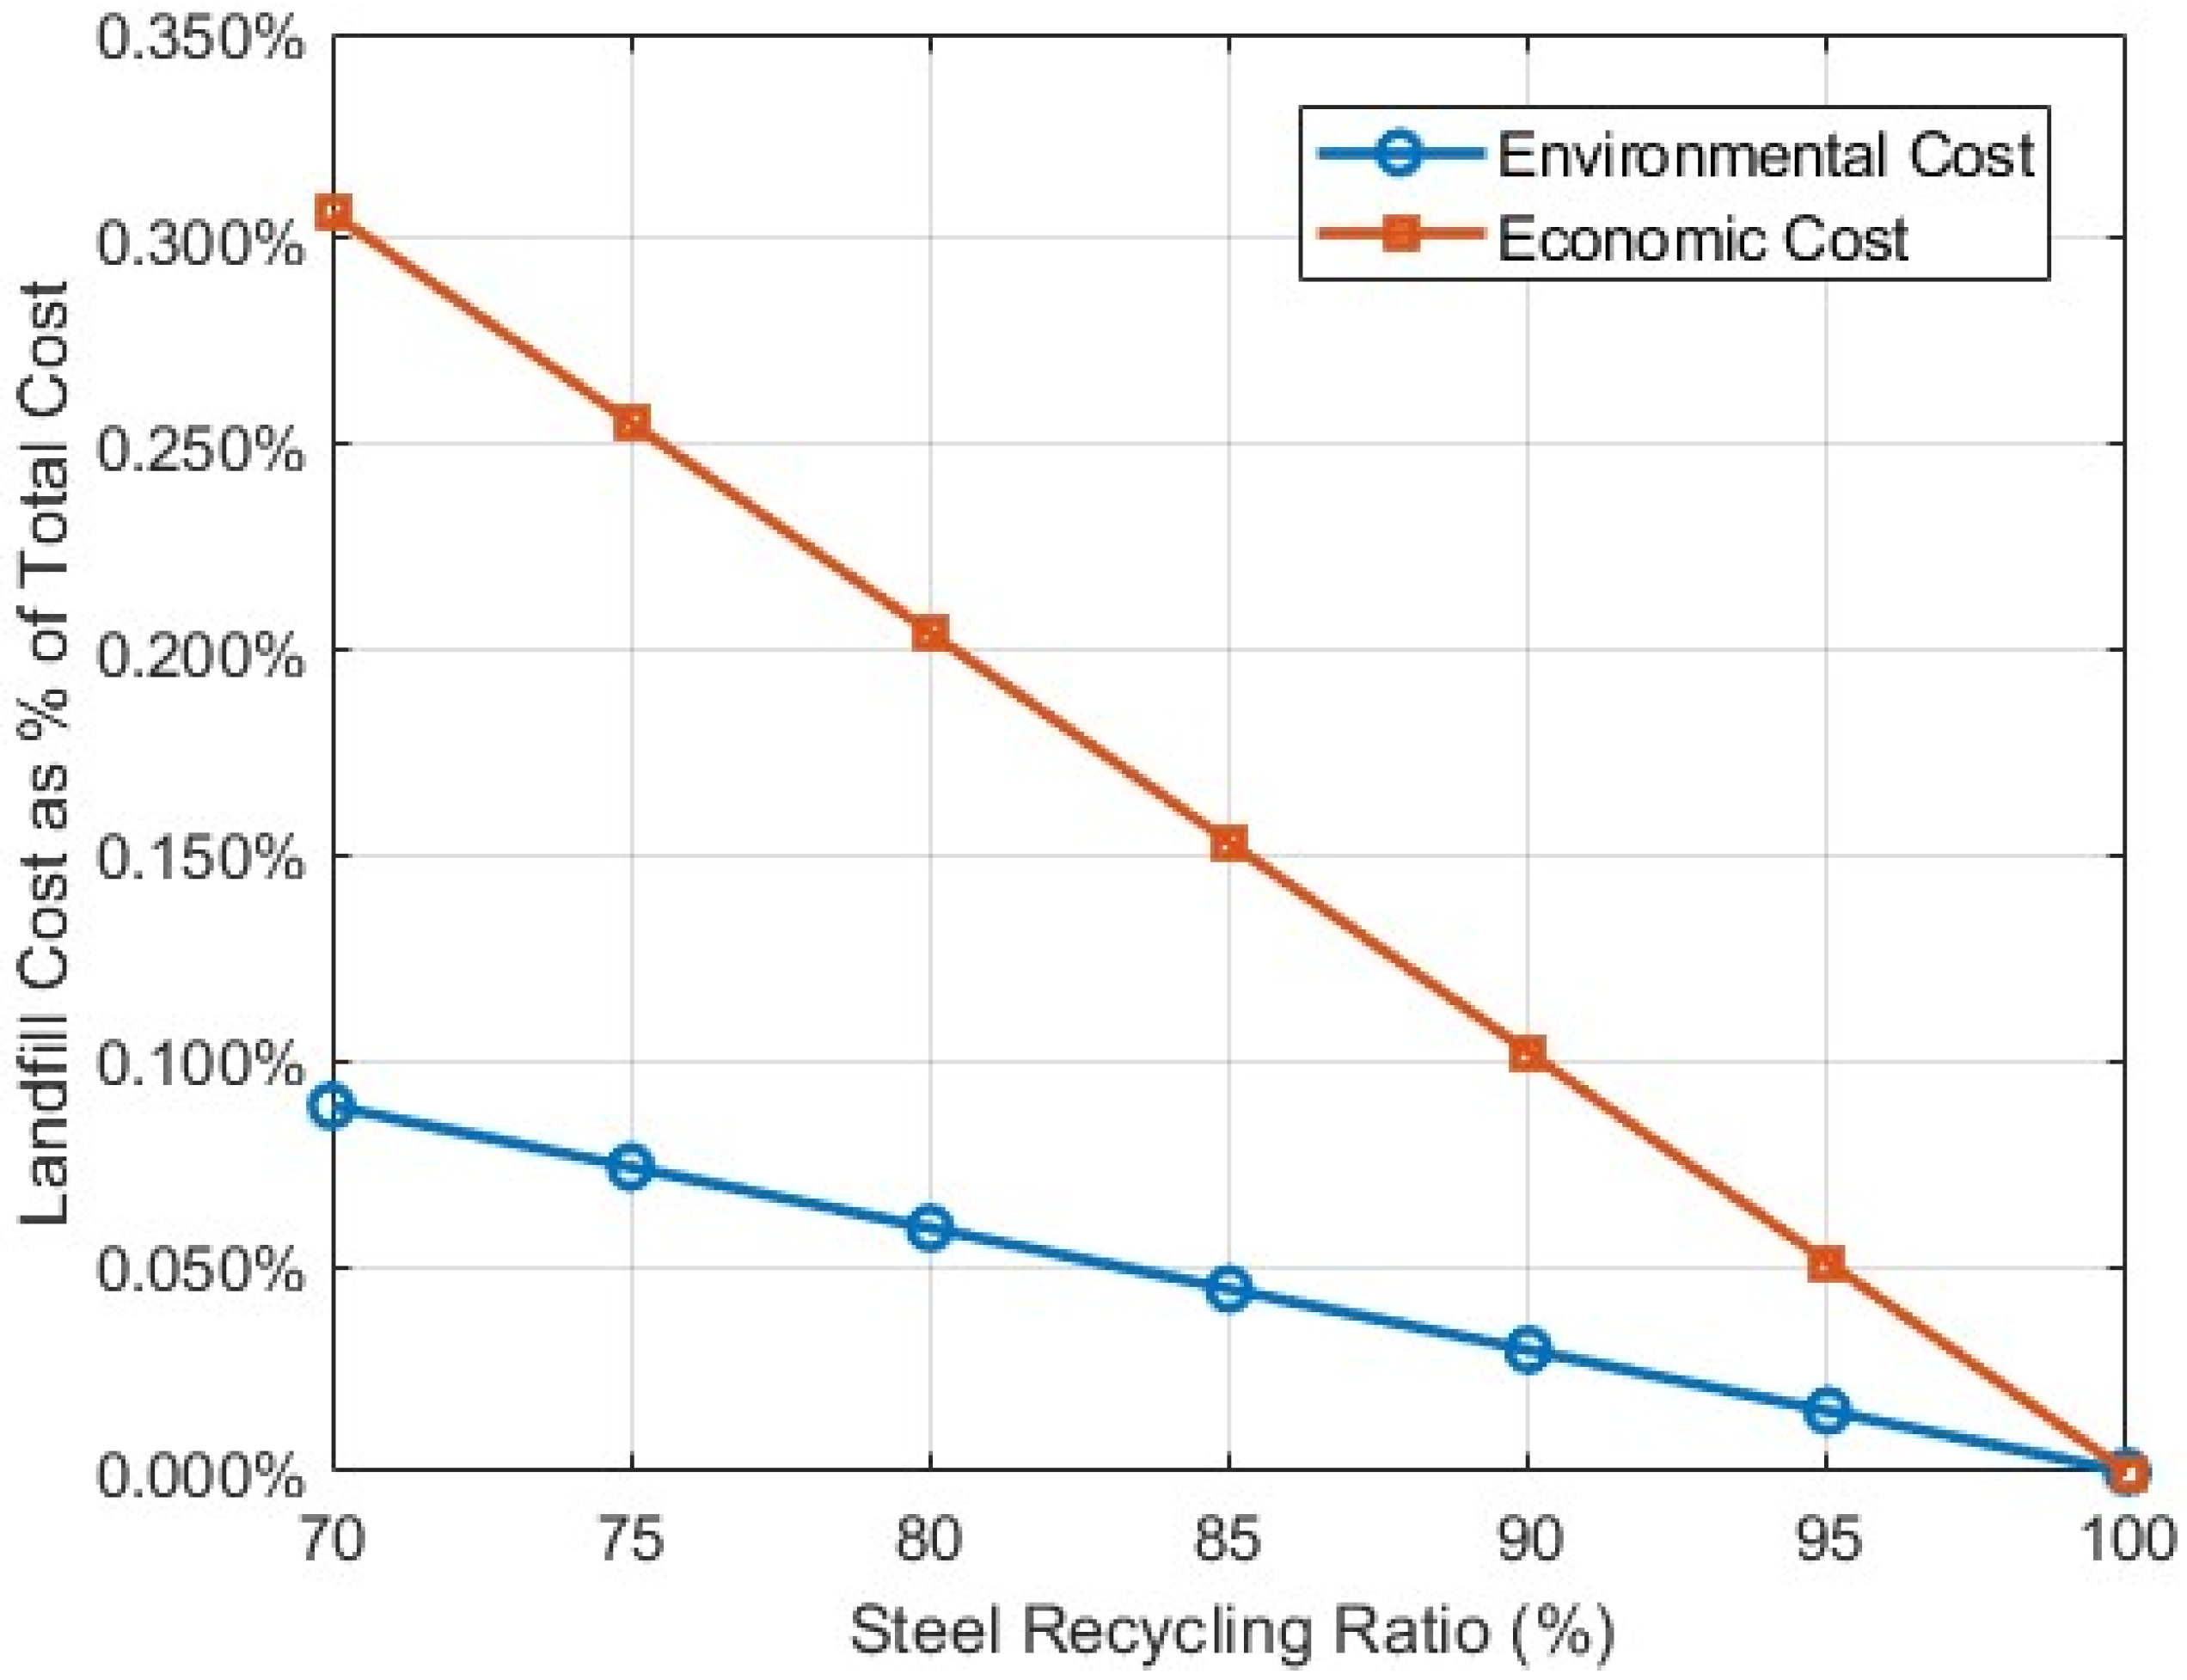
The calculations of the environmental and economic costs presented above were based on the assumption of 100% steel scrap recycling. Although this assumption aligns with the ideal vision of optimal resource circularity, it is challenging to fully achieve in practical engineering applications. Influenced by site management, recycling channels, and market factors, the actual recovery rate of steel typically falls below 100%. To more accurately reflect the economic and environmental impacts under varying recovery rates, a range of steel recycling rates from 70% to 100%, increasing in increments of 5%, was established. The solid waste landfill costs and their proportions within the total environmental and economic costs were calculated and compared for each scenario, and a sensitivity analysis was conducted. The results are presented in Table 7 and Figure 9.
The analysis demonstrates that, as the steel recycling rate decreases, although the absolute values of landfill costs remain relatively small, their shares in the total costs increase markedly from both environmental and economic perspectives. The sensitivity curves clearly illustrate the trend of landfill cost impacts on environmental and economic costs under different recovery rates. Therefore, in practical life cycle assessments and scheme optimizations, actual fluctuations in steel recovery rates should be thoroughly considered, rather than relying on idealized assumptions, so as to enhance the scientific rigor and robustness of the evaluation outcomes

4. Social Cost of the Entire Life Cycle of Engineering Structures

4.1. The Composition of Social Costs

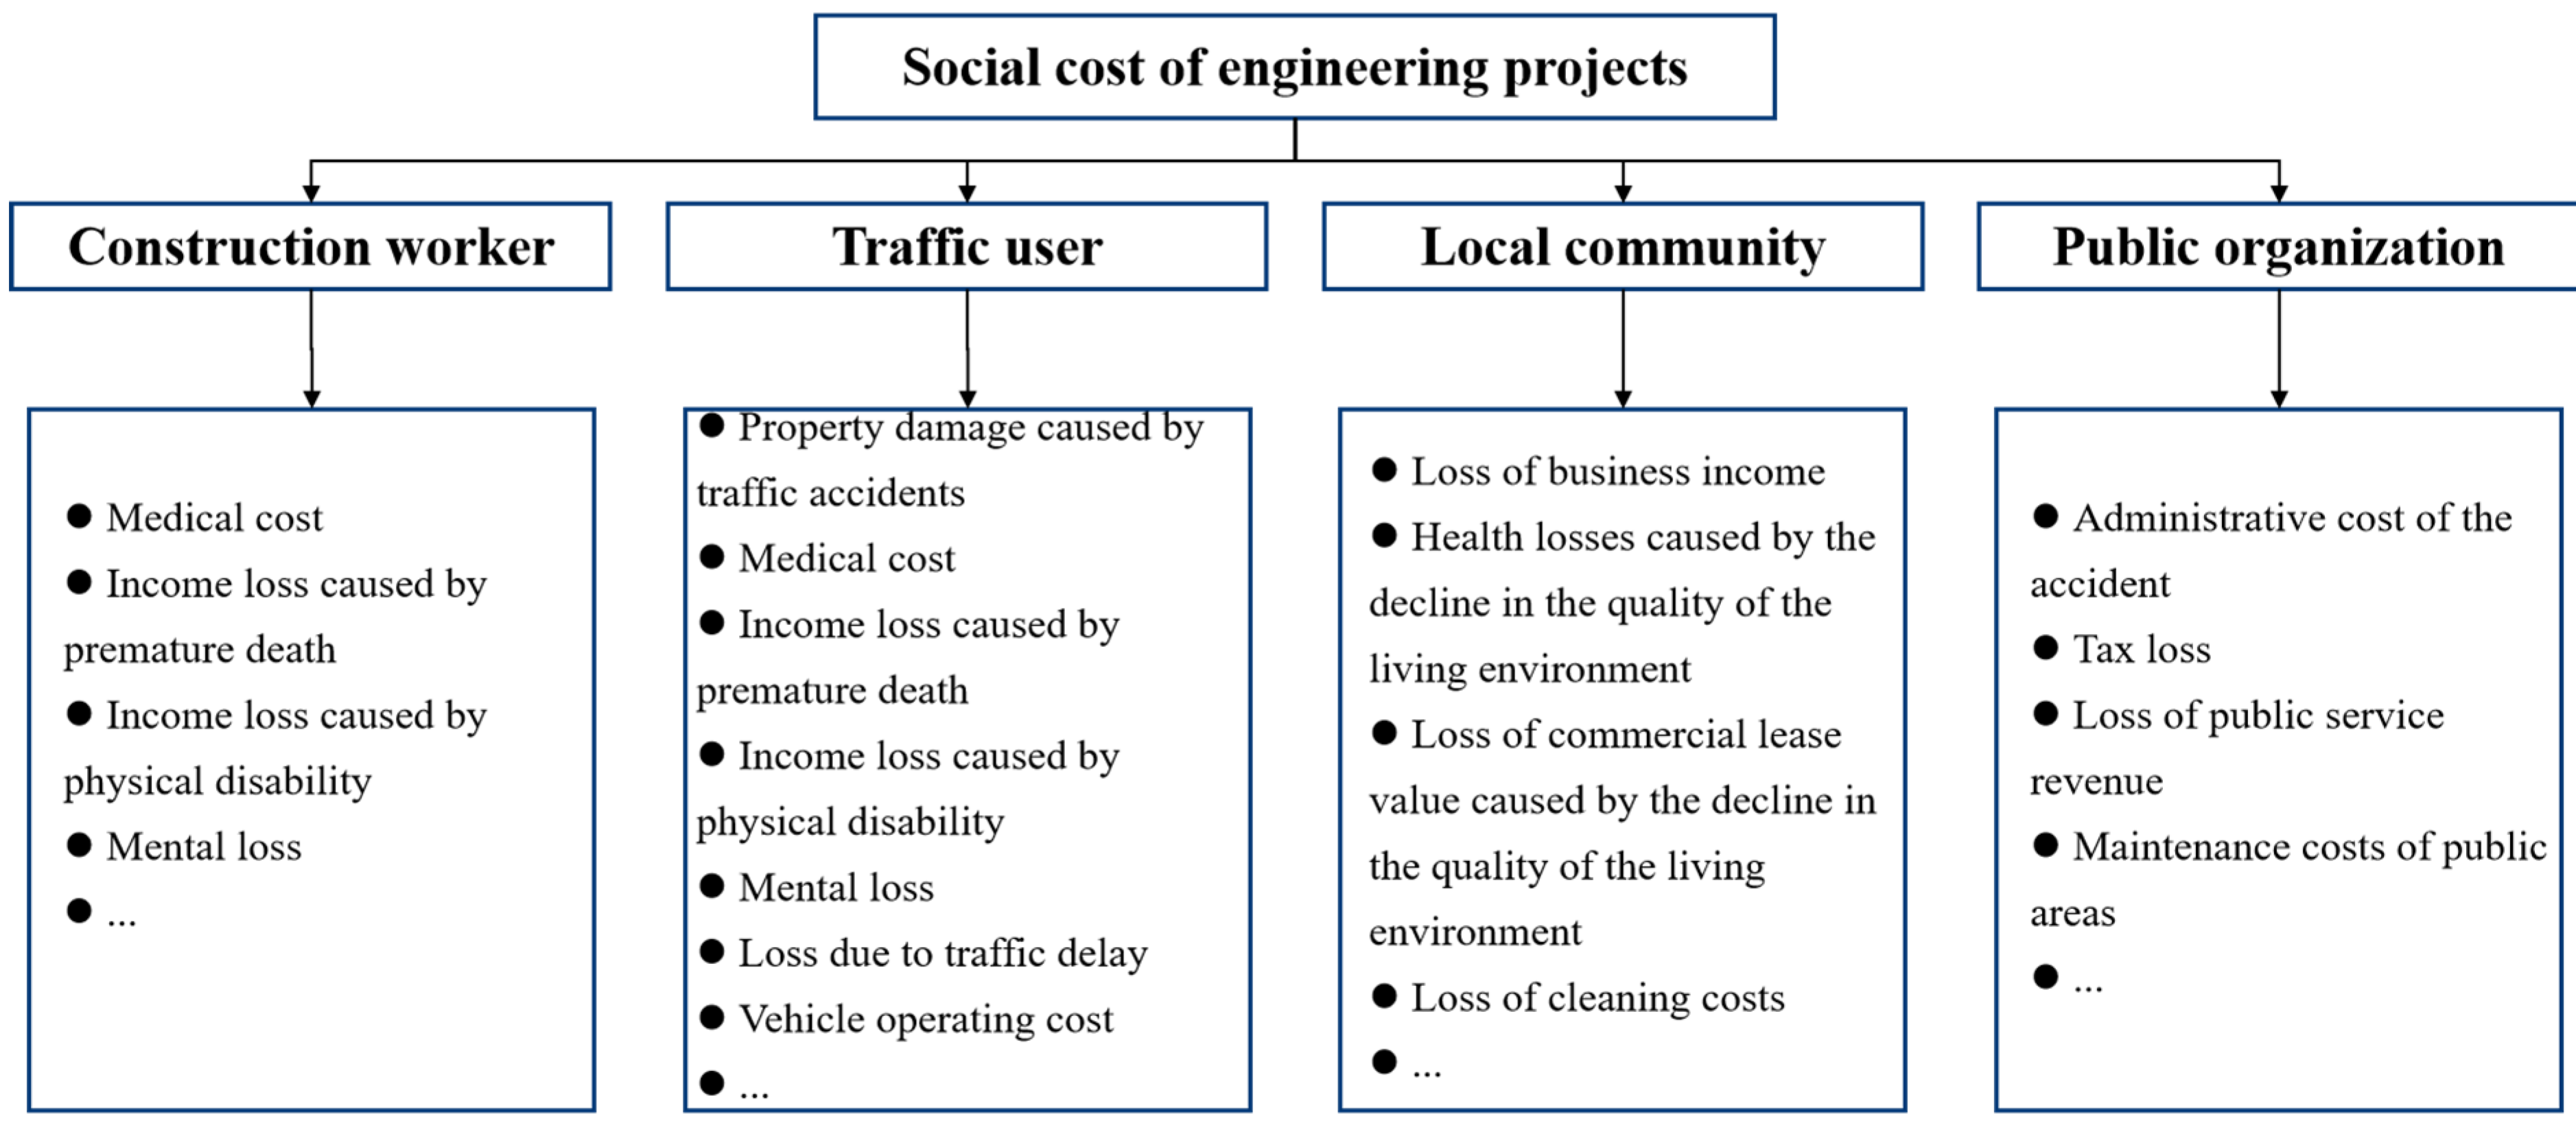
The socioeconomic burden imposed by engineering projects has been defined as the quantifiable negative externalities experienced by surrounding communities during the construction phase [53]. Based on stakeholder theory and impact pathway analysis, the evaluation framework presented in Figure 10 categorizes social costs into four primary dimensions. At the construction personnel level, burdens resulting from occupational safety incidents have been identified to include medical expenses, economic losses due to diminished labor capacity, and compensation for psychological trauma sustained by affected individuals. For traffic participants, associated costs have been characterized by compensation for property damage arising from traffic accidents, time losses encompassing delays experienced by drivers and passengers as well as postponed cargo deliveries, and additional operational expenses, such as increased fuel consumption. From the perspective of local communities, accessibility to commercial areas has been reduced during construction activities, leading to customer attrition and diminished business vitality. Economic impacts of noise pollution have been observed through declines in property values and reductions in labor productivity, while dust pollution has necessitated dedicated environmental remediation expenditures. Public administrative bodies have incurred composite external costs, including administrative expenditures for accident investigations, reductions in the tax base, losses in parking revenue, and increased maintenance expenses for secondary roads.

4.2. Social Cost Calculation Model

4.2.1. Construction Workers

Construction workers are frequently exposed to occupational hazards, such as falls from height, mechanical impacts, and structural collapses, which have been associated with severe injuries or fatalities. It has been demonstrated that the efficacy of construction site safety management systems constitutes a critical factor in the assessment of social impacts for this population [54]. Empirical data indicate that the economic burden attributable to occupational injuries ranges between approximately 0.25% and 3% of the total project cost [55]. This proportion has been shown to be influenced by multiple variables, including labor scale, levels of subcontracting, project size, complexity of management, investment in safety facilities, and regional safety awareness. The social and economic losses resulting from such accidents have been primarily categorized into the medical costs, economic losses, and psychological damage. The mathematical expression is as follows:
C b u i l d e r = C m e d + C i n c o m e + C m e n t a l
where C b u i l d e r represents the construction workers; C m e d is the budgeted value of medical costs; C i n c o m e is the economic loss of construction workers; C m e n t a l is the mental loss of construction worker. The above calculation formulas are listed in Appendix A.

4.2.2. Traffic Users

(1)
Traffic accident losses
Traffic accident losses have been characterized as encompassing comprehensive accident-related costs, including medical treatment, property damage to vehicles, road infrastructure, goods and income loss, and compensation for psychological suffering. Empirical studies have indicated that these costs account for approximately 0.5% to 6.0% of gross domestic product (GDP) in high-income economies, and 1.1% to 2.9% in middle- and low-income countries [56].
Traffic accident losses ( C t r a ) can be calculated using the following formula:
C t r a = c a v g · N r t a r · t c
where C t r a represents the losses caused by traffic accidents; c a v g is the average property damage per traffic accident; N r t a r is the road traffic accident rate caused by construction interference, which can be estimated using regional or national statistics. N r t a r covers the additional accidents from traffic flow changes due to construction-related route diversions and the continuous operation of restricted-access road sections. It can be calculated as expressed in Appendix A.
(2)
Freight delay loss
The loss C l g d caused by cargo delays can be expressed as follows:
C l g d = [ c t , c a r · O c a r · 1 T T + c t , t r u c k · O t r u c k + c t , g o o d s · n g o o d s · T T ] · [ L V C L V n · ρ d a + D V n · 1 ρ d a ] · A D T · t c
where C l g d is the loss caused by freight delays; c t , c a r and c t , t r u c k are the average value of travel time for car and truck drivers and passengers, respectively; c t , g o o d s is the average delay cost per unit of goods; O c a r and O t r u c k are the passenger capacity of cars and trucks, respectively; T T is the proportion of trucks in average daily traffic; n g o o d s is the average weight of goods in trucks; V n is the normal vehicle speed; V C is the average vehicle speed on construction-affected roads.
(3)
Vehicle Operating Costs
For vehicles taking detours, the operating cost C v o c , r e can be expressed as:
C v o c , r e = c r , c a r · 1 T T + c r , t r u c k · T T · D · 1 ρ d a ] · A D T · t c
where C v o c , r e is the operating cost of vehicles taking detours; c r , c a r and c r , t r u c k are the average operating costs of cars and trucks, respectively.
For vehicles passing through roads affected by construction, the operating cost C v o c , c o can be expressed as follows:
C v o c , c o = c f , c a r · 1 T T · ( E c , c a r E n , c a r ) + c f , t r u c k · T T · ( E c , t r u c k E n , t r u c k ) · L · ρ d a · A D T · t c
where C v o c , c o is the operating cost of vehicles passing through construction-affected roads; c f , c a r and c f , t r u c k are the unit fuel prices of cars and trucks, respectively; E c , c a r , E n , c a r , E c , t r u c k , and E n , t r u c k are the fuel efficiency values (liters/km) for cars and trucks traveling at average normal speed and limited speed, respectively, near the construction site.

4.2.3. Local Communities

The reduction in road network capacity resulting from major project implementation has been shown to deteriorate the spatiotemporal accessibility of business districts, with spatial interaction efficiency reported to decline by 23% to 41%. This reduction has been observed to induce spatial redistribution of consumer flows, thereby causing leakages within the local commercial economy. During the construction period, noise pollution and dust generation have been demonstrated to substantially diminish the environmental comfort of residential areas, leading to sustained disruptions in the daily lives and work routines of surrounding residents. The social costs imposed on adjacent communities by infrastructure projects have typically been manifested in losses of commercial revenue and expenditures related to noise pollution control, among other impacts.
(1)
Reduction in commercial sales revenue
Traffic restrictions imposed by road construction have been shown to cause consumer behavior spill-over into alternative commercial areas, resulting in customer attrition and diminished operating income within affected business districts. From a temporal perspective, sustained reductions in traffic efficiency have been observed to generate multifaceted economic effects: at the micro-level, these manifest as prolonged logistics cycles and increased labor costs; at the meso-level, spatial shifts in consumer demand have been triggered; and at the macro-level, a negative feedback loop has been formed, constraining sustainable regional economic development through weakened capital agglomeration effects and capacity contraction mechanisms. Empirical evidence has indicated that service industries situated along roadways—such as food and beverage businesses, automotive services, and the hospitality sector—exhibit high sensitivity to variations in traffic accessibility. Quantitative assessments of such economic losses have been conducted through comparative analyses of cross-sectional revenue data and time series evaluations based on tax and financial reporting records.
In the field of traffic infrastructure construction impact assessment, Matthews et al. [57] innovatively constructed the Business Interference Coefficient Model (Business Interference Index) and proposed a commercial impact factor. This indicator establishes a quantitative relationship between the revenue decline of road-based economic units and traffic accessibility based on empirical survey data. This model provides a standardized measurement tool for economic losses of traffic-dependent enterprises under construction disturbance. Based on this, the loss in commercial revenue C b i l can be expressed as follows:
C b i l = α b · R b · t c
where C b i l is the loss of commercial income; α b is the business impact factor; R b is the average daily business revenue of the affected area.
(2)
Construction noise pollution control costs
Continuous acoustic exposure has been demonstrated to induce multidimensional health risks, including behavioral alterations, psychological stress responses, and physiological dysfunction. In sound-sensitive areas adjacent to major transport corridors, passive noise reduction measures or residential relocation through special compensation mechanisms are typically implemented by municipal authorities. However, in temporary infrastructure projects, active noise control efforts are generally insufficiently motivated by constructors. Consequently, it is necessary to evaluate noise pollution-related economic losses via external loss assessment methodologies, specifically through the quantification of production efficiency suppression resulting from decreased labor productivity.
The production efficiency suppression effect can be indicated by such indexes as manufacturing capacity gaps or declines in service industry revenues. Equation (15) is as follows:
C p d = c w n · P R F · n w · t c
where C p d is the loss due to the decline in productivity; c w n is the average daily wage in the areas affected by noise; P R F is the productivity reduction factor, which depends on the noise level and the type of affected production activities; n w is the number of affected labor forces.

4.2.4. Public Organization

Public organizations are responsible for functional clusters that provide essential services necessary for maintaining societal operations. These include key departments, such as public security law enforcement agencies, social security administrative bodies, emergency rescue response units, judicial adjudication authorities, and public interest legal support platforms. Social costs arising from engineering projects associated with these organizations are generally comprised of the following components:
(1)
Administrative cost of accidents
As an externalized manifestation of social risks, the cost associated with public safety governance is primarily incurred due to the multi-departmental emergency response coordination mechanisms activated by sudden safety accidents. The constituent components of these costs include (1) labor costs for on-site investigations conducted by public security law enforcement agencies; (2) equipment dispatch losses incurred by disaster emergency response units; (3) operational expenditures related to judicial mediation and insurance loss assessment systems. Accurate quantification of this cost structure necessitates the execution of cross-departmental budget audits and detailed decomposition of functional consumption. Tang et al. [55] concluded that the administrative intervention cost of safety accidents in the construction field in Hong Kong accounts for approximately 57% of the direct economic losses. However, the expenditure on traffic accident management shows a significant range fluctuation characteristic of 0.07–30% [58]. The administrative cost of an accident can be estimated through the ratio of administrative cost to accident cost, as follows:
C a d = α w · C m e d + C i n c o m e + α t · C t r a
where C a d is the administrative cost of accidents; α w and α t are, respectively the ratios of the administrative costs to the accident costs of construction accidents and traffic accidents.
(2)
Loss of Municipal Revenue
During construction activities within urban core areas, traffic restrictions have been shown to induce road-based economic losses through two primary mechanisms. First, underutilization of public parking facilities has resulted in concession revenue losses, manifested as reduced parking fees; second, alterations in traffic flow have led to diminished income from illegal parking fines, due to decreased law enforcement confiscations. These opportunity costs, particularly pronounced during prolonged road-occupation construction, have been identified as significant components of overall project social costs. To quantify this, we can use historical data of on-street parking resources and estimate the loss through spatiotemporal comparisons between construction periods and benchmark revenues [59], as follows:
C p f = n p · c m e t e r · ρ o c c · t c + n p · c t i c k e t · f t i c k e t · t c
where C p f represents the loss of parking space income; n p represents the number of parking spaces occupied for construction. c m e t e r is the average charging amount for parking spaces; ρ o c c is the average occupancy rate of parking spaces; c t i c k e t is the average fine amount for each ticket. f t i c k e t is the fine frequency for each parking space.
To facilitate understanding and the practical application of the social cost model, a fully worked numeric example is provided for municipal revenue loss, following Equation (17). The assumed parameters are as follows: n p is 50, c m e t e r is 20 yuan/day, ρ o c c is 0.8, c t i c k e t is 100 yuan/fine, f t i c k e t is 0.05 fines/space/day, and t c is 60 days. Substituted into Formula (17), the C p f is 63,000 yuan.
Based on the above analysis, the calculation model of the social cost throughout the entire life cycle of the engineering structure can be obtained as follows:
C S C = C m e d + C i n c o m e + C m e n t a l + C t r a + C l g d + C v o c , r e + C v o c , c o + C b i l + C p d + C a d + C p f
where C S C is the total life cycle social cost of the engineering structure.

4.3. Case Analysis of Social Costs

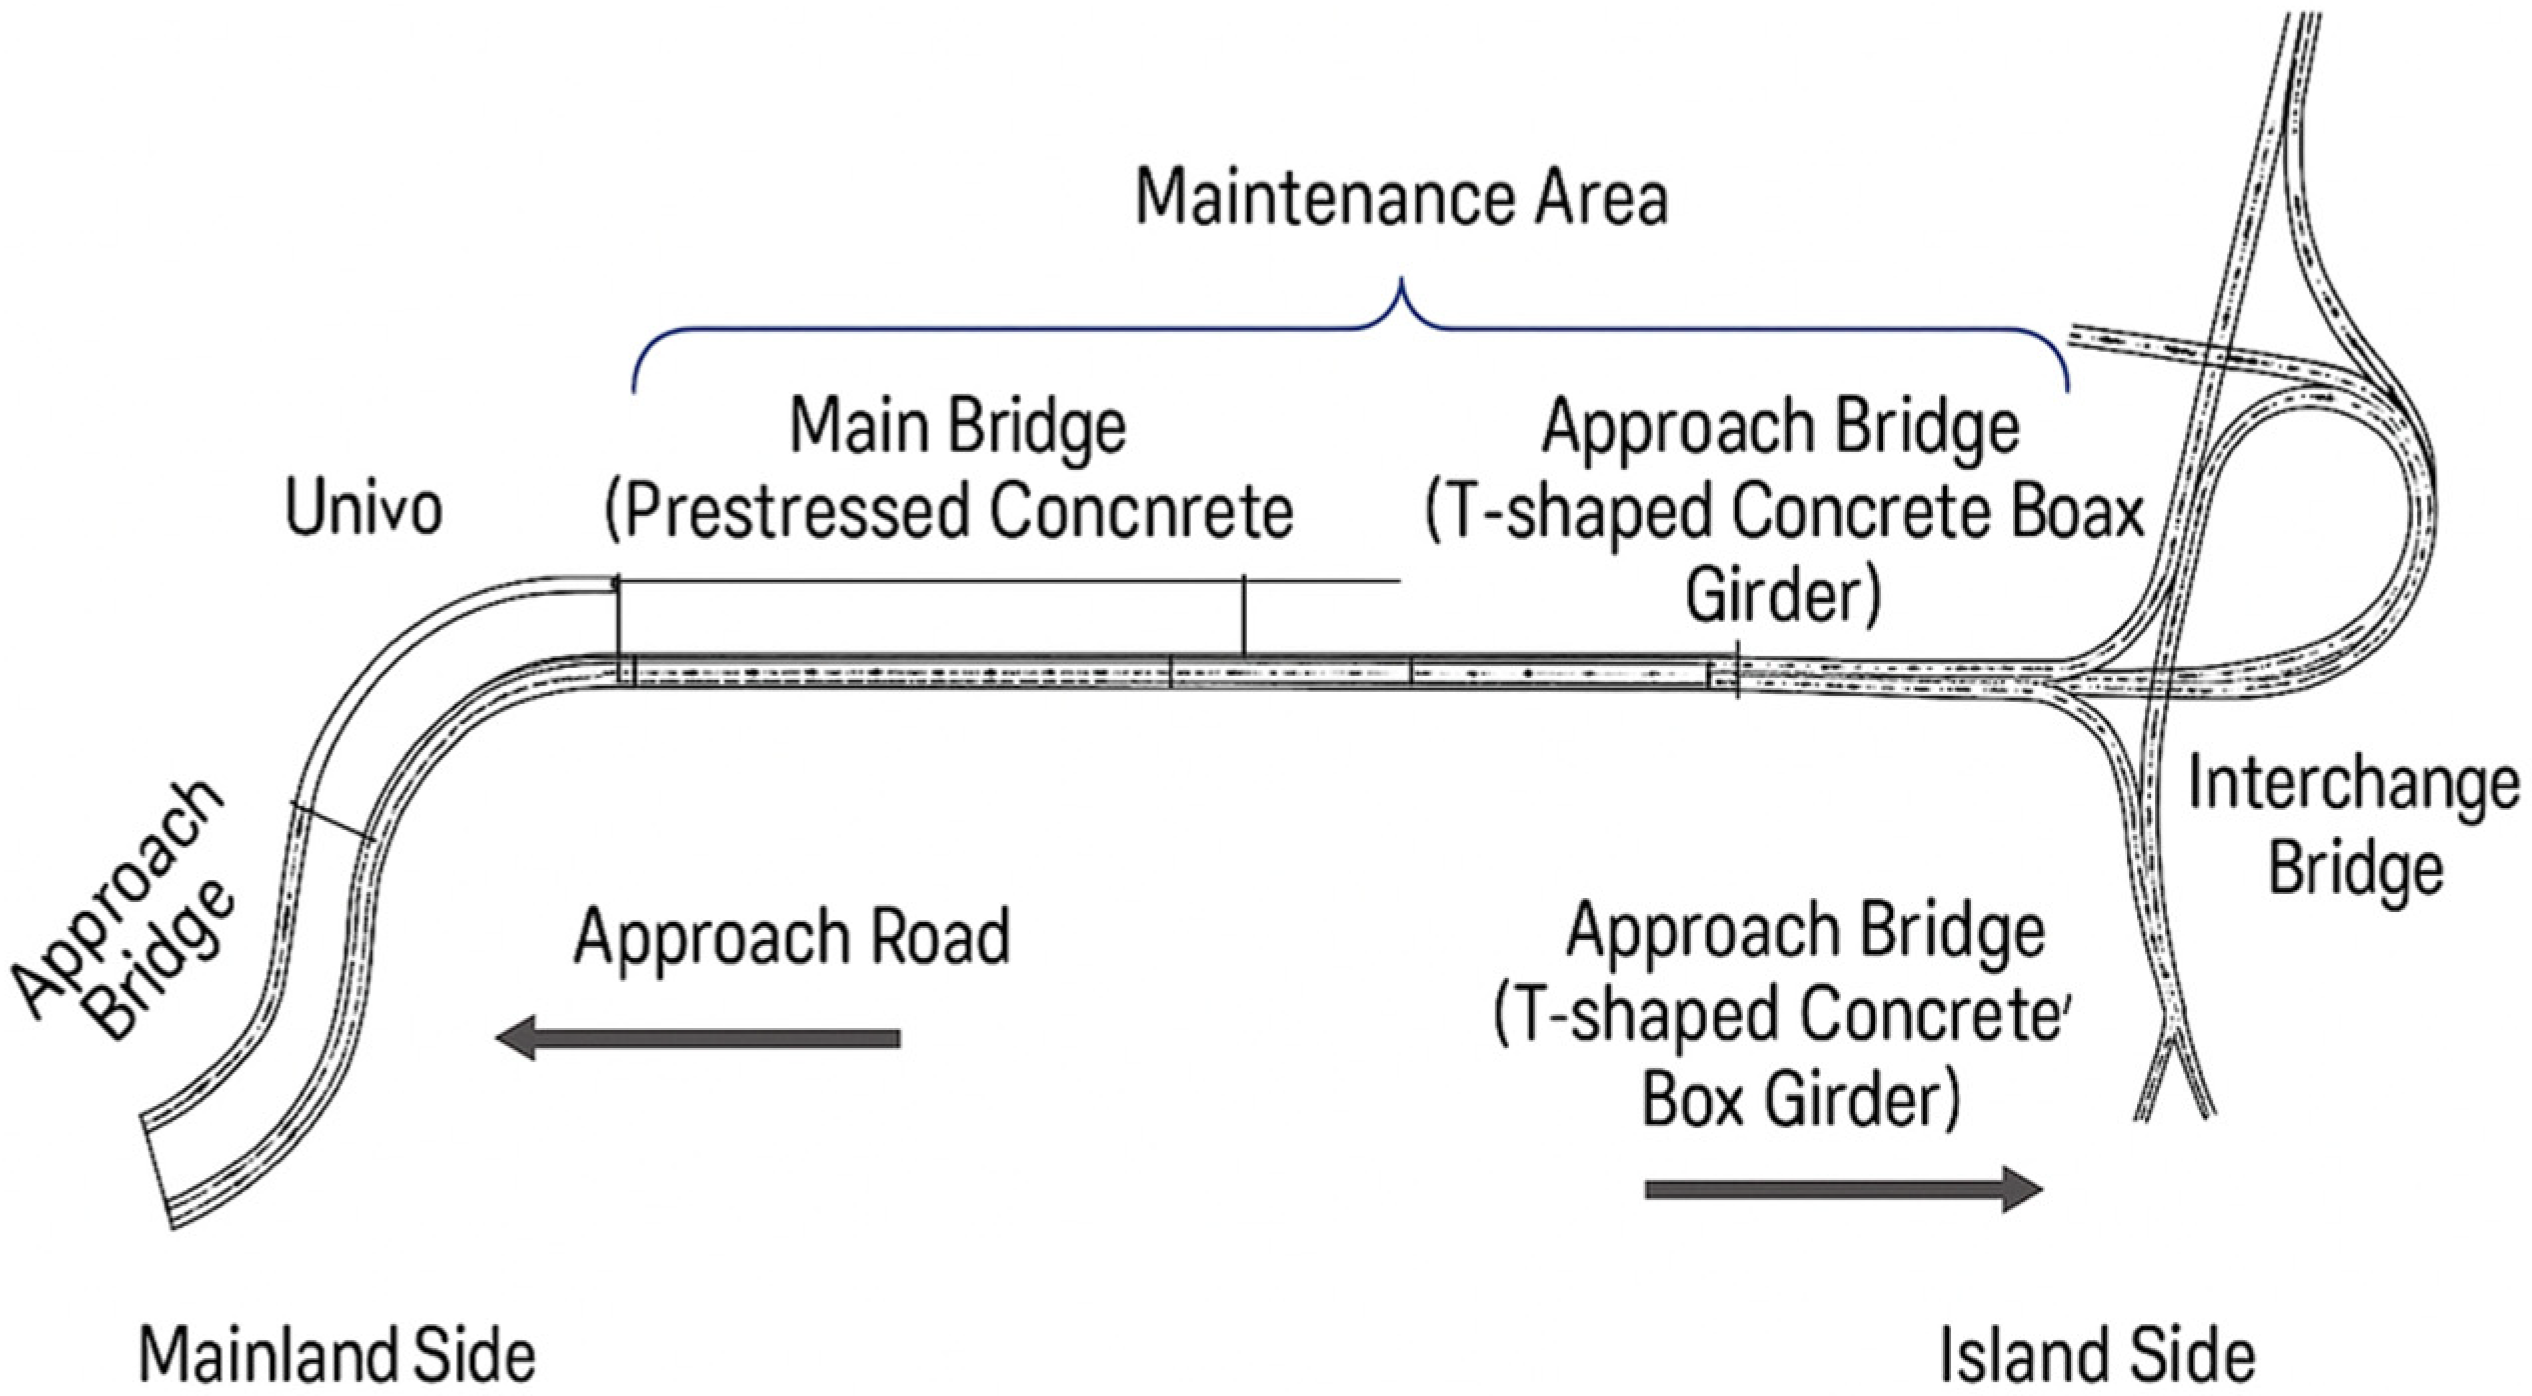
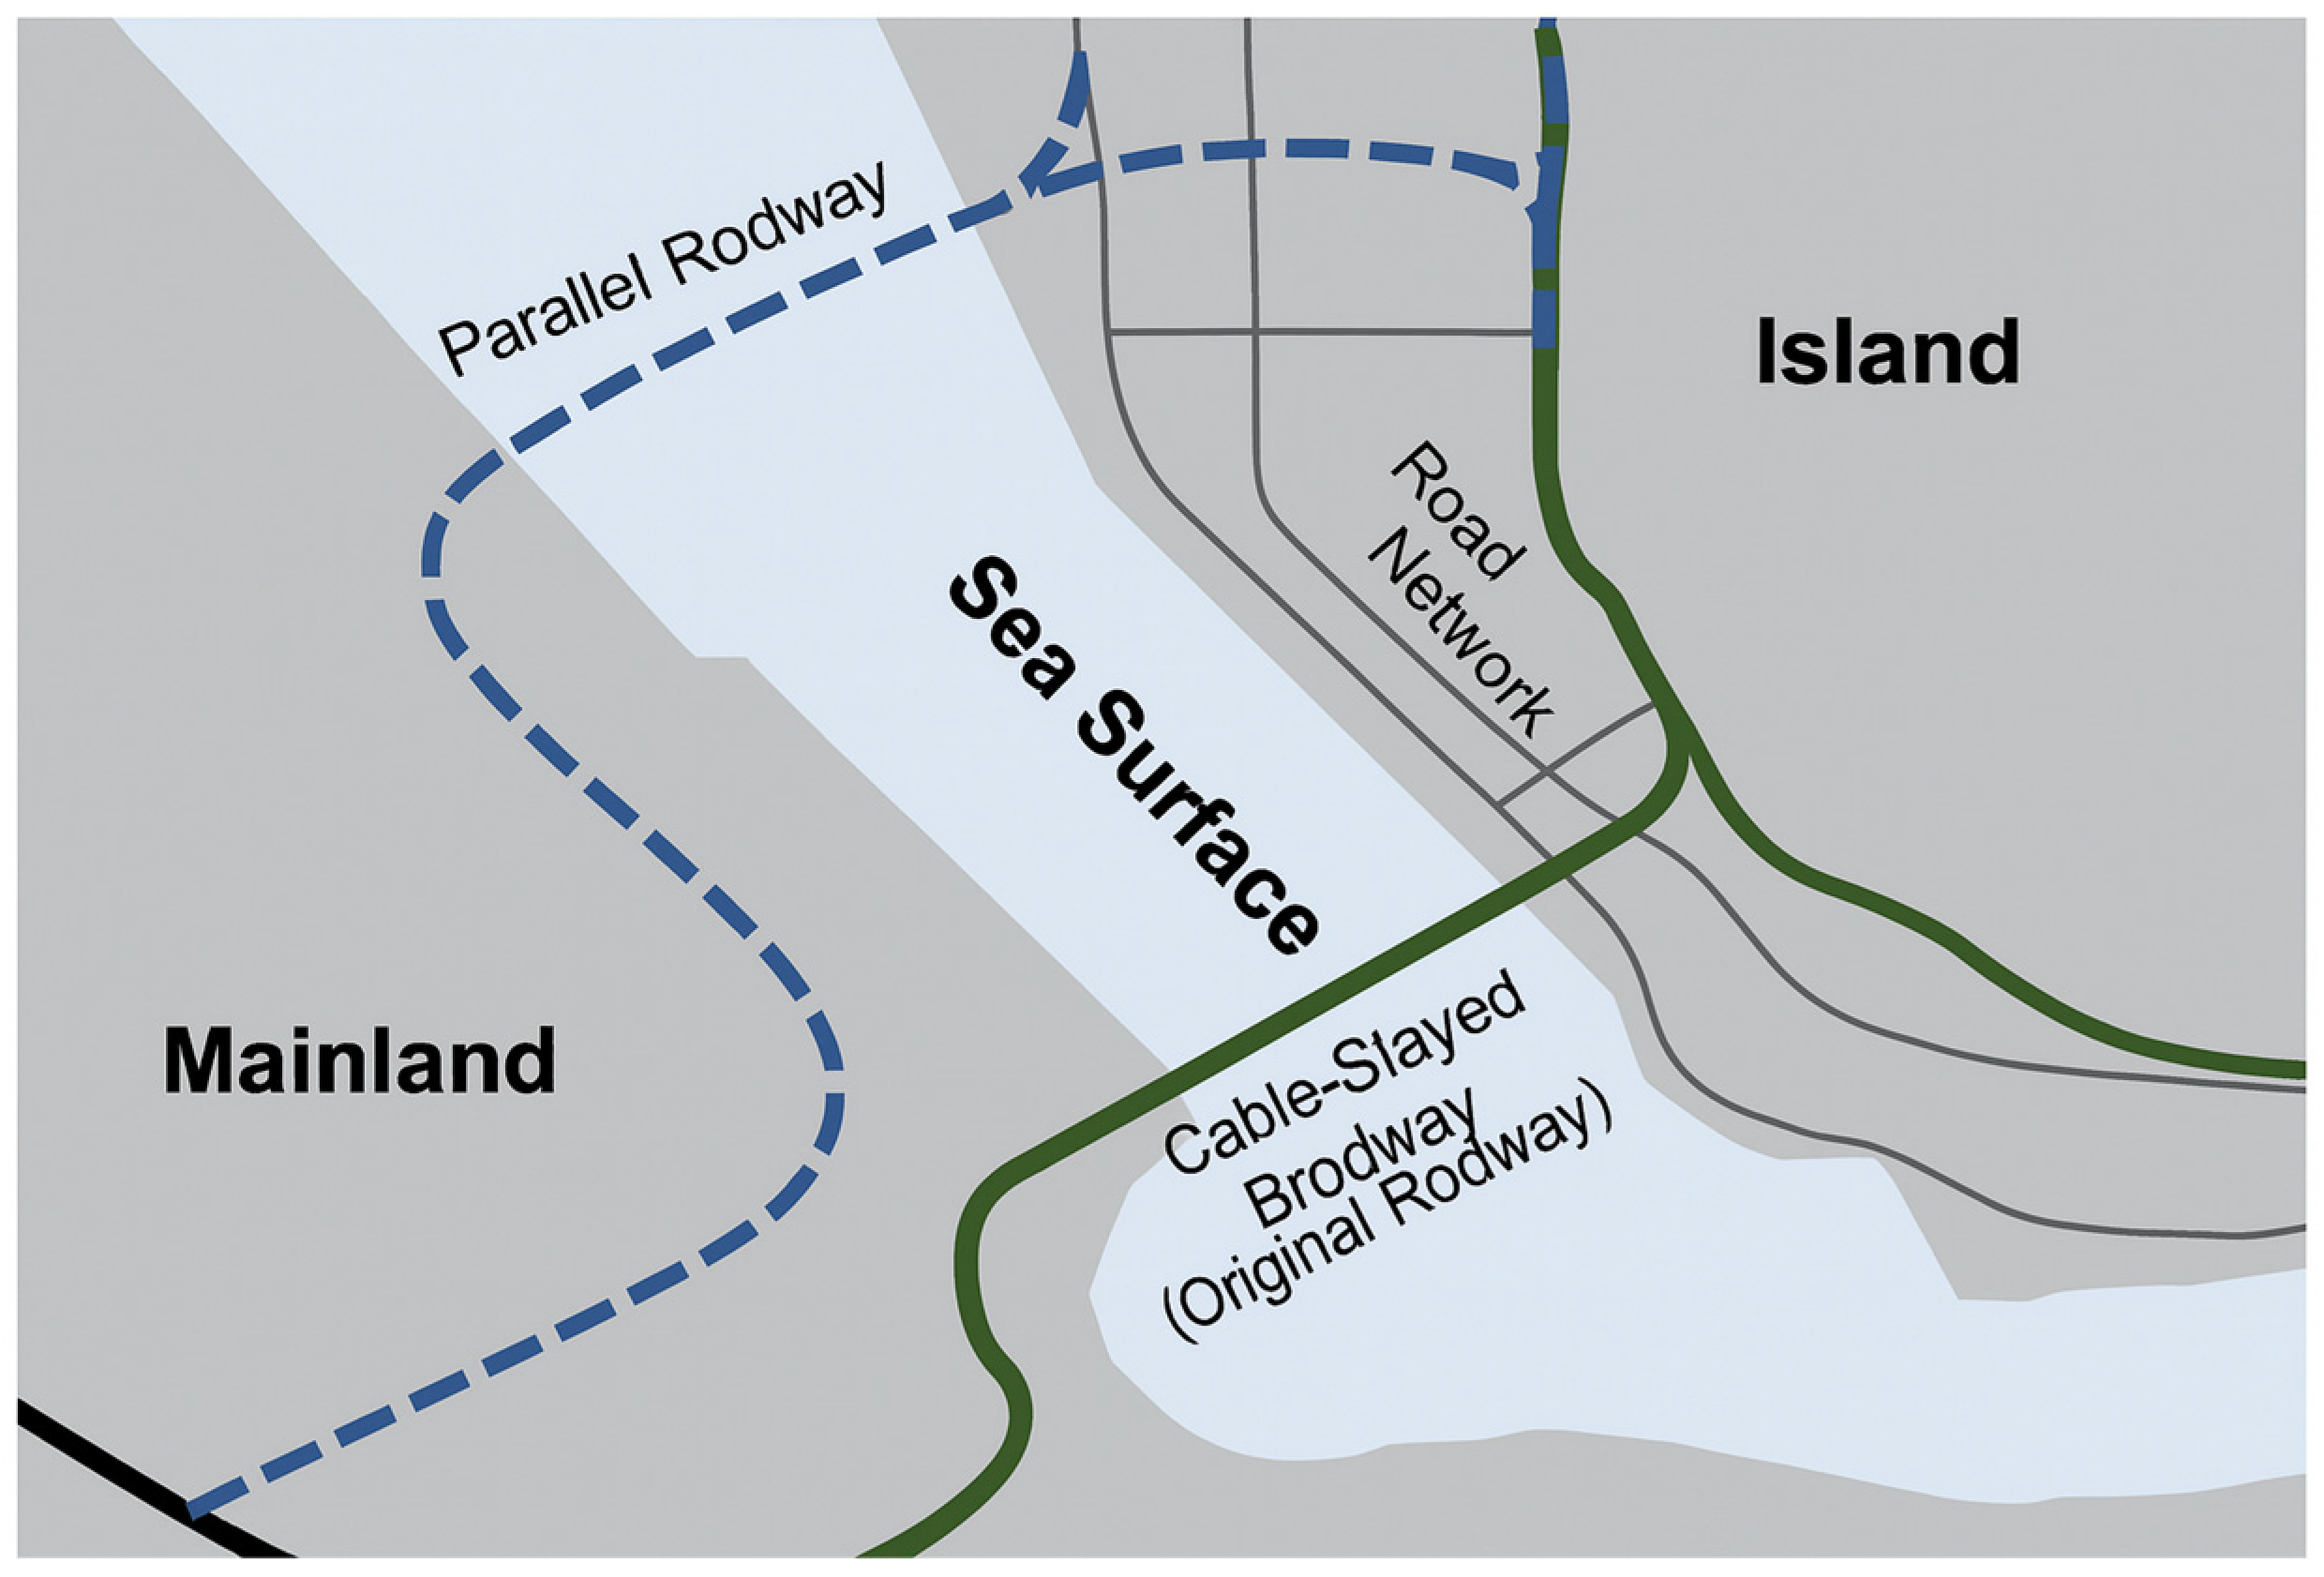
The case study was conducted on a cross-sea bridge located in coastal Zhejiang Province, connecting the mainland to an offshore island. The bridge, comprising a mainland viaduct, main bridge, and island interchange—as depicted in Figure 11—was subjected to a one-year systematic maintenance after fifteen years of service. The maintenance activities, extending over 3.79 km of the main bridge and connecting lines, encompassed protective epoxy coating application, deck repairs, expansion device renewal, and upgrades to ancillary facilities. During this period, a half-lane closure was enforced, speed limits were reduced from 60 km/h to 30 km/h, and approximately 40% of the traffic flow was diverted via a nearby bridge, resulting in a 4.4 km detour as shown in Figure 12. Daily traffic volume decreased from 11,736 vehicles prior to maintenance to approximately 6900 vehicles during construction. The maintenance project, with a total cost of approximately 34.3571 million yuan, was situated in a non-commercial area with available alternative routes and primarily impacted key stakeholder groups, including construction workers, traffic users, and public management institutions.
The estimation of the social cost parameters in this study was based not only on traffic flow data obtained from the project’s feasibility report but also on official statistics collected at both national and regional levels. Data sources have included national statistical publications, such as the China Statistical Yearbook and the China Labor Statistical Yearbook, both compiled by the National Bureau of Statistics. Additionally, specialized reports have been referenced, including the Ministry of Transport’s Statistical Bulletin on the Development of the Transportation Industry and the National Health Commission’s Statistical Bulletin on the Development of the Health and Wellness Sector. Regional economic data retrieved from the Zhejiang Government Service Portal have been incorporated as supplementary inputs. Detailed parameter values alongside their corresponding data sources are presented in Table 8.
It has been revealed that the bridge maintenance and repair project imposes a significant socioeconomic burden. The total social cost, as detailed in Table 9, has been calculated to amount to 62.2381 million yuan, substantially exceeding the direct economic cost of 34.3571 million yuan, yielding a ratio of approximately 1.8:1. Notably, 92% of the social cost has been attributed to traffic delays, primarily resulting from time losses experienced by drivers and passengers, as well as reduced cargo transport efficiency. This finding underscores the central role of road users as the primary stakeholder group. To mitigate such impacts, the adoption of modular rapid construction technologies, implementation of off-peak work schedules, and prioritization of high-performance building materials to extend the maintenance cycle are recommended.
Moreover, although construction safety risks are considered controllable, with an accident probability of 0.12%, it has been estimated—based on China’s construction industry fatality rate of 1.58 persons per accident—that a single accident could lead to social and economic losses approximating 7.25 million yuan. Therefore, enhancement of safety protection systems is deemed essential. Beyond conventional protective equipment, the installation of engineering controls, such as fully enclosed operation channels and intelligent monitoring and warning devices, is advised. Additionally, immersive safety training employing virtual reality technology is recommended to address human-factor accident risks proactively at their source.

4.4. Sensitivity Analysis of Social Cost Parameters

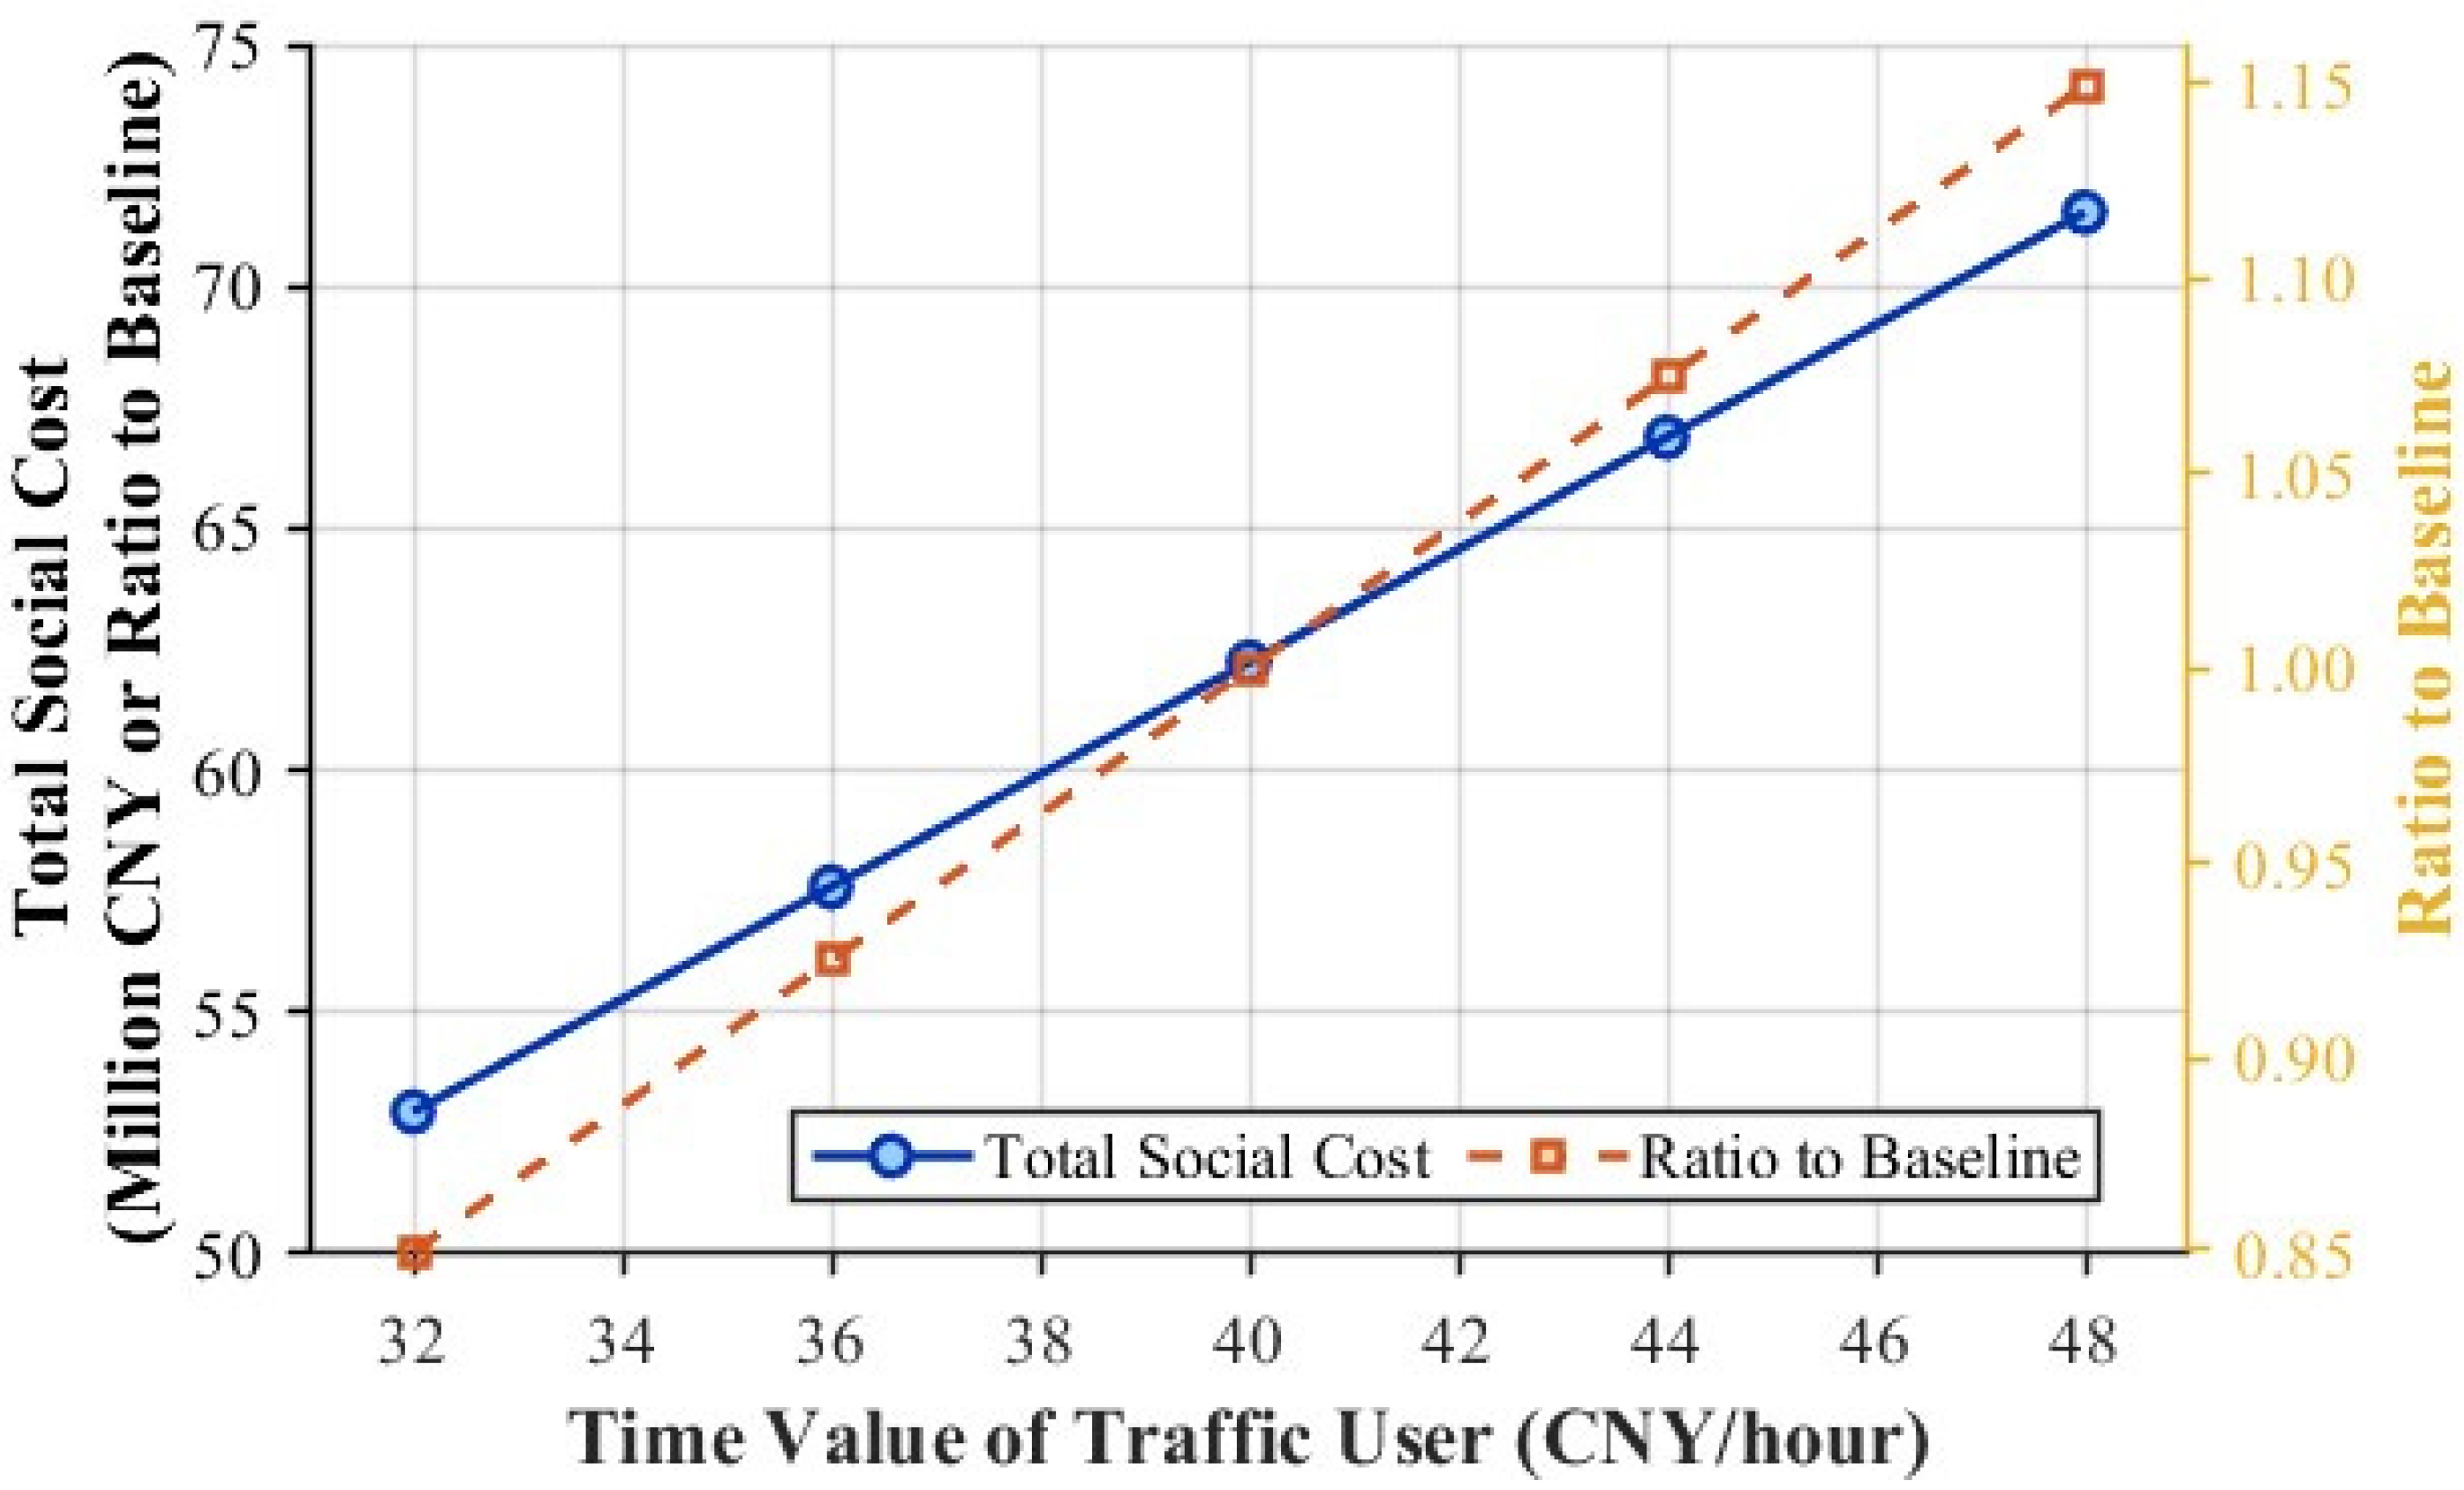
The time value of traffic user (TTV) from the case study project was adopted as the key sensitive parameter for social cost analysis. The TTV reflects the indirect economic losses caused by traffic delays, and its estimation exhibits regional and temporal variability, significantly impacting social cost evaluation results. Using the case study project as the baseline, the TTV was varied by ±20% around the baseline value (40 RMB/hour), resulting in a range of 32 to 48 yuan/hour. Traffic delay costs and total social costs were calculated for different scenarios accordingly.
The results indicate that for every 4 yuan/hour increase in the TTV, the total social cost rises by approximately 6.7%. When the TTV increases from 32 yuan/hour to 48 yuan/hour, the total social cost fluctuates by up to 28% relative to the baseline. The sensitivity analysis outcomes are presented in Table 10 and Figure 13, highlighting the necessity for careful consideration of the scientific validity and dynamic adjustment of TTV values in practical engineering evaluations, thereby enhancing the accuracy and robustness of social cost assessments.

5. Conclusions

The traditional economic cost framework has been expanded by embedding life cycle cost analysis (LCCA) within environmental and social dimensions, thereby resulting in the development of a sustainability-oriented, integrated life cycle cost model. On the environmental front, a source-specific accounting system has been introduced, alongside a novel multi-factor metric that captures the contributions of energy, materials, and equipment during construction. On the social front, a hierarchical evaluation mechanism grounded in stakeholder theory has been established, yielding differentiated indicator sets tailored to each stakeholder group. The primary findings of this study are summarized as follows:
(1)
From a life cycle perspective, the economic cost structure of engineering structures has been systematically deconstructed through the division of the life cycle cost (LCC) framework into five sequential phases, namely planning and decision making, construction and implementation, inspection and maintenance, repair and strengthening, and decommissioning and recycling. Input elements involved in each critical stage have been comprehensively captured. By introducing a dynamic discount factor, a time-varying discount model has been developed to address challenges associated with adjusting the time value of money in traditional cost accounting. This has facilitated accurate normalization and comprehensive integration of cash flows across all life cycle phases.
(2)
From the standpoint of ecosystem services, environmental externalities resulting from engineering activities have been analyzed in terms of the negative effects of pollutant emissions across atmospheric, aquatic, and soil media on public health, biodiversity, climate regulation, and habitat quality. Methodologically, a resource–environment correlation model has been established based on life cycle inventory (LCI) data. Material flow analysis (MFA) has been employed to quantify the relationships between engineering inputs—such as construction material usage and energy consumption—and corresponding environmental impact coefficients. It has been noted that both pollution prevention cost rates and environmental damage cost rates exhibit significant variability, attributable to spatiotemporal heterogeneity and the regional sensitivity of pollutant toxicity. Notably, the population density of receptor areas has been identified as a key factor directly influencing the accuracy of environmental damage assessments.
(3)
The social impacts of engineering activities were represented through cost components associated with construction workers—including medical expenses, income loss, and psychological distress, as well as traffic-related effects, assessed by indicators, such as changes in traffic accident rates, increases in travel time, logistics delays, and additional fuel consumption by motor vehicles. Community-level impacts due to prolonged reductions in traffic accessibility and noise pollution during construction were quantified via economic indicators encompassing reduced business revenue, real estate depreciation, and diminished labor productivity. For public administrative agencies, accounting frameworks primarily included administrative expenditures related to accident response and revenue losses from roadside parking.
(4)
Based on empirical investigations and parameter calibration, a database of key social cost factors has been established, and a representative coastal bridge maintenance project has been selected for multidimensional impact assessment. Quantitative analysis has revealed that social externalities induced by project implementation bear significant economic implications, with socioeconomic losses arising from reduced traffic efficiency identified as the dominant component. Accordingly, a spatiotemporal optimization strategy has been proposed, recommending the adoption of rapid construction techniques or time-phased operational plans for infrastructure maintenance activities within high traffic-sensitivity zones. By reducing construction windows and implementing staggered scheduling, overall social benefits are expected to be maximized.

6. Limitation and Future Research Work

Although this study proposes an integrated framework for evaluating economic, environmental, and social costs across the life cycle of engineering structures, the acquisition of model parameters still mainly relies on case studies and public statistical data, which may limit regional applicability and representativeness. In addition, some indirect social impacts (such as mental health effects and long-term community disturbances) have not yet been quantitatively assessed.
Future research should focus on empirical studies across multiple regions and project types to enrich the database of key parameters, thereby improving the universality and precision of the model. It is also recommended to incorporate big data and artificial intelligence technologies to enable dynamic monitoring and quantitative assessment of social impacts, thus providing more robust scientific support for sustainability-oriented decision making in structural engineering.

Author Contributions

Conceptualization, W.J.; methodology, B.L.; software, K.J. and Z.W.; formal analysis, K.J.; resources, K.J. and K.W.; writing—original draft preparation, K.W.; writing—review and editing, Z.W.; supervision, B.L.; funding acquisition, W.J. All authors have read and agreed to the published version of the manuscript.

Funding

This work is funded by the National Natural Science Foundation of China (NSFC Grant Nos. 51820105012 and 52178176).

Data Availability Statement

The data used to support the findings of this study are included in the article.

Conflicts of Interest

Author Kexian Wu was employed by the company Zhejiang Institute of Communications Co., Ltd. and Author Zhujun Wang was employed by the company Shanghai Construction No. 2 (Group) Co., Ltd. The remaining authors declare that the research was conducted in the absence of any commercial or financial relationships that could be construed as a potential conflict of interest.

Appendix A

(1)
Medical costs
An engineering application model for estimating these costs can be derived by combining the annual work injury incidence rate with the benchmark cost per medical case. Its mathematical expression is as follows:
C m e d = ( λ × T × φ w × S d × R m ) / 10 6 · t c
where C m e d is the budgeted value of the medical cost; λ is the benchmark incidence rate of work-related injuries (times per million working hours, using historical statistical data); it is the annual on-the-job personnel hours (total working hours = Number of workers × 2000 h/person·year); T is the weight coefficient of the severity of injury (with a value range of 1.0–5.0, referring to the AIS trauma classification standard); φ w is the single-case standard medical treatment cost (including the three stages of emergency, where S d is the hospitalization and rehabilitation, priced according to the regional medical insurance directory); R m is the correction coefficient of regional medical costs (determined based on the regional difference index in the Health Statistics Yearbook); t c is the duration of the construction project.
(2)
Economic Losses
Economic loss is a human capital valuation model based on the discounted cash flow theory, and its mathematical expression is as follows:
C i n c o m e = [ λ d × ω d × ( T r T i ) × γ w × 365 ] × D a v g · t c
where C i n c o m e is the economic loss of construction workers; λ d represents the average daily number of work-related deaths; ω d is the benchmark value of the average daily salary for the position (median salary of the industry in the region/250 days); T r is the legal retirement age (determined according to the current social security policy); T i is the average age of casualties at the time of the accident (statistics from the human resources and social security department); γ w is the conversion rate of working days (actual working days/365); D a v g is the labor capacity attenuation index (0 ≤ D ≤ 1, graded and quantified according to the GB/T 16180 [63] disability assessment standard).
(3)
Psychological damage
Non-material losses resulting from occupational injuries can be quantified through multiple methodologies. In legal practice, a coefficient for mental damage compensation is typically determined via case-law precedents—for instance, values of 0.3 for the construction industry [64] and ranging from 5.2% to 27.5% for the transportation industry [65]—with the coefficient being proportional to direct costs, such as medical treatment and lost income. The willingness-to-pay approach is employed to construct the value of a statistical life (VSL), wherein the life value magnitude is estimated by integrating parameters including the social welfare elasticity coefficient and national life expectancy. Various international standard systems adopt differing approaches to measure such losses; for example, the EU’s HEATCO guide [66] sets the mental loss attributable to severe disability at 13% of the VSL, whereas the World Bank recommends the use of the implicit cost of preventing a single death (ICAF) as the evaluation benchmark for infrastructure projects.
According to the EU HEATCO guide, the loss from psychological damage can be estimated as follows:
C m e n t a l = ( λ d + 0.13 · λ i n j ) · V S L · t c
where C m e n t a l is the mental loss of construction workers; λ i n j is the average daily number of work-related injuries.
(4)
N r t a r covers the additional accidents from traffic flow changes due to construction-related route diversions and the continuous operation of restricted-access road sections. It can be calculated as follows:
N r t a r = r t a · L · ρ d a · A D T + r t n · D · ( 1 ρ d a ) · A D T λ d , t r a = r d · N r t a r λ i n j , t r a = r i n j · N r t a r
where r t a is the extra accident rate near construction sites; L is the road length affected by construction; ρ d a is the percentage of vehicles passing through the construction road during lane closure, and ( 1 ρ d a ) is the percentage choosing detours; ADT is the average daily traffic; r t n is the vehicle accident rate under normal driving conditions (accidents per vehicle-kilometer); D is the detour route length; λ d , t r a and λ i n j , t r a are the average daily fatalities and injuries among traffic users, respectively; r d and r i n j are the fatality and injury rates per road accident, respectively.

References

  1. Omidian, P.; Khaji, N.; Aghakouchak, A.A. An integrated decision-making approach to resilience–LCC Bridge network retrofitting using a genetic algorithm-based framework. Resilient Cities Struct. 2025, 4, 16–40. [Google Scholar] [CrossRef]
  2. Mostafaei, H.; Ashoori Barmchi, M.; Bahmani, H. Seismic Resilience and Sustainability: A Comparative Analysis of Steel and Reinforced Structures. Buildings 2025, 15, 2075–5309. [Google Scholar] [CrossRef]
  3. Weidema, B.P. The integration of economic and social aspects in life cycle impact assessment. Int. J. Life Cycle Assess 2006, 11, 89–96. [Google Scholar] [CrossRef]
  4. Frangopol, D.M.; Dong, Y.; Sabatino, S. Bridge life-cycle performance and cost: Analysis, prediction, optimisation and decision-making. Struct. Infrastruct. Eng. 2017, 13, 1239–1257. [Google Scholar] [CrossRef]
  5. Dong, Y.; Frangopol, D.M. Performance-based seismic assessment of conventional and base-isolated steel buildings including environmental impact and resilience. Earthq. Eng. Struct. Dyn. 2016, 45, 739–756. [Google Scholar] [CrossRef]
  6. Lundie, S.; Peters, G.M.; Beavis, P.C. Life cycle assessment for sustainable metropolitan water systems planning. Environ. Sci. Technol. 2004, 38, 3465–3473. [Google Scholar] [CrossRef]
  7. Mithraratne, N.; Vale, B. Life cycle analysis model for New Zealand houses. Build. Environ. 2004, 39, 483–492. [Google Scholar] [CrossRef]
  8. Verbeeck, G.; Hens, H. Life cycle inventory of buildings: A contribution analysis. Build. Environ. 2010, 45, 964–967. [Google Scholar] [CrossRef]
  9. Dong, Y.; Frangopol, D.M.; Saydam, D. Pre-earthquake multi-objective probabilistic retrofit optimization of bridge networks based on sustainability. J. Bridge Eng. 2014, 19, 04014018. [Google Scholar] [CrossRef]
  10. Dong, Y.; Frangopol, D.M.; Saydam, D. Sustainability of highway bridge networks under seismic hazard. J. Earthq. Eng. 2014, 18, 41–66. [Google Scholar] [CrossRef]
  11. García-Segura, T.; Yepes, V.; Frangopol, D.M.; Yang, D.Y. Lifetime reliability-based optimization of post-tensioned box-girder bridges. Eng. Struct. 2017, 145, 381–391. [Google Scholar] [CrossRef]
  12. Jebelli, S.T.; Behnam, B. Intelligent Life Cycle Cost-Based Framework for Seismic Design of Conventional Structures. Buildings 2024, 14, 2597. [Google Scholar] [CrossRef]
  13. Ping, B.; Fang, C.; Hu, Y.; Yu, S. Life-cycle cost assessment of conventional and self-centering steel frames in seismic zones, An extra focus on environmental impacts. Eng. Struct. 2025, 325, 119393. [Google Scholar] [CrossRef]
  14. Kendall, A.; Keoleian, G.A.; Helfand, G.E. Integrated life-cycle assessment and life-cycle cost analysis model for concrete bridge deck applications. J. Infrastruct. Syst. 2008, 14, 214–222. [Google Scholar] [CrossRef]
  15. Al-Kabaha, Y.; Bataineh, K.; Aburabi, E.M. Multi-objective optimization of energy consumption, cost and emission for a residential building. Heliyon 2025, 11, e42139. [Google Scholar] [CrossRef]
  16. Dervishaj, A.; Gudmundsson, K. From LCA to circular design: A comparative study of digital tools for the built environment. Resour. Conserv. Recycl. 2024, 200, 19. [Google Scholar] [CrossRef]
  17. Boje, C.; Menacho, Á.J.H.; Marvuglia, A.; Benetto, E.; Kubicki, S.; Schaubroeck, T.; Gutiérrez, T.N. A framework using BIM and digital twins in facilitating LCSA for buildings. J. Build. Eng. 2023, 76, 107232. [Google Scholar] [CrossRef]
  18. Guerriero, A.; Busio, F.; Boje, C.; Mack, N. Combining Building Information Model and Life Cycle Assessment for Defining Circular Economy Strategies. Sustainability 2024, 16, 4561. [Google Scholar] [CrossRef]
  19. Alhadi, A.; Tom, B.D.; Yacine, R. Enhancing asset management, Integrating digital twins for continuous permitting and compliance—A systematic literature review. J. Build. Eng. 2025, 99, 111515. [Google Scholar] [CrossRef]
  20. Senthil Kumaran, D.; Ong, S.K.; Tan, R.B.H.; Nee, A.Y.C. Environmental Life Cycle Cost Analysis of Products. Environ. Manag. Health 2001, 12, 260–276. [Google Scholar] [CrossRef]
  21. Gluch, P.; Baumann, H. The Life Cycle Costing (LCC) Approach: A Conceptual Discussion of Its Usefulness for Environmental Decision-Making. Build. Environ. 2004, 39, 571–580. [Google Scholar] [CrossRef]
  22. Spitzer, M.; Pojasek, R.; Robertaccio, F.L.; Nelson, J. An Introduction to Environmental Accounting as a Business Management Tool: Key Concepts and Terms; US Environmental Protection Agency, Office of Pollution Prevention and Toxics: Washington, DC, USA, 1995. [Google Scholar]
  23. Beaver, E. LCA and Total Cost Assessment. Environ. Prog. 2000, 19, 130–139. [Google Scholar] [CrossRef]
  24. Spitzer, M.; Pojasek, R.; Robertaccio, F.L.; Nelson, J. Accounting and Capital Budgeting for Pollution Prevention. In Proceedings of the Engineering Foundation Conference, San Diego, CA, USA, 24–29 January 1993. [Google Scholar]
  25. Global Environmental Management Initiative. Finding Cost-Effective Pollution Prevention Initiatives: Incorporating Environmental Costs into Business Decision Making—A Primer. In Spring Conference Proceedings; Global Environmental Management Initiative-Gemi: Washington, DC, USA, 2004. [Google Scholar]
  26. US EPA. Pollution Prevention Benefits Manual; EPA’s NCEE Economic Reports; U.S. Environmental Protection Agency: Washington, DC, USA, 1989. [Google Scholar]
  27. Keoleian, G.A.; Kendall, A.; Dettling, J.E.; Smith, V.M.; Chandler, R.F.; Lepech, M.D.; Li, V.C. Life Cycle Modeling of Concrete Bridge Design: Comparison of Engineered Cementitious Composite Link Slabs and Conventional Steel Expansion Joints. J. Infrastruct. Syst. 2005, 11, 51–60. [Google Scholar] [CrossRef]
  28. Klüppel, H.J. ISO 14041: Environmental Management–Life Cycle Assessment–Goal and Scope Definition–Inventory Analysis. Int. J. LCA 1998, 3, 301. [Google Scholar] [CrossRef]
  29. Wu, K. Life-Cycle Design and Optimization for Concrete Structures Based on Reliability and Sustainability. Ph.D. Thesis, Zhejiang University, Hangzhou, China, 2022. (In Chinese). [Google Scholar] [CrossRef]
  30. Seigneur, C. Air pollution: Current challenges and future opportunities. AIChE J. 2005, 51, 356–364. [Google Scholar] [CrossRef]
  31. Gregg, R.T. Development Document for Proposed Effluent Limitations Guidelines and New Source Performance Standards for the Textile, Friction Materials and Sealing Devices Segment of the Asbestos Manufacturing Point Source Category; US Environmental Protection Agency: Washington, DC, USA, 1974. [Google Scholar]
  32. Meng, T.; Shan, X.; Ren, Z.; Deng, Q. Analysis of Influencing Factors on Solid Waste Generation of Public Buildings in Tropical Monsoon Climate Region. Building 2024, 14, 513. [Google Scholar] [CrossRef]
  33. Donoso, M.C.; Vargas, N.M. Water interactions with energy, environment, food, and agriculture. Interact. Food Agric. Environ. 2002, 1, 348. [Google Scholar]
  34. Wang, Z. An Improved Life-Cycle Design Theory of Engineering Structures and Its Life-Cycle Cost Model. Ph.D. Thesis, Zhejiang University, Hangzhou, China, 2018. (In Chinese). [Google Scholar] [CrossRef]
  35. Hunkeler, D.; Lichtenvort, K.; Rebitzer, G. Environmental Life Cycle Costing; CRC Press: Boca Raton, FL, USA, 2008. [Google Scholar]
  36. Anderson, R.C. The United States Experience with Economic Incentives for Protecting the Environment; Environmental Protection Agency: Washington, DC, USA, 2001. [Google Scholar]
  37. Schneider, A.M. An Effluent Fee Schedule for Air Pollutants Based on Pindex. J. Air Pollut. Control Assoc. 1973, 23, 486–489. [Google Scholar] [CrossRef]
  38. Brown, K.A.; Holland, M.R.; Boyd, R.A.; Thresh, S.; Jones, H.; Ogilvie, S.M. Economic Evaluation of PVC Waste Management; Report No. EPCS/20725; AEA Technology: Oxford, UK, 2000. [Google Scholar]
  39. Mehan, G.T.; Grubbs, G.H.; Frace, S.E.; Anderson, D.F.; Anderson, W.; Jett, G.; Freeman, J.L. Development Document for Final Effluent Limitations Guidelines and Standards for the Iron and Steel Manufacturing Point Source Category; US Environmental Protection Agency: Washington, DC, USA, 2002. [Google Scholar]
  40. Helmer, R.; Ivanildo, H. Water Pollution Control: A Guide to the Use of Water Quality Management Principles; CRC Press: Boca Raton, FL, USA, 1997. [Google Scholar]
  41. Li, Z. A New Life Cycle Impact Assessment Approach for Buildings. Build. Environ. 2006, 41, 1414–1422. [Google Scholar] [CrossRef]
  42. CEWEP. Landfill Taxes and Ban; CEWEP: Brussels, Belgium, 2017. [Google Scholar]
  43. GOV. UK. Landfill Tax: Rates, Exemptions and Taxable Activities; GOV. UK.: London, UK, 2017. [Google Scholar]
  44. Huntzinger, D.N.; Eatmon, T.D. A Life-Cycle Assessment of Portland Cement Manufacturing: Comparing the Traditional Process with Alternative Technologies. J. Clean. Prod. 2009, 17, 668–675. [Google Scholar] [CrossRef]
  45. Van Den Heede, P.; De Belie, N. Environmental Impact and Life Cycle Assessment (LCA) of Traditional and ‘Green’ Concretes: Literature Review and Theoretical Calculations. Cem. Concr. Compos. 2012, 34, 431–442. [Google Scholar] [CrossRef]
  46. IPCC NGGIP. Emission Factor Database; IPCC NGGIP: Hayama, Japan, 2021. [Google Scholar]
  47. Costa, M.M.; Schaeffer, R.; Worrell, E. Exergy Accounting of Energy and Materials Flows in Steel Production Systems. Energy 2001, 26, 363–384. [Google Scholar] [CrossRef]
  48. Puettmann, M.E.; Wilson, J.B. Life-Cycle Analysis of Wood Products: Cradle-to-Gate LCI of Residential Wood Building Materials. Wood Fiber Sci. 2005, 37, 18–29. [Google Scholar]
  49. Kato, N.; Akimoto, H. Anthropogenic Emissions of SO2 and NOx in Asia: Emission Inventories. Atmos. Environ. Part A Gen. Top. 1992, 26, 2997–3017. [Google Scholar] [CrossRef]
  50. US EPA. Emission Factors for Greenhouse Gas Inventories; U.S. Environmental Protection Agency: Washington, DC, USA, 2015. [Google Scholar]
  51. Kuhns, H.D.; Mazzoleni, C.; Moosmüller, H.; Nikolic, D.; Keislar, R.E.; Barber, P.W.; Li, Z.; Etyemezian, V.; Watson, J.G. Remote Sensing of PM, NO, CO and HC Emission Factors for on-Road Gasoline and Diesel Engine Vehicles in Las Vegas, NV. Sci. Total Environ. 2004, 322, 123–137. [Google Scholar] [CrossRef]
  52. Raheman, H.; Phadatare, A.G. Diesel Engine Emissions and Performance from Blends of Karanja Methyl Ester and Diesel. Biomass Bioenergy 2004, 27, 393–397. [Google Scholar] [CrossRef]
  53. Wu, K.; Yang, D.Y.; Frangopol, D.M.; Jin, W. Multi-Stakeholder Framework for Assessing the Life-Cycle Social Cost of Construction Projects. Struct. Infrastruct. Eng. 2022, 18, 129–144. [Google Scholar] [CrossRef]
  54. Dong, Y.H.; Ng, S.T. A Life Cycle Assessment Model for Evaluating the Environmental Impacts of Building Construction in Hong Kong. Build. Environ. 2015, 89, 183–191. [Google Scholar] [CrossRef]
  55. Tang, S.L.; Chan, S.S.K.; Saram, D.D.D.; Kwong, L.H. Costs of Construction Accidents in the Social and Humanity Context—A Case Study in Hong Kong. HKIE Trans. 2007, 14, 35–42. [Google Scholar] [CrossRef]
  56. Wijnen, W.; Stipdonk, H. Social Costs of Road Crashes: An International Analysis. Accid. Anal. Prev. 2016, 94, 97–106. [Google Scholar] [CrossRef] [PubMed]
  57. Matthews, J.; Allouche, E. A social cost calculator for utility construction projects. N. Am. Soc. Trenchless Technol. 2010, 3, F-4. [Google Scholar]
  58. Road Safety Guidelines for the Asian and Pacific Region; Asian Development Bank: Manila, Philippines, 2003.
  59. Matthews, J.C.; Allouche, E.N.; Sterling, R.L. Social Cost Impact Assessment of Pipeline Infrastructure Projects. Environ. Impact Assess. Rev. 2015, 50, 196–202. [Google Scholar] [CrossRef]
  60. Yang, Z. Theory, Methods and Practice Research on Life Value Assessment. Master’s Dissertation, Jiangsu University, Zhenjiang, China, 2010. (In Chinese). [Google Scholar]
  61. FHWA Work Zone Facts and Statistics: Work Zone Safety; U.S. Federal Highway Administration: Washington, DC, USA, 2017.
  62. Tefft, B.C. Rates of Motor Vehicle Crashes, Injuries and Deaths in Relation to Driver Age, United States, 2014–2015; AAA Foundation for Traffic Safety: Washington, DC, USA, 2017. [Google Scholar]
  63. GB/T 16180-2014; Classification and Grading Criteria of Disability. General Administration of Quality Supervision, Inspection and Quarantine of the People’s Republic of China/Standardization Administration of the People’s Republic of China: Beijing, China, 2014.
  64. Darshi De Saram, D.; Tang, S.L. Pain and Suffering Costs of Persons in Construction Accidents: Hong Kong Experience. Constr. Manag. Econ. 2005, 23, 645–658. [Google Scholar] [CrossRef]
  65. Ismail, M.A.; Abdelmageed, S.M. Cost of road traffic accidents in Egypt. World Acad. Sci. Eng. Technol. 2010, 42, 1308–1314. [Google Scholar] [CrossRef]
  66. Bickel, P.; Friedrich, R.; Burgess, A.; Fagiani, P.; Hunt, A.; Jong, G.D.; Laird, J.; Lieb, C.; Lindberg, G.; Mackie, P.; et al. Proposal for Harmonised Guidelines. Deliverable D5 HEATCO. Unification of Accounts and Marginal Costs for Transport Efficiency (UNITE); University of Leeds: Leeds, UK, 2006. [Google Scholar]
Figure 1. The economic cost composition of engineering structures throughout their entire life cycle.
Buildings 15 02923 g001
Figure 2. Economic cost calculation model of the engineering structure throughout its entire life cycle.
Buildings 15 02923 g002
Figure 3. Sensitivity analysis of discount rate.
Buildings 15 02923 g003
Figure 4. Environmental impact of the entire life cycle of engineering structures.
Buildings 15 02923 g004
Figure 5. Construction drawing of the superstructure of the bridge (mm).
Buildings 15 02923 g005
Figure 6. Design load conditions of the beam.
Buildings 15 02923 g006
Figure 7. Section design. (a) Prestressed reinforced concrete beam; (b) steel beam.
Buildings 15 02923 g007
Figure 8. Cost comparison between steel beams and reinforced concrete beams.
Buildings 15 02923 g008
Figure 9. Sensitivity analysis of the steel recovery rate.
Buildings 15 02923 g009
Figure 10. List of social costs for stakeholders.
Buildings 15 02923 g010
Figure 11. Layout of the bridge route and maintenance sections.
Buildings 15 02923 g011
Figure 12. Bridge location and detour route.
Buildings 15 02923 g012
Figure 13. Sensitivity analysis of the traffic delay time value.
Buildings 15 02923 g013
Table 1. Life cycle economic costs under different discount rates.
Discount Rate (%)Total Life Cycle Economic Cost
(10,000 CNY)
1895.476
2848.565
3811.216
4781.165
5756.720
6736.612
Table 2. Existing environmental cost analysis methods and models.
Methods and ModelsSourceDescription
Full life cycle environmental cost analysis[20]Describes the environmental cost throughout the product’s entire life cycle and defines the relationship between the total cost and the environmental cost.
Full environmental cost accounting method[21,22]Defines all the costs throughout the entire life cycle of the product and emphasizes the environmental factors therein.
Full cost accounting method[23,24]In the process of management accounting, environmental costs are allocated to products, production lines, or processing procedures.
Environmental cost accounting[23]Incorporates environmental costs into the existing cost accounting process or allocates potential link costs to the corresponding products.
Total cost evaluation[25,26]Evaluates the pollution prevention and control project of the product by introducing the environmental cost data of the product, a reasonable time range, and standard financial indicators.
LCA-LCCA model[27]Quantifies and calculates the full-life mechanism cost, user cost and environmental cost of the bridge slab.
Bridge failure consequence model[9]Includes the economic, environmental, and social consequences caused by the damage to/failure of bridges under earthquakes.
Table 3. Pollution prevention and control cost rates and environmental damage cost rates for various pollutants.
Pollutant CategoryPollutantUnitPollution Prevention and Control Cost Rate aData SourceEnvironmental Damage Cost Rate aData Source
Higher EstimateLower Estimate
Air pollutantsCO2CNY/t452.34[14,35,36,37]153.4730.69[38]
COCNY/t114.8814.367.18[14]
SO2CNY/t5169.601220.60631.84
NOxCNY/t5026.001120.08466.70
DustCNY/t22,473.4044,113.9219,745.00
VOCsCNY/t28,002.0014,072.8014,072.80
CH4CNY/t8831.401615.50347.33[38]
SewageTSSCNY/t4667 b[35,39,40]71,377.65[41]
CODCNY/t4882 b43.92
T-NCNY/t/5662.17
T-PCNY/t/66,847.91
Solid wasteNSWsCNY/t32.67[42,43]182.66[36]
a. The currency exchange rates used in this study are as follows: 1 euro = 8.32 yuan, 1 USD = 7.18 yuan, and 1 Japanese yen = 0.049 yuan. b. The unit of the figures is yuan/m3.
Table 4. Unit pollution prevention and control costs and environmental damage costs of common building materials and energy.
MaterialsUnit dCost of Pollution Prevention and Control eData SourceEnvironmental Damage CostData Source
Higher EstimateLower Estimate
CementCNY2232.66[44]3966.3481782.820[45]
Concrete aggregateCNY2.23[45]0.5320.214
Fly ashCNY953.50801.706309.458
Blast furnace slagCNY345.17158.28347.957
LimestoneCNY339.26[46]115.10523.021[46]
AluminumCNY//245.55649.111
Steel barCNY1027.54[39,47]4291.1054038.656[39]
Fresh woodCNY//6.9602.317[48]
Dry woodCNY125.87[48]44.95311.182
Glued laminated woodCNY//90.07929.255
Glued laminated woodCNY108.65[48]53.82019.159
Electricity aCNY0.74[47]0.6230.241[45]
Gasoline bCNY4.01[49,50]0.5090.103[50]
Diesel cCNY4.71[51,52]0.4640.094[51,52]
a. The environmental cost of electricity considers emissions from thermal power generation. b. The environmental cost of gasoline considers emissions from automotive gasoline engines. c. The environmental cost of diesel considers average emissions from different types of diesel vehicles. d. In order to standardize all units to CNY, it is necessary to assume that all materials use 1 unit, such as cement using 1 t and dry wood using 1 m3. e. The currency exchange rates used in this study are as follows: 1 euro = 8.32 yuan, 1 USD = 7.18 yuan, and 1 Japanese yen = 0.049 yuan.
Table 5. Initial costs of steel beams and prestressed reinforced concrete beams.
Cost (CNY) aSteel BeamPrestressed Reinforced Concrete Beam
C L C C E C C L C C E C
Materia bCement--2839.57954.9
Concrete aggregate--1632.228.9
Fly ash--96.1601.6
Steel bar--13,024.44034.4
I-beam19,439.35563.9--
Total materials19,439.35563.917,592.112,619.8
TransportationBuilding materials21.315.954.040.5
Workers1162.829.111,628.2290.7
Engineering equipment2154.0537.16462.01611.2
Landfill of construction waste0.00.02391.1187.5
Total construction cost22,777.46146.038,127.514,749.8
a. C L C is the economic cost; C E C is the environmental cost; b. The concrete mix ratio is cement/aggregate/water/fly ash = 1:3.6:0.34:0.18.
Table 6. Environmental costs of steel beams and reinforced concrete beams in terms of waste gas, waste water, and solid waste.
Environmental Cost (CNY)Steel BeamPrestressed Reinforced Concrete Beam
Waste GasWaste WaterSolid WasteWaste GasWaste WaterSolid Waste
Building materials4168.061395.07011,759.83857.44187.54
Material transportation15.510039.3500
Worker transportation29.0800290.7200
Construction machinery538.28001614.9300
Total environmental cost4750.931395.07013,704.83857.44187.54
Proportion77.3%22.7%0.0%92.9%5.8%1.3%
Table 7. Environmental and economic costs of different steel recovery rates.
Recovery
Rate (%)
Burying Amount (t)Unrecovered Steel Environmental Costs (CNY)Proportion (%)Unrecovered Steel Economic Costs (CNY)Proportion (%)
700.04865.470.08969.770.306
750.04054.560.07458.180.255
800.03243.650.05946.590.205
850.02432.740.04534.990.154
900.01621.820.03023.400.103
950.00810.910.01511.800.052
1000.00000.000.0000.000.000
Table 8. Values of typical social cost parameters in Zhejiang Province.
StakeholderParametersSymbolUnitValueData Source
Construction workerProject duration t c Day365Data of this case
The number of injuries/the number of deaths-/48.53China Labor Statistical Yearbook
Age of injury T i Age43.36
Daily average mortality rate λ d Person/day 1.97 × 10 6 Estimated based on the data of production safety accidents in housing and municipal engineering from 2015 to 2018
Daily average injury rate λ i n j Person/day 9.05 × 10 5 Estimated by the ratio of the number of injured people to the number of deaths
Average disability level φ w /22.42%It is obtained from the disability grade assessment in the 2024 “China Labor Statistical Yearbook”
Attendance rate on working days γ w /0.688Hypothesis
Retirement age T r Age63Measures of The State Council on Gradually Delaying the Legal Retirement Age
Average wage ω d Yuan/working day287.84Database of Zhejiang Provincial Bureau of Statistics
Average medical expense C m e d Yuan per person10,677.4Statistical Bulletin on the Development of China’s Health and Wellness Industry 2023
Statistical value of human lifeVSLYuan per person3,629,110[60]
Traffic userDaily average traffic volumeADTCar/day11,736Data of this case
The percentage of vehicles passing through the construction road ρ d a -0.59
The length of the road is affected by constructionLKm3.79
Detour lengthDKm4.4
The number of accidents-One/year212,153.25
The number of deaths-Person/year95,261.25Traffic accident data of the National Bureau of Statistics of China in 2024
The number of injured-Person/year253,624
Economic loss-Ten thousand yuan per year121,054.75
Mortality rate r d Person/accident0.29234Calculated based on traffic accident data
Injury rate r i n j Person/accident1.05407
Annual average daily driving volume-Ten thousand vehicle kilometers384,996China’s “Statistical Bulletin on the Development of the Transportation Industry 2024”
The accident rate of normal driving r t n Accident/vehicle kilometers2.186 × 10−7Calculated based on the data of the number of accidents and driving volume
The additional accident rate in the construction area r t a Accident/vehicle kilometers1.940 × 10−8[61]
Average economic loss of the accident C t r a Yuan/accident5706Calculated based on the number of accidents and economic losses
Age of injury T i Age34.59[62]
The average salary of transportation users c w Yuan/working day384.43Database of Zhejiang Provincial Bureau of Statistics
The time value of traffic users c t , c a r Yuan per hour40.03Calculated from the average wage
Normal speed V n km/h60Data of this case
The speed passing through the construction area V c km/h30
Cost of goods delay c t , g o o d s Yuan per ton per hour40Statistical data in the engineering feasibility report
Automobile proportion1-TT/68.60%Statistical data in the engineering feasibility report
Statistical data in the engineering feasibility report
Truck proportionTT/31.40%
Average passenger capacity of automobiles O c a r Guest/vehicle3.58Statistical data in the engineering feasibility report
Average passenger capacity of trucks O t r u c k Guest/vehicle1.26
Average cargo capacity of the truck n g o o d s t/vehicle5.33
Automobile operating cost c t , c a r Yuan/km0.6837[59]
Truck operating cost c t , t r u c k Yuan/km2.2758
Gasoline c f , c a r Yuan/liter7.25Real-time market price
Diesel c f , t r u c k Yuan/liter6.8
Automobile fuel consumption (60 km/h) E n , c a r Liters/vehicle kilometers0.1325Statistical data in the engineering feasibility report
Automobile fuel consumption (30 km/h) E c , c a r Liters/vehicle kilometers0.1557
Truck fuel consumption (60 km/h) E n , t r u c k Liters/vehicle kilometers0.2120
Truck fuel consumption (30 km/h) E c , t r u c k Liters/vehicle kilometers0.2488
Public organizationThe ratio of administrative cost to accident cost of construction accidents α w /57%[55]
The ratio of administrative costs to accident costs in traffic accidents α t /15%[58]
Table 9. Composition of social costs for bridge maintenance.
StakeholderSocial CostSymbolCost (Yuan)Percentage
Construction workerConstruction accident cost C m e d 3160.04%
C i n c o m e 10,345
C m e n t a l 14,040
Traffic userCost of traffic accidents C t r a 4,562,7207.33%
Traffic delay cost C l g d 46,465,52292.04%
C v o c , r e 1,846,878
C v o c , c o 8,974,394
Public organizationAdministrative cost C a d 363,9020.58%
Total social cost (in ten thousand yuan)6223.8118
Table 10. Sensitivity analysis of traffic delay time value.
TTV (CNY/hour)Delay Cost (CNY)Social Cost Total (CNY)Proportion of the Benchmark Value
3237,972,43853,744,0340.86
3641,978,98157,751,5770.93
4046,465,52262,238,1181.00
4450,952,06466,724,6601.07
4855,438,60671,211,2021.14
Disclaimer/Publisher’s Note: The statements, opinions and data contained in all publications are solely those of the individual author(s) and contributor(s) and not of MDPI and/or the editor(s). MDPI and/or the editor(s) disclaim responsibility for any injury to people or property resulting from any ideas, methods, instructions or products referred to in the content.