Article

Automated Arch Profile Extraction from Point Clouds and Its Application in Arch Bridge Construction Monitoring

1
School of Civil Engineering, Central South University, Changsha 410075, China
2
State Key Laboratory of Bridge Intelligent and Green Construction, Wuhan 430034, China
3
The Fourth Engineering Co., Ltd., China Railway Seventh Bureau Group, Wuhan 430040, China
4
Department of Civil and Environmental Engineering, University of Auckland, Auckland 1010, New Zealand
*
Author to whom correspondence should be addressed.
Buildings 2025, 15(16), 2912; https://doi.org/10.3390/buildings15162912
Submission received: 12 July 2025 / Revised: 10 August 2025 / Accepted: 15 August 2025 / Published: 17 August 2025
(This article belongs to the Section Construction Management, and Computers & Digitization)

Abstract

Accurate extraction of the arch profile, the key spatial geometric parameter of the core load-bearing component in arch bridges, is crucial for construction process control and for achieving the designed final bridge configuration. To overcome the limitations of existing methods—geometric information loss, sensitivity to noise, and inefficiency—when extracting continuous, precise profiles from point clouds of complex spatially curved arch ribs, this paper proposes a multi-step point cloud processing workflow. The approach integrates geometric feature constraints specific to arch bridges to enable automated, high-precision extraction of the arch profile during construction. The approach comprises three steps. First, arch point cloud subset partitioning: the primitive arch point cloud is efficiently divided using parameters from down-sampling arch point cloud data. Second, component segmentation: a Random Sample Consensus (RANSAC) algorithm, optimized with cylindrical geometric constraints, is then employed to precisely segment the point cloud of individual arch tube components from each subset point cloud. Third, arch profile extraction: the geometric invariance of the bottom edge of each arch tube is leveraged to identify feature points via local coordinate system transformation and longitudinal constraints. These feature points are then spliced together to reconstruct the complete arch profile. The proposed method is employed in multiple construction stages of a concrete-filled steel tubular (CFST) arch bridge and quantifies the vertical deformation between adjacent stages. Compared with Total Station (TS) measurements, the average error ranged from 0.24 mm to 4.13 mm, with an overall average error of 2.105 mm, demonstrating accuracy and reliability.

1. Introduction

The construction process of a bridge is a lengthy procedure involving multi-stage structural system transformations, during which the spatial configurations continuously evolve with the construction progress [1,2,3]. This is particularly evident in arch bridges—key phases such as arch rib hoisting, closure, and concrete pouring induce significant dynamic changes to the arch profile [4,5]. Concurrently, the combined effects of structural self-weight, construction loads (e.g., hoisting equipment, temporary supports), and ambient temperature fluctuations cause the actual state of the arch structure to persistently change at each construction stage. If not properly controlled, these complex dynamic factors can adversely affect the final profile and internal force state of the completed bridge relative to design targets, potentially leading to structural instability risks in severe cases. Therefore, implementing high-precision monitoring throughout the entire construction process of arch bridges is crucial for ensuring construction safety and quality, ultimately achieving the intended design state of the completed bridge [6].
The profile of the arch, the core load-bearing component of an arch bridge, directly reflects key geometric parameters of the structure’s spatial configuration under loads and environmental influences [5]. Its precise monitoring is fundamental for ensuring smooth construction progress and realizing the design state of the completed bridge. During arch bridge construction, minor deviations in the arch profile (e.g., mid-span sag or arch foot displacement) can significantly alter the internal force distribution, threatening overall stability [7]. Traditional monitoring methods, such as TS [8,9], levels, and theodolites [10], primarily acquire profile data by measuring sparsely distributed coordinate points. For arch rib structures with complex curvature characteristics (e.g., parabolic or catenary forms), traditional methods struggle to capture continuous curvature variation details. Although accurate, these methods require extensive point deployment to obtain high-resolution profile data, making them time-consuming, labor-intensive, and inefficient.
Three-dimensional (3D) laser scanners, which utilize laser ranging technology to rapidly acquire the 3D coordinates and radiometric features (e.g., color and reflectance intensity) of target points, are characterized by high automation, high resolution, and high precision [11,12,13]. The dense point cloud data obtained by 3D laser scanners contains 3D spatial coordinates and radiometric features, enabling a precise description of the overall geometric morphology and surface details of a bridge structure’s current state [14]. Systematic processing and analysis of the complete point cloud data facilitate applications such as crack identification [15,16], construction progress monitoring [17], and deformation monitoring [18,19,20]. For example, a fusion framework combining 3D point cloud geometric features with unsupervised anomaly detection algorithms was employed for the effective identification of surface and internal cracks in masonry arch bridges using synthetic data generation and multi-scale feature analysis [15]. A semi-automated bridge construction progress monitoring framework integrating mobile LiDAR point clouds with 4D design models (3D-BIM + schedule) was used to achieve incremental progress tracking by calculating component-level completion percentages [17]. A shape information model based on an octree data structure, utilizing efficient compression and processing techniques for terrestrial LiDAR point cloud data combined with the Hausdorff distance algorithm, was used for precise bridge deformation detection [18]. In bridge construction scenarios, TLS can rapidly acquire high-density point clouds of arch rib surfaces from multiple stations, fully recording their spatial configuration evolution. However, the efficient and accurate extraction of the arch profile from point cloud data is a complex task due to the massive data volume (a single scan can reach tens of millions of points) and the prevalence of noise interference (e.g., scaffolding occlusion) [21].
A common approach for establishing the bridge profile involves extracting discrete feature points (such as the centroids of fixed monitoring regions [22,23,24]) from the bridge point cloud data. For instance, multiple black-and-white reflectors can be uniformly installed along the main cable and the bottom of the girder of a suspension bridge to serve as fixed monitoring regions. The centroids of the point clouds corresponding to these reflectors are then extracted to represent the profiles of the main cable and the girder [23]. However, this method typically requires the manual installation of fixed monitoring devices, which makes it difficult to achieve automated deployment in arch bridge construction environments, such as those with dense scaffolding, thereby making automated bridge profile extraction highly challenging. Furthermore, the discrete feature points with a sparse distribution cannot adequately capture continuous curvature variations along the bridge deck, leading to a loss of geometric information in the extracted profile. The fixed-step search method and the slice centroid method can automatically extract key points from each deck point cloud slice to form the bridge profile [10]. These methods eliminate the need for fixed monitoring regions and can increase the number of key points by adding more slices. Specifically, the fixed-step search method divides the bridge longitudinally into fixed intervals and, on a projected plane (e.g., XOY plane), calculates a midpoint P, then searches for the nearest point in the original point cloud to use as a key point, and the key points from all intervals form the deck profile. The slice centroid method generates longitudinal slices and calculates the centroid of the point cloud within each slice as the key point to extract the deck profile. However, in scenarios involving arch ribs with complex cross-sectional characteristics, multiple spatial candidate points may correspond to point P, leading to discontinuities or “jumps” in the extracted profile. Meanwhile, scaffolding occlusion and interference from auxiliary components during construction can distort the point cloud distribution, causing the centroid to significantly deviate from the true arch axis. Therefore, for arch structures with three-dimensional spatial curvature and complex geometric cross-sections during construction, existing methods face geometric information loss and sensitivity to noise in complex arch bridge scenarios, making it difficult to meet the requirements of high-precision monitoring.
To address the aforementioned challenges, this paper proposes a multi-stage processing approach leveraging the geometric feature constraints of arch bridges, enabling the precise and automatic extraction of the arch profile from point cloud data. The method comprises three core modules, namely arch point cloud subset partition, component segmentation, and arch profile extraction. Arch point cloud subset partition involves a down-sampling analysis to obtain parameters for fitting the arch centroid curve, used to efficiently partition the original point cloud. Component segmentation employs a RANSAC algorithm [25] optimized with cylindrical geometric feature constraints to precisely isolate the point cloud of individual cylindrical model components from each subset. Arch profile extraction leverages the geometric invariance of the bottom edge of the arch tube. By transforming local coordinate systems and applying longitudinal constraints, feature points are identified and finally spliced to obtain the complete arch profile. The method is successfully applied to extract the arch profile across multiple stages for the vertical deformation monitoring of a CFST arch bridge during construction. Compared to TS monitoring results, the average error ranged from 0.24 mm to 4.13 mm, with an overall average error of 2.105 mm, validating its effectiveness and accuracy.
The organization of this paper is as follows: Following this introduction, Section 2 systematically elaborates on the proposed automatic arch profile extraction method. Section 3, based on a CFST arch bridge case study, implements arch profile extraction and vertical deformation monitoring across multiple construction stages, and it conducts a comprehensive performance evaluation by benchmarking against TS measurements. Finally, Section 4 summarizes the research and presents the conclusions.

2. Methods

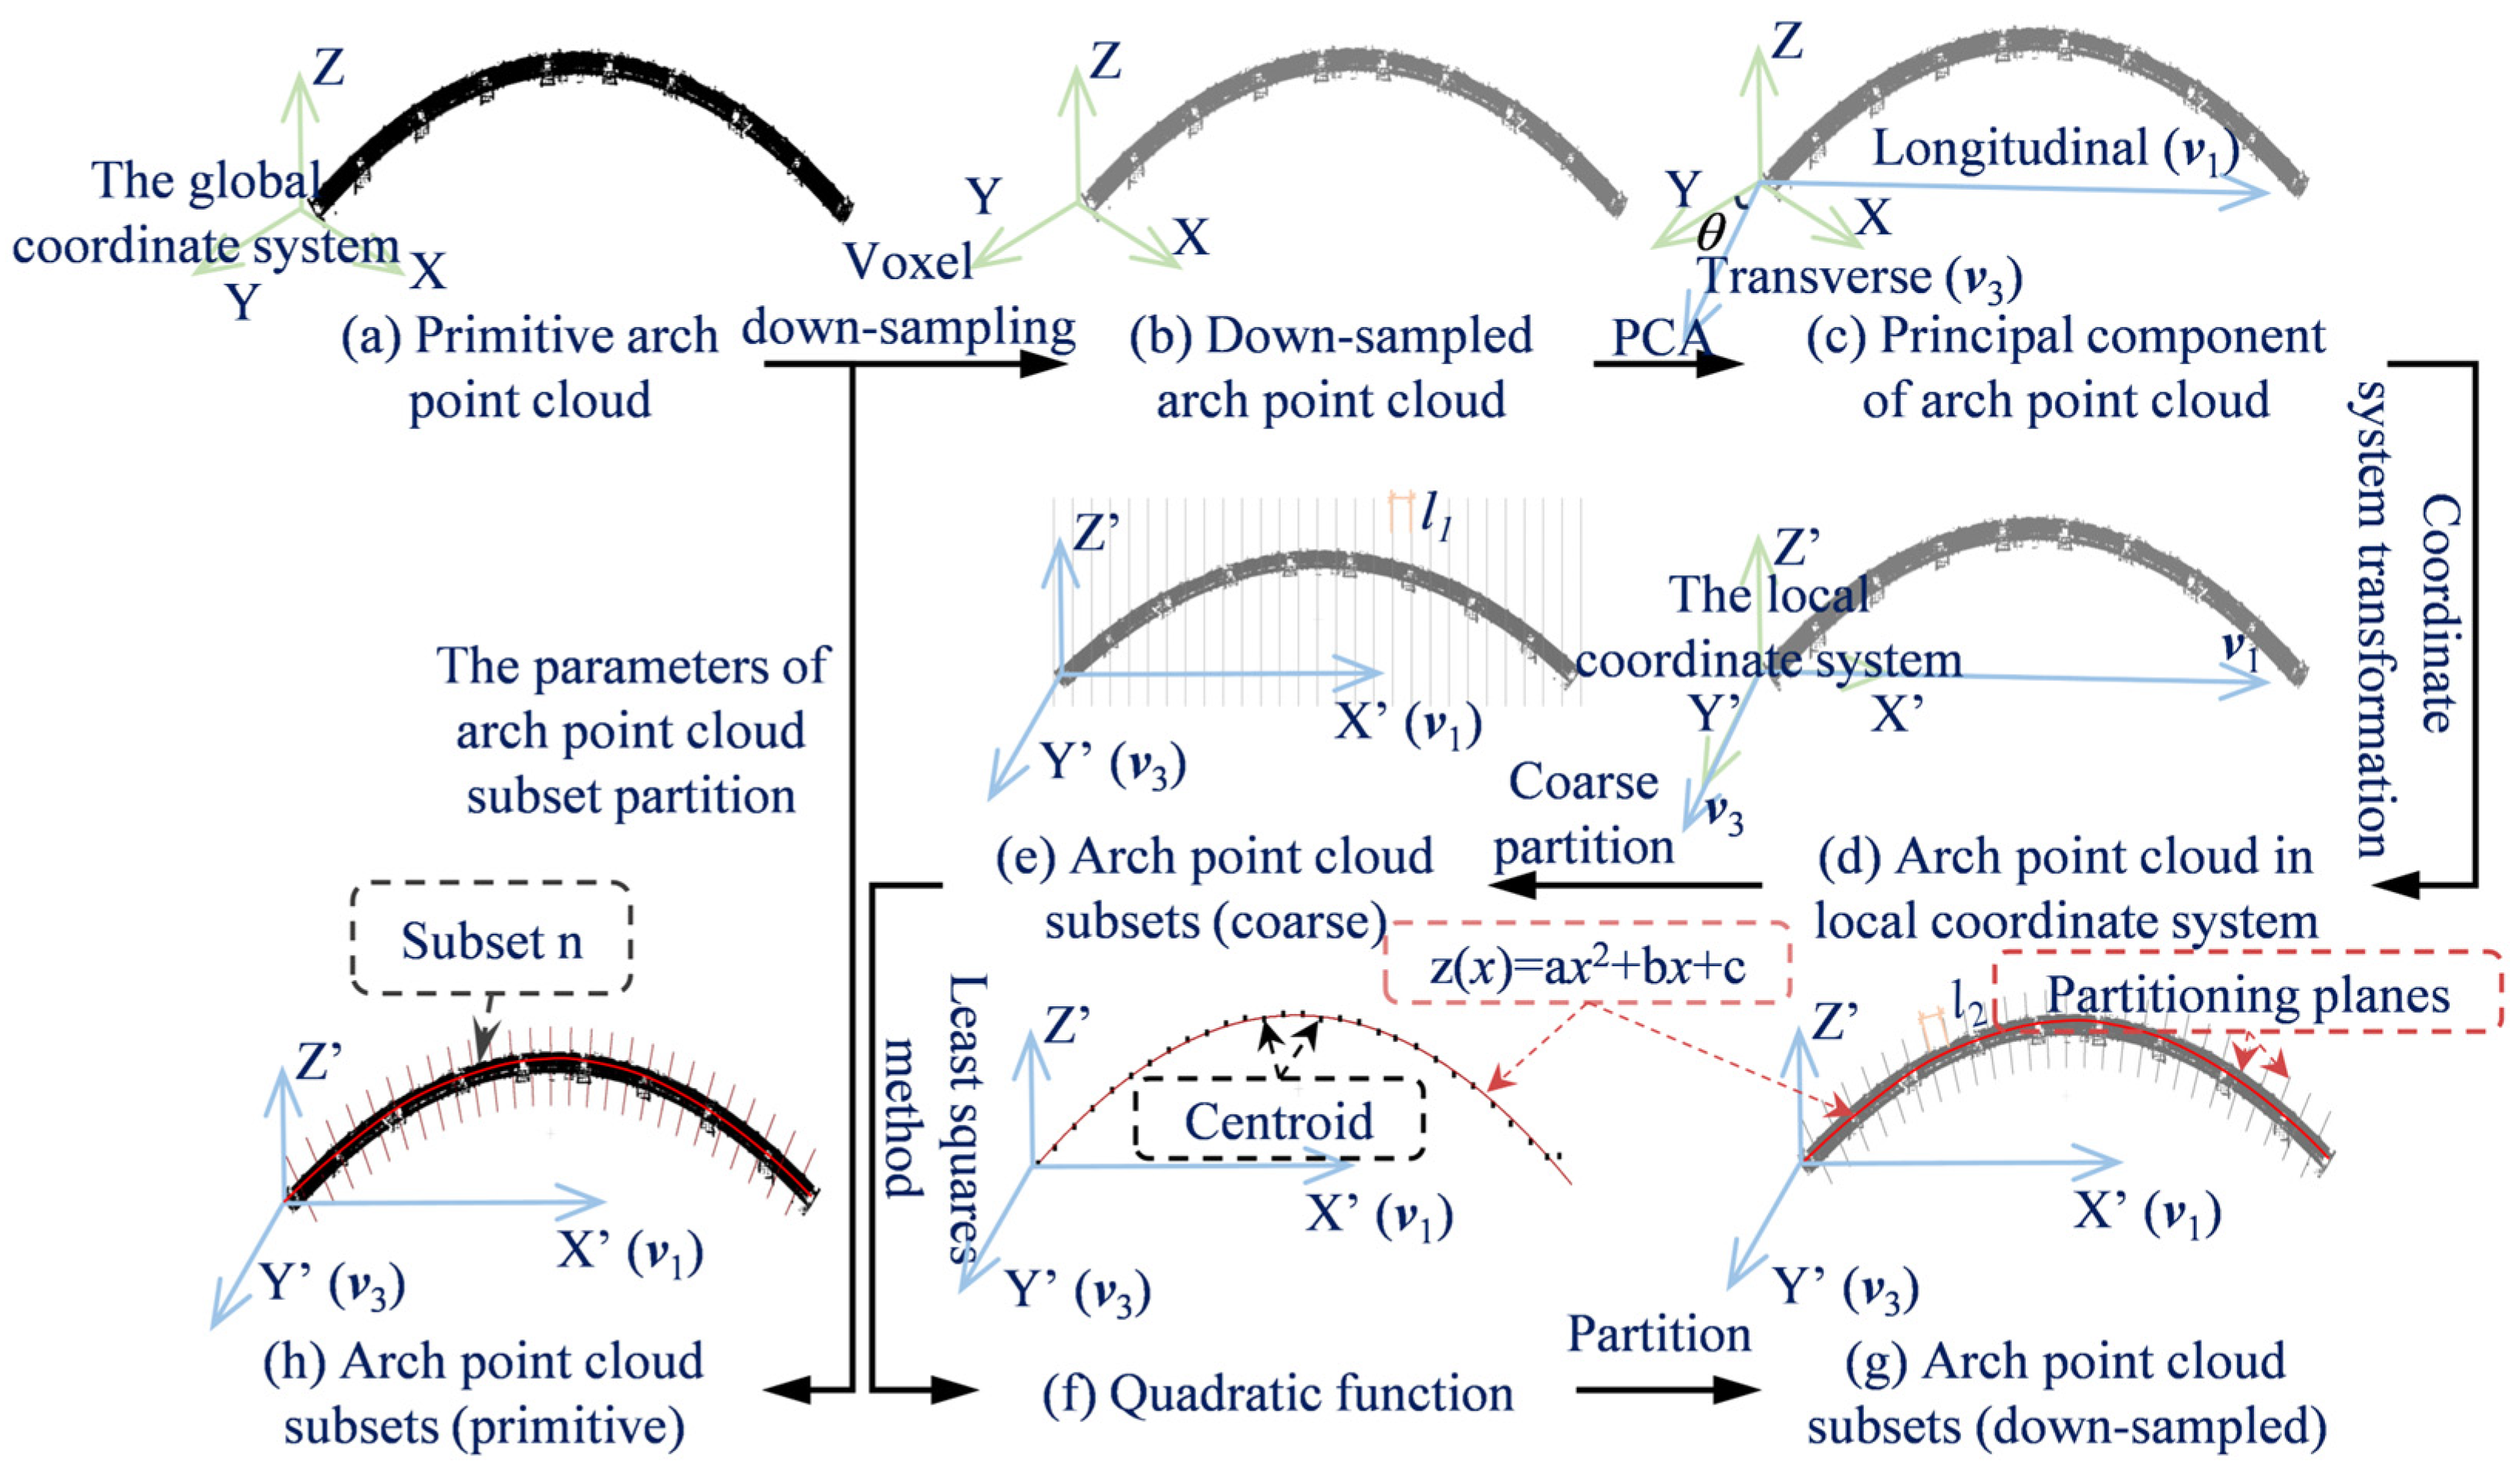
This study utilizes the bottom-edge profile to characterize the profile of the arch structure. The point cloud extraction workflow, illustrated in Figure 1, comprises three core stages: (1) arch point cloud subset partition, (2) component segmentation, and (3) arch profile extraction.
In the arch point cloud subset partition, the primitive arch point cloud is partitioned into equal-length segments along the arch axis. Optimal partition parameters are first determined using down-sampled arch point cloud data, which subsequently guide the partition of the primitive arch point cloud. Component segmentation involves fitting geometric models (e.g., cylindrical model) within each down-sampled subset using the RANSAC algorithm. These models are then back-projected into their corresponding primitive subsets to extract refined component point clouds adhering to the geometric constraints. In arch profile extraction, feature points representative of the linear profile geometry are identified by leveraging the distinctive geometric boundaries of the bottom-edge profile within each segmented component. The resulting feature points from all subsets are integrated to reconstruct the profile of the arch.

2.1. Arch Point Cloud Subset Partition

The primitive arch point cloud data exhibits complex geometric structures, making direct global processing inefficient. By partitioning the bridge arch point cloud into approximate subsets, periodic processing of simplified-shape subsets can be achieved, thereby reducing computational complexity and improving efficiency. As illustrated in Figure 2, the proposed method obtains partition parameters through feature analysis of down-sampled point clouds and maps them to primitive data for efficient partition.
First, a voxel down-sampling algorithm [26] is applied to spatially discretize the primitive arch point cloud. The 3D space is divided into equally-sized cubic voxels, where geometric centroid points of each voxel are retained to generate a down-sampled dataset preserving identical geometric features with significantly reduced point density. This operation maintains the macrostructure of the arch while effectively reducing the computational complexity of subsequent processing. Second, principal component analysis (PCA) [27] is employed for feature decoupling of the down-sampled point cloud. By constructing the point cloud covariance matrix, eigenvalue sequence n1 > n2 > n3 and corresponding eigenvectors v1, v2, v3 are calculated. According to the physical interpretation of eigenvalues, n1 corresponds to the longitudinal distribution feature (along v1 direction), and n3 represents the transverse distribution feature (along v3 direction). To establish a coordinate system profile with structural features, the world coordinate system is rotated by θ degrees around the Z-axis, aligning the X’-axis with v1 and the Y’-axis with v3, thereby achieving point cloud transformation into a local coordinate system. Subsequently, uniform partitioning along the X’-axis in the feature coordinate system generates consecutive point cloud subsets with width l1. The centroid coordinates of each subset are calculated to form a discrete feature point sequence. This feature point sequence is projected onto the Z’OX’ plane. A quadratic curve fitting using the least-squares method [28] yields the centroid distribution Equation z(x) = ax2 + bx + c within the Z’OX’ plane, which characterizes the geometric characteristics of the arch. Although a quadratic polynomial is used in the case study due to the parabolic design curve of the arch, the quadratic least-squares fitting is used exclusively for constructing the global reference curve for point cloud segmentation. This ensures that subsequent slicing planes remain approximately perpendicular to the arch cross-section, allowing fast and stable point cloud partitioning. For arch ribs with higher-order curvature or geometric asymmetry, the same least-squares framework permits flexible adaptation, such as using cubic or quartic polynomials, segmented fitting, or sliding window techniques, to handle more complex curvature distributions, which can locally approximate complex curvature without changing the global framework. A partition rule is established based on the centroid fitting curve: Uniformly distributed partitioning planes are generated along the down-sampled arch point cloud, ensuring each plane remains perpendicular to the tangent at its intersection with the fitting curve. After applying this parameterized partition to the down-sampled point cloud, the corresponding geometric parameters are inversely projected onto the primitive arch point cloud, achieving arch point cloud subset partition. The details of the arch point cloud subset partition are illustrated in Algorithm 1.
It should be noted that v1, the eigenvector corresponding to the largest eigenvalue λ1, represents the direction of maximum distribution of the arch point cloud along the longitudinal axis. By defining the X’-axis along v1, uniform partitioning of the point cloud along the longitudinal direction of the arch can be achieved. This ensures that the sequence of centroids from each segment accurately captures the curvature characteristics of the arch axis. Similarly, v3, the eigenvector corresponding to the smallest eigenvalue λ3, represents the direction of minimum distribution of the arch point cloud in the transverse direction. By defining v3 as the Y’-axis, the centroid points projected onto the Z’OX’ plane can be fitted using a quadratic curve that closely matches the actual arch profile. This fitting ensures that the generated partitioning planes remain perpendicular to the cross-section of the arch. Therefore, the construction of the local coordinate system using v1 and v3 not only enables uniform longitudinal partitioning of the arch point cloud but also guarantees that each partitioning plane is perpendicular to the arch’s cross-section, which is critical for accurate and efficient profile extraction.
Algorithm 1. Arch point cloud subset partition.
Inputs: Primitive arch point cloud P_arch, voxel size Δ , coarse partition length l1, curve partition length l2
Output: Primitive arch points cloud subsets S = {subset 1, subset 2, …, subset n}
1: P_down ← VoxelDownsample (P_arch, voxel size)
2: cov_matrix ← ComputeCovariance (P_down)
3: eigenvalues, eigenvectors ← EigenDecompose (cov_matrix)
4: v1, v2, v3 ← eigenvectors [:, 0], eigenvectors [:, 1], eigenvectors [:, 2]
5: T_rot ← RotationMatrixFromVectors (v1, v3)
6: P_down’ ← TransformPoints (P_down, T_rot)
7: min_x, max_x ← MinMaxX (P_down’)
8: For x from min_x to max_x step l1 do
9:     S’_i ← ExtractPointsInRange (P_down’, x, x + l1)
10:   centroid_i ← ComputeCentroid (S’_i)
11: end for
12: centroids ← [centroid 1, centroid 2, …, centroid m]
13: curve_params ← LeastSquaresFit(centroids, degree = 2)
14: partition_planes ← GeneratePerpendicularPlanes (curve_params, spacing = l2)
15: S ← ApplyPartitionToPrimitiveArchPointCloud (P_arch, partition_planes)
16: return S

2.2. Component Segmentation

Arch cross-sections typically consist of composite geometries, making arch geometry features difficult to identify directly in primitive arch point cloud subsets. Component segmentation employs the RANSAC algorithm to extract individual geometric entities from arch point cloud subsets (e.g., cylindrical models), specifically involving cylindrical model computation on down-sampled arch point cloud subsets and geometric component segmentation on primitive arch point cloud subsets.
The computational workflow initiates by randomly selecting two sample points with their normal vectors from a down-sampled arch point cloud subset as a cylindrical model, enabling the derivation of parameters including axis position, directional vector sc, and radius r. The model is subsequently validated against the following a priori constraints:
  • The orthogonality between axis and arch transverse direction, as defined in Equation (1).
arccos s c v 3 T 90 ° θ t h , 1
  • The radius tolerance constraint, as defined in Equation (2).
| R r | t
  • The elevation constraint, as defined in Equation (3).
h c h
where sc represents the directional vector of the cylindrical model, v3 represents the transverse direction of the arch cloud point (illustrated in Figure 2), θ t h , 1 represents the angular threshold, r represents the radius of the cylindrical model, R represents the design radius of the arch’s circular cross-section, Δ t represents the radius deviation threshold, hc represents the elevation of the centroid for the cylindrical model, and h represents the elevation of the centroid for the arch cloud point subset. Violation of any constraint results in model rejection and resampling. By computing the distance distribution from all points to the model, points within the threshold d t h , 1 are marked as inliers; if the inlier count falls below the threshold MinPts1, resampling is triggered. The iterations proceed while dynamically computing the maximum iteration count k until the termination criteria are satisfied:
k = log ( 1 p ) log ( 1 w n )
where p represents the confidence probability, w represents the current inlier ratio, and n indicates the number of primitives. The cylindrical model achieving maximum inlier consensus is selected as the optimal solution (illustrated in Figure 1).
Subsequently, coarse extraction of the component point cloud is performed on the primitive arch point cloud subsets by identifying all points within distance threshold d t h , 2 to the cylindrical model. The normals of these coarsely extracted points are then computed, and their angular deviations from the theoretical radial normal vectors of the cylindrical model are measured. Points exceeding angular threshold θ t h , 2 are filtered out, achieving segmentation of the component point cloud for arch point cloud subsets:
arccos n p i T n c < θ t h , 2
where n p i represents the normal of the point pi, nc represents the theoretical radial normal vectors of the cylindrical model, and θ t h , 2 represents the angular threshold. The details of the constrained RANSAC cylinder fitting are illustrated in Algorithm 2.
Algorithm 2. Constrained RANSAC cylinder fitting.
Inputs:   Subset   point   cloud   S i ,   angle   threshold   θ t h , 1 ,   radius   deviation   t ,   distance   threshold   d t h , 1 , minimum number of internal points MinPts1, expected probability p, Maximum number of iterations k, eigenvectors v3
Output: Optimal cylinder model C_opt
1: max_inliers ← Ø
2: w_est ← 0.5
3: k_max ← (log (1 − p)/log (1 − w_est^2))
4: j ← 05: while j < min (k_max, k) do:
6:     sample_points ← RandomSample (Si, 2)
7:     n1, n2 ← ComputeNormals (sample_points)8:    axis_dir ← n1 × n2
9:     radius, centroid ← EstimateCylParams (sample_points, n1, n2)
10:   h_subset ← ComputeSubsetCentroid (Si).z
11:    if   |   arccos ( axis _ dir   ·   v 3 )     90 ° |   < =   θ t h , 1 :
12:      continue
13:   if |radius − R| >= t:
14:      continue
15: if centroid.z <= h_subset:
16:      continue
17:   inliers ← []
18:   for p in Si:
19:      dist ← DistanceToCylinder (p, axis_dir, radius)
20:       if   dist   <   d t h , 1
21:        inliers. append(p)
22:      if len(inliers) > max_inliers and len (inliers) >= MinPts1
23:        continue
24:      w_current ← |inliers|/|S_i|
25:      if w_current > w_est:
26:        w_est ← w_current
27:        k_max ← log (1 − p)/log (1 − w_est^2)
28:        max_inliers ← len (inliers)
29:        C_opt ← (axis_dir, radius, centroid, inliers)
30: return C_opt

2.3. Arch Profile Extraction

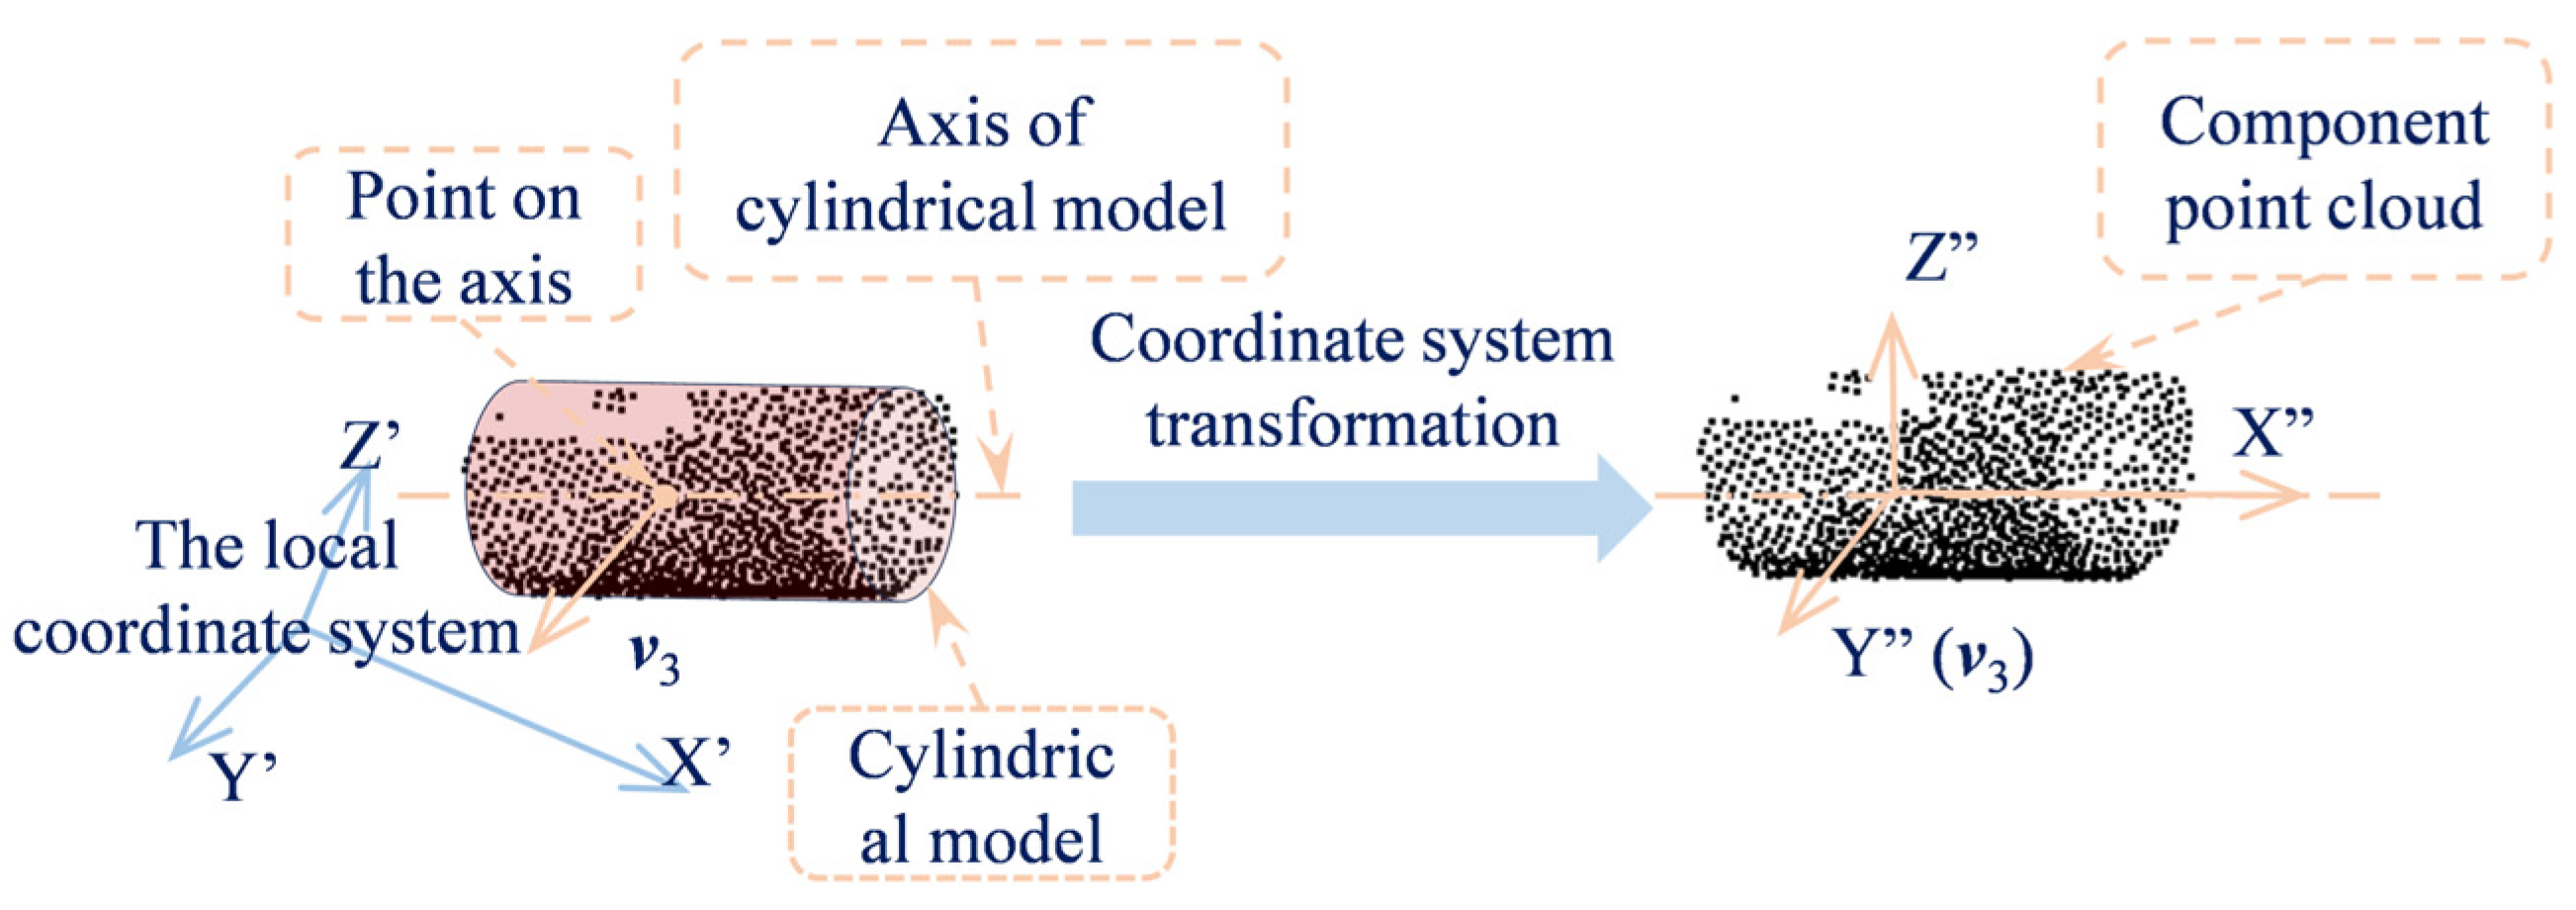
The profile extraction for arch point cloud subsets comprises two core computational phases: coordinate system transformation and profile points extraction. As illustrated in Figure 3, a new coordinate system is established using the axis of cylindrical model (X”-axis), an arbitrary reference point along the axis (origin), and the principal transverse direction v3 of the arch point cloud (Y”-axis), with the Z-axis automatically determined by the right-hand rule. The component point cloud is then rigidly transformed into this new coordinate frame via a spatial transformation matrix:
P = P T R
where P and P” represent the point cloud matrices of the lower tube before and after transformation, respectively, T represents the translation matrix, and R represents the rotation matrix. Within this local coordinate system, we calculate the polar angle of each point in the (Y″, Z″) plane. Transformed points satisfying the angular constraint are identified as candidate axis points, with their original indices recorded:
| y i | < | z i tan θ t h , 3 |
where y” and z”i represent Y”-axis and Z”-axis coordinate values of the i point, respectively, and θ t h , 2 represents the angular threshold. These indices enable reverse mapping to spatially locate the arch profile points within the component point cloud. Finally, integration of the profile points of subsets across all subsets reconstructs the arch profile (illustrated in Figure 1). The details of the profile point extraction are illustrated in Algorithm 3.
Algorithm 3. Profile point extraction.
Inputs:   Component   point   cloud   P _ comp ,   cylinder   model   C ,   lower   profile   extraction   θ t h , 3 , eigenvectors v3
Output: Optimal cylinder model C_opt
1: X” ← C.axis_dir
2: Y” ← v3
3: Z” ← X” × Y”
4: origin ← C.centroid
5: T ← ConstructTransformMatrix (X”, Y”, Z”, origin)
6: P_comp” ← TransformPoints (P_comp, T)
7: P_profile ← []
8: for p” in P_comp”:
9:     y = p”.y; z = p”.z
10:   angle = atan2(z, y)
11:    if   abs   ( angle     180 ° )   <   θ t h , 3 :
12:      P_profile.append (OriginalPosition (p”))
13: return P_profile

3. Method Validation

3.1. Description of the CFST Arch Bridge

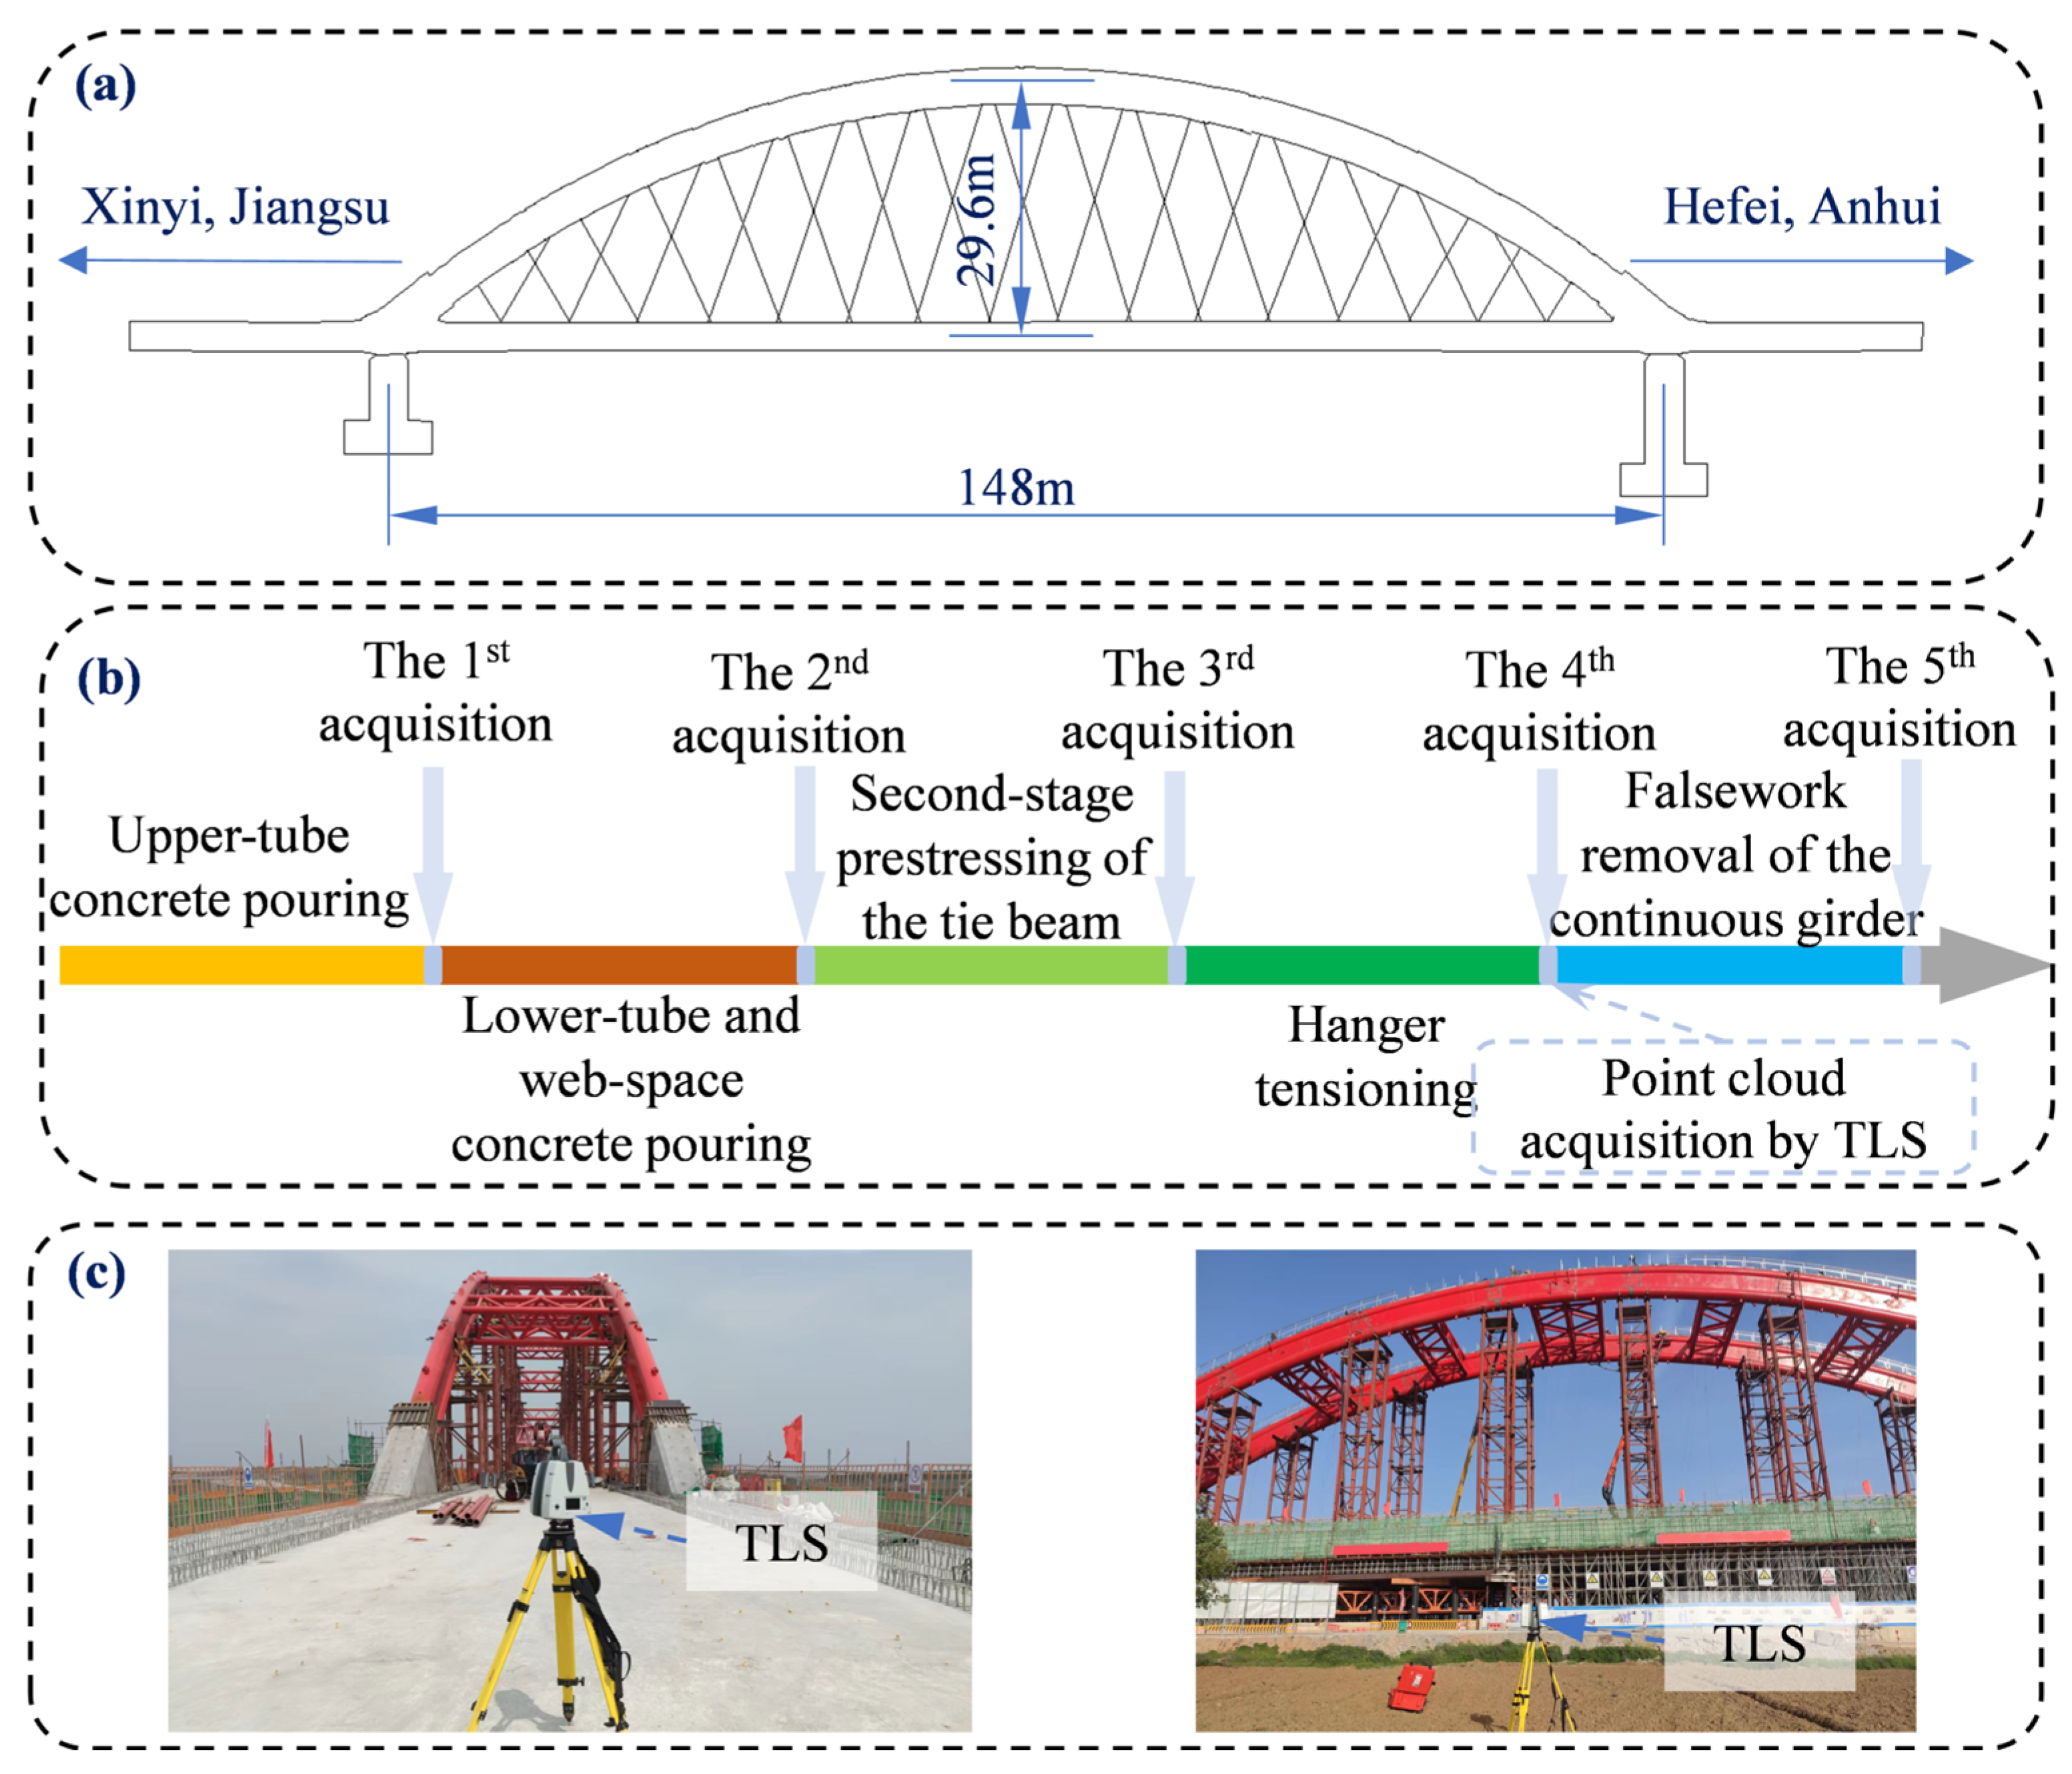
The field-monitored bridge is a through-type CFST arch bridge featuring a 148 m clear span and 29.6 m arch rise, yielding a rise-to-span ratio of 1:5. The continuous prestressed concrete box girder has a constant width of 16.4 m, with girder depths of 3.0 m at typical sections and 3.5 m at supports. The CFST arch adopts a dumbbell-shaped cross-section with a uniform height of 4.0 m throughout its length. The spans layout of the arch bridge is represented in Figure 4a. Construction deformation monitoring of the CFST arch focused on five critical stages (see Figure 4b): upper-tube concrete pouring, lower-tube and web-space concrete pouring, second-stage prestressing of the tie beam, hanger tensioning, and falsework removal of the continuous girder.

3.2. Arch Point Clouds Acquisition

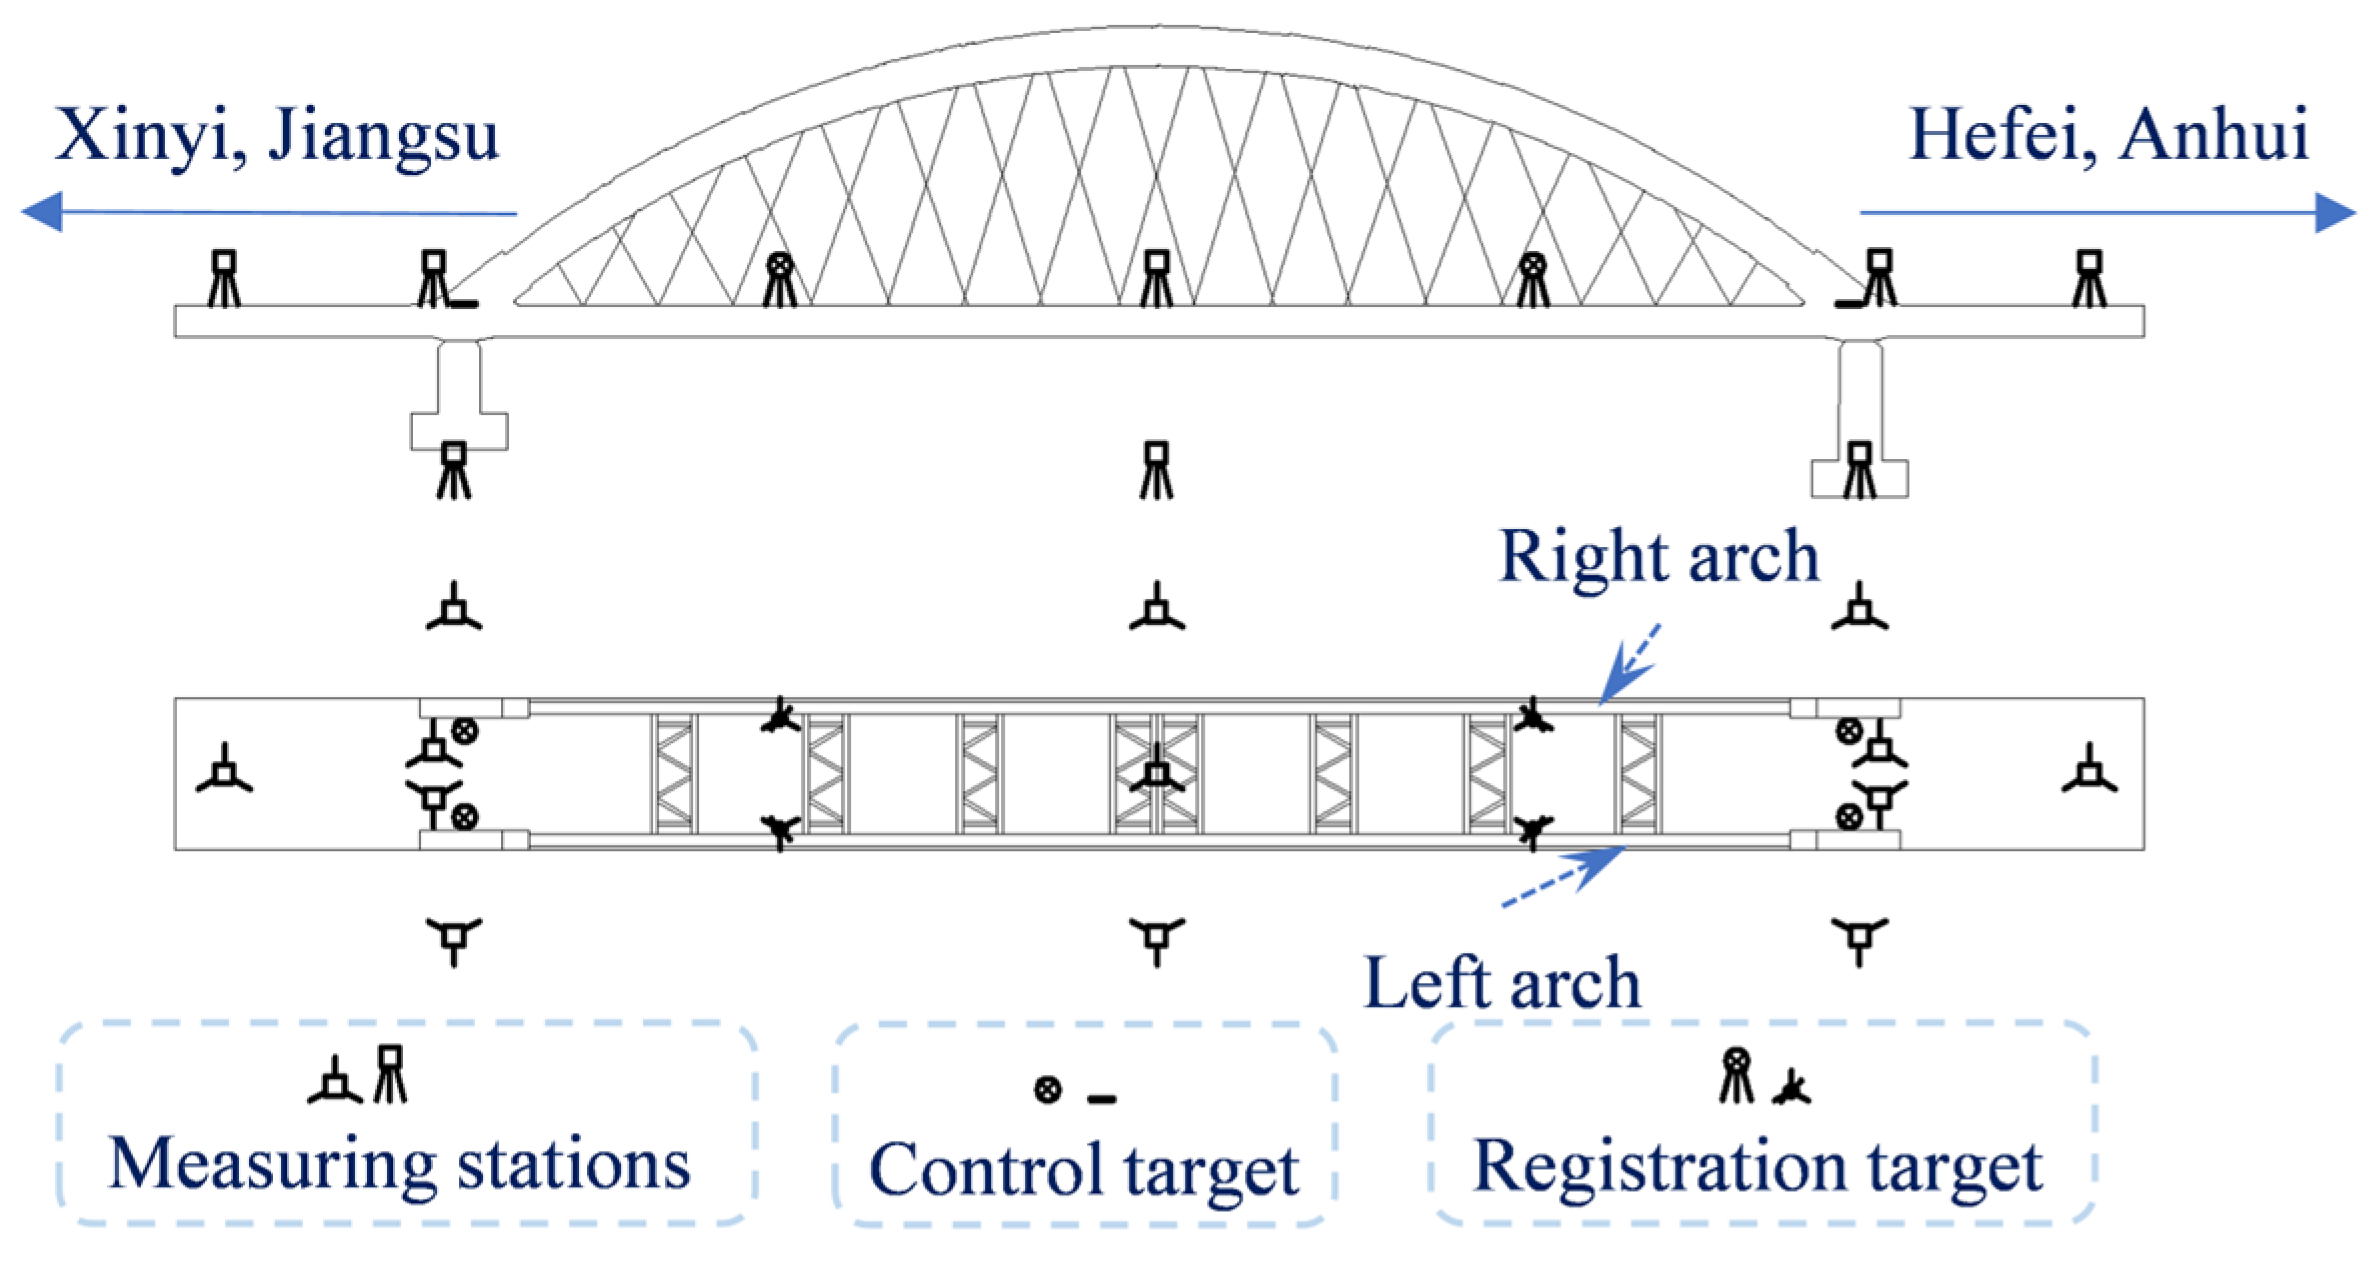
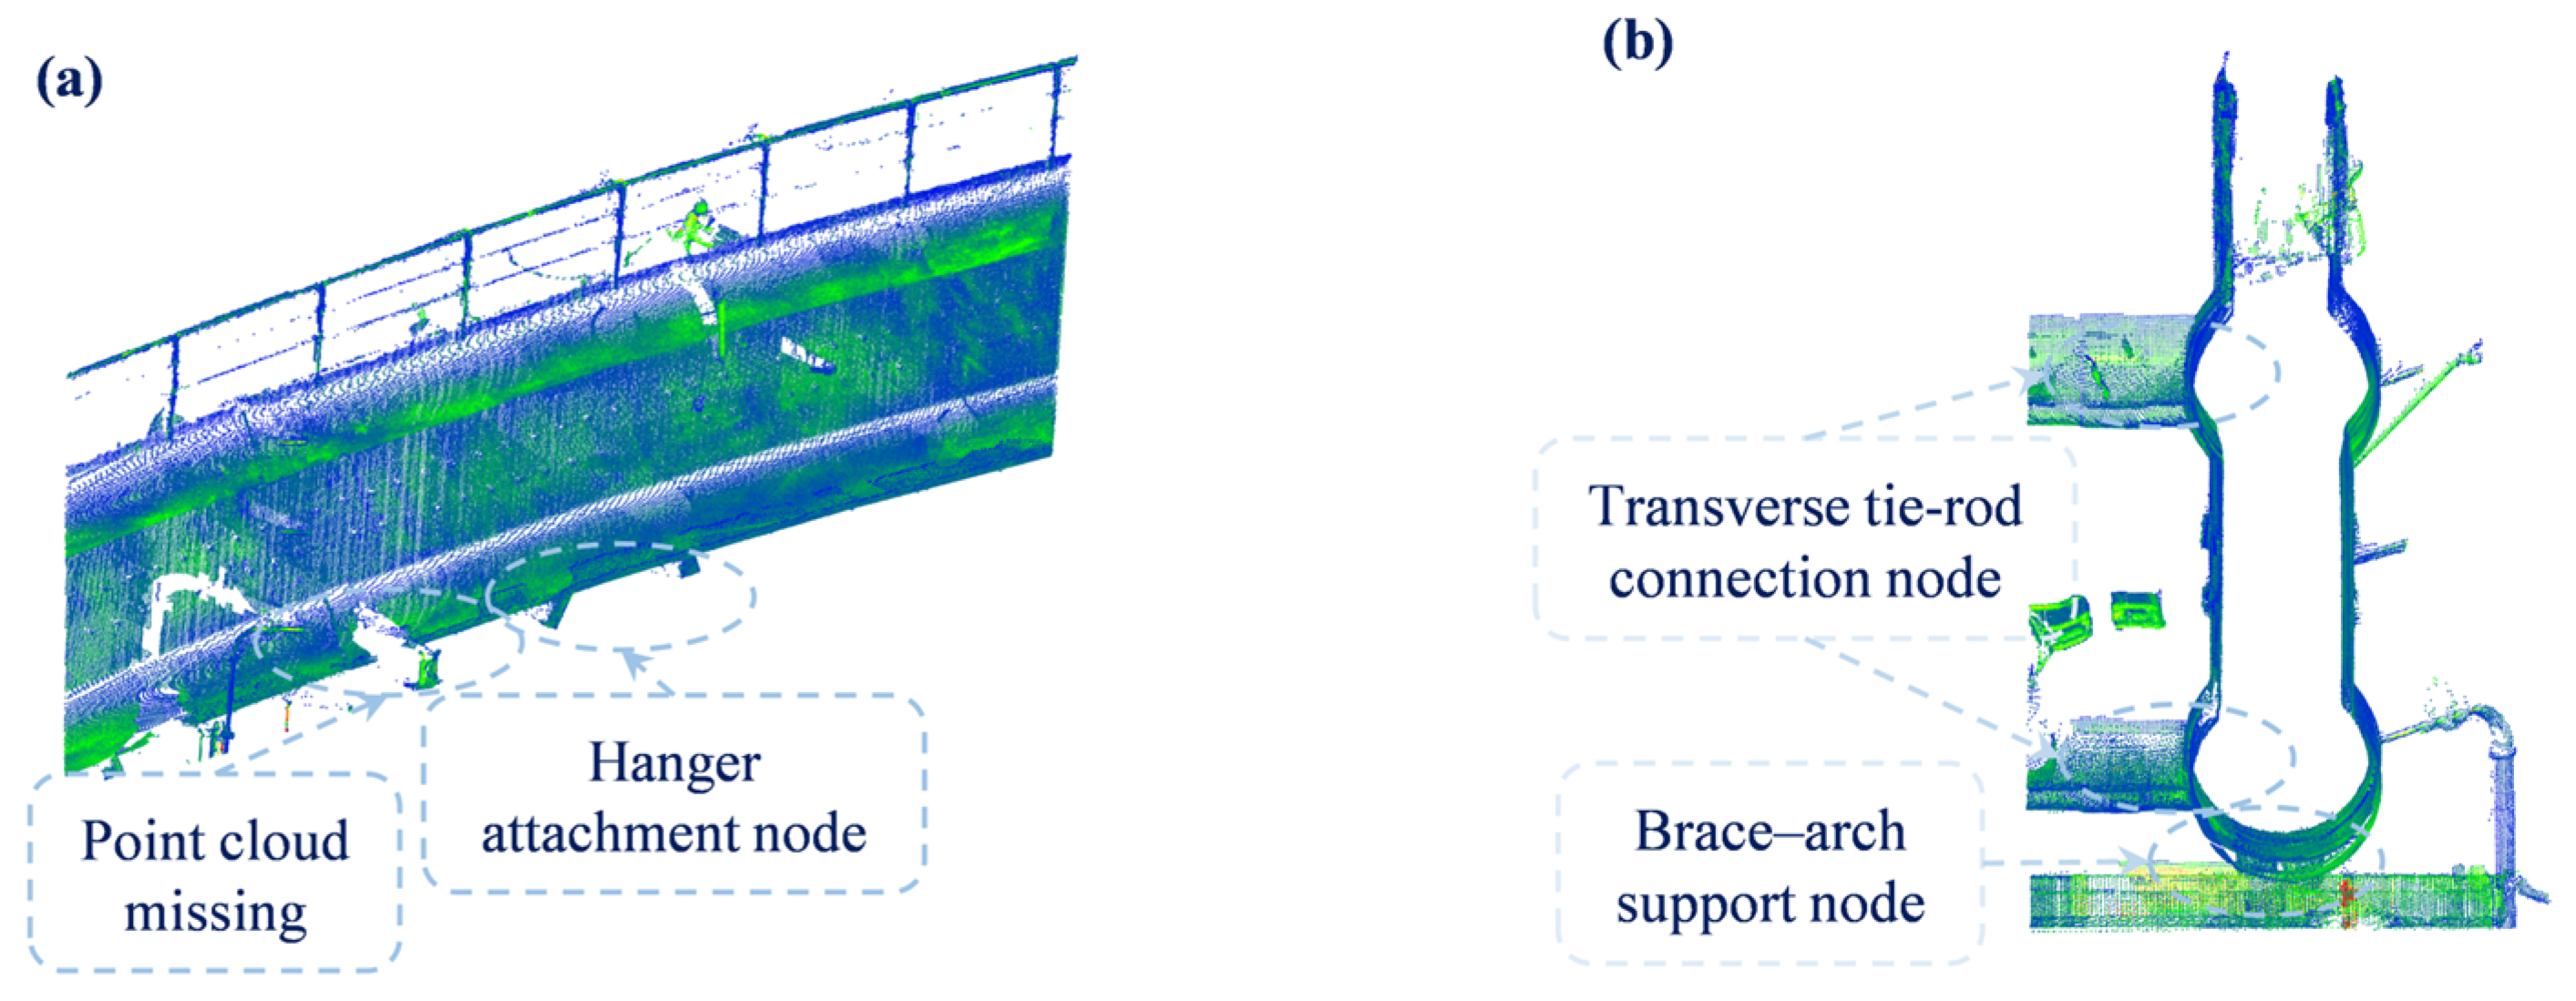
The point cloud data acquisition was performed using a Leica ScanStation P50 scanner (Leica Geosystems AG, Heerbrugg, Switzerland). Two types of target systems were deployed: four control targets permanently fixed on both lateral sides of the deck above the main piers, serving as reference points for the deformation analysis across construction stages; and four registration targets temporarily placed between stations for multi-station point cloud registration within a single scan (ensuring each station identified at least two targets). Based on the principles of covering the arch structure and ensuring line-of-sight to targets, seven scanning stations were established longitudinally along the bridge deck (covering the lower edges of the arch ribs, the bridge centerline, and positioned near the control targets), while six additional stations were set up beneath the bridge on both sides (station layout shown in Figure 5). After scanning all thirteen station positions sequentially, point clouds from the individual stations were registered using the registration targets to obtain the complete bridge point cloud data (see Table 1); finally, non-arch components and ambient noise were manually processed and removed, extracting the arch point cloud data (see Table 1). Notably, as shown in Figure 6, the cross-section of the arch point cloud contains multiple structural connection nodes, including hanger attachment joints, bearing support connections, and transverse tie-rod connections. At the same time, due to the complex construction site conditions, the acquired arch point cloud exhibits varying degrees of missing data.

3.3. Arch Profile Automatic Extraction

The arch geometry extraction workflow comprises three phases: Initially, voxel down-sampling (voxel size 0.05 m) is applied to the preprocessed point cloud. After coordinate partitioned system transformation via PCA, the down-sampled arch points cloud is coarsely parted into subsets (partition length l1 = 1 m). Centroids of these subsets are computed and fitted with a curve. Vertical partitioning planes spaced at l2 = 0.25 m intervals are constructed normal to this curve, uniformly dividing the down-sampled cloud while synchronously applying the same partitioning parameters to the primitive arch point cloud. During component segmentation, the RANSAC algorithm extracts cylindrical models from down-sampled subsets (parameters: axis deviation tolerance θ t h , 1 = 7.5° relative to transverse rib direction, radius tolerance 0.01 m, distance threshold d t h , 1 = 0.05 m, minimum inliers MinPts1 = 10, confidence probability p = 0.99, maximum iterations k = 1 × 10⁶). Segmentation of primitive subsets employs two-stage filtering: coarse segmentation (distance threshold d t h , 2 = 0.05 m) coupled with normal filtering (angular threshold θ t h , 2 = 5°). The final profile extraction phase converts coordinate systems of segmented components, extracts geometric feature points of primitive subsets using the angular threshold θ t h , 3 = 1°, and merges all feature points to reconstruct the complete arch profile (results in Table 1). The details of the algorithm parameters are illustrated in Table 2.

3.4. Arch Vertical Deformation Calculation

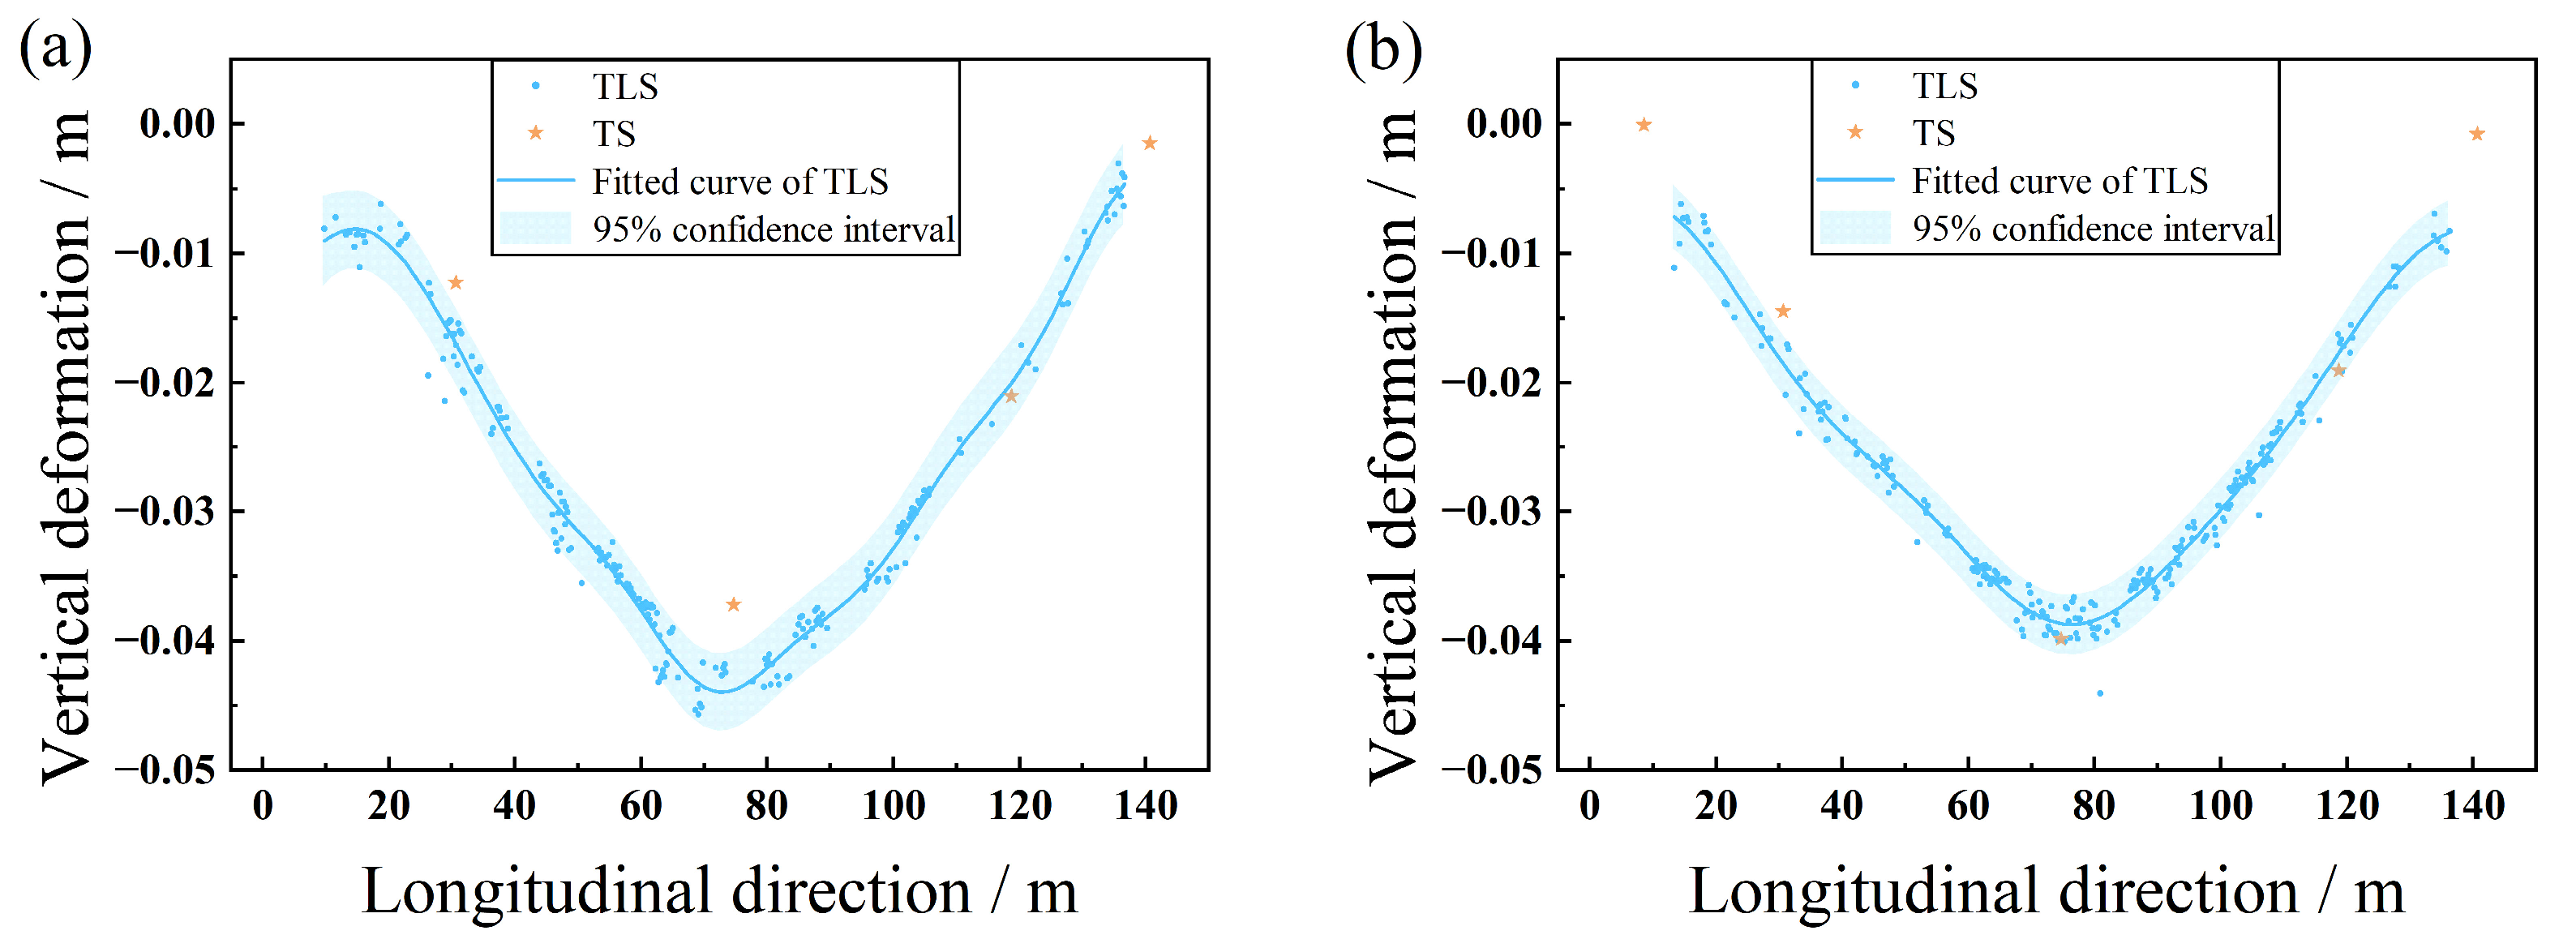
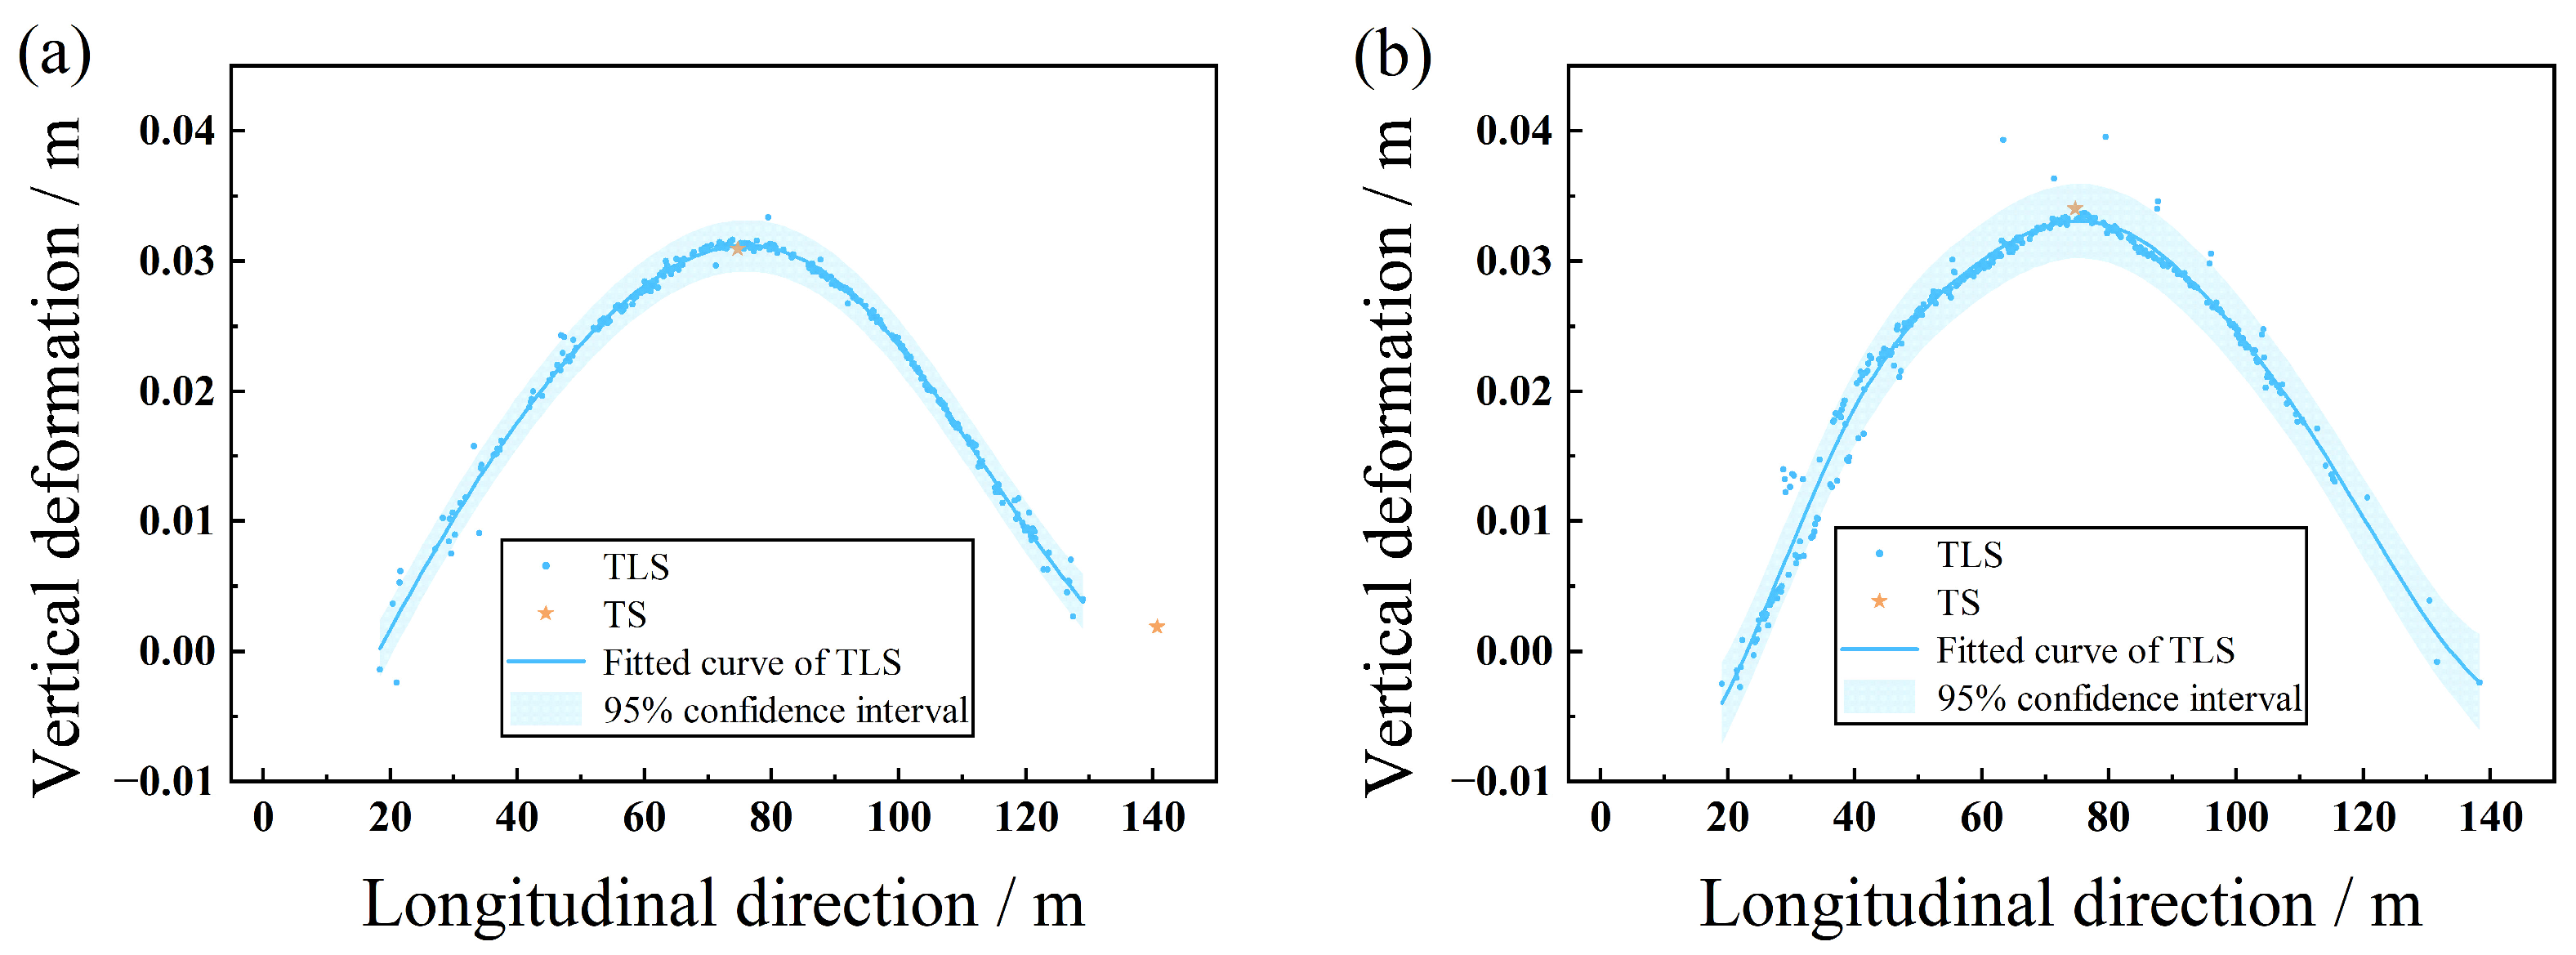
This study monitored arch construction deformation by comparing the profile of the arch across adjacent construction stages, illustrated in Figure 7. For each stage pair, common regions of the arch point cloud data were first extracted from both the preceding and subsequent stages. Within these shared regions, the point clouds were segmented longitudinally along the arch at defined intervals (ranging from 0.05 m to 0.4 m). Within each segment, least-squares linear fits were applied separately to the point clouds of the preceding and subsequent stages. The vertical displacement of the arch at the fitted line’s central point was then calculated as the elevation difference between these two fitted lines. After obtaining a series of discrete deformation observations along the longitudinal axis of the arch, Gaussian process regression (GPR) was employed to fit these points, generating a continuous curve representing the overall construction deformation of the arch. The calculated vertical deformation of the arch during construction is presented in Figure 8, Figure 9, Figure 10 and Figure 11. The graphical results indicate that the vertical deformations induced in the arch structure by each construction stage all exhibited an approximate parabolic shape, with the maximum vertical deformation occurring at the mid-span of the arch. Specifically, the lower-tube and web-space concrete pouring stage caused the mid-span of the left arch to settle about 0.045 m and the right arch to settle about 0.040 m; the second-stage prestressing of the tie beam caused the mid-span of both the left and right arches to rise about 0.030 m; the hanger tensioning stage caused the mid-span of both the left and right arches to settle about 0.025 m; and the falsework removal of the continuous girder stage caused the mid-span of the left arch to settle about 0.008 m and the right arch to settle about 0.009 m.
GPR is a non-parametric Bayesian method used for modeling and predicting continuous functions [29]. Its core idea is that, for any set of input points, the corresponding function values follow a multivariate Gaussian distribution, with the covariance determined by a kernel function. Let the training dataset be D = { ( x i , y i ) } i = 1 n , where xi is the input and yi is the corresponding observation. GPR assumes the following prior distribution for the function values [29]:
f ( x ) ~ G P 0 , k x , x
where k x , x denotes the kernel function. In this study, we use the squared exponential kernel, expressed as [29]
k ( x ,   x   ) = σ f 2 exp ( x   x   ) 2 2 l 2
where σ f 2 is the output variance, and l is the length-scale parameter. This kernel function is infinitely differentiable and is well-suited for modeling the smooth elevation variation along the bottom edge of the arch rib.
The GPR model learns the hyperparameters in the kernel function, θ = { σ f , l , σ n } , by maximizing the marginal likelihood, where σ n 2 is the observational noise variance. The log marginal likelihood is given by [29]
log p ( y X , θ ) = 1 2 y K + σ n 2 I 1 y 1 2 log K + σ n 2 I n 2 log ( 2 π )
where K is the covariance matrix between training points, and I is the identity matrix.
Finally, given a new input x , its predictive distribution is [30]
f x D ~ N μ , σ 2
where the predictive mean μ and variance σ 2 are given by [30]
μ = k K + σ n 2 I 1 y σ 2 = k x , x k K + σ n 2 I 1 k
where k is the covariance vector between the test points and the training points.
In this study, we used the discrete deformation observations along the longitudinal direction of the arch as the training set to optimize the hyperparameters of the GPR kernel function, { σ f , l , σ n } . Subsequently, within the prediction interval (i.e., the horizontal coordinate range [xmin, xmax] corresponding to each construction stage), we computed the fitted values μ and the corresponding 95% confidence intervals (i.e., μ ± 1.96 σ ) at 100 uniformly sampled points x using the posterior predictive distribution. This approach avoids extrapolation in regions without data, while ensuring both the smoothness and accuracy of the fitted curve.

3.5. Comparison with TS

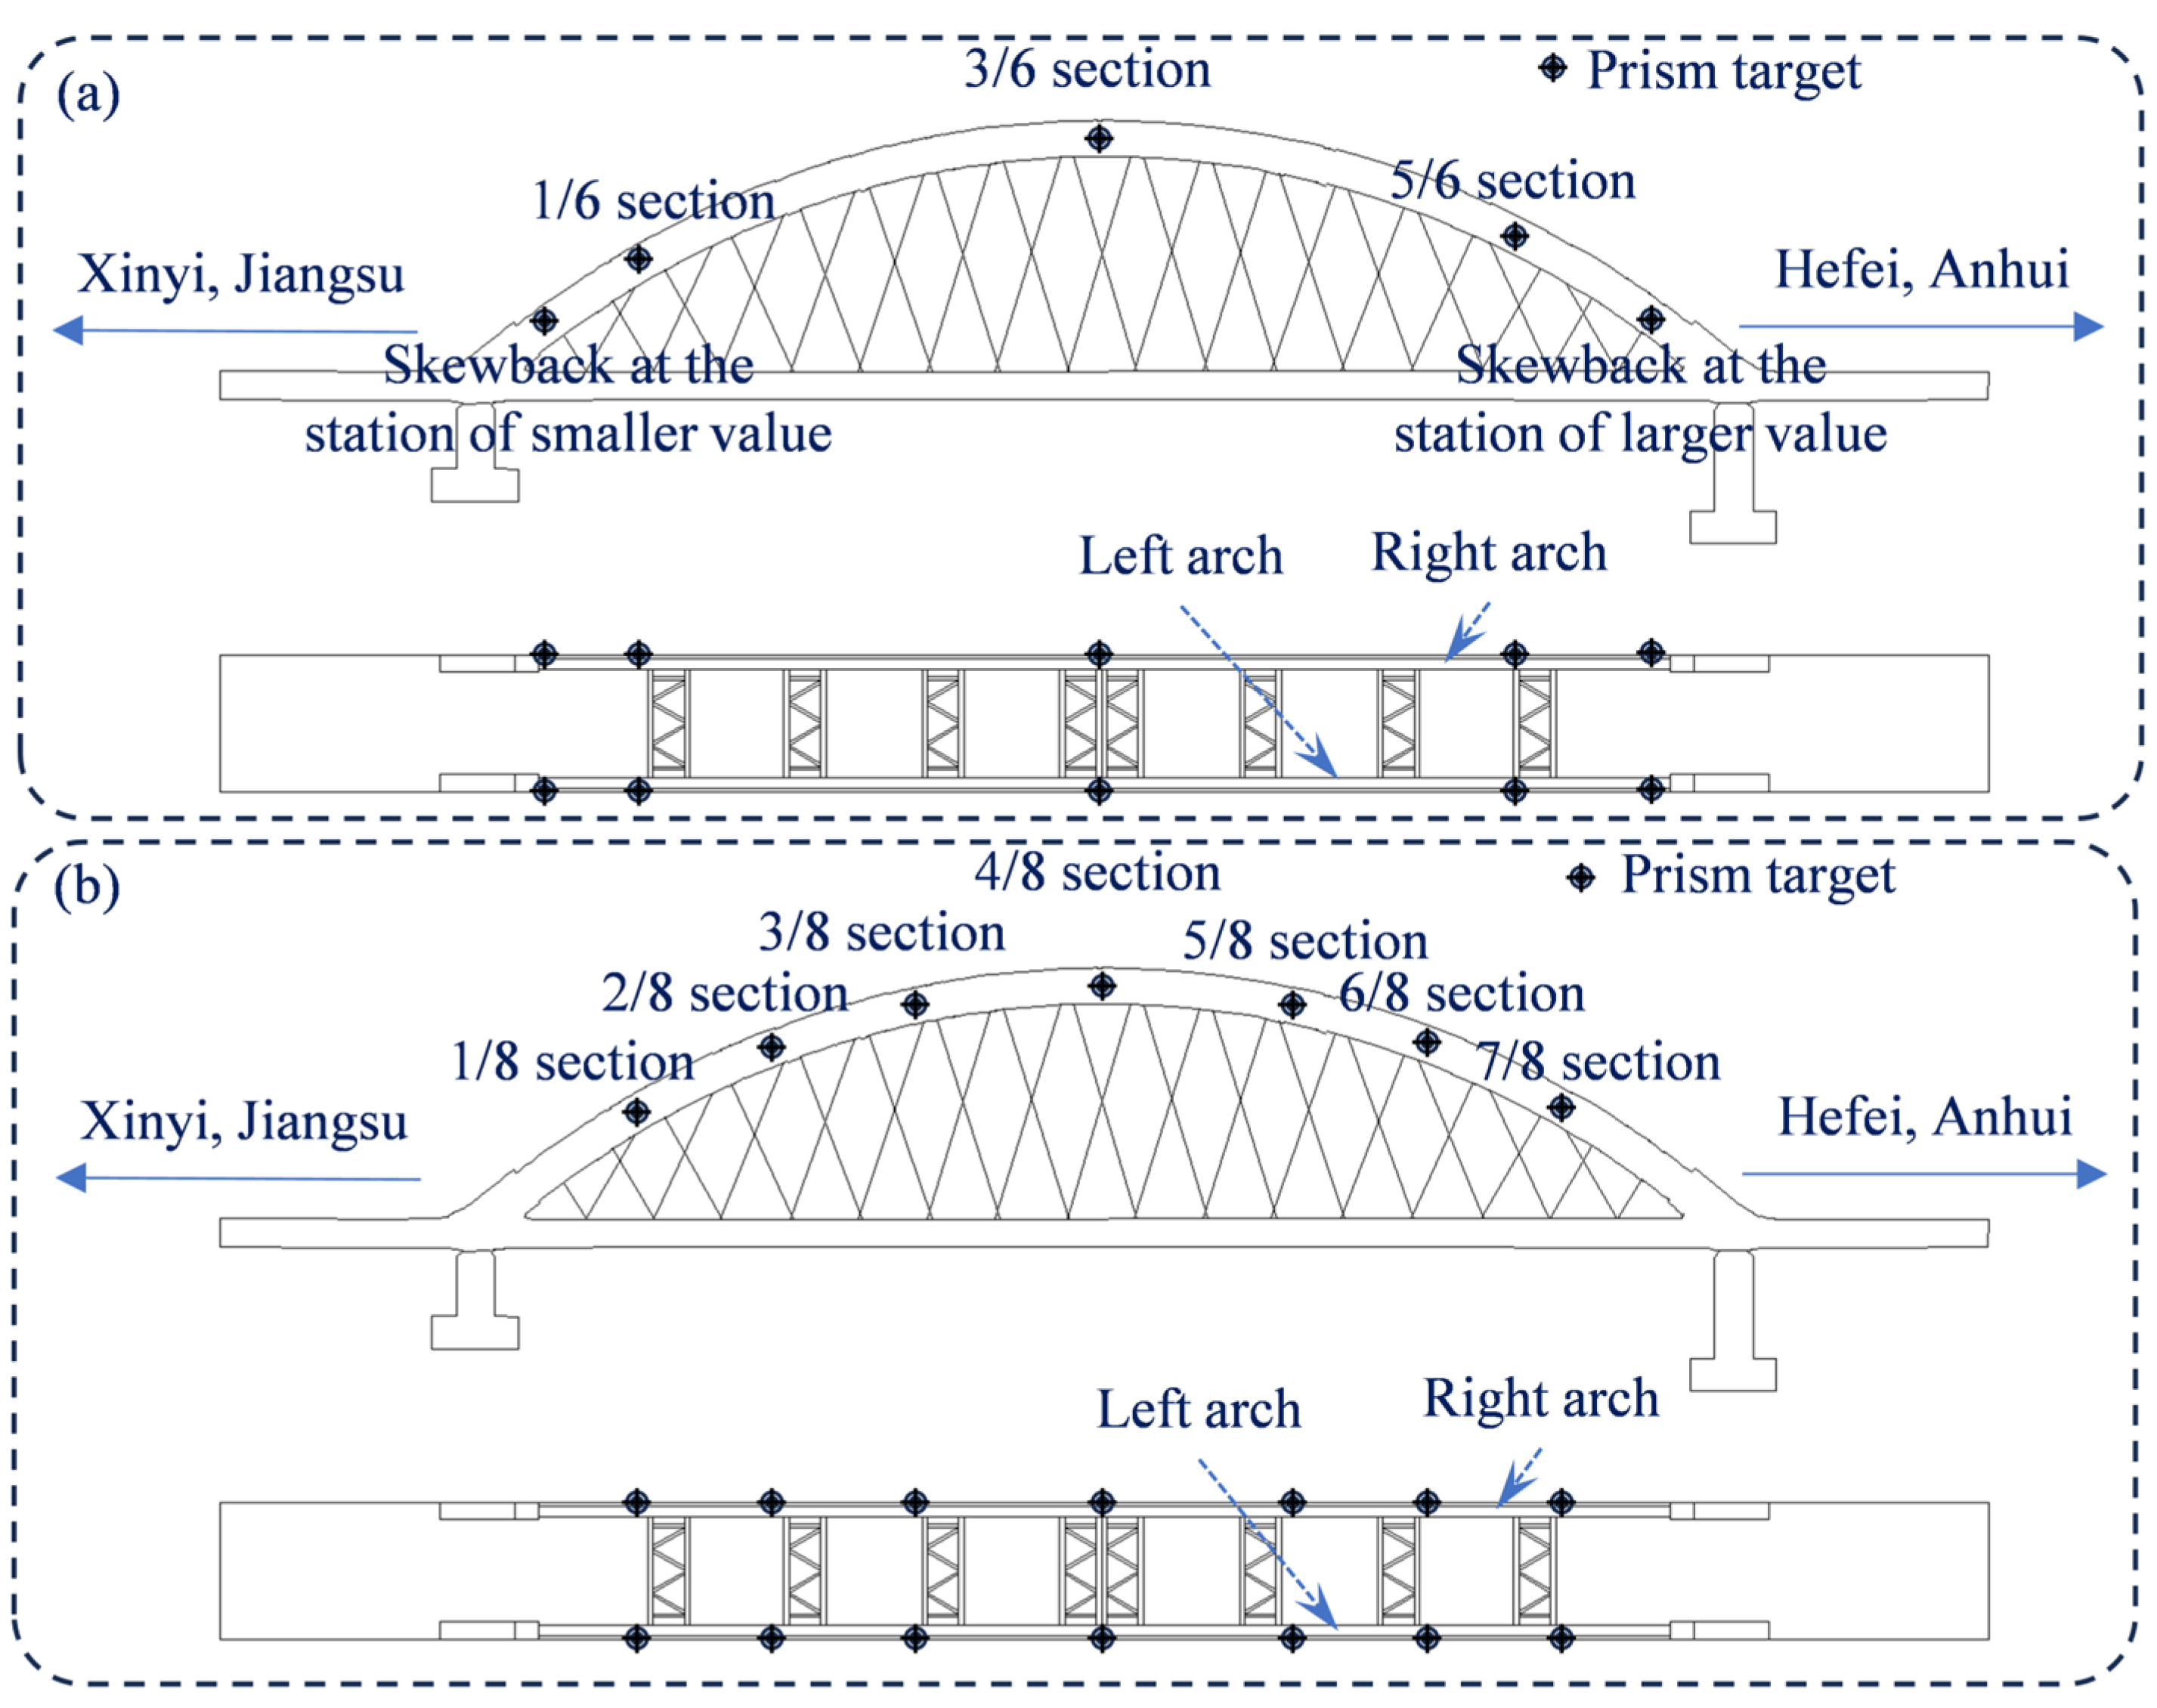
To validate the measurement accuracy of the proposed method for vertical deformation of the arch, this study employed a Zhongwei ZT30R TS (angular accuracy: 2”, reflectorless distance measurement accuracy: 3 mm + 2 ppm) (Zhongwei Surveying System Co., Ltd., Wuhan, China) to acquire real-time elevation data of prism targets relative to control points in reflectorless mode. The vertical deformation of the arch during each construction stage was characterized by time-varying elevation differences. The prism target layout is illustrated in Figure 12. Figure 12a corresponds to the construction stages of lower-tube and web-space concrete pouring, upper-tube concrete pouring, and second-stage prestressing of the tie beam; Figure 12b shows the target arrangement for second-stage prestressing of the tie beam, hanger tensioning, and falsework removal of the continuous girder. This zoned configuration resolves measurement interference caused by extensive paint coverage on reflective surfaces during the tie beam’s second-stage prestressing operation. Figure 8, Figure 9, Figure 10 and Figure 11 present the measured vertical deformation of the arches. It should be noted that site obstructions such as paint and scaffolds rendered measurements of certain points infeasible during TS operations.
Overall, the vertical deformation measurements of the arch structure obtained via TS and TLS demonstrate consistency. However, significant discrepancies between the two methods were observed during the falsework removal stage of the continuous girder (Figure 11). In this phase, gravity redistribution from the tie beam to the arch structure should theoretically produce a quadratic parabolic deformation pattern with maximum displacement at midspan. The anomalous TS measurements—specifically the failure to record a mid-span maximum—indicate questionable data reliability, likely attributable to field operation errors. These data were excluded. Consequently, these TS results were excluded from analysis. For the remaining construction stages (as specified in Table 3), six groups of error measurements yielded a mean of 2.10 mm, a standard deviation of 1.25 mm, and a range of 0.24–4.13 mm, underscoring the method’s stability and robustness in complex field conditions.

4. Conclusions

As a critical geometric parameter of the core load-bearing component in arch bridges, the precise extraction of the arch profile is essential for achieving design objectives and ensuring construction quality. However, existing methods face challenges such as geometric information loss, noise sensitivity, and insufficient efficiency when extracting continuous and precise profiles from the point clouds of arch ribs with complex spatial curvature, making accurate linear extraction difficult. To address this challenge, this study proposes a multi-stage point cloud processing workflow incorporating geometric feature constraints specific to arch bridges, achieving accurate and automatic extraction of the arch profile during construction stages. The core methodology operates through three sequential stages: First, the arch point cloud subset partition obtains arch centroid fitting curve parameters through down-sampling analysis to enable efficient partitioning of the primitive, massive arch point cloud. Second, component segmentation employs a RANSAC algorithm optimized with cylindrical geometric property constraints to precisely separate individual arch tube model point clouds from each subset. Third, arch profile extraction leverages the geometric invariance inherent to the bottom edge of the arch tubes, where characteristic points are reliably identified through local coordinate system transformation and longitudinal constraints; these points are then stitched together to form the complete arch profile.
Validated through application across five critical construction stages of a CFST arch bridge (upper-tube concrete pouring, lower-tube and web-space concrete pouring, second-stage prestressing of the tie beam, hanger tensioning, and falsework removal of the continuous girder), this method successfully achieved fully automatic and high-precision extraction of the arch profile. Based on the extracted profiles, the vertical deformation of the arch rib between adjacent construction stages was further quantified and analyzed. Comparative validation against TS monitoring results demonstrated that the average error range for arch profile extraction was between 0.24 mm and 4.13 mm, with an overall average error of 2.105 mm. This conclusively confirms the excellent precision and engineering reliability of the proposed method.
The multi-stage constrained point cloud processing method presented in this study provides an efficient and automated solution for the high-precision extraction of continuous linear profiles from spatially curved arch ribs during the construction process. This method not only significantly enhances the utilization efficiency and precision of point cloud data in bridge construction monitoring but also offers robust technical support for ensuring arch bridge construction safety and accurately achieving the designed final bridge state.
Future work will focus on applying the proposed approach to profile extraction in a variety of curved structures.

Author Contributions

Conceptualization, X.W. and X.Z.; methodology, X.W. and X.Z.; software, X.Z.; validation, X.W. and X.Z.; formal analysis, Y.L. and X.Z.; investigation, X.Z.; resources, X.W., J.Z., Y.W. and Y.Y.; data curation, X.Z.; writing—original draft preparation, Y.L. and X.Z.; writing—review and editing, X.W., Y.L., X.Z., J.Z., Y.W., C.L., Y.Y. and Y.Z.; visualization, Y.L. and X.Z.; supervision, X.W.; project administration, X.Z.; funding acquisition, X.W., J.Z. and Y.W. All authors have read and agreed to the published version of the manuscript.

Funding

This research was funded by the Science and Technology Research and Development Program Project of China Railway Group Ltd. (Major Special Project, No. 2023-Special-02) and the National Natural Science Foundation of China (U1934209).

Data Availability Statement

The data that support the findings of this study are available on request from the corresponding author.

Acknowledgments

The authors gratefully acknowledge the support from the Fourth Engineering Co., Ltd., China Railway Seventh Bureau Group.

Conflicts of Interest

Author Yihua Yuan was employed by the company The Fourth Engineering Co., Ltd., China Railway Seventh Bureau Group. The remaining authors declare that the research was conducted in the absence of any commercial or financial relationships that could be construed as a potential conflict of interest.

References

  1. Zhou, X.L.; Deng, T.X.; Chen, L.; Chen, J.; Li, A.; Yuan, Q.J.; Fang, W.; Gu, J.F. Application of Bayesian update method in the construction control of continuous rigid frame bridge girders with high piers and large spans. Buildings 2023, 13, 1556. [Google Scholar] [CrossRef]
  2. Au, F.T.F.; Wang, J.J.; Liu, G.D. Construction control of reinforced concrete arch bridges. J. Bridge Eng. 2003, 8, 39–45. [Google Scholar] [CrossRef]
  3. Gou, H.G.; Liu, C.; Bao, Y.; Han, B.; Pu, Q.H. Construction monitoring of self-anchored suspension bridge with inclined tower. J. Bridge Eng. 2021, 26, 05021011. [Google Scholar] [CrossRef]
  4. Li, Z.P.; Dong, X.T.; Chen, H.R.; Chi, L.J.; Zhang, Z.C. Overall lifting construction control method for large-segment steel arch bridges based on unstressed state control theory. Buildings 2025, 15, 523. [Google Scholar] [CrossRef]
  5. Pan, J.; Wang, X.R.; Huang, K.N.; Wang, W.S. Symmetrically construction monitoring analysis and completed state evaluation of a tied steel box arch bridge based on finite element method. Symmetry 2023, 15, 932. [Google Scholar] [CrossRef]
  6. Zhang, Y.C.; Wang, L.L.; Nong, Y.; Wang, W.S. Construction-monitoring analysis of a symmetrical rigid frame tied steel box arch bridge in southwest China based on segmental assembly technique. Symmetry 2023, 15, 1437. [Google Scholar] [CrossRef]
  7. Yin, Y.H.; Liu, X.L.; Hu, B.; Chen, W.J.; Guo, X.; Ma, D.Y.; Ding, X.H.; Han, L.H.; Yu, Q.F. A displacement measurement methodology for deformation monitoring of long-span arch bridges during construction based on scalable multi-camera system. Comput. Aided Civil Infrastruct. Eng. 2025, 40, 1871–1885. [Google Scholar] [CrossRef]
  8. Nguyen, A.C.; Weinand, Y. Displacement study of a large-scale freeform timber plate structure using a total station and a terrestrial laser scanner. Sensors 2020, 20, 413. [Google Scholar] [CrossRef]
  9. Psimoulis, P.A.; Stiros, S.C. Measuring deflections of a short-span railway bridge using a robotic total station. J. Bridge Eng. 2013, 18, 182–185. [Google Scholar] [CrossRef]
  10. Han, Y.T.; Feng, D.M.; Wu, W.W.; Yu, X.Y.; Wu, G.; Liu, J.X. Geometric shape measurement and its application in bridge construction based on UAV and terrestrial laser scanner. Autom. Constr. 2023, 151, 104880. [Google Scholar] [CrossRef]
  11. Yang, T.; Zou, Y.; Yang, X.F.; Del Rey Castillo, E. Domain knowledge-enhanced region growing framework for semantic segmentation of bridge point clouds. Autom. Constr. 2024, 165, 105572. [Google Scholar] [CrossRef]
  12. Yang, X.F.; Del Rey Castillo, E.; Zou, Y.; Wotherspoon, L.; Tan, Y. Automated semantic segmentation of bridge components from large-scale point clouds using a weighted superpoint graph. Autom. Constr. 2022, 142, 104519. [Google Scholar] [CrossRef]
  13. Jing, Y.X.; Sheil, B.; Acikgoz, S. A lightweight Transformer-based neural network for large-scale masonry arch bridge point cloud segmentation. Comput. Aided Civil Infrastruct. Eng. 2024, 39, 2427–2438. [Google Scholar] [CrossRef]
  14. Lamas, D.; Justo, A.; Soilán, M.; Riveiro, B. Automated production of synthetic point clouds of truss bridges for semantic and instance segmentation using deep learning models. Autom. Constr. 2024, 158, 105176. [Google Scholar] [CrossRef]
  15. Jing, Y.X.; Zhong, J.X.; Sheil, B.; Acikgoz, S. Anomaly detection of cracks in synthetic masonry arch bridge point clouds using fast point feature histograms and PatchCore. Autom. Constr. 2024, 168, 105766. [Google Scholar] [CrossRef]
  16. Valença, J.; Puente, I.; Júlio, E.; González-Jorge, H.; Arias-Sánchez, P. Assessment of cracks on concrete bridges using image processing supported by laser scanning survey. Constr. Build. Mater. 2017, 146, 668–678. [Google Scholar] [CrossRef]
  17. Puri, N.; Turkan, Y. Bridge construction progress monitoring using lidar and 4D design models. Autom. Constr. 2020, 109, 102961. [Google Scholar] [CrossRef]
  18. Cha, G.C.; Park, S.; Oh, T. A terrestrial LiDAR-based detection of shape deformation for maintenance of bridge structures. J. Constr. Eng. Manag. 2019, 145, 04019075. [Google Scholar] [CrossRef]
  19. Gawronek, P.; Makuch, M. TLS measurement during static load testing of a railway bridge. ISPRS Int. J. Geo-Inf. 2019, 8, 44. [Google Scholar] [CrossRef]
  20. Lõhmus, H.; Ellmann, A.; Märdla, S.; Idnurm, S. Terrestrial laser scanning for the monitoring of bridge load tests–two case studies. Surv. Rev. 2018, 50, 270–284. [Google Scholar] [CrossRef]
  21. Mahphood, A.; Arefi, H. Grid-based building outline extraction from ready-made building points. Autom. Constr. 2022, 139, 104321. [Google Scholar] [CrossRef]
  22. Erdélyi, J.; Kopáčik, A.; Lipták, I.; Kyrinovič, P. Automation of point cloud processing to increase the deformation monitoring accuracy. Appl. Geomat. 2017, 9, 105–113. [Google Scholar] [CrossRef]
  23. Xiong, W.; Diaw, I.; Zhu, Y.J.; Zhang, H.W.; Cai, C.S. Spatial shape identification of long-span suspension bridges using 3d laser scanning technology. J. Civ. Struct. Health Monit. 2024, 14, 383–400. [Google Scholar] [CrossRef]
  24. Li, X.X.; Deng, E.; Wang, Y.W.; Ni, Y.Q. 3D laser scanning for predicting the alignment of large-span segmental precast assembled concrete cable-stayed bridges. Autom. Constr. 2023, 155, 105056. [Google Scholar] [CrossRef]
  25. Derpanis, K.G. Overview of the RANSAC algorithm. Image Rochester NY 2010, 4, 2–3. [Google Scholar]
  26. Xu, Y.S.; Tong, X.H.; Stilla, U. Voxel-based representation of 3D point clouds: Methods, applications, and its potential use in the construction industry. Autom. Constr. 2021, 126, 103675. [Google Scholar] [CrossRef]
  27. Greenacre, M.; Groenen, P.J.F.; Hastie, T.; D’Enza, A.L.; Markos, A.; Tuzhilina, E. Principal component analysis. Nat. Rev. Method. Prim. 2010, 2, 433–459. [Google Scholar] [CrossRef]
  28. Hansen, P.C.; Pereyra, V.; Scherer, G. Least Squares Data Fitting with Applications; JHU Press: Baltimore, MD, USA, 2013. [Google Scholar]
  29. Suhulz, E.; Speekenbrink, M.; Krause, A. Atutorial on Gaussian process regression: Modelling, exploring, and exploiting functions. J. Math. Psychol. 2018, 85, 1–16. [Google Scholar] [CrossRef]
  30. Williams, C.K.I.; Rasmussen, C.E. Gaussian processes for regression. Adv. Neural Inf. Process. Syst. 1995, 8. Available online: https://proceedings.neurips.cc/paper/1995/hash/7cce53cf90577442771720a370c3c723-Abstract.html (accessed on 11 July 2025).
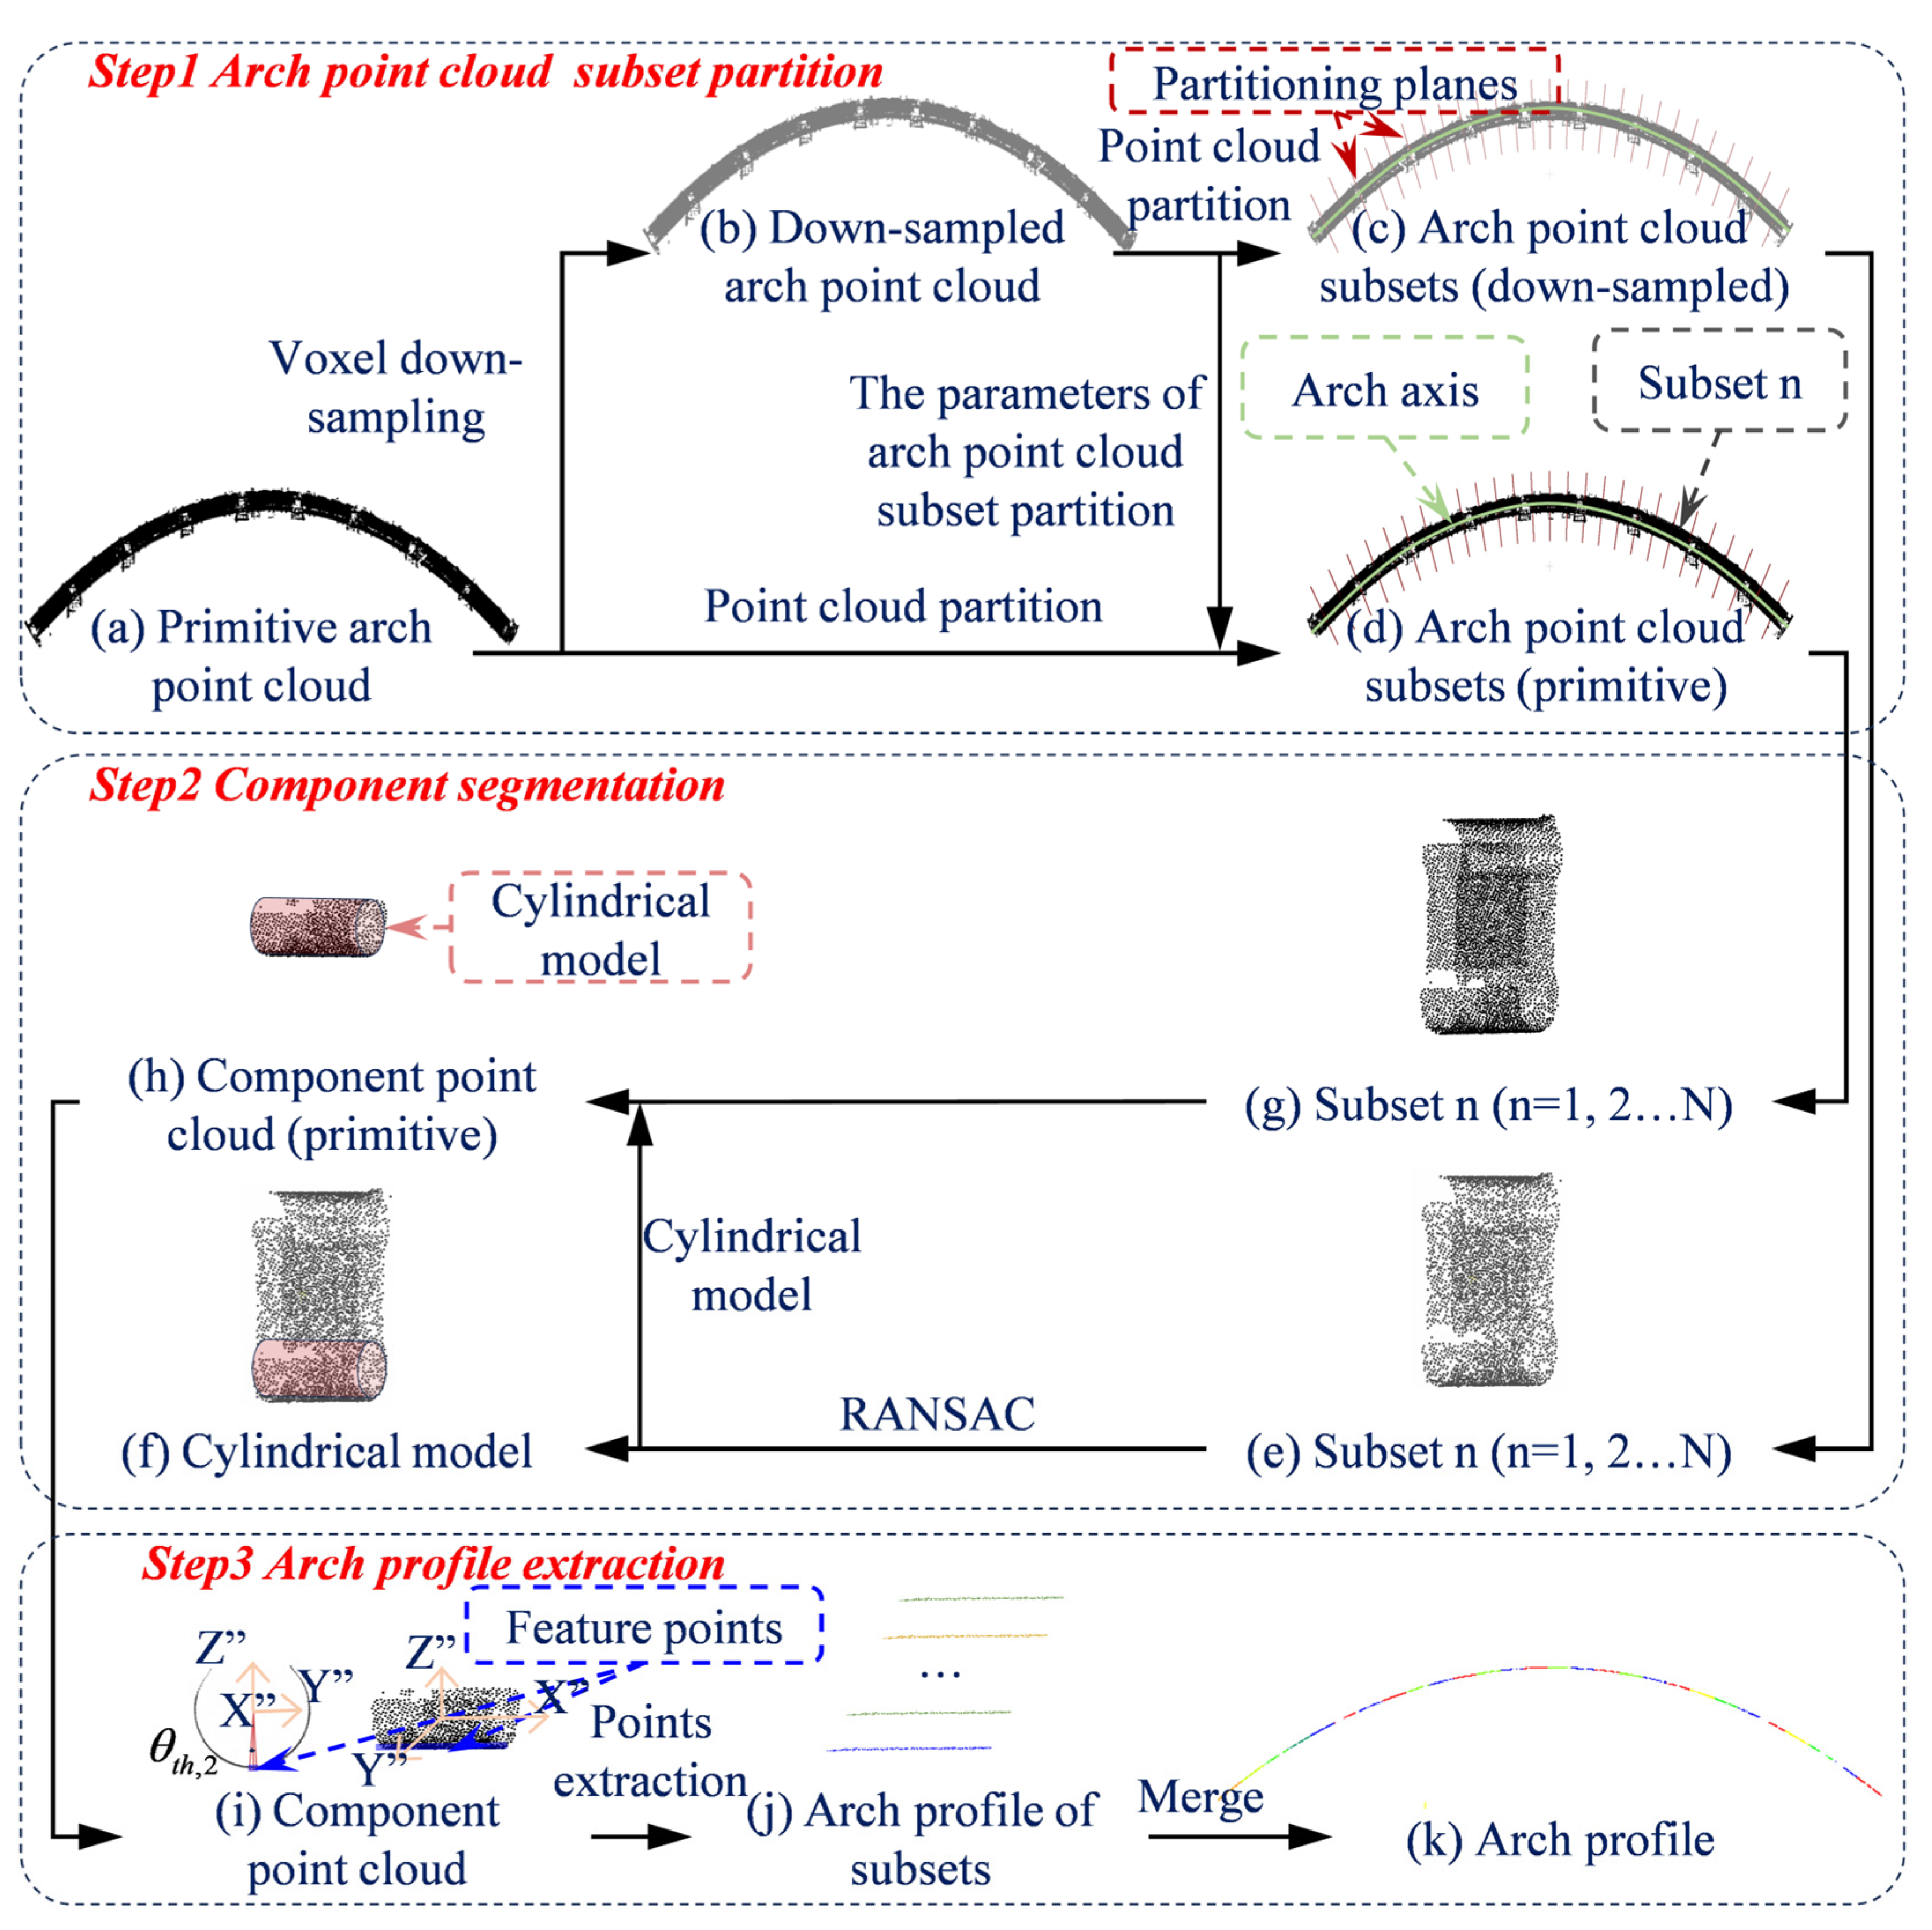
Figure 1. Workflow for arch profile automatic extraction framework.
Buildings 15 02912 g001
Figure 2. Workflow for arch point cloud subset partition.
Buildings 15 02912 g002
Figure 3. Schematic diagram of local coordinate system transformation for component point cloud.
Buildings 15 02912 g003
Figure 4. The through-type CFST arch bridge: (a) the spans layout of the entire bridge; (b) the critical construction stages for point cloud acquisition; (c) the construction site and devices.
Buildings 15 02912 g004
Figure 5. Measurement station and target arrangement scheme.
Buildings 15 02912 g005
Figure 6. Schematic diagram of the local arch point cloud: (a) front view and (b) sectional view.
Buildings 15 02912 g006
Figure 7. Schematic diagram of vertical deformation calculation between adjacent construction stages.
Buildings 15 02912 g007
Figure 8. Vertical deformation of arch during lower-tube and web-space concrete pouring: (a) left arch and (b) right arch.
Buildings 15 02912 g008
Figure 9. Vertical deformation of arch during second-stage prestressing of tie beam: (a) left arch and (b) right arch.
Buildings 15 02912 g009
Figure 10. Vertical deformation of arch during hanger tensioning: (a) left arch and (b) right arch.
Buildings 15 02912 g010
Figure 11. Vertical deformation of arch during falsework removal of continuous girder: (a) left arch and (b) right arch.
Buildings 15 02912 g011
Figure 12. Prism target arrangement scheme: (a) six-section arrangement and (b) eight-section arrangement.
Buildings 15 02912 g012
Table 1. Point cloud data processing results for the different construction stages of the arch bridge.
Point Cloud Acquisition by TLSArch Bridge Point CloudArch Point CloudArch Profile
The 1st acquisitionBuildings 15 02912 i001
(point count = 933,590,837)
Buildings 15 02912 i002
(point count = 24,078,996)
Buildings 15 02912 i003
(point count = 141,038)
The 2nd acquisitionBuildings 15 02912 i004
(point count = 633,536,300)
Buildings 15 02912 i005
(point count = 39,415,439)
Buildings 15 02912 i006
(point count = 85,369)
The 3rd acquisitionBuildings 15 02912 i007
(point count = 537,051,279)
Buildings 15 02912 i008
(point count = 38,937,110)
Buildings 15 02912 i009
(point count = 167,111)
The 4th acquisitionBuildings 15 02912 i010
(point count = 770,959,076)
Buildings 15 02912 i011
(point count = 47,674,762)
Buildings 15 02912 i012
(point count = 538,979)
The 5th acquisitionBuildings 15 02912 i013
(point count = 758,519,093)
Buildings 15 02912 i014
(point count = 46,700,482)
Buildings 15 02912 i015
(point count = 667,235)
Table 2. The algorithm parameters used in the automated arch profile extraction from the point clouds.
Sub StepParameterValueRationale
Step 1Voxel down-samplingVoxel size Δ 0.05 mMatches the minimum cross-sectional dimension of component.
Coarse partitionPartition length l11 mApproximates the width of arch cross-sections.
Partition along the curvePartition length l20.25 mOne quarter of the cross-section width.
Step 2RANSACAngle threshold θ t h , 1 7.5°Reflects maximum allowable deviation between cylindrical axis and arch transverse direction (v3).
Radius deviation t0.01 mEnsures extracted cylinders match design radius R.
Distance threshold d th , 1 0.05 mMatches voxel size to filter noise while retaining points within typical surface roughness.
Minimum number of internal points MinPts110Threshold derived empirically. Reject spurious cylinders.
Expected probability p0.99Ensures >99% probability of finding valid cylinders within iterations.
Maximum number of iterations k 1 × 1 0 6 Conservative upper bound for complex scenes.
Coarse extractionDistance threshold d th , 2 0.05 mConsistent with RANSAC inlier threshold to maintain data coherence.
Fine ExtractionAngle threshold θ t h , 2 Filters non-radial points. Tolerance set below typical noise levels in TLS normal estimation.
Step 3Lower profile extractionAngle threshold θ t h , 3 Small value chosen for high accuracy in profile feature identification.
Table 3. RMSE of vertical deformation for TLS.
Construction StageLeft Arch (mm)Right Arch (mm)
Lower-tube and web-space concrete pouring4.132.22
Second-stage prestressing of the tie beam0.240.93
Hanger tensioning2.602.48
Falsework removal of the continuous girder2.243.25
Disclaimer/Publisher’s Note: The statements, opinions and data contained in all publications are solely those of the individual author(s) and contributor(s) and not of MDPI and/or the editor(s). MDPI and/or the editor(s) disclaim responsibility for any injury to people or property resulting from any ideas, methods, instructions or products referred to in the content.