Article

Street Vitality Evaluation of the Mengzi East Street Historical District Based on Space Syntax and POI Big Data

School of Architecture and Urban Planning, Kunming University of Science and Technology, Kunming 650500, China
*
Authors to whom correspondence should be addressed.
Buildings 2025, 15(16), 2896; https://doi.org/10.3390/buildings15162896
Submission received: 26 June 2025 / Revised: 11 August 2025 / Accepted: 13 August 2025 / Published: 15 August 2025
(This article belongs to the Section Architectural Design, Urban Science, and Real Estate)

Abstract

The decline and revitalization of vitality in historic districts of small- and medium-sized cities undergoing rapid urbanization is a frontier issue in global heritage conservation and urban regeneration. Using the East Street Historic District in Mengzi, Yunnan, as a case study, this study proposes a “space–function–time” coupling framework. Topological accessibility is quantified through space syntax metrics—Integration Value (2021) and Integration Value (2025), as well as Choice Value (2021) and Choice Value (2025)—while functional aggregation is represented by POI kernel density analysis. A “Deviation Degree–Change in Deviation Degree” model is developed to track the dynamic evolution before and after the implementation of the conservation plan (2021–2025). The findings indicate that (1) the linear correlation between Integration Value and POI density decreases from a moderate level (r = 0.42) in 2021 to a weak correlation (r = 0.32) in 2025, revealing that the spatial–functional coordination mechanism in small- and medium-sized city historic districts is considerably more fragile than in large cities; (2) Identifying streets with abnormal deviations: The primary street, Renmin Middle Road, exhibits a deviation degree as high as 4.160 due to excessive commercial aggregation, resulting in a “high accessibility–high load” imbalance. The secondary street, Dashu Street, although demonstrating a relatively high Integration Value (0.663), shows a “high accessibility–low vitality” condition due to insufficient functional facilities; (3) the Deviation Degree–Change in Deviation Degree model accurately identifies High Deviation Streets, Medium Deviation Streets, and Low Deviation Streets, and provides quantitative thresholds for planning feedback. This study introduces the Deviation Degree–Change in Deviation Degree model for the first time into the evaluation of historic district renewal in small- and medium-sized cities, establishing a closed-loop “diagnosis–intervention–reassessment” tool. The proposed framework offers both a methodological and operational paradigm for precision-oriented urban regeneration in historic districts.

1. Introduction

1.1. From Static Preservation to Dynamic Regeneration: A Paradigm Shift in Historic Districts of Small- and Medium-Sized Cities

Since the adoption of the Washington Charter and the Recommendation on the Historic Urban Landscape, global heritage discourse has undergone a substantial shift—from static preservation to dynamic regeneration—emphasizing the sustainable evolution of urban heritage [1,2,3]. Within this context, historic districts in small- and medium-sized cities face distinctive challenges under accelerated urbanization and the dual pressures of capital globalization. Funding shortages, population outflow, and economic monocultures often confine these areas to a cycle of “spatial decay–functional imbalance” [4]. The East Street Historic District in Mengzi (Figure 1) exemplifies this trajectory. Once a thriving commercial hub centered on the Yunnan–Vietnam Railway, it has experienced a steady decline following the relocation of railway freight operations, the northward shift of the administrative center, and the outmigration of younger residents. Over the past four decades, the district has evolved into a representative case of spatial–functional mismatch within the global heritage discourse, underscoring the vulnerability of historic sites in contemporary urban development.

1.2. Research Gap: Methodological Fragmentation Across the Space–Function–Time Dimensions

Existing scholarship reveals two major methodological deficiencies. First, while space syntax provides precise quantification of topological accessibility, it remains limited in capturing the temporal dynamics of functional aggregation and the multidimensional socio-cultural attributes of urban spaces [2]. Second, although POI big data effectively reflects the dynamic evolution of commercial activities, it offers limited insight into spatial usage patterns and lacks intuitive feedback mechanisms for spatial planning [5]. More critically, the majority of coupling studies have concentrated on megacities, such as Chengdu [6] and Xi’an [7], leaving the applicability of such methods to historic districts in small- and medium-sized cities largely untested. Furthermore, the absence of dynamic evaluation tools encompassing the full “planning–implementation–feedback” cycle has resulted in regeneration strategies that depend heavily on experiential trial-and-error and slow iterative adjustments, thereby constraining the scientific basis for historic district renewal.

1.3. Research Objectives and Scientific Questions

This study centers on the East Street Historic District in Mengzi. Guided by the Mengzi East Street Historic Cultural District Conservation Plan (2021–2035), notable progress has been achieved since the initiation of renewal efforts in 2021, particularly in architectural restoration and infrastructure upgrading, resulting in improved physical conditions. However, a systematic and quantitative assessment of spatial utilization efficiency and the degree of functional alignment remains lacking. To address this gap, the research is structured around three core scientific questions:
(1)
Integration of Methods: How can space syntax metrics and temporal POI data be methodologically integrated to construct a dynamic evaluation framework for street vitality in historic districts?
(2)
Closed-Loop Feedback: How can quantitative tools be developed to enable dynamic, closed-loop feedback for planning and intervention processes?
(3)
Applicability to Developing Contexts: How can the adaptability of this approach be enhanced for historic cultural areas in small- and medium-sized cities and towns in developing countries?
Ultimately, this study seeks to evaluate the vitality evolution of the Mengzi historic district through a “space–function–time” coupling framework, bridge the identified methodological gaps, and deliver a systematic evaluation tool to inform conservation and renewal strategies.

2. Theoretical Background

2.1. Methodological Evolution and Research Progress

Streets shape public perception of urban space by guiding patterns of pedestrian movement and encouraging or discouraging lingering [8]. Streets with high vitality foster sustained interactions between residents and visitors, thereby supporting sustainable regional development [9]. Conversely, a decline in vitality often results in functional monotony and population outmigration. Thus, scientifically assessing street vitality in historic districts—and exploring its relationship with urban morphology and commercial distribution—is critical for providing an evidence base for coordinated conservation and renewal strategies [7].
The academic discourse on street vitality can be traced to Jane Jacobs’ “eyes on the street” theory, which emphasizes functional mix and small-scale blocks as catalysts for urban vitality [10]. Kevin Lynch extended this perspective by incorporating vitality into evaluations of urban spatial quality, asserting that vitality depends on both spatial accessibility and functional diversity [11]. Subsequent research has operationalized street vitality as the manifestation of human activities sustained by the built environment and its physical infrastructure [12,13], with consensus emerging around two core determinants: accessibility—comprising spatial connectivity, public transport availability, and facility density—and functional diversity [14,15]. Empirical studies have further substantiated and expanded these theoretical foundations. Borràs et al. found that street vitality in Barcelona’s Novarís district is strongly correlated with population density, proximity to the historic core, and the orthogonality of the street network [16]. Ola Hassan et al. developed the Alexander Sustainable Transportation Framework, underscoring the pivotal roles of accessibility and environmental quality in shaping urban vitality [17]. Similarly, Lu’s study in Chengdu confirmed that communities with balanced building density, functional diversity, and strong public transport accessibility exhibit significantly higher vitality levels [6]. Collectively, these studies converge on the view that accessibility and diversity are fundamental to both measuring and fostering street vitality.
Since Hillier and Hanson introduced space syntax theory [18], it has become a widely adopted framework for analyzing spatial structure by quantifying accessibility and movement potential through indicators such as Integration Value and Choice Value [19,20]. In the context of historic district conservation in China, space syntax has proven valuable: Liang et al. confirmed the effectiveness of integration-related metrics in assessing vitality [21], while Huang and Fu demonstrated its utility in balancing heritage conservation with the optimization of commercial space [2,22]. However, limitations of the approach have become increasingly evident. Netto critiques its tendency to oversimplify complex social practices [23]. A case study in Harbin’s main urban area reveals that high spatial integration does not necessarily correspond to higher commercial activity or denser usage [24]. The prevailing assumption that spatial configuration primarily determines behavior often overlooks socio-cultural dynamics, leading to imprecise predictions [2]. Consequently, scholars have called for integrating morphological analysis with socioeconomic variables [25], infrastructure conditions [26], and multi-scale perspectives [26].
Parallel to these developments, POI big data has emerged as an important resource for representing functional distribution and urban vitality [8,27]. For example, research in Xining used POI data to map vitality patterns and confirmed a positive correlation between land-use diversity and vitality stability [28]. Kernel density estimation has been employed to capture the non-linear effects of POI distribution on vitality [29]. Yet, approaches focusing solely on functional attributes provide limited insight into the carrying capacity of the spatial structure [5]. The integration of space syntax with POI big data has thus become a prominent research direction. Atakara combined space syntax and GIS technologies to investigate the morphological evolution of traditional urban cores in historical periods [30], while Srivanit applied both methods to analyze the spatial distribution and diversity of economic activities [31]. Chinese case studies have yielded similar findings in Wuxi Old Town, Hefei Huaihe Road, and the Macau Peninsula [32,33,34]. Nevertheless, research in Guilin demonstrates that spatial morphology and functional activities are not always aligned [35], underscoring the complexity of their relationship. Moreover, the majority of integrated studies focus on large-city cores, leaving a methodological gap in understanding and managing historic districts in small- and medium-sized towns.
Compared with large metropolitan areas, historic districts in small- and medium-sized towns exhibit distinctive spatial and socio-cultural characteristics. Jiménez-Espada et al. found that historic areas in Cáceres, Spain, are characterized by high building density, multifunctional public spaces, and a pronounced orientation toward tourism [36]. In the Warmia region of Poland, a compact and intricate spatial morphology was shown to promote social interaction, reinforce resident networks, and enhance individual sense of community and identity [37]. Despite these strengths, such districts are often constrained by fragile economic foundations, making the revival and transformation of historic cores highly dependent on government policy guidance and active community participation [38]. They also face more complex challenges in balancing cultural heritage conservation with sustainable development. Persistent issues include conflicts between modern construction regulations and traditional spatial layouts, as well as the need to coordinate conservation efforts between core areas with strong place identity and peripheral zones with weaker historic fabric [39]. However, existing research on historic districts in small- and medium-sized towns presents notable limitations. First, traditional vitality assessment methods often rely on single data sources and fail to capture the relationship between vitality and cultural sustainability fully. Second, studies tend to overemphasize quantitative geospatial data while neglecting qualitative insights into users’ subjective perceptions [40]. Third, efforts to reconcile historic cultural values with the enhancement of spatial vitality remain insufficient, and clear assessment standards for historic public spaces in smaller cities are still lacking [39]. In response, historic towns require data-driven spatial diagnostics that are firmly grounded in respect for cultural heritage. When combined with a gradual renewal strategy and the integration of local knowledge, such an approach can form a robust evaluative framework to guide the sustainable conservation and development of historic districts.

2.2. Research Positioning

To address these shortcomings, this study proposes a three-dimensional analytical framework based on the “space–function–time” concept (Figure 2). The framework incorporates several innovations: A two-dimensional dynamic evaluation model integrating space syntax metrics, POI time-series data, and field investigations, which quantitatively captures the dynamic relationship between spatial structure and functional distribution by classifying streets into high, medium, and low deviation categories; A comparative analysis of data from 2021 (pre-renovation) and 2025 (post-renovation) and key temporal nodes in urban morphological change, enabling precise quantification of renewal implementation effects; A focus on rapidly developing historic neighborhoods in small- and medium-sized cities, proposing differentiated planning and design strategies that address resource loss and accelerated spatial decline while uncovering latent spatial value.

3. Research Methods

3.1. Data Collection Methods

This study integrates morphological structure indicators (Integration Value and Choice Value) with functional distribution characteristics (kernel density) to derive an overall street activity score for assessing urban street vitality.
Data were collected during two phases: January to March 2021 (construction start phase) and March to June 2025 (construction completion phase). Field verification and offline data collection were conducted in March 2025, followed by data processing from April to June 2025.
Road network data were extracted from satellite imagery and supplemented with historical planning documents, surveying data, Baidu Street View (a major domestic digital mapping platform), and field verification for calibration. Street axial maps were refined using AutoCAD 2021, while UCL Depthmap 10 computed global Integration and Choice metrics to quantify street accessibility and flow potential. GIS tools facilitated coordinate correction and topological validation.
POI data for Mengzi city in March 2021 and March 2025 were obtained via the Amap API (another major domestic digital mapping platform) and calibrated against field survey data. Following established functional classification schemes [37], and referencing the Urban Land Classification Standard and Land Use Planning Specification for Construction Land, POIs within the Mengzi Old Town boundary were categorized into six types: residential, commercial, public services, transportation, cultural, and plazas. Data cleaning—including removal of temporary street vendors—and projection to the WGS_1984 coordinate system were performed using ArcGIS 10.8. Classified point layers were subsequently generated for kernel density estimation.

3.2. Data Analysis Methods

3.2.1. Space Syntax Analysis

Space syntax theory quantifies spatial accessibility and flow potential through key indices such as Integration Value and Choice Value, thereby enabling the prediction of pedestrian movement patterns and spatial utilization.
Integration Value measures the centrality and accessibility of a street segment within the overall network. Higher Integration Values indicate more central locations, characterized by fewer average steps required to access other streets and correspondingly higher pedestrian density. Conversely, lower Integration Values correspond to peripheral or marginal segments, typically associated with reduced activity levels. The calculation is expressed as follows:
M D C = 1 k 1 k d c k
R A c = M D C 1 k 2
R R A c = R A c D k
Global   integration = 1 R R A c
k: the total number of streets (or nodes/axes) in the network;
D k : this represents the shortest path depth from C to any other node in the k network;
M D C : mean depth from C to all other streets;
R R A c : normalized depth value (accounting for the total size of the network).
Choice Value reflects the potential of a street segment to carry through-traffic within the network. Higher Choice Values indicate that the segment lies along multiple shortest paths, serving as a likely traffic hub. Conversely, lower Choice Values correspond to segments with less flow passing through [41,42]. To mitigate the skewness inherent in the wide range of raw Choice Values, a natural logarithm transformation is applied for normalization, enhancing the interpretability and visualization of the results. The formula is as follows:
C h o i c e   v a l u e = j < k g j k i g j k
g j k i : number of shortest paths between j and k that pass through node i;
g j k : total number of shortest paths between j and k.

3.2.2. Kernel Density Analysis

To characterize the spatial clustering of POIs, kernel density estimation is applied using the ArcGIS tool. To accommodate both micro- and meso-scale analyses, the bandwidth is set to 100 m, striking a balance between reducing noise and preserving spatial detail. This bandwidth parameter is consistently applied across the temporal dataset and refined through sensitivity analysis. Higher kernel density values represent areas with denser concentrations of points of interest, whereas lower values indicate sparser distributions [35]. The estimation is computed according to the following formula:
    f n x = 1 n h i = 1 n K x x i h
n: total number of POI points in the study area;
h: bandwidth (search radius, e.g., 100 m), controlling density smoothing.
x i : location of the i-th POI point;
K: kernel function (often a bell-shaped curve), representing distance-decay weighting.

3.2.3. Spatial Overlay Analysis

Overlay analysis is conducted in ArcGIS by integrating space syntax metrics (integration and choice) with POI kernel density results within a common fishnet framework. Both datasets are spatially joined to a 20 m × 20 m grid, enabling the visualization and quantification of spatial correlations.
The Pearson correlation coefficient is applied to measure the linear relationship between spatial accessibility and functional distribution across the study area. The coefficient ranges from −1 (negative correlation) to 1 (positive correlation), with 0 representing no correlation. The magnitude of the correlation is classified as follows:
Very Weak: 0 ≤ ∣r∣ < 0.20;
Weak: 0.2 ≤ ∣r∣ < 0.4;
Moderate: 0.4 ≤ ∣r∣ < 0.6;
Strong: 0.6 ≤ ∣r∣ < 0.8;
Very Strong: ∣r∣ ≥ 0.8.
For empirical estimation, sample covariance and standard deviation were used:
  ρ X , Y = cov X , Y σ X σ Y = E X μ X Y μ Y σ X σ Y
The above formula defines the population correlation coefficient, commonly denoted by a Greek lowercase letter ρ . By estimating the sample covariance and standard deviation, the Pearson correlation coefficient can be obtained, typically represented by the lowercase English letter r .
r = i = 1 n X i X ¯ Y i Y ¯ i = 1 n X i X ¯ 2 i = 1 n Y i Y ¯ 2
To quantitatively assess the alignment between spatial functions and actual street performance, this study adopts a “Deviation Degree–Change Value” index method (see Table 1).
The deviation degree is calculated based on the spatial Integration Value and POI kernel density, using the regional mean deviation as a baseline and the sample standard deviation to define dispersion thresholds. This classification segments the area into high, medium, and low deviation zones, enabling differentiated spatial analysis. The change value captures temporal variation by measuring the difference in deviation degree between 2025 and 2021. By integrating government medium- and long-term planning periods, this study compares planning priorities with observed renewal changes, identifying mismatches and misalignments arising from building renovations, municipal upgrades, and other interventions. This facilitates the correction of renewal strategies and guides subsequent planning actions. This approach transcends the limitations of static analyses by establishing a cycle of spatial diagnosis, real-time monitoring, and planning feedback. Compared with methods relying solely on space syntax or POI data, it comprehensively captures the intrinsic relationship between spatial form and functional activity, providing robust quantitative indicators for the conservation and renewal of historic streets in small- and medium-sized urban contexts.
D e v i a t i o n   d e g r e e = K e r n e l   D e n s i t y   V a l u e × 0.001 R n
  C = D 2025 D 2021
S = D i D ¯ 2 n 1
D: Deviation degree;
C: Change in deviation degree;
D ¯ : Mean of the deviation degree in the historic district;
S: Standard deviation of the deviation degree.

4. Analysis of Mengzi East Street

4.1. Overview of the Study Area

East Street and its surrounding cultural district are situated in Mengzi City, Honghe Prefecture, Yunnan Province. This provincial-level historic cultural district reflects Mengzi’s modern history of open commerce, industrial prosperity, the revolutionary heritage of the National Southwest Associated University, and the architectural fusion of Chinese and Western styles. As illustrated in Figure 1 and Figure 3 and supported by the existing literature, from the late Qing Dynasty to the mid-Republican era (early 20th century to the 1940s), the opening of the Yunnan–Vietnam Railway and establishment of Mengzi Customs transformed Mengzi into a critical commercial port and military–political hub in southern Yunnan. The subsequent relocation of the National Southwest Associated University further stimulated cultural consumption. Capitalizing on its central location, East Street in Mengzi Old Town thrived with dense commercial activity and concentrated pedestrian flows. However, from the latter half of the 20th century—especially post-1980s—the establishment of factories and the return of the prefectural government shifted the city’s urban center. Aging infrastructure in the old town, the rise of new commercial districts, and the outmigration of younger residents contributed to the gradual decline of East Street. Consequently, spatial vitality increasingly concentrated west of the old town, invigorating the western area while the core declined.
According to the Overall Protection Plan for Mengzi East Street and Cultural District (2021–2035) (Mengzi Municipal Government), the renewal project is divided into two phases: short-term (2021–2025) and long-term (2026–2035). The district’s revitalization commenced in 2021, prioritizing building restoration, municipal infrastructure upgrades, and improvements to service facilities, primarily concentrated in the East Street and Wenmiao Lane areas. Following substantial completion and public opening of major works in early 2025, this study selects street conditions from 2021 and 2025 for a before-and-after comparison to evaluate the renewal’s impact on spatial vitality.
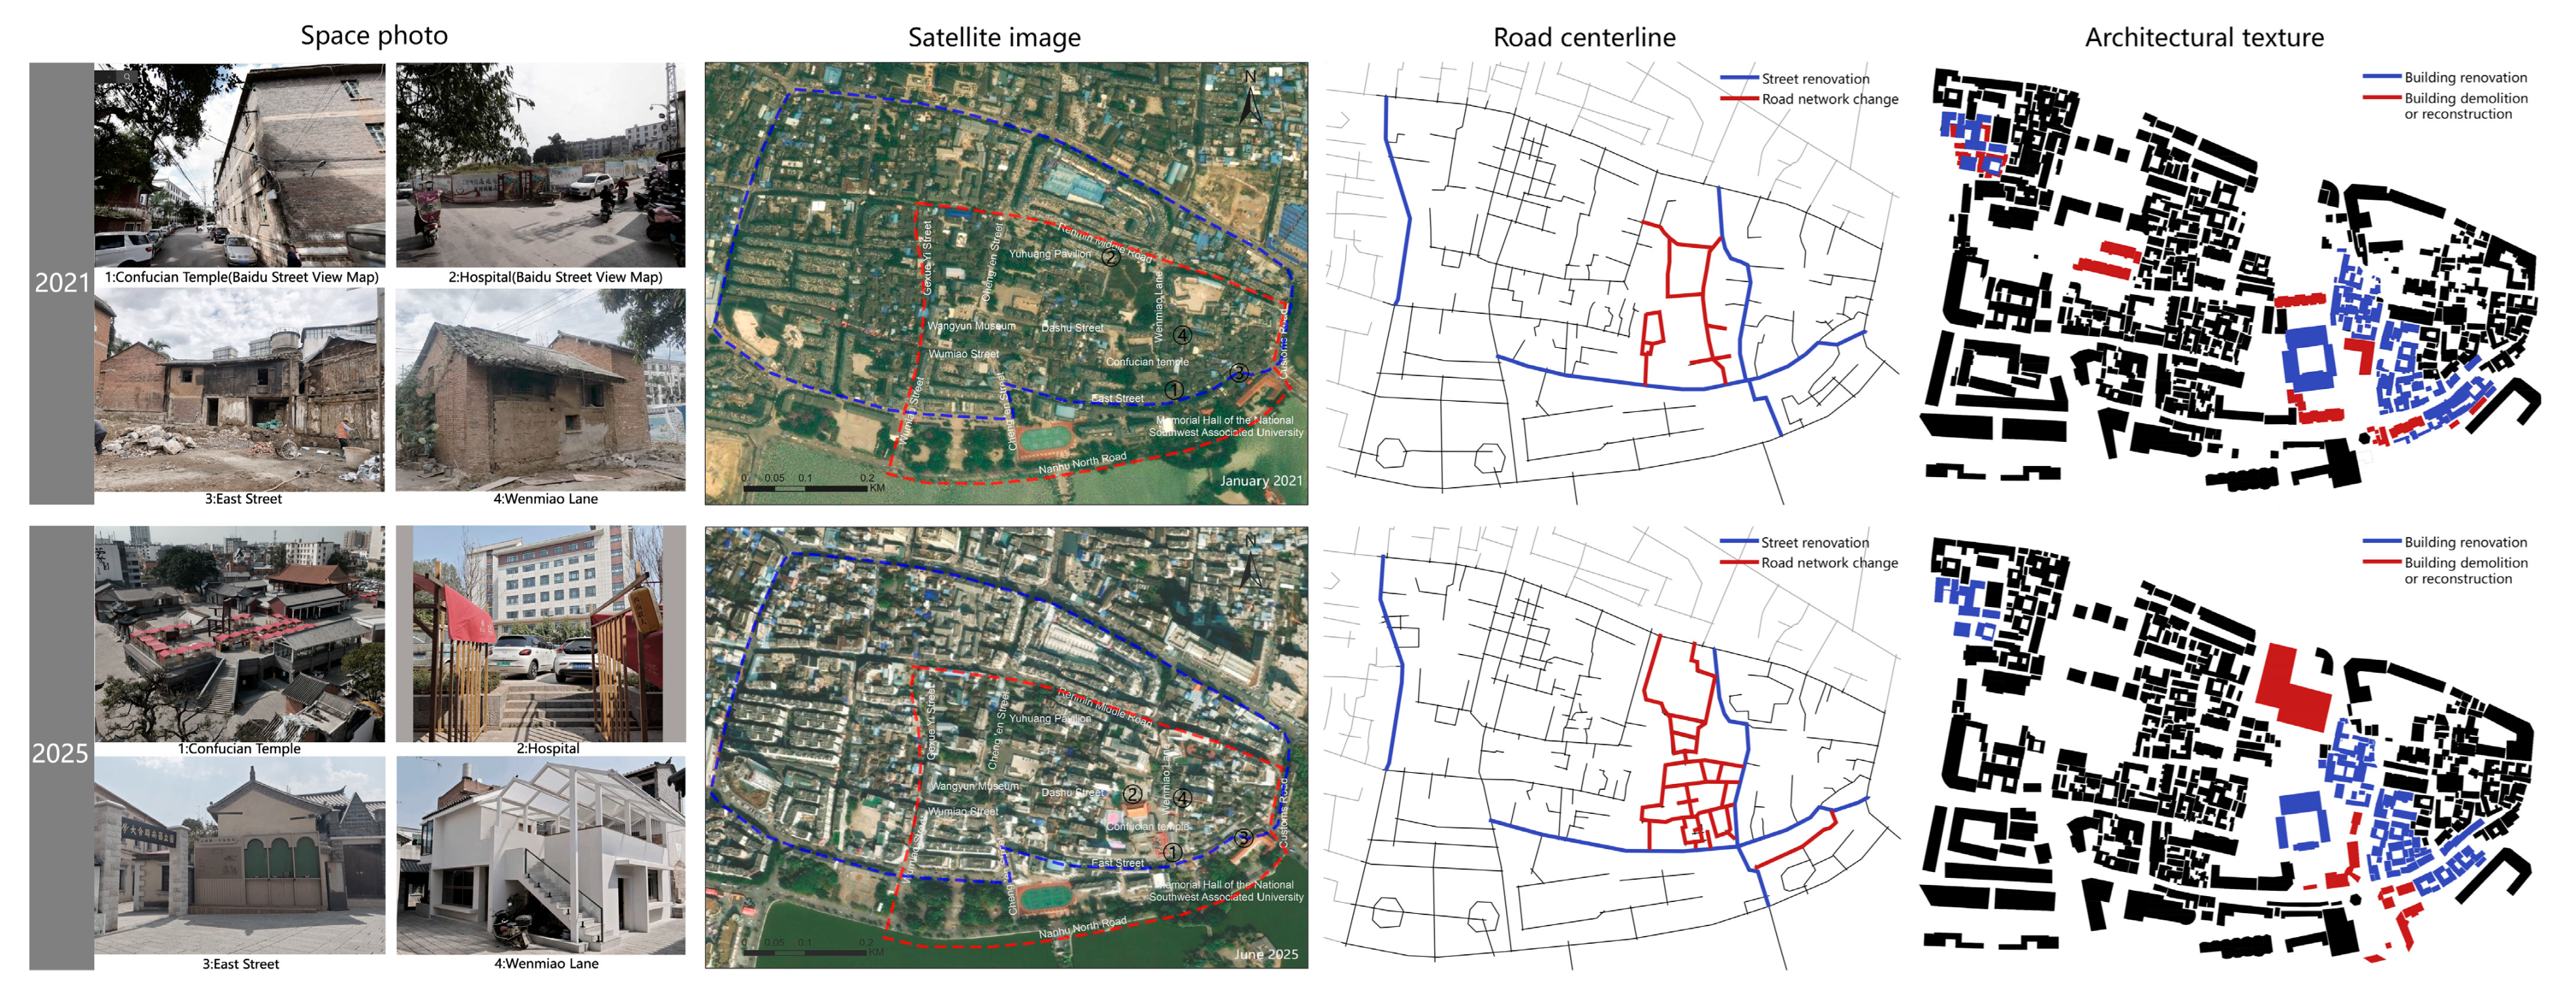
As shown in Figure 4 (with street view images sourced from Baidu Street View duly noted; all others were self-photographed), alterations to the street network and functional facilities are predominantly centered around Wenmiao Temple and Wenmiao Square. Original buildings in front of Wenmiao Temple and Yuhuang Pavilion Square were demolished, effectively “liberating” these significant historic landmarks from the confines of narrow alleys and enhancing their visual prominence. This intervention aligns more closely with the traditional spatial arrangement characteristic of Chinese temple architecture, reinforcing the axial prominence of religious structures within the historic district. A large new public facility—the Mengzi Second People’s Hospital—was constructed north of Wenmiao Temple. The hospital and temple share no physical walls; instead, a natural terrain elevation difference creates a retaining barrier approximately 0.8 m high, forming a seamless, barrier-free sloped transition between the two spaces without steps or obstacles. Renovation efforts focus on East Street and Wenmiao Lane, involving demolition of temporary and dilapidated structures while preserving and refurbishing remaining buildings. Modern brick constructions incongruent with the historic character were removed and rebuilt. Historic residences, such as the Wang family home and Miao Yunxiao’s former residence, underwent renovation and adaptive reuse, contributing to the creation of a distinctive historic cultural commercial street. Based on these renovation features, this study presents before-and-after photographs of four characteristic nodes, with shooting locations indicated on satellite imagery.
To ensure the reliability of spatial analysis, the study area encompasses the main streets of Mengzi Old Town along with selected peripheral streets. The core focus is on the renovated East Street and Wenmiao Lane, bounded by Haiguan Road to the east, Nanhu North Road to the south, Gexue Street to the west, and Renmin Middle Road to the north, covering approximately 11.8 hectares (Figure 3).

4.2. Spatial Efficiency Assessment

Integration Value analysis (Figure 5) reveals that streets with high integration in the old town cluster around the intersection of Renmin Middle Road and Cheng’en Street in the northern central area, exhibiting a clear gradient of decreasing accessibility from the center toward the periphery. This highly accessible zone includes key nodes, such as Yuhuang Pavilion, the hospital, Wangyun Museum, and Mengzi Experimental Middle School, underscoring the synergy between transportation advantages and major urban functions. In contrast, the East Street Historic District generally exhibits low Integration Values, indicating a disconnect between its rich historic architectural resources and poor spatial accessibility. Following renovation, Wenmiao Lane shows notable improvement in spatial integration: areas with low integration (depicted in blue) decrease, while medium-to-high integration zones (depicted in yellow) expand, enhancing overall connectivity. Nonetheless, this area remains one of the less accessible segments within the old town’s road network. The accessibility disparity between the eastern and western parts of the old town originates from the early development of the urban road network (see Figure 3). Early planners, guided by specific functional layouts, designed the western district with a regular grid pattern, whereas the eastern district evolved with a more winding and irregular street configuration.
Choice Value analysis (Figure 6) indicates that streets with higher Choice Values—highlighted in warm colors—are primarily concentrated along the major east–west arteries of the old town, such as Renmin Middle Road, East Street, and Nanhu North Road. This pattern reflects these roads’ roles as primary carriers of traffic flow. Within the East Street Historic District, main streets generally exhibit high Choice Values, with their spatial distribution remaining largely stable before and after renovation. The contrasting street layouts between the western and eastern districts continue to influence these patterns: the western district features a more regular grid, whereas the eastern district retains a winding, irregular street pattern.
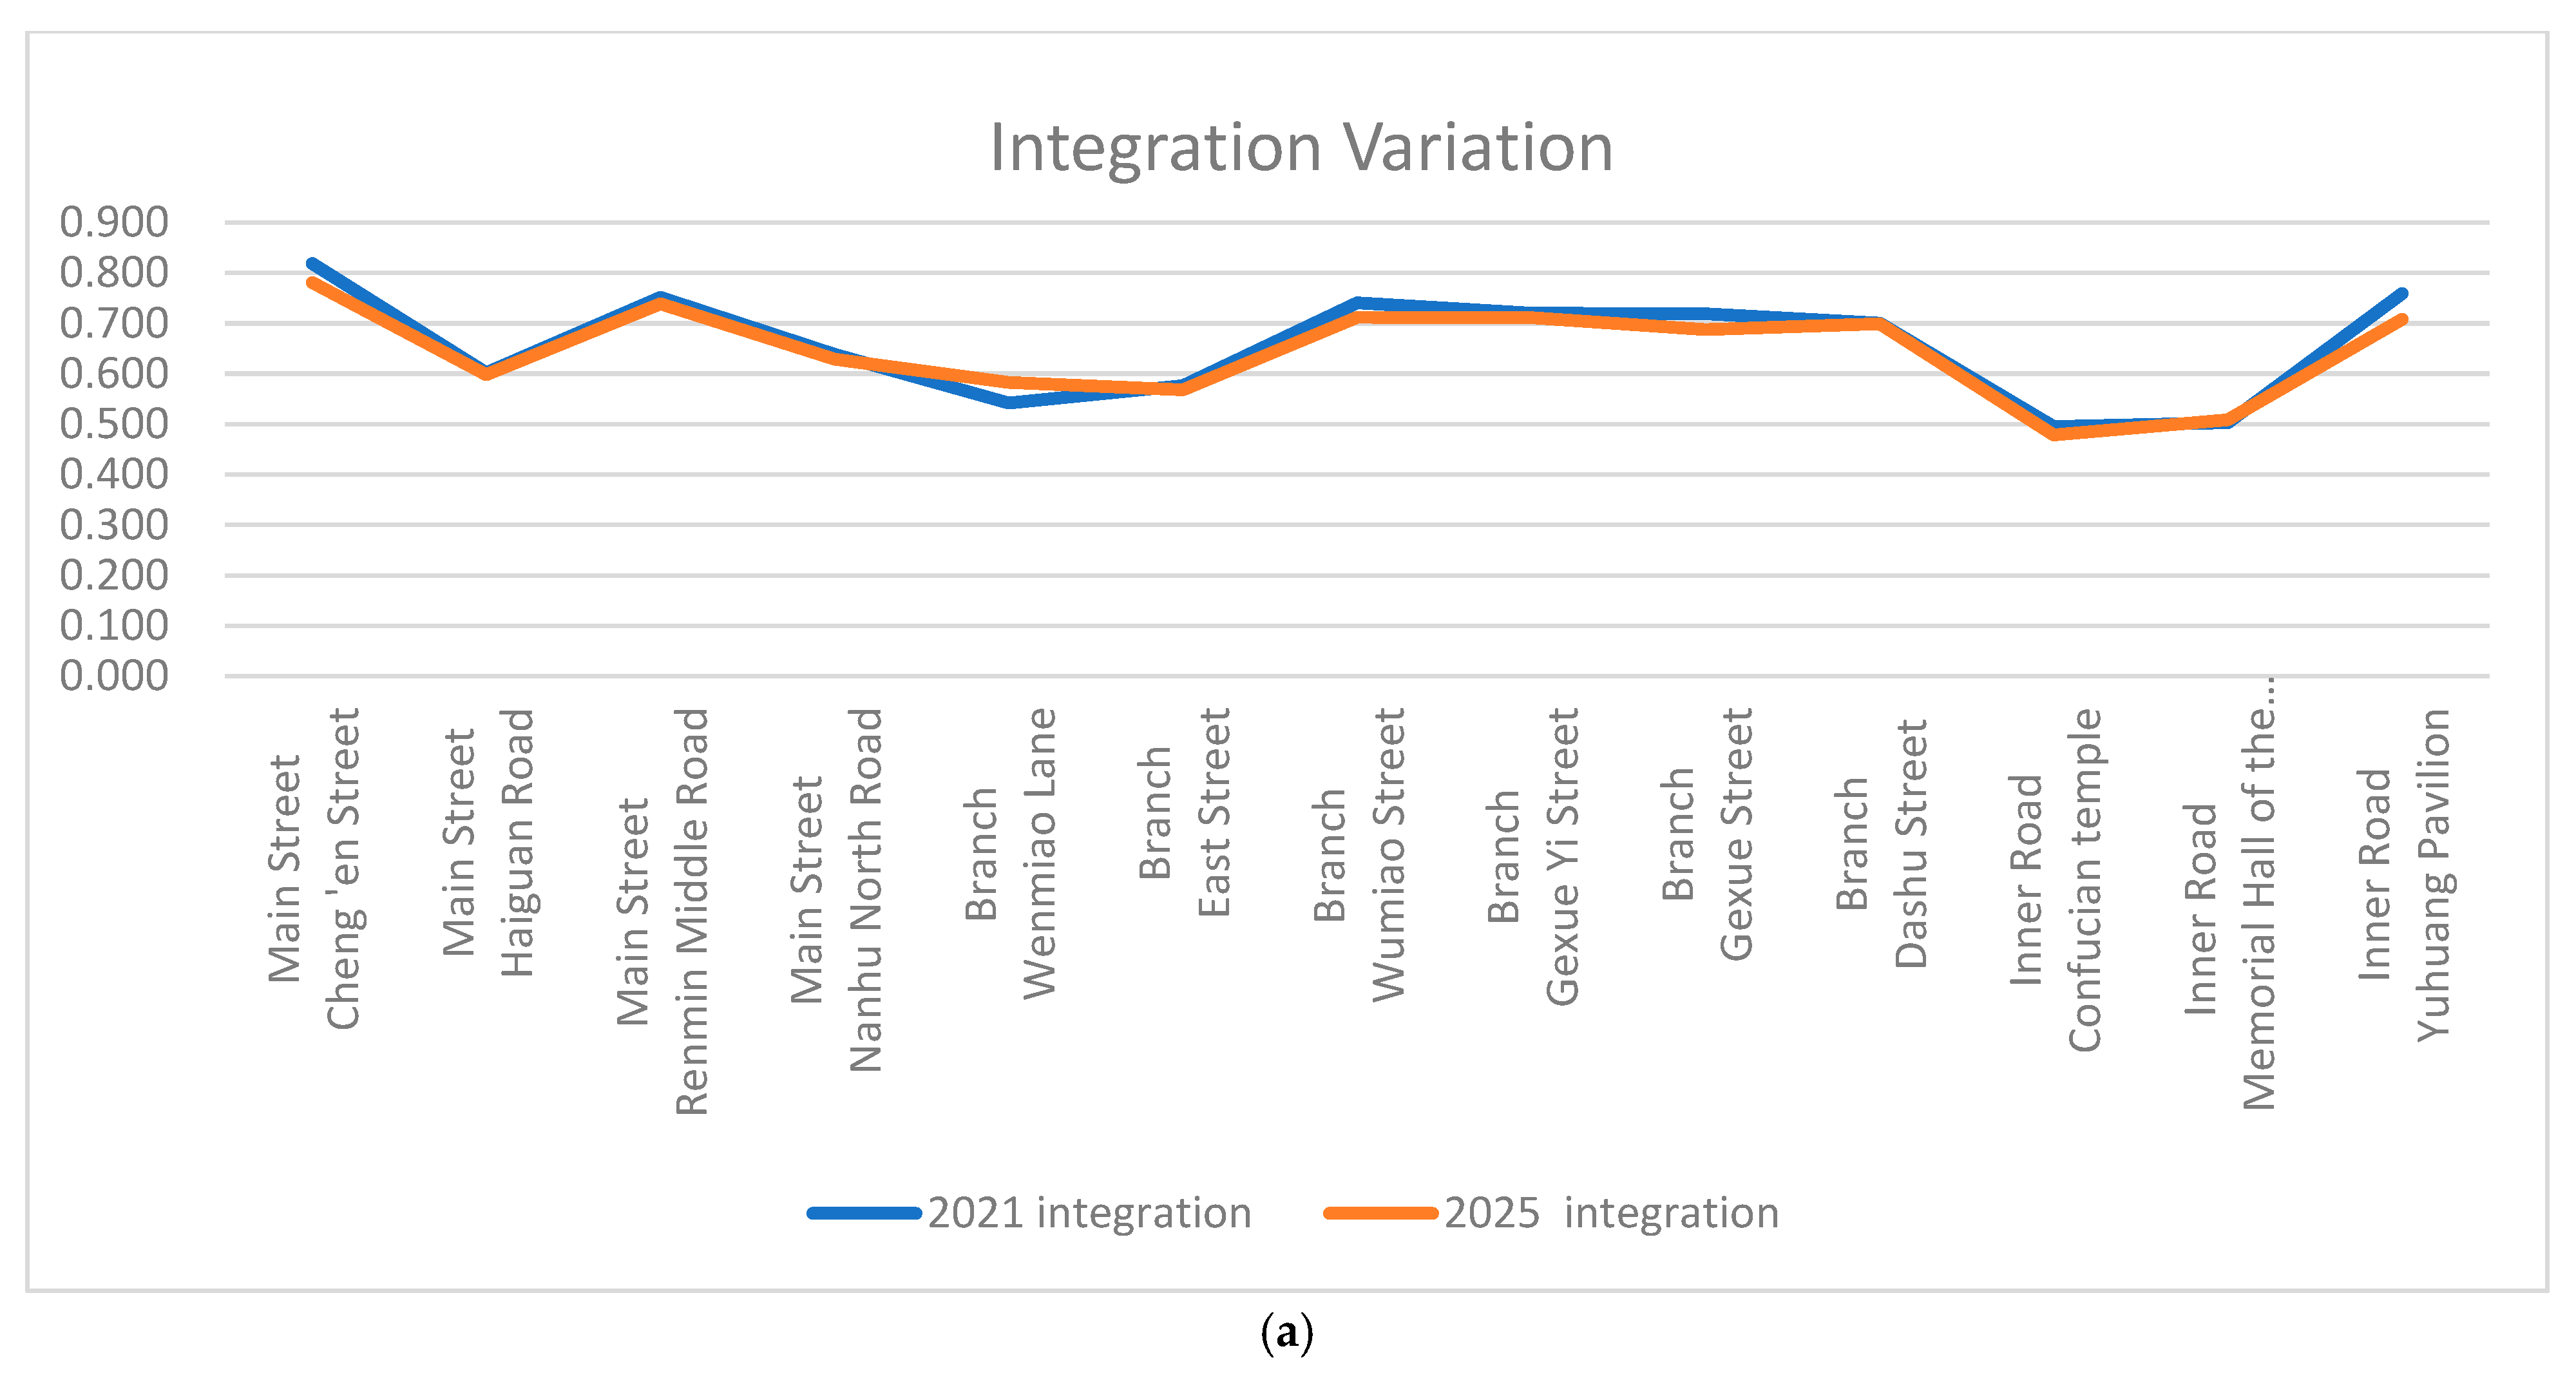
Based on the dynamic evolution analysis of Integration and Choice Values (see Table 2 and Figure 7), the following spatial structure characteristics are identified after district renewal:
Significant reinforcement of the core framework: The geometric center at the intersection of Renmin Middle Road and Cheng’en Street maintains stable or slightly decreased Integration Values, while Choice Values increase markedly. Specifically, Cheng’en Street’s Integration Value remains stable at 0.8, and its Choice Value rises from 57,712 to 60,983; Renmin Middle Road’s Choice Value increases from 51,231 to 67,976. These changes indicate a strengthening of the old town’s orthogonal spatial framework, where Renmin Middle Road functions as the main north–south axis and Cheng’en Street serves as the primary east–west connector.
Improvement of branch street networks: East Street’s Integration Value slightly decreases from 0.577 to 0.568, whereas its Choice Value rises significantly from 24,930 to 27,934. This suggests that overall accessibility remains relatively stable, while East Street’s role as a traffic conduit linking main roads and internal functional areas is enhanced. Wenmiao Lane shows notable increases in both Integration and Choice Values, with Integration rising from 0.542 to 0.583 and Choice Value from 13,805 to 24,994. These results confirm that the demolition of old buildings and creation of an open plaza south of Wenmiao enhances the spatial permeability and connectivity of East Street and adjacent streets.

4.3. Functional Compatibility Assessment

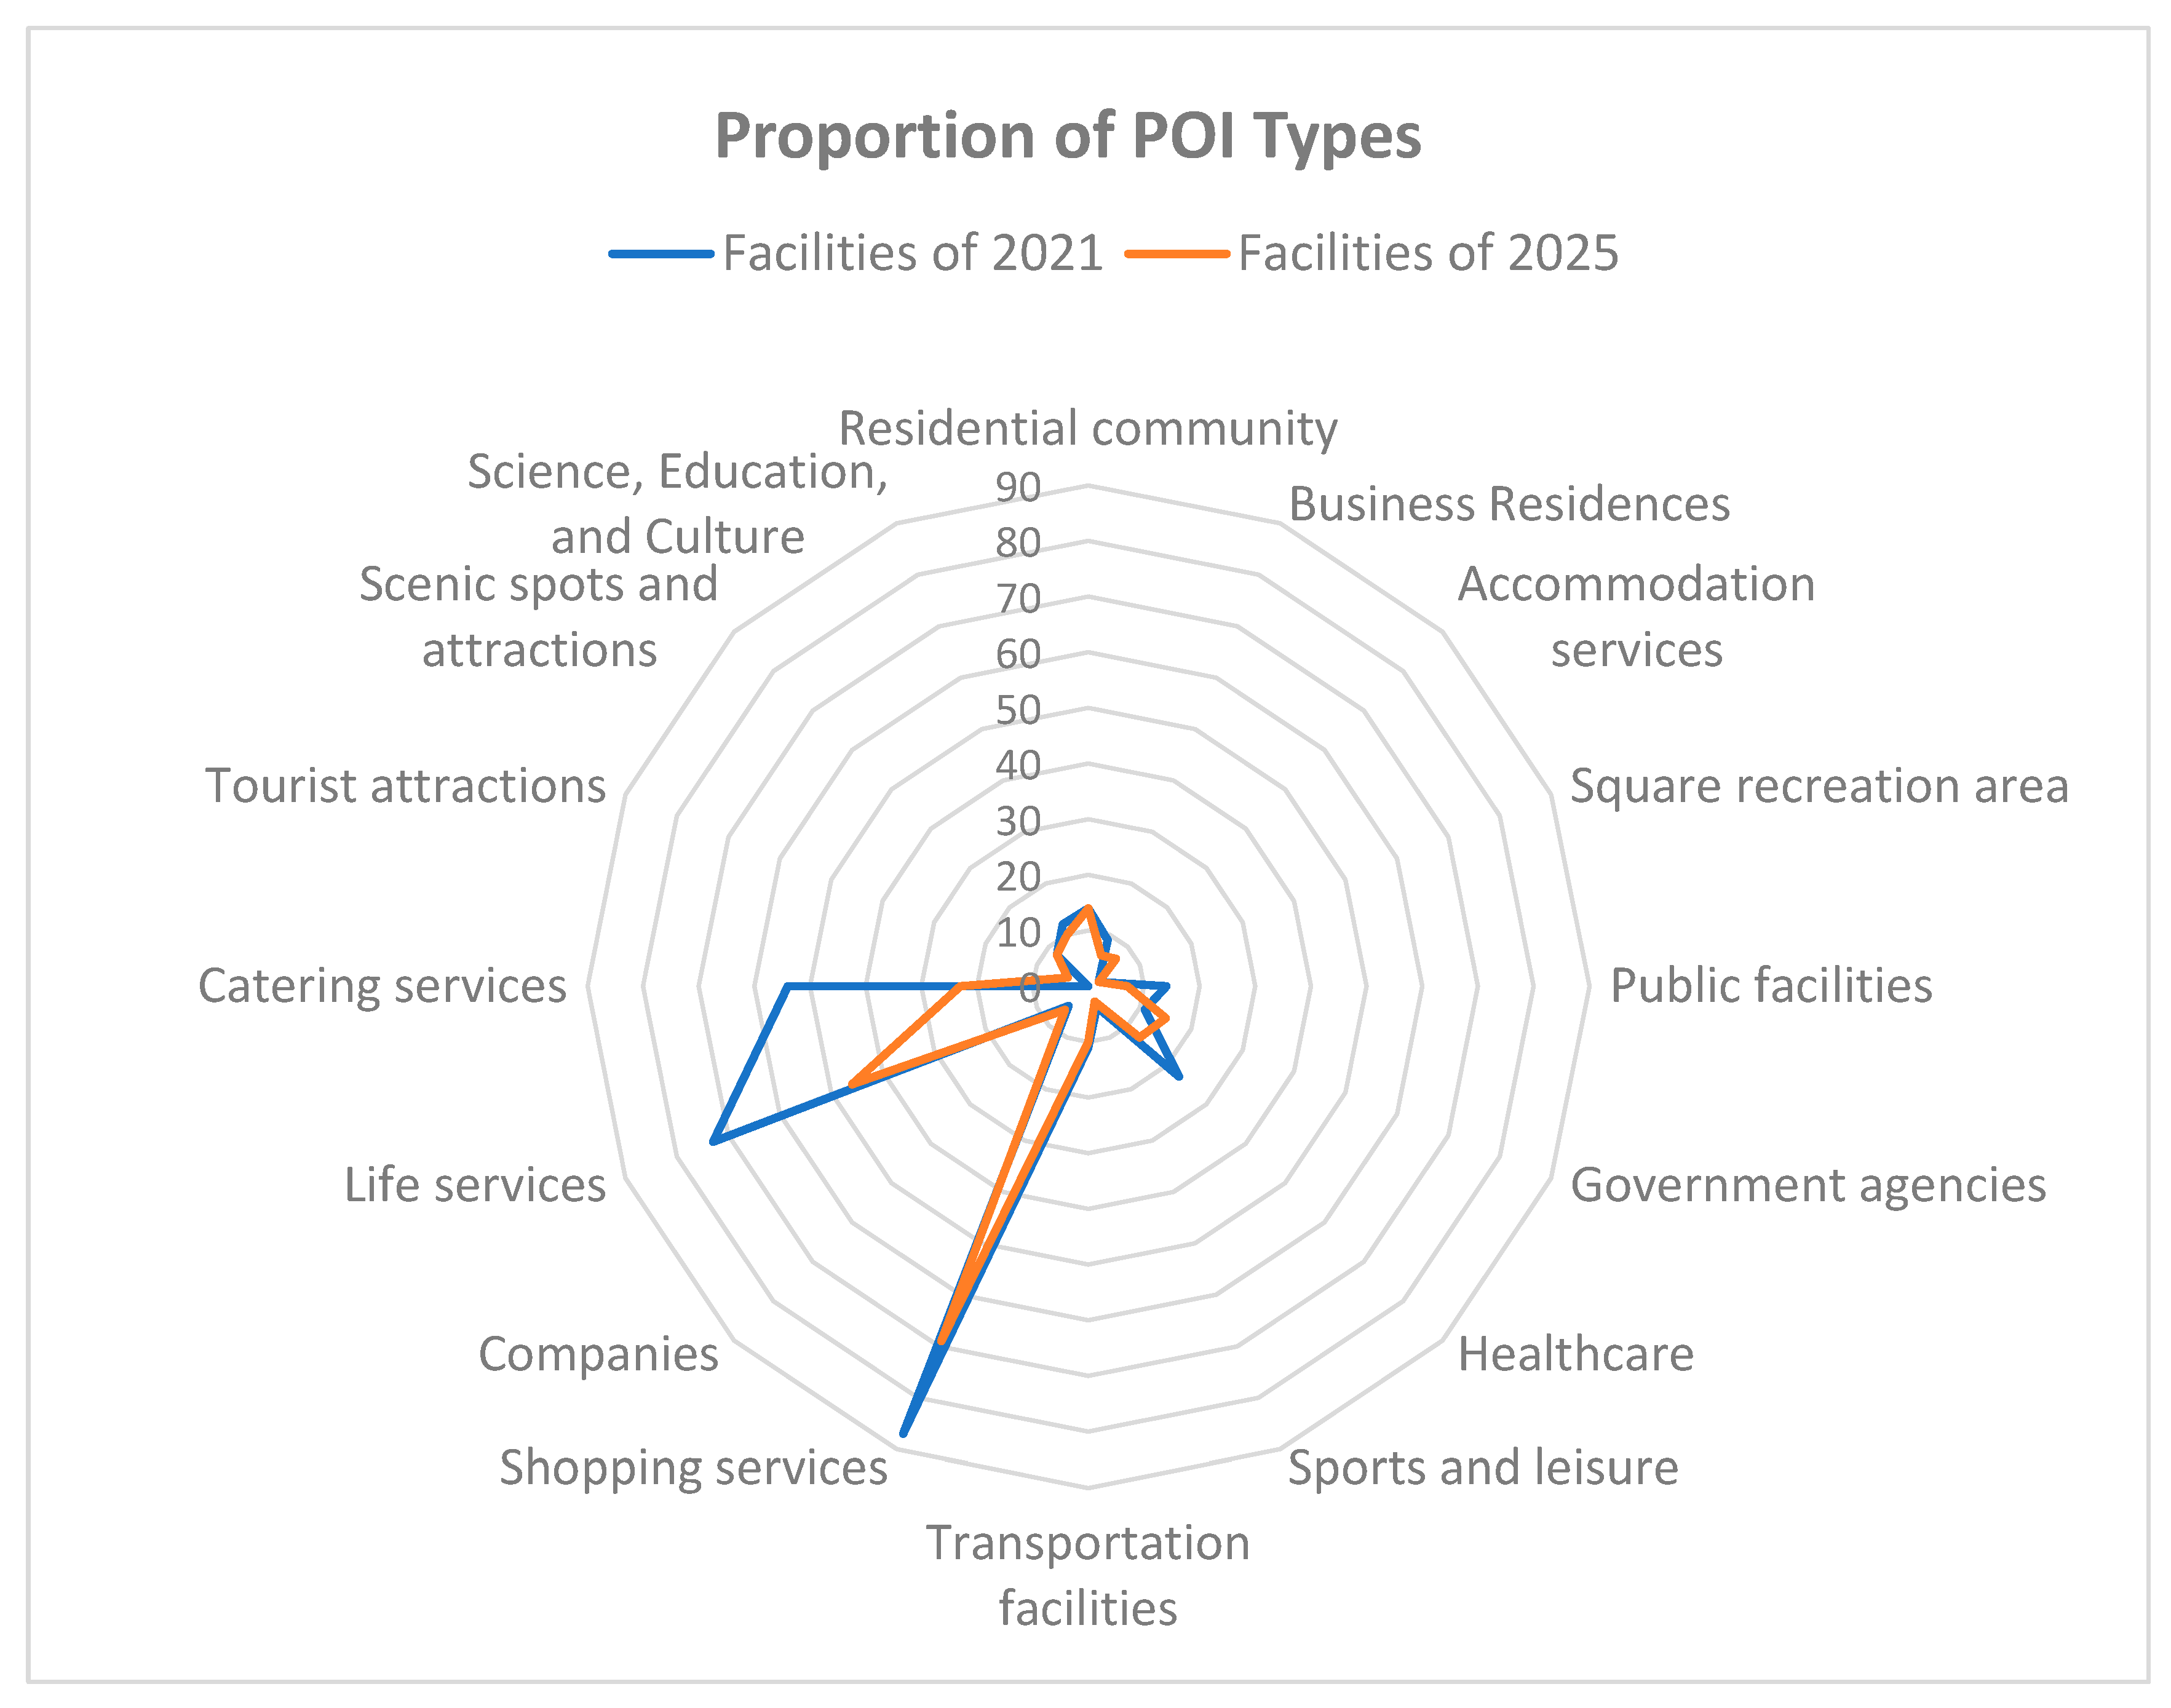
The functional compatibility assessment analyzes the spatial distribution and aggregation characteristics of facilities in relation to regional vitality and spatial structure. As shown in Table 3 and Figure 8, the facility composition within the study area exhibits the following features: Commercial facilities dominate, accounting for 70.95%, primarily comprising retail, dining, and daily services. Cultural facilities represent only 9.13%, mainly encompassing education, culture, and tourist attractions. Public facilities constitute 19.92%, largely government agencies and healthcare services. Leisure and sports facilities remain notably insufficient. This composition indicates that the current functional layout centers on basic commercial services. However, despite the area’s historical and cultural richness, cultural and leisure functions are underrepresented. Additionally, facilities supporting public activities and recreation are still insufficient. Between 2021 and 2025, the numbers of dining, daily life services, and retail facilities decline significantly, reflecting a reduction in service-oriented stores within the old town.
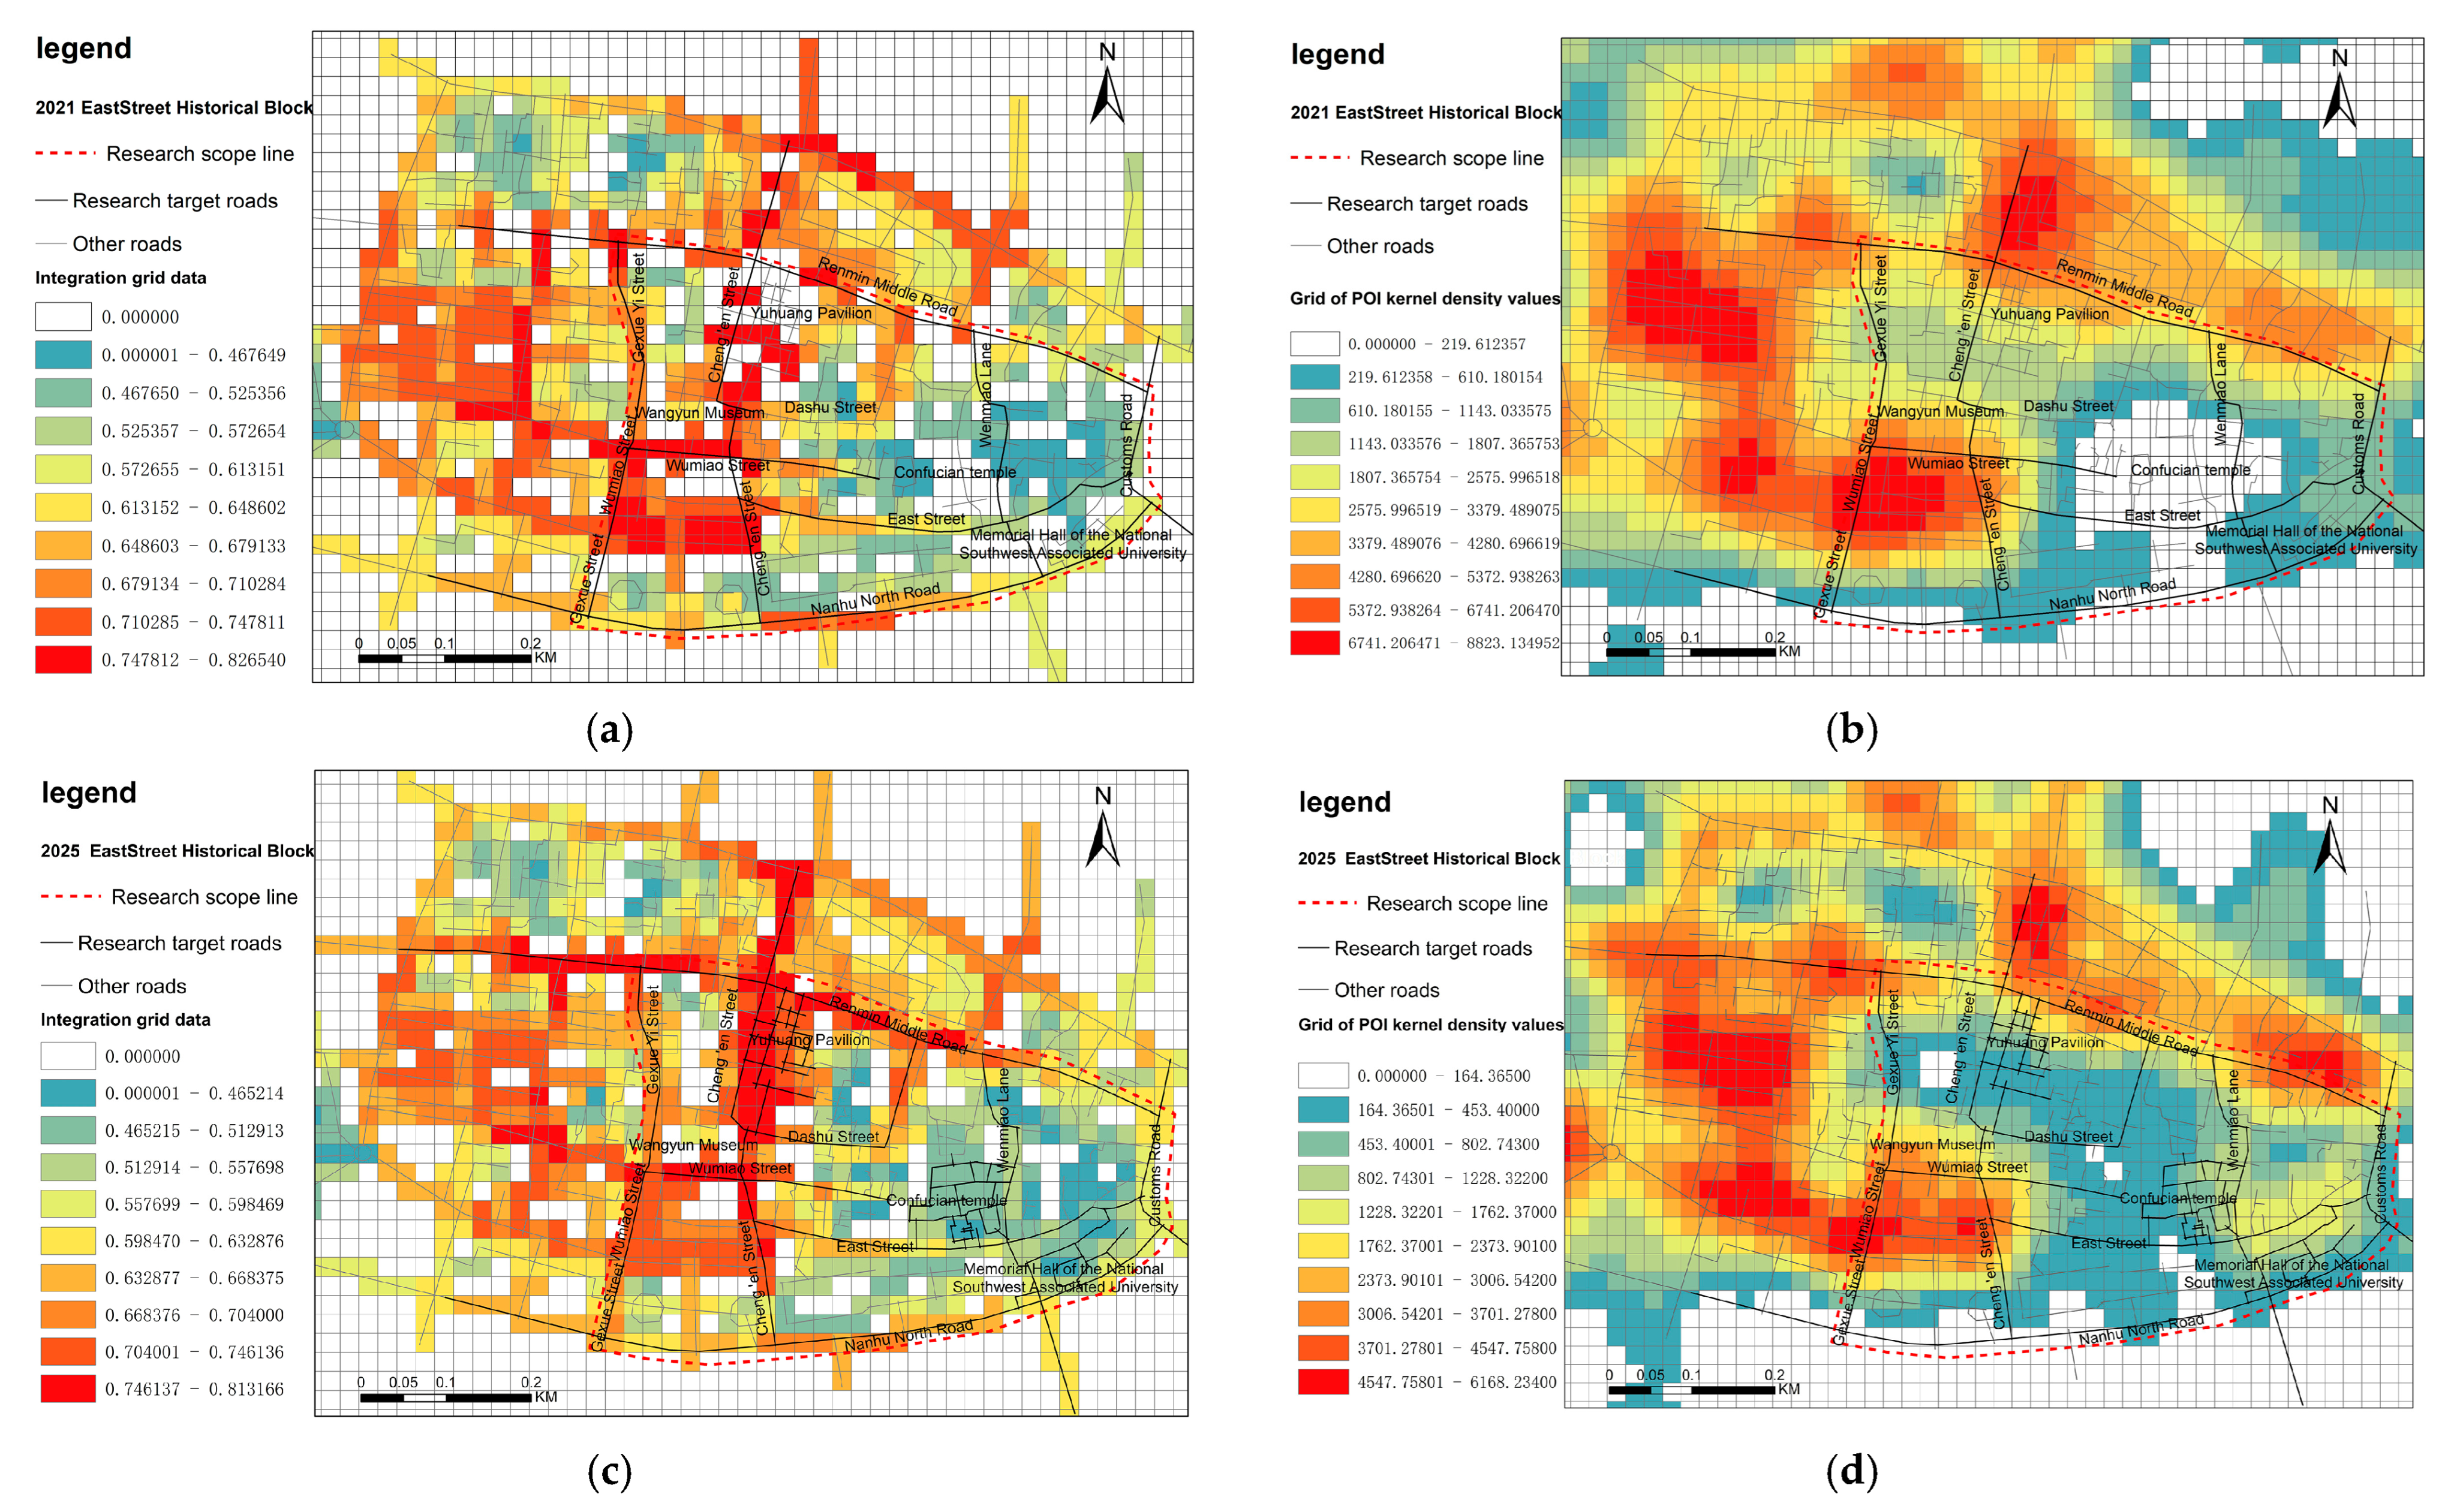
Facility and Vitality Distribution: Kernel density analysis of POI data (Figure 9 and Figure 10) reveals a pronounced imbalance in facility distribution within the old town, with the western side significantly stronger than the eastern side. In 2021, the peak POI density on the eastern side reached approximately 1000, far lower than the western side’s 8926, indicating a clear deficiency in facility aggregation and vitality in the east. Following the 2025 renovation, the overall peak POI density in the old town decreases to about 6583, while the disparity between east and west narrows. Within the East Street district, the area with POI densities between 0 and 1085 expands significantly, accompanied by an increase in total facility numbers. Nevertheless, the kernel density distribution across the old town remains unbalanced, primarily due to the decline of the eastern district and the concentration of commercial vibrancy in the western district.
Spatial Layout and Functional Adaptation: The western part of the old town develops into a large-scale commercial pedestrian zone, where the regular grid street pattern facilitates linear and dense clustering of facilities, resulting in highly active, concentrated areas. In contrast, the East Street Historic District features an irregular layout, with facilities mainly clustered around heritage landmarks, such as the Memorial Hall of the National Southwest Associated University, the Confucius Temple, and Yuhuang Pavilion, forming relatively isolated clusters. Furthermore, the organically evolved spatial configuration and its weak connection to the old town’s main grid hinder facility concentration, preventing the formation of a cohesive vitality core or continuous cultural experience routes.

5. District Vitality: Comprehensive Evaluation Results

5.1. Correlation Analysis

Based on previous analyses, the spatial distributions of Integration Value and POI kernel density exhibit structural overlap, indicating a regular relationship between street characteristics and POI distribution. To verify this hypothesis, a Pearson correlation analysis is conducted between global Integration Values and POI kernel density values. Since street Integration Value data are represented as linear vectors, whereas POI kernel density results are raster data, the differing data formats require transformation into a common dimension for analysis [36]. Accordingly, an overlay analysis is performed using a fishnet grid consisting of 3484 cells, each measuring 0.0002 in width and height. Among these, 961 grids intersect with streets having non-zero Integration Values, with 378 valid grid cells located within the East Street Historic District, as shown in Figure 11.
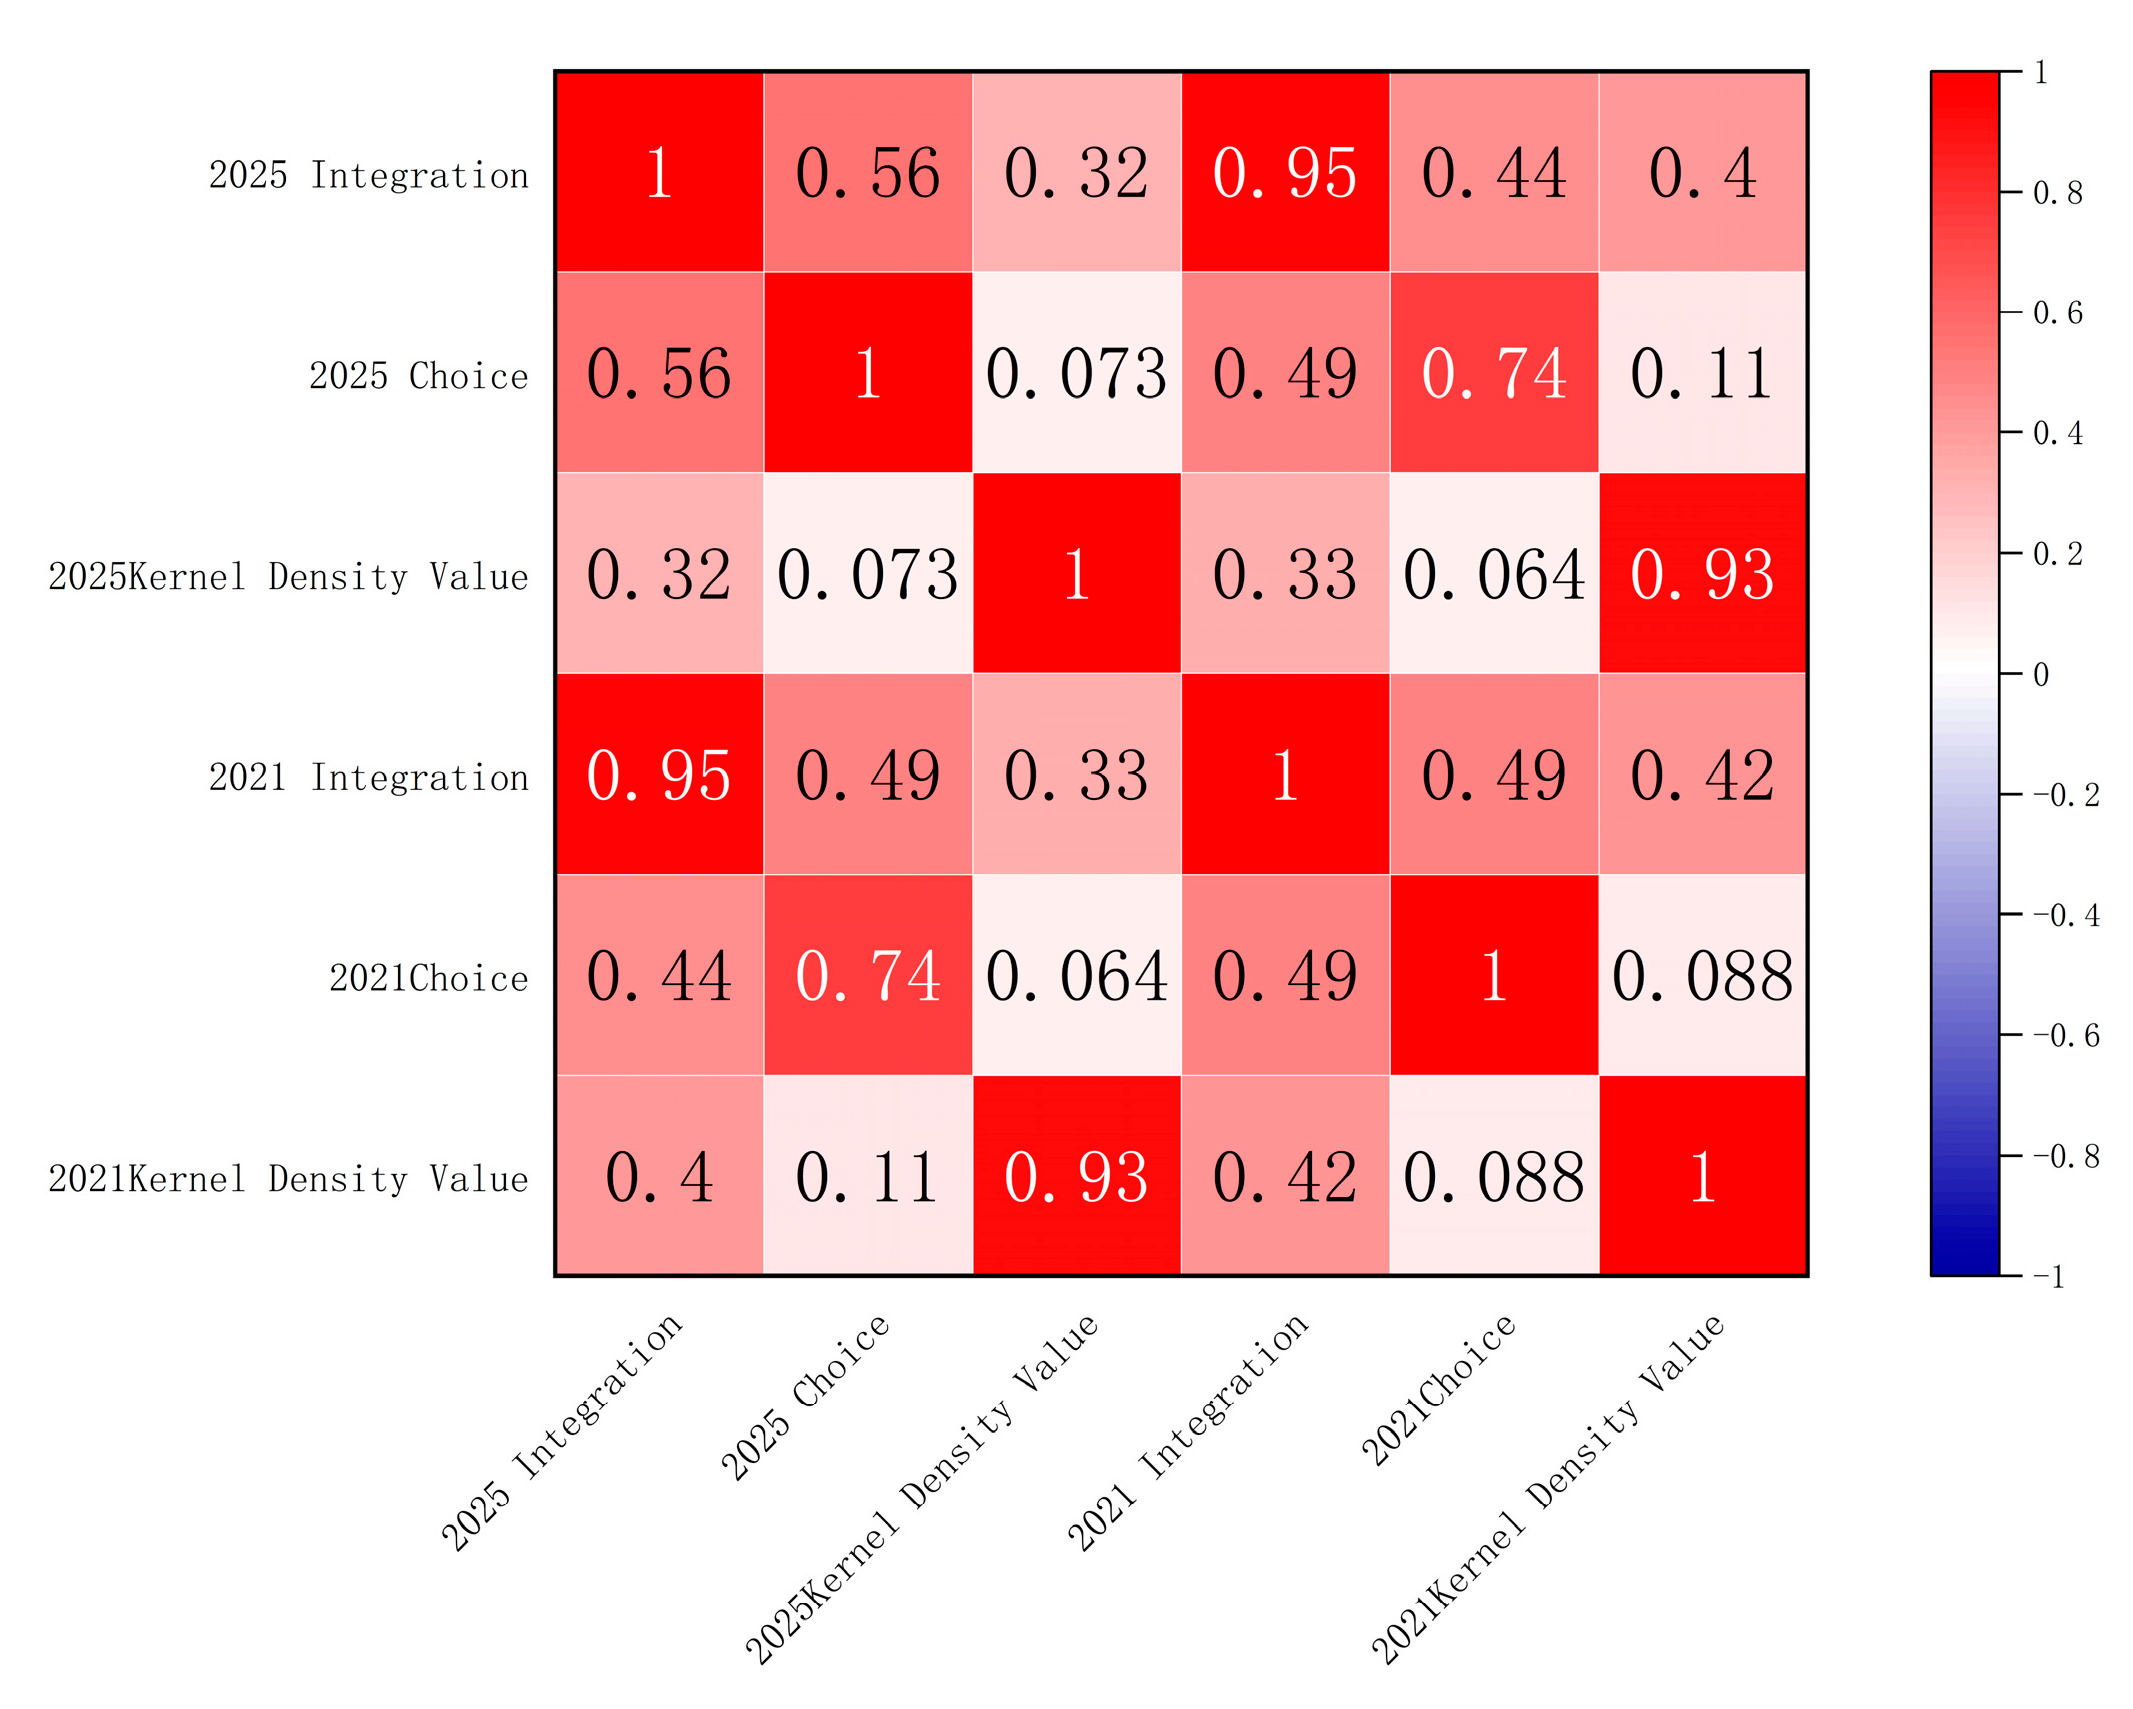
According to the Pearson correlation coefficients shown in Figure 12, the correlation between Integration Value and kernel density is 0.42 in 2021 and 0.32 in 2025, with p-values approaching zero in both cases. This indicates a significant correlation, though its strength decreases from moderate in 2021 to weak in 2025, reflecting a non-linear and more differentiated relationship following renovation. Correlation coefficients between Choice Value and kernel density are 0.088 and 0.073 (approximately zero) for 2021 and 2025, respectively, indicating almost no correlation. In summary, the East Street Historic District exhibits an imbalance between Integration Value and POI density across its streets.

5.2. Typical Street Classification

Spatial deviation degree analysis reveals significant differentiation in the vitality pattern of the East Street Historic District (Figure 13). A stark contrast appears between the western and eastern parts of the old town: the western district generally exhibits high deviation, whereas the eastern historic section around East Street predominantly shows medium to low deviation, forming a functional intensity gradient with Cheng’en Street as the boundary. This pattern reflects a common challenge for historic districts in small- and medium-sized cities, where new urban development often shifts resources—particularly younger populations and commercial investments—to the western new town, resulting in relatively lagging functional aggregation and vitality in historical core areas such as East Street.
Table 4 presents comprehensive data on the main streets within the East Street Historic District, ranked in descending order by their 2025 deviation values. According to the definitions in Table 1 and the statistics in Table 4, the average deviation degree for the district in 2025 is 1.921. Streets with deviation values above 2.932 are classified as High Deviation Streets, while those below 0.910 are classified as Low Deviation Streets.
Based on the deviation threshold and the classification of the relationship between street-specific integration and POI distribution, this study identifies three street types (Figure 14, Table 5). The main figure presents the classification of deviation streets, while the inset figure illustrates their formation mechanisms and evolutionary characteristics. Streets are first divided into two broad categories according to correlation strength: Strong correlation streets—deviation degree close to the mean, reflecting high spatial–functional synergy across the East Street Historic District, including key transformation zones. Weak correlation streets—deviation degree significantly above or below the mean, indicating abnormal deviation and weak spatial–functional linkage. Further subdivision into three specific street types allows for targeted analysis of weak-correlation cases, enabling identification of underlying causes and formulation of strategies to enhance balance in street vitality across the district.
The first type—stressful streets—reflects the risk of spatial overloading on main roads. For example, Renmin Middle Road exhibits a deviation degree of 4.160, driven by a mismatch between excessive commercial agglomeration (POI kernel density of 3077) and limited street space, resulting in both pedestrian and vehicular congestion. Although Wumiao Street’s deviation has decreased since 2025 (from 3.070), it remains within the high range; its relatively low integration value (0.629 vs. the mean of 0.635) suggests insufficient spatial organization efficiency to alleviate functional pressure. This underscores the dilemma faced by main roads in small- and medium-sized historic districts—namely, accommodating intense commercial activity within constrained physical spaces. Furthermore, streets along the ancient city’s central axis display vitality levels far exceeding those of the eastern district, producing deviation values markedly above the eastern district’s mean and reflecting a broader spatial–functional imbalance between the western and eastern sectors.
The second type—steady-state streets—corresponds to streets with medium deviation degrees and forms the majority of the neighborhood (81.8% of the total; e.g., East Street, Cheng’en Street). Their mean deviation degree (1.857) approximates the regional average (1.921), indicating a relatively stable synergy between spatial form and functional distribution. For instance, East Street (deviation degree: 1.772) possesses an integration value (0.571) slightly below the average for side streets and a kernel density (982.316) close to the regional mean. As a transitional side street linking Cheng’en Street and South Lake, its spatial efficiency could be enhanced through targeted interventions.
The third type—low-potential streets—encompasses areas where spatial potential remains underutilized, such as Dashu Street and Nanhu North Road. Dashu Street exhibits optimal side-street integration (0.663), yet its kernel density (517.522) is less than half the mean value, with cultural facilities comprising only 9.13% of total functions. This illustrates the limited spatial vitality of highly accessible areas when cultural investment is insufficient in small- and medium-sized historic neighborhoods. Nanhu North Road faces geographical constraints—fronting solely onto Nanhu Lake—which limit its functional layout (kernel density: 185.176) and hinder vitality development, reflecting the district’s unique spatial conditions. Notably, the internal route of Wenmiao improved from low deviation (2021: 0.048) to medium deviation (2025: 1.356), demonstrating the effectiveness of micro-renewal measures—such as the removal of unauthorized building works (UBWs) and the reopening of alleys—in activating the historic core’s spatial performance.
Across the three categories, low deviation areas—primarily in the Old City’s east—reflect phenomena such as core-area decline and youth outmigration; medium deviation areas receive more intensive investment from government or cultural institutions; and high deviation areas, concentrated in the west, align with new urban expansion and thriving main-road commerce. The evolution of these categories and their deviation-change trends will be examined later in the paper in relation to planning policies, forming the basis for targeted feedback strategies.

5.3. Feedback Mechanism and Optimization Strategies

The space–function coupling evaluation model established in this study provides a diagnostic approach for assessing the vitality development of historic districts. It is applied to the revitalization plan of the East Street Historic District in Mengzi City for the period 2021–2035, enabling systematic diagnosis of the district’s vitality. By comparing evaluation results with the principles and strategies outlined in the Mengzi East Street Historic and Cultural District Protection Plan (summarized in Table 6 and Figure 15), actionable feedback mechanisms are extracted. These mechanisms link observed changes in values and transformation effects to planning goals, facilitating targeted optimization and adaptive management.

5.3.1. Dynamic Feedback on Change Values and Planning Implementation

According to the data in Table 4, the average change in deviation degree is −0.311, indicating a decline in the ratio between functional kernel density and spatial efficiency following the renewal. This reflects the inability of certain areas within the East Street Historic District to resist decline trends under resource constraints typical of small- and medium-sized cities. The spatial distribution of change values (Figure 15) further illustrates the relationship with planning implementation: after the introduction of cultural and commercial functions in the eastern part of Mengzi Old Town, all areas except Wumiao Street exhibit warm tones in East Street and Wenmiao Lane, while cooler tones represent Wumiao Street. This indirectly suggests that improvements in facility functions surpass optimizations in street structure, aligning with the short-term planning objective that prioritizes preservation of existing street spaces—specifically the scale and alignment of East Street, Wenmiao Lane, and Wumiao Street—while concentrating new functional facilities mainly along East Street. As a result, a functionally aggregated zone has emerged around East Street, Wenmiao Lane, and the Wenmiao complex, effectively enhancing the vitality of the eastern part of Mengzi Old Town.
The Deviation Degree—Change in Deviation Degree model captures hierarchical street patterns (Figure 15, Table 5 and Table 6):
First, improvements resulting from actual street renovations are observed. Wumiao Street shows the smallest negative change value (−2.896). Despite declines in both Integration Value and kernel density, the functional kernel density decreases faster than street load, indicating some pressure relief in this core area of the ancient city. Gexue Yi Street successfully transitions from high to medium deviation (change value −1.721), demonstrating effective spatial optimization combined with functional adjustments such as the relocation of outdated shops. Renmin Middle Road exemplifies the stability of main roads within the old town’s network.
Second, three streets exhibit limited benefits from renovations and require increased attention in future planning. The main street, Renmin Middle Road, shows an increase in deviation degree (+0.254), indicating sustained pressure and high deviation risk. While some side streets show initial signs of vitality improvement, Dashu Street remains unaffected by historic district renewal, continuing its vitality decline. The deviation degree on Nanhu North Road decreases (−0.164), primarily due to a decline in kernel density (from 278 to 185), revealing vitality shrinkage in the waterfront area caused by insufficient functional interventions. Overall, main streets under high pressure require further integration improvements to alleviate stress, while declining vitality in some side streets demands the introduction of functional activities. Notably, long-term planning focuses on three longitudinal streets for key updates, differing from the three transverse streets identified by change value analysis. Therefore, future planning implementation should reasonably adjust priorities by integrating recent planning outcomes and actual conditions.

5.3.2. Optimization and Correction of Anomalous Streets

Based on the Deviation Degree–Change in Deviation Degree model, four anomalous streets are identified: Renmin Middle Road, Wumiao Street, Dashu Street, and Nanhu North Road. After correcting the anomalous deviation degree indicators, a revised correlation is calculated to verify the feasibility of the proposed optimizations.
Restoration of High Deviation Streets: The locations of Wumiao Street and Renmin Middle Road in the global Integration Value map (Figure 12) show that the eastern section of Wumiao Street near the Wenmiao area is a dead end and does not traverse the entire old town like Renmin Middle Road. Consequently, Wumiao Street has potential for increased street integration through internal urban renewal. This suggests that strengthening connectivity within the secondary street network and activating potential spaces is crucial. For high-pressure secondary streets, such as Wumiao Street, fine-grained spatial adjustments can alleviate congestion and enhance overall integration. In contrast, functional relief is required for the main street, Renmin Middle Road. Given Renmin Middle Road’s connection with the low deviation street Dashu Street, redundant service-oriented commercial functions on Renmin Middle Road can be relocated to low deviation areas, such as Dashu Street, thereby freeing space for public art installations and leisure plazas.
Restoration of Low Deviation Streets: The POI kernel density map (Figure 12) locates Dashu Street and Nanhu North Road in areas with significantly low kernel density, indicating that functional implantation is essential to unlock their potential. Field surveys reveal that Dashu Street is dominated by aging residential complexes, self-built houses, and abandoned staff dormitories, with limited functional facilities except for the Second People’s Hospital of Mengzi on its east side. Idle plots and underutilized spaces can be fully integrated. For example, abandoned factory buildings can be converted into mixed-use cultural spaces, introducing unique activities such as the Dongjing music studio and the Guoqiao rice noodle intangible heritage workshop to compensate for the area’s lack of cultural facilities. Coupled with long-term planning that adds intangible heritage experience spaces, the western section of Dashu Street can become a vibrant cultural display zone, enhancing walkability in high-integration side streets. Additionally, neighborhood centers and commercial outlets like community convenience stores and pharmacies can be introduced in the middle section to improve resident convenience. Nanhu North Road, adjacent to the lake, can benefit from added lakeside viewpoints and slow-traffic paths, alongside low-intensity commercial functions, such as light dining and tea rooms, to improve public access to the waterfront.
By applying these strategies, estimated corrections to kernel density (or Integration Value) for the anomalous streets are performed by averaging their values with those of adjacent streets meeting the criteria of medium deviation and similar integration or kernel density levels. This average serves as the expected corrected value. The corrected results are shown in Table 7. Replacing the 2025 data of these streets with the corrected values while keeping other data unchanged, the Pearson correlation coefficient increases from 0.32 to 0.36. This indicates a significant enhancement in the synergy between spatial efficiency and functional density. The improved consistency between space syntax results and POI kernel density validates the effectiveness of the dynamic feedback mechanism based on the Deviation Degree–Change in Deviation Degree model for regenerating vitality in historic districts.

6. Findings and Discussion

This study integrates space syntax and POI big data to analyze the complex relationship between spatial morphology and functional vitality in the East Street Historic District of Mengzi. On the one hand, the findings support Jacobs’ and Lynch’s theories that accessibility and diversity form the foundation of vitality [10,11]. For example, highly accessible main roads such as Renmin Middle Road accommodate a greater number of functional facilities. On the other hand, the empirical case reveals only a weak positive correlation between these factors (Pearson’s r = 0.32), significantly lower than correlations observed in large city cores (see Table 8). This weak correlation highlights the distinctive mechanism of vitality generation in historic districts of small- and medium-sized cities, where spatial topology advantages (high Integration Value) do not necessarily translate into functional agglomeration. A typical example is Cheng‘en Street (Integration Value 0.739), whose POI kernel density (1479) accounts for only 23% of the peak value in the western old town (approximately 6583), forming a typical “high accessibility–low vitality” street. This observation aligns with findings from Fuzhou’s Shuixilin historic district, where higher spatial accessibility does not always foster greater activity [2].
In-depth analysis (see Table 8) reveals that the weak correlation observed in small- and medium-sized cities, such as Mengzi, primarily reflects functional stagnation caused by resource scarcity. In contrast, large cities generally exhibit moderate to strong positive correlations [18,33]. Weak correlations in large cities often result from resource oversaturation or functional mismatches due to single-function orientation [7]. The systemic challenges faced by historic districts in rapidly developing small- and medium-sized cities extend beyond spatial structure or methodological issues:
Resource Loss and Uneven Investment: Compared to large cities or developed regions, small- and medium-sized cities have more limited fiscal and renewal resources. Investments tend to prioritize hardware upgrades on main historic streets (e.g., East Street), while secondary street networks (e.g., Wumiao Street, Dashu Street) and district-wide cultural facilities receive less attention. This leads to spatial improvements—such as the notable increase in Choice Value in Wenmiao Lane—that fail to stimulate vitality on side streets or balance functional distribution. Despite renovation, Wumiao Street’s high Deviation degree (3.070) indicates that enhancing spatial connectivity alone cannot fully relieve street-level pressure under constrained resources.
Rapid Decline and Functional Simplification: During rapid urbanization, historic districts in small- and medium-sized cities are vulnerable to siphoning effects from emerging urban areas, causing outflows of young populations, capital, and service facilities, which accelerates decline in old town cores (e.g., East Street Historic District). Consequently, even areas with relatively high Integration Value (e.g., Dashu Street, 0.663) may exhibit low vitality due to insufficient functional facilities. Moreover, a weak economic base often drives renewal efforts toward overreliance on basic commercial uses (retail, dining), crowding out cultural and recreational functions. This undermines the district’s sustainable attractiveness and diverges from Jacobs’ principle of diversity [10].
Spatial Governance Limitations and Historical Constraints: Small- and medium-sized cities often encounter challenges in fine-grained spatial governance. The contrasting road network morphologies between the western and eastern parts of Mengzi Old Town—characterized by a regular grid in the west versus an organic fabric in the east (see Figure 3)—result in a pronounced west–east functional imbalance. Kernel density peaks in the western area are approximately four times higher than those in the East Street district. These localized governance bottlenecks and historically inherited structural fragmentation restrict the full realization of spatial potential. However, as Guo advocates in the spatial structuring of Wuxi’s old town [32], the spatial patterns of historic districts emerge from long-term evolution and should be respected by aligning interventions with their inherent spatial characteristics and historical context.
Methodological Limitations: First, although space syntax emphasizes morphology’s influence on behavioral potential, static topological analysis has limited capacity to account for socio-cultural variables, leading to discrepancies between predicted and actual street spatial carrying capacities. Second, while POI data include temporal attributes, they lack explanatory power for informal economies (e.g., street vending, festivals, night markets), real-time pedestrian flows, and socio-cultural factors underlying the accessibility–vitality paradox (e.g., sense of belonging, leisure experiences). Third, the heavy reliance on quantitative data in this study is susceptible to data quality issues, especially since the 2021 data could not be monitored or corrected in real time, introducing uncontrollable errors into the analysis.
Due to space constraints, this paper does not fully explore multidimensional analytical perspectives. Nevertheless, the coupled space syntax and POI analysis method possesses inherent limitations. Large-scale empirical studies that systematically quantify and compare these methods across multiple cities and scales, while deeply analyzing influencing factors, remain scarce. Despite this, the approach advances beyond previous methods relying solely on physical form or anecdotal predictions, yielding more realistic results. Future research may address these gaps by (1) integrating multi-source data—such as real-time heat maps, street view images, and social media datasets—to enhance analytical accuracy; (2) incorporating stakeholder perspectives through structured surveys and semi-structured interviews that combine visitor behaviors and resident spatial perceptions, thereby developing a systematic understanding linking environment, behavior, and meaning; and (3) conducting multidimensional comparative studies across neighborhoods with diverse cultural, geographic, and developmental contexts to reveal co-evolution patterns of spatial morphology and functional structure under varied conditions.

7. Conclusions

Recent international research increasingly applies space syntax to study historic district vitality, developing multi-scale, multi-scenario evaluation frameworks [43,44,45]. This study investigates the spatial–functional synergy in historic districts of small- and medium-sized Chinese cities amid rapid urbanization, revealing a weak positive correlation and structurally imbalanced spatial characteristics driven by resource constraints.
Empirical analysis of Mengzi East Street demonstrates that spatial accessibility and functional distribution diverge markedly from models observed in large city cores, exhibiting significant spatial–functional mismatches. Following the implementation of the protection plan (2021–2025), the district’s average deviation degree decreases; however, a heterogeneous pattern emerges, characterized by persistent main street overload, differentiated vitality on secondary streets, and inefficient waterfront utilization. This outcome deviates from planning goals that emphasize diversity preservation and cultural revitalization, highlighting issues of commercial homogenization and scarcity of cultural facilities.
A dynamic Deviation Degree–Change in Deviation Degree diagnostic model is constructed to quantify the alignment between spatial efficiency and functional capacity across street hierarchies and their temporal evolution, enabling precise identification of vitality risk and potential zones. The analysis suggests that historic district vitality regeneration should adhere to the following principles: (1) spatial network optimization must prioritize continuity of the historic fabric, maximizing benefits through fine-scale adjustments; (2) street function allocation requires holistic consideration of broader urban development trends; and (3) strengthening connectivity among secondary streets is essential to establish a cultural heritage spatial network adapted to local life.
Finally, this study focuses on historic districts in rapidly urbanizing small- and medium-sized cities, contributing to the diversification and localization of global urban vitality research. The proposed three-dimensional dynamic evaluation framework not only aligns with global academic calls for detailed, context-sensitive analysis [44,45] but also offers a sustainable approach that integrates heritage authenticity with local life. It provides a valuable scientific tool for analysis and evaluation applicable to similarly developing small- and medium-sized cities worldwide.

Author Contributions

Contributed to conceptualization and original draft preparation, M.M.; managed the project, formulated the research problem, and optimized the study, Z.W.; participated in research discussions and refinement, J.Y.; curated the data, C.P.; conducted field investigations and visualization, H.Z. All authors have read and agreed to the published version of the manuscript.

Funding

This research was funded by a comparative study on the history of regional architectural concepts in Yunnan 1950–2010 (Grant No.51968028).

Data Availability Statement

The data are contained within the article.

Conflicts of Interest

The authors declare that they have no conflicts of interest.

Abbreviations

The following abbreviations are used in this manuscript:
DDeviation degree
CChange in deviation degree

References

  1. Zhang, F.; Liu, Q.; Zhou, X. Vitality evaluation of public spaces in historical and cultural blocks based on multi-source data, a case study of Suzhou Changmen. Sustainability 2022, 14, 14040. [Google Scholar] [CrossRef]
  2. Fu, J.-M.; Tang, Y.-F.; Zeng, Y.-K.; Feng, L.-Y.; Wu, Z.-G. Sustainable Historic Districts: Vitality Analysis and Optimization Based on Space Syntax. Buildings 2025, 15, 657. [Google Scholar] [CrossRef]
  3. Unesco, W. Recommendation on the historic urban landscape. In Proceedings of the Records of the General Conference 36th Session, Paris, France, 25 October–10 November 2011. [Google Scholar]
  4. Li, M.; Hasemi, Y.; Tanaka, W.; Nozoe, Y.; Nagasawa, M. A Fire Prevention Measure for Disaster Prevention Planning Based on Resident Conditions and Community Characteristics in Preserved Historic Districts/Village in Japan. Int. J. Archit. Herit. 2025, 19, 194–215. [Google Scholar] [CrossRef]
  5. Ouyang, P.; Wu, X. Analysis and Evaluation of the Service Capacity of a Waterfront Public Space Using Point-of-Interest Data Combined with Questionnaire Surveys. Land 2023, 12, 1446. [Google Scholar] [CrossRef]
  6. Lu, S.; Huang, Y.; Shi, C.; Yang, X. Exploring the associations between urban form and neighborhood vibrancy: A case study of Chengdu, China. ISPRS Int. J. Geo-Inf. 2019, 8, 165. [Google Scholar] [CrossRef]
  7. Yu, B.; Sun, J.; Wang, Z.; Jin, S. Influencing factors of street vitality in historic districts based on multisource data: Evidence from China. ISPRS Int. J. Geo-Inf. 2024, 13, 277. [Google Scholar] [CrossRef]
  8. Yang, J.; Li, X.; Du, J.; Cheng, C. Exploring the relationship between urban street spatial patterns and street vitality: A case study of Guiyang, China. Int. J. Environ. Res. Public Health 2023, 20, 1646. [Google Scholar] [CrossRef] [PubMed]
  9. Artmann, M.; Kohler, M.; Meinel, G.; Gan, J.; Ioja, I.-C. How smart growth and green infrastructure can mutually support each other—A conceptual framework for compact and green cities. Ecol. Indic. 2019, 96, 10–22. [Google Scholar] [CrossRef]
  10. Jacobs, J. The Death and Life of Great American Cities; Random House, Inc.: New York, NY, USA, 1961; Volume 21, pp. 13–25. [Google Scholar]
  11. Lynch, K. Good City Form; MIT Press: Cambridge, MA, USA, 1984. [Google Scholar]
  12. Oliveira, V. Morpho: A methodology for assessing urban form. Urban Morphol. 2013, 17, 21–33. [Google Scholar] [CrossRef]
  13. Jiang, Y.; Han, Y.; Liu, M.; Ye, Y. Street vitality and built environment features: A data-informed approach from fourteen Chinese cities. Sustain. Cities Soc. 2022, 79, 103724. [Google Scholar] [CrossRef]
  14. Huang, J.; Hu, X.; Wang, J.; Lu, A. How diversity and accessibility affect street vitality in historic districts? Land 2023, 12, 219. [Google Scholar] [CrossRef]
  15. Handy, S. Planning for accessibility: In theory and in practice. In Access to Destinations; Emerald Group Publishing Limited: Leeds, UK, 2005; pp. 131–147. [Google Scholar]
  16. Gómez-Varo, I.; Delclos-Alio, X.; Miralles-Guasch, C. Jane Jacobs reloaded: A contemporary operationalization of urban vitality in a district in Barcelona. Cities 2022, 123, 103565. [Google Scholar] [CrossRef]
  17. Hassan, O.; Mohamed, E.A.; Hassan, A.; Shaheen, M.; Bekheet, W. Sustainable urban development of mobility and streetscape in historic city quarters, an ancient street in Alexandria-Egypt, as a case study. Alex. Eng. J. 2023, 78, 378–389. [Google Scholar] [CrossRef]
  18. Hillier, B.; Hanson, J. The Social Logic of Space; Cambridge University Press: Cambridge, UK, 1989. [Google Scholar]
  19. Xu, Y.; Chen, X. Quantitative analysis of spatial vitality and spatial characteristics of urban underground space (UUS) in metro area. Tunn. Undergr. Space Technol. 2021, 111, 103875. [Google Scholar] [CrossRef]
  20. Hillier, B. Space Is the Machine: A Configurational Theory of Architecture; Space Syntax: London, UK, 2007. [Google Scholar]
  21. Liang, W.; Ahmad, Y.; Mohidin, H.H.B. Spatial form and conservation strategy of Sishengci historic district in Chengdu, China. Heritage 2023, 6, 891–903. [Google Scholar] [CrossRef]
  22. Huang, Y.; Zhang, Z.; Fei, J.; Chen, X. Optimization strategies of commercial layout of traditional villages based on space syntax and space resistance model: A case study of anhui longchuan village in china. Buildings 2023, 13, 1016. [Google Scholar] [CrossRef]
  23. Netto, V.M. ‘What is space syntax not?’ Reflections on space syntax as sociospatial theory. Urban Des. Int. 2016, 21, 25–40. [Google Scholar] [CrossRef]
  24. Sun, M.; Meng, Q. Using spatial syntax and GIS to identify spatial heterogeneity in the main urban area of Harbin, China. Front. Earth Sci. 2022, 10, 893414. [Google Scholar] [CrossRef]
  25. Karimi, K. The configurational structures of social spaces: Space syntax and urban morphology in the context of analytical, evidence-based design. Land 2023, 12, 2084. [Google Scholar] [CrossRef]
  26. Askarizad, R.; Daudén, P.J.L.; Garau, C. The application of space syntax to enhance sociability in public urban spaces: A systematic review. ISPRS Int. J. Geo-Inf. 2024, 13, 227. [Google Scholar] [CrossRef]
  27. Ying, L. (New) Urban science: Studying ”new” cities with new data, methods, and technologies. Landsc. Archit. Front. 2019, 7, 8–21. [Google Scholar]
  28. Guo, X.; Chen, H.; Yang, X. An evaluation of street dynamic vitality and its influential factors based on multi-source big data. ISPRS Int. J. Geo-Inf. 2021, 10, 143. [Google Scholar] [CrossRef]
  29. Zhou, M.; Yang, J. Geospatial Spatiotemporal Analysis of Tourism Facility Attractiveness and Tourism Vitality in Historic Districts: A Case Study of Suzhou Old City. Land 2025, 14, 922. [Google Scholar] [CrossRef]
  30. Atakara, C.; Allahmoradi, M. Investigating the urban spatial growth by using space syntax and GIS—A case study of Famagusta city. ISPRS Int. J. Geo-Inf. 2021, 10, 638. [Google Scholar] [CrossRef]
  31. Srivanit, M.; Kongphunphin, C.; Rinchumphu, D. Exploring the association of spatial capital and economic diversity in the tourist city of Surat Thani, Thailand. ISPRS Int. J. Geo-Inf. 2022, 11, 507. [Google Scholar] [CrossRef]
  32. Xing, Z.; Guo, W. A new urban space analysis method based on space syntax and geographic information system using multisource data. ISPRS Int. J. Geo-Inf. 2022, 11, 297. [Google Scholar] [CrossRef]
  33. Zhou, Q.; Zheng, Y. Evaluation research on the spatial vitality of Huaihe Road commercial block in Hefei city based on multi-source data correlation. Sustainability 2024, 16, 3372. [Google Scholar] [CrossRef]
  34. Huang, Y.; Chen, Y.; Song, J.; Zheng, L.; Yang, S.; Gao, Y.; Li, R.; Huang, L. Explore the Ultra-High Density Urban Waterfront Space Form: An Investigation of Macau Peninsula Pier District via Point of Interest (POI) and Space Syntax. Buildings 2025, 15, 1735. [Google Scholar] [CrossRef]
  35. Yang, L.; Jin, Q.; Fu, F. Research on urban street network structure based on spatial syntax and POI Data. Sustainability 2024, 16, 1757. [Google Scholar] [CrossRef]
  36. Jiménez-Espada, M.; García, F.M.M.; González-Escobar, R. Urban Equity as a Challenge for the Southern Europe Historic Cities: Sustainability-Urban Morphology Interrelation through GIS Tools. Land 2022, 11, 1929. [Google Scholar] [CrossRef]
  37. Zagroba, M.; Szczepańska, A.; Senetra, A. Analysis and evaluation of historical public spaces in small towns in the Polish region of Warmia. Sustainability 2020, 12, 8356. [Google Scholar] [CrossRef]
  38. Miranda, E.; Silva, J.B.E.; da Costa, A.R. Emergence and structure of urban centralities in a medium-sized historic city. SAGE Open 2020, 10, 2158244020930002. [Google Scholar] [CrossRef]
  39. Zagroba, M.; Pawlewicz, K.; Senetra, A. Analysis and evaluation of the spatial structure of Cittaslow towns on the example of selected regions in Central Italy and North-Eastern Poland. Land 2021, 10, 780. [Google Scholar] [CrossRef]
  40. Zheng, G.; Ding, L.; Zheng, J. A Multi-Dimensional Evaluation of Street Vitality in a Historic Neighborhood Using Multi-Source Geo-Data: A Case Study of Shuitingmen, Quzhou. ISPRS Int. J. Geo-Inf. 2025, 14, 240. [Google Scholar] [CrossRef]
  41. Van Nes, A.; Yamu, C. Introduction to Space Syntax in Urban Studies; Springer Nature: Berlin, Germany, 2021. [Google Scholar]
  42. Duan, J.; Wang, S.; Dai, X. Spatial Syntax Tutoria; China Architecture & Building Press: Beijing, China, 2011. [Google Scholar]
  43. Li, S. Analysis of Points of Interest in Hsinchu Old City Blocks Using Space Syntax. Eng. Proc. 2025, 91, 8. [Google Scholar]
  44. Esposito, D.; Santoro, S.; Camarda, D. Agent-based analysis of urban spaces using space syntax and spatial cognition approaches: A case study in Bari, Italy. Sustainability 2020, 12, 4625. [Google Scholar] [CrossRef]
  45. Fan, M.; Marzbali, M.H.; Abdullah, A.; Tilaki, M.J.M. Using a space syntax approach to enhance pedestrians’ accessibility and safety in the Historic City of George Town, Penang. Urban Sci. 2024, 8, 6. [Google Scholar] [CrossRef]
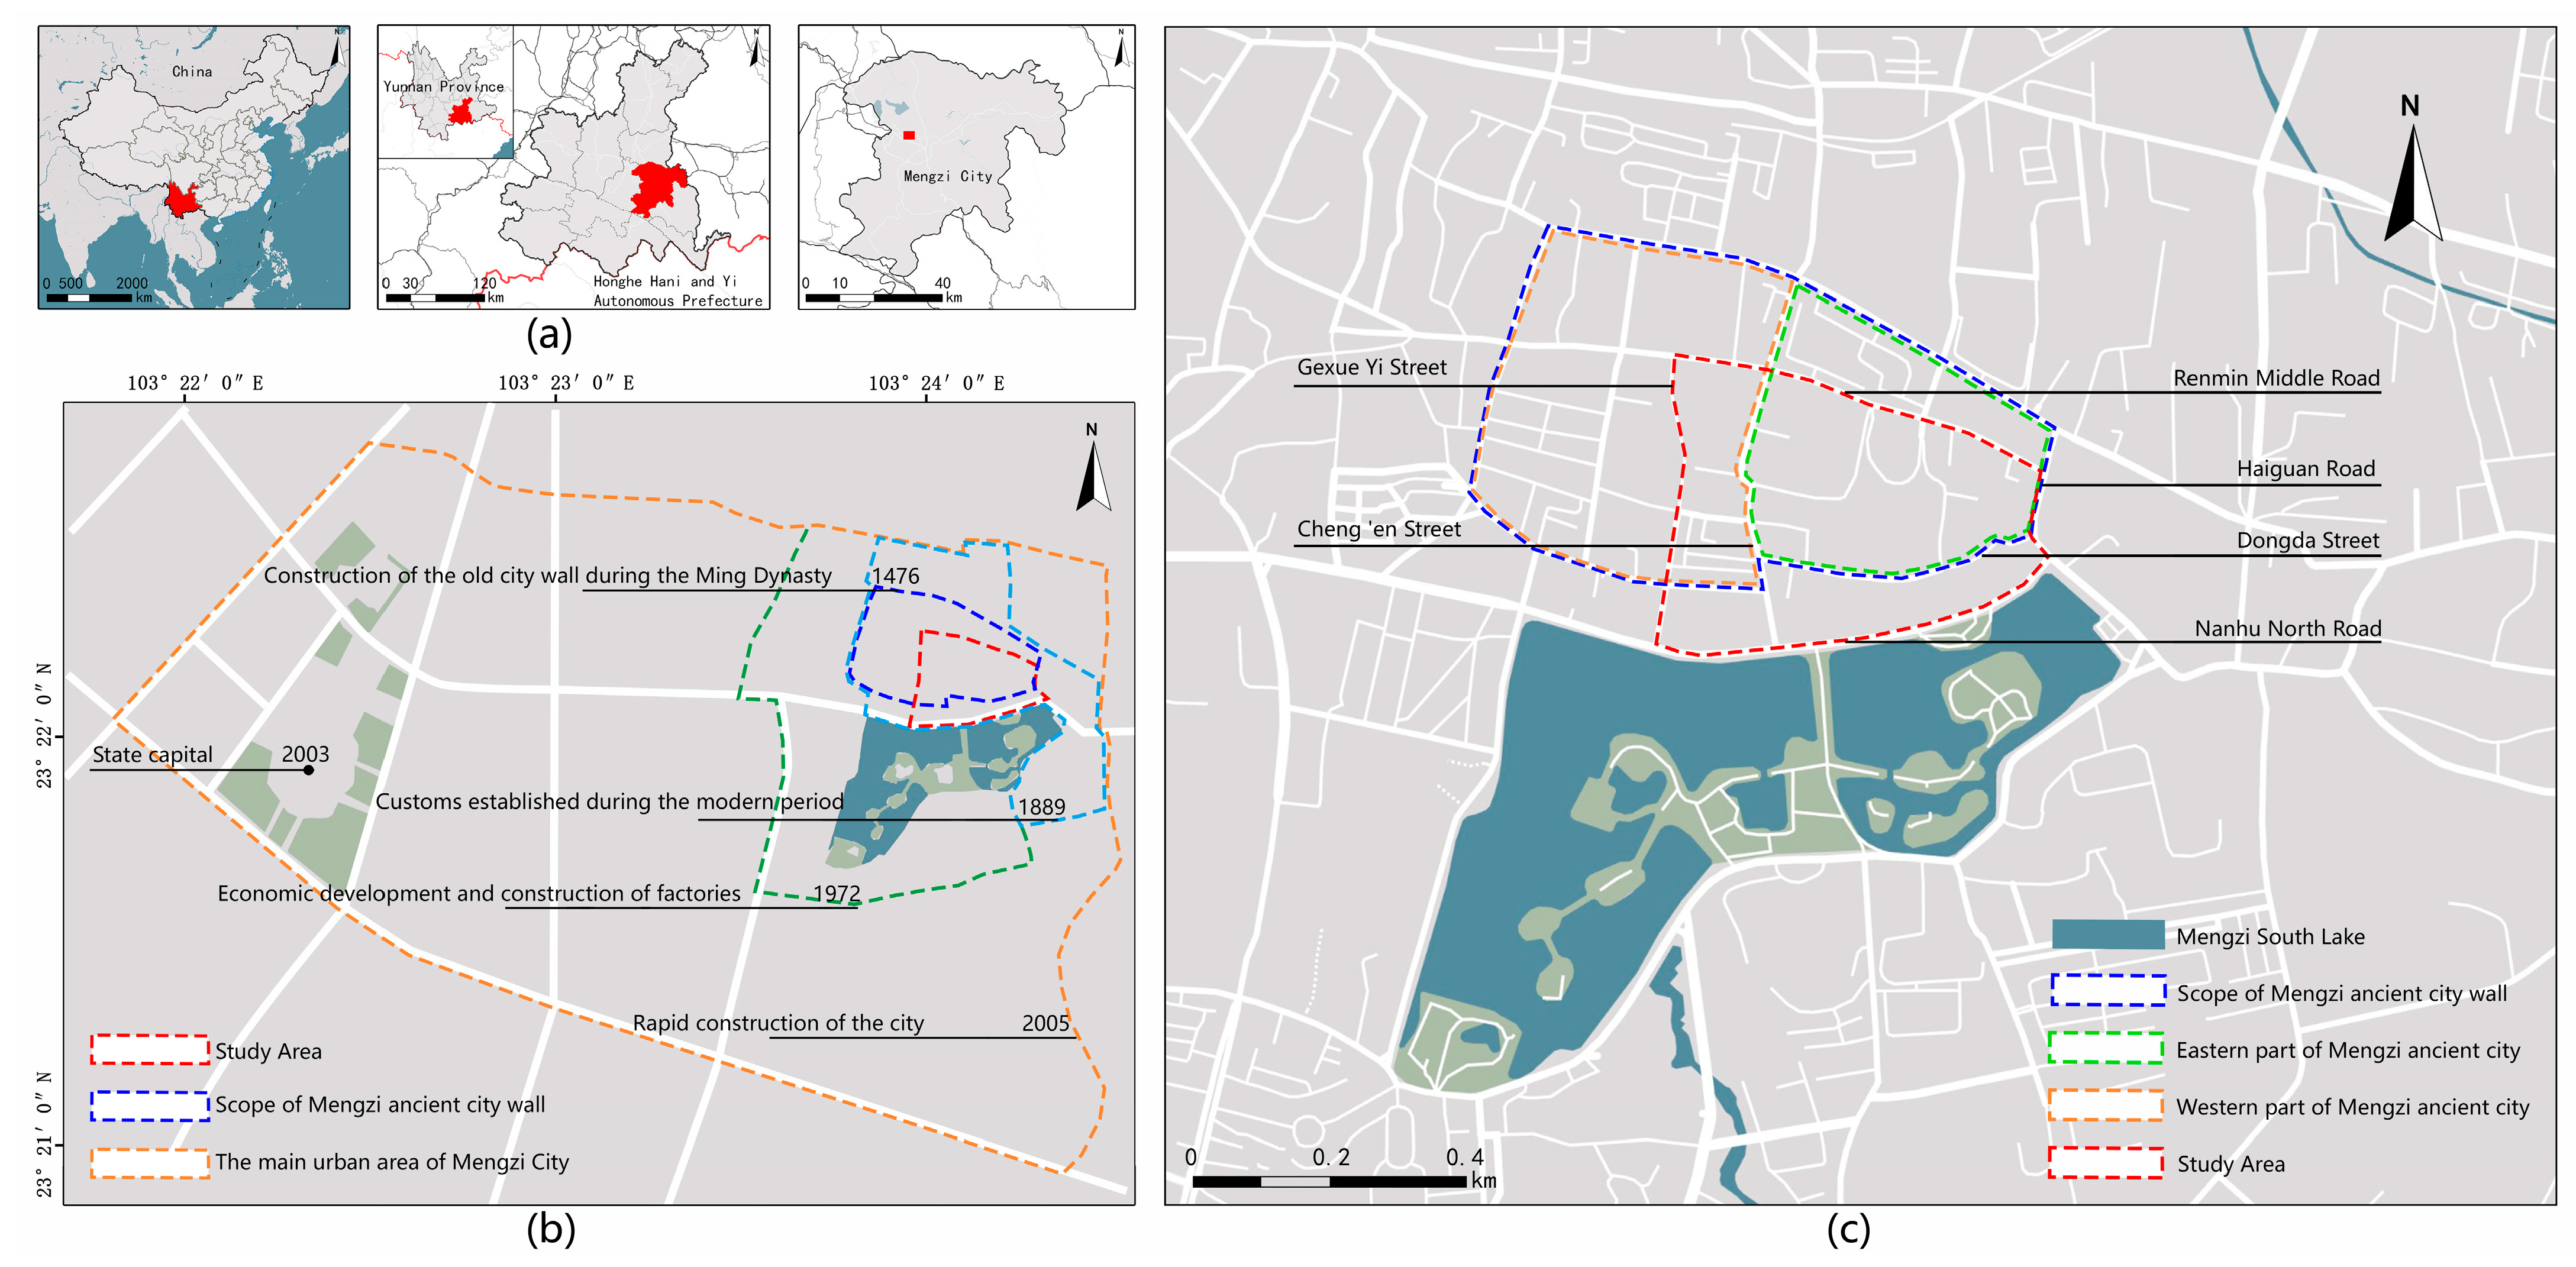
Figure 1. Location and Temporal Schematic: (a) Urban location map; (b) Urban morphological evolution diagram; (c) Main urban street network map of the study area.
Buildings 15 02896 g001
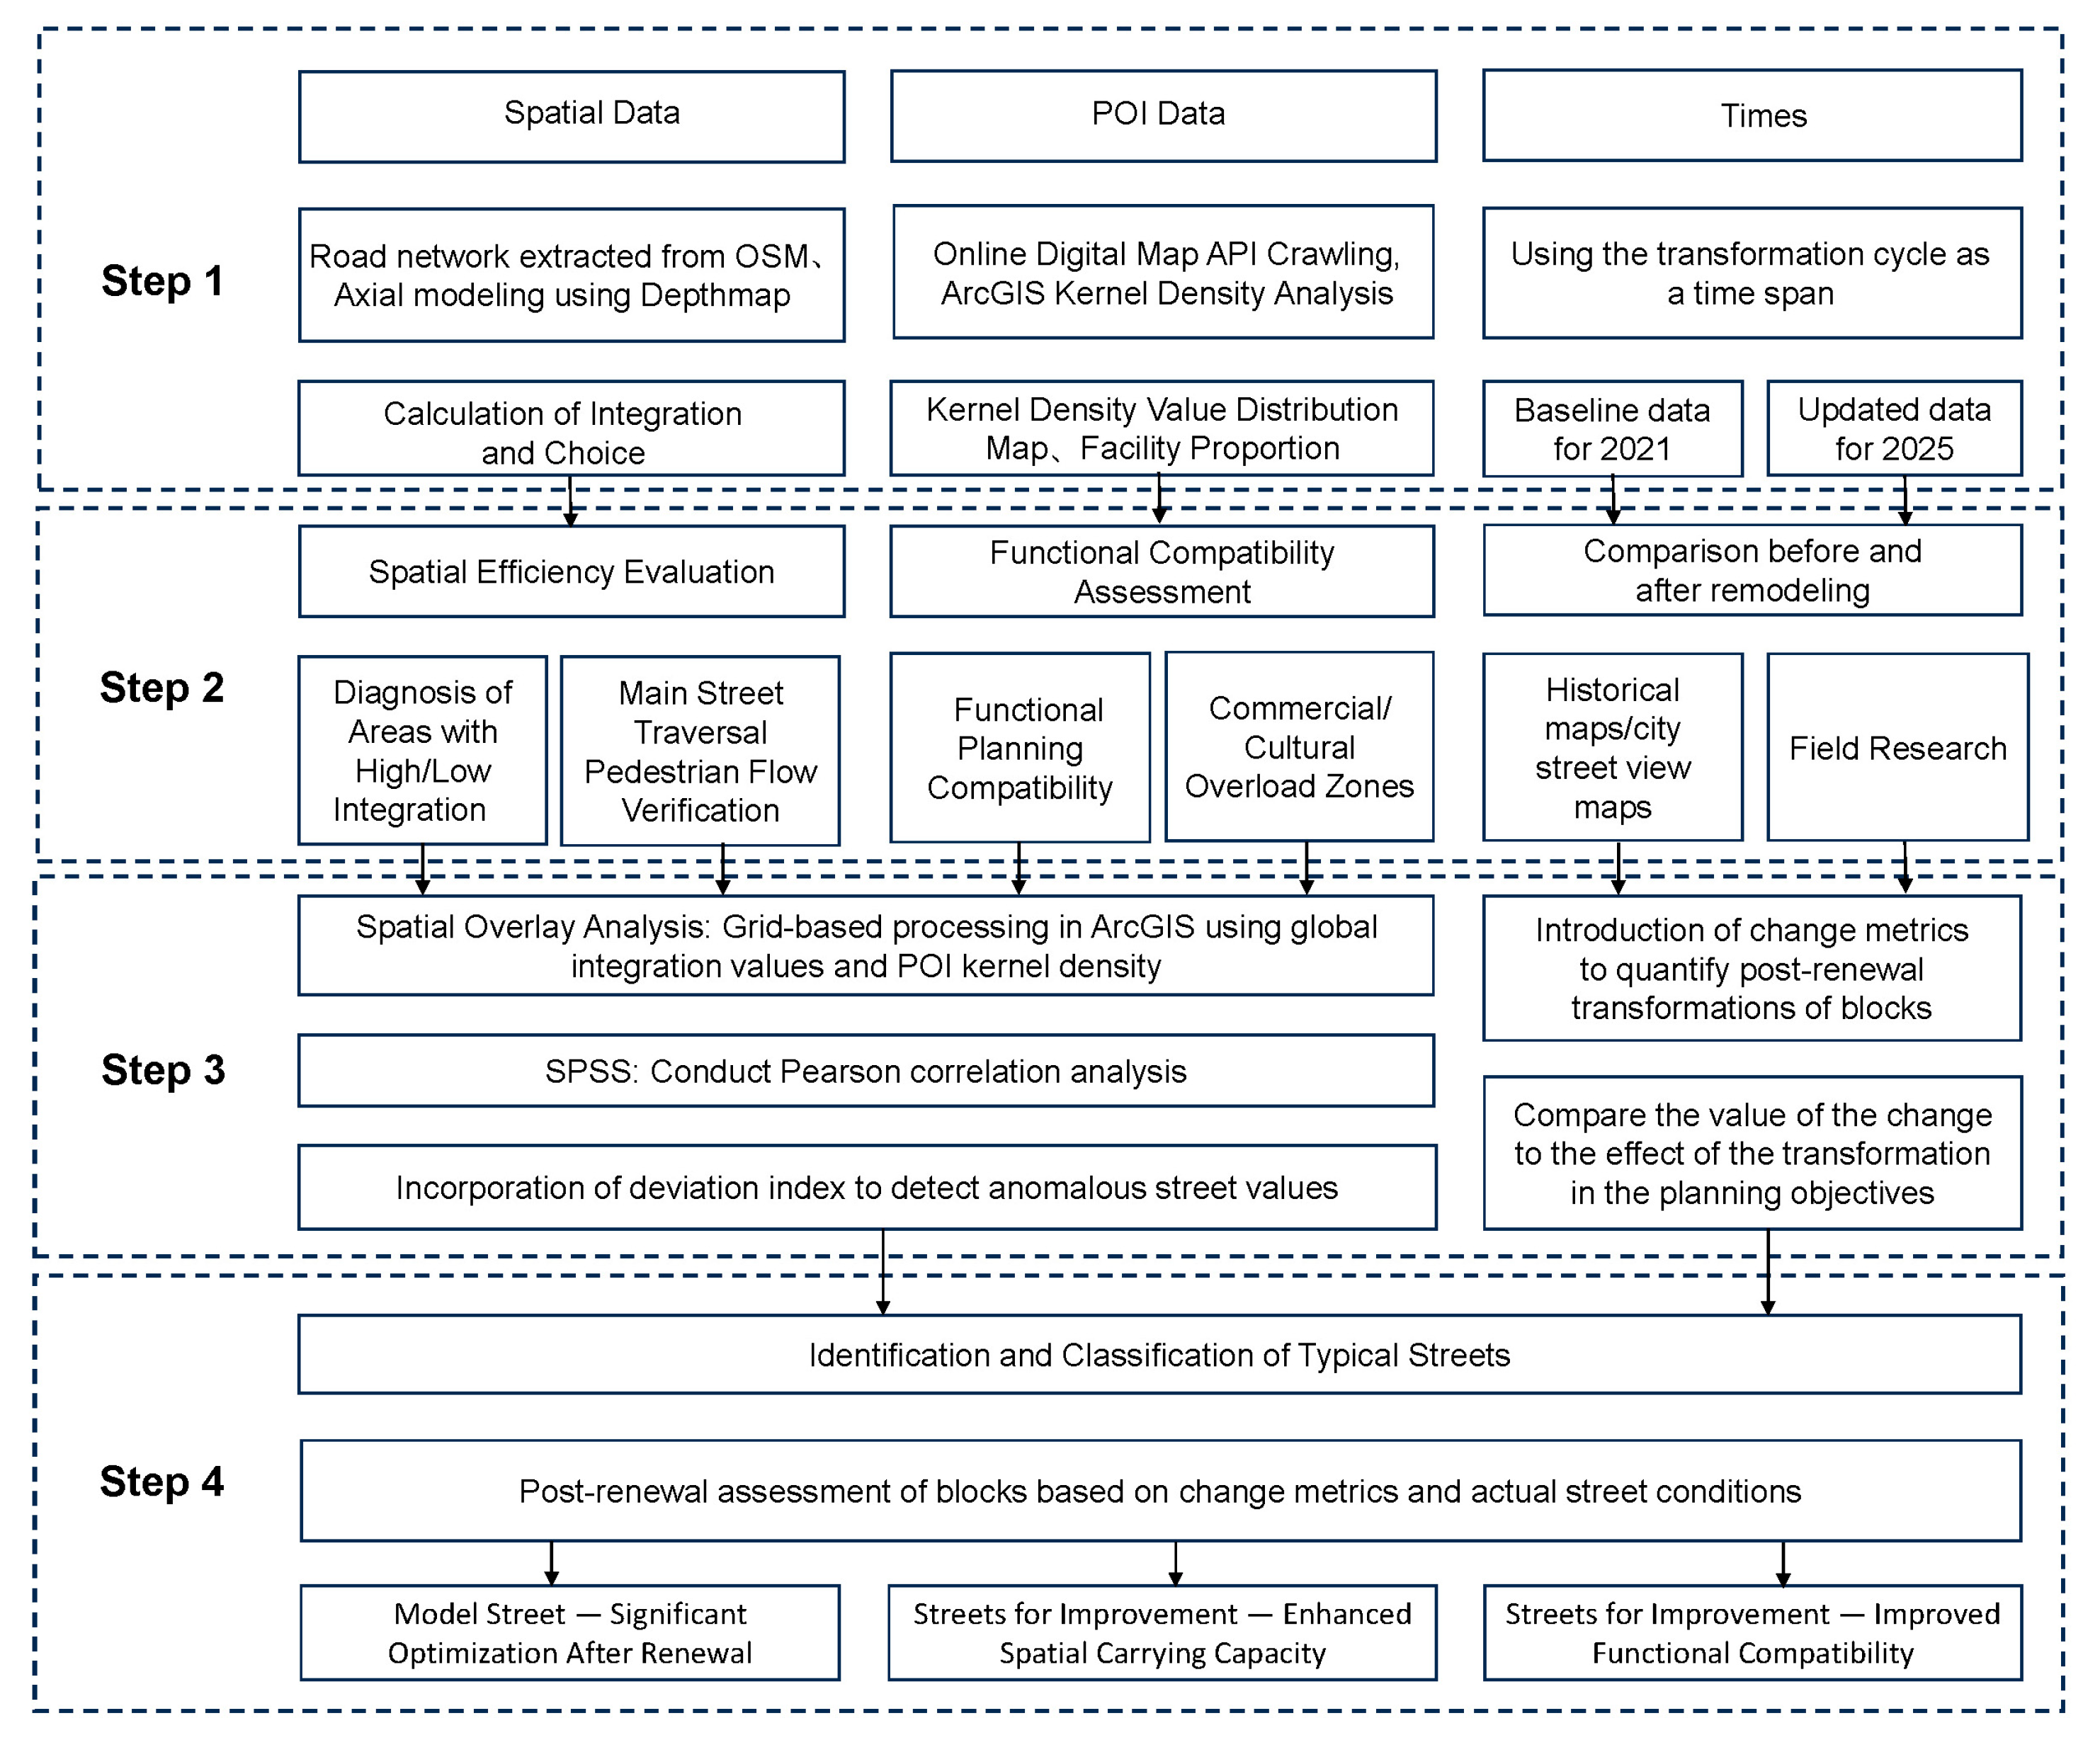
Figure 2. Technical flowchart.
Buildings 15 02896 g002
Figure 3. Historical changes in urban structure: (a) Historical Changes of Urban Structure; (b) Research scope.
Buildings 15 02896 g003
Figure 4. Before-and-after comparison of renovation.
Buildings 15 02896 g004
Figure 5. Integration Analysis: (a) Integration Value in 2021; (b) Integration Value in 2025.
Buildings 15 02896 g005
Figure 6. Choice Value Analysis: (a) Choice Value in 2021; (b) Choice Value in 2025.
Buildings 15 02896 g006
Figure 7. Changes in spatial efficiency: (a) Integration Variation; (b) Choice Variation.
Buildings 15 02896 g007aBuildings 15 02896 g007b
Figure 8. POI facility proportion.
Buildings 15 02896 g008
Figure 9. POI facilities distribution: (a) 2021 POI facility distribution; (b) 2025 POI facility distribution.
Buildings 15 02896 g009
Figure 10. Kernel density analysis: (a) Kernel density for 2021; (b) Kernel density for 2025.
Buildings 15 02896 g010
Figure 11. Grid map of integration and kernel density in 2021: (a) Grid map of integration for 2021; (b) Grid map of kernel density for 2025; (c) Integration grid map in 2025; (d) Kernel density grid map in 2025.
Buildings 15 02896 g011
Figure 12. Pearson Correlation Coefficient Results.
Buildings 15 02896 g012
Figure 13. Deviation degree fishing net map: (a) Deviation for 2021; (b) Deviation for 2025.
Buildings 15 02896 g013
Figure 14. Typical street classification.
Buildings 15 02896 g014
Figure 15. Change in Deviation Degree Feedback: (a) Spatial Fishnet Map of Change Values; (b) Feedback between Change Values and Planning.
Buildings 15 02896 g015
Table 1. Definition of Deviation and Change Value Zones.
CategoryDefinitionExplanation
High Deviation Zone x   >   D ¯ + SExcessive functional concentration, spatial congestion, or imbalance in facility distribution; requires pressure relief or layout optimization.
Average Deviation Zone D ¯ S     x     D ¯ + SIndicates consistency between street integration and POI kernel density across the district.
Low Deviation Zone x   <   D ¯ − SA potential spatial zone; vitality can be activated via functional implantation or circulation optimization.
Functionally Aggregated ZoneC > 0Indicates increased street vitality or growing spatial pressure.
Functionally Dispersed ZoneC < 0Indicates a decline in street vitality or reduced functional pressure.
Table 2. Space efficiency data.
Urban StreetFormIntegration Value (2021)Integration Value (2025)Choice Value (2021)Choice Value (2025)
Cheng ‘en StreetMain Street0.8190.78257,712.85760,983.750
Haiguan RoadMain Street0.6020.59824,316.60031,245.200
Renmin Middle RoadMain Street0.7510.73951,231.41767,976.833
Nanhu North RoadMain Street0.6380.62918,405.81825,750.091
Wenmiao LaneBranch0.5420.58313,805.00024,994.300
East StreetBranch0.5770.56824,930.07727,934.923
Wumiao StreetBranch0.7410.71239,534.20041,136.400
Gexue Yi StreetBranch0.7200.7128392.71415,684.286
Gexue StreetBranch0.7190.68826,003.00031,532.000
Dashu StreetBranch0.7000.69918,424.14333,023.286
WenmiaoInner Road0.4950.4794963.8573816.237
Memorial Hall of the National Southwest Associated UniversityInner Road0.5030.5092796.8244439.458
Yuhuang PavilionInner Road0.7590.70810,569.6924677.933
Table 3. Facility type.
Major CategoryType of FacilityType of 2021Type of 2025Total of 2025Proportion of 2025
ResidentialResidential community14142711.11%
Business residences96
Accommodation services37
Square DistrictSquare recreation area2220.82%
Public ServicesPublic facilities1473815.60%
Government agencies1115
Healthcare2313
Sports and leisure43
TrafficTransportation facilities1110104.16%
BusinessShopping services876914459.26%
Companies56
Life services7346
Catering services5423
CultureTourist attractions04229.05%
Scenic spots and attractions88
Science, Education, and Culture1210
Table 4. Comprehensive data of main streets.
Urban StreetFormIntegration Value (2025)Choice Value (2025)Deviation Degree of 20212021 DeviationDeviation Degree of 20252025 DeviationChange ValueTrend Description
Renmin Middle RoadMain Street0.6743077.2343.907Medium
Deviation
4.160High
Deviation
0.254Rising from medium to high
Wumiao StreetBranch0.6292320.1495.966High
Deviation
3.070High Deviation−2.896Persistently high
Gexue Yi StreetBranch0.6931796.4124.233High
Deviation
2.512Medium Deviation−1.721Decline from high to medium
Gexue StreetBranch0.6841527.3881.958Medium
Deviation
2.204Medium Deviation0.247Stable
Wenmiao LaneBranch0.5151214.2540.669Medium
Deviation
2.061Medium Deviation1.392Stable
Cheng ‘en StreetMain Street0.7391479.5102.590Medium
Deviation
1.962Medium Deviation−0.627Stable
East StreetBranch0.571982.3161.169Medium
Deviation
1.772Medium Deviation0.604Stable
Haiguan RoadMain Street0.591893.2920.921Medium Deviation1.484Medium
Deviation
0.563Stable
Memorial Hall of the National Southwest Associated UniversityInner Road0.523718.8200.503Medium
Deviation
1.430Medium Deviation0.927Stable
WenmiaoInner Road0.497669.8500.048Low
Deviation
1.356Medium Deviation1.307Increase from low to medium
Yuhuang PavilionInner Road0.736762.9611.123Medium
Deviation
1.037Medium Deviation−0.085Stable
Dashu StreetBranch0.663517.5221.443Medium
Deviation
0.756Low
Deviation
−0.687Decrease from
medium to low
Nanhu North RoadMain Street0.585185.1760.462Medium
Deviation
0.297Low
Deviation
−0.164Decrease from
medium to low
East Street Historic DistrictAverage value0.6071173.1812.168Average1.857Average−0.311Average
Table 5. Typical streets.
Pearson CorrelationSpatial Distribution PatternUrban StreetStreet TypeCurrent Deviation ClassificationChange Value ClassificationTrend Analysis
Weak CorrelationClosely related to the high commercial vitality of the western area of the old townRenmin Middle RoadMain StreetHigh DeviationFunctional AggregationRising Pressure
Wumiao StreetBranchHigh DeviationFunctional DispersionReduced Pressure
Functional development constrained by geographical factorsDashu StreetBranchLow DeviationFunctional DispersionDeclining Vitality
Nanhu North RoadMain StreetLow DeviationFunctional DispersionDeclining Vitality
Strong CorrelationCore area and key redevelopment zone of the East Street Historic DistrictWenmiao LaneBranchMedium DeviationFunctional AggregationVitality Increase
WenmiaoInner RoadMedium DeviationFunctional AggregationVitality Increase
East Street BranchMedium DeviationFunctional AggregationStable
The vertical central axis of the old town influences the overall trendCheng en StreetMain StreetMedium DeviationFunctional DispersionStable
Gexue Yi StreetBranchMedium DeviationFunctional DispersionSignificant Improvement
Table 6. Summary of government planning strategies.
Planning StageStreet SpaceFunctional FacilitiesExpected Effect
Short-term planning
(2021–2025)
1. Slow traffic is the main focus, and non-essential vehicles are restricted.
2. Demolish temporary buildings and dredge roadways.
3. Focus on protecting the scale, direction and traditional paving of East Street, Confucian Temple Lane and Wumiao Street.
1. Retain cultural facilities and add the Dacheng Hall Exhibition Hall of the Confucian Temple.
2. Existing educational and medical facilities will be retained.
3. Add a leisure plaza on the west side of Kuixing Pavilion.
1. Street space: protect the historical texture and improve the environment.
2. Functional facilities: retention and addition of basic cultural facilities.
Long-term planning
(2026–2035)
1. Extend two lanes near Confucian Temple Lane and add east–west branch lines.
2. Deepen the construction of the pedestrian system, optimize the network, and strictly control the high line attachment rate.
3. Comprehensively renovate the façade style of Cheng’en Street and Wumiao Street (east–west).
1. A new kindergarten will be added on the east side of the block to make up for the education gap.
2. Add one public toilet and optimize garbage sorting facilities.
3. Expand the intangible cultural heritage experience space (cave music, bridge rice noodle workshop).
1. Street space: optimize the road network structure, style coordination.
2. Functional facilities: education fills the gaps, intangible cultural heritage is inherited.
3. Core: The vitality of the block is revived, and the cultural tourism economy has become a pillar industry.
Table 7. Comparison of abnormal street modifiers.
Fix ObjectUnusual StreetsOriginal ValueNeighboring RoadThe Value of the Neighboring StreetCorrected Value (After Correction)
Integration ValueWumiao Street0.693Cheng ‘en Street0.7390.716
Kernel Density
Value
Renmin Middle Road3077Gexue Yi Street 19762526.5
Dashu Street518Cheng ‘en Street1480999
Nanhu North Road 185Haiguan Road893539
Table 8. Comparison of Correlations Across Cities.
CityCorrelationPhenomenonFormation Mechanism
Hefei (Huaihe Road Pedestrian Street) [33]Medium–high (Pearson’s r ≈ 0.58)Integration Value exerts the strongest influence on spatial vitalityEnhanced urban road network, diversified spatial layout, and abundant cultural tourism attractions continuously attract residents and visitors
Chengdu (Central Urban Area) [6]Significant (Regression model r ≈ 0.45)Significant correlation exists between urban form (building intensity, density, accessibility, and functional diversity) and block vitalityHigher block accessibility improves connectivity with other city areas, facilitating resident participation in activities and social interactions
Xi’an (Ancient City Core Area) [7]Negative (Spearman’s r = −0.343)Walking accessibility negatively correlates; motorized traffic disturbance positively correlatesHigh vitality areas experience vehicle congestion; lower walkability and higher motorized traffic disturbance associate with higher vitality
Mengzi (East Street Historic District)Moderate–weak (Pearson’s r = 0.32)Clear mismatch between high Integration Value areas and POI kernel density peaks, resulting in streets with high accessibility but low vitalityResource loss and uneven investment, rapid decline and functional simplification, spatial governance constraints, and historical limitations
Disclaimer/Publisher’s Note: The statements, opinions and data contained in all publications are solely those of the individual author(s) and contributor(s) and not of MDPI and/or the editor(s). MDPI and/or the editor(s) disclaim responsibility for any injury to people or property resulting from any ideas, methods, instructions or products referred to in the content.