Article

Assessment of Energy Saving Potential from Heating Room Relocation in Rural Houses Under Varying Meteorological and Design Conditions

1
School of Civil Engineering and Architecture, Xi’an University of Technology, Xi’an 710048, China
2
China Northwest Architectural Design and Research Institute Co., Ltd., Xi’an 710018, China
3
School of Life Sciences, Yan’an University, Yan’an 716000, China
*
Author to whom correspondence should be addressed.
Buildings 2025, 15(16), 2867; https://doi.org/10.3390/buildings15162867
Submission received: 23 July 2025 / Revised: 7 August 2025 / Accepted: 11 August 2025 / Published: 13 August 2025

Abstract

Space layout design has been recognized as a key technical challenge in achieving low-energy and low-carbon rural houses. Adjustment of room location can influence building energy performance and is subject to both meteorological and design parameters. To elucidate the impact of these parameters on the energy saving potential of room relocation (ESR), this study investigated rural houses in Northwest China using dynamic simulations to compare the relative energy saving rates (RES) associated with three types of single heated room location changes: from the west side to the middle (WM), from the east side to the middle (EM), and from the west side to the east side (WE). Simulations were conducted across different climate regions (Lhasa, Xi’an, Tuotuohe, and Altay) and design parameters, including exterior wall U-value, building orientation (BO), building height (BH), and window-to-wall ratio (WWR). Additionally, the maximum differences in energy consumption (MD) among six layouts with multiple heated rooms were assessed. The results demonstrated that ESR varied significantly with room relocation. The ranges of RESWM, RESEM, and RESWE were −7.89% to 13.20%, −7.82% to 10.25%, and −2.29% to 3.36%, respectively. The MD values ranged from 2.42% to 15.01%. For single heated rooms, including direct normal irradiance (Idn), the difference between east and west solar-air temperature (△Tsa), outdoor dry bulb temperature (Te), exterior wall heat transfer coefficient (U), and WWR significantly influenced RESWM and RESEM. The ranking of the factor contributions was U > △Tsa > Idn > Te > WWR for RESWM and U > Idn > △Tsa > Te > WWR for RESEM. In the case of RESWE, Idn, △Tsa, Te, exterior wall U value, and BO had significant effects, ranking Idn > △Tsa > Te > BO > U. For MD, the key influencing factors were Idn, △Tsa, Te, exterior wall U value, and WWR, which were ranked as Idn > △Tsa > U > Te > WWR. The effects of design parameters on ESR varied under different climatic conditions. In high-temperature regions, the exterior wall U-value had a stronger influence on the ESR of WE. In regions with larger |△Tsa|, BO exerted a more pronounced effect on the ESR of WE. In regions characterized by high temperatures and radiation, WWR and BH significantly influenced the ESR of WM and EM. Similarly, in these regions, WWR and BH exhibited a greater impact on MD. Finally, among the meteorological parameters, Idn and △Tsa were significantly correlated with ESR (p < 0.01). These findings provide a valuable reference for the energy-efficient layout design of rural houses in Northwest China and cold regions and support the future development of intelligent and automated rural residential spatial layout design.

1. Introduction

Building energy consumption is a major contributor to global energy use and carbon emissions [1,2]. In China, the energy consumption of the construction industry accounts for over 35% of the nation’s total energy usage, with a significant portion devoted to space heating and cooling [3]. To achieve the dual-carbon target, the Chinese government has implemented national legislation [4] and industry standards [5] to promote green and sustainable development in both urban and rural living environments. However, compared with urban houses, most rural dwellings are constructed without scientific design, often resulting in poor thermal comfort, high energy consumption, significant carbon emissions, and severe environmental pollution [6]. In 2021, the total construction energy consumption of China reached 1.91 billion tons of coal equivalent, representing 36.3% of the total energy consumption [7]. Simultaneously, the rural residential construction area reached 23 billion m2, accounting for 32% of the total construction area. Therefore, promoting energy-efficient renovation of rural residential buildings is crucial for achieving China’s dual-carbon objectives [8].
Determining room location is one of the primary design considerations in a spatial layout. As a typical passive design strategy, it influences the distribution of solar radiation heat gain across different rooms [9,10]. It has become a key element in improving indoor thermal comfort (ITC) and building energy performance (BEP) [11,12]. For instance, Dino et al. [13] simulated and compared various library layout schemes with identical geometries in Turkey and demonstrated a 19% variation in daily heating demand and a 20% variation in cooling demand depending on the layout. Yi [14] simulated and compared a South Korean office building under different layout configurations and found that the maximum difference in annual energy use was 8%, while the difference in predicted mean vote reached 15%. To isolate the effect of room position within the spatial layout design, Du et al. [15] compared the heating and cooling loads of office buildings under cold, warm, and hot climatic conditions using 11 layout schemes. Their results showed that adjusting the room location alone could significantly influence BEP. However, among the 100 studies reviewed by Ekici et al. [16] on building performance optimization, most focused on quantifiable design parameters, such as window-to-wall ratio (WWR), shading, building orientation (BO), building height (BH), and similar features. Only six studies addressed spatial layout optimization [17], and the majority were conducted on urban buildings [18,19]. Considering the clear operational differences between rural and urban houses, such as centralized heating in urban houses versus local or zoned heating in rural homes, it becomes essential to flexibly determine the room location [20]. The ESR (the energy saving potential of room relocation), proposed in this study, was used to evaluate the impact of location changes of a single room and multiple rooms on energy consumption, which was more suitable for the complex and diverse living scenarios in rural areas. It can be used to solve the problems of arranging heating equipment for existing rural buildings and optimizing the spatial layout of new rural buildings, and adapting to various heating conditions. It is significantly important for improving the ITC and BEP of rural houses to fully realize their energy saving potential.
As a fundamental factor in building performance, the ESR resulting from changes in room location is influenced by both meteorological and design variables. Multiple variables associated with space layout effects were identified in a study by Delgarm et al. [21], where simulation-based multi-objective optimization was employed to evaluate how the specific architectural elements of a standard room could affect energy consumption across four different climatic regions in Iran. Their findings revealed that optimized spatial configurations tailored to each climatic condition could yield substantial energy savings. Similarly, Du et al. suggested that the effect of room location changes on BEP varies across three distinct climatic environments depending on the thermal performance characteristics of the building envelope [15]. Moreover, previous research has demonstrated that integrating design parameters produces greater energy saving benefits than optimizing them individually. For instance, the simultaneous optimization of WWR and BO can lead to 60% energy savings [22,23]. Liu et al. [24] evaluated and optimized the energy efficiency of rural houses in Huangyuan County, concluding that the coordinated optimization of BO, building outline, BH, and solar access among other parameters had a significant impact on the energy efficiency and BEP in cold climates. Similar conclusions have been reported in the domains of multi-objective optimization of building space design and automatic generation of optimal building layouts [25,26]. However, existing studies have primarily focused on identifying the optimal combinations of design parameters, lacking a comprehensive investigation into how meteorological and design factors interact in the context of spatial layout optimization.
ESR is primarily derived from improvements in building lighting and thermal environments [27]. Therefore, it is highly sensitive to climatic conditions in the study area [15]. In rural regions of Northwest China where the research was conducted, most areas fell within severely cold or cold climatic zones. In these areas, heating energy consumption during winter accounted for 53.6%, while cooking energy consumption accounted for 37%, with the total energy usage reaching up to 90% of rural residential energy consumption. The poor thermal performance of rural buildings is a major contributor to their excessive energy use [28]. To simplify the scope, this study focused on typical direct-gain rural solar houses in Northwest China, where winter heating is critical. Using numerical simulations and statistical analysis, this study evaluated the ESR associated with different room location changes, clarified the effects of various meteorological and design parameters, and proposed spatial layout optimization strategies for rural houses in Northwest China. The findings were intended to support the spatial layout energy saving design for rural houses in cold and severely cold regions and to inform future intelligent and automated spatial layout designs for rural residences.

2. Climate and Residential Layout Characteristics

2.1. Climate Characteristics

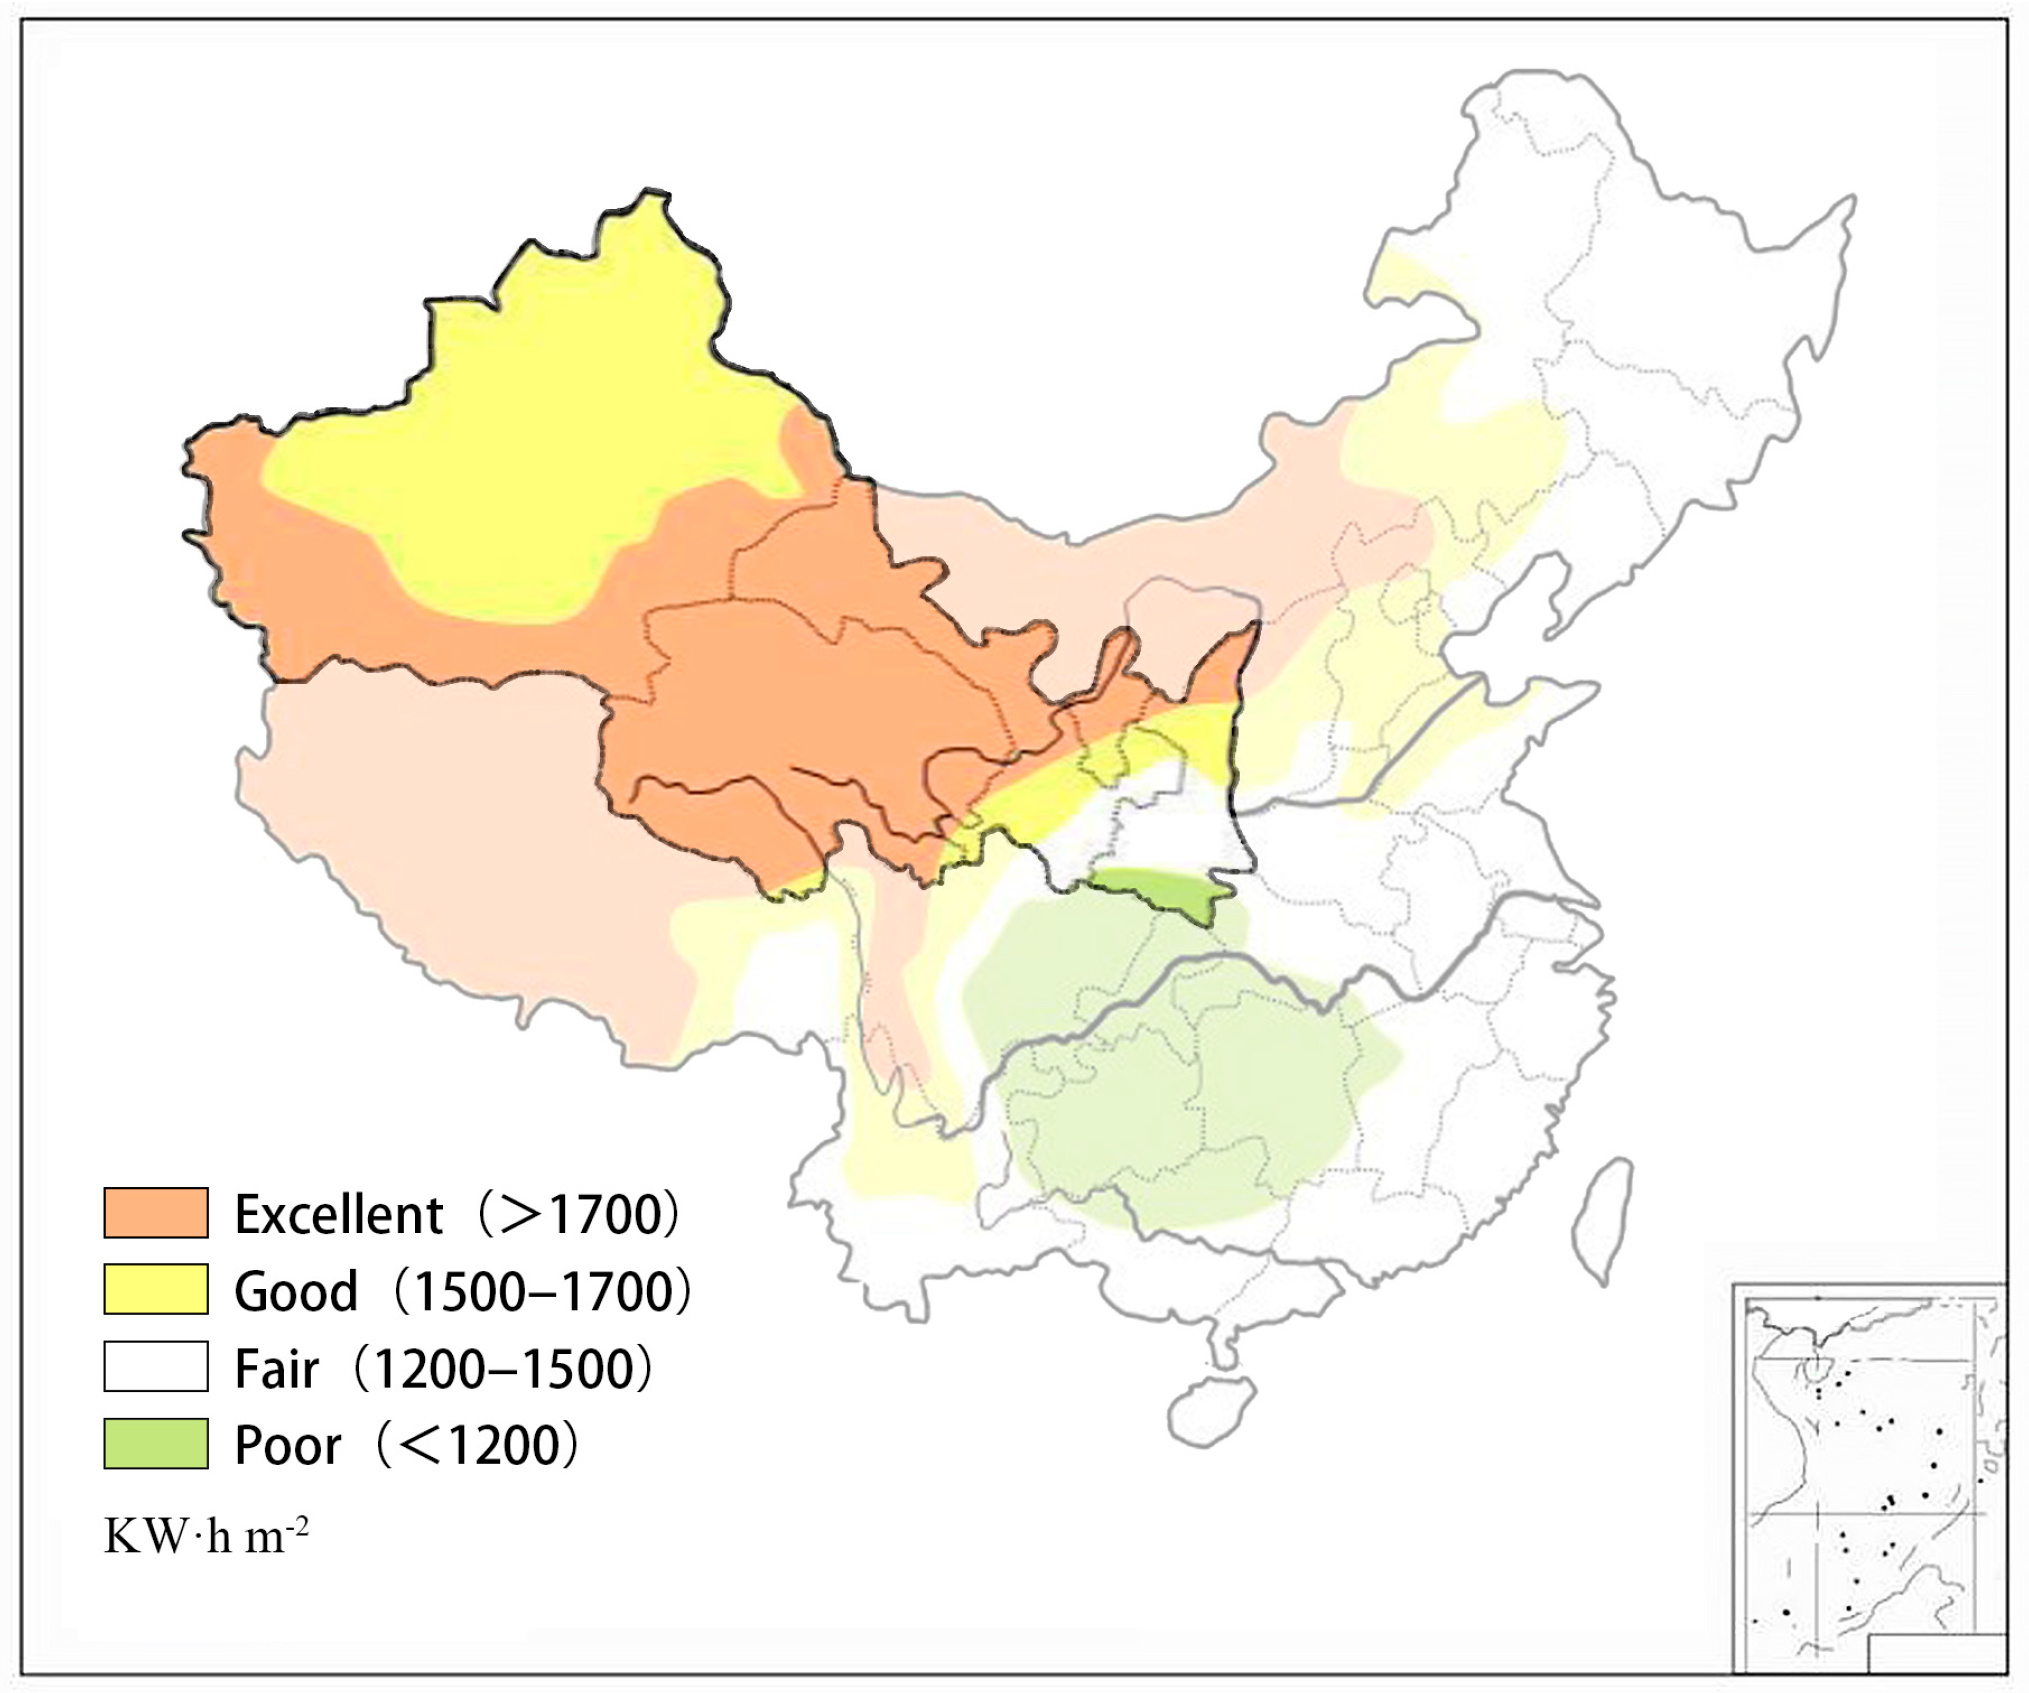
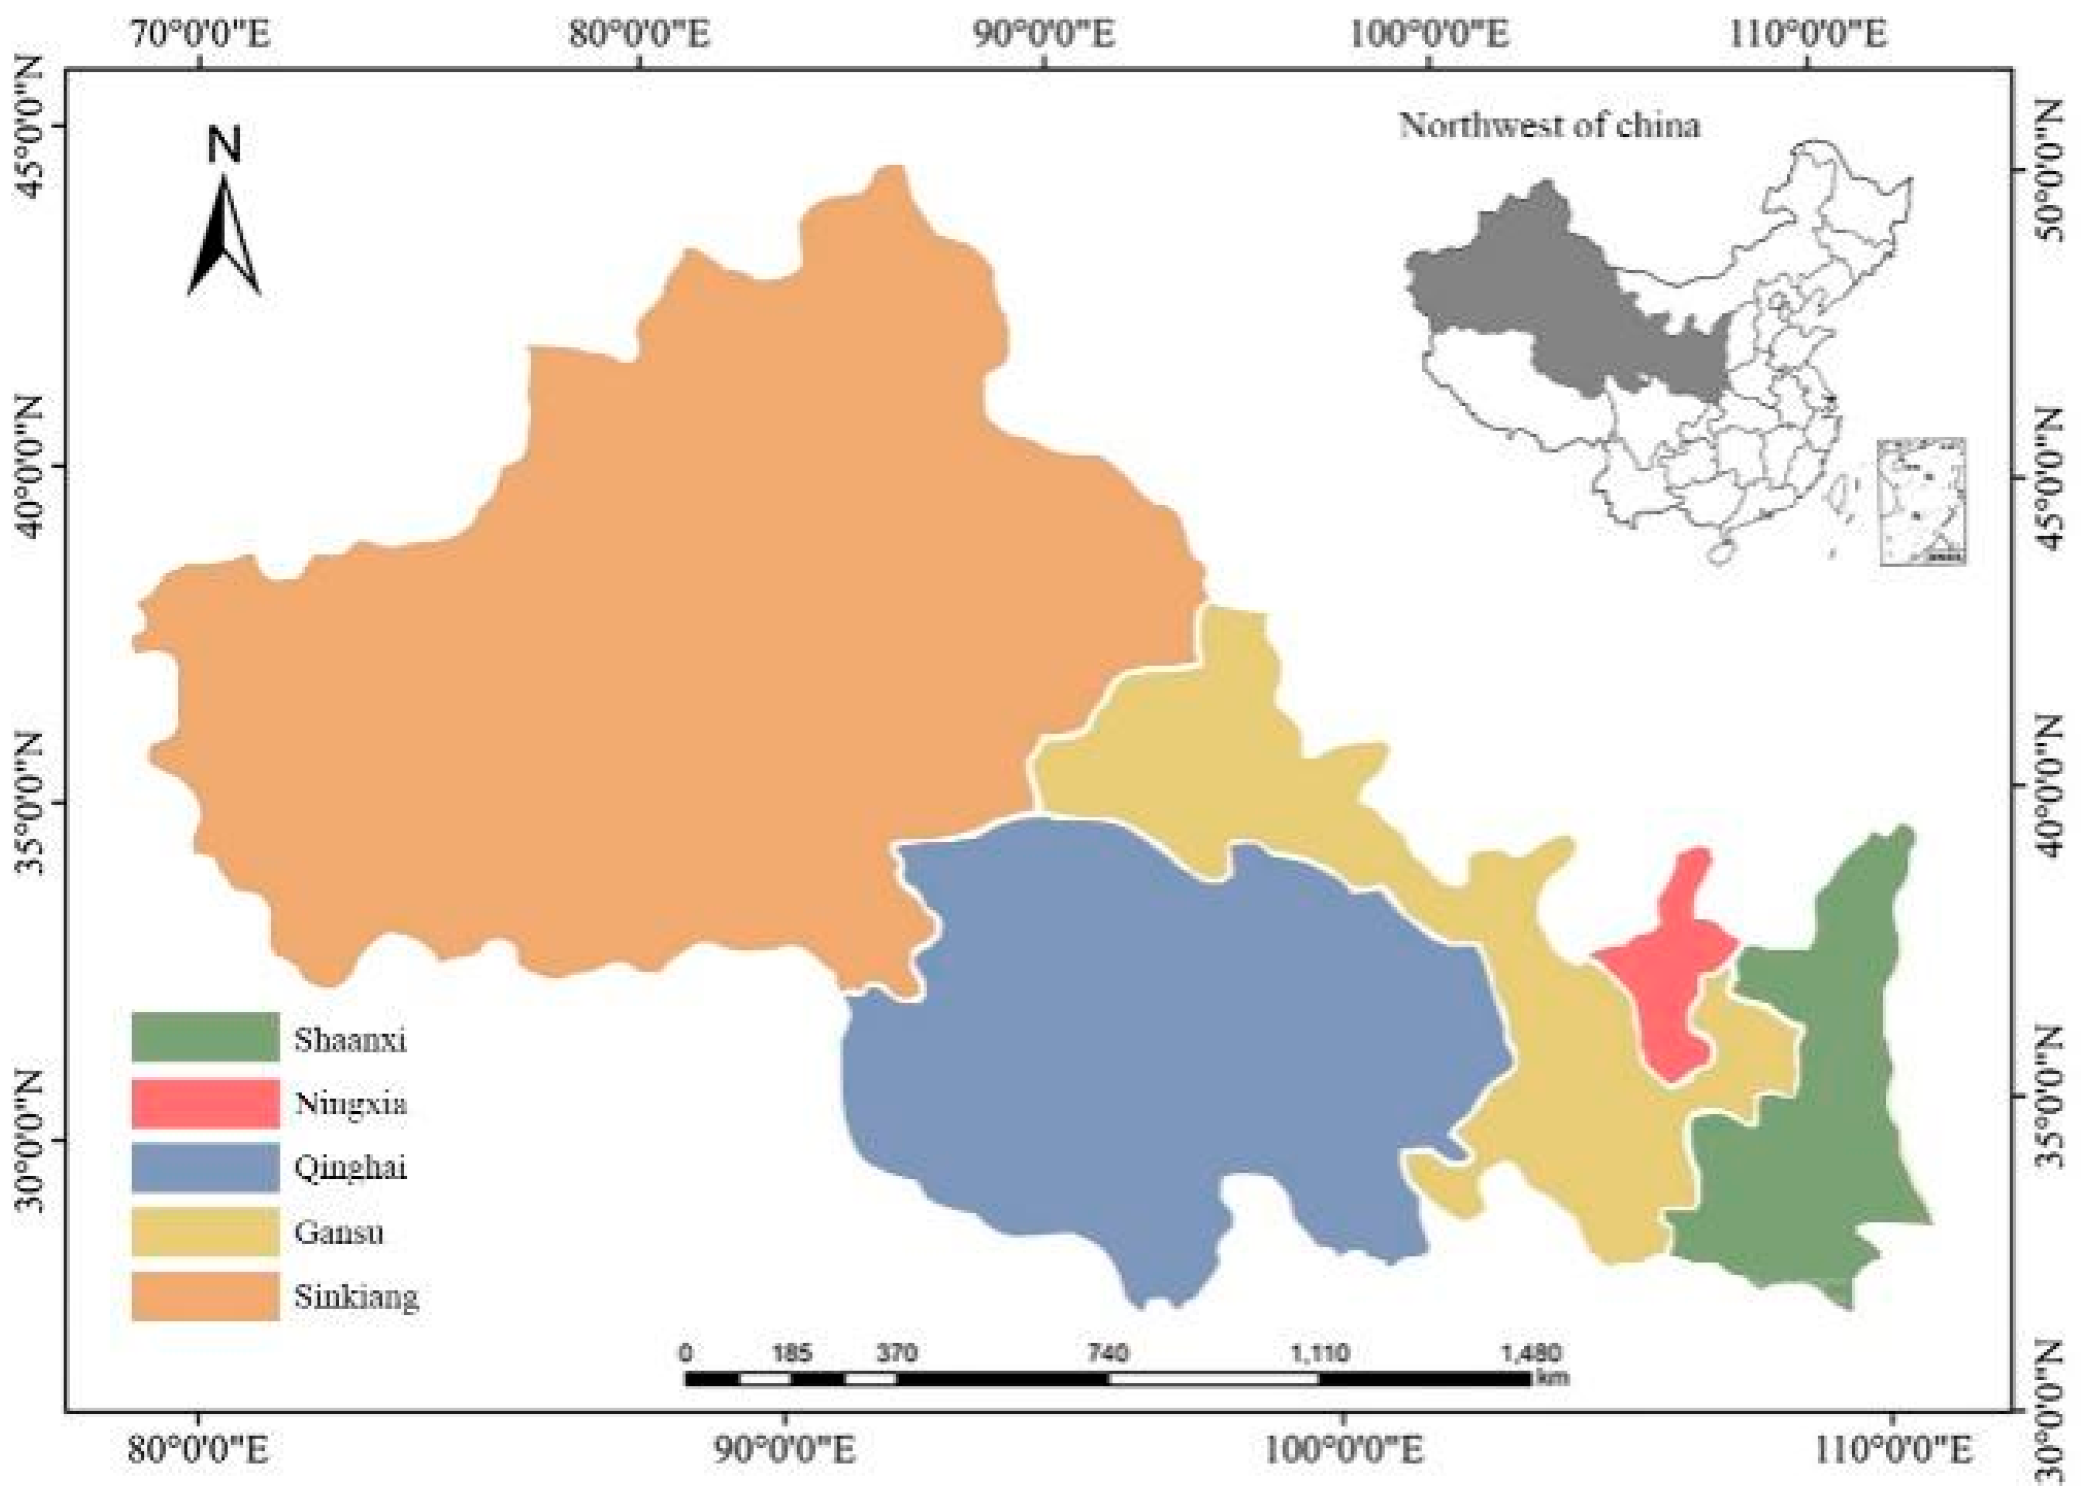
The study area is located in Northwest China, spanning geographic coordinates of 73.67 °E–111.25 °E and 31.60 °N–48.17 °N, with a total area of approximately 3.04 × 10⁶ km2 (Figure 1). The predominant climate types in this region are severely cold and cold, characterized by long and harsh winters. This area is also rich in solar energy (Figure 2). According to the classification of solar energy resource availability in China, as defined by the Technical Code for Passive Solar Buildings [29], the majority of the study area falls within climate zones deemed optimal and suitable for solar heating.

2.2. Layout Characteristics

Compared with urban houses, rural solar houses exhibit simpler spatial layouts. These layouts are typically in the form of regular rectangles, elongated in the east-west direction and narrower in the north-south direction. Such a design facilitates construction and enhances the solar exposure on the south-facing side. The internal rooms tend to follow a regular rectangular shape. Essentially, the spatial layout of rural houses involves arranging several smaller, regular rectangles within a larger one [30]. In existing rural houses in Northwest China, the most common configuration is a symmetrical three-bay layout featuring a central hall (Figure 3). Although some rural households with better economic conditions have begun to emulate the spatial and functional layouts of urban residences, their design flexibility remains constrained by the structural limitations of brick and concrete buildings, resulting in relatively restricted choices for room positioning.

3. Basic Building Model and Research Method

Given the study area’s location in severely cold and cold climate regions, winter heating energy consumption can account for the majority of rural household energy use. According to the theoretical calculation method of the building heat consumption index, the primary factors influencing heating energy consumption include spatial design, building envelope, climate, equipment systems [20], and residents’ thermal demand. Based on field research data collected from rural houses in regions such as Shaanxi, Gansu, and Xinjiang, and with reference to relevant design standards, a basic building model of rural solar houses in Northwest China was developed. This study also established the value ranges of major meteorological and design parameters.

3.1. Basic Space Layout and Its Variants

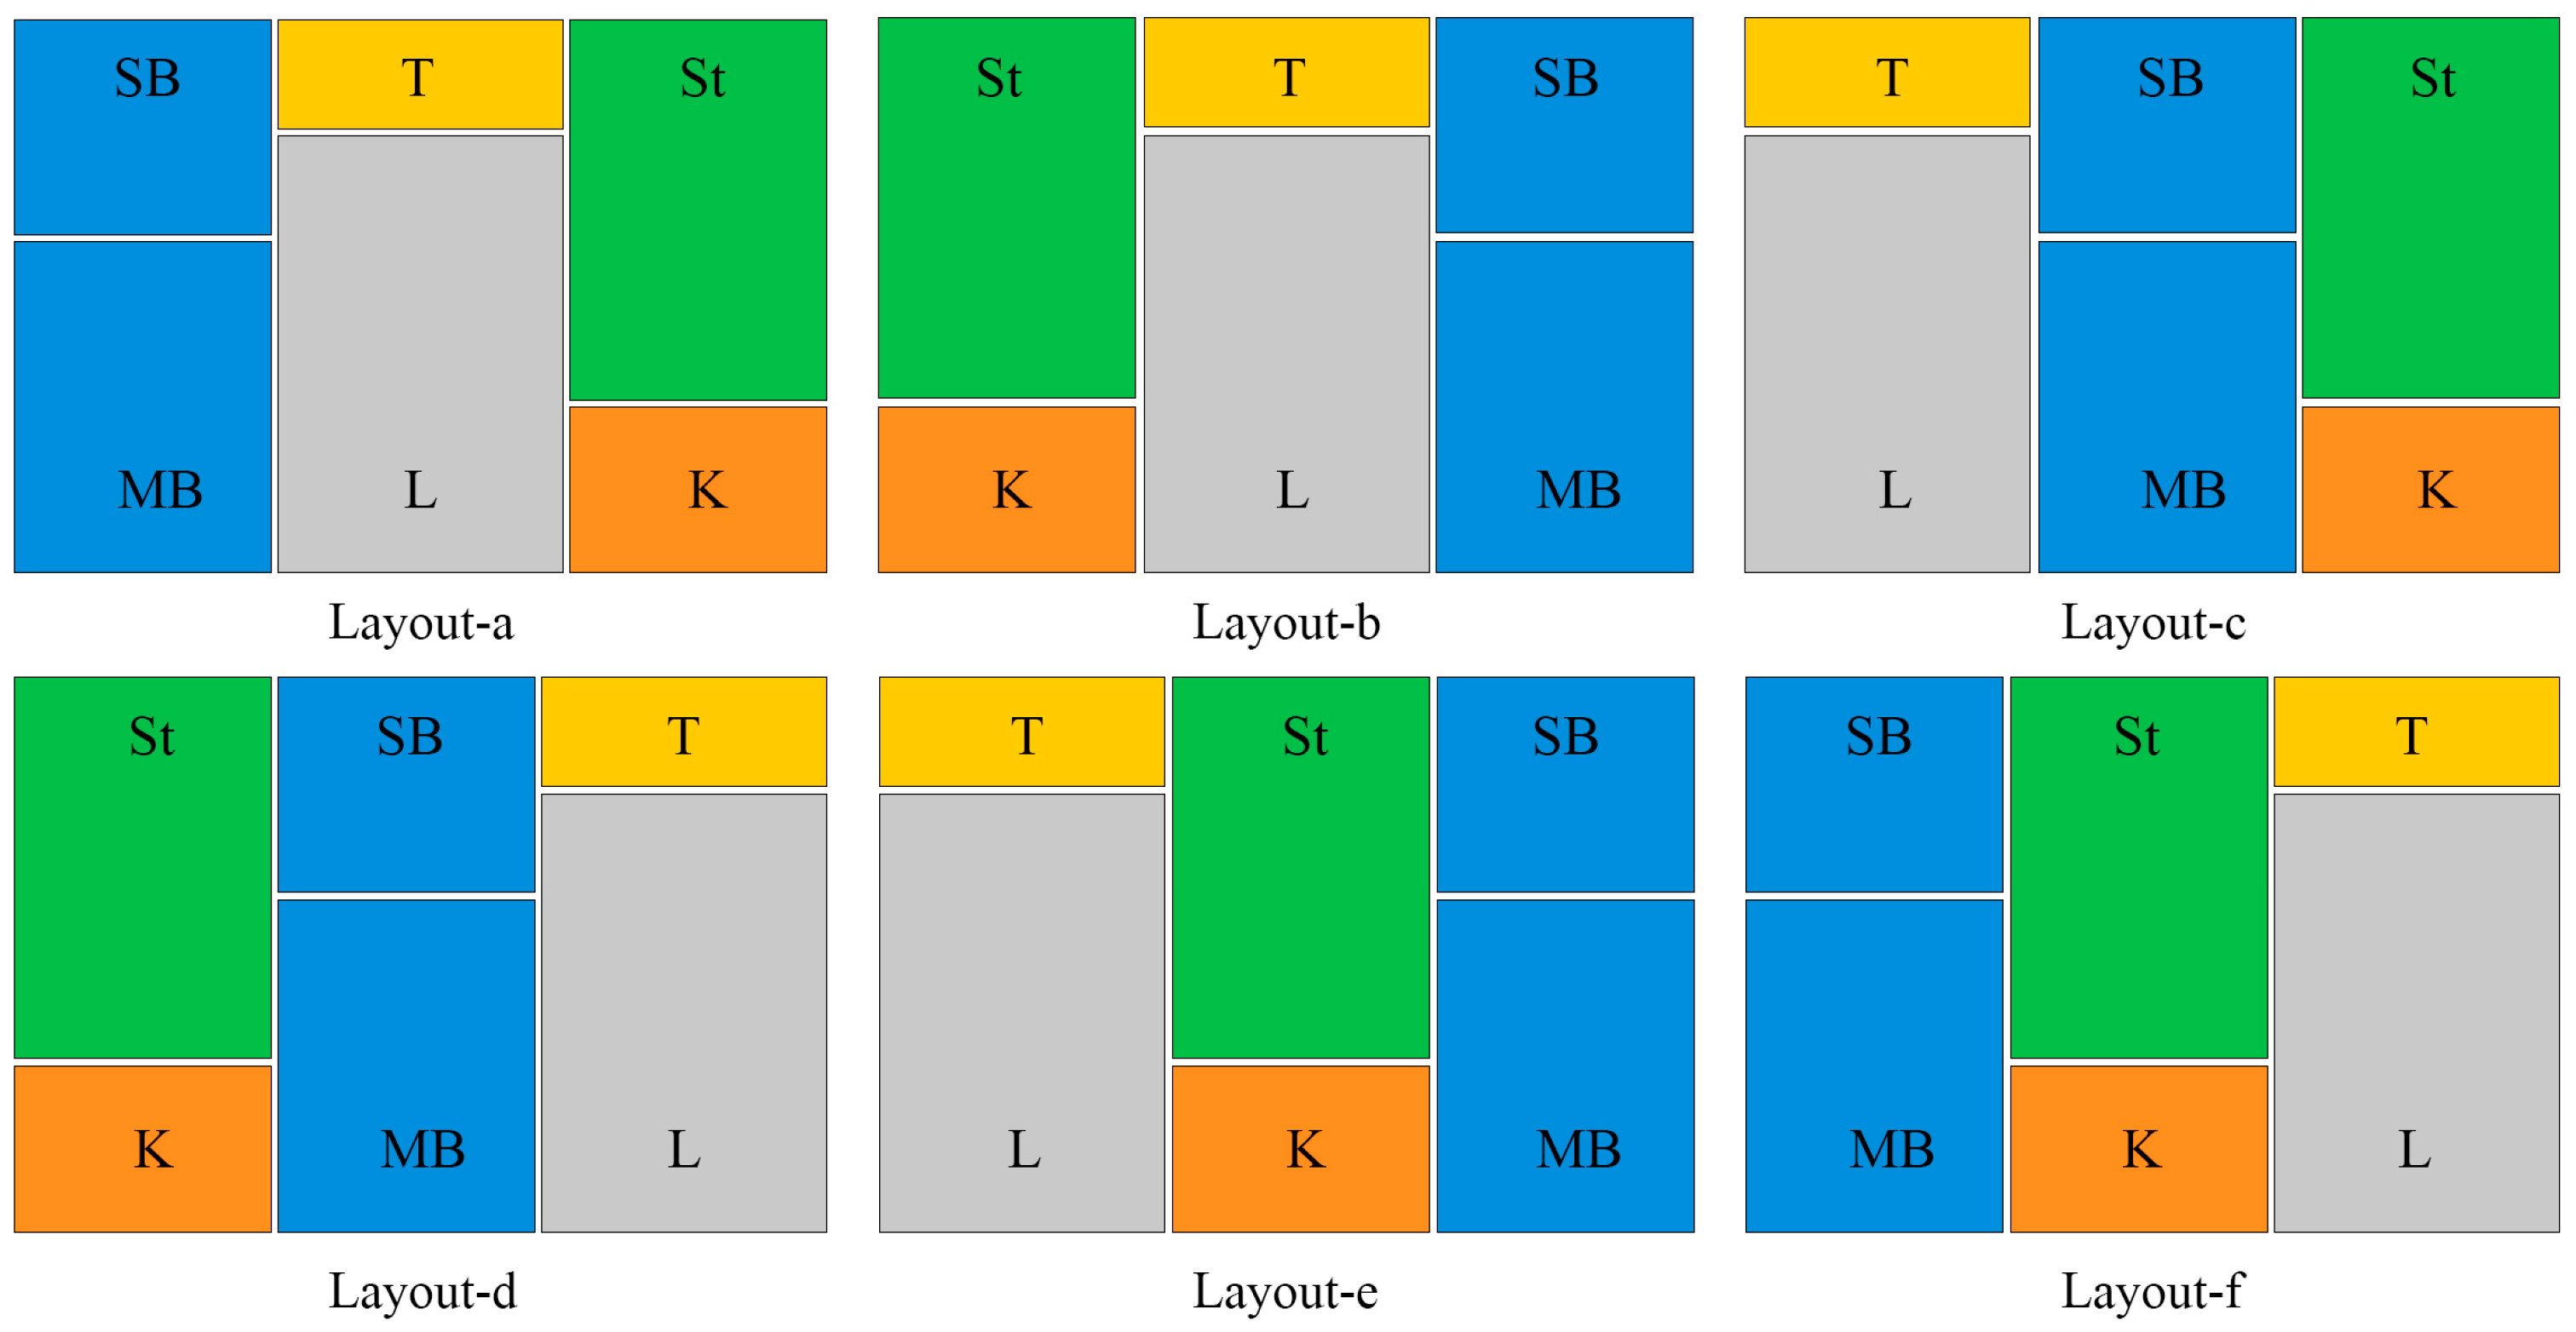
Field research has revealed that rural houses in Northwest China typically contain six functional spaces: a living room (L), a master bedroom (MB), a secondary bedroom (SB), a storage room (St), a kitchen (K), and a toilet (T). Among these, L, MB, and K were the most frequently used and thus classified as primary rooms. SB was typically designated for children’s temporary use during holidays, St was used to store food and tools requiring a cool and dry environment, and T was primarily for daily washing. These were identified as secondary rooms owing to their lower usage frequency.
In the established model, primary rooms (L, MB, and K) were placed on the south side and equipped with heating, whereas secondary rooms (SB, St, and T) were positioned unheated on the north side. The basic layout configuration was located with L in the center, flanked by MB and K on either side (Figure 4a). All layout variants shared a uniform building area of 117.9 m2, with the layout dimension of 13.1 m (east-west) by 9 m (north-south).
Based on layout a, five additional variants (Figure 4b—f) were generated using partial and full mirroring techniques (Figure 4). For all six layouts, the design parameters other than room position were kept constant, as defined in Section 3.2 and Section 3.3, to construct a consistent building model. To avoid deviations in energy consumption due to door quantity or usage frequency in winter, doors were treated as part of walls. Table 1 presents the specific dimensions and heated room areas of L, MB, and K across layouts. The widths and depths of L, MB, and K were 4.7 and 7.2 m, 4.2 and 5.4 m, and 4.2 and 2.7 m, respectively. The areas of L, MB, and K were 33.8, 22.7, and 11.4 m2, respectively.

3.2. Spatial Design Parameters

Numerous design parameters can influence building energy consumption. Given the relatively simple structural form of rural houses and the practicality of spatial design, south-facing WWR, BO, and BH were selected as the spatial design parameters for analysis. According to the residential building design standards for severely cold and cold regions [31,32] and based on field survey data, each parameter was assigned three levels: one typical value and two variants.
(1)
South-facing WWR: With the interval of 0.1, the typical south-facing WWR was set at 0.4 (W-0.4), consistent with the requirements of the current energy-saving design code [32], while the variant values were 0.3 (W-0.3) and 0.5 (W-0.5). Although a WWR of 0.5 exceeds the upper limit defined by energy saving design codes for residential buildings in severely cold and cold regions, it was retained because of its alignment with field survey results. The north-facing WWR was uniformly set at 0.1, with no windows on the east or west walls. To ensure consistency in WWR adjustments, only the window width was varied, while window and sill heights remained constant, and windows were centered. Unless otherwise stated, WWR hereafter referred specifically to the south-facing WWR.
(2)
BO: As the building form in this study resembles the Chinese character “一”, according to Ref. [33], the optimal BO for similar building shapes in major cities of Northwest China typically fell between 20° west of south and 10° east of south. For simplification, BO was set at 10° intervals: the typical value was south 0° (S), and the variant values were 10° west of south (SW-10) and 10° east of south (SE-10).
(3)
BH: To accommodate production needs, rural houses were generally taller than urban buildings. Based on the 0.3 m building expansion modulus, the typical BH was 3.3 m (H-3.3), with the variation levels of 3.0 m (H-3) and 3.6 m (H-3.6). When modifying BH, the window size and sill height were kept constant.

3.3. Structural Design Parameters

The building envelope served as the primary medium for heat transfer between indoor and outdoor spaces and between different rooms, and its thermal performance significantly affected ITC and BEP. As the six layouts described in Section 3.1 did not involve changes to room area or WWR, this study varied only the heat transfer coefficient of the exterior wall (U, W/(m2·K)) to simplify the analysis. The heat transfer coefficients of internal partitions, roof, ground, and windows were kept constant.
To ensure applicability under various climatic conditions in the study region and to align with the development trends of rural housing, according to [34], three types of exterior walls with progressively improved thermal performance were defined as follows:
Type I (T1) was determined based on field surveys of rural houses in Northwest China [35].
Type II (T2) complied with the specifications of Ref. [20], which outlined the energy saving requirements for rural residential buildings in severely cold and cold regions.
Type III (T3) corresponds to that described in Ref. [21] as a standard originally developed for urban residential buildings but is applicable to guiding the gradual enhancement of thermal performance in rural building envelopes.
The thermal performance indicators for the main parts of the building envelope for the three wall types are listed in Table 2. The internal partitions in rural houses typically consisted of 240 mm thick brick walls, with a heat transfer coefficient of 1.75 W/(m2·K). Among the three wall types, T2 was selected as the typical value because it fitted the requirements of the current energy saving design code [32]. T1 and T3 were chosen as variant values. T1, despite not being energy-efficient, is commonly found in existing rural houses. T3, while not yet realized, represents the future development goals for rural houses.

3.4. Meteorological Parameters

The ITC of rural solar houses is influenced by building parameters and is closely associated with meteorological factors such as solar radiation intensity and outdoor air temperature [36]. To clarify the relationship between ESR and meteorological conditions, this study utilized meteorological data from four cities (Lhasa, Tuotuohe, Xi’an, and Altay) for numerical calculations and simulations. City selection was based on the spatial distribution of solar resources in Northwest China [37] and the variation in the average outdoor dry-bulb temperature (Te, °C) during the heating season in northwest cities [38]. Although Lhasa is not geographically situated in Northwest China, its climate characteristics closely resemble those of southern Qinghai Province, which experiences exceptionally high solar radiation levels, making it a representative sample. The climatic profiles of the four cities are as follows: Lhasa is characterized by high temperatures and high radiation; Xi’an, high temperatures and low radiation; Tuotuohe, low temperatures and high radiation; and Altay, low temperatures and low radiation. The “high temperature” was a relative term and did not refer to the hot climates in the conventional meteorological context. To accurately evaluate the impact of solar radiation intensity across different orientations [39] on ESR, the “solar-air temperature” (Tsa, °C) was introduced to describe heat transfer conditions on various envelope orientations [40]. The equation used to compute Tsa [41] is as follows:
T s a = T e q e α e + I ρ s α e = T l + T s
where Tsa represents the solar-air temperature, °C; Te represents the dry-bulb temperature, °C; qe represents the effective nocturnal radiation, W/m2; αe represents the external surface heat transfer coefficient, W/(m2·K); I denotes the solar irradiance, W/m2; ρs denotes the solar radiation absorption coefficient; Tl denotes the long-wave equivalent temperature, °C; Ts denotes the equivalent temperature of solar radiation, °C. As stipulated in Ref. [42], the external surface heat transfer coefficient αe was set at 23.0 W/(m2·K) for exterior walls and roofs in direct contact with outdoor air, and 20.0 W/(m2·K) for regions located above 3000 m in elevation. The solar radiation absorption coefficient ρs for building envelopes was specified as 0.7 [43]. The directional Tsa values were defined as follows: Tsar (roof), Tsas (south wall), Tsae (east wall), Tsaw (west wall), and Tsan (north wall). Given that the location of heated rooms can affect the orientation of the east and west walls, the parameter ΔTsa was introduced to quantify the variation in the outdoor heat transfer boundary conditions between the east- and west-facing walls across different climatic regions. This method is described by Equation (2).
T s a = T s a w T s a e
where ΔTsa represents the difference in the solar-air temperature between the east- and west-facing walls, °C. Based on Equations (1) and (2), as well as the meteorological data for the coldest month (January) obtained from the Chinese Standard Weather Data (CSWD) database, calculations were conducted to determine Tsa and ΔTsa for different orientations, along with Te and direct normal irradiance (Idn, W/m2) for each city. Detailed results are presented in Table 3.

3.5. Thermal Balance Analysis

3.5.1. Basic Assumption

(1)
The heating room was controlled by an ideal start-stop heat source. T s e t is the heating set-temperature (°C). When the room temperature exceeded the set-temperature, the heat source power could achieve q = 0 within the time step. Non-heated rooms had no active heat sources.
(2)
Each room was regarded as a single air node. The heat transfer of the envelope structure was calculated based on one-dimensional unsteady state. The change in the exterior wall U value was mainly achieved by altering the thickness of the insulation layer, ignoring the difference in heat capacity between different walls.
(3)
In rural houses, non-heated rooms are used infrequently, without personnel occupation or internal heat gain, while heated rooms in winter are occupied all day. In addition, the sensitivity test showed that the impact of an internal heat gain variation of ±50 W on ESR was less than 1%. Therefore, to simplify the analysis and avoid generating additional noise, the internal disturbance of personnel was simplified to a time-by-hour function, and other internal heat gains were turned off.

3.5.2. Heat Balance Equation

The control logic for the heat source system in the heated room is as follows:
q s y s ( n ) = { q m a x if   T H ( n ) < T s e t 0 if   T H ( n ) T s e t
q s y s ( n ) is heat source power at time n, W; q m a x is maximum available heat source power, W; T H ( n ) is air temperature of heating room at time n.
The heat exchange process between the indoor and outdoor environments of solar houses in rural areas of Northwest China can be described by the following formula:
(1)
Thermal balance equation of the outer surface of the non-transparent envelope at any time:
q S + q R + q B + q g = q o + q r a + q c a
q S is solar radiation heat absorbed by the outer surface of the envelope, W/m2; q R is ground-reflected radiation heat absorbed by the outer surface of the envelope, W/m2; q B is intensity of atmospheric long-wave radiation, W/m2; q g is ground heat radiation heat absorbed by the outer surface of the envelope, W/m2; q o is heat transfer from the outer surface of the envelope to the inner side of the wall, W/m2; q r a is radiative heat exchange between the outer surface of the envelope and the surrounding environment, W/m2; q c a is convective heat transfer between the outer surface of the envelope and the surrounding air, W/m2.
(2)
Thermal balance equation of the inner surface of the non-transparent envelope:
q i ( n ) + α i c [ T H / N ( n ) T i ( n ) ] + k = 1 N i C b ε i k φ i k [ ( T k ( n ) 100 ) 4 ( T i ( n ) 100 ) 4 ] + q r , i ( n ) = 0
T H / N ( n ) is indoor air temperature of heated/non-heated room, °C; T i ( n ) / T k ( n ) is inner surface temperature of the ith and kth envelope, respectively, °C; α i c is the convective heat transfer coefficient of the inner surface of the ith envelope, W/m2·°C; C b is blackbody radiation constant; ε i k is the system emissivity coefficient between the ith and kth inner surfaces of the envelope; φ i k is the radiation angle coefficient of the inner surface i to inner surface k of the envelope; N i is the total number of inner surfaces of different envelopes in the room; q i ( n ) is the heat transfer obtained by the inner surface of the ith envelope, W/m2; q r , i ( n ) is solar radiation and internal radiation heat obtained from the inner surface of envelope i, W/m2.
(3)
The transparent envelope has a relatively high heat transfer coefficient but poor thermal inertia, and can be regarded as steady-state heat transfer. Its thermal balance equation is:
q g , w = U w T e T H / N + S H G C · I + q i n f , w
q g , w is heat gain of transparent envelope, W/m2; U w is overall heat transfer coefficient of transparent envelope, W/m2·°C; S H G C is solar heat gain coefficient; I is solar irradiance, W/m2; q i n f , w is heat transfer due to air infiltration through windows, W/m2.
(4)
Thermal balance equation for indoor air in the heated room:
V H · ρ C P a · T H n T H n 1 τ = i A i , H · q c , i n + q s y s n + q G n + q inf n
(5)
Thermal balance equation for indoor air in the non-heated room:
V N · ρ C P a · T N n T N n 1 τ = k A k , N · q c , k n + q i n f ( n )
V H / N is heated/non-heated room volume, m3; ρ C P a is specific heat capacity of indoor air per unit volume, KJ/m3·°C; A i , H / A k , N is the area of the ith envelope of the heated room and the area of the kth envelope of the non-heated room, m2; q c , i n / q c , k n is the convective heat transfer from the inner surface of the ith envelope of the heated room and the kth envelope of the non-heated room to the air, W/m2; q G n is internal heat gain, W/m2; q inf n is air infiltration heat transfer, W/m2.

3.5.3. The Impact of Non-Heated Room on Thermal Balance Calculations

Based on the Equations (3)–(8), the T N impacts the overall thermal balance of residential buildings through several key pathways:
Firstly, T N directly affects the convective heat transfer q c , k between the inner surface of the non-heated room and the air. This process causes heat to be transferred from the heated room to the non-heated room through the interior wall, thereby reducing the thermal efficiency of the heated room.
Secondly, the temperature difference between T N and T e drives heat dissipation through the exterior walls, which makes the non-heated room act as a buffer zone between the heated room and the outdoor environment.
Clearly, non-heated rooms play a crucial role in the thermal balance calculations for residences with zoned heating. They dynamically influence the heating load by altering heat conduction with heated rooms and heat exchange with the outdoor environment through the envelope.

3.6. Model Verification

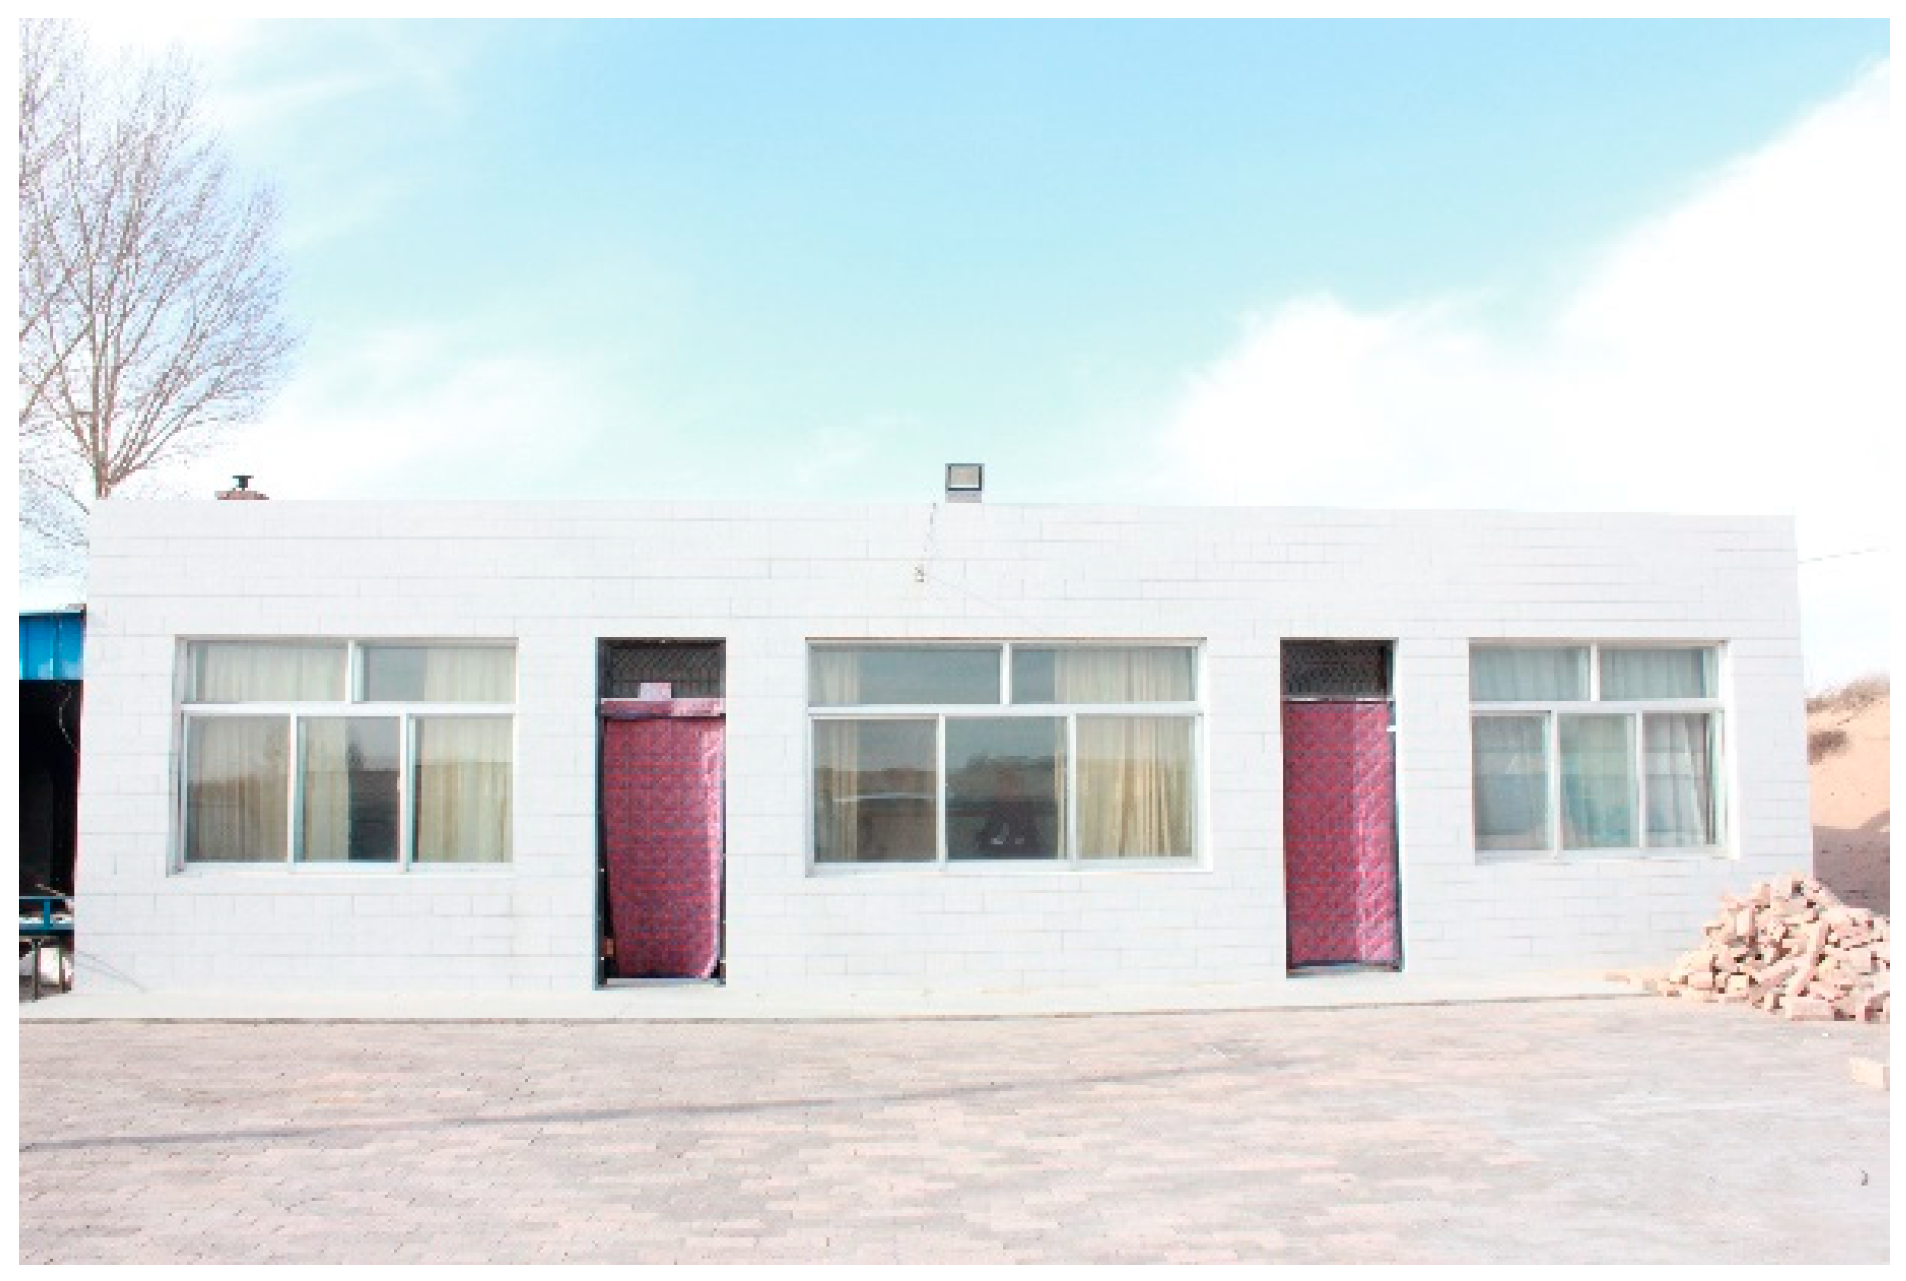
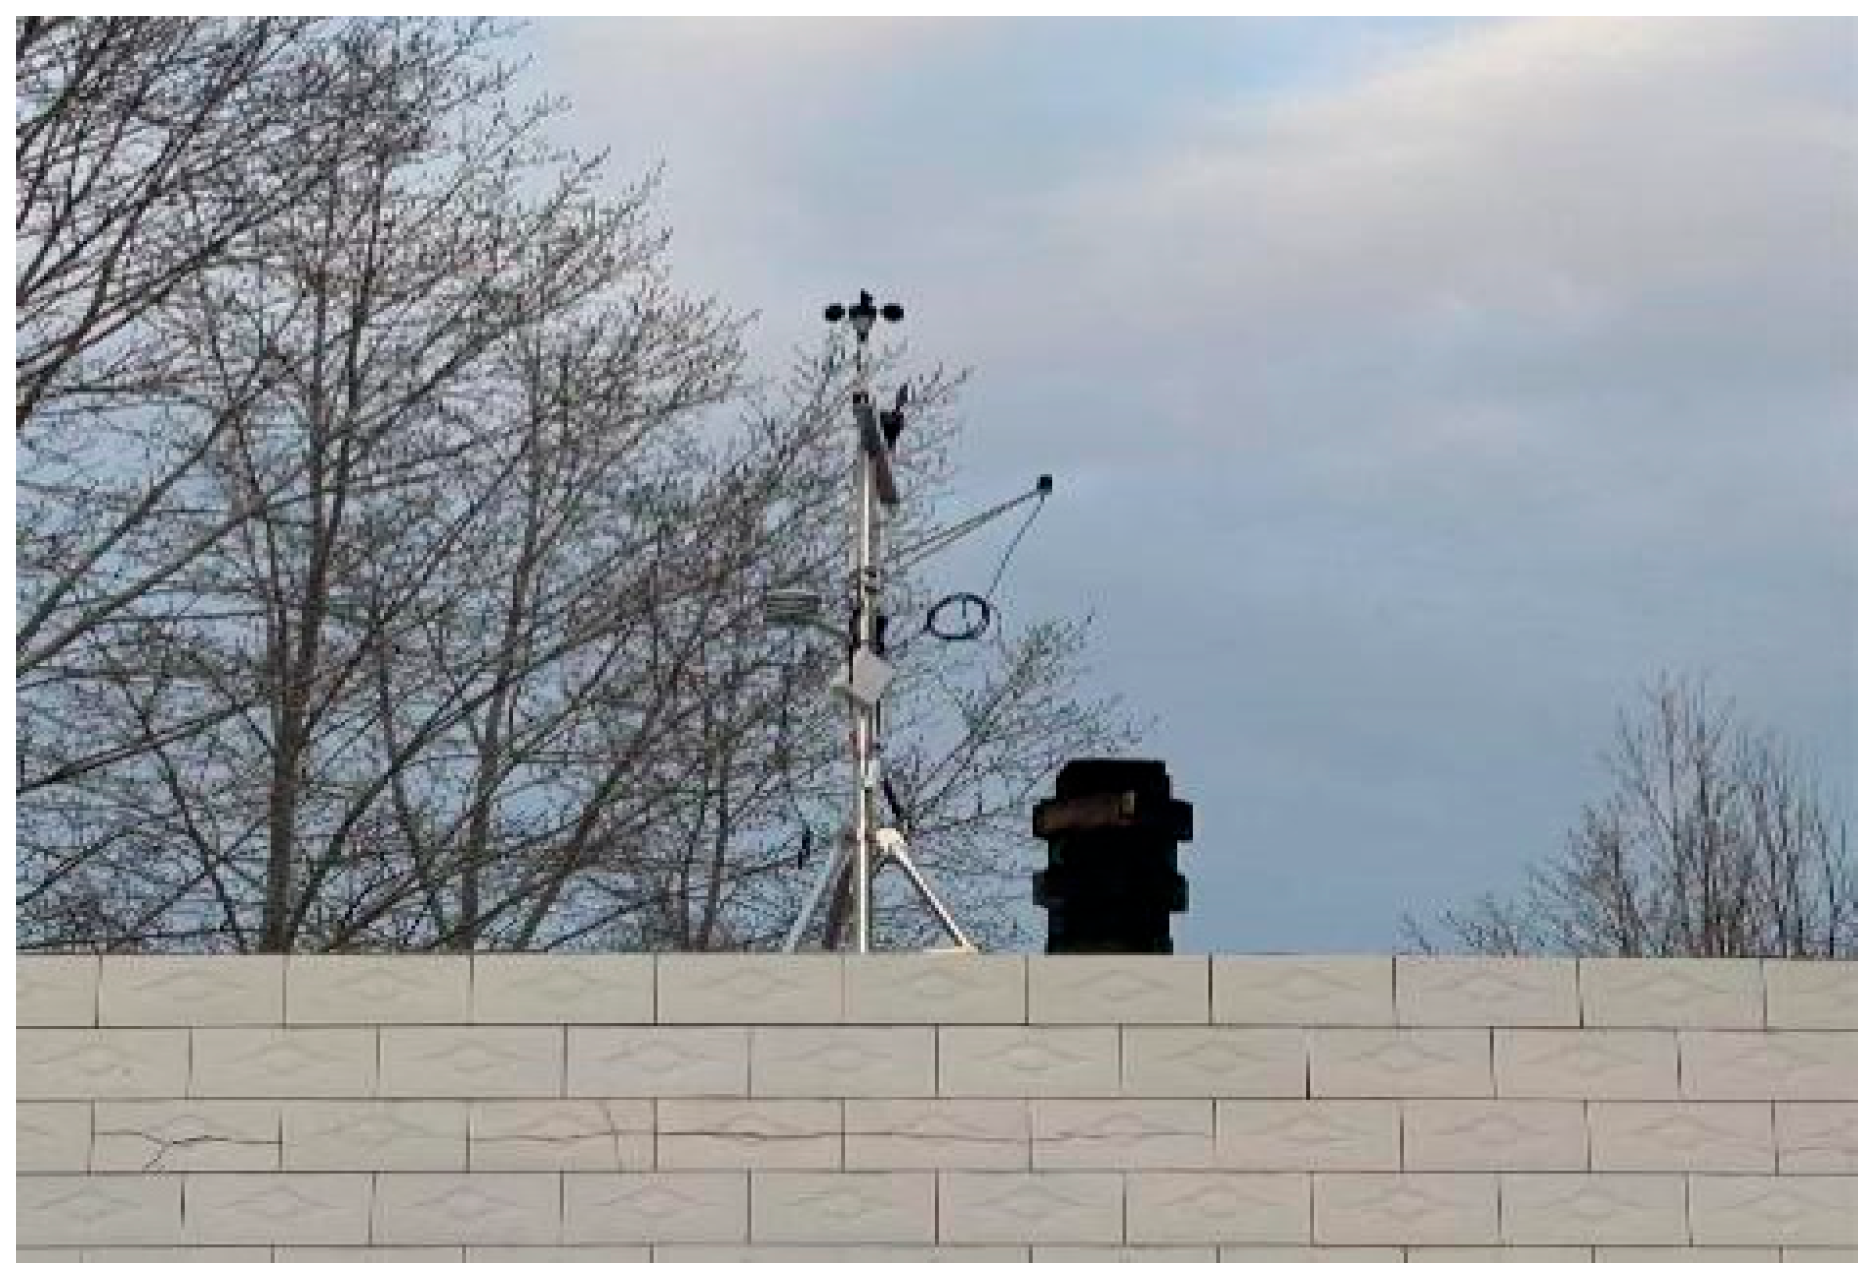
In this study, the reliability of the numerical model was validated using measured data. A simulation model consistent with layout a and featuring a building size of 13.1 m × 9 m with a floor height of 3.3 m was established using DesignBuilder 7.0.2 (DB) software for validation purposes. The size and building materials of the constructed model were identical to those of a rural residential building measured by researchers in Yulin, China, during the winter of 2024 (Figure 5). The thermal performance parameters of the envelope structure were set according to T1. Considering the discrepancies between the measured meteorological data and the CSWD data, the measured data collected locally on 22 December 2024, were adopted in this study (Figure 6).
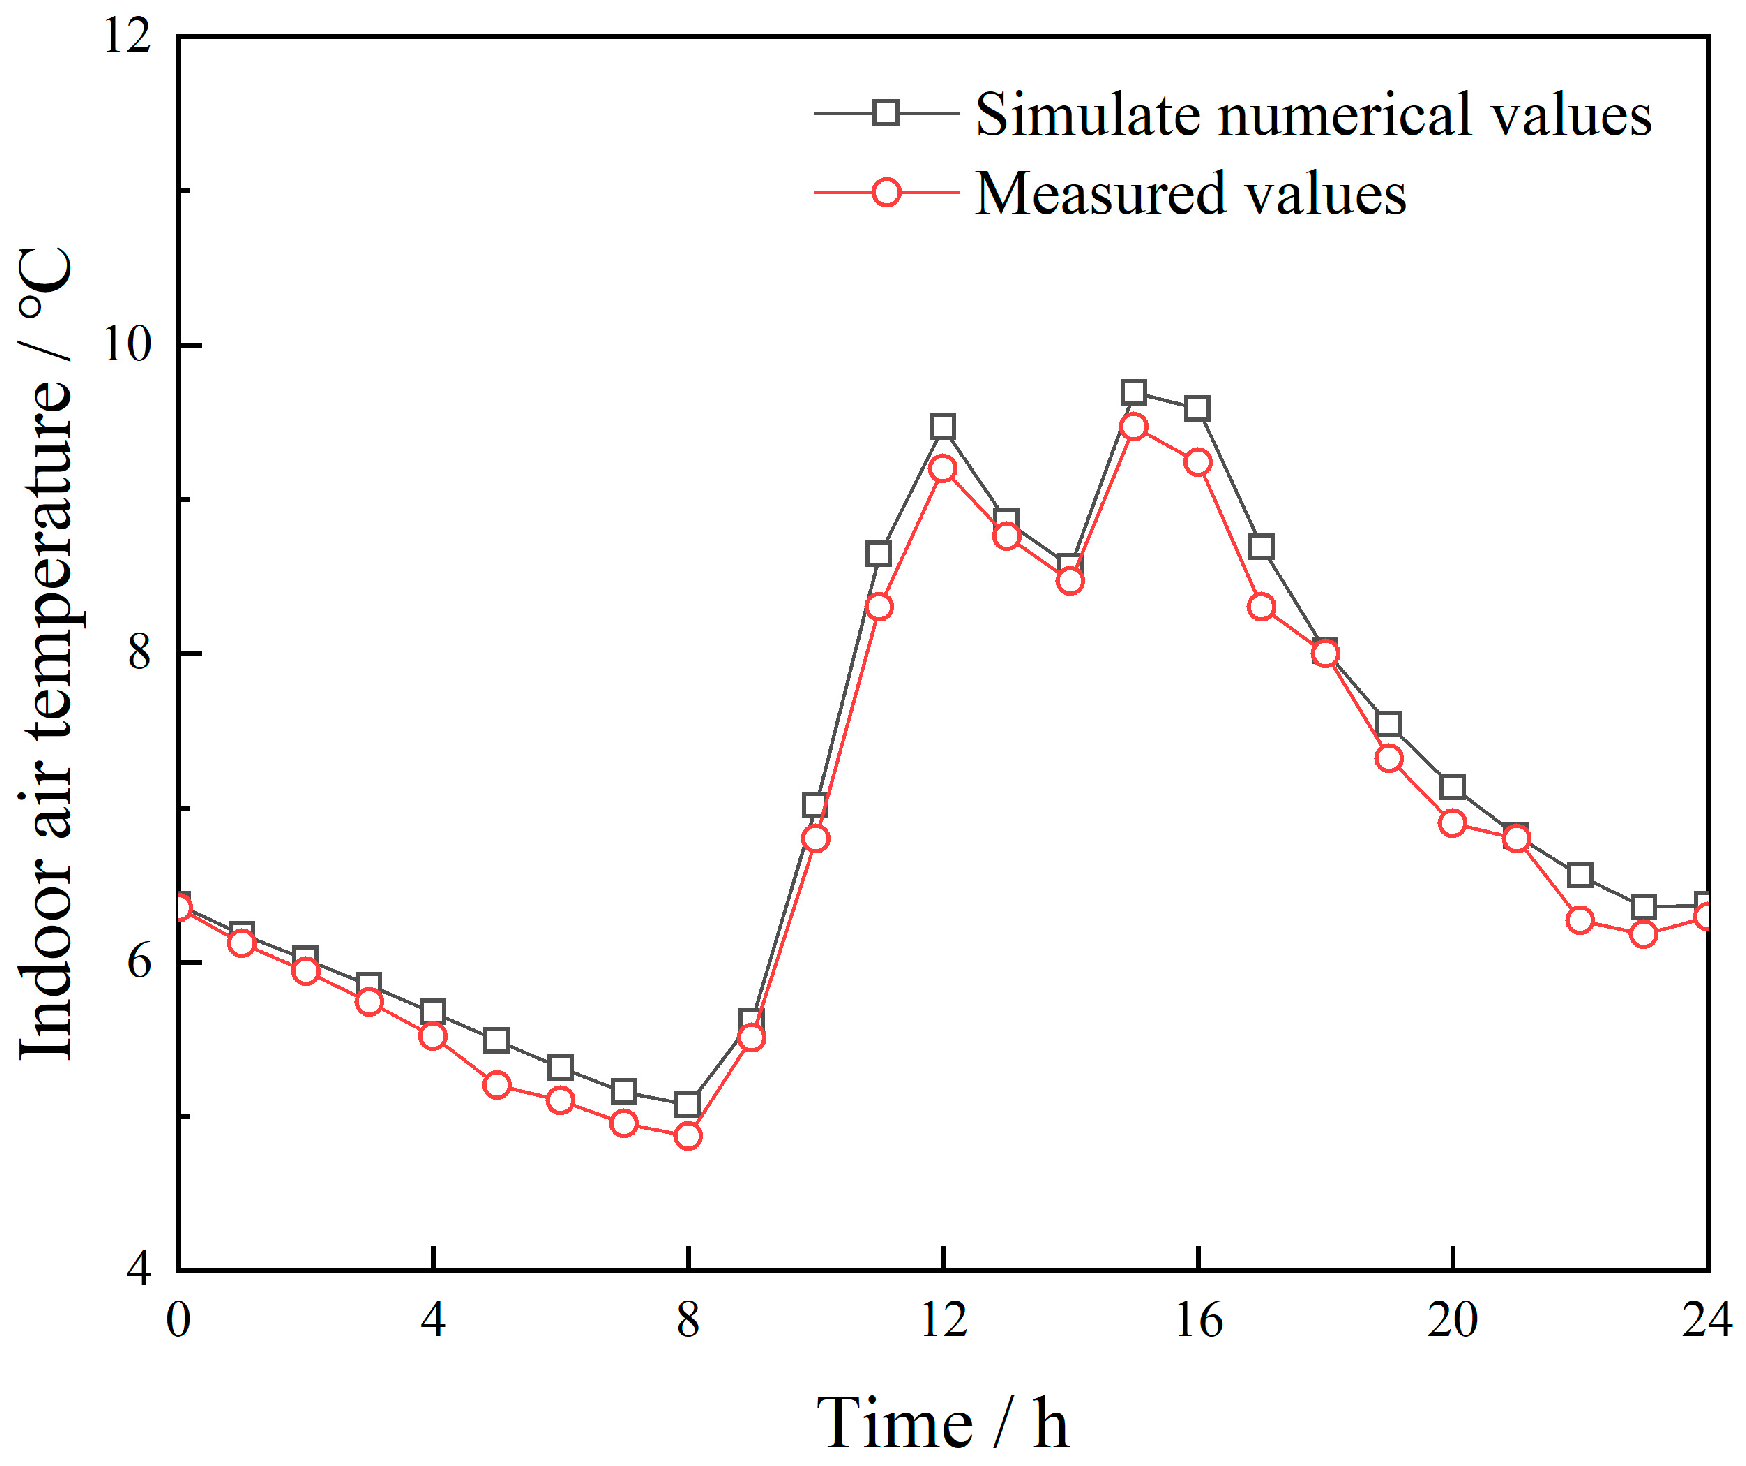
The simulated results were compared with measured data (Figure 7). The simulated indoor air temperature was slightly higher than the measured values, but it exhibited a consistent overall trend, with a maximum percentage deviation of approximately 5.58%. Two potential factors may explain this discrepancy. First, the measured building, constructed more than 15 years ago, could have lower airtightness than the numerical model. Second, the measured data may contain inherent errors. Overall, the minimal difference between the simulation and experimental results indicated that the numerical model was reasonably reliable.

3.7. Simulation and Data Analysis

3.7.1. Simulation Parameters

The simulation was conducted using DesignBuilder 7.0.2 (BD), which integrated EnergyPlus developed by the U.S. Department of Energy as its computational core [44]. This platform has been widely used to analyze energy consumption and environmental performance across various building types [45,46]. Based on the CSWD data, the heating energy consumption of buildings with different layouts was simulated. Given the real-world operating conditions of rural houses, two heating schemes were established for the simulations: (1) heating a single room and (2) heating multiple rooms simultaneously. In rural residences, zoned heating is common. Only a few rooms are equipped with heating systems, and whether to use them depends on specific needs. In this study, the heated room had a heating system to maintain the indoor temperature, thus meeting the thermal comfort requirements of the occupants, and the non-heated room did not.
To isolate the effect of room location changes on ITC, lighting, hot water, and other equipment were disabled in the simulation. Internal heat gains from equipment operation were also excluded. When heating a single room, L, MB, and K were sequentially used as the heated rooms to form three distinct samples. Because rural houses typically lack time-controlled heating systems, continuous heating was adopted. The indoor heating temperature was uniformly set at 16 °C [47,48], with a ventilation rate of 0.5 h−1. Assuming 2–3 permanent residents per household, the occupant density was set at 0.02 persons per m−2. As the windows and doors of rural houses in Northwest China could be generally kept closed during winter, the average indoor clothing insulation level was set at 1.0 clo [49]. The heating equipment was modeled as coal-fired boilers and radiators with a coefficient of performance (COP) of 0.85.

3.7.2. Evaluation Index of Energy Saving

The relative energy saving rate (RES, %) is the percentage reduction in energy use relative to a baseline scenario and is commonly applied in building performance optimization studies [50,51]. In this study, RES was used to quantify the ESR by comparing the energy consumption when heating a single room under different location change scenarios. Three room location adjustments were considered: moving the heated room from the west side to the center (WM), from the east side to the center (EM), and from the west side to the east side (WE). The spatial layouts and corresponding heating room adjustments for each scheme are listed in Table 4.
By comparing the RES of L, MB, and K under different room location changes across various meteorological and design parameters, the influence of these factors on ESR was assessed. The RES was calculated using Equation (9):
R E S i = Q b Q a / Q b
where i denotes the room location change scheme (WM, EM, and WE), and Qb and Qa represent the building’s heating energy consumption in the coldest month before and after room location adjustment, respectively. A positive RES value indicates that the adjusted layout is more energy-efficient, whereas a negative RES value implies a more efficient original layout.
To evaluate the ESR of multiple-room heating scenarios, the “Max Difference” (MD, %) was adopted. It represented the maximum variation in the heating energy demand across different room location layouts and was computed by dividing the difference between the highest and lowest demands by the highest value. The MD calculation is provided in Equation (10):
M D = Q m a x Q m i n / Q m a x
where Qmax and Qmin denote the maximum and minimum heating energy consumption values in the coldest month across the six layout schemes, respectively.

3.8. Data Processing and Analysis

Pearson correlation analysis was employed to examine the relationships between major meteorological and design parameters across different regions and the RES values of L, MB, and K when heated individually, as well as the MD data. In addition, Random Forest (RF) analysis was used to evaluate the contribution of each factor to RES and MD. Correlation analysis was conducted using SPSS 26.0, while RF analysis was performed using the RF package in R 4.5.

4. Results and Discussion

4.1. Relative Energy Saving Rates

Since the number of energy consumption data for multi-room and single-room heating was up to 1152, some of the data were selected for clearer presentation, as shown in Figure 8. The energy consumption results were lower than the statistical data in [28] and the measured data in [52]. This is mainly because the thermal performance of the building model envelope in this study was better than that in the existing studies. The envelope structures were determined in accordance with the specifications [31,32] except for the U value of the exterior wall, and the precise energy system control and stronger sealing performance led to the simulation results being slightly lower than those of actual residences. Moreover, considering that an envelope with excellent thermal performance helps to reduce building energy consumption and weaken the impact of other energy-saving measures on energy consumption [53], the simulation results actually increased the applicability redundancy of the analysis conclusion in this study.
Based on the heating energy consumption data of L, MB, and K when heated individually, the RES trends of these rooms remained consistent under varying design parameters. To avoid redundancy, only the data for the L room were analyzed in this section. Under different meteorological and design parameter values, the RES of the L room under location change scenarios (RESWM, RESEM, and RESWE) ranged from −7.89% to −13.2%, −7.82% to −10.25%, and −2.29% to −3.36%, respectively.
RESWM and RESEM represent the ESR of the L room during WM and EM location changes, respectively. These changes effectively transformed the east and west exterior walls of the L room into interior partition walls. Given the fixed U-value of interior partitions, the indoor thermal balance equation for the heated room showed that RESWM and RESEM were strongly influenced by the U-values of the exterior walls and the temperature (Ta, °C) of adjacent unheated rooms. When the L room was centrally located, a higher Ta in surrounding non-heated rooms contributed to increased ESR for WM and EM, while a lower Ta had the opposite effect. RESWE represents the ESR of the L room when the location was changed from the west side to the east side, meaning that the west-facing exterior wall was reoriented to face east. Under unchanged design parameters, RESWE was closely linked to △Tsa. A larger |△Tsa| value indicates a higher ESR for WE. These findings are consistent with the results of Sang [27], who reported that under identical increases in thermal resistance, the daily average heat loss per unit area of exterior walls varied with orientation, as observed in Lhasa, Yinchuan, and Xi’an.
The simulation results under typical design parameter settings indicated that the |RESWM| and |RESEM| values for the L room were consistently higher than those of RESWE across all study areas. This implies that the ESR of WM and EM was greater than that of WE. This is because, under specific environmental and heating conditions, the impact of changes in the envelope area and heat transfer coefficient of the heated room was more significant for BEP than the changes in outdoor boundary conditions for a single exterior wall.

4.1.1. Relative Energy Saving Rates of Different Exterior Wall U Values

The RES of different exterior wall U-values is illustrated in Figure 9. Under varying U-values, the RESWM and RESEM for each city followed the trend T3 < T2 < T1, indicating that the smaller exterior wall U-values were associated with lower ESR for WM and EM. In some cases, no energy savings were observed. A similar trend was observed for |RESWE|, where T3 < T2 < T1, suggesting that the smaller the U-value of the exterior wall, the smaller the ESR for WE. These results confirmed that the exterior wall U-values had a significant impact on ESR.
The differences in RESWM and RESEM under different U-values were mainly attributed to the following mechanisms. When the exterior wall U-value (1.55 W/(m2·K)) approached that of interior partitions (1.75 W/(m2·K)) (T1), the Ta of adjacent non-heated rooms remained higher, which enhanced the ESR of WM and EM. Conversely, when the U-value of the exterior wall was significantly lower than that of the interior partition wall (e.g., 0.5 or 0.25 W/(m2·K), T2 and T3), the heat loss from the heated room through the envelope was substantially reduced. In such cases, especially in regions with higher Ta in non-heated rooms (e.g., Lhasa), WM and EM can still yield energy savings. However, in colder regions with lower Ta in non-heated rooms, the ESR of WM and EM was reduced or even negative.
The variation in RESWE under different U-values was also related to the heat transfer behavior. As the exterior wall U-value decreased, the heat loss from the heated room to the exterior decreased accordingly, resulting in a reduction in ESR for WE.
Based on Figure 9, the following conclusions can be drawn. Under different climatic conditions, the variation in U-values showed no significant effect on the ESR of WM and EM. In general, the smaller the U-value, the lower the ESR of WM and EM. This is because the impact of the U value on the heat loss of the exterior wall was greater than the variations in climatic conditions in this study. Consequently, the variation in the exterior wall U-values had a greater influence on BEP.
In high-temperature regions, smaller U-values were associated with lower ESR for WE. For example, in Lhasa, |RESWE| was 4.6% in T1 and 2.2% in T3. This was because the heating energy demand was already low, making the ESR of WE relatively more noticeable. However, as the U-value decreased, the absolute energy savings from WE also decreased, while the overall heating consumption remained nearly unchanged.
In low-temperature regions, changes in the U-value had little effect on the ESR of WE. For example, in Tuotuohe and Altay, |RESWE| was nearly zero regardless of the U-value. This was because the energy savings resulting from △Tsa were negligible compared with the relatively large heating demand in these cold regions.

4.1.2. Relative Energy Saving Rates of Different BO

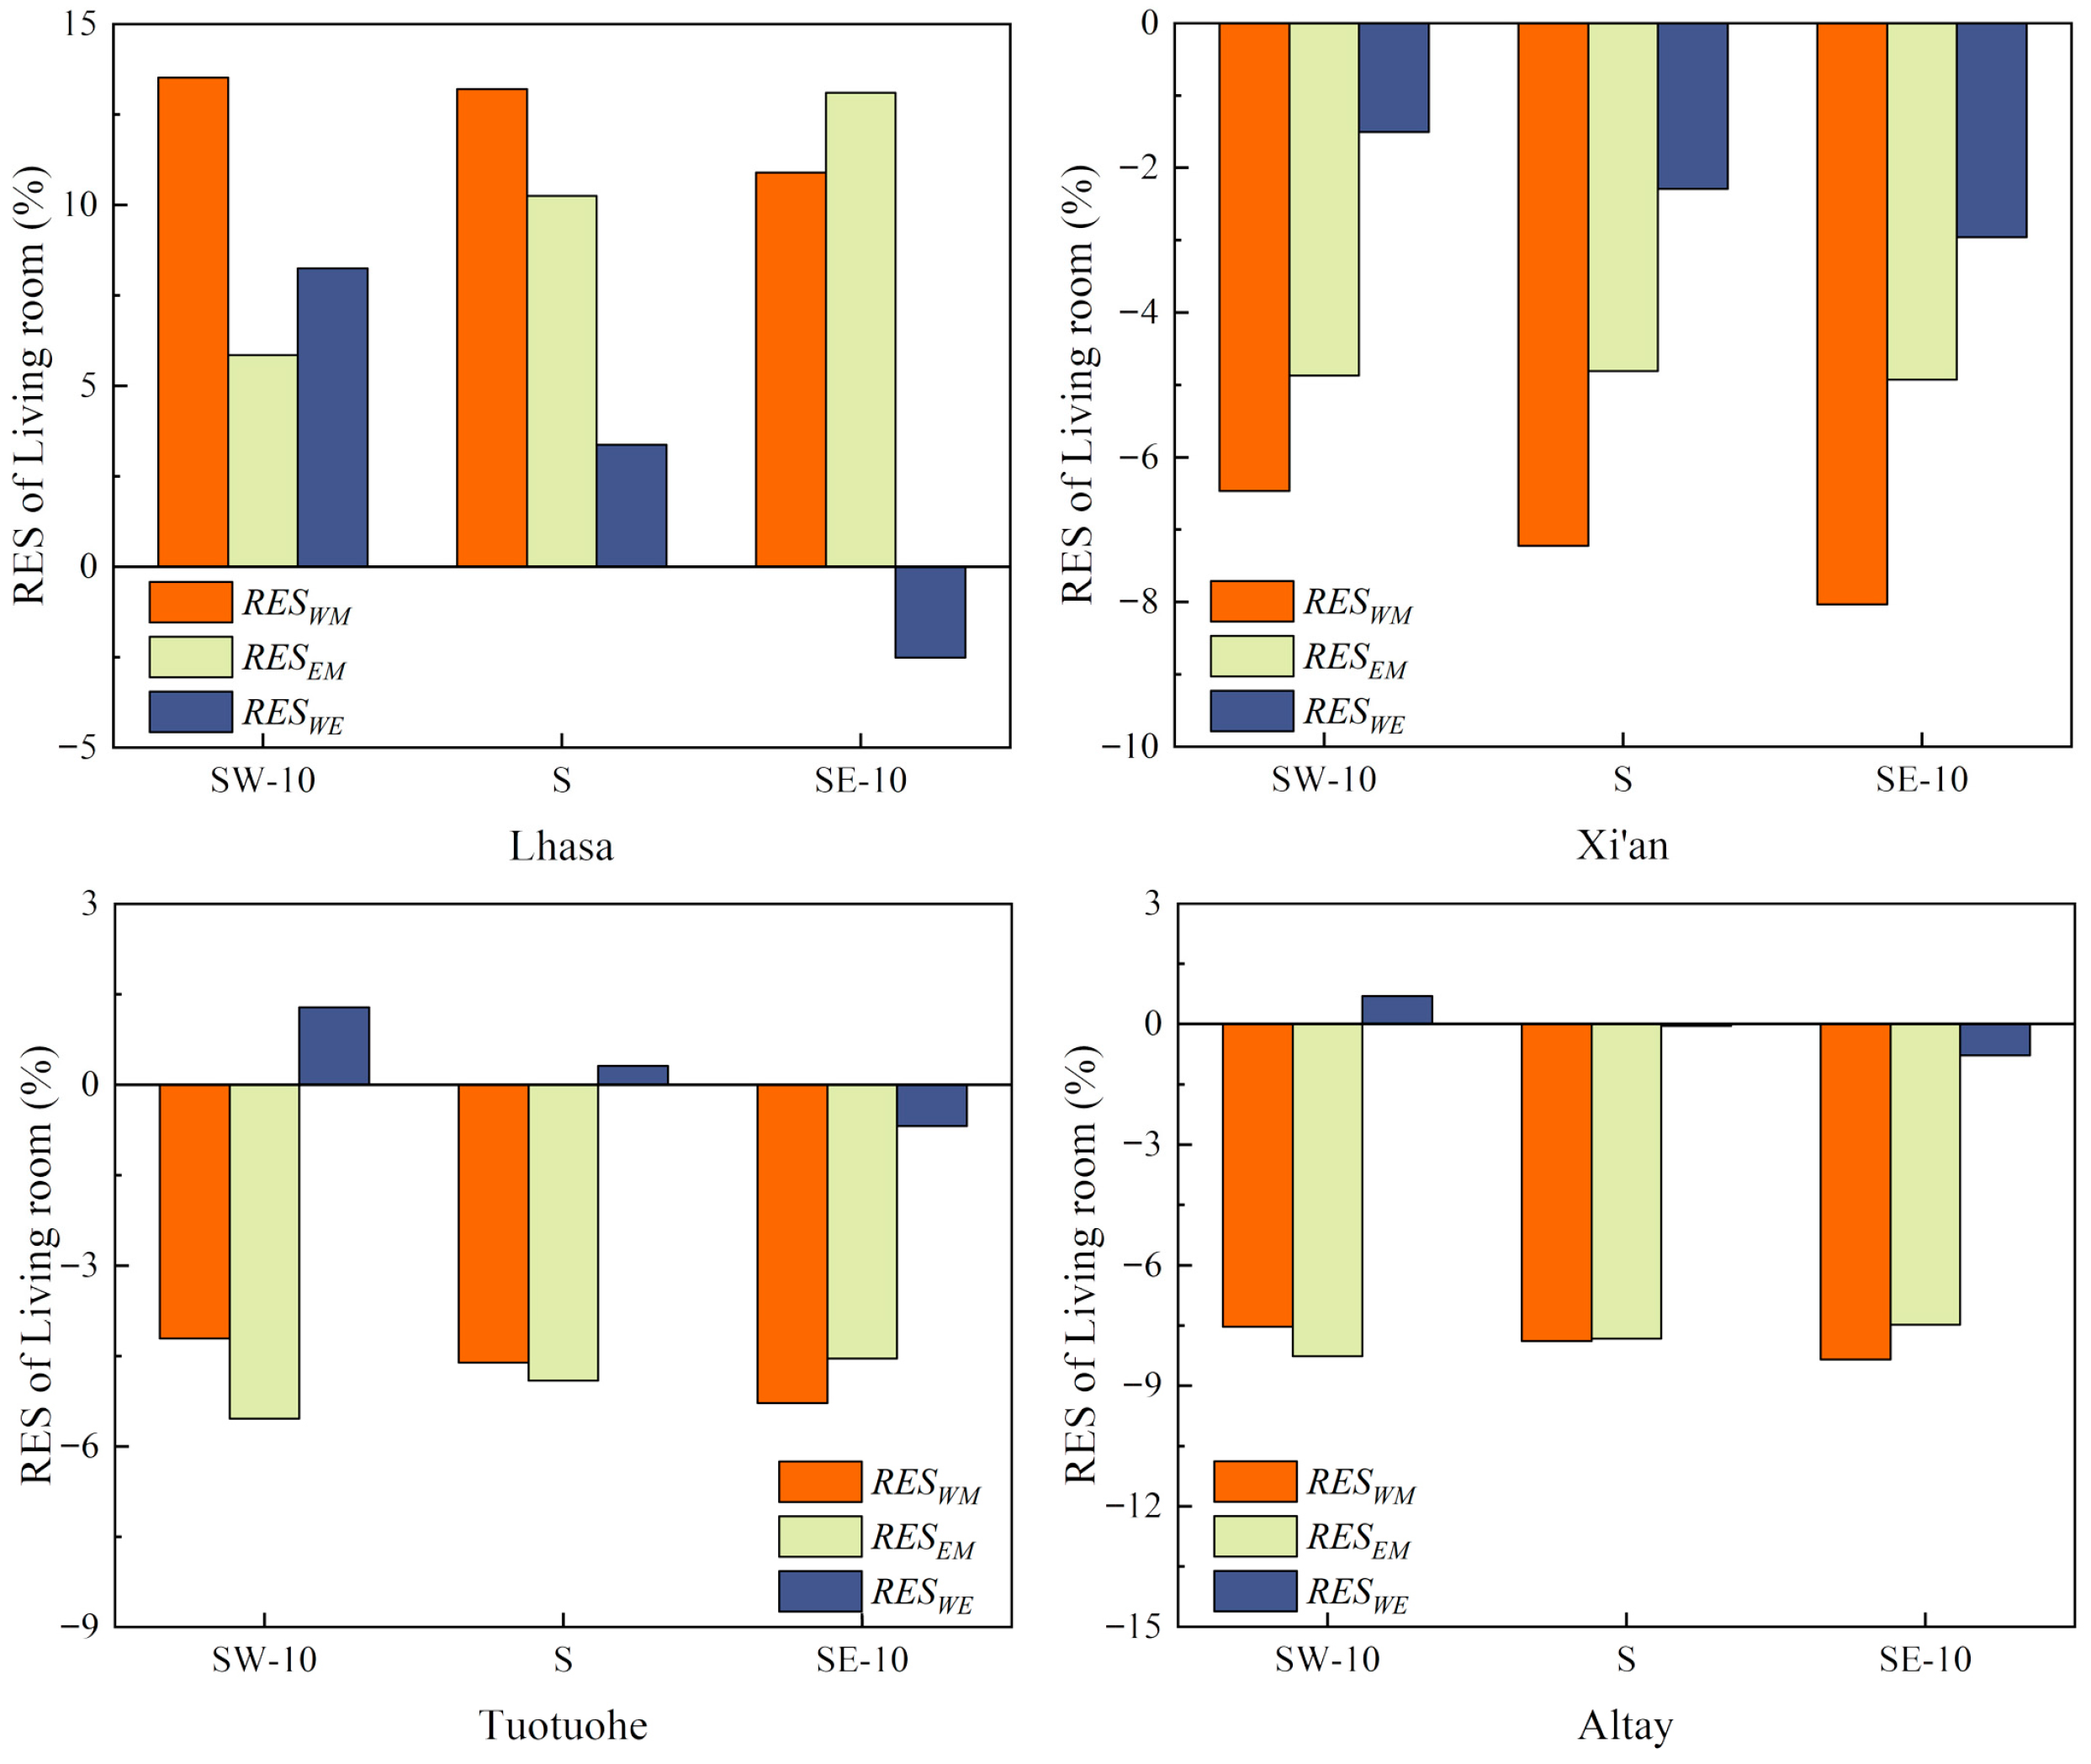
The RES values under different BOs are shown in Figure 10. In Lhasa, RESWM and RESEM were both positive across BO settings, following the order SE-10 < S < SW-10 for RESWM and SW-10 < S < SE-10 for RESEM. RESWE was positive for S and SW-10 orientations and negative for SE-10, with the size relationship SE-10 < S < SW-10. In Xi’an, all RES values across BO settings were negative. The size relationships for RESWM and RESEM were SE-10 < S < SW-10, and RESEM demonstrated no significant variation under different BO conditions. In Tuotuohe, RESWM and RESEM were all negative, with the same size relationship as observed in Lhasa. RESWE was positive under S and SW-10 orientations but negative under SE-10, with the order SE-10 < S < SW-10. In Altay, RESWM and RESEM were consistently negative under all BOs, following Lhasa’s size relationship. RESWE was positive under SW-10 but negative under S and SE-10 orientations, again following the trend SE-10 < S < SW-10.
The results indicated that BO significantly affected ESR. The influence of BO on RESWM and RESEM was primarily due to the changes in △Tsa of the heating room. For instance, when BO shifted from south to southwest by 10° (SW-10), the west-facing wall rotated northwest and the east-facing wall rotated southeast. This shift decreased Tsaw but increased Tsae. When WM and EM yielded positive energy savings (i.e., RESWM and RESEM > 0), the SW-10 orientation reduced Tsaw, thereby increasing the ESR of WM. However, it also increased Tsae, reducing the ESR of EM. Conversely, if WM and EM yielded a negative RES, the same shift had the opposite effect. Regarding RESWE, its variation under different BOs correlated closely with |△Tsa|. Specifically, |RESWE| increased with greater |△Tsa| induced by BO changes and decreased otherwise.
Based on Figure 10, in high-radiation regions (where |△Tsa| is relatively large), BO had a more pronounced effect on ESR. For example, in Lhasa, the maximum RESEM difference under varying BO was 7.25%, whereas that for RESWE was 10.75%. In Altay, the respective differences were 0.78% and 1.47%. This was attributed to the greater influence of BO on |△Tsa| when the orientation was S. In such cases, |△Tsa| varied more substantially when BO shifted to SW-10 or SE-10. Therefore, the greater the value of |△Tsa| when BO was set to S, the more pronounced the variation in |ΔTₛₐ| upon the BO change, and thus the greater the resulting difference in the heat loss through the exterior walls.

4.1.3. Relative Energy Saving Rates of Different WWR

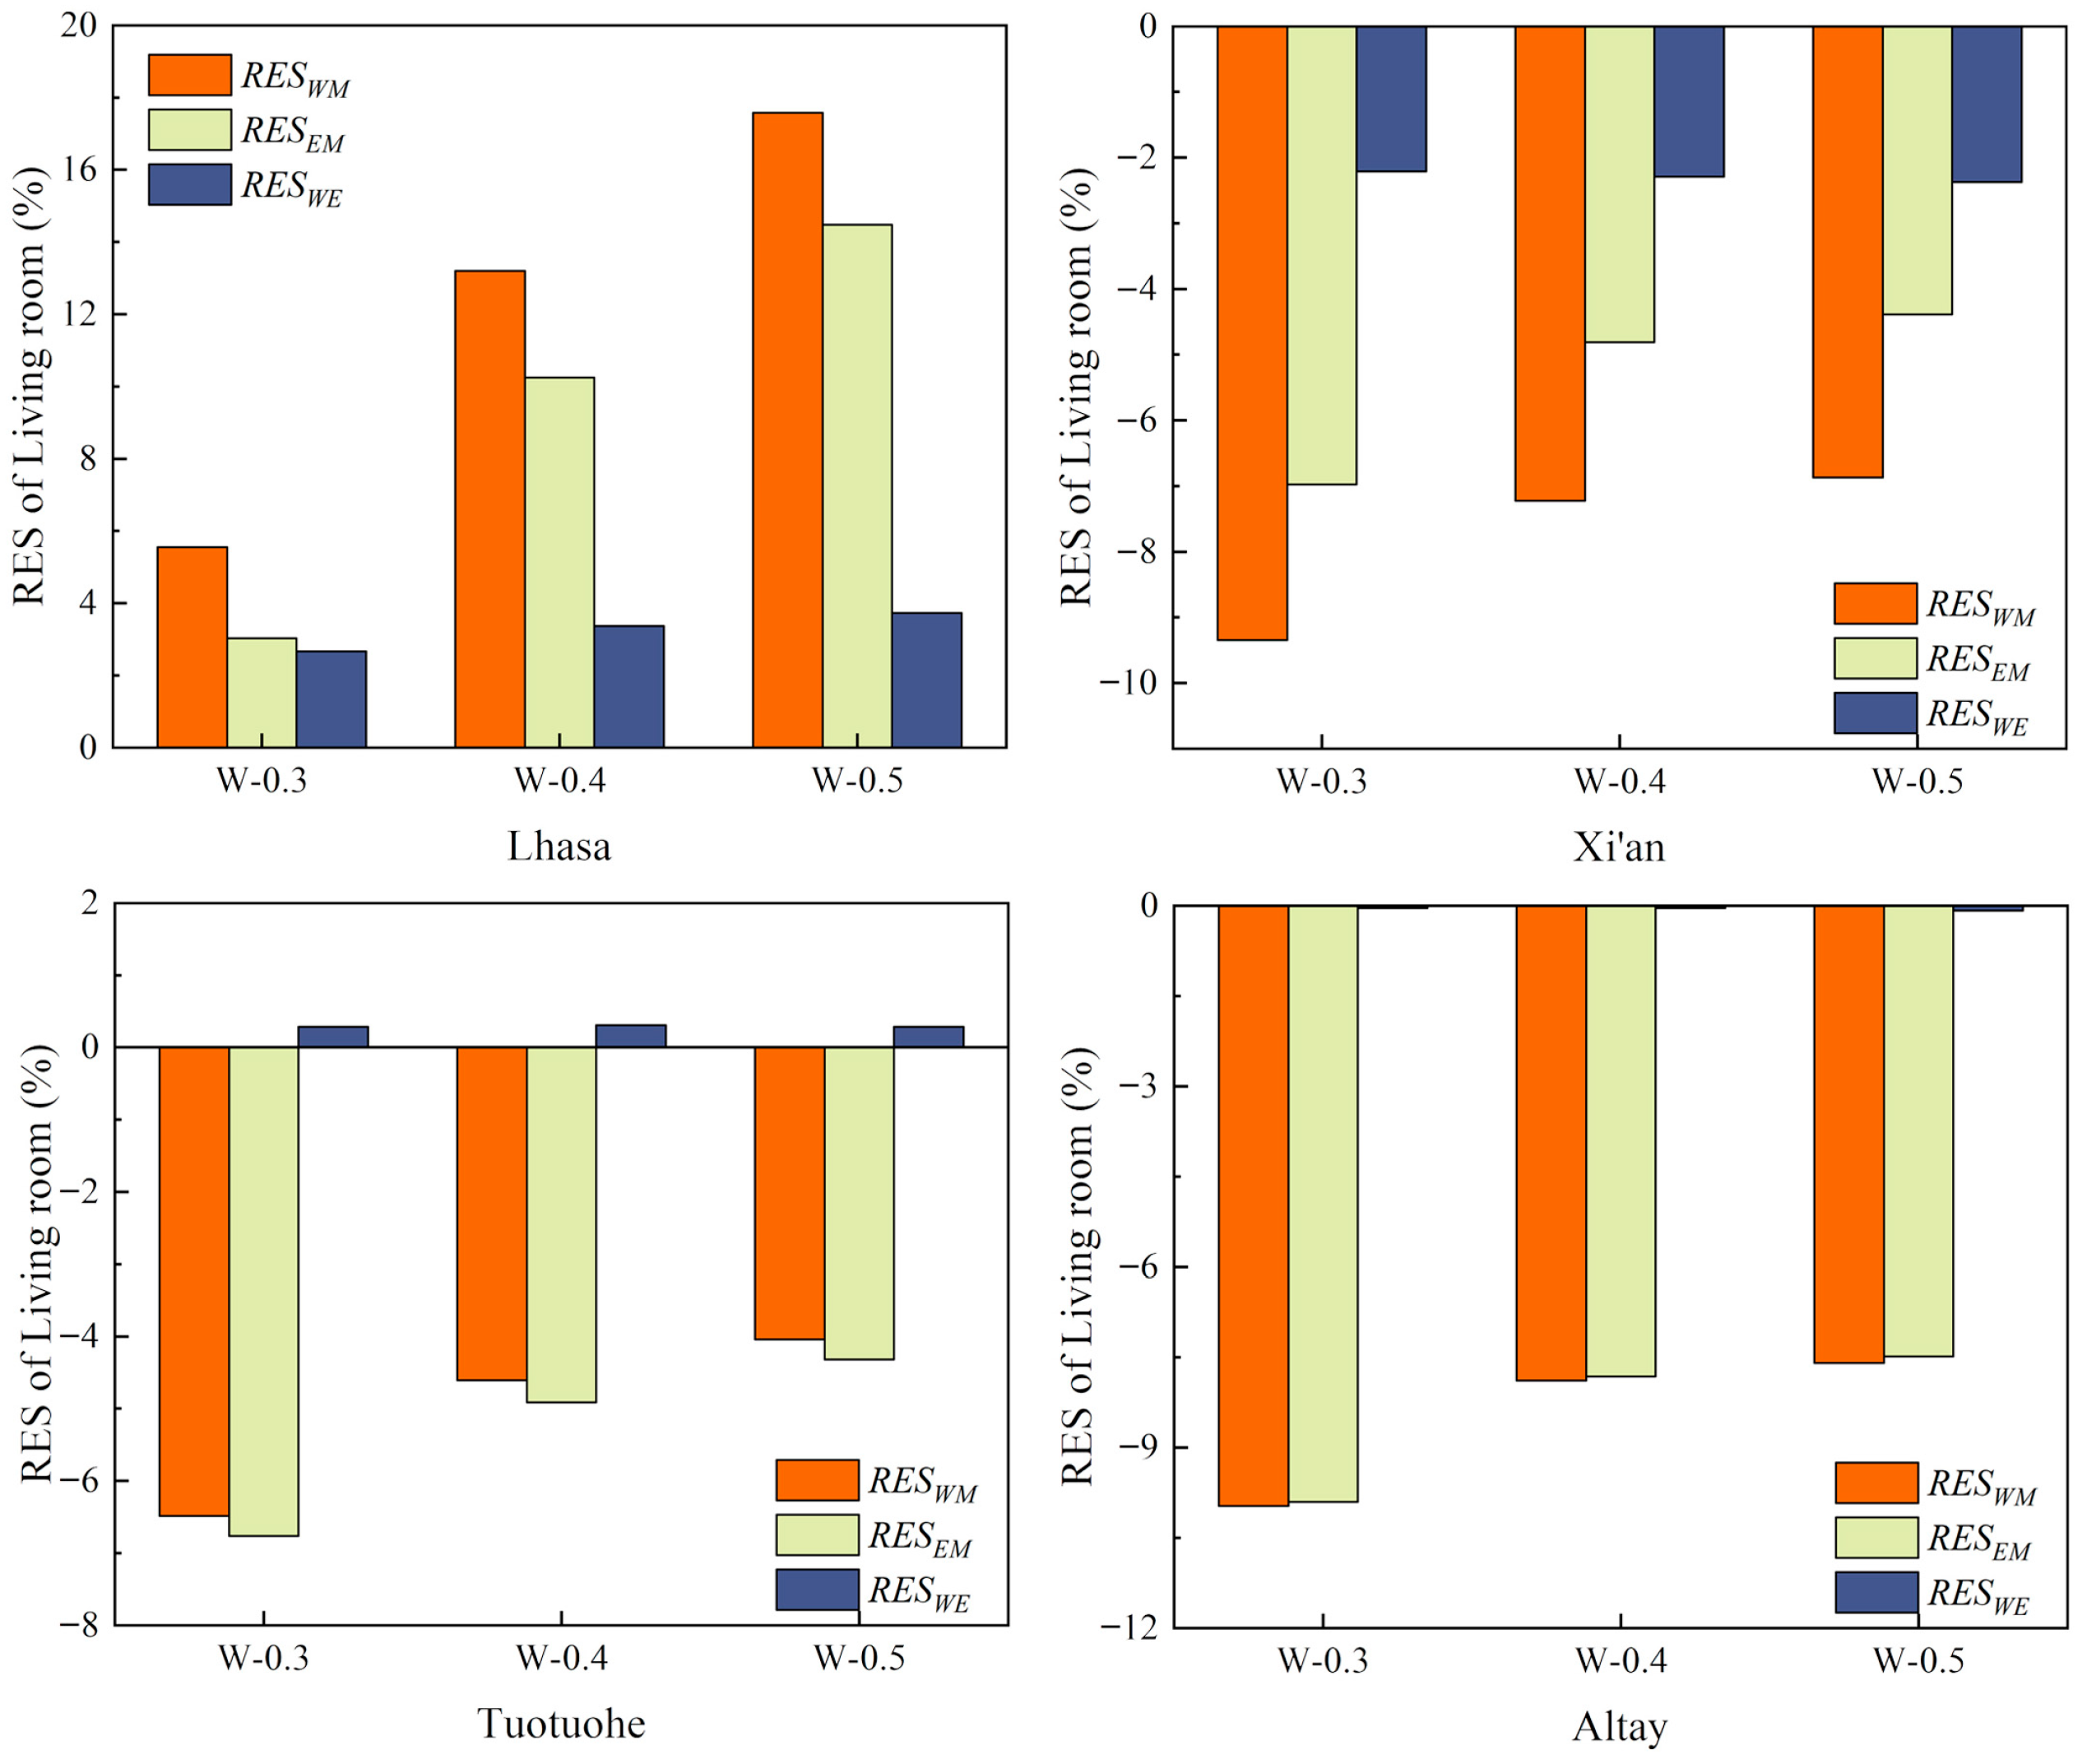
The RES values under different WWR are shown in Figure 11. In Lhasa, all RES values were positive, following the order of W-0.3 < W-0.4 < W-0.5. This indicated that a smaller WWR corresponded to a lower ESR. In contrast, in Xi’an, Tuotuohe, and Altay, RESWM and RESEM under different WWR values were all negative, with the same order of W-0.3 < W-0.4 < W-0.5, suggesting that neither WM nor EM yielded energy savings under any WWR setting, and energy efficiency declined as WWR increased. In addition, |RESWE| showed no significant variation under different WWR values.
These results indicate that WWR significantly affected ESR. The differences in RESWM and RESEM under different WWR conditions were primarily due to the fact that, under the typical values of other design parameters, WM and EM were not energy-efficient in Xi’an, Tuotuohe, and Altay. However, as WWR increased, solar radiation gains also increased, increasing the Ta in non-heated rooms. At the same time, the heat loss through interior partition walls of heated rooms was reduced, which decreased the extent to which WM and EM failed to be energy-efficient, referring to the decreases in |RESWM |and |RESEM|. This trend was not observed in Lhasa, where Ta in non-heated rooms was already relatively high, making WM and EM energy-efficient even under a smaller WWR. Under such conditions, increasing WWR further raised Ta in non-heated rooms, thereby enhancing the ESR of WM and EM. The differences in RESWE under different WWR values were attributed to the fact that increasing WWR only reduced the thermal load of heated rooms without affecting △Tsa. Consequently, while the energy savings of WE remained nearly constant, the reduced heating load led to an increase in |RESWE|.
Furthermore, based on Figure 11, the following conclusions can be drawn. (1) In regions with low solar radiation or low temperatures, the changes in WWR had minimal impact on the ESR of WM and EM. For instance, the maximum differences in RESWM and RESEM under different WWR conditions in Altay were 2.37% and 2.41%, respectively. In high-radiation, high-temperature areas such as Lhasa, the maximum difference in RESWM under different WWR values was 12.02%, and it was 11.45% for RESEM. This was because, under typical design conditions, smaller solar radiation intensity indicated that the additional solar radiation from increased WWR was insufficient to offset heat loss through interior partitions. Conversely, lower Te resulted in increased heating demand and heat loss through exterior windows while WWR increased. Both factors contributed to lower differences in heating energy consumption before and after room location changes. (2) The variation in WWR had no significant influence on the ESR of WE under different climatic conditions. For example, the maximum difference in RESWE under different WWR values was only 1.06% in Lhasa and 0.04% in Altay. This was because the increased solar gains due to the higher WWR were mainly used to offset heat losses in the heated area and had a limited impact on the heat loss differences between exterior walls due to the orientation change.

4.1.4. Relative Energy Saving Rates of Different BH

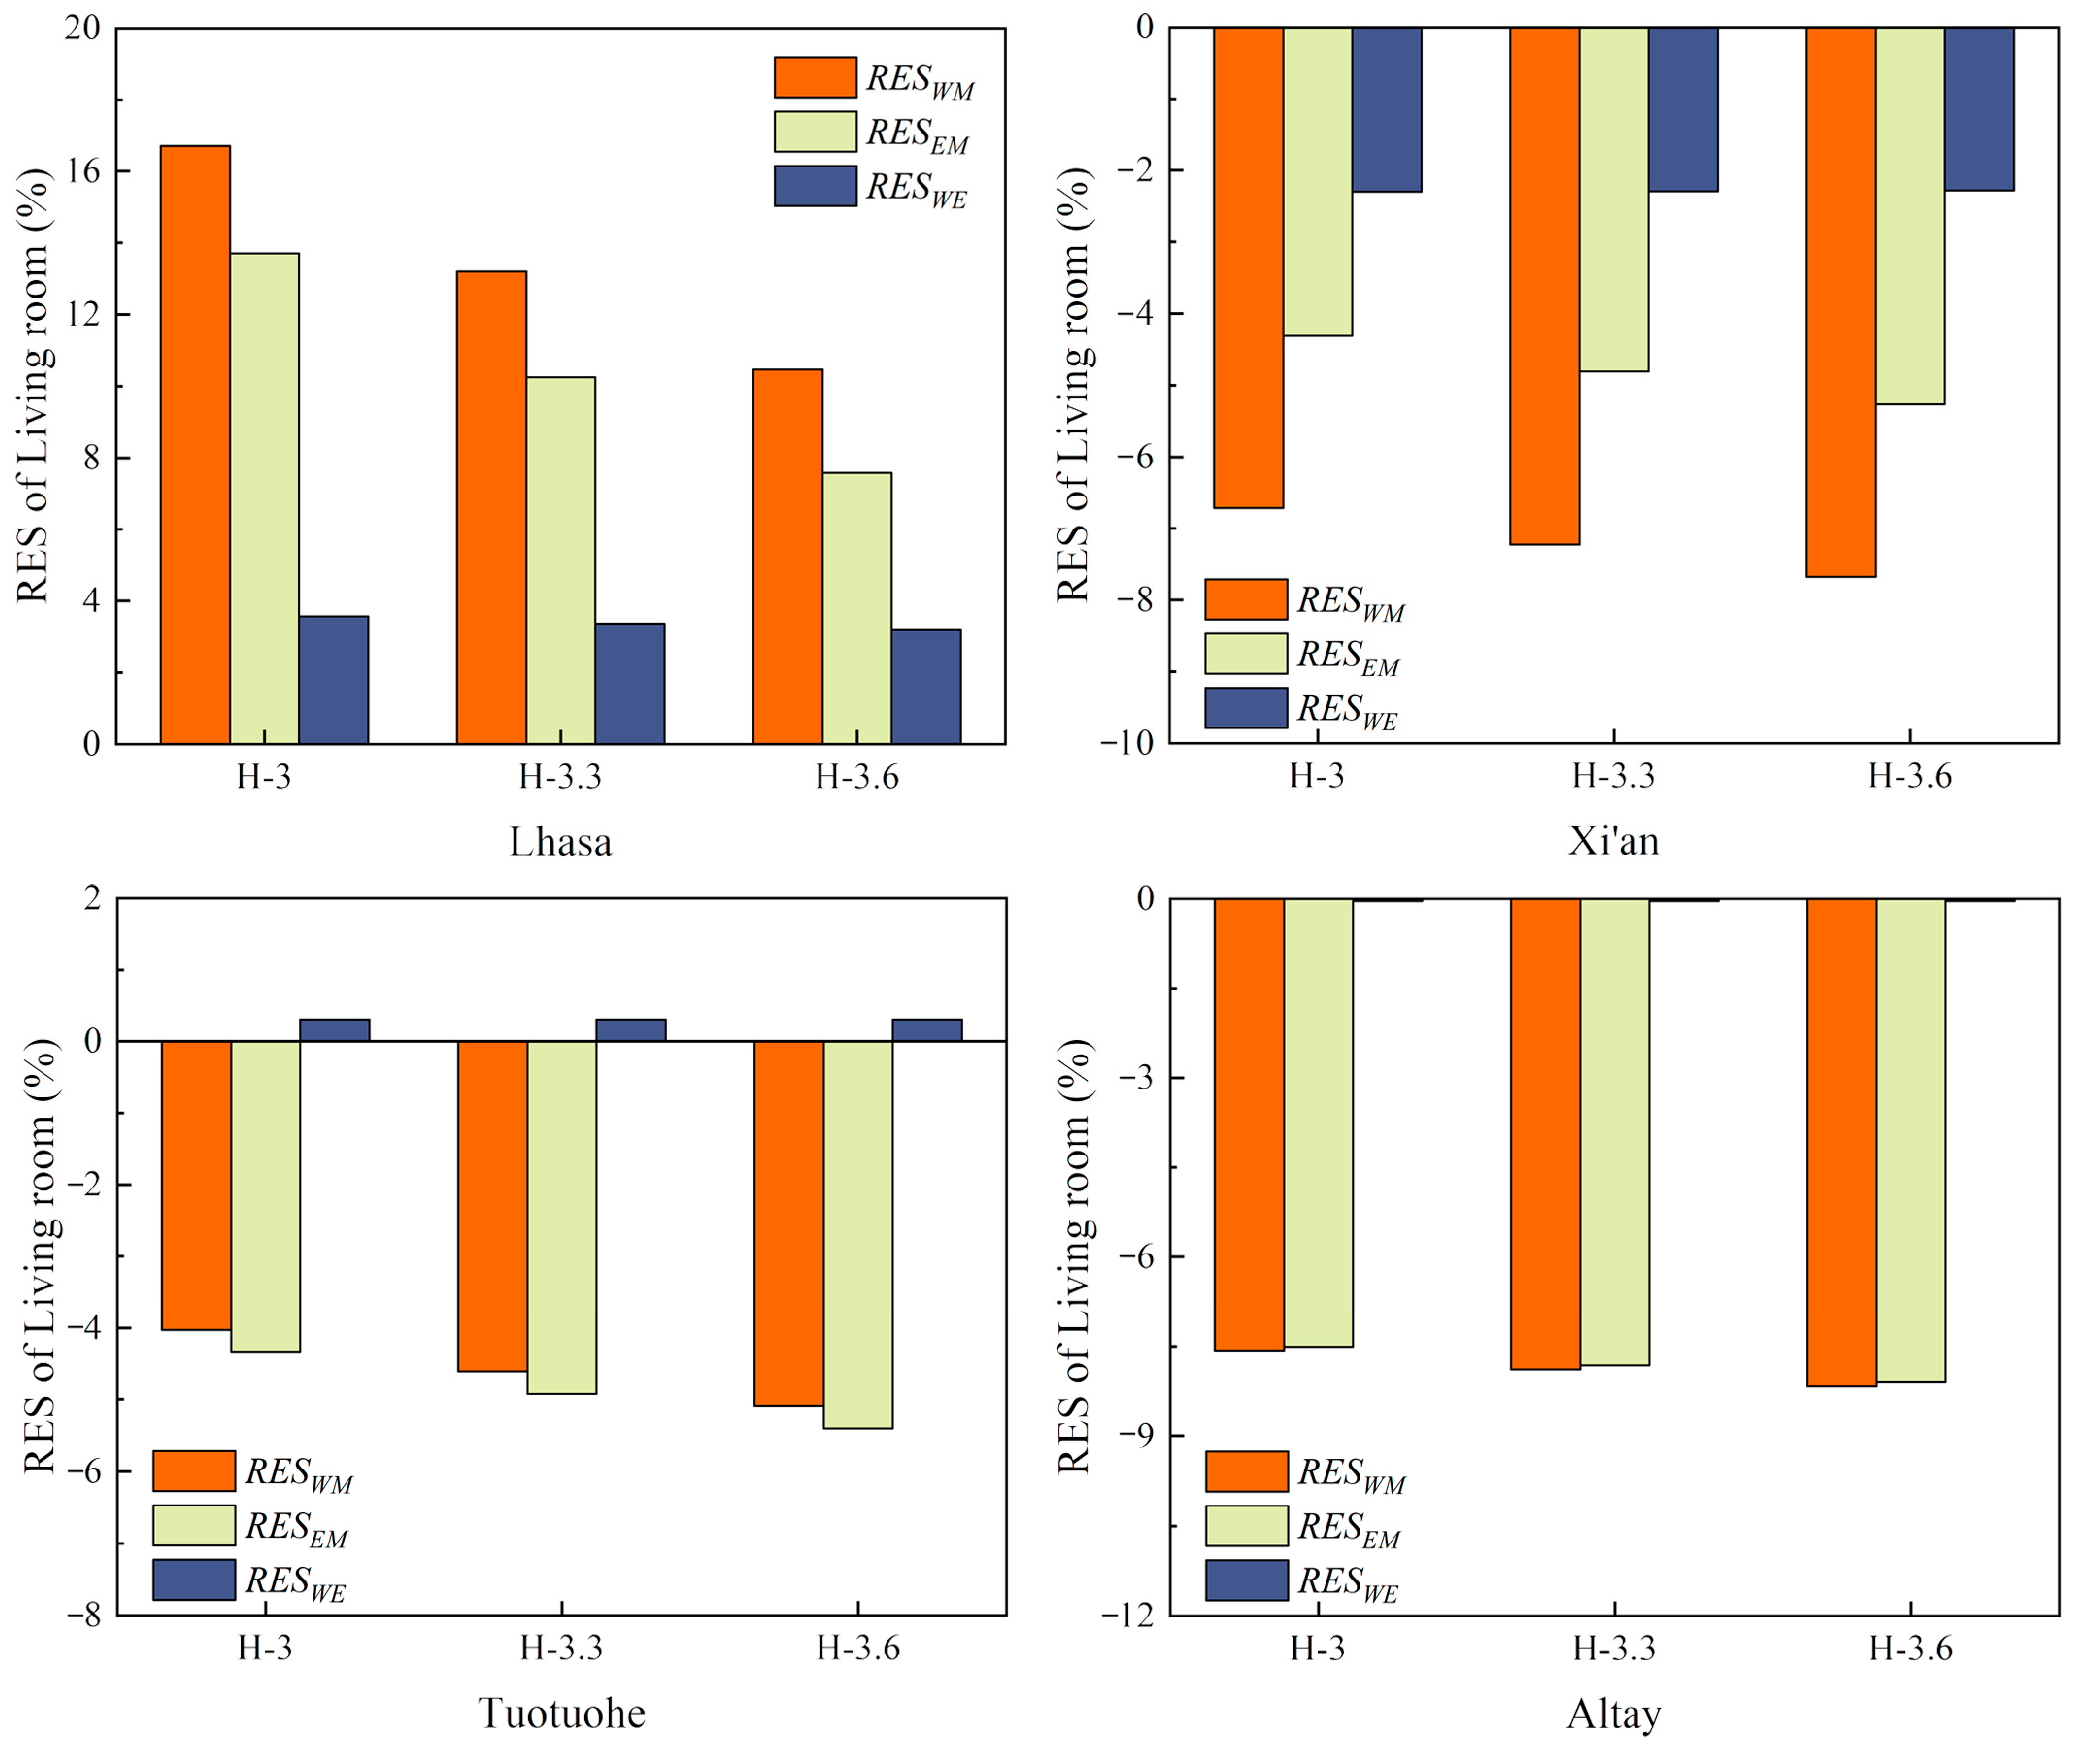
The RES values under different BH are presented in Figure 12. In Lhasa, all RES values were positive under varying BH, following the order H-3.6 < H-3.3 < H-3. This suggested that an increase in BH led to a reduction in ESR. In contrast, in Xi’an, Tuotuohe, and Altay, all RES values were negative across different BH values in the same order: H-3.6 < H-3.3 < H-3. This indicated that WM and EM were not energy-efficient in these regions, and the energy efficiency further declined with increasing BH. For RESWE, no significant differences were observed across BH values in these areas.
The differences in RESWM and RESEM across BH values were primarily associated with heat loss from the enclosing structures of heated rooms. The changes in BH altered both the height and area of walls, thereby affecting the total heat loss of the enclosing envelope. Under typical design conditions, WM and EM were not energy efficient in Xi’an, Tuotuohe, and Altay. In these areas, an increase in BH resulted in increased heat loss through interior partition walls, especially when the L room was centrally located. Consequently, |RESWM| and |RESEM| increased. However, this trend was not observed in Lhasa, where the increase in heat loss from interior partitions was relatively minor due to the relatively high Ta of non-heated rooms. Thus, the ESR of WM and EM declined slightly with increasing BH. For |RESWE|, the differences under different BH values were generally insignificant. This was because BH proportionally changed the heating demand and the difference in the heat loss of the exterior wall before and after the orientation change. Taking Lhasa, where the differences in RESWE were most obvious, as an example, after the heating rooms moved from the west to the east side, the differences in total energy consumption during the heating period between H-3.6 and H-3.3, and between H-3.3 and H-3, were 33.6 and 32.5 kWh, respectively, with a ratio of about 1. The heat loss differences caused by the change in the orientation of the exterior walls were 0.78 and 0.76 kWh, respectively, whose ratio was also close to 1.
Furthermore, Figure 12 presents the following observations.
In low-radiation or low-temperature regions, changes in BH had little influence on the ESR of WM and EM. For example, in Altay, the maximum differences in RESWM and RESEM under varying BH were 0.59% and 0.58%, respectively. In contrast, in high-radiation and high-temperature regions such as Lhasa, these differences reached 6.25% for RESWM and 6.14% for RESEM. This was because the ESR of WM and EM under typical design values was primarily influenced by heat loss through interior partition walls. When solar radiation intensity was low or Te was low, the additional heat loss and heating load resulting from increased BH were relatively small compared to the huge original heating load. However, in high-temperature and high-radiation areas, the increment of heat loss of interior partition walls caused by the increase in BH was small, but its value was relatively large compared with the lower building energy consumption.
The impact of BH on the ESR of WE was negligible across different climatic regions. For example, the maximum difference in RESWE was 0.39% in Lhasa and only 0.02% in Altay. This was because the changes in BH led to proportional changes in heating energy consumption through the exterior walls before and after orientation shifts, and these effects largely offset each other.

4.2. Maximum Differences in Energy Consumption

Based on the building energy consumption data under simultaneous heating of L, MB, and K across different climatic conditions and design parameter settings, the layouts with the highest and lowest energy consumptions were identified (Table 5). MD was then calculated using Equation (4).
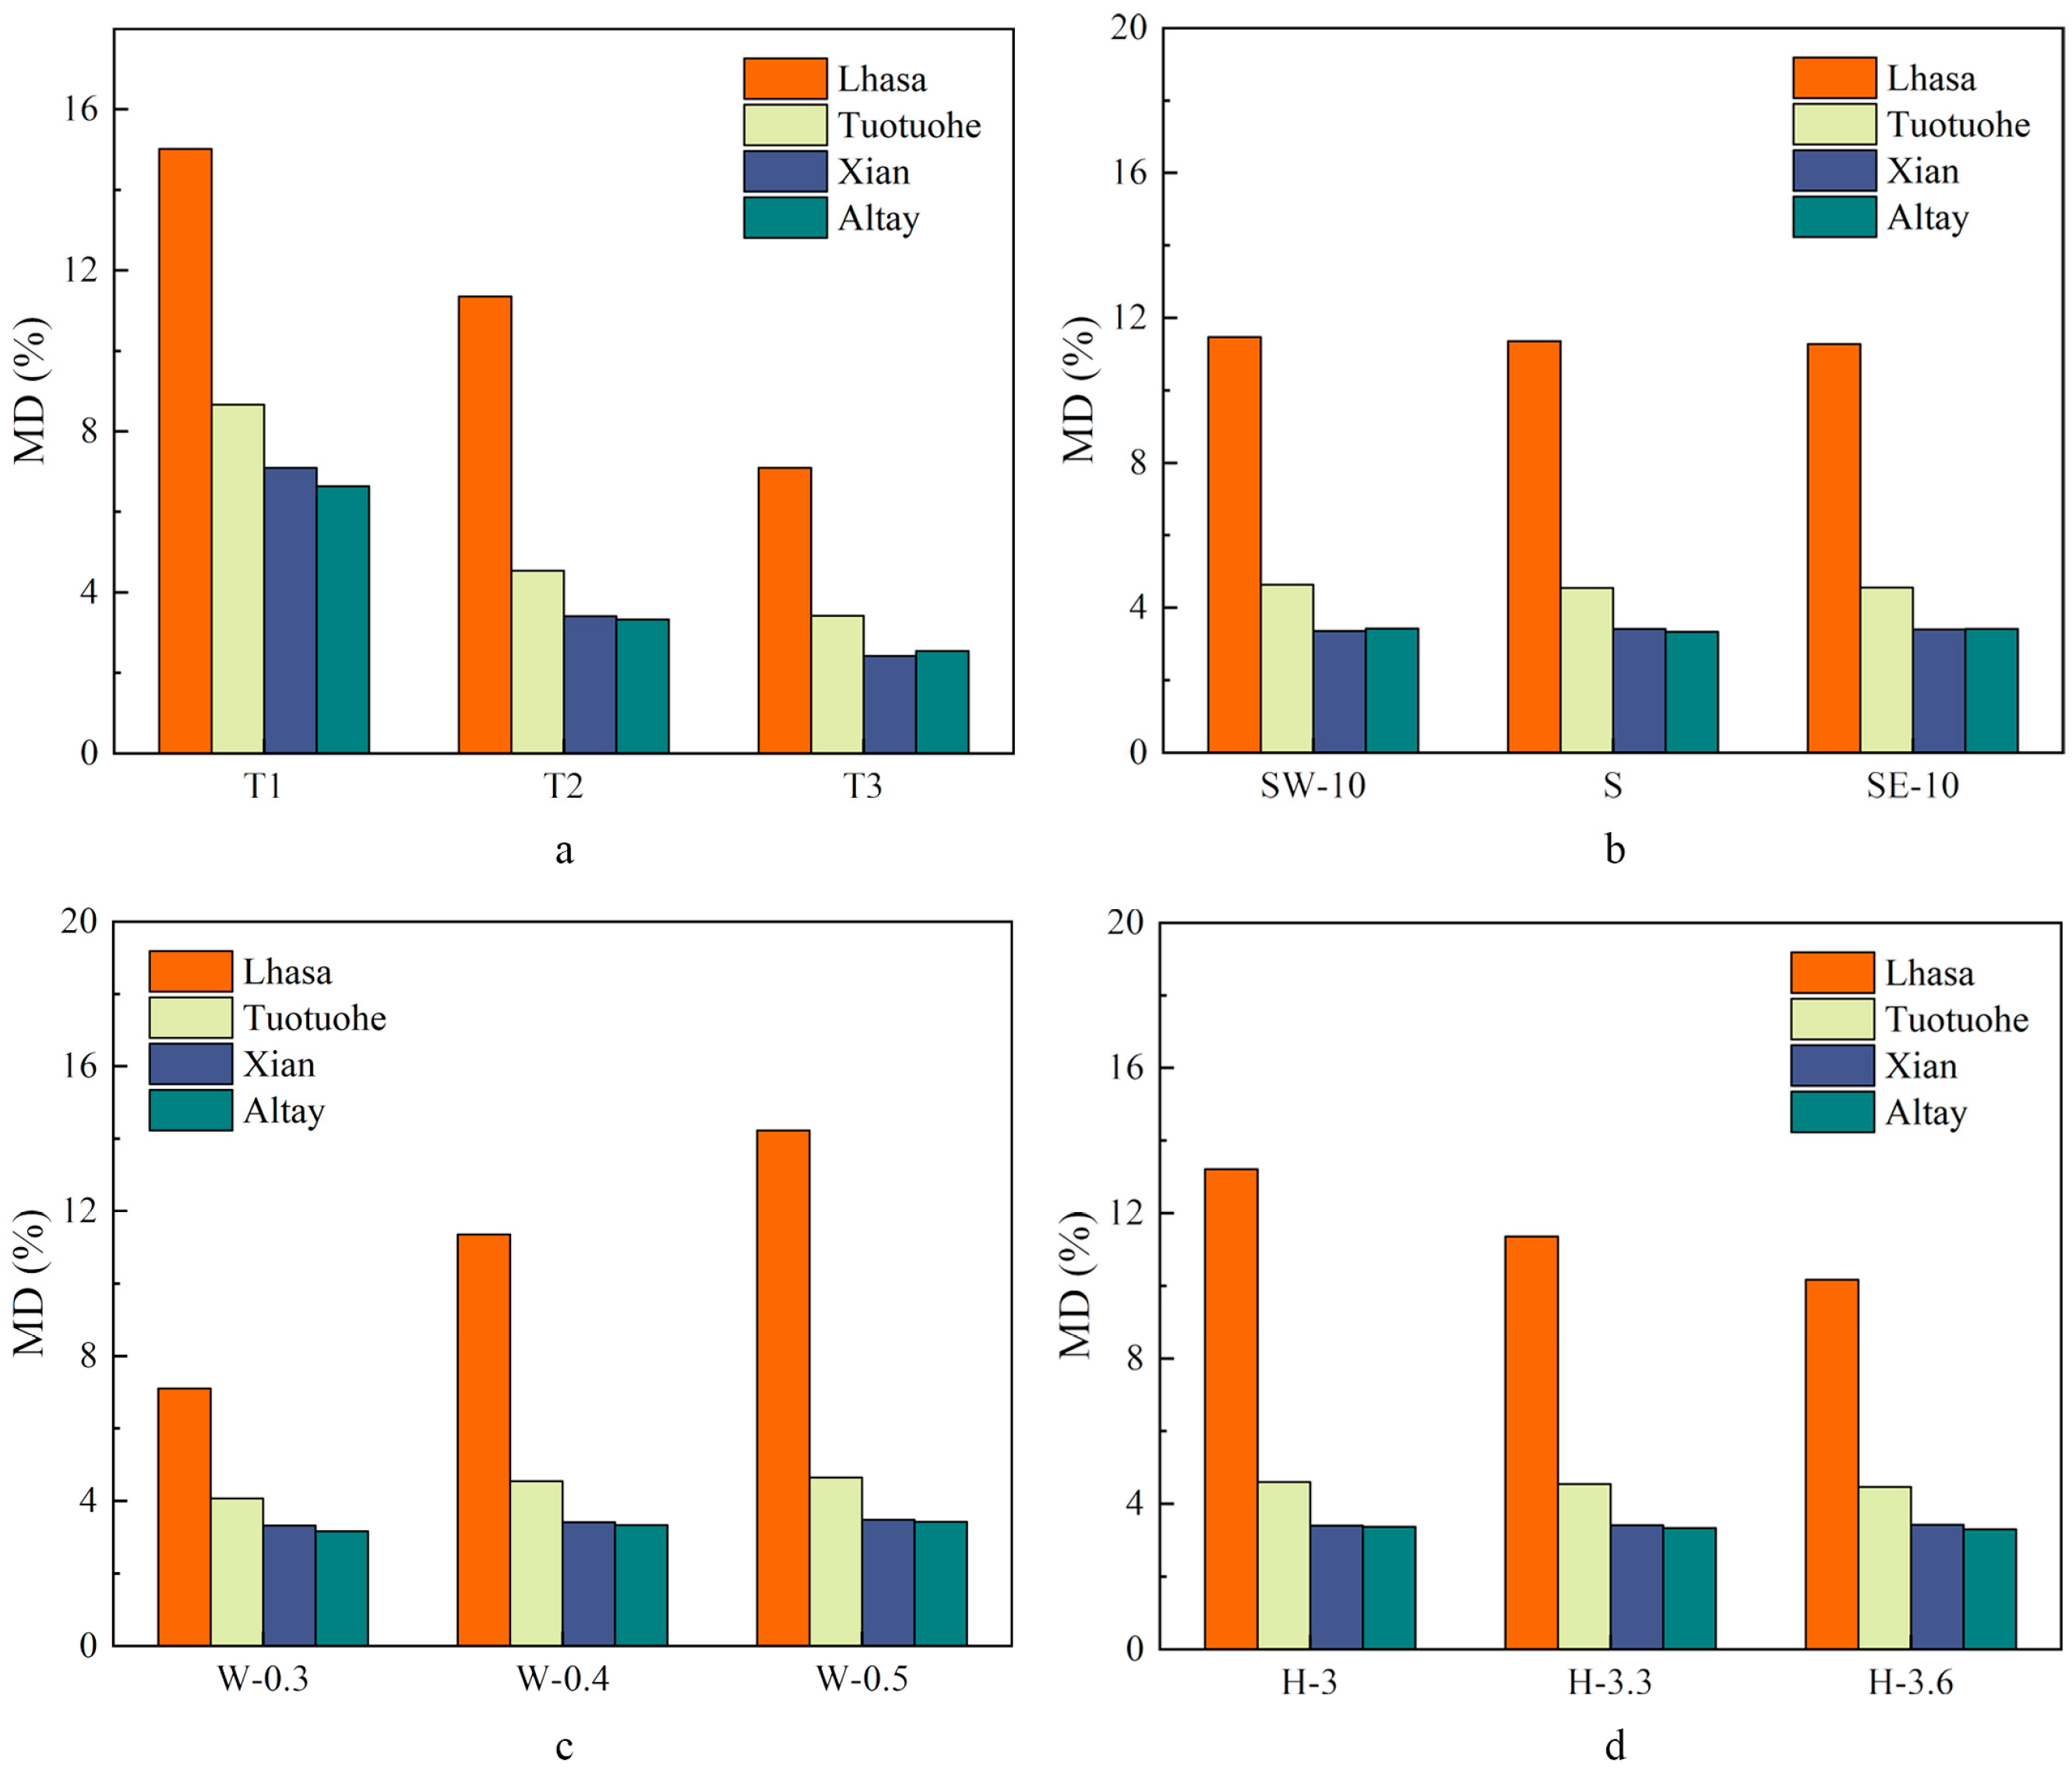
Figure 13 shows the MD values across various design parameters in different regions. Under typical design settings, the MD values for Lhasa, Xi’an, Tuotuohe, and Altay were 11.35%, 3.41%, 4.54%, and 3.33%, respectively. These variations were primarily influenced by the location of the room with the largest heating area as well as the area and orientation of exterior walls within the heated zone. For instance, in Lhasa’s lowest energy consumption layout, the largest area room was centrally located, reducing the heat loss through the interior partition walls. Additionally, the second-largest room was positioned on the eastern side of the building, optimizing the heat retention in Lhasa’s Tsae > Tsaw climate by reducing the heat loss through exterior walls.
In multi-room heating scenarios, different meteorological and design parameters affected MD in distinct ways. In Lhasa, Xi’an, Tuotuohe, and Altay, the MD values varied across exterior wall U-values (Figure 13a), ranging as follows: 7.09–15.01%, 2.42–7.09%, 3.42–8.66%, and 2.54–6.64%, respectively. Across all regions, MD followed the ranking T1 > T2 > T3, indicating that higher exterior wall U-values were associated with larger MD. This was because reduced U-values minimized the heat loss through exterior walls across different layouts. These findings contrasted with those of Du et al. [15], who concluded that the variations in exterior wall U-values had a minimal effect on the maximum differences in heating, cooling, and lighting energy consumption across layouts. In our study, not all rooms were heated simultaneously. Therefore, the influence of exterior wall U-values on ESR should be interpreted in the context of the relative sizes and thermal characteristics of both exterior and interior partition walls. In cities such as Amsterdam and Harbin, where the thermal performance conditions of the envelope resembled those of T2 and T3, the reported maximum differences in heating energy consumption across layouts were 1.5% and 1%, respectively, which were comparable to the 0.99% and 0.79% differences observed in Xi’an and Altay under similar climate conditions in this study.
In Lhasa, Xi’an, Tuotuohe, and Altay, the MD values under different BO conditions are shown in Figure 13b, ranging as follows: 11.27–11.47%, 3.36–3.41%, 4.54–4.63%, and 3.33–3.42%, respectively. The results indicated that BO had no significant influence on MD in any region. This was primarily because, under typical design conditions, most heat loss in heated rooms occurred through the interior partition walls, while the BO changes only affected △Tsa. In all layouts, the heating zone consistently included both east- and west-facing exterior walls, reducing the sensitivity of MD to BO changes. These findings are consistent with those of Shao et al. [34], who also observed a limited BO impact on heating loads under T2 envelope conditions. The minor deviation angles between BO values and the fact that most BO settings in northwest China remained within 20° of due south or southwest could further explain the minimal variation, supporting the practical validity of this conclusion. The results might be related to the setting of BO in this study. However, since the best BO for most cities in northwest China is within 20° southeast or southwest, the above conclusion still has practical value.
In Lhasa, Xi’an, Tuotuohe, and Altay, MD varied across different WWR values (Figure 13c). The values ranged from 7.1–14.23%, 3.32–3.48%, 4.07–4.65%, and 3.17–3.42%, respectively. In all regions, MD followed the trend W-0.5 > W-0.4 > W-0.3, indicating that MD decreased as WWR decreased. Therefore, WWR had a pronounced effect on MD. This was attributed to the increased solar radiation gains under higher WWR settings, which reduced the heating demand, consistent with the findings of Jiang et al. [53]. When the north-facing WWR was fixed, the heating energy consumption decreased with increasing south-facing WWR owing to higher solar gains. A significant reduction in the building heating load also accentuated the relative differences in heating energy consumption among different layouts. As shown in Figure 13c, the MD variation under different WWR values was more prominent in Lhasa than in other regions, indicating that WWR had a more substantial effect in high-temperature, high-radiation climates. In such environments, reduced heating demand amplifies layout-driven energy differences. Similar conclusions were reported by Li et al. [54], highlighting that solar radiation-related design factors such as WWR played a more critical role in influencing building heating loads in Lhasa.
In Lhasa, Xi’an, Tuotuohe, and Altay, MD also varied with different BH values (Figure 13d): 10.17–13.21%, 3.43–3.42%, 4.47–4.6%, and 3.3–3.37%, respectively. In all cases, MD followed the trend H-3 > H-3.3 > H-3.6, indicating that MD decreased with increasing BH. This was because an increase in BH increased the envelope surface area, increasing the heating energy consumption of the building but proportionally reducing the relative difference in energy consumption between layouts. As a result, MD decreased. As shown in Figure 13d, the MD values in Lhasa were significantly higher than those in other regions. In Xi’an, Tuotuohe, and Altay, the variation in MD across BH values was minimal. In high-radiation, high-temperature regions such as Lhasa, the temperature in non-heated rooms remained relatively high. Therefore, when BH increased, the additional heat loss through interior partitions was limited, whereas the increase in the overall building heating load was more substantial, contributing to the observed decrease in MD. These findings are consistent with Liu’s research [55], which reported a similar trend for optimal floor heights in energy-saving design strategies.
4.3. Correlation Coefficients Between Meteorological Parameters and Relative Energy Saving Rates and Maximum Differences in Energy Consumption

The effects of meteorological parameters on ESR are presented in Table 6. By analyzing the correlation between major meteorological parameters (Idn, Te, and △Tsa) and the RES values of rooms L, MB, and K (when heated separately), as well as MD (when multiple rooms were heated simultaneously) under typical design parameter values, RES and MD were significantly correlated with Idn and △Tsa (p < 0.01).
(1)
The correlations between the meteorological parameter Te and RES and MD were insignificant. This was because, under the typical exterior wall U-value (0.5 W/(m2·K)), the influence of Te on the indoor thermal environment was diminished.
(2)
Idn and △Tsa were significantly correlated with RESWM and RESEM (p < 0.01). This was attributed to the fact that RESWM and RESEM primarily reflected the heat loss through east and west exterior walls of the heated room when located on the exterior of the building, as well as heat loss through interior partition walls when the heated room was centrally located. Under a typical exterior wall U-value of 0.5 W/(m2·K), Idn could still influence the temperature of non-heated rooms through transparent and opaque envelope structures. Although △Tsa only represented the differences in outdoor thermal boundary conditions for east and west exterior walls, it was directly related to the variation in solar radiation equivalent temperatures among orientations (Equations (1) and (2)). Moreover, △Tsa also reflected the relative heat loss across east and west exterior walls of the heated room, resulting in a higher correlation coefficient between △Tsa and RESWM and RESEM compared to Idn.
(3)
Idn and △Tsa were significantly correlated with RESWE (p < 0.01). This was due to the fact that the adjustment of room location in the WE case directly altered the orientation of the east and west exterior walls, which determined the outdoor comprehensive temperature of those walls. Thus, △Tsa reflected the differences in outdoor thermal boundary conditions, inherently including the solar radiation equivalent temperature.
(4)
Idn and △Tsa were also significantly correlated with MD (p < 0.01). The stronger Idn or larger |△Tsa| amplified the heat distribution differences among layouts. In multi-room heating, the energy consumption differences among layouts were mainly attributable to:
  • Variations in heat loss through interior partition walls between heated and non-heated zones.
  • Variations in heat loss through the east and west exterior walls of the heating zones.
Because Idn influenced ITC and the outdoor heat transfer boundary conditions, and △Tsa represents the variation in these boundary conditions, both Idn and △Tsa significantly affected MD by determining factors a and b.
In summary, when adjusting a single heated room or simultaneously modifying the layout of multiple heated rooms under typical passive design parameter values, local Idn and △Tsa should be prioritized.

4.4. Contribution Rate of Each Influencing Factor

Based on the random forest results, the optimal fitting of the ESR was obtained when the number of trees was set to 500. For RESWM, the ranking of the influencing factors was U > △Tsa > Idn > Te > WWR (R2 = 0.99; RMSE = 0.65). For RESEM, the ranking was U > Idn > △Tsa > Te > WWR (R2 = 0.96; RMSE = 1.58). For RESWE, the order is Idn > △Tsa > Te > BO > U (R2 = 0.92; RMSE = 0.86). For MD, the ranking was Idn > △Tsa > U > Te > WWR (R2 = 0.99; RMSE = 0.31) (Table 7). Overall, the exterior wall U-values and meteorological parameters had the most significant effects on ESR. This was primarily because room location changes for WM, EM, and WE mainly affected the exterior wall area and outdoor heat transfer boundary conditions of heated rooms. Moreover, the variation in exterior wall U-values was more evident than that in climate conditions across the four studied regions. Therefore, when the exterior wall U-values exhibited minimal variation, their influence on spatial layout adjustments was relatively limited.

5. Conclusions and Recommendations

5.1. Conclusions

This study simulated and compared the heating energy consumption of six layouts of a single-story rural solar house in Northwest China. It demonstrated that ESR varied significantly. Under typical design parameters, RESWM ranged from −7.89% to 13.20%, RESEM from −7.82% to 10.25%, RESWE from −2.29% to −3.36%, and MD ranged from 2.42% to 15.01%. Notably, ESR was strongly influenced by meteorological and design parameters.
1)
For WM and EM, the exterior wall U-value exerted the most significant influence on ESR, followed by WWR. Higher U-values, greater WWR, or lower BH values enhanced ESR. The influence of BO on ESR for WM and EM was associated with local Tsa.
2)
For WE, BO had the greatest impact on ESR, followed by exterior wall U-value. BO changes that increased |△Tsa| also increased |RESWE|. Higher U-values corresponded to greater ESR.
3)
In multi-room heating, the exterior wall U-value had the greatest influence on MD, followed by WWR, and finally BH. Higher U-values and WWR increased MD, whereas higher BH values reduced it.
4)
In high-temperature regions, the exterior wall U-value significantly affected ESR for WE. In regions with large |△Tsa|, BO had a greater impact on ESR. In high-temperature and high-radiation areas, the influence of WWR and BH on ESR for WM and EM was significant, and the same held for their impact on MD.
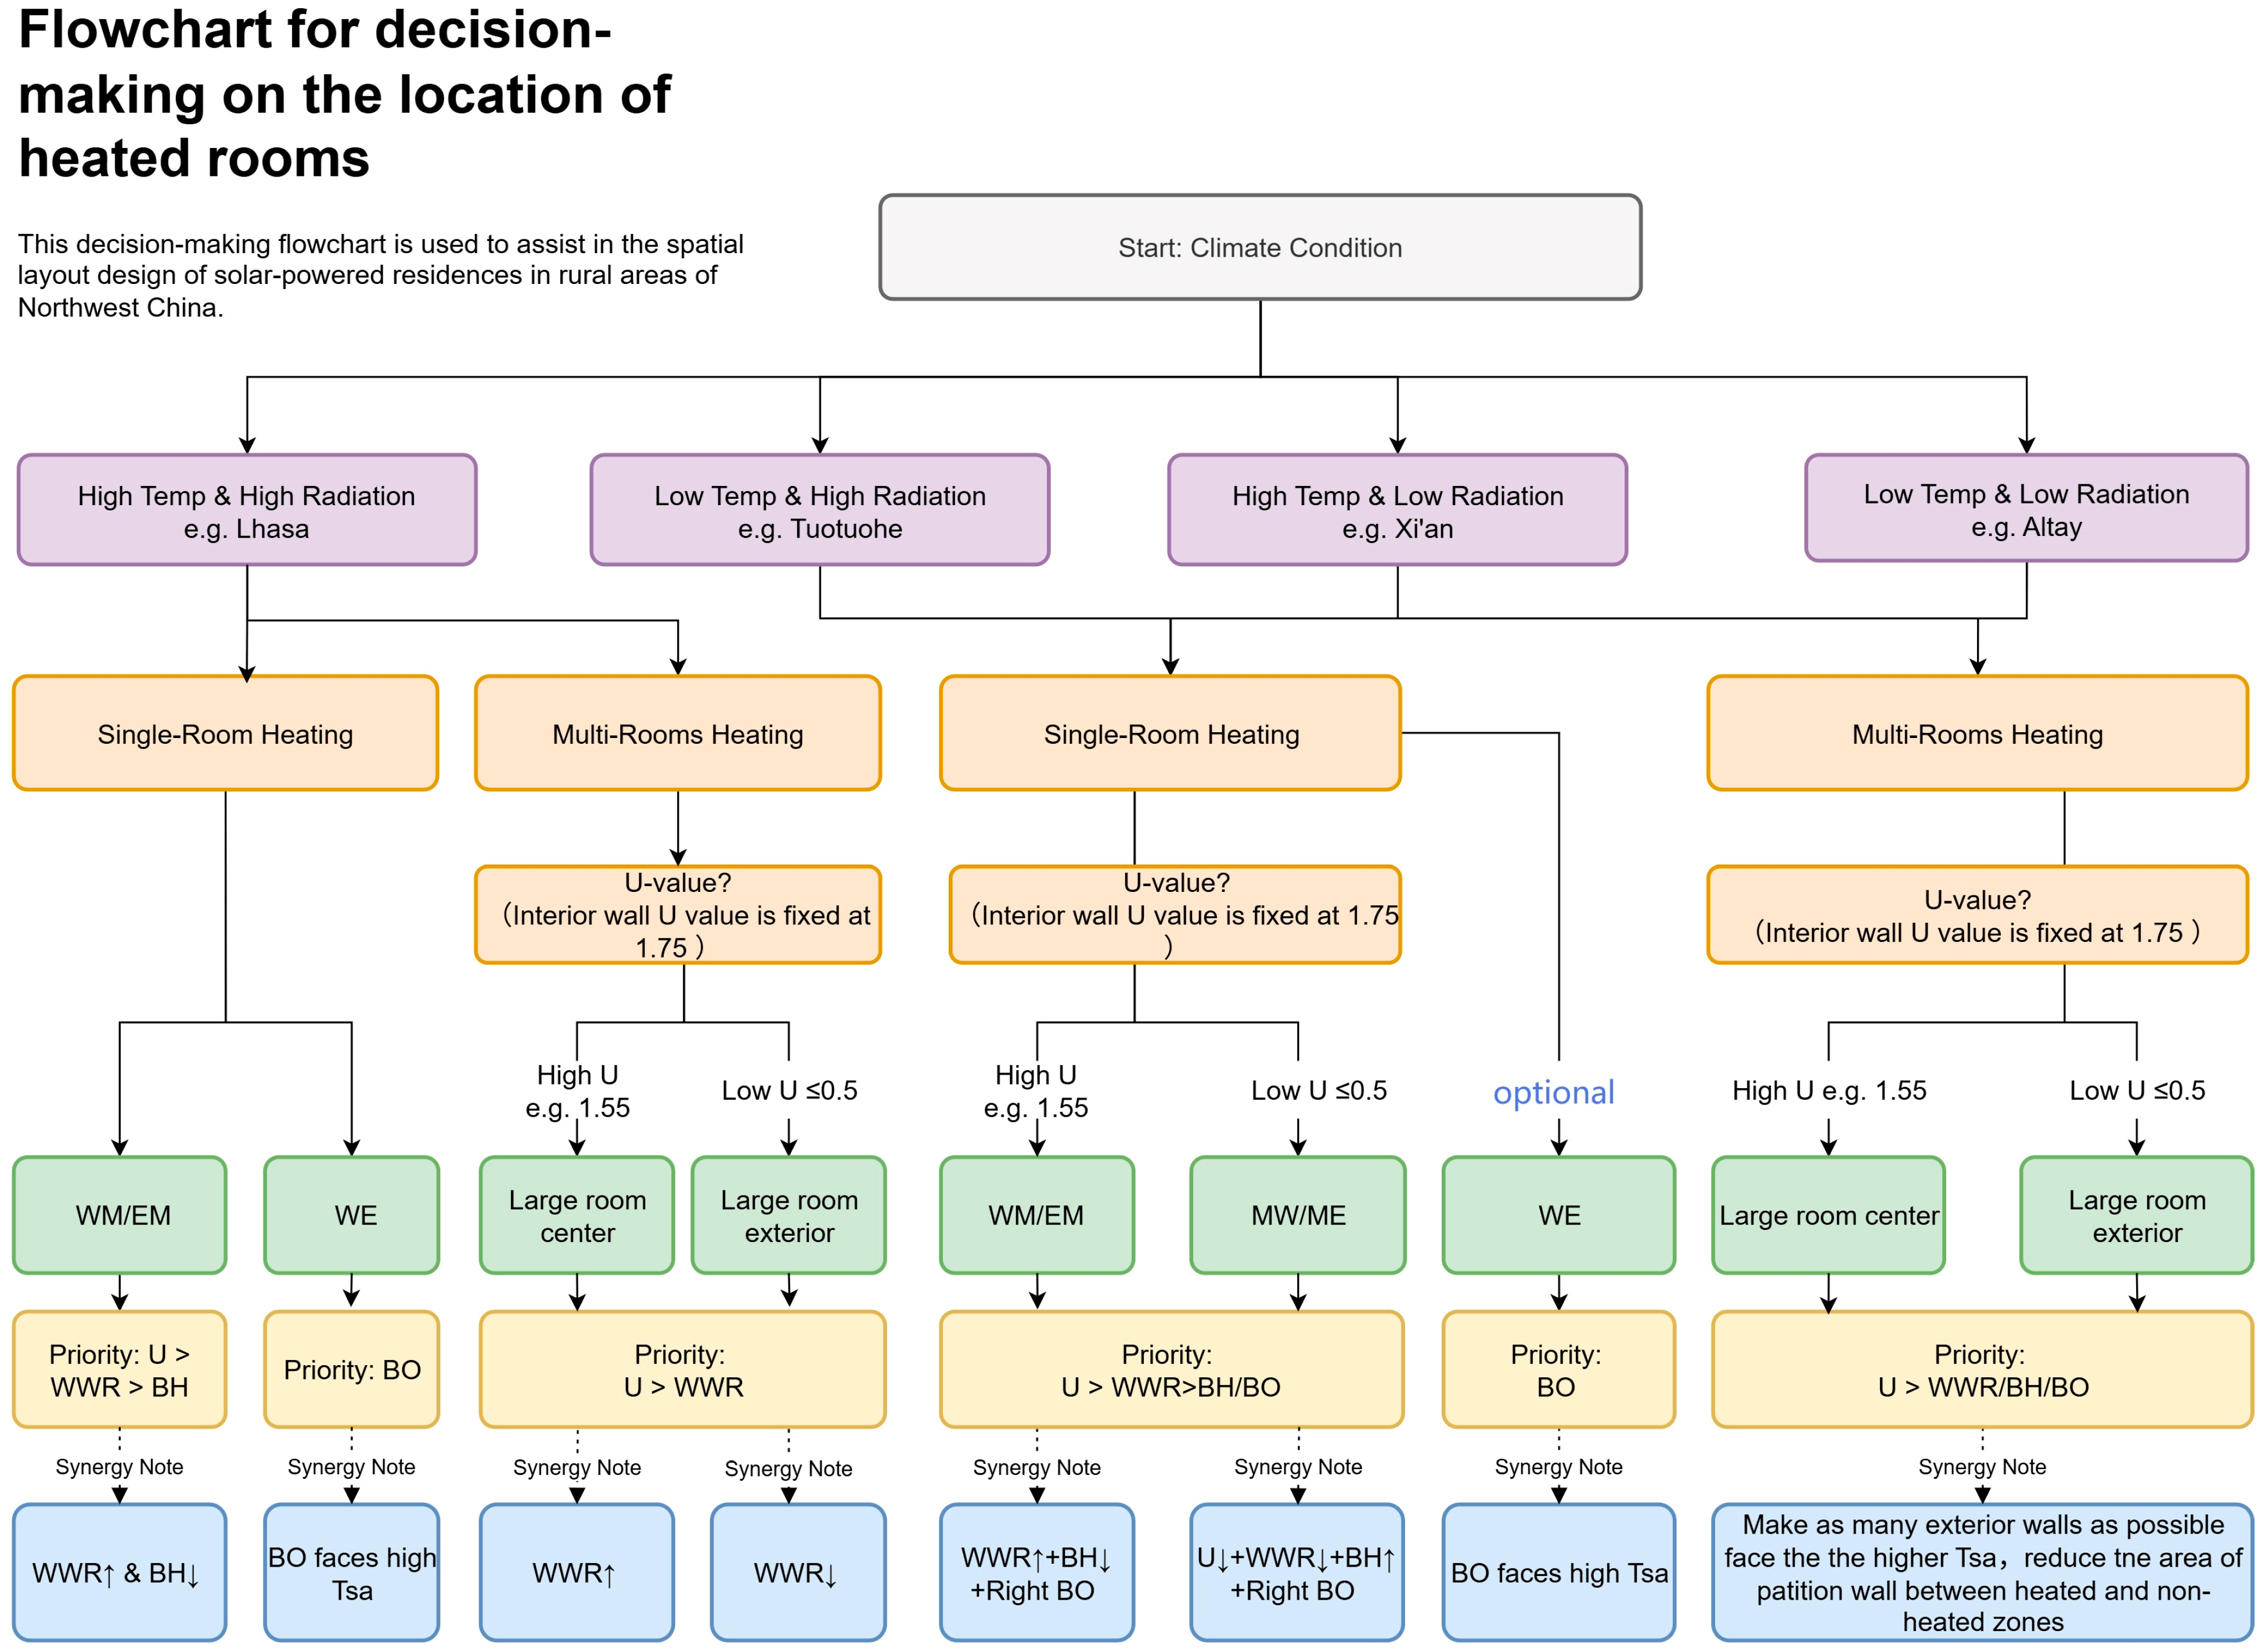
Overall, for changes in a single heated room location, the primary meteorological factors were Idn and △Tsa. The key design parameters were exterior wall U-value, BO, and WWR. For heated multi-room location changes, the dominant meteorological factors were Idn and △Tsa, while the main design parameters were exterior wall U-value and WWR. To better assist in the spatial layout design of solar houses in rural areas of Northwest China, a decision-making flowchart for the location of heated rooms was drawn, as shown in Figure 14.

5.2. Recommendations

Based on the above conclusions, the following energy-saving optimization recommendations were proposed for the layout of rural solar houses in Northwest China:
When other design parameters are typical and the thermal performance of the envelope is weak, the centrally located placement of single heated rooms is recommended. Larger-area rooms should also be centrally positioned in cases that involve multiple heated rooms. Conversely, when the thermal performance of the envelope is strong, single heated rooms should be placed on the exterior of the building. For multiple heated rooms, large-area rooms should be positioned on the exterior.
With typical exterior wall U-values, increasing the south-facing WWR and decreasing BH were identified to enhance ESR.
Under typical exterior wall U-values, if heated rooms are placed on the exterior, the side with a higher Tsa should be selected. For multiple heated rooms, reducing the exterior wall area of the heating zones and the area of interior partition walls between heated and non-heated zones, while orienting as many exterior walls as possible towards the side with higher Tsa, was advised.
In regions with high temperatures and strong solar radiation, adjusting the layout of heated rooms can achieve significant energy-saving benefits. In low-temperature or low-radiation regions, the energy efficiency can be improved by combining room location adjustments with increased WWR and reduced BH and BO modifications to increase the Tsa of specific exterior walls. This strategy can also be applied to the spatial arrangement of multiple heated rooms.
This study selected single-story, brick-concrete, flat-roofed rural solar houses as representative cases, given the commonality of their layout issues in other rural housing types. However, future rural houses are expected to be more diverse. Further research is needed on room location modifications in multi-story, non-rectangular, and irregular buildings. In addition, in practical applications, spatial layout optimization based on ESR may face some challenges. For instance, traditional architectural customs and economic conditions in rural areas may restrict the flexible adjustment of room locations. Moreover, implementing ESR optimization may require additional cost input, such as renovations to the building envelope and upgrades to the heating system. Therefore, when promoting ESR optimization strategies, it is necessary to fully consider these potential obstacles and make trade-offs in light of local actual conditions. For rural designers and policymakers, the findings of this study offer a new perspective on energy-saving design for rural residences, but at the same time, a balance needs to be struck between energy-saving goals and practical operation.

Author Contributions

Conceptualization, W.H. and G.S.; methodology, W.H., G.S., J.L. and L.Z.; formal analysis, W.H., S.B. and J.L.; writing—original draft preparation, W.H.; supervision, G.S. and L.Z.; review and editing, S.B.; software, H.X. All authors have read and agreed to the published version of the manuscript.

Funding

This research was funded by the Natural Science Basic Research Program of Shaanxi (Program No. 2024JC-YBQN-0496, 2024JC-YBQN -0314), the National Natural Science Foundation of China (Grant No. 42407478), Shaanxi Provincial Key Research and Development Project (No. 2024SF-YBXM-629), the Doctor’s Scientific Research Startup Project (YAU202313804).

Data Availability Statement

The original contributions presented in the study are included in the article, further inquiries can be directed to the corresponding author.

Conflicts of Interest

Author Shaofu Bai is employed by China Northwest Architectural Design and Research Institute Co., Ltd. The remaining authors declare that the research was conducted in the absence of any commercial or financial relationships that could be construed as a potential conflict of interest.

Abbreviations

The following abbreviations are used in this manuscript:
ITCIndoor thermal conditions
BEPBuilding energy performance
ESREnergy saving potential of heated room relocation
WWRWindow-to-wall ratio
BOBuilding orientation
BHBuilding height
RESRelative energy saving rate
MDMax difference of energy consumption
UHeat transfer coefficient
SHGCSolar heat gain coefficient
TsaSolar-air temperature
ΔTsaDifference between the Tsaw and Tsae
TeOutdoor dry bulb temperature
THIndoor temperature of heated room
TNIndoor temperature of non-heated room
ISolar irradiance
IdnDirect solar irradiance
AArea
VVolume
qHeat flux
αConvective heat transfer coefficient
cpSpecific heat capacity
ρ Density
C b Blackbody radiation constant
ε Emissivity coefficient
φ Radiation angle coefficient
|a|Absolute value.

References

  1. Rahman, N.M.A.; Haw, L.C.; Fazlizan, A. A literature review of naturally ventilated public hospital wards in tropical climate countries for thermal comfort and energy saving improvements. Energies 2021, 14, 435. [Google Scholar] [CrossRef]
  2. Mirabella, N.; Röck, M.; Saade, M.R.M.; Spirinckx, C.; Bosmans, M.; Allacker, K.; Passer, A. Strategies to improve the energy performance of buildings: A review of their life cycle impact. Buildings 2018, 8, 105. [Google Scholar] [CrossRef]
  3. IEA. Net Zero Roadmap: A Global Pathway to Keep the 1.5 °C Goal in Reach; IEA: Paris, France, 2023. [Google Scholar]
  4. Niu, B.; Xue, X.R.; Sai, Y.X.; Xu, J. Impact of digitalization inputs on CO2 emissions in China’s construction industry under the “Dual Carbon” goal. Energ. Build. 2025, 344, 116014. [Google Scholar] [CrossRef]
  5. GB/T 50378-2019; Evaluation Standard for Green Building. China Architecture and Architecture Press: Beijing, China, 2024.
  6. Tsinghua University. Annual Report on China Building Energy Efficiency; China Architecture & Building Press: Beijing, China, 2020. [Google Scholar]
  7. Tsinghua Building Energy Research Center. China Carbon Emission Research Report on Buildings and Urban Infrastructure; China Architecture & Building Press: Beijing, China, 2023. [Google Scholar]
  8. Li, M.; Zhu, K.; Lu, Y.; Zhao, Q.; Yin, K. Technical and economic analysis of multi-energy complemntary systems for net-zero energy consumption combining wind, solar, hydrogen, geothermal, and storage energy. Energ. Conver. Manag. 2023, 295, 117572. [Google Scholar] [CrossRef]
  9. Shi, Y.; Yan, Z.F.; Li, C.Y.; Li, C.X. Energy consumption and building layouts of public hospital buildings: A survey of 30 buildings in the cold region of China. Sustain. Cities Soc. 2021, 74, 103247. [Google Scholar] [CrossRef]
  10. Sleiman, H.A.; Hempel, S.; Traversari, R.; Bruinenberg, S. An assisted workflow for the early design of nearly zero emission healthcare buildings. Energies 2017, 10, 993. [Google Scholar] [CrossRef]
  11. Musau, F.; Steemers, K. Space planning and energy efficiency in office buildings: The role of spatial and temporal diversity. Archit. Sci. Rev. 2008, 51, 133–145. [Google Scholar] [CrossRef]
  12. Sang, G.C.; Han, Y.; Zhu, Y.Y.; Chen, D.Y.; Zhao, Q. Study of the non-uniform effect of space division on passive solar house indoor temperature. Acta Energiae Solaris Sin. 2016, 37, 2902–2908. [Google Scholar]
  13. Dino, I.G.; Üçoluk, G. Multiobjective design optimization of building space layout, energy, and daylighting performance. J. Comput. Civ. Eng. 2017, 31, 04017025. [Google Scholar] [CrossRef]
  14. Yi, H. User-driven automation for optimal thermal-zone layout during space programming phases. Archit. Sci. Rev. 2016, 59, 279–306. [Google Scholar] [CrossRef]
  15. Du, T.; Jansen, S.; Turrin, M.; Dobbelsteen, A.V.D. Effect of space layouts on the energy performance of office buildings in three climates. J. Build. Eng. 2021, 39, 102198. [Google Scholar] [CrossRef]
  16. Ekici, B.; Cubukcuoglu, C.; Turrin, M.; Sariyildiz, I.S. Performative computational architecture using swarm and evolutionary optimisation: A review. Build. Environ. 2019, 147, 356–371. [Google Scholar] [CrossRef]
  17. Boonstra, S.; van der Blom, K.; Hofmeyer, H.; Emmerich, M.T.M.; Van Schijndel, J.; De Wilde, P. Toolbox for super-structured and super-structure free multi-disciplinary building spatial design optimization. Adv. Eng. Inform. 2018, 36, 86–100. [Google Scholar] [CrossRef]
  18. Schwartz, Y.; Raslan, R.; Korolija, I.; Mumovic, D. Integrated building performance optimisation: Coupling parametric thermal simulation optimisation and generative spatial design programming. In Proceedings of the 15th International Building Performance Simulation Association, San Francisco, CA, USA, 7–9 August 2017; pp. 1222–1229. [Google Scholar]
  19. Dino, I.G. An evolutionary approach for 3D architectural space layout design exploration. Autom. Constr. 2016, 69, 131–150. [Google Scholar] [CrossRef]
  20. Ge, D.D.; Huang, M.; Jin, X.; Liang, Z.Y.; Chang, W.S.; Yin, X.Z. Carbon emission of rural household in China: A STIRPAT analysis of 30 provinces 2011–2021. Energ. Build. 2025, 343, 115953. [Google Scholar] [CrossRef]
  21. Delgarm, N.; Sajadi, B.; Kowsary, F.; Delgarm, S. Multi-objective optimization of the building energy performance: A simulation-based approach by means of particle swarm optimization (PSO). Appl. Energy 2016, 170, 293–303. [Google Scholar] [CrossRef]
  22. Al-Shargabi, A.A.; Almhafdy, A.; Ibrahim, D.M.; Alghieth, M.; Chiclana, F. Buildings’ energy consumption prediction models based on buildings’ characteristics: Research trends, taxonomy, and performance measures. J. Build. Eng. 2022, 54, 104577. [Google Scholar] [CrossRef]
  23. Kistelegdi, I.; Horváth, K.R.; Storcz, T.; Ercsey, Z. Building geometry as a variable in energy, comfort, and environmental design optimization—A review from the perspective of architects. Buildings 2022, 12, 69. [Google Scholar] [CrossRef]
  24. Liu, Y.F.; Ghazali, M.A.; Yang, L.J.; Chen, Y. Sustainable passive design in cold regions: Energy and thermal evaluation of traditional Zhuangke dwellings-in Qinghai Province, China. Energy Build. 2025, 344, 115969. [Google Scholar] [CrossRef]
  25. Zhang, A.; Huang, Q.; Sun, Y.; Zhang, Q. Multi-objective window optimization of school buildings for thermal and daylight performance in the cold climate of China. In Proceedings of the 33rd PLEA International Conference: Design to Thrive, PLEA 2017, Edinburgh, UK, 2–5 July 2017; pp. 4461–4468. [Google Scholar]
  26. Hu, Y.; Wang, X.M.; Xu, Z.L.; Yuan, L. Optimization of low-energy building interior design based on machine vision: Environmental thermal energy conduction and layout design. Therm. Sci. Eng. Prog. 2025, 57, 103140. [Google Scholar] [CrossRef]
  27. Yao, S.; Li, M.; Yuan, J.Y.; Huo, Q.; Zhao, S.Y.; Wu, Y. Optimization design of layout dimension for residential buildings weighing up daylighting, thermal comfort, and indoor air quality with a low-carbon decision-making. J. Build. Eng. 2024, 98, 111328. [Google Scholar] [CrossRef]
  28. Xu, J.; Gao, W.J.; Huo, X.P. Analysis on energy consumption of rural building based on survey in northern China. Energy Sustain. Dev. 2018, 47, 34–38. [Google Scholar] [CrossRef]
  29. JGJ/T 267-2012; Technical Code for Passive Solar Building. Ministry of Housing and Urban-Rural Development: Beijing, China, 2012.
  30. Zhang, K.Y.; Sang, G.C.; Ren, G.M.; Du, M.J.; Cui, X.L.; Zhang, L.; Han, W.X. Partition construction and characteristic difference of thermal environment in rural solar heating buildings. J. Xi’an Univ. Technol. 2022, 38, 386–393. [Google Scholar]
  31. GB/T50824-2013; Design Standard for Energy Efficiency of Rural Residential Buildings. Ministry of Housing and Urban-Rural Development: Beijing, China, 2013.
  32. JGJ26-2018; Design Standard for Energy Efficiency of Residential Buildings in Severe Cold and Cold Zones. Ministry of Housing and Urban-Rural Development: Beijing, China, 2018.
  33. Chen, C.; Li, Y.; Li, N.; Wei, S.; Yang, F.G.; Ling, H.S.; Yu, N.; Han, F.T. A computational model to determine the optimal orientation for solar greenhouses located at different latitudes in China. Sol. Energy 2018, 165, 19–26. [Google Scholar] [CrossRef]
  34. Shao, T.; Zheng, W.X. Energy-Saving sensitivity analysis of rural houses’ spatial design factors based on difference in envelope performances. Build. Sci. 2021, 37, 101 110,125. [Google Scholar]
  35. Ma, C.; Liu, Y.F.; Wang, D.J.; Wang, Y.Y. Analysis of thermal performance and energy saving strategy of rural residence building in Northwest China. J. Xi’an Univ. Archit. Technol. 2015, 47, 427–443. [Google Scholar]
  36. Xu, X.Y.; Dong, Q.; Zhen, M. Assessing effects of future climate change on outdoor thermal stress and building energy performance in severe cold region of China. Build. Environ. 2024, 251, 111236. [Google Scholar] [CrossRef]
  37. Zhou, Y.; Sha, X.L.; Wang, L.Y.; Li, X.; Zhang, Z.H. Spatial and temporal dynamics of solar energy resources in China and forecast of future solar radiation. J. Atmos. Solar Terr. Phys. 2025, 269, 106463. [Google Scholar] [CrossRef]
  38. Chen, Y.; Wang, Z.; Wei, P. Climatic zoning for the building thermal design in China’s rural areas. Build. Serv. Eng. Res. Technol. 2021, 42, 567–581. [Google Scholar] [CrossRef]
  39. Li, T.; Liu, Q.X.; Mao, Q.J.; Chen, M.; Ma, C.; Wang, D.J.; Liu, Y.F. Optimization design research of insulation thickness of exterior wall based on the orientation difference of solar radiation intensity. Appl. Therm. Eng. 2023, 223, 119977. [Google Scholar] [CrossRef]
  40. Zhu, Y.Y.; Liu, L.; Qiu, Y.Y.; Ma, Z.X. Design of the passive solar house in Qinba mountain area based on sustainable building technology in winter. Energy. Rep. 2022, 8, 1763–1777. [Google Scholar] [CrossRef]
  41. Yan, Q.S.; Zhao, Q.Z. Thermal Process in Buildings; China Architecture Publishing & Media Co., Ltd.: Beijing, China,, 1986. [Google Scholar]
  42. GB50176-2016; Thermal Design Code for Civil Building. Ministry of Housing and Urban-Rural Development: Beijing, China, 2016.
  43. Sang, G.C.; Chen, F.Y.; Liu, Y.; Long, K.C.; Cui, X.L. Influence of solar absorptivity of building envelope on thermal performance of exterior wall of solar heating building. Acta Energiae Solaris Sin. 2023, 44, 33–40. [Google Scholar]
  44. Crawley, D.B.; Lawrie, L.K.; Winkelmann, F.C.; Buhl, W.F.; Huang, Y.J.; Pedersen, C.O.; Strnd, R.K.; Liesen, R.J.; Fisher, D.E.; Witte, M.J.; et al. Energy Plus: Creating a new-generation building energy simulation program. Energy Build. 2001, 33, 319–331. [Google Scholar] [CrossRef]
  45. Andreia, C.; João, A.; António, T.; Bahareh, R.; Maria, R.F.; Jorgede, B.; Carlos, M.S. The effect of cork-based living walls on the energy performance of buildings and local microclimate. Build. Environ. 2022, 216, 109048. [Google Scholar] [CrossRef]
  46. De, L.T.S.; Yousif, C. Evaluation of chimney stack effect in a new brewery using DesignBuilder-EnergyPlus software. Energy Procedia 2014, 62, 230–235. [Google Scholar]
  47. Zhu, Y.Y.; Liu, J.P. Research on the indoor thermal environment of rural architecture in winter in northwestern areas. China Civ. Eng. J. 2010, 43, 400–403. [Google Scholar]
  48. Song, C.; Liu, Y.F.; Wang, D.J. Study on temporal-spatial partitioned indoor design parameters of residential buildings in Northwest China. Heat. Vent. Air Cond. 2020, 50, 29–34. [Google Scholar]
  49. GB/T50785-2012; Evaluation standard for Indoor Thermal Environment in Civil Buildings. Ministry of Housing and Urban-Rural Development: Beijing, China, 2012.
  50. Ibrahim, A.J.; Zangana, D.D.; Liu, S.; Samuelson, H.; Yang, L.C. Impacts of climate change on energy-saving sensitivity of residential building envelope design parameters in three hot-dry cities. J. Build. Eng. 2025, 99, 111481. [Google Scholar] [CrossRef]
  51. Zhang, W.; Shi, Y.; Yang, H.; Zou, Y.; Cao, X.; Cui, H. Design optimization of passive PCM-enhanced hospital buildings for efficient energy-saving. J. Energy Storage 2024, 91, 112037. [Google Scholar] [CrossRef]
  52. Zhao, J.; Liu, R.; Zhou, B.T.; Xie, Y.M.; Li, Y.C.; Wang, X.; Fu, Y.C. Field survey, measurement and economic evaluation of the rural house heating systems in Shaanxi, China. Appl. Therm. 2025, 274, 126719. [Google Scholar] [CrossRef]
  53. Jiang, W.; Liu, B.; Li, Q.; Li, D.; Ma, L. Weight of energy consumption parameters of rural residences in severe cold areas. Case Stud. Therm. Eng. 2021, 26, 101131. [Google Scholar] [CrossRef]
  54. Li, J.; Zhang, Y.; Yue, T. A new approach for indoor environment design of passive solar buildings in plateau areas. Sustain. Energy Technol. Assess. 2024, 63, 103669. [Google Scholar] [CrossRef]
  55. Liu, K.; Xu, X.D.; Wang, W. Research on automatic optimization method of residential district layout based on energy efficiency. Ind. Constr. 2021, 51, 120950. [Google Scholar]
Figure 1. Scope of the research area.
Buildings 15 02867 g001
Figure 2. Distribution of solar energy in Northwest China.
Buildings 15 02867 g002
Figure 3. The bay-layout of rural houses in Northwest China.
Buildings 15 02867 g003
Figure 4. Basic space layout and its variants. Layout—(a), basic space layout; Layout—(b), Layout—(c), Layout—(d), Layout—(e) and Layout—(f), variants of the basic space layout. Note: MB—Master bedroom, SB—secondary bedroom, L—lounge, T—toilet, K—kitchen, St—storeroom.
Buildings 15 02867 g004
Figure 5. Tested building.
Buildings 15 02867 g005
Figure 6. Portable weather station.
Buildings 15 02867 g006
Figure 7. Comparison of the simulated numerical values with the measured values.
Buildings 15 02867 g007
Figure 8. The heating energy demand per unit floor area in January. (a) For multiple heated rooms under different layouts across cities; (b) For room L under different layouts across cities. a–f mean 6 layouts.
Buildings 15 02867 g008
Figure 9. RES of heating room relocation under different exterior wall U values in different cities; RES means relative energy saving rate. RESWM, RESEM and RESWE mean the relative energy saving rates of the heated room from the west side to the center, from the east side to the center, and from the west side to the east side, respectively. The same below. T1, T2 and T3 mean the three types of exterior wall U values, as shown in Table 2.
Buildings 15 02867 g009
Figure 10. RES of heating room relocation under different BOs in different cities; SW−10, S and SE−10 mean the building orientations of 10° west of south, south and 10° east of south, respectively. The same below.
Buildings 15 02867 g010
Figure 11. RES of heating room relocation under different WWR in different cities; W-0.3, W-0.4, and W-0.5 mean the window-to-wall ratios of 0.3, 0.4, and 0.5, respectively. The same below.
Buildings 15 02867 g011
Figure 12. RES of heating room relocation under different BH in different cities; H-3, H-3.3, and H-3.6 mean the building heights of 3, 3.3 and 3.6 m, respectively. The same below.
Buildings 15 02867 g012
Figure 13. The trend of MD under different meteorological and design parameters in different cities; MD means the maximum differences in energy consumption. (a) the trend of MD under different exterior wall U values in different cities; (b) the trend of MD under different BOs in different cities; (c) the trend of MD under different WWR in different cities; (d) the trend of MD under different BH in different cities.
Buildings 15 02867 g013
Figure 14. The flowchart for decision-making on the location of heated rooms in Northwest China.
Buildings 15 02867 g014
Table 1. Dimensions of L, MB and K.
LMBK
Width × depth/m4.7 × 7.24.2 × 5.44.2 × 2.7
area/m233.822.711.4
Table 2. The U values of 3 types of exterior wall and other main building envelope W/(m2·K).
TypeExterior WallInternal WallRoofFloorWindow
T11.551.750.450.252
T20.51.750.450.252
T30.251.750.450.252
Table 3. Major meteorological parameters of Lhasa, Xi’an, Tuotuohe, Altay.
CityTe (°C)Idn (W/m2)Tsa (°C)
TsarTsasTsaeTsawTsan△Tsa
Lhasa−2.6232.27−2.80.8−1.7−2.9−3.9−1.2
Xi’an−0.460.61−2.8−0.4−1.7−1.2−1.80.5
Tuotuohe−15.8198.39−16.4−12.7−15.6−16−17.1−0.4
Altay−15.276.49−17.3−14.4−15.9−16.1−16.4−0.2
Table 4. The layouts before (B) and after (A) the position change of each heated room.
WMEMWE
RoomBABABA
Lcadbcd
MBacbdab
Kbeafba
Table 5. The layout with maximum and minimum energy consumption in different climate conditions and design parameters.
LhasaXi’anTuotuoheAltay
MinMaxMinMaxMinMaxMinMax
Typical valuebecfdece
T1beafbebf
T3decfdecf
SW-10decfdede
SE-10afcfcfcf
D-0.3decfdecf
D-0.5becfdecf
H-3/H-3.6becfdece
The typical values were as follows: the exterior wall U value was T2, the BO was south, the WWR was 0.4, and the BH was 3.3 m.
Table 6. Correlation coefficients between meteorological parameters and RES and MD. (** indicates p < 0.01).
RESWMRESEMRESWEMD
Te0.4200.5080.0900.418
Idn0.763 **0.724 **0.809 **0.794 **
ΔTsa−0.847 **−0.791 **−0.952 **−0.875 **
Table 7. Contribution rate of each influencing factor.
Contribution Rate (%)Meteorological ParametersDesign Parameters
Idn ΔTsaTeWWRUBOBH
RESWM17.2818.338.881.3321.30−0.99−1.58
RESEM18.6516.279.224.5022.80−0.44−2.59
RESWE19.3817.9012.83−2.040.689.09−0.44
MD19.3017.818.023.8312.82−2.39−1.00
Note: Negative values indicate no contribution.
Disclaimer/Publisher’s Note: The statements, opinions and data contained in all publications are solely those of the individual author(s) and contributor(s) and not of MDPI and/or the editor(s). MDPI and/or the editor(s) disclaim responsibility for any injury to people or property resulting from any ideas, methods, instructions or products referred to in the content.