Article

Research on Vehicle–Bridge-Coupled Vibration of Multi-Tower High-Pier Partially Cable-Stayed Bridge Based on a Single Vehicle

1
School of Highway Engineering, Chang’an University, Xi’an 710064, China
2
Key Laboratory of Transport Industry of Bridge Detection Reinforcement Technology, Chang’an University, Xi’an 710064, China
3
China Design Group Co., Ltd., Nanjing 210014, China
*
Author to whom correspondence should be addressed.
Buildings 2025, 15(16), 2865; https://doi.org/10.3390/buildings15162865
Submission received: 28 June 2025 / Revised: 1 August 2025 / Accepted: 10 August 2025 / Published: 13 August 2025

Abstract

High-pier partially cable-stayed bridges, with their significant pier heights and relatively low structural stiffness and stability, experience pronounced vehicle–bridge coupling effects during vehicle transit, influencing their dynamic response and safety. This study developed a co-simulation analysis program using easy language and ANSYS to investigate the dynamic behavior of a prestressed concrete five-tower partially cable-stayed bridge under vehicle–bridge interaction, considering factors such as vehicle speed, bridge deck grade, and cable force. The research findings indicate that a reduction in bridge deck grade leads to increases in peak dynamic responses and impact factors, with the dynamic amplification factor showing a deteriorating trend across all cross-sections. Structural responses fluctuate with vehicle speed and exhibit sensitivity to speed variations, with the maximum response observed at a speed of 80 km/h. Adjusting cable forces can reduce the impact factor: a 5% change in cable tension causes the mid-span impact factor to drop sharply from 0.38 to 0.04, a substantial decrease of 89.5%. The structural system can exert an impact on the impact factor by as much as several times: while the dynamic displacement and bending moment of the fixed system are smaller than those of the continuous beam system, its impact factor is as high as 4.22 times that of the continuous beam system. Additionally, dynamic responses are closely related to the position of the fixed bearing, with responses near the fixed bearing being reduced. Notably, the maximum impact factors of critical sections all exceed the 0.05 limit specified in the code for this type of bridge, with values of 0.54 at the mid-span, 0.91 at the pier top, and 0.43 at the tower top anchor zone. This indicates that the provisions regarding dynamic amplification factors in the current code are inappropriate for such bridges. The difference in impact factors between bridge components can reach 2.12 times, this indicates that specific impact factors should be assigned to individual components to achieve an optimal balance between safety and economic performance.

1. Introduction

Partially cable-stayed bridges are a unique type of bridge structure that lies between conventional cable-stayed bridges and continuous beam bridges. Compared to continuous beam bridges, partially cable-stayed bridges are equipped with bridge towers and stay cables, where the stay cables assist the main beam in load-bearing, resulting in lighter and thinner main beams. In contrast to conventional cable-stayed bridges, partially cable-stayed bridges typically feature a sparse cable configuration, with smaller angles between the stay cables and the main beam. Consequently, the stay cables can only support a limited portion of the vertical load, leaving the majority of the load to be borne by the main beam. This results in relatively high stiffness in the main beam, giving partially cable-stayed bridges mechanical characteristics distinct from those of conventional cable-stayed bridges. Due to their favorable stress performance, economic efficiency, and esthetic advantages, partial cable-stayed bridges have been increasingly adopted in both domestic and international projects in recent years [1,2,3]. However, with the continuous growth of traffic flow, the interaction between vehicles and bridges—referred to as the vehicle–bridge coupling effect—has become more pronounced, leading to increasingly prominent vibration issues in bridge structures [4,5].
To investigate the vehicle–bridge coupling effects on cable-stayed bridges, numerous studies have been conducted both domestically and internationally. Lei et al. [6] examined a 400 m main-span sea-crossing cable-stayed bridge, analyzing vehicle–bridge-coupled vibration under the combined effects of wave and seismic motion parameters at the bridge site. Li et al. [7] studied the influence of geometric nonlinearity, train speed, and other factors on the dynamic response and driving safety of a cable-stayed bridge system, using a kilometer-long cable-stayed bridge as the engineering background. Lu et al. [8] conducted a comparative analysis of static effects and coupled dynamic responses of cable-stayed bridges under different parameters, focusing on the influence of vehicle loads and train speeds under overloaded transport conditions on cable stress and amplitude variations. Zhai et al. [9] utilized BP neural networks to approximate and fit the coupled vibration responses of long-span cable-stayed bridges, providing explicit expressions of complex finite element analysis results for use in coupled vibration analysis. Lei et al. [10] employed spectral methods to generate spatially correlated seismic motion inputs using a self-developed simulation program. Based on a steel truss cable-stayed bridge, they systematically studied the effects of traveling wave, site, and incoherence effects on the bridge system’s dynamic response.
Additional studies have focused on other aspects of vehicle–bridge interactions. Chen et al. [11] analyzed the coupled dynamic model of metro vehicles and large-span cable-suspended bridges with elastic wheels under combined long- and short-wave irregular excitations, evaluating the damping effects from time-frequency domain perspectives. Li et al. [12] performed moving load time history analyses of train passage loads on a special bridge, investigating the dynamic responses of the main beam, bridge towers, and stay cables under various conditions. Wang et al. [13] established a model of a double-tower partial cable-stayed bridge, solved the coupled vibration equations, and determined the dynamic responses and impact factors under varying vehicle speeds and road surface roughness. Sun et al. [14] studied the influence of initial bridge deck deformation under combined long- and short-wave irregularities and temperature loads. They analyzed the natural vibration characteristics of the bridge and evaluated the dynamic response during train passage at different speeds. Lin et al. [15] used probabilistic statistical methods to investigate the distribution of impact factors for displacements, bending moments, and shear forces in four railway extradosed cable-stayed bridges. They derived an expression for impact factors considering bridge span, train speed, natural frequency, and track irregularities, addressing the lack of specific formulas for impact factors in existing norms for low-tower cable-stayed bridges. Li et al. [16] emphasizes the importance of considering 3D vehicle models in VBI simulations, especially for bridges with poor road conditions. Zhu et al. [17] studies the influence of the dynamics of the complex vehicle–bridge–wind-wave system on vehicle–bridge coupling. The results show that wind load is the main dynamic response factor for vehicles and bridges, while the load effect of waves is negligible. Zhou et al. [18] proposes a co-simulation method to study the dynamic response of the straddle-type monorail VBI system, in which various factors can be easily considered. Wang et al. [19] studies the influence of steel fiber distribution on the mechanical properties of UHPC in vehicle–bridge-coupled vibration, which is beneficial to the design and application of UHPC in actual construction sites. Montenegro et al. [20] proposes a numerical evaluation method for bridge IM. Compared with the predefined factors in design specifications, it has more advantages in probabilistic numerical evaluation.
In summary, existing research on vehicle–bridge coupling of cable-stayed bridges has mostly focused on double-tower low-pier systems. However, the engineering case studied in this paper is a prestressed concrete five-tower partially cable-stayed bridge with piers as high as 140 m (For stiffness changes caused by high piers, see the Appendix A for details), which belongs to a rare multi-tower high-pier partially cable-stayed bridge structure. Compared with double-tower cable-stayed bridges, the intermediate towers of multi-tower cable-stayed bridges lack longitudinal constraints from symmetric anchor cables, resulting in a significant reduction in overall structural stiffness; specifically, compared with the five-tower cable-stayed bridge, the vertical deflection of the main girder of the six-tower cable-stayed bridge increases by approximately 19.5% [21]. This unique mechanical property may induce more complex vehicle–bridge coupling dynamic response mechanisms. Currently, research on vehicle–bridge coupling dynamic analysis of high-pier multi-tower (especially five-tower) partially cable-stayed bridges is relatively scarce, and existing literature has not fully explored the structural system characteristics of such bridges and the impact of cable forces on vehicle–bridge coupling responses. In view of this, this study establishes a numerical model based on the actual project and conducts research on vehicle–bridge coupling vibrations by analyzing multiple factors such as vehicle speed, bridge deck slope, cable force, and structural system, aiming to clarify the dynamic responses of this special bridge type under vehicle–bridge coupling.

2. Theory of Vehicle–Bridge Coupling

2.1. Vehicle–Bridge Coupling Equation

In vehicle–bridge-coupled vibration analysis, the vehicle and the bridge are regarded as two vibration subsystems. The dynamic equations of the coupled vibration system are constructed using the displacement coordination conditions and the mechanical equations at the contact points [22]. The vibration equation of the bridge can be expressed as
M b Y ¨ b + K b Y b + C b Y ˙ b = F b ,
where M b , C b , K b are the bridge modal mass matrix, damping matrix and stiffness matrix, respectively; and Y ¨ b , Y ˙ b , Y b , F b are the acceleration vector, velocity vector, displacement vector and external force vector of the bridge, respectively.
The vibration equation of the vehicle is
M v Y ¨ v + K v Y v + C v Y ˙ v = F v ,
where M v , C v , K v are the mass matrix, damping matrix and stiffness matrix of the vehicle model, respectively; and Y ¨ v , Y ˙ v , Y v , F v are the acceleration vector, velocity vector, displacement vector and external force vector of the vehicle model, respectively.

2.2. Equation Solving and Convergence Control and Algorithm Flow Chart

The coupled system of equations is solved iteratively based on the Newmark-β method, with displacement coordination and contact forces of opposite direction and equal magnitude taken as the coupling condition. During the computational process, displacement convergence is controlled, and the convergence conditions are defined as follows:
Z t + Δ t Z t Z t ξ ,
where Z t + Δ t and Z t are the displacement values of the contact point between the bridge and the vehicle at times t and t + Δ t, respectively; and ξ is the convergence control index, which is taken as 0.01.
The flowchart (Figure 1) of the coupling algorithm is as follows.

2.3. Dynamic Amplification Factor and Impact Factor

To effectively evaluate vehicle–bridge coupling, the dynamic amplification factor (DAF) and impact factor (IM) are introduced. These factors account for the dynamic amplification effects caused by moving vehicles. The impact factor is defined as the ratio of the increment in the structural response due to the moving load to the static response, while the dynamic amplification factor is the ratio of the dynamic structural response to the static response [23,24]. Their calculation equations are
D A F = Y d max Y j max ,
I M = Y d max Y j max Y j max ,
where DAF is the dynamic amplification factor; IM is the impact factor; and Y d max and Y j max are the maximum dynamic and static responses of the bridge structure due to vehicle loads, respectively.

2.4. Bridge Deck Grade

According to the mechanical vibration road surface profile reporting of measured data [25], the road surface roughness determined from the power spectral density can be expressed as
G d ( n ) = G d ( n 0 ) ( n / n 0 ) w ( n l < n < n u ) ,
where n 0 is the reference spatial frequency, set at 0.1 cycles per meter; n is the spatial frequency; n l and n u are the lower and upper limits of the frequency, respectively; w is the frequency exponent, with a value of 2; G d ( n ) is the road surface roughness coefficient; and G d ( n 0 ) is the power spectral density.
The Fourier transform of Equation (7) provides a model for roughness in the spatial domain, as shown in the following equation:
r ( x ) = k = 1 N 2 G d ( n m i d _ m ) Δ n cos ( 2 π n m i d _ m x + θ m ) ,
where r ( x ) is the elevation of road surface roughness, x is the longitudinal distance, Δ n = ( n u n l ) / N , n m i d _ m = n l + ( m 0.5 ) Δ n ; N is taken as a relatively large value, and m is a positive integer between 1 and N ; and θ m is uniformly distributed between 1 and 2 π .
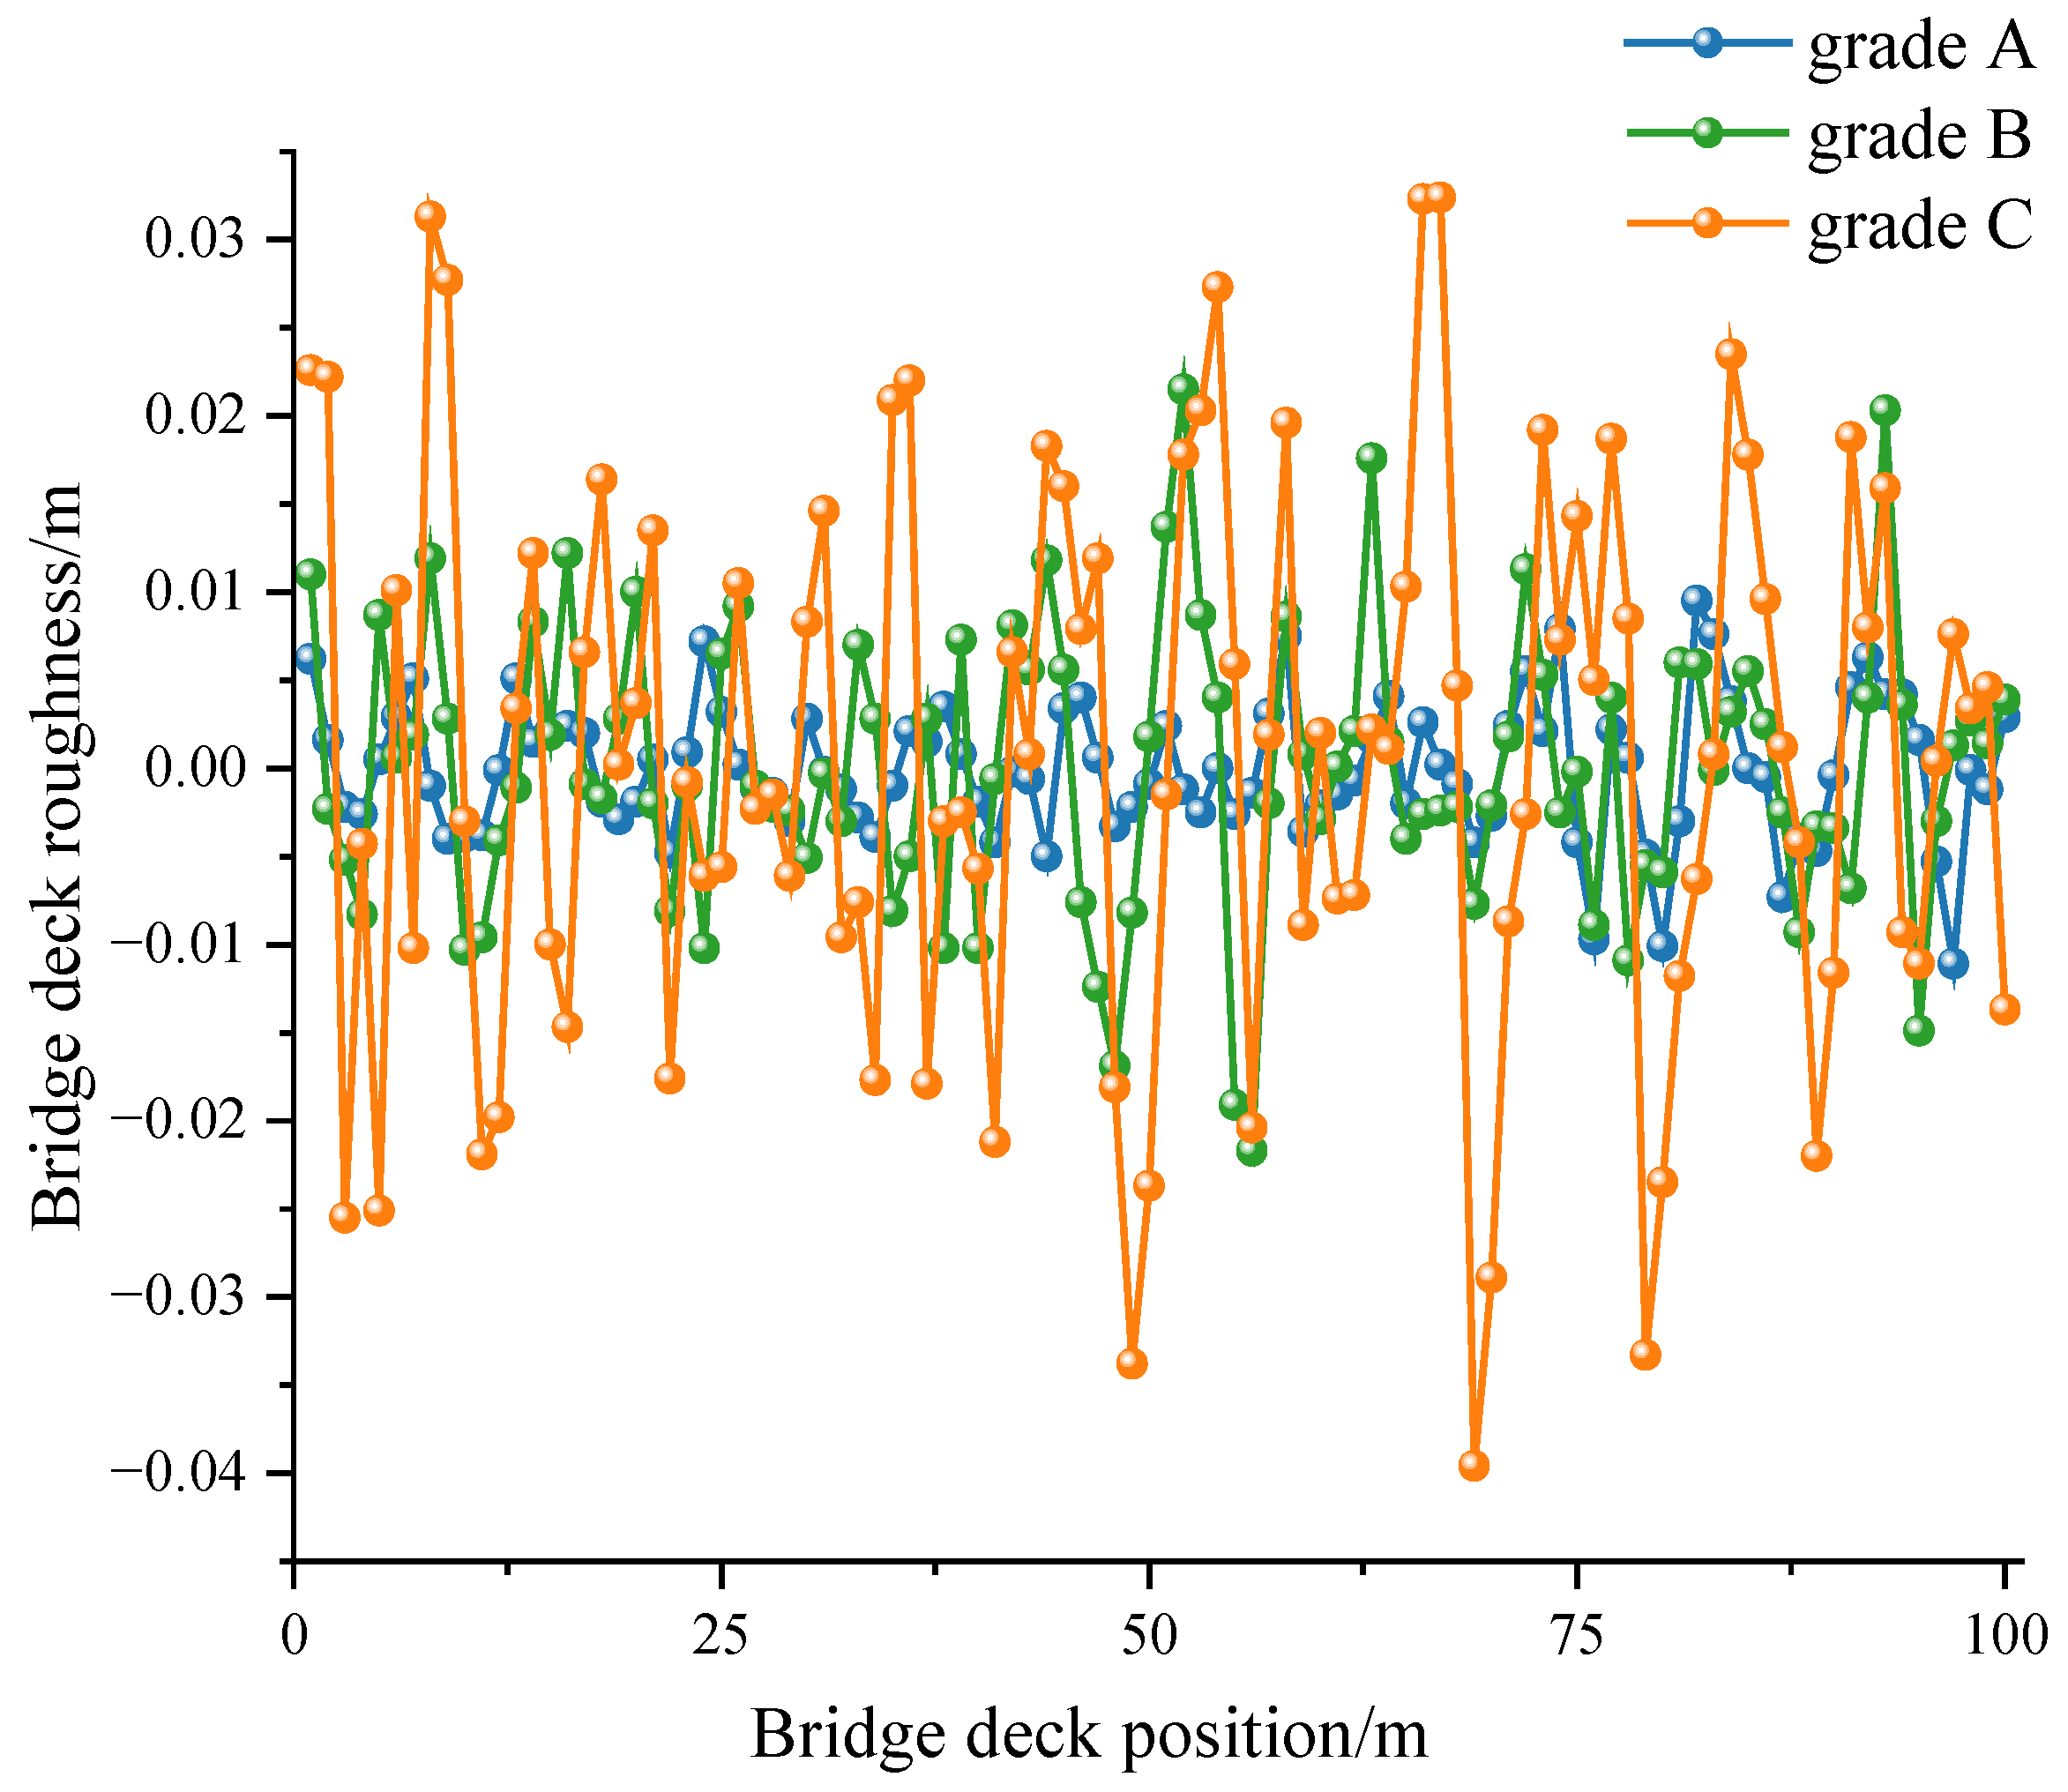
The international standard ISO-8608:2016 [26] categorizes road roughness into eight grades (A through H), with grade H being the lowest. This study focuses on highway bridges, where road grade and maintenance requirements are higher. Consequently, C-grade road roughness is selected as the most unfavorable condition. Using MATLAB R2021a and the Fourier inverse transform method, different road roughness profiles were simulated. The sample curves of bridge deck roughness for grades A through C are shown in Figure 2.

3. Modeling

3.1. Project-Based Modeling

This study is based on a real-world project of a prestressed concrete five-tower partially cable-stayed bridge with a total length of 1170 m and a span arrangement of (125 + 4 × 230 + 125) m. The structural system adopts a rigid connection configuration between the towers, piers, and beams. The height of the towers above the bridge deck is 36 m, while the pier heights are 114 m (Pier 10), 144 m (Pier 11), 142 m (Pier 12), 140 m (Pier 13), and 120 m (Pier 14). The cable-stay system features a central double-cable plane, with cables arranged in double rows within the central divider of the main beam. The no-cable zones are distributed as follows: 90 m on both sides of the tower roots, 28 m in the middle span, and 23.68 m in the side spans. The distance between cables is 4.0 m along the girder and 1.2 m along the tower. The overall arrangement of the main bridge is shown in Figure 3.
This paper establishes the bridge structure model using ANSYS 17.0. The main girder, main towers, and piers are simulated with BEAM189 elements—high-order 3D beam elements with three nodes per element; the material parameters are shown in Figure 1. Their formulation inherently accounts for vertical shear deformation and cross-sectional warping effects, making them suitable for capturing the mechanical behavior of flexural members under combined bending, shear, and torsion. The secondary dead load and cross beams are simulated using MASS21 elements, as they efficiently represent concentrated mass distribution without introducing additional stiffness, which is consistent with the characteristics of such components. For these elements, KEYOPT(3) = 0 is set to activate only translational mass, with the Z-direction mass specified as 1533.04 kN. Stay cables are simulated using LINK10 elements, with their material parameters detailed in Table 1. For these elements, KEYOPT(3) = 1 is configured to account for the sag effect.
Regarding boundary conditions: The bottom of the pier is subjected to fully fixed constraints, which are simulated using the D command to constrain all degrees of freedom. Rigid connections at the tower–pier beam-fixed nodes are achieved by constraining the corresponding degrees of freedom. The connection between the cables and the main tower is hinged, simulated by defining MPC184 with KEYOPT(1) = 2 to constrain translational degrees of freedom while releasing rotational degrees of freedom. The connection between the cables and the main girder is rigid; thus, MPC184 is defined with KEYOPT(1) = 0 to constrain all degrees of freedom, simulating a rigid connection and ensuring displacement coordination between the cable ends and the girder nodes. In the dynamic analysis, the Rayleigh damping ratio is assumed to be 3% (in accordance with Article 9.3.7 of the Code for Seismic Design of Highway Bridges (JTG/T 2231-01-2020 [27])). Based on the first- and second-order structural vibration frequencies, the mass-proportional damping coefficient α is approximately 0.0343, and the stiffness-proportional damping coefficient β is approximately 0.0234. Furthermore, the large deformation option is activated in the analysis settings to account for geometric nonlinearity—a critical consideration for long-span bridges, as their significant displacements can alter structural stiffness and internal force distribution. The finite element model of the bridge is shown in Figure 4.
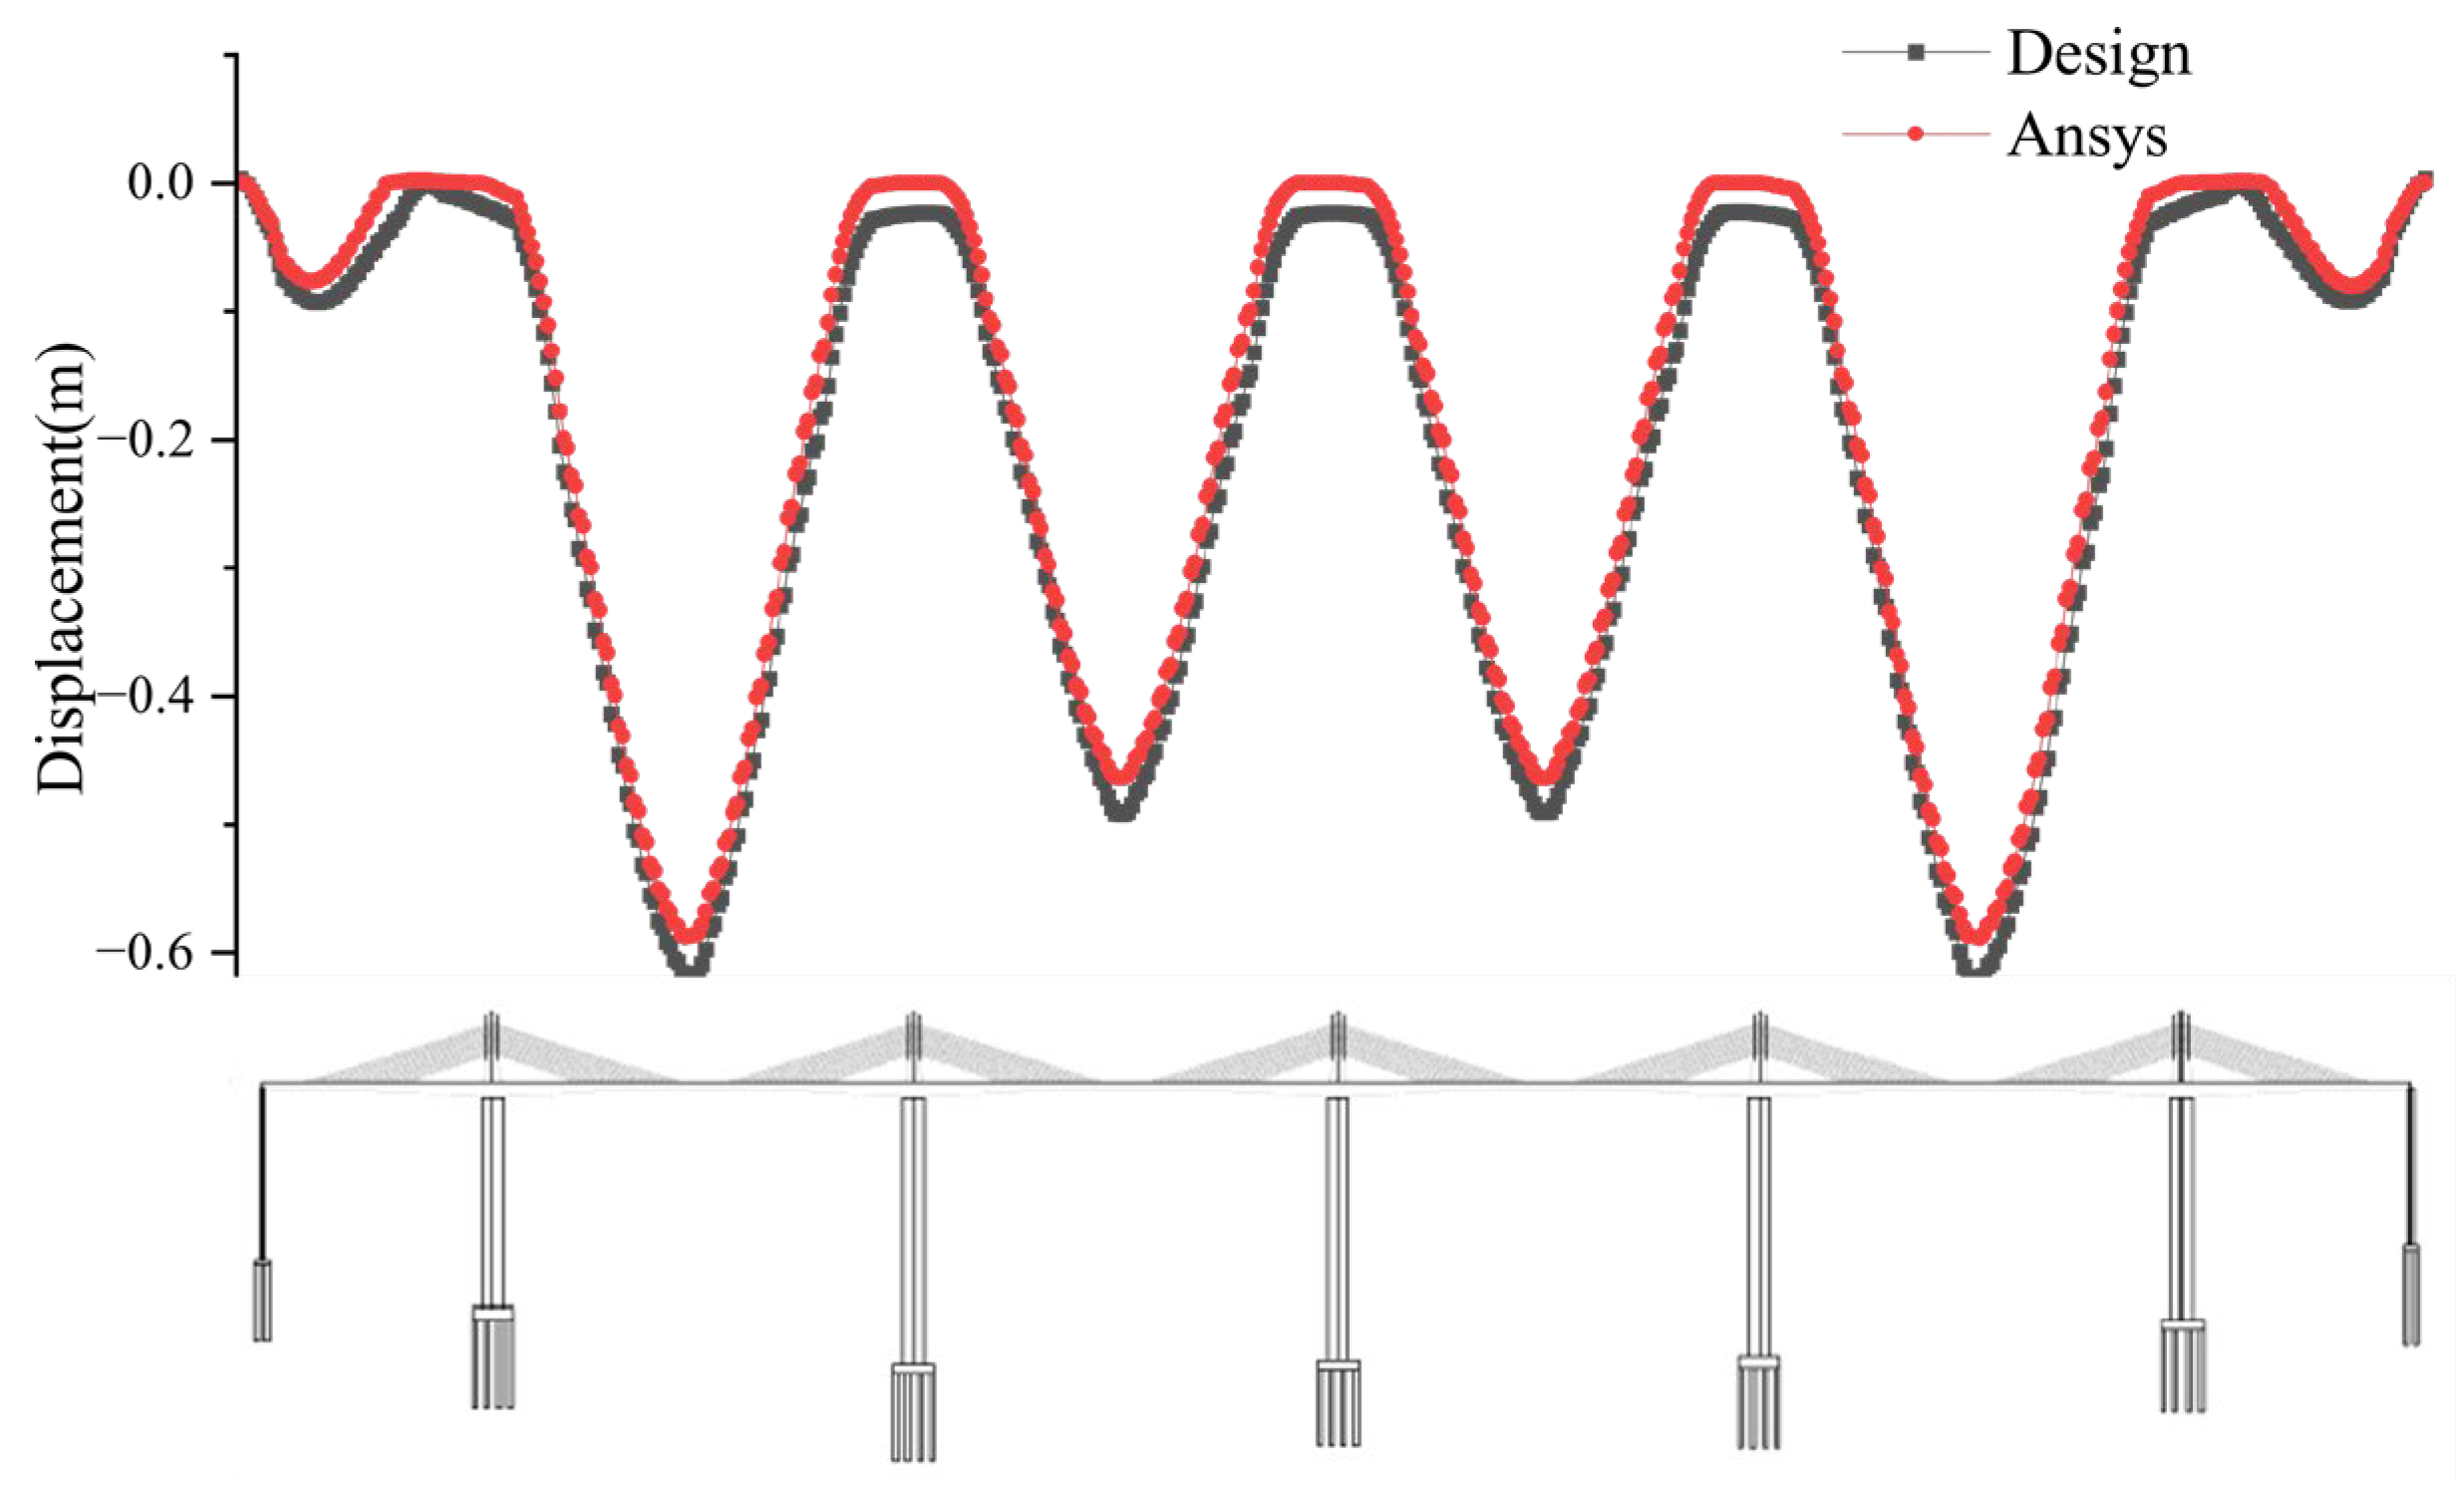
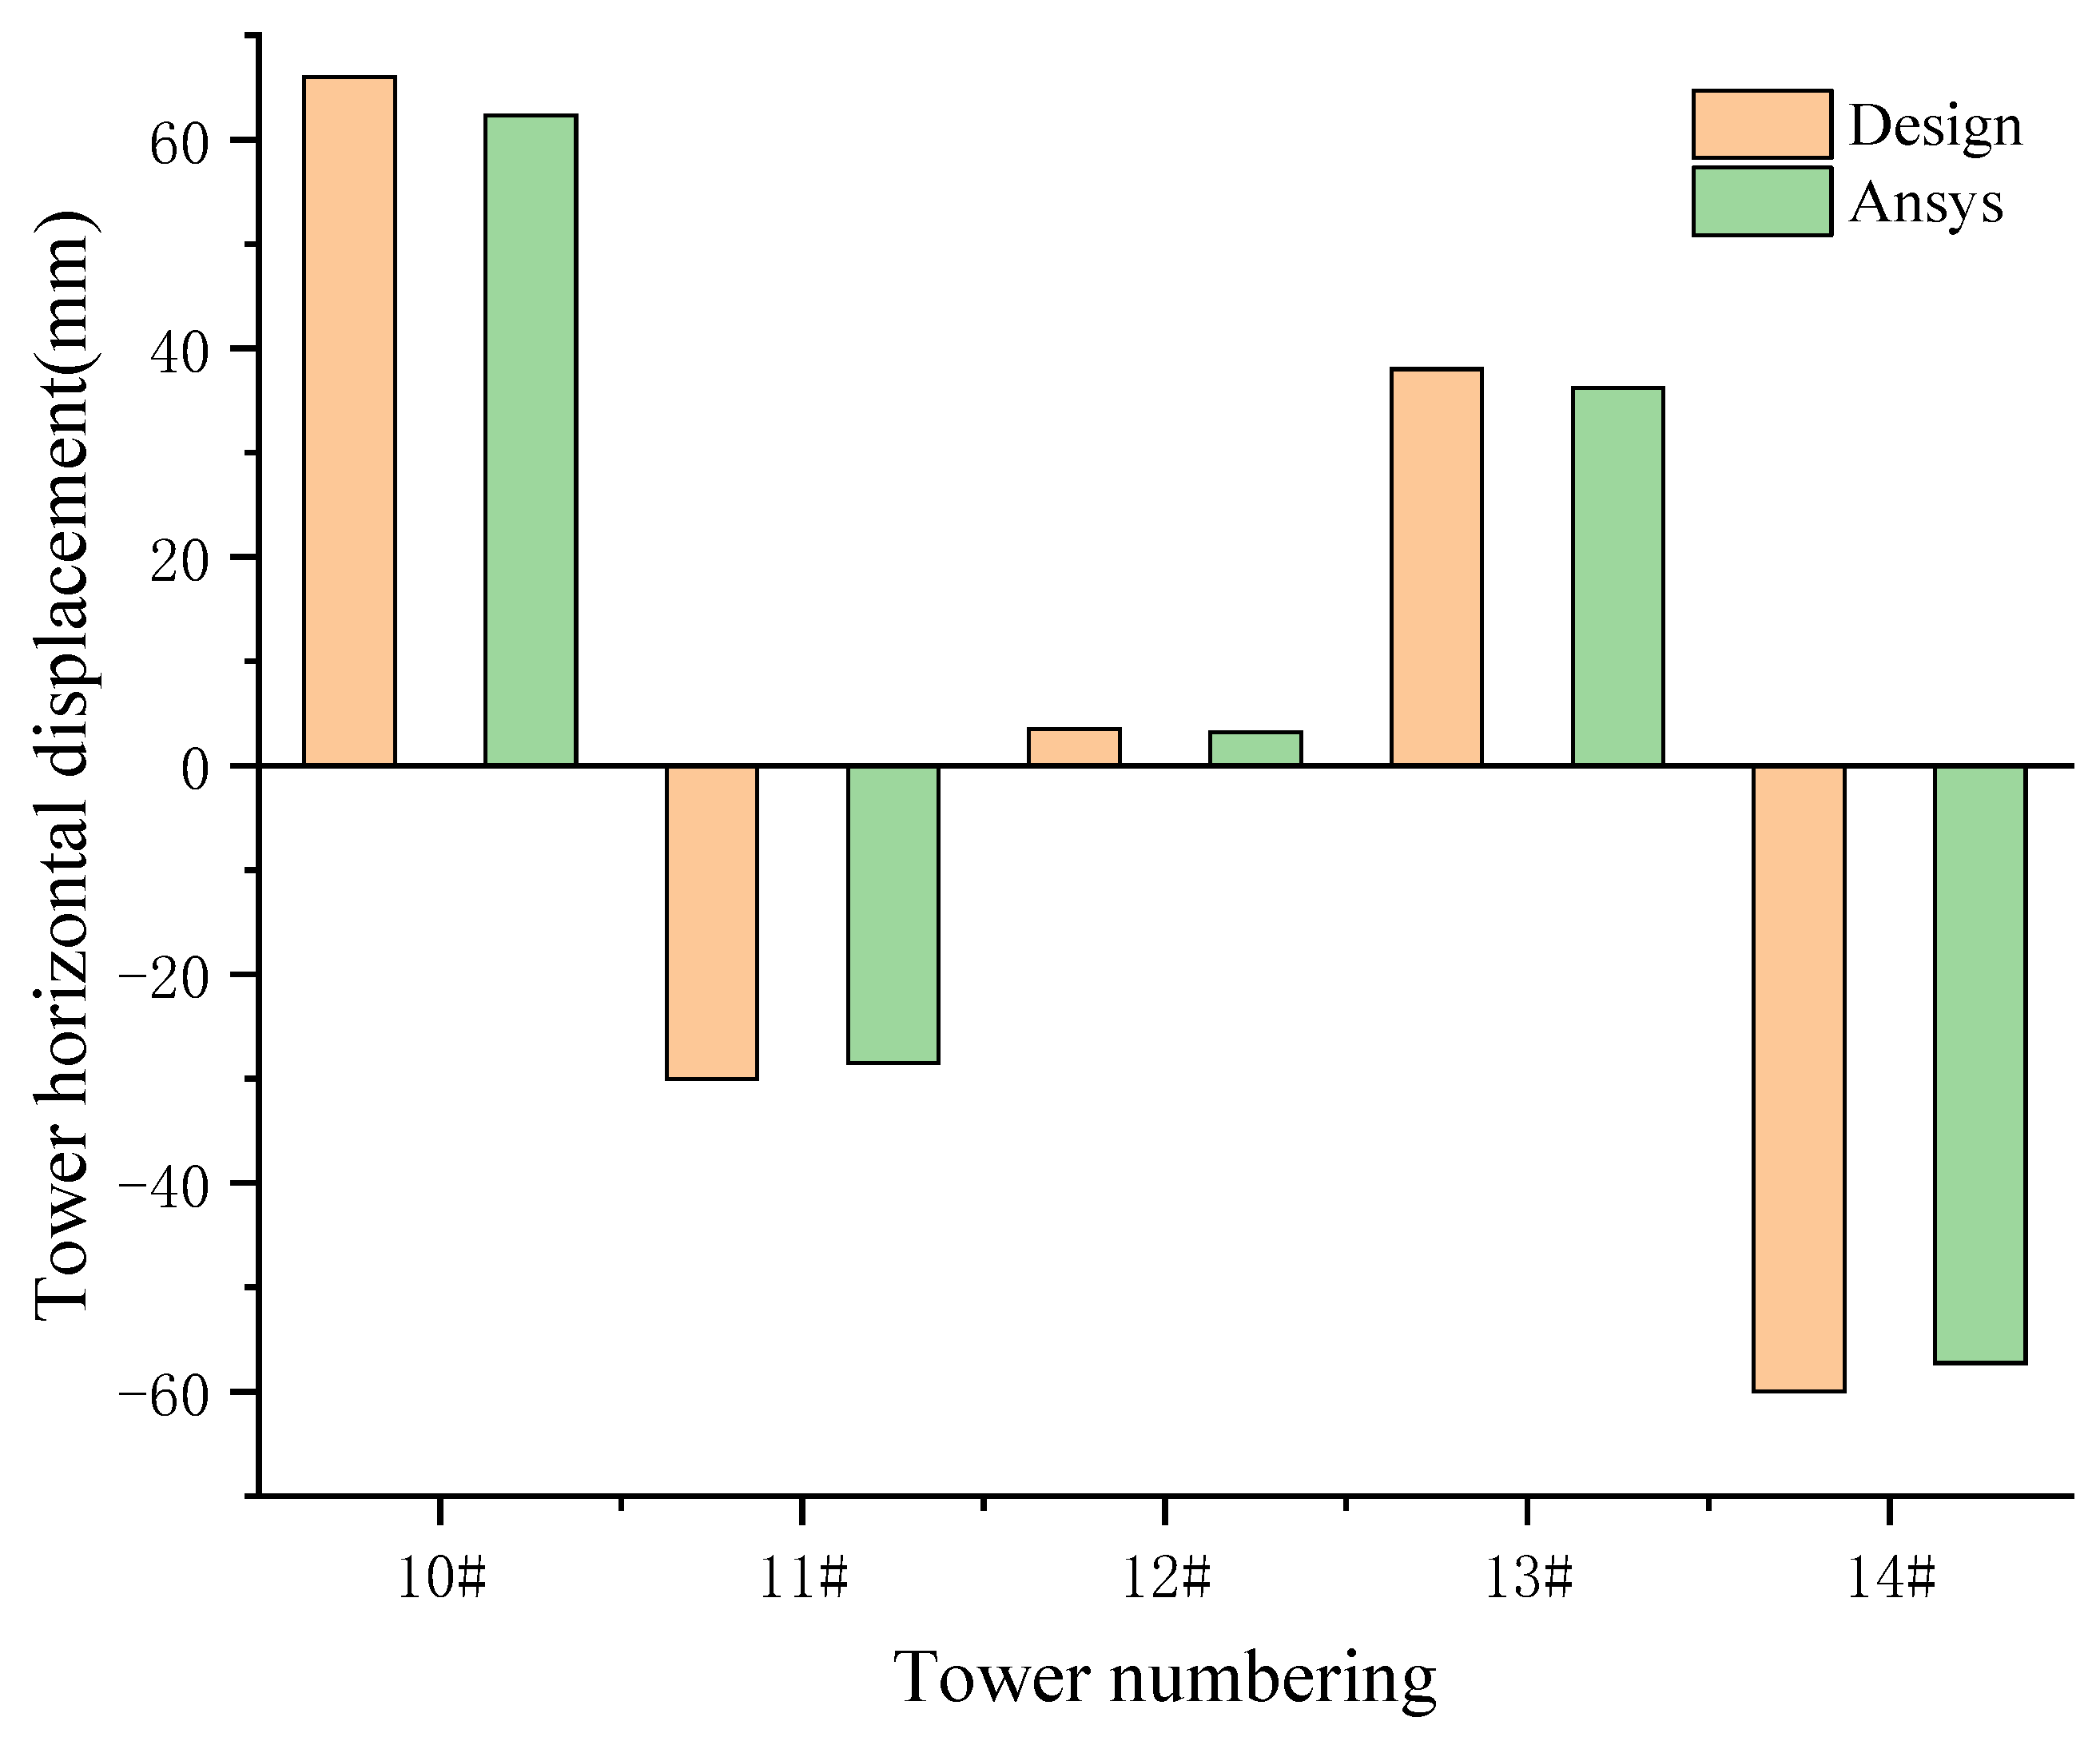
To ensure the accuracy of the ANSYS bridge model and its consistency with design results, we compared the model calculation data with the results from the design drawings using midas Civil 2023. We extracted and compared the displacement diagrams of the entire bridge and key components (i.e., the bridge towers) under dead load conditions, as shown in Figure 5 and Figure 6.
The results indicate that the deviation between the calculated values of our bridge model and the theoretical design values falls within the 5% engineering allowable range, verifying the calculation accuracy of the established ANSYS model. This verification provides a reliable basis for subsequent dynamic response analysis and offers solid validation evidence for the numerical method proposed in this study.

3.2. Vehicle Model

To accurately evaluate the excitation effects of vehicles on the bridge, a vehicle dynamic model suitable for vehicle–bridge-coupled vibration analysis was required. For this study, a three-axle heavy-duty vehicle—commonly used as a bridge load test vehicle in China—was selected [28]. The schematic diagram of the vehicle model is shown in Figure 7. The model includes the following components: m1m6, representing the masses of each wheel (including suspension); ku1–ku6 and kd1kd6, denoting the upper and lower spring stiffness for each wheel, respectively; Ic1 and Ic2, representing the longitudinal and lateral moments of inertia of the vehicle body; Cu1–Cu6 and Cd1Cd6, indicating the upper and lower spring damping coefficients for each wheel, respectively; mv, the mass of the vehicle body; Zv, the vertical displacement of the vehicle body; θv, the pitch angular displacement of the vehicle body; and φv, the roll angular displacement of the vehicle body.

4. Vehicle–Bridge Coupling Analysis

4.1. Natural Vibration Characteristics Analysis

According to JTG D60-2015 [29], the impact factor (IM) is related to the natural vibration characteristics of the bridge and is defined by the following conditions: when the natural frequency f ≤ 1.5 Hz, IM = 0.05; when 1.5 Hz < f ≤ 14 Hz, IM = 0.1767lnf − 0.0157; and when f > 14 Hz, IM = 0.45. For the bridge in this case study, the first ten natural vibration frequencies and their corresponding mode shapes are presented in Table 2.

4.2. Control Section Selection

According to research findings [30,31], there are certain differences in vulnerability among different components of cable-stayed bridges. Specifically, the probability of pier damage is relatively low; the mid-span of the main girder is subjected to the maximum force; the top of the bridge tower exhibits the largest displacement but the smallest bending moment; and compared with long cables, short cables experience more severe impact effects, higher dynamic fatigue risks, and more significant dynamic responses [32]. Based on these observations, the following control sections were selected for vehicle–bridge coupling vibration analysis: the mid-span section of each main girder span, the anchorage section at the top of the bridge tower, the top section of the pier, and a pair of long and short stay cables on each bridge tower. The positions of typical cross-sections are shown in Figure 8.
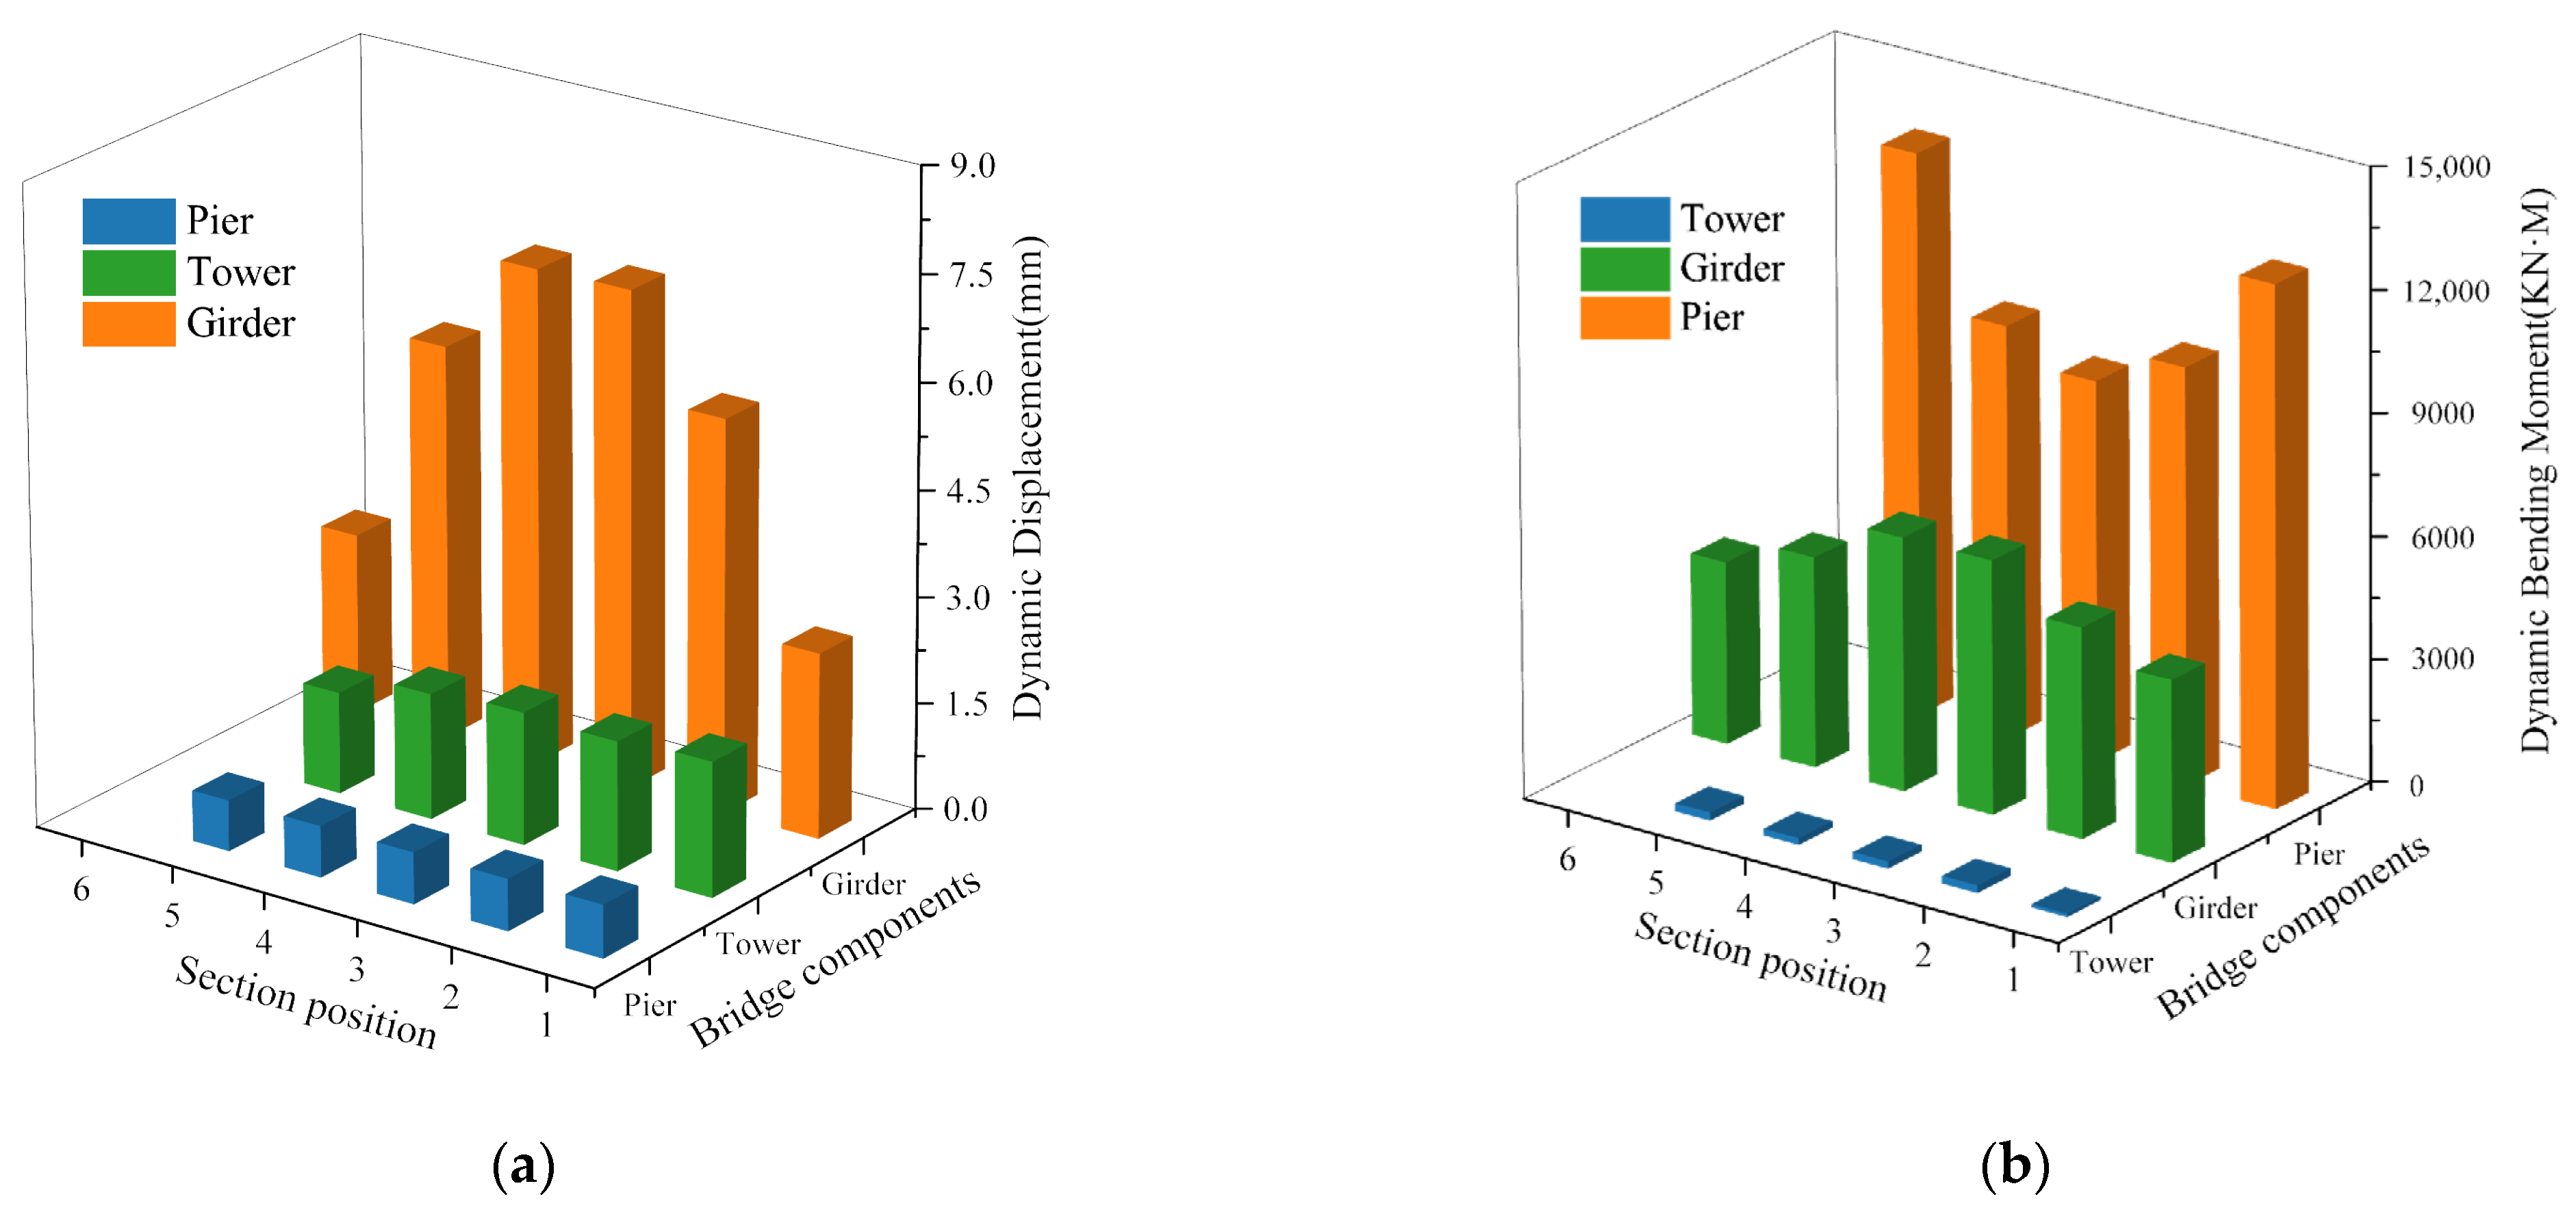
In vehicle–bridge coupling vibration research, although time history curves can intuitively present the dynamic response process, this paper involves a relatively large number of control sections. Considering space constraints and that the core information of time history curves is mainly reflected in extreme points (i.e., maximum values), the time history curves of each section are not listed. Instead, the maximum and minimum results of all-time history curves are summarized and analyzed. For this purpose, the working condition of a three-axle truck traveling at 80 km/h on a B-grade road surface is selected, and the results thus obtained finally form Figure 9 and Figure 10.
From Figure 9, several observations can be made regarding the dynamic responses of the bridge. The A3 section exhibits the highest dynamic response peaks and dynamic bending moment peaks. While the dynamic displacement peaks at each pier top section are very similar, the D5 section shows the largest dynamic bending moment peak. Among the tower sections, T1 has the largest dynamic displacement peak but the smallest dynamic bending moment peak, whereas T5 has the smallest dynamic displacement peak but the largest dynamic bending moment peak. The T2 section displays relatively large dynamic displacement and bending moment peaks. From Figure 10, it is observed that the maximum increment in cable force for all cables is 11.6 kN, compared to an initial tension of 4700 kN. The impact factor is exceptionally small at 0.0025, and thus, further discussion on cable force increment is omitted. The final selection of control sections is summarized in Table 3.

5. Vehicle–Bridge-Coupled Vibration Response Under Different Parameters

5.1. Effects of Different Vehicle Speeds

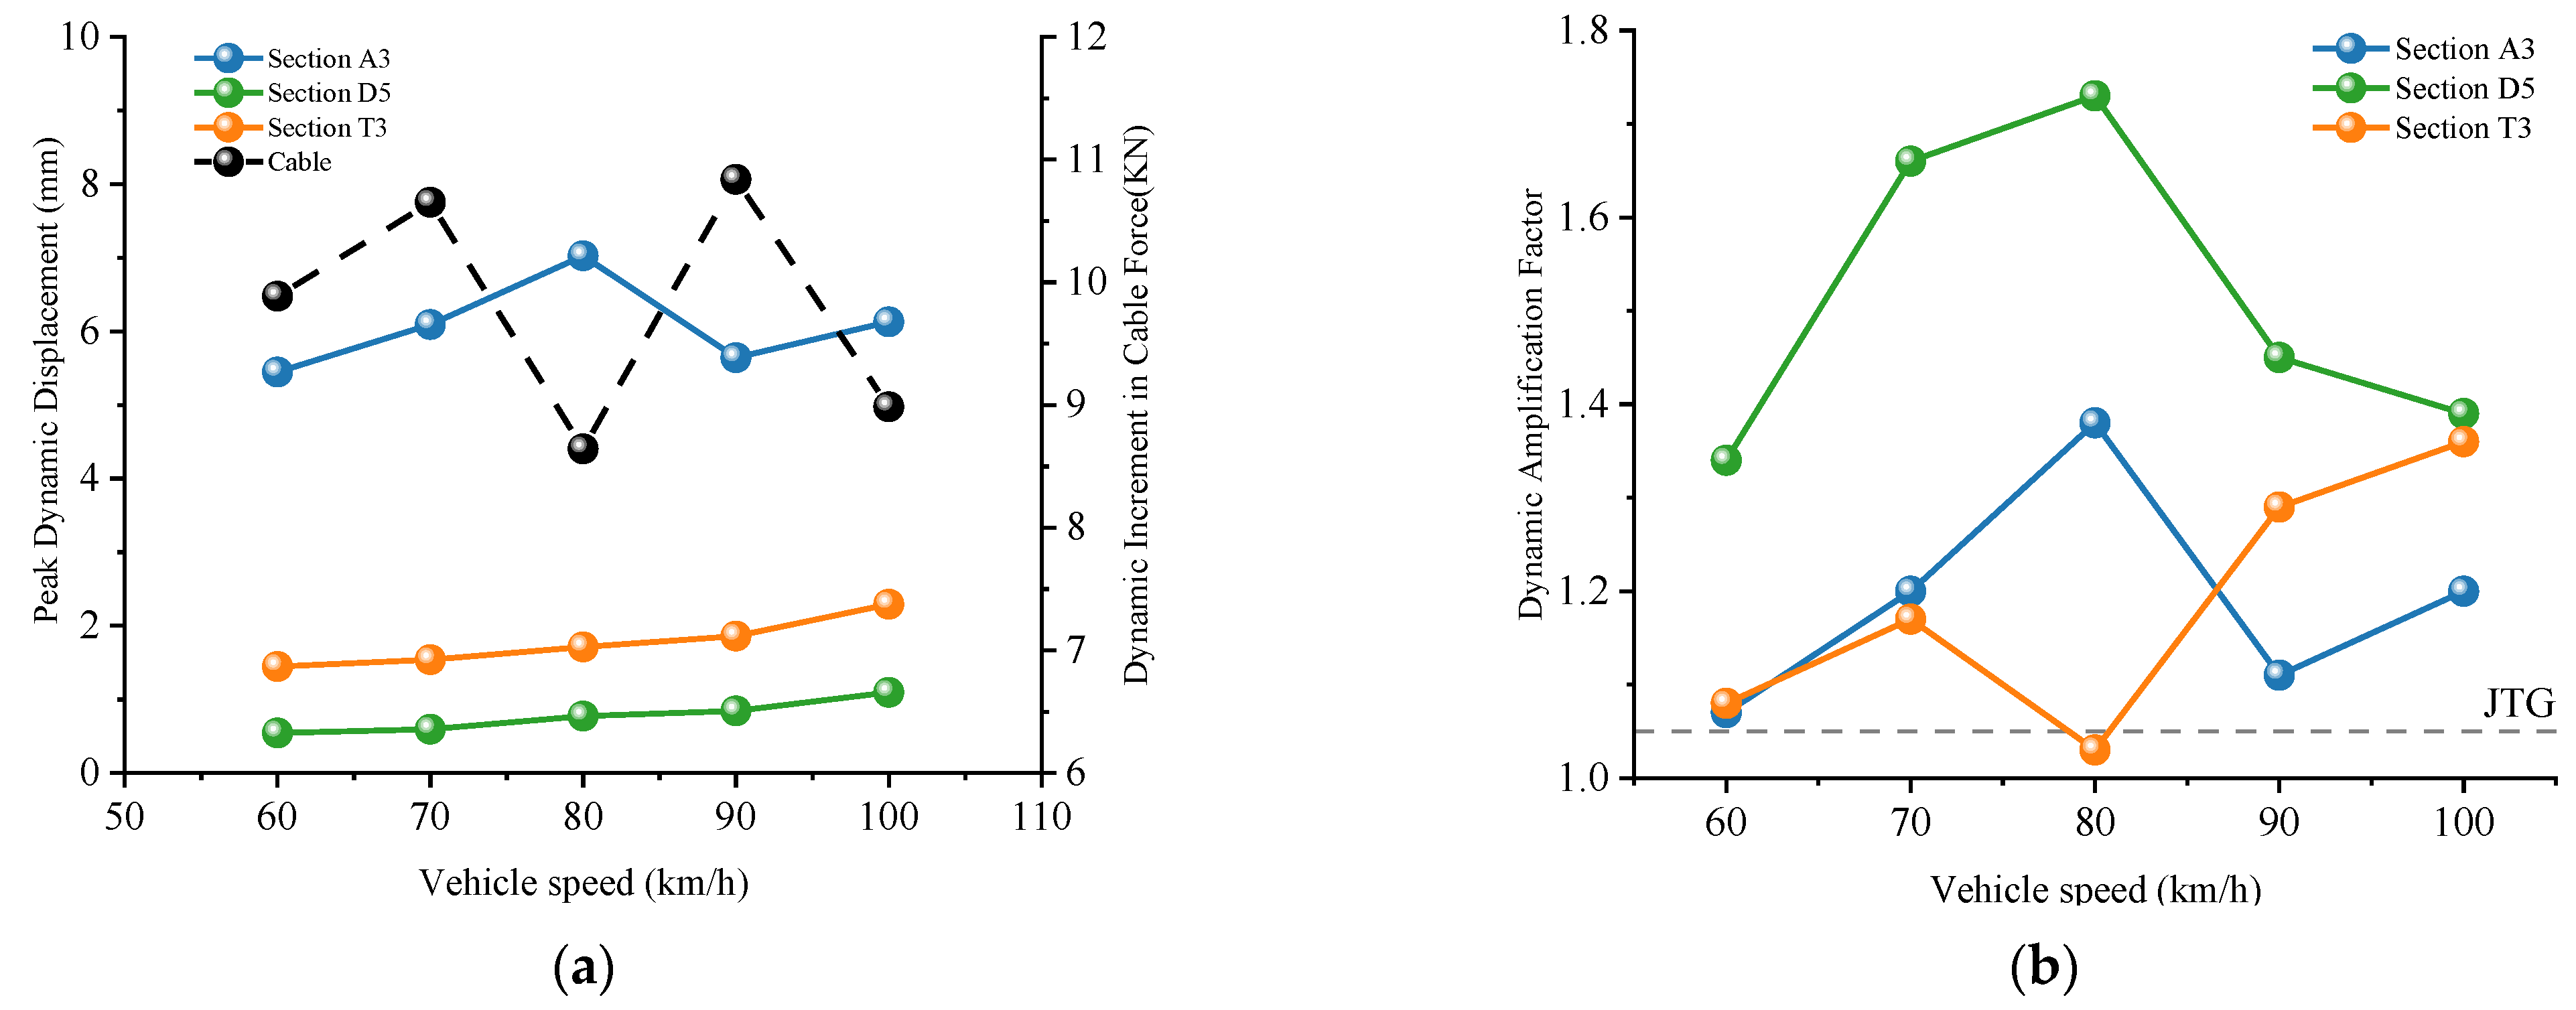
On highways, truck speeds typically range from 60 km/h to 100 km/h (The basis for selecting the vehicle speed is shown in Appendix B.1). This section investigates the influence of vehicle speed on vehicle–bridge-coupled vibrations. Using the single-variable control method, the road grade is maintained at B grade, the bridge system remains in a fixed state, and the cable forces are in a reasonable configuration. Vehicle speeds are varied from 60 km/h to 100 km/h in increments of 10 km/h, and the dynamic response values and dynamic amplification factors at each control section are calculated. The results are shown in Figure 11.
From Figure 11, several observations can be made regarding the effects of vehicle speed on dynamic responses. As vehicle speed increases, the dynamic displacement of each control section generally shows an upward trend, with the A3 section exhibiting the most prominent dynamic displacement response, significantly exceeding that of the D5 and T3 sections, and showing high sensitivity to a vehicle speed of 80 km/h. The dynamic increment of cable force fluctuates significantly with vehicle speed but does not exhibit a clear pattern. The impact factor can be affected several times by vehicle speed. At the T3 section, the impact factor reaches a minimum value of 0.03 at 80 km/h and a maximum value of 0.36 at 100 km/h, representing a 12-fold difference. For the dynamic amplification factor, the A3 and D5 sections achieve their maximum values at 80 km/h, while the T3 section records its minimum value. However, the overall changes in the dynamic amplification factor are complex and do not follow a clear pattern.

5.2. Effects of Bridge Deck Grade

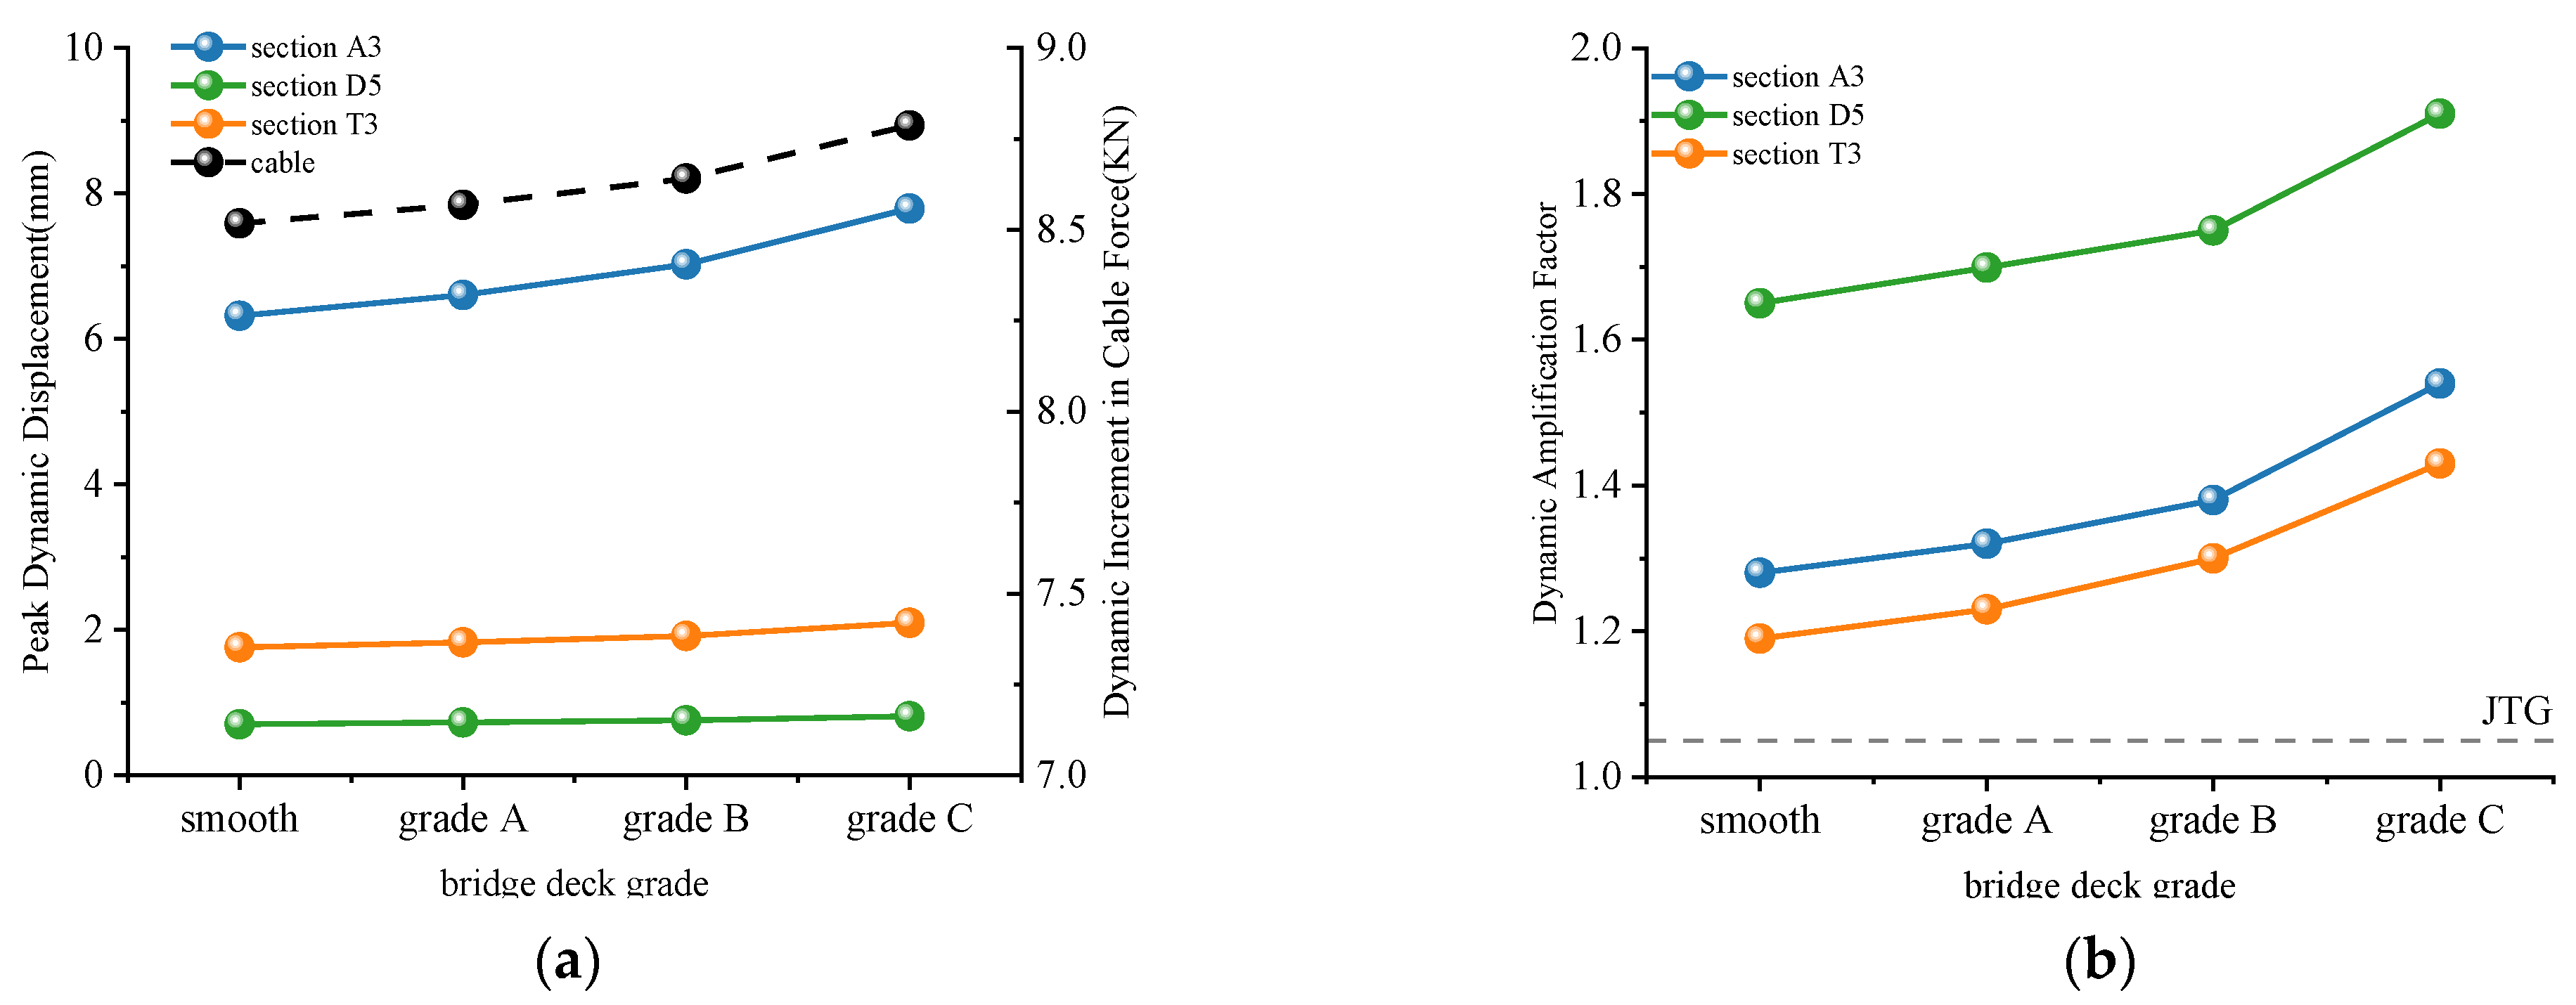
The bridge deck grade is one of the primary factors causing vehicle vibrations. Based on the standard “Mechanical Vibration Shock and Condition Monitoring. Mechanical Vibration Road Surface Profiles. Reporting of Measured Data” (GB/T 7031-2005 [25]), this section examines the influence of bridge deck grade on vehicle–bridge-coupled vibrations. Using the single-variable control method, the vehicle speed is fixed at 80 km/h, the bridge system remains in a fixed state, and the cable forces are set to their reasonably completed state. The dynamic response peaks and dynamic amplification factor at each section are calculated for four deck grades: smooth, grade A, grade B, and grade C. The results are illustrated in Figure 12.
From Figure 12, it can be observed that the peak dynamic displacement and dynamic amplification factor at each cross-section increase with the deterioration of the bridge deck grade. The minimum values occur for the smooth bridge deck, while the maximum values are observed for the C-grade bridge deck. Among the sections, the A3 section exhibits a significantly higher peak dynamic displacement compared to the D5 and T3 sections. However, in terms of the dynamic amplification factor, the D5 section is more prominent, with its value significantly exceeding that of the A3 and T3 sections.
A deeper analysis of the trends reveals that for the T3 section, the dynamic amplification factor increases by 0.04 when the bridge deck deteriorates from smooth to grade A. Further deterioration from grade A to grade B results in an increase to 0.07, and from grade B to grade C, the dynamic amplification factor increases even more significantly, reaching 0.13. This trend indicates that as the bridge deck condition worsens, the growth rate of the dynamic response and dynamic amplification factor intensifies. Therefore, strengthening the maintenance and management of the bridge deck is crucial to reducing the dynamic impact on the bridge structure caused by moving vehicles. Ensuring a well-maintained bridge deck is essential for safeguarding the structural safety of the bridge.

5.3. Effects of Cable Force

During the service life of a cable-stayed bridge, cable forces fluctuate due to vehicle loads, wind loads, and other external factors, which can influence vehicle–bridge coupling vibrations. Compared to conventional cable-stayed bridges, partially cable-stayed bridges have stiffer main girders and lower cable tension, resulting in smaller variations in mobile load effects. This section examines the impact of varying cable forces on vehicle–bridge-coupled vibrations.
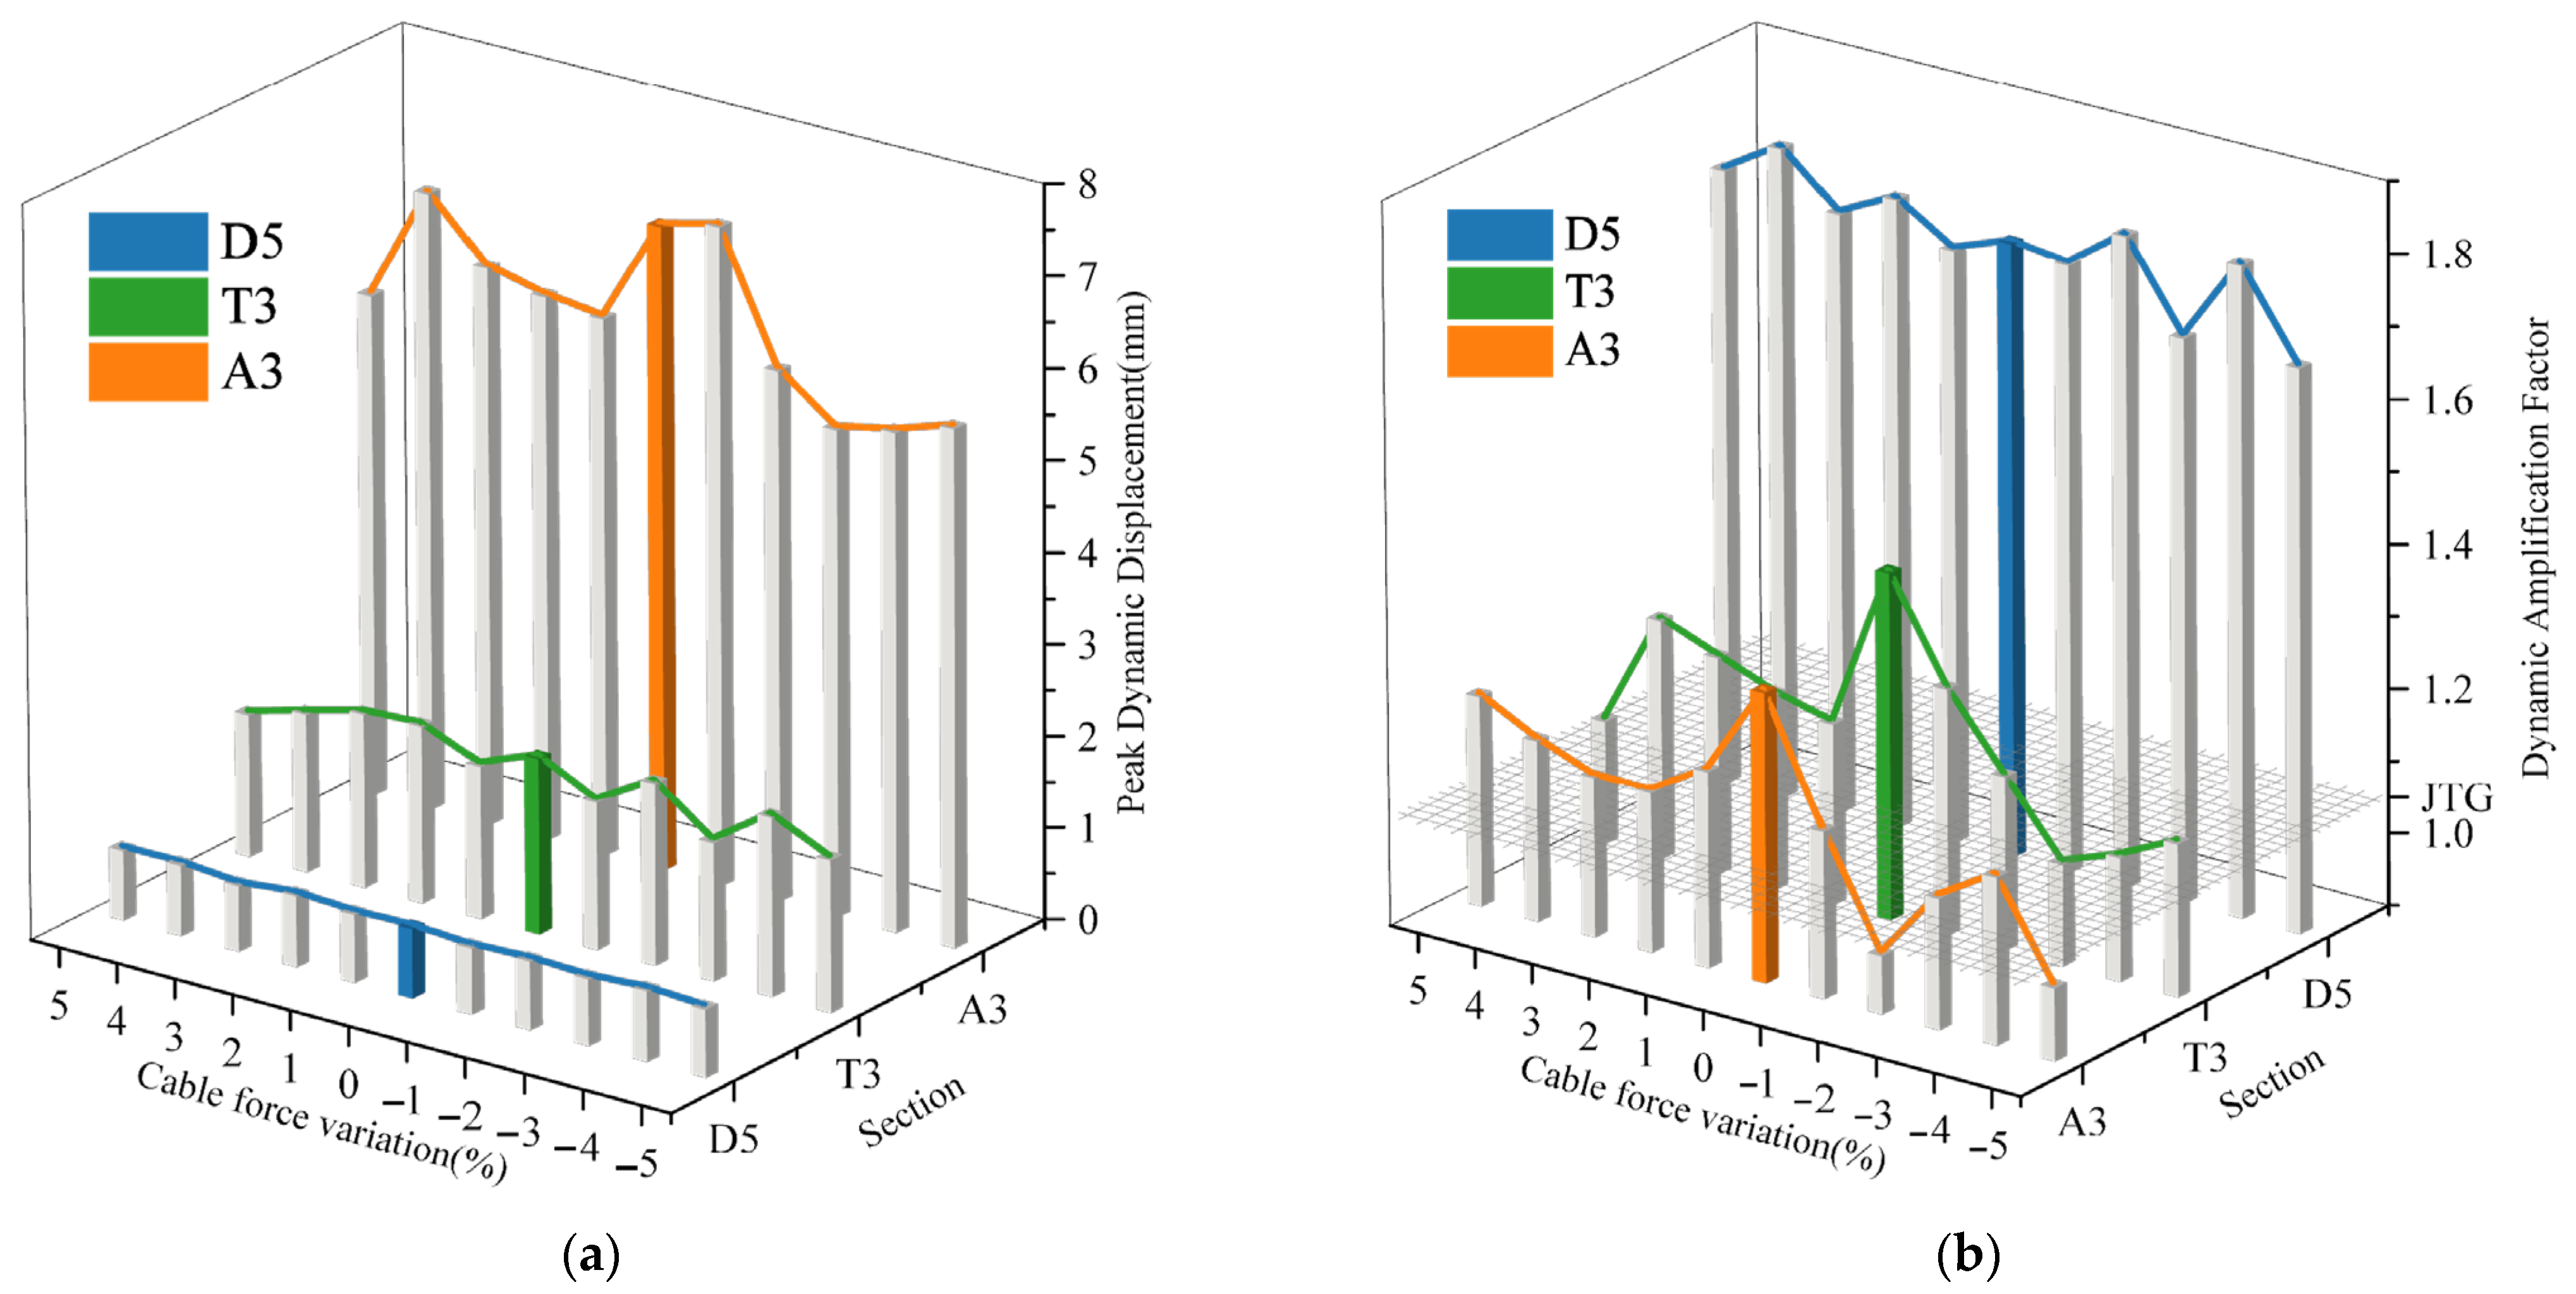
In the analysis, the bridge deck grade is maintained at the B level, the vehicle speed is set to 80 km/h, and the bridge system remains in a fixed state. Cable forces are adjusted by ±5% of the initial tension (47 kN) in 1% increments (The basis for selecting the ±5% cable force is shown in Appendix B.2). The dynamic response peaks and dynamic amplification factors at each section are calculated for vehicles passing through bridges with varying cable forces. The results are presented in Figure 10.
From Figure 13, it can be observed that the dynamic response and dynamic amplification factor fluctuate around their corresponding values for the original cable force when the cable force is adjusted. In most cases, the peak dynamic response and dynamic amplification factor are reduced compared to the original cable force condition. For peak dynamic displacements, the A3, D5, and T3 sections achieve maximum values after the cable force adjustment, which are 2.2%, 2.4%, and 3.3% higher than their original values, respectively. In contrast, the minimum dynamic displacements for A3, D5, and T3 sections are 24.4%, 5.7%, and 21.7% smaller than their original values, indicating a more significant decreasing trend. Regarding the dynamic amplification factor, the A3 and T3 sections achieve their maximum values under the original cable force condition, which are 32.7% and 32.6% higher than their respective minimum values, reflecting a relatively large fluctuation range. For the D5 section, the dynamic amplification factor reaches its maximum when the cable force changes by 4%, but this maximum is only 2.9% higher than the value for the original cable force, indicating a relatively small increase.
In summary, the dynamic amplification factor decreases with adjustments to cable force, reaching its maximum under the reasonably completed bridge state, while also resulting in a relatively large impact factor. However, even at this maximum value, the structural response remains relatively small, with the peak dynamic displacement of each cross-section not exceeding 8 mm, which is within an acceptable safety range. Therefore, changes in cable force have a non-negligible impact on vehicle–bridge coupling vibrations. Nevertheless, for cable-stayed bridges, all components exhibit favorable mechanical performance under the reasonably completed bridge state. Although adjusting cable force can reduce dynamic responses and impact effects, it may lead to inappropriate stress redistribution, causing stress concentration and placing the structure in an unfavorable working condition. To ensure the safety and stability of the structure, it is recommended that the reasonable cable force of the completed bridge be maintained in practical applications.

5.4. Effect of Structural Systems

The structural system of a cable-stayed bridge has an impact on its structural response. Specifically, the peak displacement of the tower top in a floating cable-stayed bridge (non-consolidated system) can even reach 2.14 times that of a rigid frame system (consolidated system) [33]. This section examines the influence of structural systems on vehicle–bridge-coupled vibrations.
In the computational analysis, the bridge deck grade is set to B level, the vehicle speed is maintained at 80 km/h, and the cable forces are kept in the reasonable completed bridge state. By adjusting the fixed support positions, a series of bridge models with different structural systems are created. The dynamic response peaks and dynamic amplification factors at various sections are calculated for vehicles passing through these bridges with different structural systems.
To analyze the effects of structural systems, the original tower beam–pier monolithic system is modified into a tower beam-fixed system by separating the tower and pier using fixed supports at the pier tops. The influence of support positions on the dynamic performance of the bridge structure is examined by varying the locations of the fixed supports. Figure 14 illustrates the support layouts, where the upper and lower diagrams represent fixed supports located at Piers 10 and 11, respectively. Due to space constraints, diagrams of other configurations are not provided.
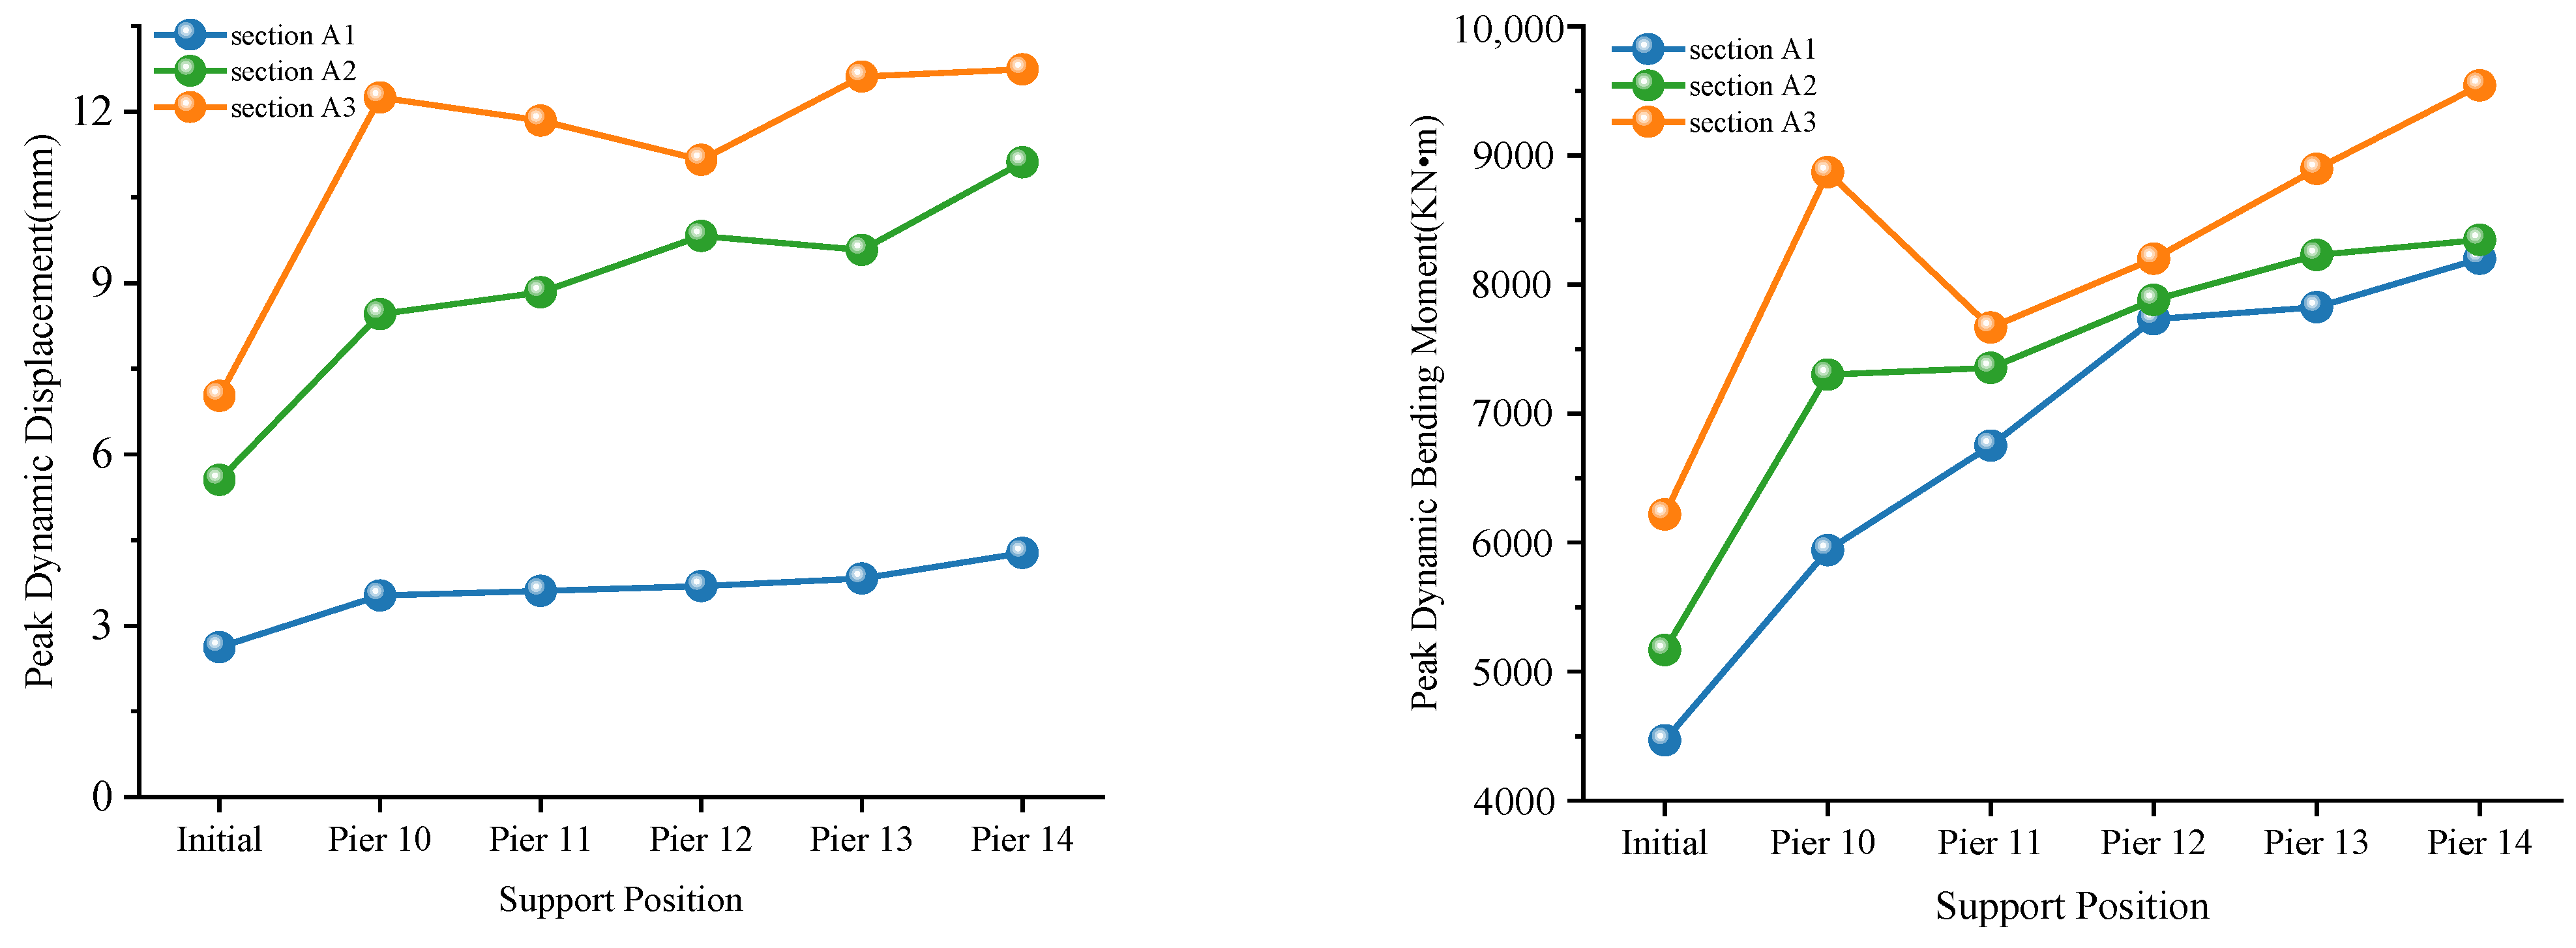
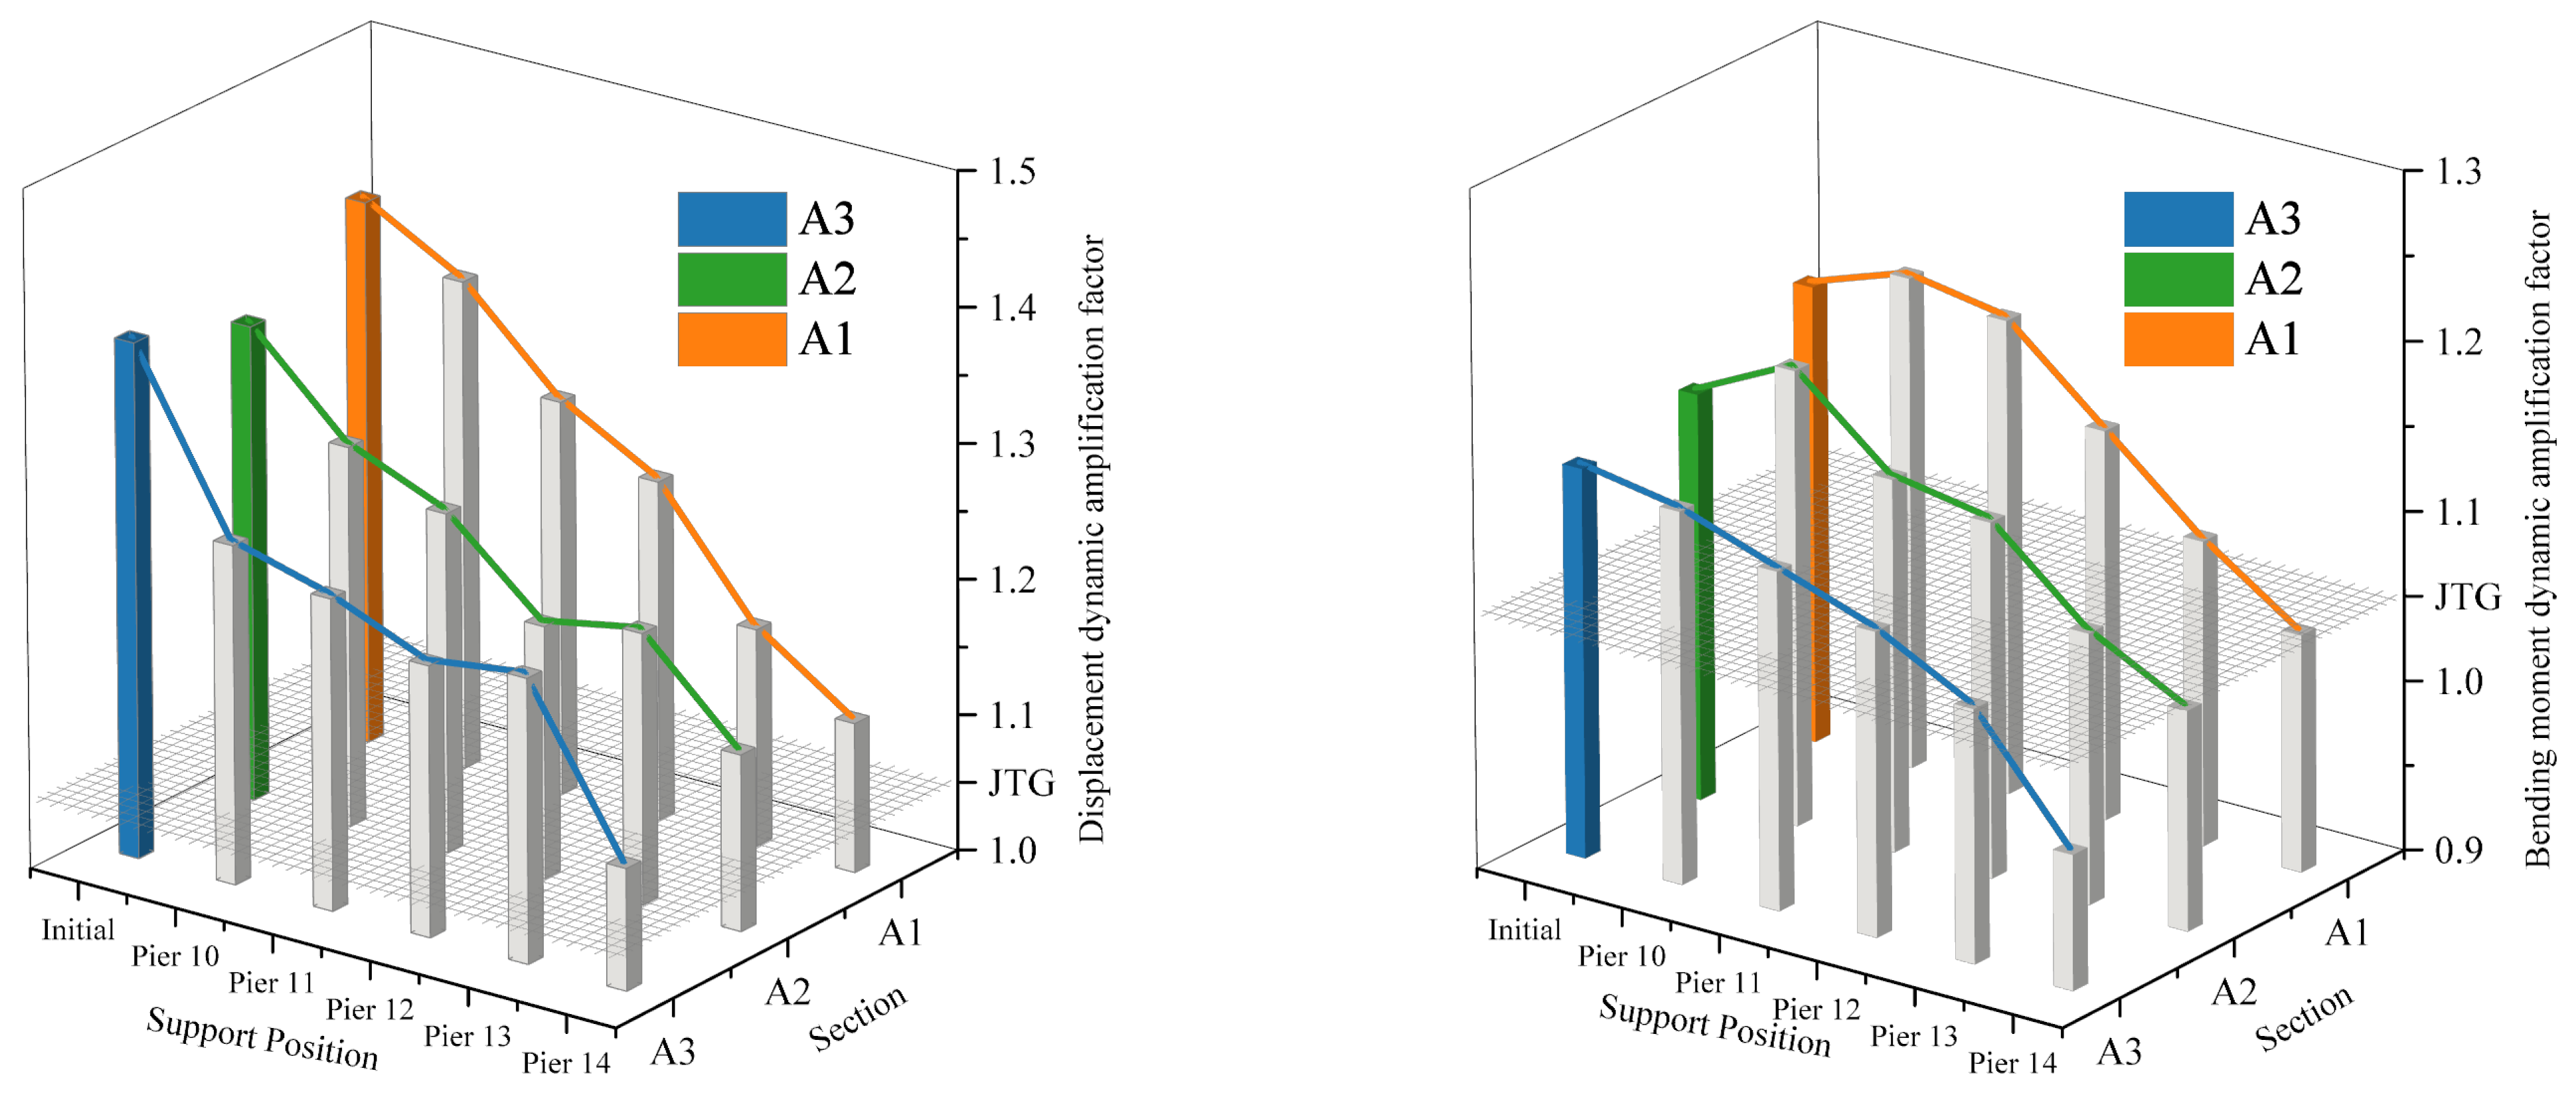
The dynamic responses for the main beam sections—specifically the mid-span of the side span (A1 section), the mid-span of the secondary side span (A2 section), and the mid-span of the main span (A3 section)—are calculated (refer to Figure 8 for section positions). The results are shown in Figure 15 and Figure 16, where “Initial” refers to the original structural system.
From Figure 15, it can be observed that when the structural system changes, the dynamic displacements and dynamic bending moments at all sections increase compared to the original system. For the A1 section, both the dynamic displacement and bending moment reach their minimum values when the fixed support is located at Pier 10. For the A2 section, the dynamic displacement is minimized when the fixed support is at Pier 10, while the bending moment is minimized when the fixed support is at Pier 11. For the A3 section, the dynamic displacement is minimized when the fixed support is at Pier 12, while the bending moment is minimized when the fixed support is at Pier 11. These results indicate that sections closer to the fixed support exhibit higher relative stiffness, resulting in smaller dynamic responses during vehicle–bridge-coupled vibration.
In contrast to dynamic responses, the displacement dynamic amplification factors for the rigid frame system are generally higher than those for the continuous beam system (Figure 16). As the fixed support position shifts to the right, both the displacement and bending moment dynamic amplification factors show an overall decreasing trend. Notably, when the fixed support is located at Pier 10, the bending moment dynamic amplification factor for the continuous beam system exceeds that of the rigid frame system. Additionally, for bending moment dynamic amplification factors at various sections, the mid-span of the side span consistently exhibits the highest value, whereas displacement dynamic amplification factors do not follow a similar pattern.
In summary, higher structural stiffness at a calculation section reduces the dynamic response. Compared to the continuous beam system, the fixed system exhibits a higher dynamic amplification factor; however, it results in smaller dynamic responses and lower total load effects when vehicles pass. On the other hand, the continuous beam system has a lower dynamic amplification factor but produces larger dynamic responses and higher total load effects, which may lead to greater safety risks. Therefore, for this specific bridge, the fixed system demonstrates superior safety performance compared to the continuous beam system.

6. Conclusions and Outlook

This study established a finite element model of a five-tower partially cable-stayed bridge to explore the dynamic characteristics of vehicle–bridge coupling, focusing on analyzing the effects of vehicle speed, bridge deck slope, cable force, and structural system. The research results are as follows:
  • This study deepens the understanding of the dynamic behavior of high-pier multi-tower partially cable-stayed bridges by revealing the following laws. Specifically, there is a non-monotonic relationship between vehicle speed and dynamic response. For this bridge, a sensitivity peak appears at 80 km/h; the deterioration of the bridge deck slope amplifies the response by enhancing the impact intensity, while a ±5% cable force deviation affects the response by changing the stiffness distribution, indicating that parameter-specific analysis is necessary for complex bridge types. Additionally, there are inherent differences in the dynamic amplification factor (DAF) between components, which challenges the rationality of adopting a unified DAF standard for multi-tower high-pier bridges.
  • In terms of engineering practice, the study found that the maximum DAF of key sections far exceeds 0.05 specified in current specifications, indicating that existing standards are insufficiently applicable to such bridges. It is therefore recommended to revise the DAF limits for high-pier multi-tower partially cable-stayed bridges and formulate differentiated DAF standards for components such as main girders, tower columns, and stay cables. Comparative analysis shows that the fixed system reduces dynamic displacement and bending moment compared with the continuous beam system but leads to a higher dynamic amplification factor; the response of the continuous beam system is closely related to the position of the fixed support, with smaller responses in the main girder sections near the support. This finding can provide important references for the selection of structural systems based on different priorities (such as stability or vibration control) in engineering practice.
  • It should be noted that this study has certain limitations. Firstly, only single-lane traffic conditions were considered, failing to cover more complex actual scenarios such as two-way traffic or multi-vehicle interaction. Secondly, the influencing factors involved in the study are relatively limited, and various parameters of vehicle loads (such as vehicle type, axle load distribution, traffic density, etc.) and other important parameters of the bridge model (including structural damage, vehicle lane position, etc.) have not been considered.
  • Based on the current research results, future work should be extended to scenarios closer to actual traffic conditions—such as random traffic flow or multi-vehicle coupling—to systematically examine the synergistic effects of multiple parameters and identify key parameter combinations affecting vehicle–bridge coupling. Notably, greater emphasis should be placed on verifying numerical simulation results through scaled model tests or on-site monitoring data: this step is critical to improving the reliability of engineering applications, thereby providing a more scientific basis for the design, operation, and maintenance of similar bridges.

Author Contributions

Conceptualization, W.G.; methodology, K.W.; validation, Y.L.; formal analysis, W.G.; investigation, H.S.; resources, K.C. and L.W.; data curation, H.S.; writing—original draft preparation, K.W.; visualization, L.W.; supervision, H.S. and Y.L.; project administration, L.W. and K.C. All authors have read and agreed to the published version of the manuscript.

Funding

This research was funded by the Innovation Capability Support Program of Shaanxi (Program No. 2023-CX-TD-38); the Natural Science Basic Research Program of Shaanxi (Program No. 2022JC-23); and the Science and Technology Project of the Department of Transport of Shaanxi Province (Grant No. 21-63K).

Data Availability Statement

The datasets generated during and/or analyzed during the current study are available from the corresponding author upon reasonable request.

Conflicts of Interest

Author Wei Ge is employed by the China Design Group Co., Ltd. The remaining authors declare that the research was conducted in the absence of any commercial or financial relationships that could be construed as a potential conflict of interest.

Abbreviations

DAFdynamic amplification factor
IMimpact factor

Appendix A

Regarding the quantification of stiffness reduction caused by high piers, while this is not the focus of the current study, we have compiled the key figures and tables from [34]—which systematically compare the stiffness characteristics of high and low piers—into the appendix. These additional analytical data can satisfy the need for quantifying stiffness differences and their coupling effects.
Table A1. The relationship between model displacement and tower height under live load.
Tower Height/mHeight-to-Span RatioMid-Span Deflection of the Secondary Side Span/cmMid-Span Deflection of the Main Span/cmHorizontal
Displacement of the Side Tower Top/cm
Horizontal
Displacement of the Main Tower Top/cm
UpDownUpDownRightLeftRightLeft
70.671/4.2515.68−34.4215.69−38.6410.77−3.8314.85−13.92
78.671/3.8116.17−32.7516.18−37.4011.84−4.3216.70−15.52
88.671/3.3816.73−31.4116.73−36.4713.23−4.9319.05−17.56
100.671/2.9817.36−30.4917.36−35.9515.00−5.7621.97−20.10
110.671/2.7117.88−30.1217.88−35.8516.56−6.3124.51−22.32
Table A2. The relationship model between bending moment and tower height under live load.
Tower Height/mHeight-to-Span RatioMid-Span Bending Moment of the
Secondary Side Span/kN·m
Mid-Span Bending Moment of the Main Span/kN·mHorizontal Bending Moment of the Side Tower Top/kN·mHorizontal Bending
Moment of the Main Tower Top/kN·m
MaxMinMaxMinMaxMinMaxMin
70.671/4.2549,922−15,60554,483−15,628408,264−206,748539,297−513,098
78.671/3.8148,709−16,55153,749−16,567361,888−181,460487,592−460,715
88.671/3.3847,477−17,55053,008−17,556318,466−157,941437,222−410,162
100.671/2.9846,367−18,55552,358−18,550280,143−137,269390,748−364,102
110.671/2.7145,688−19,27651,980−19,262255,793−124,161360,081−334,080

Appendix B

Appendix B.1. Basis for Vehicle Speed Selection

  • The bridge in the studied project is located on a first-class highway. According to the Technical Standard for Highway Engineering (JTG B01-2014 [35]), the design speed range for first-class highways is 60–100 km/h, so this speed interval is fully consistent with road design standards. As the main freight vehicle type on this class of highway, three-axle trucks typically operate within this speed range in most scenarios. Selecting 60–100 km/h can fully cover the traffic speed distribution during the bridge’s operation phase, truly reflecting the actual service environment of the bridge.
  • The research object is a three-axle truck, which belongs to medium-sized freight vehicles. The economic speed of such vehicles is 60–80 km/h, determined by their dynamic performance, load conditions, and road traffic conditions. However, their speed can reach 90–100 km/h under specific conditions such as no load, good road conditions, or special driving scenarios. Extending the speed range to 100 km/h can more comprehensively reflect the dynamic characteristics of the vehicle under different driving states.
  • According to existing research results, there is no unified standard for selecting vehicle speed in vehicle–bridge coupling analysis in academic circles, and the value ranges vary significantly. The selection of 60–100 km/h in this study is mainly based on the fact that this interval is commonly covered by most existing related studies. This overlapping range not only facilitates horizontal comparison and verification with conclusions from different studies but also focuses on the universal dynamic response characteristics within this speed interval, thereby enhancing the universality and reference value of the research results. Meanwhile, the relevant analysis can better reflect the common laws of such bridges under typical operating speeds.

Appendix B.2. Basis for Selecting ±5% Cable Force Variation

  • Compliance with engineering specifications
According to Specifications for Construction of Highway Cable-Stayed Bridges (JTG/T 3650-2020 [36]), the allowable deviation of cable forces during both construction and operation phases is typically controlled within ±5%. This range is established to accommodate common fluctuations caused by environmental factors (e.g., temperature changes) and structural behaviors (e.g., long-term creep), ensuring such variations remain within the threshold for structural safety and normal service without requiring maintenance or reinforcement.
2.
Alignment with practical engineering safety margins
In the studied project, the maximum actual cable force (5729 kN) is approximately 85.3% of the maximum allowable cable force (6718 kN) calculated per specifications. A 5% variation range is deliberately chosen to maintain sufficient safety reserves, ensuring the research reflects real-world engineering conditions where operational forces must stay within a safe margin of the ultimate limit.

References

  1. Wang, Y.; Chen, J.; Liu, C.; Fang, Y. Influence of cable damage on cable force of short tower cable-stayed bridge under earthquakes. Earthq. Resist. Eng. Retrofit. 2024, 46, 69–76. [Google Scholar]
  2. Zhang, H.; Wang, L.; Kang, L.; Liu, Y.; Zhu, C.; Xi, R. Stability Analysis of Construction Factors for Partially Cable-Stayed Bridges with Multiple Towers and High Piers. Buildings 2024, 14, 3416. [Google Scholar] [CrossRef]
  3. Zhu, C.; Wang, L.; Liu, Y.; Kang, L.; Guo, X.; Zheng, X.; Farahmand-Tabar, S. Study on the structural stability of partial cable-stayed bridges with multiple towers and high piers during construction. PLoS ONE 2024, 19, e0310631. [Google Scholar] [CrossRef] [PubMed]
  4. Liu, Y.; Wang, L.; Jiang, C.; Shu, H. Research on mechanical performance of in-service continuous rigid-frame bridge based on vehicle-bridge coupling vibration. Appl. Sci. 2024, 14, 6950. [Google Scholar] [CrossRef]
  5. Lei, W.; Wang, L.; Shu, H.; Liu, X.; Liu, Y.; Chen, K. Analysis of Vehicle–Bridge Coupled Vibration and Driving Comfort of a PC Beam–Steel Box Arch Composite System for Autonomous Vehicles. Buildings 2025, 15, 1385. [Google Scholar] [CrossRef]
  6. Lei, H.; Lin, Z.; Wen, J.; Qiu, G.; Chen, X. Vehicle-bridge coupling vibration of high-speed railway sea-crossing cable-stayed bridge under combined wave-earthquake action. J. Vib. Shock 2023, 42, 16–23. [Google Scholar] [CrossRef]
  7. Li, Y.; Qiao, H.; Xu, M.; Li, K.; Wang, C.; Long, P. Seismic Response Analysis of Train-Bridge Coupled System of Long-span Cable-stayed Bridge Considering Geometric Nonlinearity. Railw. Eng. 2023, 63, 87–92. [Google Scholar]
  8. Lu, Y.; Li, D.; Wang, K.; Li, Z. Dynamic response and parameter analysis on the vehicle–bridge coupling of cable-stayed bridge under over-limit transportation. Int. J. Struct. Integr. 2021, 12, 688–714. [Google Scholar] [CrossRef]
  9. Zhai, X. Prediction of Coupled Vibration Response of Cable stayed Bridge Vehicle Bridge Based on BP Neural Network. West. China Commun. Sci. Technol. 2023, 8, 147–150. [Google Scholar] [CrossRef]
  10. Lei, H.; Li, S.; Huang, B. Train-bridge coupling vibration of long-span railway cable-stayed bridge under non-uniform seismic excitation. Earthq. Eng. Eng. Dyn. 2022, 42, 213–221. [Google Scholar] [CrossRef]
  11. Chen, Z.; Pu, Q. Suppression characteristics of vehicle-bridge coupling vibration of long-span cable-stayed bridge with resilient wheels. J. Jilin Univ. (Eng. Technol. Ed.) 2023, 53, 2519–2532. [Google Scholar] [CrossRef]
  12. Li, J.; Ji, R.; Xia, X. Research Dynamic Analysis of Low Tower Cable-stayed Bridge of High Speed Railway under Train Load. Sci. Technol. Eng. 2022, 22, 2462–2467. [Google Scholar]
  13. Wang, Y.; Chen, J.; Shi, J. Coupling vibration response and dynamic impact factor analysis of extradosed cable-stayed bridge and vehicle. J. Yangzhou Univ. (Nat. Sci. Ed.) 2021, 24, 71–78. [Google Scholar] [CrossRef]
  14. Sun, H. Analysis of Vehicle-bridge Coupling Vibration of Long-span Cable-stayed Bridge Considering Initial Analysis of Vehicle-bridge Coupling Vibration of Long-span Cable-stayed Bridge Considering Initial. Railw. Eng. 2020, 60, 25–30. [Google Scholar]
  15. Lin, P.; Wang, Y. Impact factor of railway extradosed cable-stayed bridge considering multi-factors. J. Southeast Univ. (Nat. Sci. Ed.) 2021, 51, 235–241. [Google Scholar]
  16. Li, J.A.; Feng, D. A comparative study of vehicle-bridge interaction dynamics with 2D and 3D vehicle models. Eng. Struct. 2023, 292, 116493. [Google Scholar] [CrossRef]
  17. Zhu, J.; Zhang, W.; Wu, M.X. Coupled dynamic analysis of the vehicle-bridge-wind-wave system. J. Bridge Eng. 2018, 23, 04018054. [Google Scholar] [CrossRef]
  18. Zhou, J.; Huang, C.; Zhang, L.; Guo, J. Selection of design parameters of straddle monorail system considering vehicle–bridge interaction. Structures 2023, 50, 1794–1808. [Google Scholar] [CrossRef]
  19. Wang, S.; Yu, L.; Yang, F.; Xu, L.; Wu, K.; De Schutter, G.; Yang, Z. Effect of steel fiber distribution on the mechanical properties of UHPC caused by vehicle-bridge coupling vibration. Compos. Part B Eng. 2022, 245, 110201. [Google Scholar] [CrossRef]
  20. Montenegro, P.; Castro, J.; Calçada, R.; Soares, J.; Coelho, H.; Pacheco, P. Probabilistic numerical evaluation of dynamic load allowance factors in steel modular bridges using a vehicle-bridge interaction model. Eng. Struct. 2021, 226, 111316. [Google Scholar] [CrossRef]
  21. Li, Z.; Su, R. Research on Temperature Effect Control Measures for Multi-Pylon Cable-Stayed Bridges. Highway 2023, 68, 282–288. [Google Scholar]
  22. Deng, L.; Chen, Y.X.; Han, W.S.; Wang, W. Studying Impact Factors for Short-and Medium-span Simply Supported Concrete Highway Bridges and Its Suggested Values. China J. Highw. Transp. 2020, 33, 69–78. [Google Scholar] [CrossRef]
  23. Zhou, Y.; Xue, Y.; Gao, X.; Li, R.; Wang, Y.; Zhao, Y. Research on dynamic amplification factor of highway simply supported girder bridge based on modal superposition method. J. Traffic Transp. Eng. 2023, 23, 146–155. [Google Scholar] [CrossRef]
  24. Deng, L.; He, W.; Yu, Y.; Wang, W. Research Progress in Theory and Applications of Highway Vehicle-bridge Coupling Vibration. China J. Highw. Transp. 2018, 31, 38–54. [Google Scholar]
  25. GB/T 7031-2005; Mechanical Vibration Shock and Condition Monitoring. Mechanical Vibration Road Surface Profiles. Reporting of Measured Data. Standards Press of China: Beijing, China, 2005.
  26. ISO 8608:2016; Mechanical Vibration—Road Surface Profiles—Reporting of Measured Data. International Organization for Standardization: Geneva, Switzerland, 2016.
  27. JTG/T 2231-01-2020; Specifications for Design of Highway Cable-Stayed Bridges. China Communications Press: Beijing, China, 2020.
  28. Gui, S.; He, R.; Zeng, H. Analysis of the Impact of Traffic Density on Coupled Vibration of Overloaded Random Traffic Flow and Bridge. J. Shenyang Jianzhu Univ. (Nat. Sci.) 2024, 40, 797–806. [Google Scholar]
  29. JTG D60-2015; General Specifications for Design of Highway Bridges and Culverts. China Communications Press: Beijing, China, 2015.
  30. Xu, Y.; Chen, Y. Risk Analysis of Typical Coastal Twin-Pylon Cable-Stayed Bridge Under Combined Seismic-Wind Actions Using Multi-Source Inputs. J. Southeast Univ. (Nat. Sci. Ed.) 2025. online first. [Google Scholar]
  31. Huang, G.; Chen, C.; Yan, D.; Zeng, Y.; Xu, Q. Shrinkage and creep effects on long-span steel–concrete composite girder cable-stayed bridges: Modeling and structural analysis. Structures 2025, 79, 109520. [Google Scholar] [CrossRef]
  32. Li, Z.; Li, J.; Feng, D. Analysis of dynamic impact coefficients and affecting factors of stay cables in cable-stayed bridges based on vehicle-bridge interaction theory. J. Vib. Shock 2024, 43, 67–74. [Google Scholar]
  33. Zhang, J.; Lan, X.; Xu, X.; Tang, Z.; Ji, T. Comparative Analysis of Mechanical Behavior of Cable-Stayed Bridges with Different Structural Systems Under Seismic Action. J. Transp. Eng. 2024, 24, 37–42. [Google Scholar] [CrossRef]
  34. Lin, Y.; Xin, L. The influence of pylon parameter variations on the global stiffness of multi-pylon cable-stayed bridges. Railw. Eng. 2010, 3, 18–21. [Google Scholar]
  35. JTG B01-2014; Technical Standard of Highway Engineering. China Communications Press: Beijing, China, 2014.
  36. JTG/T 3650-2020; Technical Specifications for Construction of Highway Bridges and Culverts. China Communications Press: Beijing, China, 2020.
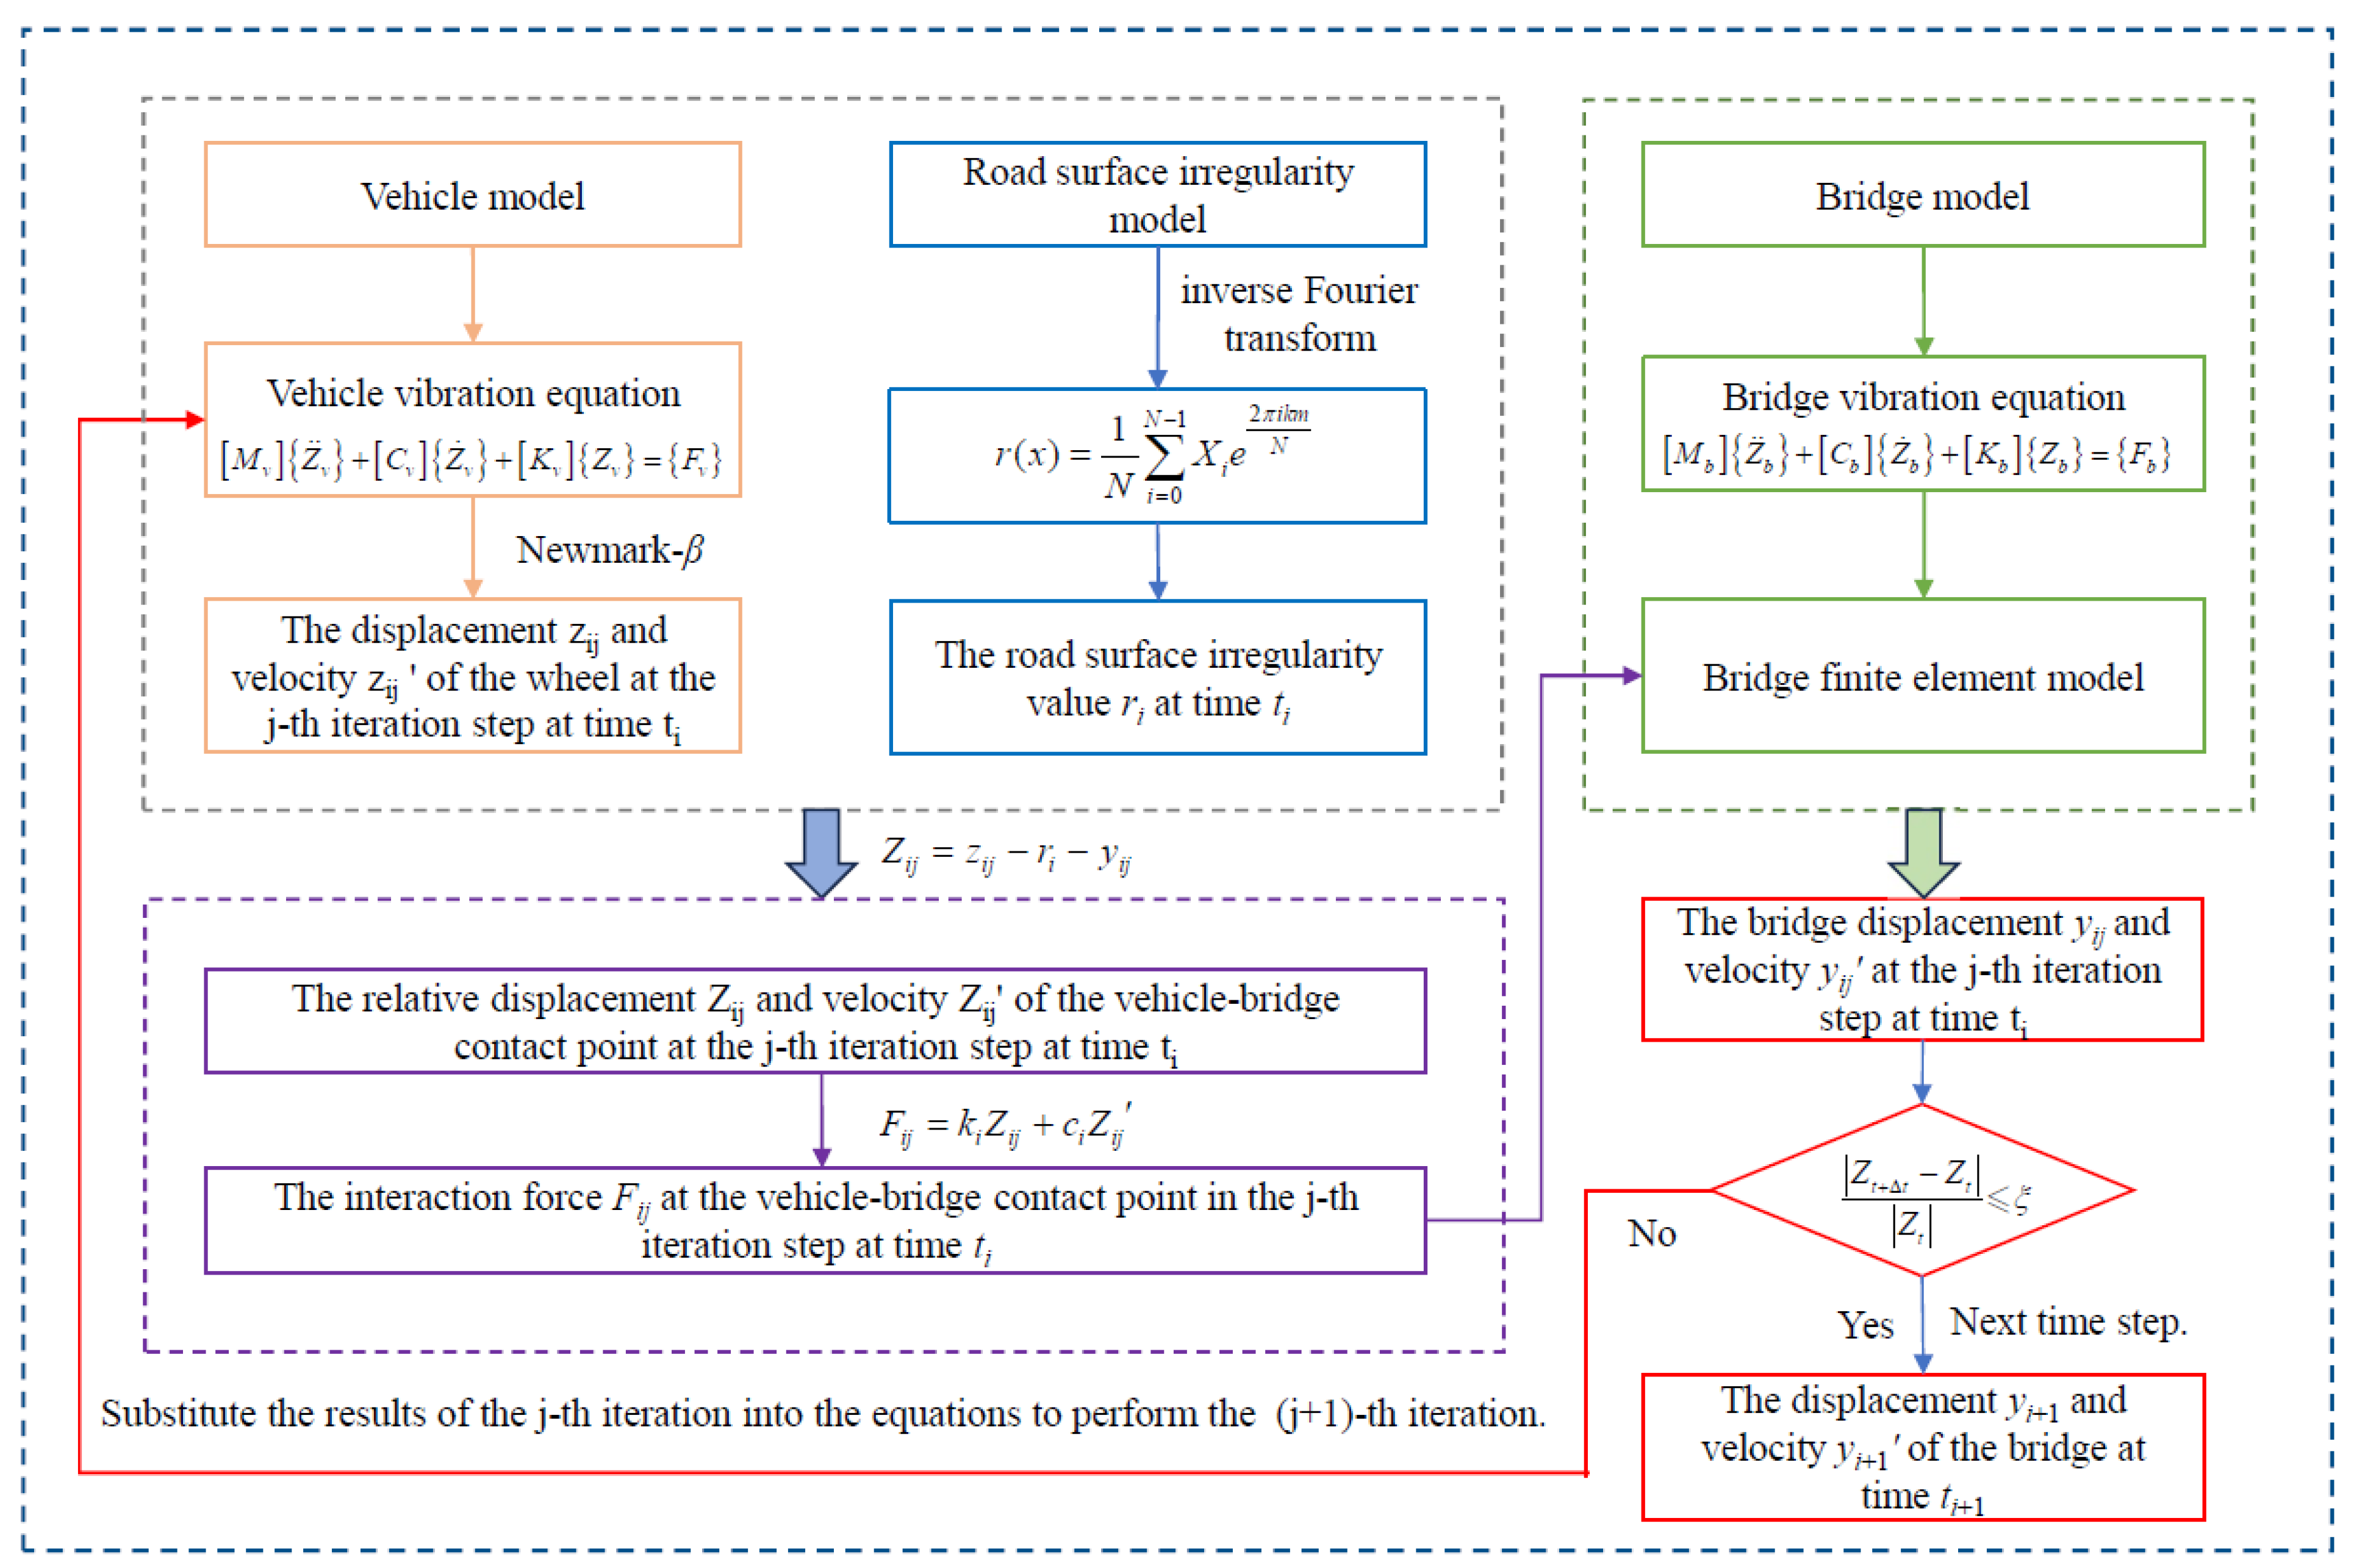
Figure 1. Vehicle–bridge coupling algorithm flowchart.
Buildings 15 02865 g001
Figure 2. Sample plot of bridge deck roughness in classes A to C.
Buildings 15 02865 g002
Figure 3. General arrangement of the main bridge (cm).
Buildings 15 02865 g003
Figure 4. Bridge finite element model.
Buildings 15 02865 g004
Figure 5. Full-span girder displacement comparison.
Buildings 15 02865 g005
Figure 6. Comparative analysis of tower top horizontal displacements.
Buildings 15 02865 g006
Figure 7. Space three-axle vehicle model.
Buildings 15 02865 g007
Figure 8. Typical cross-section position diagram.
Buildings 15 02865 g008
Figure 9. Response diagrams of the cross-section at each position. (a) Dynamic displacement. (b) Dynamic bending moment.
Buildings 15 02865 g009
Figure 10. Dynamic increment in cable force at each position.
Buildings 15 02865 g010
Figure 11. Effect of vehicle speed on coupled vibration. (a) Peak Dynamic Displacement. (b) Dynamic Amplification Factor.
Buildings 15 02865 g011
Figure 12. Effect of bridge deck grade on coupled vibration. (a) Peak Dynamic Displacement. (b) Dynamic Amplification Factor.
Buildings 15 02865 g012
Figure 13. Effect of cable forces on coupled vibration. (a) Peak Dynamic Displacement. (b) Dynamic Amplification Factor.
Buildings 15 02865 g013
Figure 14. Support layout diagram. (a) Schematic diagram of bearing locations with fixed bearings at Pier 10# (original structure). (b) Schematic diagram of bearing locations with fixed bearings at Pier 11#.
Buildings 15 02865 g014
Figure 15. Peak dynamic response of each section for different structural systems.
Buildings 15 02865 g015
Figure 16. Dynamic amplification factors of various sections under different fixed support positions.
Buildings 15 02865 g016
Table 1. Main structural material properties table.
ComponentMaterial TypeElastic
Modulus (Pa)
Poisson’s
Ratio
Density (kg/m3)
Main GirderC60 Concrete3.45 × 10100.22600
TowerC80 High-
Performance
Concrete
3.55 × 10100.22600
Stay CableHigh-Strength Strand1.95 × 10110.37850
Table 2. Modal parameters of the bridge: First 10 modes.
Modal
Number
Natural Vibration FrequenciesModal Participation Mass (%)Modal Damping Ratio
X-DirectionY-DirectionZ-Direction
10.1371678.6674400.0000090.029893
20.2717056.1488800.029969
30.2992300.15559500.029947
40.32464010.7485300.029937
50.364740.01318300.0000050.029236
60.389520.00007400.2239410.028562
70.4773300.01327400.029943
80.478310.00122800.0006120.028161
90.5768303.42030200.029959
100.602370.00000205.9069780.028038
From the table, it can be observed that the first ten natural vibration frequencies of the bridge (fi, where i = 1, 2, …, 10) are all less than 1.5 Hz. Consequently, the bridge impact factor specification value is determined to be 0.05.
Table 3. Control sections.
SectionNumbering in the FigureCalculation Content
Section at mid-span of Span 3A3Mz/Uy
Section at top of Pier 14D5Mz/Ux
Section at anchor zone of Tower 12T3Mz/Ux
Disclaimer/Publisher’s Note: The statements, opinions and data contained in all publications are solely those of the individual author(s) and contributor(s) and not of MDPI and/or the editor(s). MDPI and/or the editor(s) disclaim responsibility for any injury to people or property resulting from any ideas, methods, instructions or products referred to in the content.