Article

A SketchUp-Based Optimal Design Tool for PV Systems in Zero-Energy Buildings During the Early Design Stage

1
Department of Architecture, Graduate School of Mokwon University, 88 Doanbuk-ro, Seo-gu, Daejeon 35349, Republic of Korea
2
Division of Architecture, College of Engineering, Mokwon University, 88 Doanbuk-ro, Seo-gu, Daejeon 35349, Republic of Korea
*
Author to whom correspondence should be addressed.
Buildings 2025, 15(16), 2863; https://doi.org/10.3390/buildings15162863
Submission received: 21 July 2025 / Revised: 8 August 2025 / Accepted: 11 August 2025 / Published: 13 August 2025
(This article belongs to the Section Building Energy, Physics, Environment, and Systems)

Abstract

Achieving zero-energy buildings (ZEBs) requires the appropriate planning of renewable energy systems, particularly photovoltaic (PV) systems, from the early design stage (EDS). Conventional PV system design tools have limitations, including insufficient integration with the architectural design process, complex operability, and inability to adequately reflect the characteristics of the EDS. In this study, we developed a PV system optimization tool based on SketchUp, which is widely used in the EDS. The developed tool inputs the building’s 3D modeling information and derives an optimal layout plan that minimizes the number of PV modules while achieving the target energy self-sufficiency rate (ESR) via particle swarm optimization. To verify the performance of the developed tool, a comparative analysis with the System Advisor Model (SAM) was performed, resulting in high accuracy with a maximum relative error of 2.25% in 15 verification cases. Through case studies of 20 different building masses, optimal PV layout plans that stably achieved a target ESR of 20% were successfully derived for diverse mass cases. This tool enables architects to perform preliminary sizing and performance evaluations of PV systems in the EDS without the support of engineers and provides an environment for the integrated consideration of energy performance and esthetics through the presentation of visualized results to support more effective decision-making in the EDS of ZEB projects.

1. Introduction

The implementation of zero-energy buildings (ZEBs) is essential for achieving the 2050 net-zero target in the building sector. Because ZEBs require more stringent energy performance standards than conventional buildings, key decisions made during the early design stage (EDS) are critical for project success [1]. The major design variables, including building form, orientation, types of HVAC, and type and capacity of renewable energy systems (RESs), are typically determined during the EDS, and they determine approximately 80% of the total building operation costs [2]. Consequently, inappropriate decisions made during the EDS may necessitate frequent design modifications to ensure that the performance requirements are met, potentially resulting in significant cost increases.
Photovoltaic (PV) systems represent one of the most widely adopted measures for the implementation of ZEBs and require more careful planning using the EDS than other measures [3]. This is because PV system planning needs to be more closely integrated with architectural design than with other RESs, such as ground-source heat pumps. Envelope areas directly constrain the capacity of PV arrays [4] and, therefore, the annual energy yield. In addition, building orientation and layouts affect the shading patterns of PV modules, which significantly affect their energy generation performance [5].
The integration of PV systems into the architectural design is a critical consideration, particularly during the EDS. Architectural elements such as building form and layout are frequently modified at this stage, directly influencing the potential energy generation of the PV system. Consequently, a specific architectural design may preclude the design of a PV system capable of satisfying the energy production targets required for a ZEB. Even when feasible, a multitude of design alternatives may arise based on design elements, such as the capacity, number, placement, and installation method of PV arrays. This presents architects and engineers with a complex decision-making challenge: selecting the optimal PV system design alternative from the numerous possibilities for a given building.
Conversely, the PV system design can also influence architectural design. As PV system integration can adversely affect the esthetic quality of buildings [6,7], PV designs that prioritize energy performance without incorporating esthetic considerations may be unsuitable for practical architectural implementation. Haghighi et al. [8] emphasized the significance of esthetic evaluation and demonstrated that architects prefer PV system designs that integrate both energy performance and esthetic considerations from the EDS. This requirement means that architects need to navigate the complex challenge of simultaneously addressing engineering performance criteria and architectural design principles.
In summary, despite the frequent modifications made to architectural elements during the EDS of ZEB projects, it remains essential to design a PV system that integrates both energy performance and esthetic considerations to achieve the ZEB performance target. In this context, Jakica [9] advocates for the integration of PV design tools within the architectural design process. Furthermore, through a survey of architects, Kantersa, Horvatb, and Dubois [10] confirmed that visualization capabilities and preliminary sizing functions are essential requirements for PV design tools.
To address these challenges, various methodologies have been proposed for designing PV systems in energy-efficient buildings, including ZEBs. Among these approaches, the most prevalent involves employing PV design tools, such as PVSyst and the System Advisor Model (SAM). Previous studies demonstrated the effectiveness of these tools in ZEB projects [11]. However, the requirement for separate esthetic evaluation modeling and the complexity associated with iterative design modifications have constrained their application during the EDS.
Optimization techniques are also promising methods for PV system design. These methodologies can comprehensively explore design alternatives that achieve objective functions such as energy production maximization or cost minimization under specified constraints, thereby effectively identifying optimal design alternatives. Recent studies [12,13,14] have employed multiobjective optimization approaches, predominantly utilizing NSGA-II. However, their practical application in the EDS remains limited owing to complex setup requirements and high barriers to entry for nonspecialists [15].
Alternatively, methods that utilize BIM or Rhino/Grasshopper-based parametric platforms have been proposed [16,17,18]. These platforms facilitate efficient layout decisions by enabling the simultaneous visualization of the building and PV system, along with solar radiation analysis. Recent studies have begun to integrate these platforms with sensitivity analysis [19] and optimization techniques [20]. The integrated approach aims to provide key visualization and preliminary sizing functions identified as essential for architects [10].
However, the aforementioned techniques present several limitations. BIM platforms impose constraints on creative conceptual design during the EDS [21], whereas architects encounter practical implementation challenges owing to insufficient user comprehension [22]. Similarly, Rhino/Grasshopper requires considerable technical expertise for plugin installation, which is necessary for PV system performance evaluation and integration with simulation tools [23], thereby restricting its accessibility to practitioners. Furthermore, a significant gap remains as existing studies have primarily focused on maximizing energy production or minimizing costs. Consequently, the optimization of PV systems, specifically to achieve the target energy self-sufficiency rates (ESRs) required for ZEB, has not been sufficiently explored.
A review of previous studies shows that there are currently no PV system design methods specifically tailored for the EDS in ZEB projects. PV design tools and optimization methods lack sufficient integration with the architectural design process, whereas BIM-based approaches have shown practical limitations in the EDS. Notably, although studies have focused on maximizing energy production or minimizing costs, studies exploring optimal design alternatives based on a target ESR, which is a critical performance criterion for achieving a ZEB, remain insufficient.
Therefore, an integrated PV design tool is needed that is fully compatible with the architectural design tool used in the EDS and that incorporates optimization methods to achieve the target ESR. To address this need, this study developed a PV system design tool based on SketchUp to facilitate ZEB projects. SketchUp was selected as one of the most widely used digital tools in the EDS because of its intuitive interface and integration with high-quality rendering engines [24,25]. Furthermore, its proprietary Ruby application programming interface (API) enables the implementation and integration of custom PV system design functionalities. The developed tool automatically configures PV arrays on an initial design model to meet a specified ESR, providing both visual and numerical results. This allows for a comprehensive evaluation of the PV capacity and esthetic impact within a single platform.
Before developing the SketchUp-based PV design tool, an energy production calculation algorithm for PV systems was established as the core component of the PV system design. In the system design process, the objective function was defined to identify the alternative with the minimum number of PV modules among the design alternatives that achieve the target ESR while considering the system’s economic efficiency. Among the various optimization techniques, particle swarm optimization (PSO) was adopted because of its efficient exploration of global optimal solutions and its expected relatively rapid convergence compared with other metaheuristic algorithms. The developed PV design tool was validated from two perspectives. First, to verify the accuracy of the performance calculation module, a comparative analysis was conducted using the SAM, a representative PV performance evaluation program. The annual energy production was compared under identical building and PV array layout conditions, and the differences between the results of the PV design tool and SAM were analyzed. Second, the feasibility of the SketchUp-based PV design tool was verified for 20 different building masses. The performance evaluation results and automatic optimized plan functions were comprehensively assessed for each building mass. Therefore, the primary goal of this study is to develop and validate a SketchUp-based design tool that enables architects to derive an optimal PV system layout to achieve a target (ESR) during the EDS. This facilitates an integrated design process that considers both energy performance and esthetics.

2. Algorithm and Tool Development

This section describes the development of the SketchUp-based PV system design tool to support ZEB projects. The process consists of three core steps. First, a performance evaluation algorithm is established to calculate the annual energy production of the PV system (Section 2.1). Second, a preliminary sizing algorithm using PSO is developed to achieve the target ESR while minimizing the number of PV modules (Section 2.2). Finally, these two algorithms are integrated and implemented in the SketchUp environment, enabling architects to intuitively use the tool during the EDS (Section 2.3).

2.1. Energy Performance Calculation Algorithm

The annual energy production of the PV system was calculated using the process shown in Figure 1. The calculation sequence proceeded as follows: (1) calculation of solar radiation incident on the PV module surface, (2) analysis of shading from surrounding buildings and adjacent modules, (3) calculation of the PV cell temperature, and (4) calculation of the power generation efficiency and amount of annual energy production. With the exception of the shading analysis, the algorithms for these calculations were adapted from the established literature, including the ASHRAE Handbook Fundamentals [26], SAM Engineering Reference Manual [27], and RETScreen Engineering Manual [28]. The HDKR model proposed by Reindl et al. [29] was utilized for diffuse solar radiation, whereas the calculations for reflected solar radiation were based on the theory presented by Liu et al. [30].
To analyze the shading of individual PV modules, this study proposes a simplified model based on ray casting. As illustrated in Figure 2, the surface of each PV module is discretized into pixels. A ray is cast from the centroid of each pixel in the direction of the sun. If this ray intersects any object, such as a surrounding building, an adjacent module, or another part of the target building, the corresponding pixel is determined to be shaded. This simplified approach is particularly suitable for the EDS, in which a quick understanding of the overall shadow patterns resulting from the building form and layout is more critical than an analysis of the detailed electrical characteristics of the PV modules.
The rear surface temperature of the PV modules was calculated using the Sandia Cell Temperature Model, proposed by King et al. [31]. This model accounts for all the key factors influencing the panel temperature, including incident solar radiation, ambient air temperature, wind speed, and heat dissipation characteristics of the real surface of the PV module, which vary according to the installation method. The governing formula for the rear surface temperature is given by Equation (1). This equation utilizes the temperature coefficients corresponding to the installation method of the PV module, as detailed in Table 1. Subsequently, the cell temperature is derived from the rear surface temperature using Equation (2).
T m = I · e a + b V w + T a
T c = T m + I 1000 T
The change in power generation efficiency with cell temperature was calculated using Equation (3). This formula is based on the theory presented by Evans [32] and applied for PV performance calculations in RETScreen [28].
η p = η r [ 1 β p T c T r ]
The DC and AC power generation of the PV modules was calculated using the methodologies applied in the SAM [27]. The governing equations are presented in Equations (4) and (5), respectively. For this analysis, the DC-to-AC ratio of the inverter was set to 1.0, assuming that the DC output is converted into AC power without any loss from clipping. The total annual energy production is then calculated by summing the AC power generated at each time step for the entire year.
P D C = η p 100 · A m · I · ( 1 L D C 100 )
P A C = P D C · η i 100 · ( 1 L A C 100 )
Finally, the ESR is defined as the ratio of the annual energy production of the PV system to the annual building energy consumption, as shown in Equation (6).
E S R = E s E c × 100

2.2. PSO-Based PV Preliminary Sizing Algorithm for Achieving Target ESR

Numerous design alternatives can be used for PV systems to satisfy the target ESR. From an economic perspective, this study used the minimization of the number of PV modules as the primary objective function. Although a global search method can accurately identify the optimal solution, the time and computational resources required render it impractical for real-world applications. As noted by Barber et al. [33], common optimization algorithms for architectural or HVAC designs include PSO and genetic algorithms. This study employed PSO, which is a representative metaheuristic method. PSO was selected because of its relative ease of implementation and rapid convergence characteristics [34], making it suitable for the iterative simulations required in the EDS.
To apply PSO, the objective function, variables, and constraints were defined. The objective function was formulated to minimize the total number of PV modules among all the design alternatives that satisfied the target ESR. The objective function is defined as shown in Equation (7). The primary variables included the slope, azimuth of the PV arrays, and interarray spacing, as detailed in Table 2. In addition, a surface coverage ratio representing the proportion of the roof and exterior walls to be covered by the PV arrays was used to determine the total number of modules. For instance, a 50% coverage ratio for a 100 m2 roof area would dictate an installation area of 50 m2, and the algorithm would calculate the corresponding number of modules. As a simplifying assumption, the module type and array layout were considered uniform across all design alternatives. Finally, constraints were established using the target ESR as the baseline, with the minimum value set as the target rate and the maximum value set as the target rate plus 0.5%, allowing for design exploration within this range.
f = m i n   ( N P V )
The stable performance of PSO depends on the proper configuration of its parameters. For the inertia weight (w), we adopted the approach of Shi et al. [35], setting an initial value of 0.9 to encourage global exploration, which was then linearly decreased to 0.4 to facilitate convergence toward the optimum. To prevent the divergence of the particle velocities, a constriction factor was introduced, as in Clerc et al. [36]. Accordingly, the sum of the cognitive (c1) and social (c2) coefficients was set to 4.1 to ensure stable particle trajectories during the search process. A comprehensive summary of the configured parameters is provided in Table 3.
PSO was implemented through the following steps. (1) A population of particles is initialized, where each particle represents a unique PV system design alternative with random values for the variables defined in Table 2. (2) The fitness of each particle is evaluated by calculating the total number of PV modules and the resulting ESR using the energy performance algorithm. (3) Particles that meet the ESR constraint are compared, and the personal best (pbest) for each particle and the global best (gbest) for the entire population are updated. (4) The velocity and position of each particle are updated based on its current velocity, pbest, and gbest, guided by the inertia weight and cognitive/social coefficient. (5) Steps 2–4 are repeated until the maximum number of iterations is reached, at which point the gbest solution is presented as the optimal design.

2.3. Implementation in SketchUp

The overall framework for the PV system design tool was developed by integrating the previously established performance calculations and optimization algorithms. As shown in Figure 3, the framework is structured around five core components: (1) Project Information, (2) User Input, (3) Database, (4) Optimization Process, and (5) Output. Project Information encompasses a 3D model of the target building. Based on this model, the user provides key parameters through the User Input interface, including the use of the building, target ESR, and region. Regional selection is linked to the corresponding weather data in the Database. To streamline the EDS, the required PV system information is simplified to the module size and type; all other technical parameters required for performance calculations are automatically populated with default values.
The Optimization Process employs PSO to search for the optimal design solution. In each iteration of the algorithm, the energy production of a design alternative is calculated to evaluate its fitness against the objective function. The technical specifications and weather data required for the calculation are retrieved from the integrated database.
The final output stage visualizes the optimized layout plan as a 3D model in the SketchUp environment. This 3D representation allows architects to intuitively assess the placement and configuration of PV modules, thereby facilitating a comprehensive evaluation of the architectural esthetics and energy performance. By complementing the visual model, the tool presents detailed performance data numerically.
The SketchUp-based PV design tool was developed using the SketchUp API, which is based on the Ruby language. The Ruby environment operates on a single thread, posing a significant performance bottleneck for computationally intensive tasks such as hourly shading estimation and annual energy simulations. To overcome this limitation, the core computational modules responsible for these calculations were implemented in the C programming language, which is well suited for high-performance processing. This hybrid architecture establishes a clear division of responsibilities. The SketchUp API is used for tasks related to 3D interactions: (1) extracting geometric data from the building model, (2) managing the optimization process, and (3) visualizing the final optimized layout. The C modules perform the energy performance calculations for numerous design alternatives during optimization. In addition, the SketchUp API is used to present key numerical outputs, such as the minimum number of PV modules required to meet the target ESR, to the user through a pop-up window.
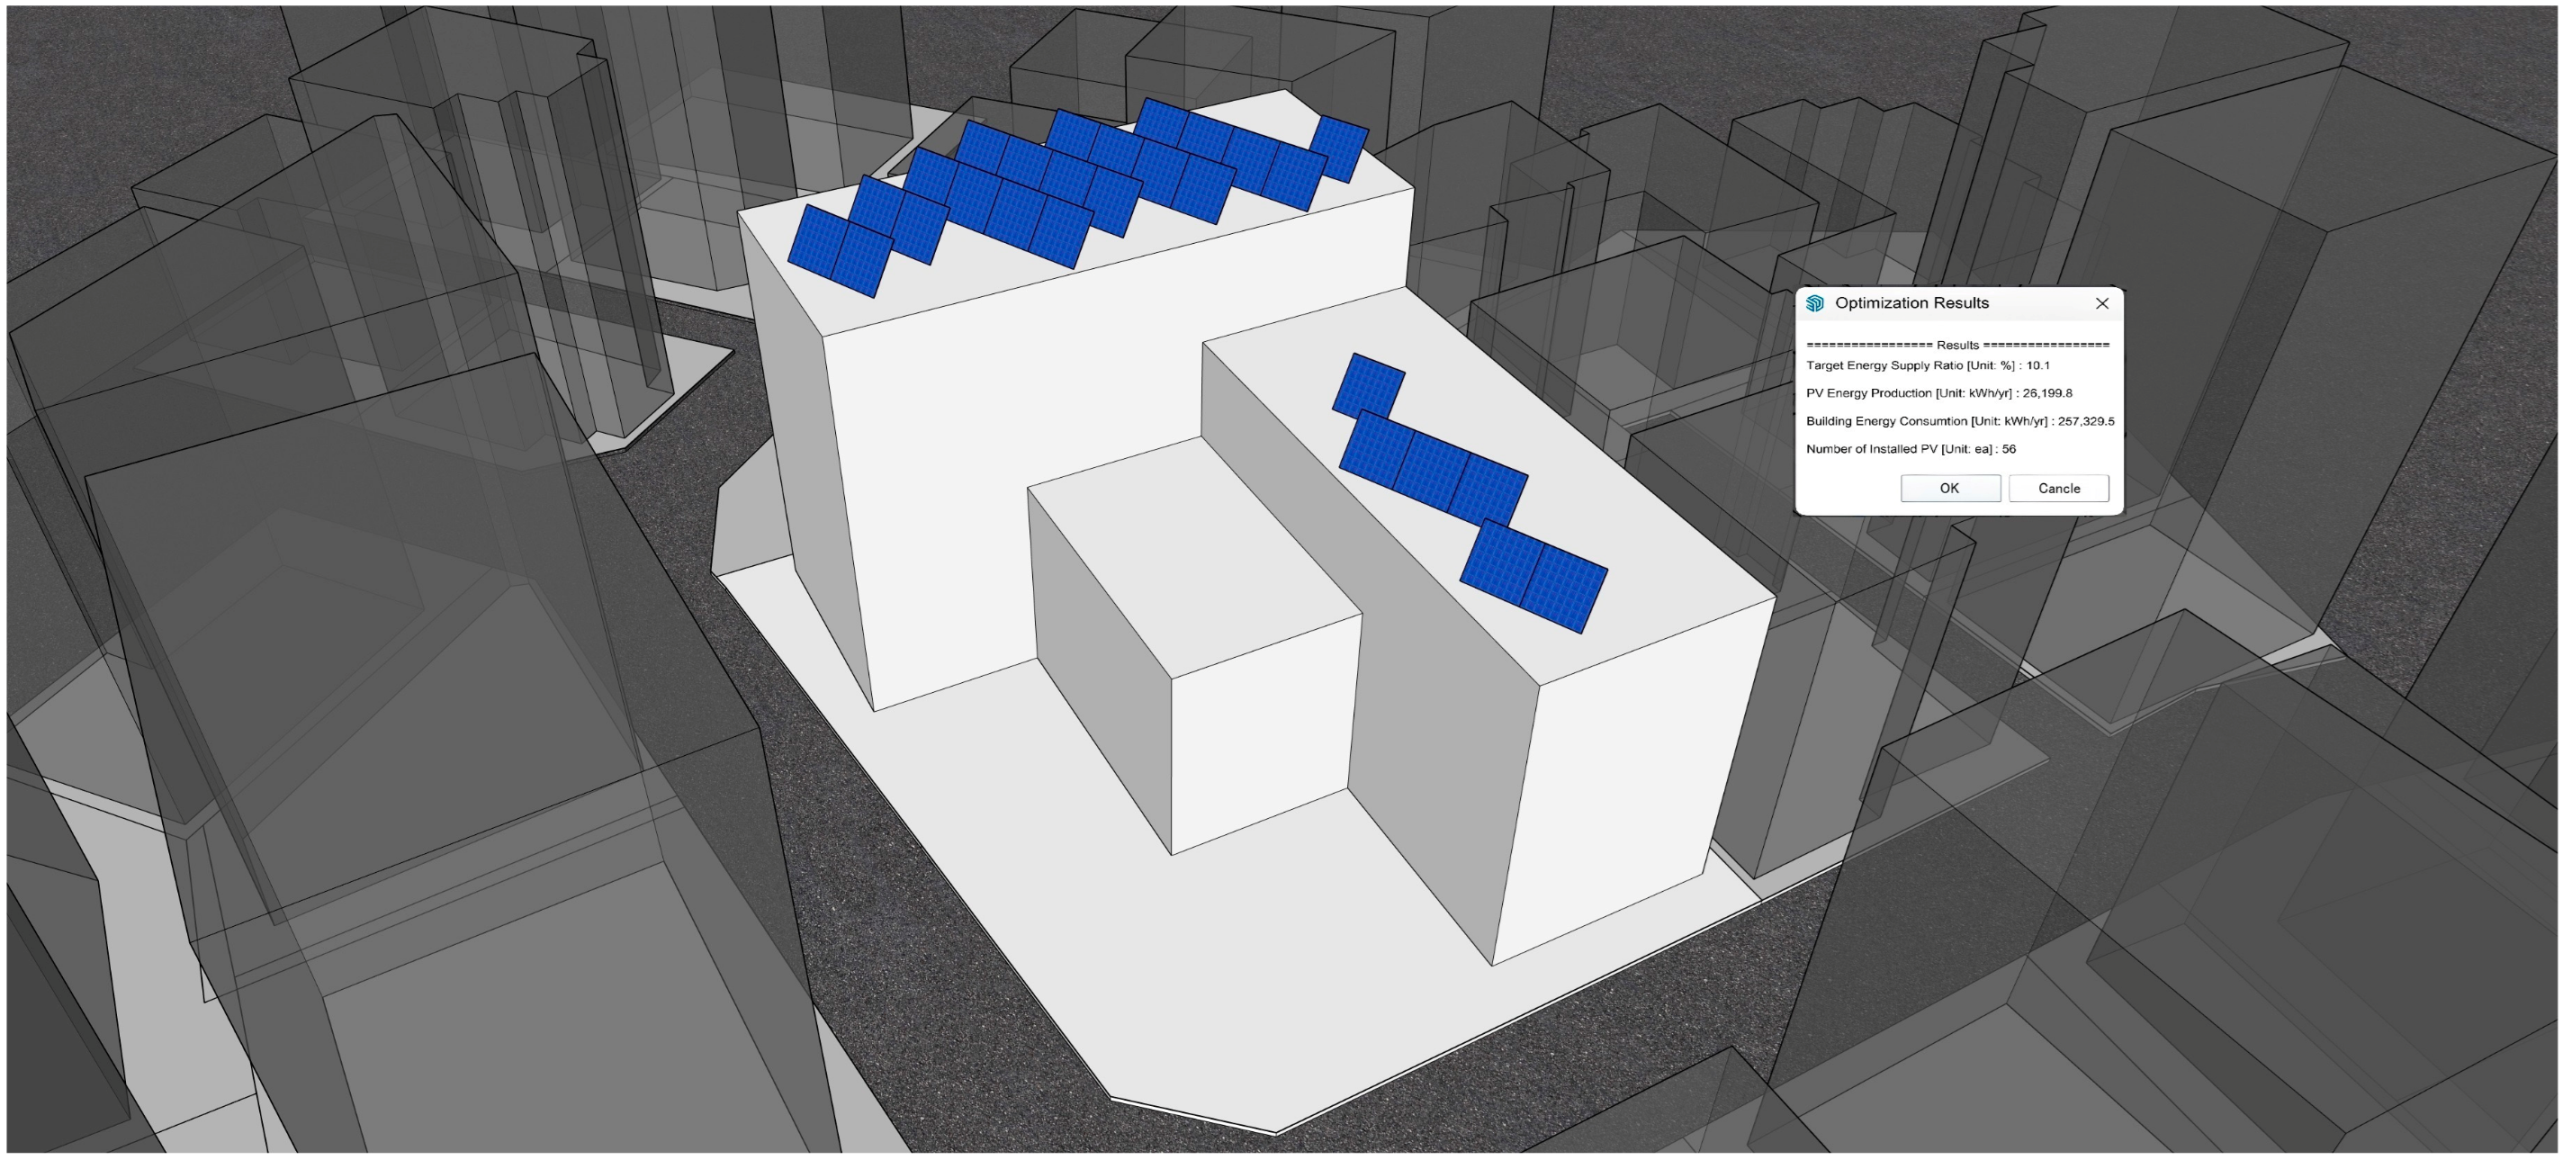
Figure 4 and Figure 5 show the typical operational workflow of the developed PV design tool. The process commences with an initial input dialog, as shown in Figure 4. In this window, the user specifies the essential parameters required for the design such as the target region, building use, and basic PV module dimensions. Following the execution of the optimization algorithm, the tool generates the results, as shown in Figure 5. The automatically arranged PV layout that achieves the target ESR with the minimum number of modules is shown.

3. Verification of PV Performance Evaluation Module

3.1. Verification Method

The calculation accuracy of the energy production from the PV system was verified prior to evaluating the feasibility of the PV design tool. The SAM, a reliable PV performance evaluation tool, was used for this validation. The SAM is a tool developed by NREL that evaluates the performance and economics of various RESs, including PV systems [37]. Freeman et al. [38] demonstrated that when compared with measurement data from nine actual projects, the error in annual power generation was within 8%, and the root mean square error (RMSE) for hourly data was within 7%, thereby confirming that the calculation accuracy of the SAM meets the standards required for practical application.
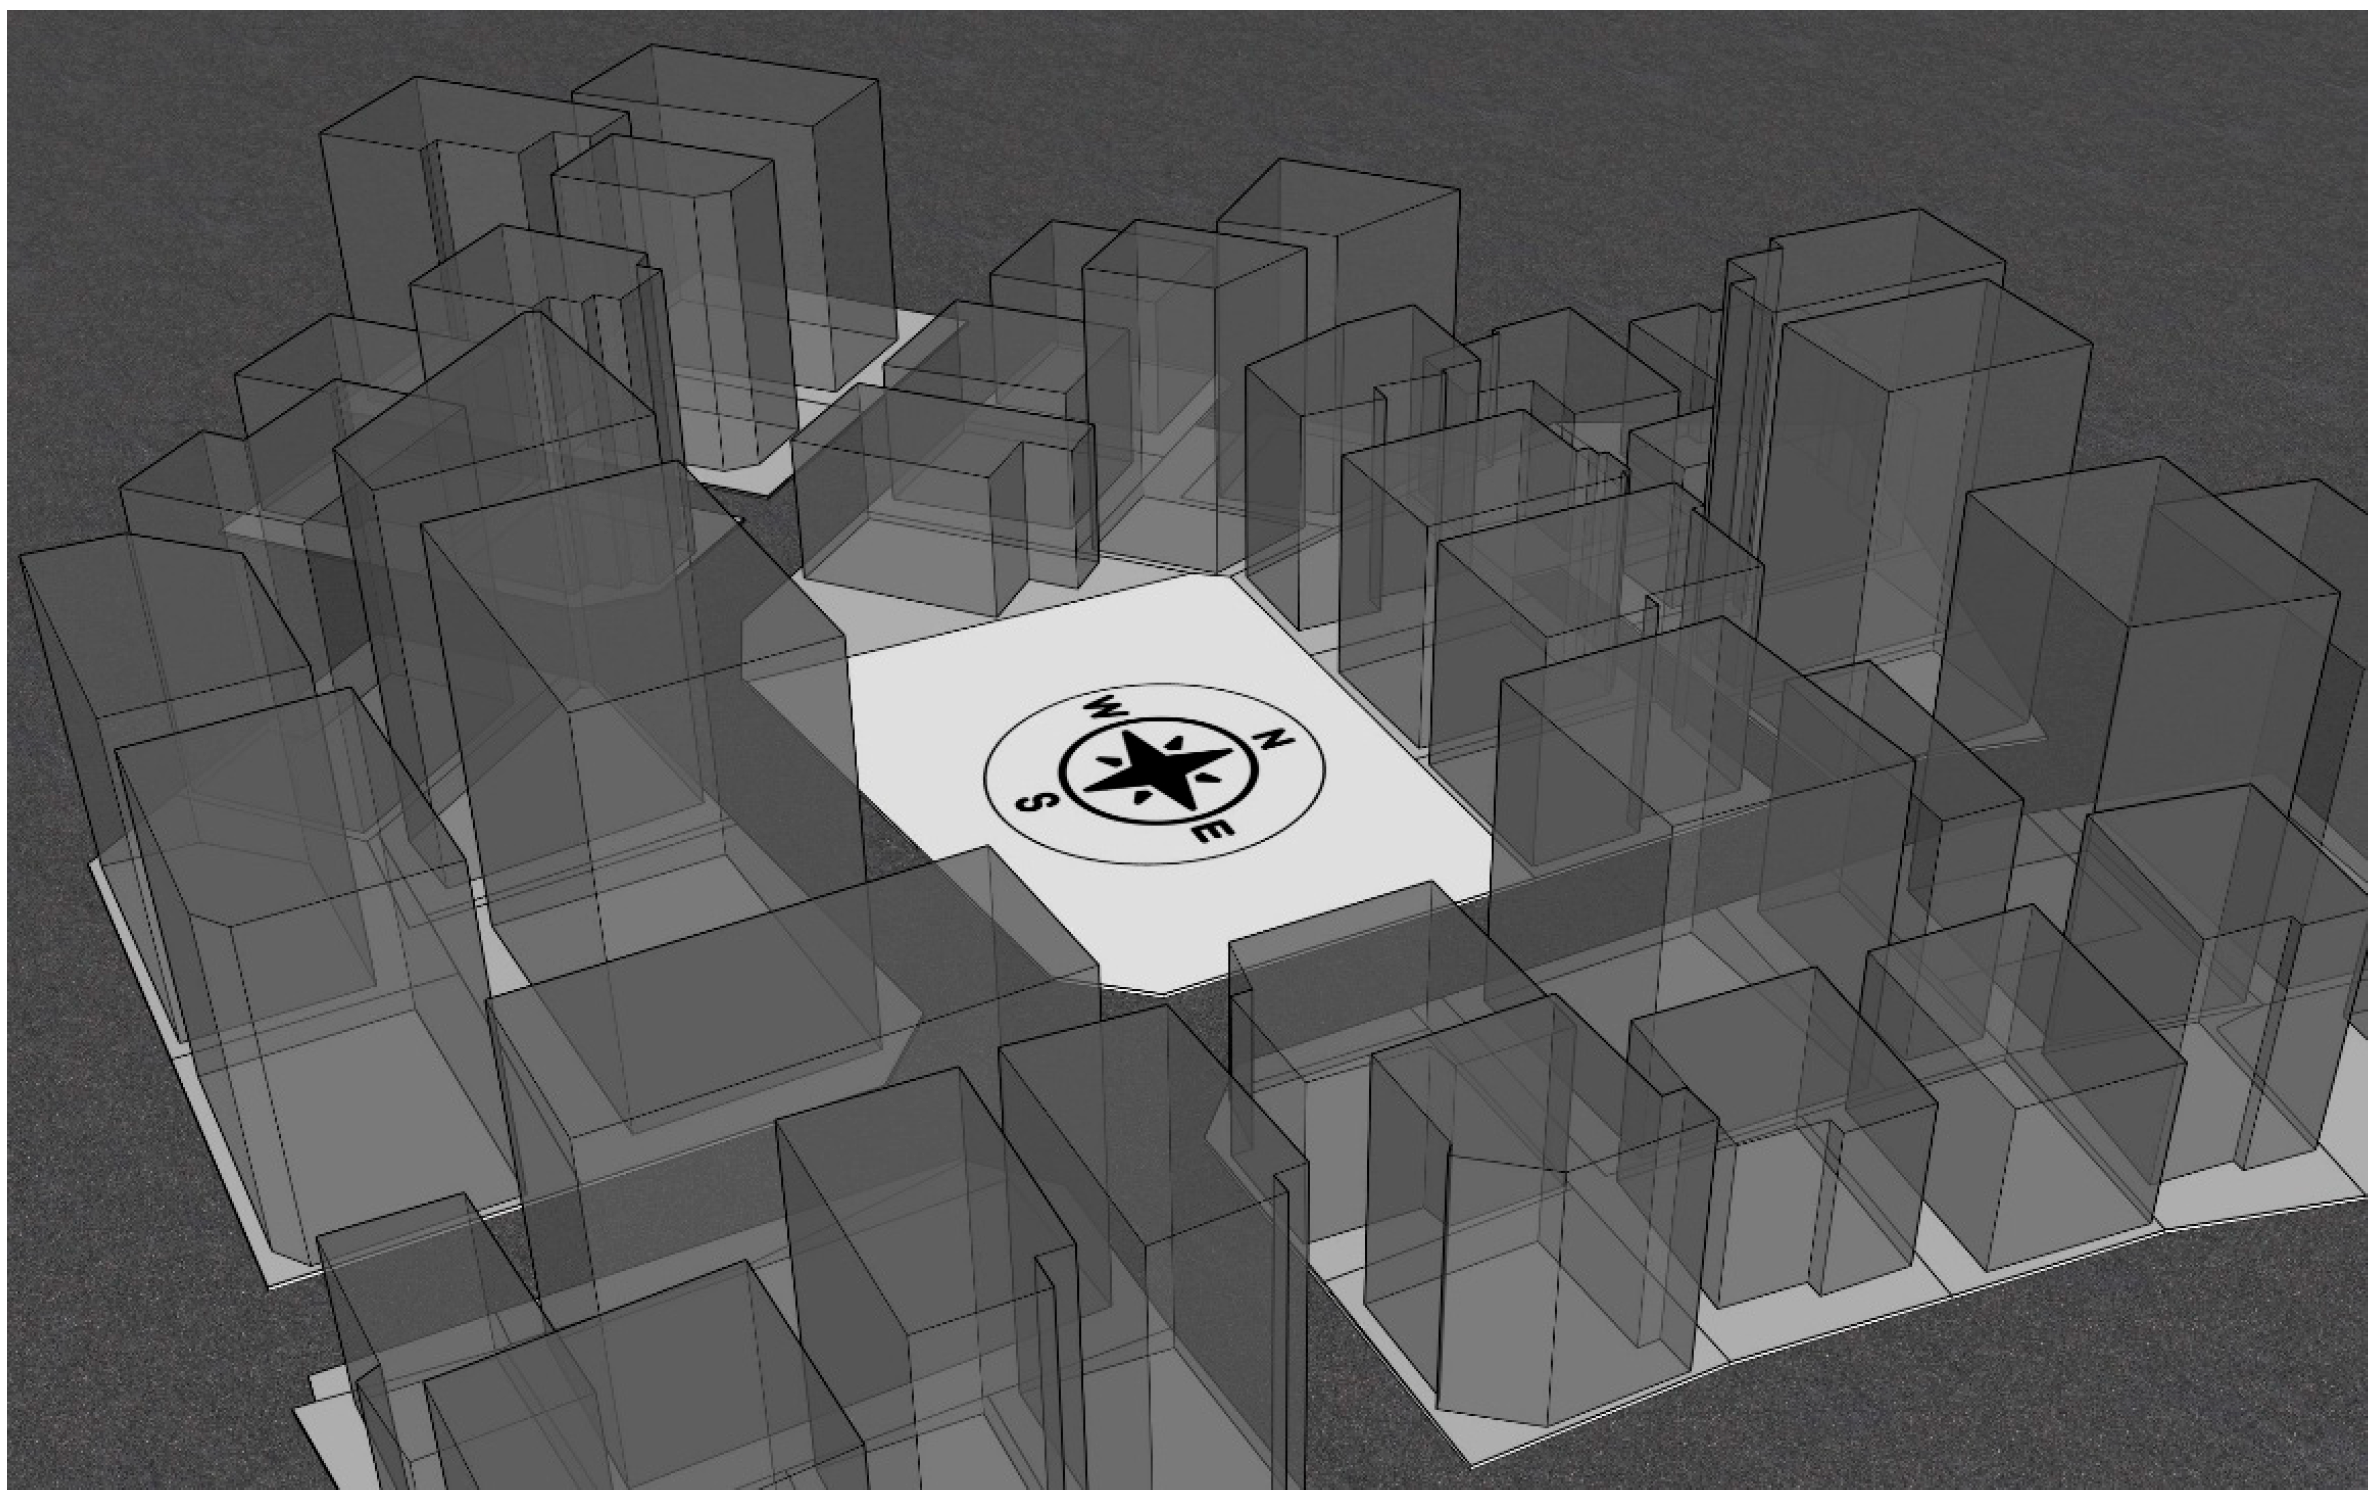
Verification cases were created by combining the primary variables that influence the PV system’s energy production. First, to account for regional variations in climate, three cities representing different climate zones in South Korea were selected: Seoul (northern region, characterized by colder winters and distinct seasonal variations), Daejeon (central region), and Busan (southern coastal region, with a milder climate and generally higher solar potential). This diversity provides a robust basis for validating the performance of the tool under different environmental conditions. Typical meteorological year (TMY) hourly data for each region was used. Next, the buildings in which the PV arrays were installed were assumed to have a box-shaped geometry. To evaluate the shadows cast by surrounding buildings, the target building was situated among the surrounding building masses, as shown in Figure 6. Because a building form influences the shadow it casts, we defined three building types for the analysis. While keeping the floor area constant, we varied the height to model one-, two-, and three-story buildings.
Because the amount of incident solar radiation is a primary determinant of PV performance, we analyzed the tilt angle and orientation as key parameters. Four installation surfaces were considered: the roof and south-, east-, and west-facing exterior walls. For the exterior wall installations, the PV arrays were modeled as flush-mounting, covering the maximum available surface area. The region-specific optimal tilt and azimuth angles for the scenario were set as follows: 36° and 5° for Seoul, 34° and −1° for Daejeon, and 34° and 0° for Busan, respectively. To account for inter-row shading in this optimally tilted configuration, a spacing of 1 m was assumed between the arrays. The verification cases constructed by combining these variables are listed in Table 4. The detailed specifications of the PV system and associated loss factors are summarized in Table 5 and Table 6, respectively.

3.2. Verification Results

The annual energy production for each of the 15 verification cases was calculated using both the developed SketchUp-based tool and the SAM. The comparative results, including the relative and absolute errors, are presented in Table 7. The analysis of these results reveals the accuracy of the developed tool across different regions and installation conditions, which is discussed in detail in the subsequent paragraphs.
An analysis of the annual energy production for each verification case, detailed in Table 7, shows that the optimally tilted rooftop installations yielded the highest output in all three regions. The ranking of energy production consistently followed the following order: flush-mounting rooftop, south-facing wall, east-facing wall, and west-facing wall. This result is attributed to the greater number of PV modules and the reduced impact of shading from the surrounding buildings on the rooftop PV arrays. By contrast, exterior wall installations accommodate fewer modules and are more susceptible to external shading, leading to lower annual production. Notably, the west-facing wall generated less energy than the east-facing wall, owing to the specific site layout, which caused more significant shading on the western side of the building.
A key trade-off was observed between the installation density and per-module efficiency. Although flush-mounting modules on all available walls and roof areas maximized the total number of PV modules, this led to reduced efficiency for the individual modules. Conversely, despite creating some inter-row self-shading, the optimally tilted rooftop PV systems achieved a higher production efficiency per module and maximized the exposure to solar irradiance.
Table 7 presents the results of comparing the annual energy production calculated using the SketchUp-based PV design tool with the SAM benchmark. The relative error across all cases ranged from 0.15% to 2.25%. The lowest error was observed for the optimally tilted rooftop installation in Daejeon (0.15%), and the highest error was observed for the west-facing wall installation in Busan (2.25%). A consistent trend emerged where rooftop installations exhibited the smallest errors, and west-facing walls showed the largest errors. This suggests that the significant and complex shading on the west-facing wall, stemming from the site layout, poses the greatest challenge to the model. We calculated the ratio of the absolute error to the annual energy production of a single module. The highest observed ratio was 0.97, confirming that the largest errors were smaller than the energy produced by one module per year.
Based on these results, the SketchUp-based PV design tool demonstrated a higher degree of accuracy than the SAM. For its intended application in the initial design stage to assess the feasibility of achieving the target ESR and estimate the required number of PV modules, this error margin is considered practically acceptable. However, the relatively large errors in the cases with heavy wall shading indicate the need for the future refinement of the shadow analysis model. Nevertheless, a maximum relative error of 2.25% across the verification cases that considered diverse installation methods and locations confirmed that the SketchUp-based PV design tool provided sufficient accuracy for the preliminary design and feasibility studies.

4. Case Studies on Diverse Building Masses

4.1. Test Overview

To evaluate the practical applicability of the developed PV design tool, we tested its PSO-based preliminary sizing function on 20 diverse building designs created by architectural design students. These 20 designs, created by architectural design students for a common brief, were not chosen randomly. Instead, they were selected to represent a diverse and realistic range of creative responses typically seen in the early design stage. This set encompasses significant variations in massing (e.g., single vs. complex multi-mass forms), height, floor area, and roof complexity (e.g., simple flat roofs, fragmented multilevel roofs, and intentionally sloped roofs). Using this varied set provides a robust testbed to evaluate the applicability of the tool and performance across a realistic spectrum of architectural concepts, rather than limiting the analysis to standardized or overly simplified building forms.
For each design, the objective of the tool was to devise an optimal PV layout that met a 20% ESR target while minimizing the number of required modules. These designs were modeled as small-scale office buildings situated on the sites shown in Figure 6, adhering to a maximum building coverage ratio of 60% and a floor coverage ratio of 200%.
This analysis focused on PV layouts as determined by building form and massing, thereby excluding detailed envelope elements, such as window placement and area. Although dynamic building energy simulations are typically used for such calculations, they require detailed inputs that are often unavailable in the EDS. Therefore, this study adopted an alternative approach using benchmark energy consumption data per unit area. Specifically, the energy usage intensity (EUI) data for small-scale office buildings were obtained from a study by Ha [39]. The corresponding values for each building floor area are summarized in Table 8.

4.2. Results of Determined Building Masses

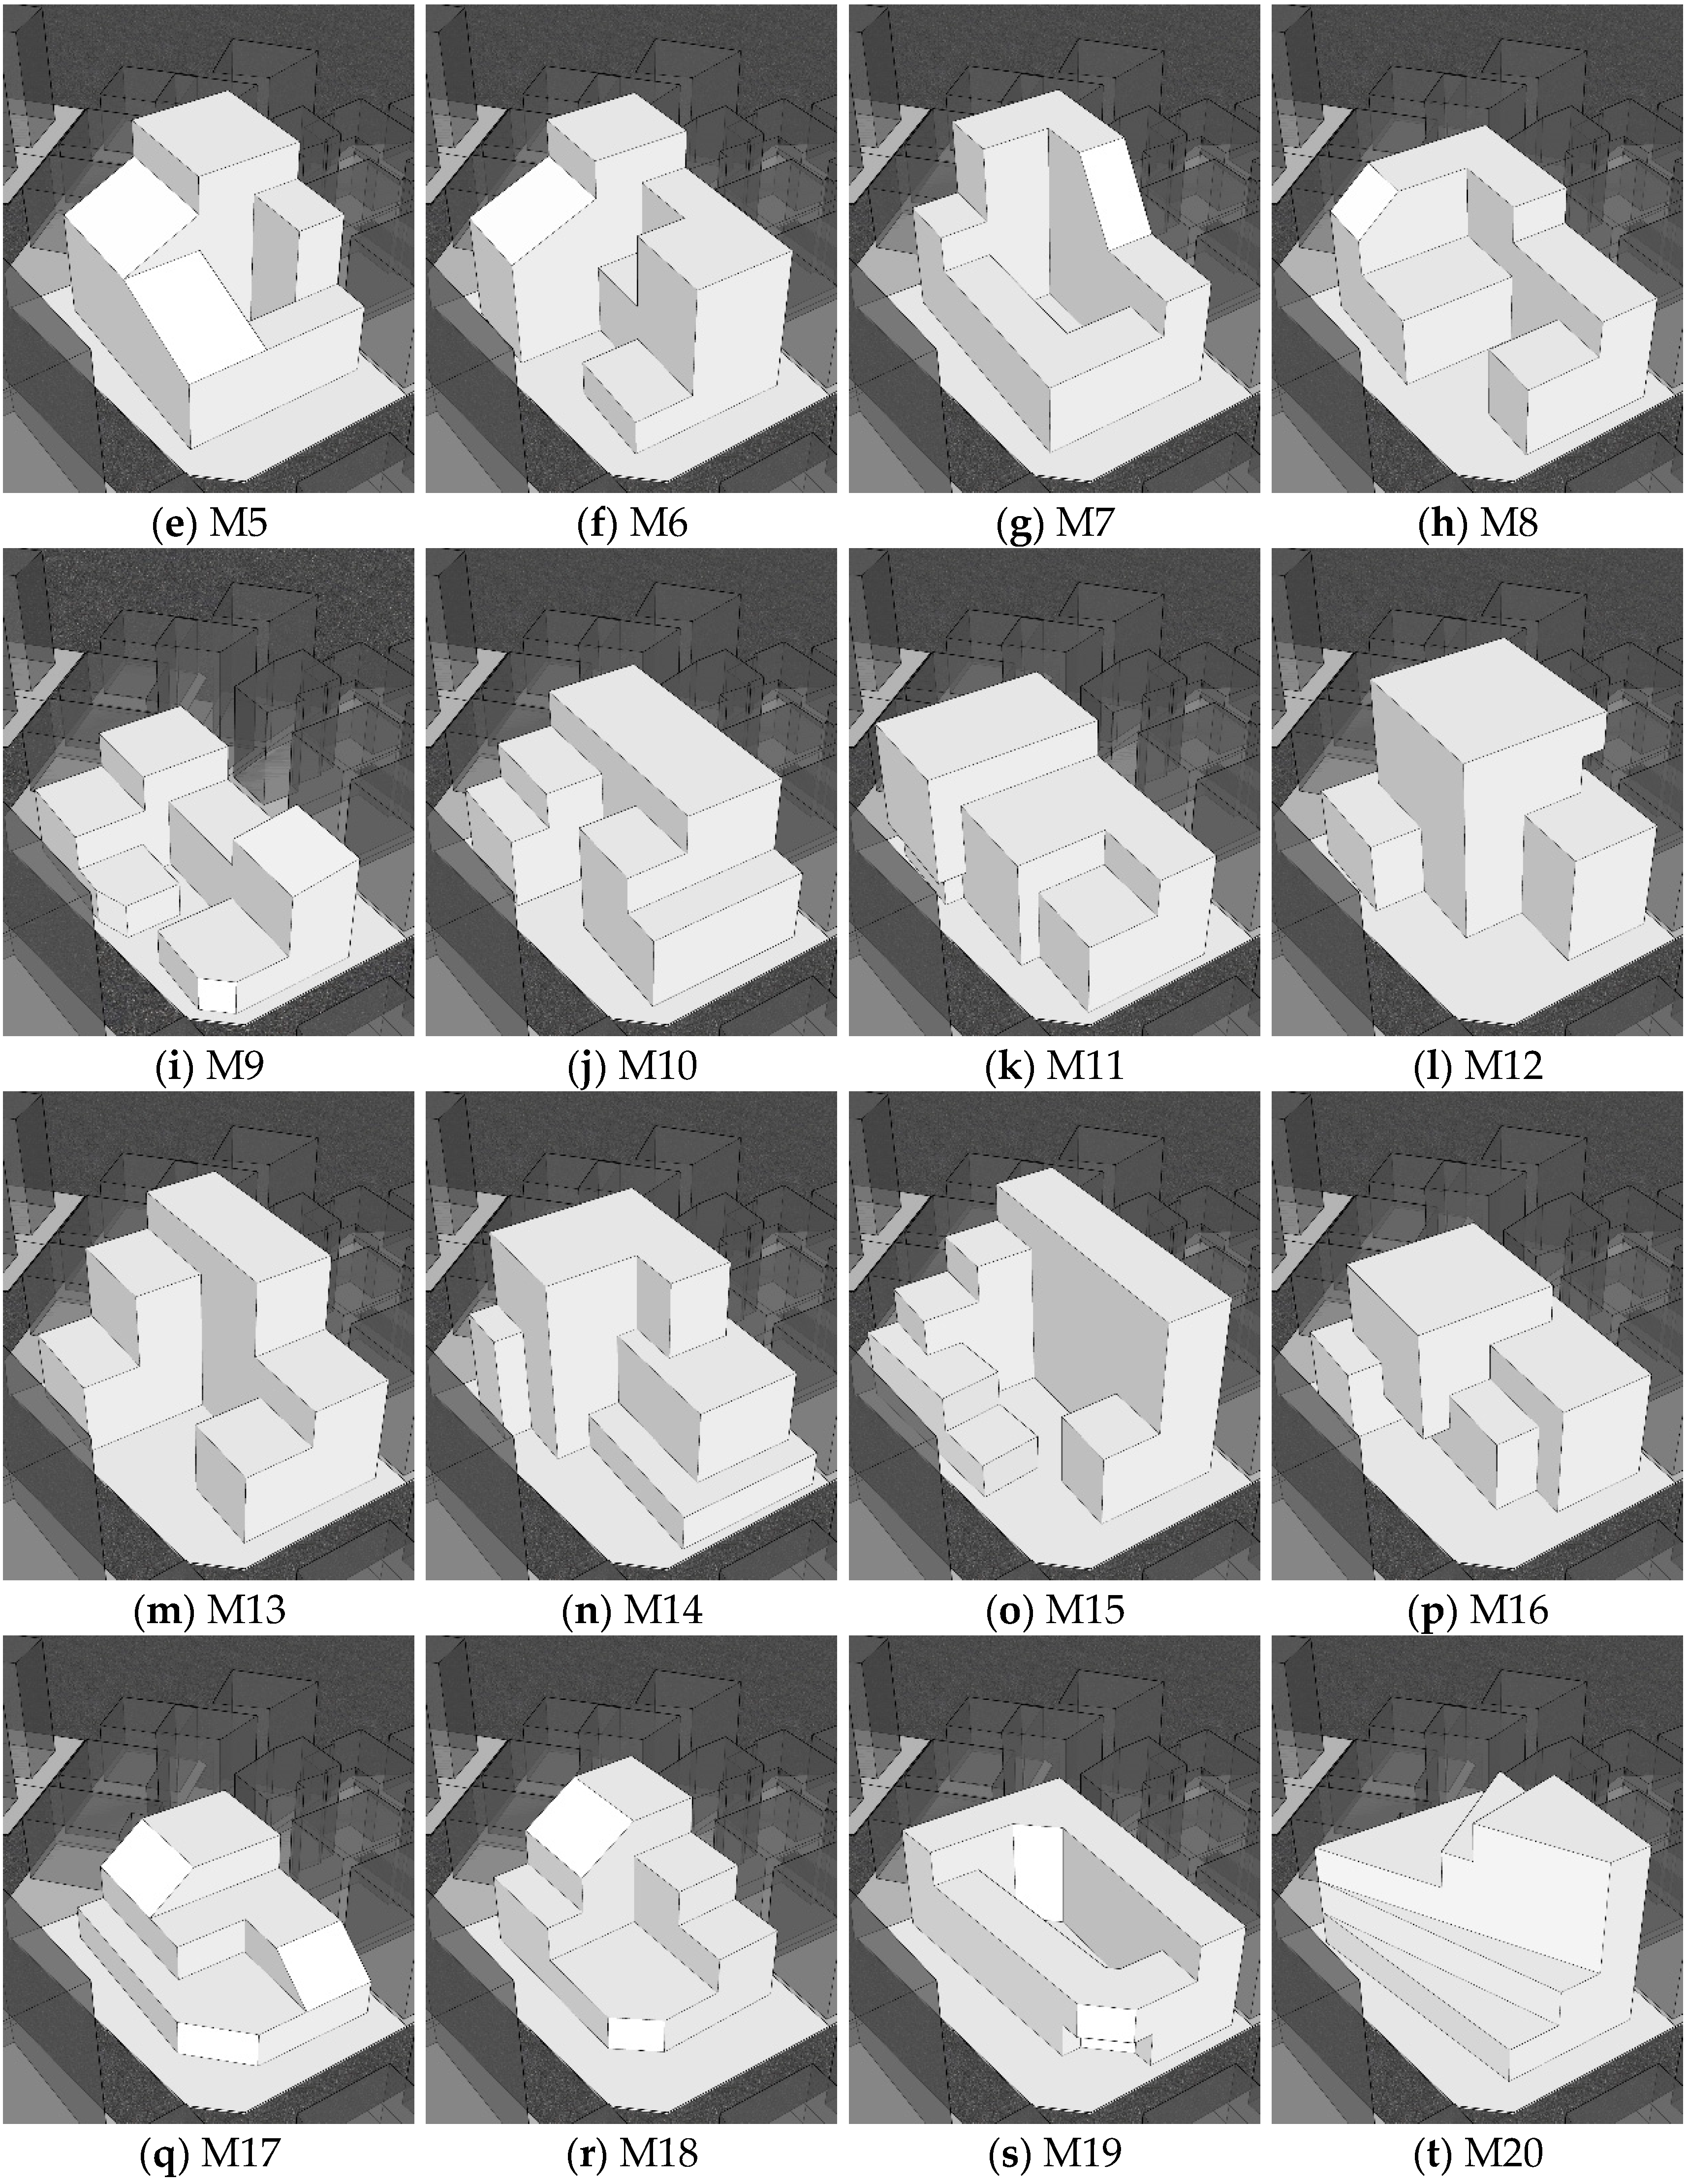
Figure 7 shows the 3D models of the building masses designed by the participants, and Table 9 details the key parameters for each design, including the number of floors, roof and exterior wall areas, and the annual energy consumption. The data revealed wide variation in scale. For instance, model M14 had the largest gross floor area, resulting in the highest estimated annual energy consumption of 263,377 kWh. M17 had the smallest gross floor area, with an annual energy consumption of 144,820 kWh.
Significant diversity was also observed in the roof designs, which is a critical factor for PV system potential. Although M14 had the largest total roof area of 453 m2, its design featured a complex multilevel mass with separate roof sections on the first, third, and fifth floors. Consequently, the primary roof area on the fifth floor, which was the least susceptible to shading, was only 200.1 m2. This is considerably smaller than the single, unobstructed 336 m2 roof of M2, which had a much simpler form. Furthermore, the design varied with the roof geometry. Although most cases featured flat roofs, M5, M6, M8, M17, and M18 were designed with south-facing sloped roofs, which are advantageous for maximizing solar energy capture.

4.3. Results of Optimal Design Alternatives for Each Building Mass

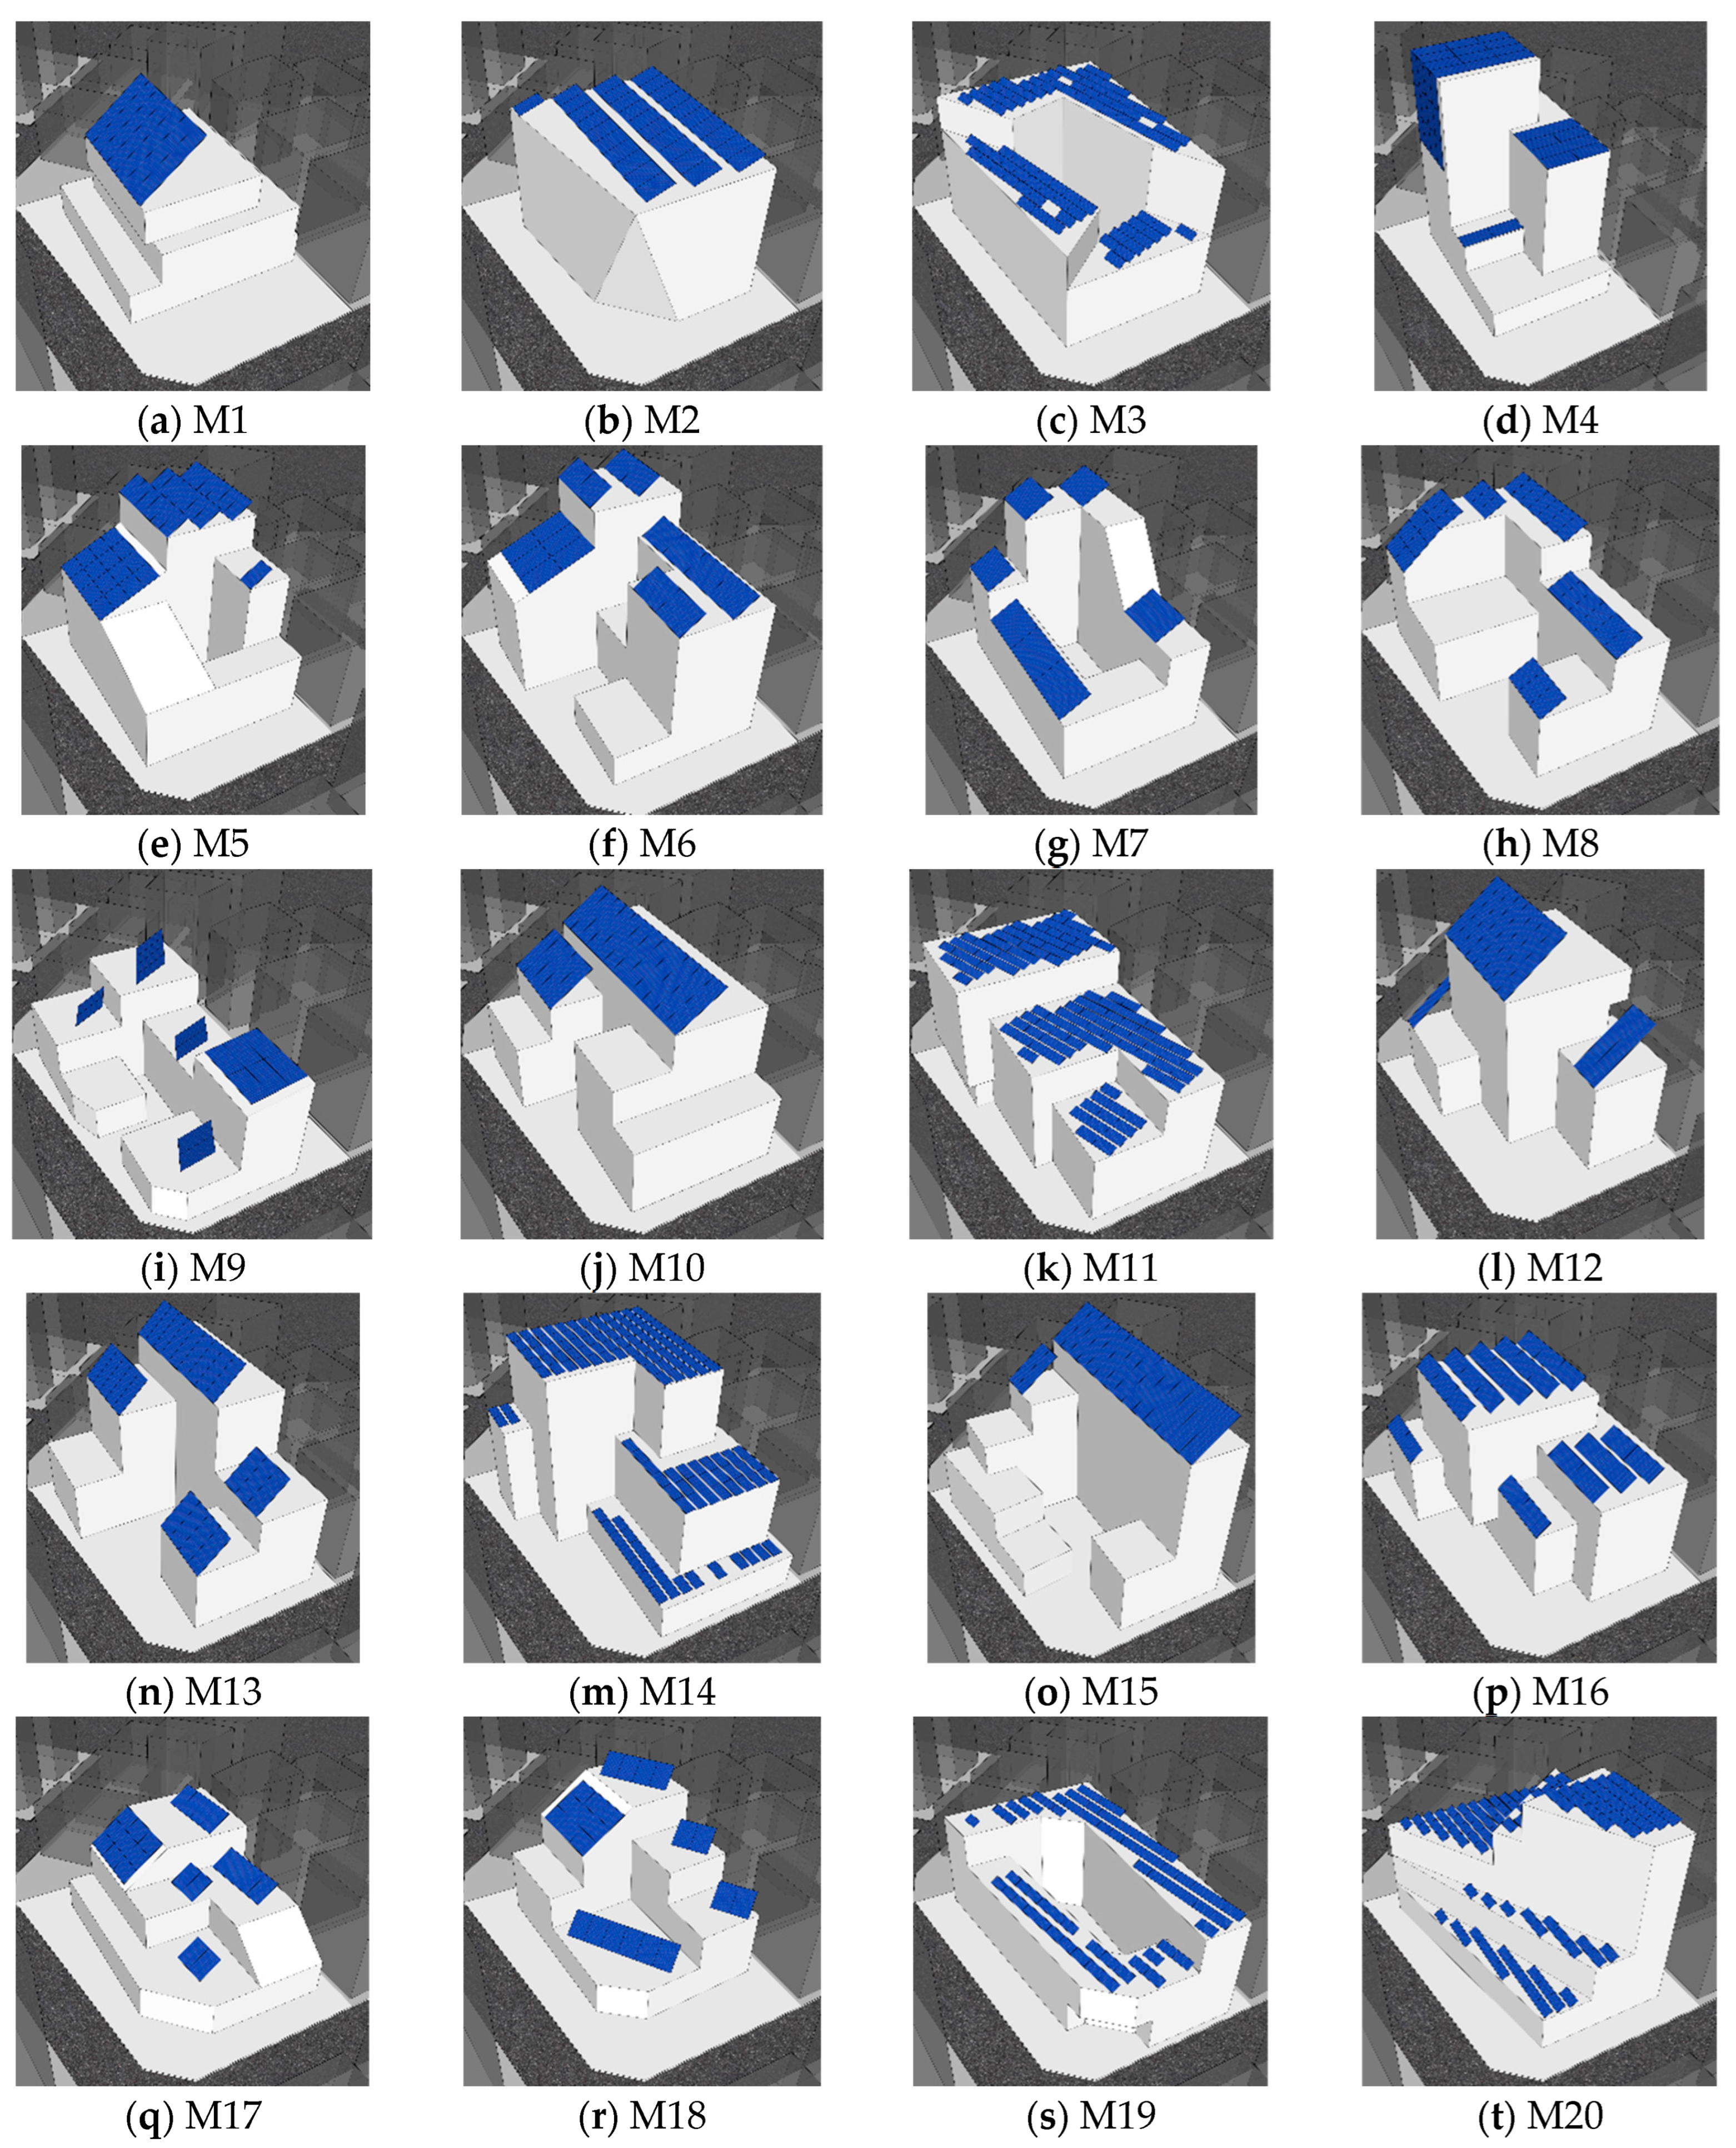
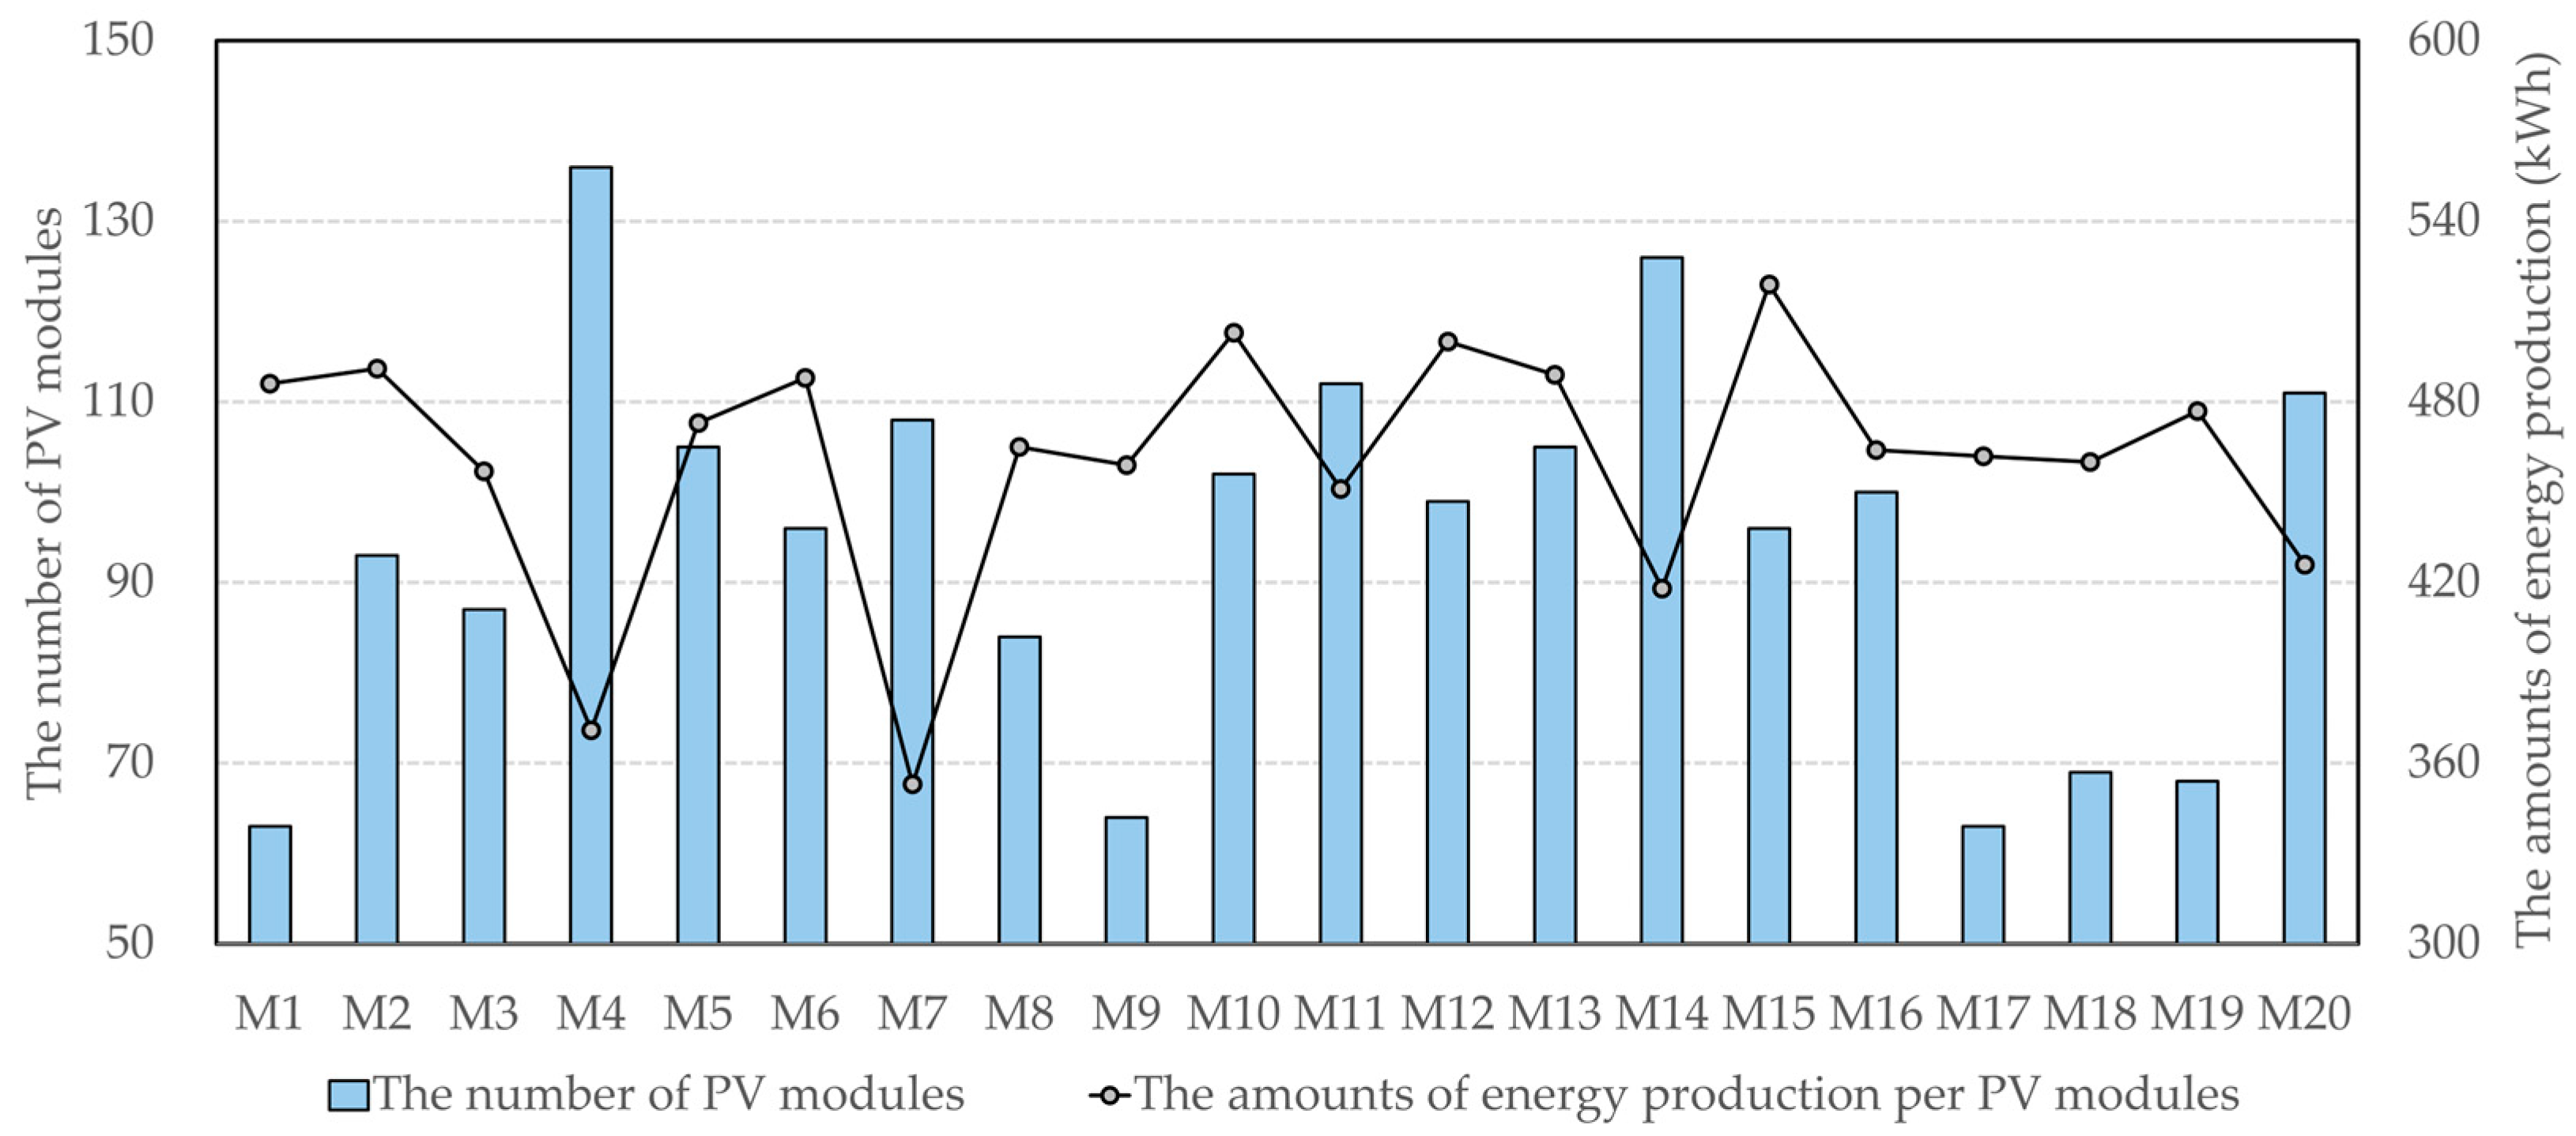
Figure 8 shows the PV module layouts generated using the PV design tool, which are visualized as 3D models in SketchUp. Table 10 presents a detailed summary of each case, including the resulting ESR, number of modules, and installation methods. It is important to note that the number of PV module columns represents the final value of the objective function, which involved minimizing the number of modules required to achieve the target ESR. Figure 9 illustrates the relationship between energy production per PV modules and the total number of modules required for each case. The PV design tool consistently achieved the target, with the final ESR values within a narrow range of 20.0–20.7% for all 20 cases. This demonstrates the robustness of the PV design tool in meeting a specified goal without excessive overprovisioning.
An analysis of the layouts revealed a general strategy for prioritizing the roof surfaces for module installation. This approach is logical because rooftops are typically less affected by shading from surrounding buildings than exterior walls. The layout of M4 is an interesting exception. Despite having available roof space, the tool opted to install modules on south-facing walls. This decision is a direct response to the self-shading geometry of the building; the taller mass of M4 casts shadows on its own lower roof sections, making the south wall a more viable surface for consistent solar radiation and demonstrating the intelligent placement capabilities of the tool.
The tilt angles selected by PSO also indicate effective problem-solving. Most of the solutions utilized tilt angles of 30°, 35°, and 40°, which were clustered around the theoretical optimum of 36° for the Seoul region. This suggests that PSO can effectively explore the most promising solution space. M4 presents a noteworthy exception, in which the tool selected a flush-mounting rooftop. This was a strategic choice driven by the limited optimal space on its fragmented upper roofs. Under such constraints, the algorithm determined that achieving the target ESR required maximizing the number of modules, even at the cost of a slightly lower per-module efficiency.
The optimization of the interarray spacing further demonstrates its ability to mitigate self-shading effects. For instance, for installations with a 30° tilt angle, the required spacing increased from 0.5–1.0 m to 3.0 m as the array height increased from 1 m to 4 m. A similar trend was observed for installations with a 35° tilt. These results confirm that PSO correctly accounts for the geometric relationship between the array height, tilt angle, and the resulting inter-row shading.
Finally, a compelling example of the nuanced decision-making of the PV design tool was found by comparing M5, M6, and M17. Under identical physical conditions (3 m array height, 35° tilt), the tool prescribed a spacing of 1.5 m for M5 and M6 and a much wider spacing of 3.0 m for M17. Although their roof areas were comparable, M17 had a significantly lower annual energy consumption. This means that to reach the 20% ESR target, M17 required fewer modules and thus had more available roof area to spend on a less dense, more efficient layout. PSO intelligently used this surplus area to increase the spacing, thereby minimizing self-shading losses and maximizing the performance of the system.

5. Discussion

5.1. Capabilities

Operating within the SketchUp environment, the SketchUp-based PV design tool successfully processed 3D geometric data from 20 diverse building masses, thereby generating and visualizing optimal PV array layouts without operational issues. This performance confirms that the tool fulfills key requirements for EDS aids identified by Kantersa et al. [10], such as addressing architects’ specific needs, ensuring ease of use, providing clear visualization, facilitating preliminary sizing, and achieving seamless integration with existing design workflows.
A primary advantage of this tool is its potential to empower architects to conduct preliminary PV sizing independently, without immediate reliance on engineering support. Traditionally, this task involves iterative simulations using specialized tools that require significant time and have a steep learning curve. By providing a computationally optimized layout as the starting point, the tool drastically reduces the iterative workload. Architects can then make minor adjustments to this baseline solution to align with esthetic preferences rather than starting from scratch.
Furthermore, this tool can be directly integrated into the formative stages of ZEB design strategies. For instance, if an architect prefers a rooftop-only PV installation but the analysis of the tool, such as in the M4 case, indicates that an exterior wall installation is more effective, this immediate feedback prompts the architect to consider critical design alternatives. These include modifying the building form to reduce self-shading or integrating other RESs. The ability to rapidly test and respond to performance feedback without consulting an engineer is a significant advantage during the EDS.
Finally, the seamless integration tool within the primary architectural design environment addresses a well-documented limitation of the conventional building performance simulation (BPS). While Attia et al. [40] highlighted the necessity of using BPS from the EDS for successful ZEB projects, other studies, such as Østergård et al. [41], have noted that the complexity of these tools makes it unrealistic to explore a wide range of alternatives during the EDS. This dilemma led [42] to advocate for continuous collaboration with engineers from the inception of the project. The SketchUp-based PV design tool offers a practical solution to overcome this challenge. By enabling architects to conduct robust performance and design evaluations independently, it reduces the immediate dependency on engineers and fulfills the need for accessible and active BPS use in the EDS.

5.2. Integrating Mass Studies and PV Performance in Early Design Stage

The results from Section 4.3 confirm that the optimal PV module layout is highly dependent on the building mass. This dependency is clearly demonstrated by contrasting different models; for instance, in the complex, multi-mass form M4, self-shading from taller sections rendered the lower roofs ineffective, leading the optimization algorithm to favor an envelope-based installation. By contrast, the simple, unobstructed form of M2 allowed for a conventional multi-row array of tilted arrays on its large roof surface. These findings underscore the importance of integrating PV energy performance evaluation directly into the EDS, as the building form is a critical determinant of its potential for on-site energy generation and achieving ZEB targets.
Traditionally, architects conduct initial mass studies by synthesizing their design philosophy under multiple constraints, including building codes, programmatic requirements, and structural types [43,44]. More recently, this approach has been augmented by advanced computational techniques, such as generative design. Representative examples include the Generative Design of Revit [45], which uses parametric algorithms to automatically generate and evaluate numerous building mass alternatives, and the Evomass tool [46], which employs genetic algorithms to simultaneously optimize performance while exploring a wide range of design options.
However, current generative design tools often rely on simplified metrics, such as incident solar radiation, as primary performance indicators. This study proposes a more practical path toward ZEBs using a more sophisticated and realistic metric: the calculated actual PV energy production. By incorporating this as the core driver in the mass optimization process, a more effective design strategy can be realized. The PSO-based optimization algorithm presented in this study is particularly suitable for this purpose. It can rapidly assess the viable PV system performance for each massing alternative, enabling a more profound and integrated design study in which the architectural form and tangible energy performance synergistically inform each other from the inception of the project.

5.3. Limitations and Future Research

Despite these achievements, the SketchUp-based PV design tool has several limitations that offer clear directions for future research. First, the calculation of building energy consumption, which is a critical input for determining the ESR, relies on a simplified model. The current approach uses benchmark energy consumption data per unit area, which does not dynamically account for key variables such as the U-values of envelope elements, occupancy, or specific HVAC systems. Although this simplification is pragmatic for the EDS where such details are often undefined, it overlooks the significant impact of building form on energy consumption, as highlighted by Catalina et al. [47]. Different building forms alter the surface-area-to-volume ratio, which directly affects heat loss and solar heat gain. Therefore, future work should focus on developing a more sophisticated, form-sensitive energy prediction algorithm to improve the accuracy of the critical EDS.
Second, the proposed optimization process focuses on technical and economic performance, specifically minimizing the number of PV modules required to meet the target ESR. The objective function does not incorporate esthetic considerations, which are often the primary drivers of an architect’s decision-making process. The workflow of the tool is designed to propose a technically optimal solution that the architect can manually adjust to meet esthetic goals. However, referencing recent studies that attempt to quantify esthetics, a future iteration of the tool could integrate user-defined esthetic preferences into the optimization algorithm. This would enable the generation of solutions that are more holistic and immediately viable from both the technical and design perspectives.
Finally, this study was limited by the absence of formal usability testing with intended users, such as practicing architects. A gap may exist between a computationally optimal layout and a practical and desirable solution within a real-world architectural workflow. If the automatically generated layout requires significant manual revision to align it with the architect’s intent, the efficiency benefits of the tool could be diminished. Therefore, the next step is to conduct user studies to evaluate the practical utility of the proposed PV design tool, assess its impact on the design process, and validate its effectiveness in facilitating the development of ZEB strategies.

6. Conclusions

This paper details the development and validation of a PV system design tool integrated within SketchUp and specifically tailored for the EDS of ZEB projects. The key contributions and findings of this study are as follows.
First, the energy performance calculation algorithm of the tool demonstrated high fidelity, exhibiting a maximum relative error of just 2.25% when benchmarked against the established SAM. Ray casting-based shadow analysis also accurately modeled complex shading effects, confirming its suitability for preliminary design.
Second, the integrated PSO was demonstrably robust and efficient. It consistently identified economically optimal solutions by minimizing the required number of PV modules while reliably meeting the target ESR across a case study of 20 diverse building forms.
Third, by operating as a fully integrated SketchUp plugin, the tool empowers architects to conduct PV evaluations within their native design environments. This seamless integration directly addresses the critical usability and accessibility barriers that have limited the adoption of performance simulation tools in previous studies.
A practical implication of this tool is that it provides an agile and informed EDS process for ZEB. Architects can rapidly make key decisions without immediate reliance on engineering support. The ability to receive instant performance feedback when modifying a building’s mass allows for an integrated approach in which energy considerations directly inform the architectural form. The simultaneous visualization of performance data and esthetics enhances this process, demonstrating the significant potential of this tool for application in real-world architectural projects.
This study had several limitations, primarily the use of a simplified model for building energy consumption and the absence of quantitative esthetic criteria for the optimization process. Despite these limitations, this study represents a significant step forward by offering a practical and accessible solution for PV system planning in the EDS of ZEB projects. It successfully promotes a more integrated approach, bridging the gap between architectural design, energy performance, and economic feasibility from the inception of a project.

Author Contributions

Conceptualization, S.H.B.; methodology, S.H.B.; software, J.H.P.; formal analysis, J.H.P. and S.H.B.; investigation, J.H.P. and S.H.B.; data curation, J.H.P.; writing—original draft preparation, J.H.P. and S.H.B.; writing—review and editing, J.H.P. and S.H.B.; visualization, J.H.P.; supervision, S.H.B. All authors have read and agreed to the published version of the manuscript.

Funding

This research received no external funding.

Data Availability Statement

The original contributions presented in the study are included in the article, further inquiries can be directed to the corresponding author.

Conflicts of Interest

The authors declare no conflicts of interest.

Nomenclature

T a Ambient temperature [°C]
T m PV module rear surface temperature [°C]
T c PV cell temperature [°C]
T r PV module STC temperature [°C]
I Total irradiance incident on the PV module surface [W/m2]
A m PV module area [m2]
L D c PV module DC power generation loss rate [%]
L A c Loss rate excluding inverter AC conversion efficiency [%]
h p v Vertical length of the PV module [m]
P D c DC power output of the PV module [W]
P A c AC power converted by the inverter [W]
N P V Required number of PV modules meeting the target ESR [-]
E S R Energy self-sufficiency rate [-]
E S Annual energy supply from the RES [Wh]
E C Annual building energy consumption [Wh]
η p PV module efficiency as a function of cell temperature [°C]
α s u n Sun altitude angle [°]
θ p v Tilt angle of the PV module [°]
η r PV module nominal efficiency [%]
η i Inverter conversion efficiency [%]
β p PV module temperature coefficient [%/°C]
T Temperature coefficient [°C]
a Temperature coefficient [-]
b Temperature coefficient [-]
V w Wind speed [m/s]

References

  1. Attia, S.; Gratia, E.; De Herde, A.; Hensen, J.L. Simulation-Based Decision Support Tool for Early Stages of Zero-Energy Building Design. Energy Build. 2012, 49, 2–15. [Google Scholar] [CrossRef]
  2. Bogenstätter, U. Prediction and Optimization of Life-Cycle Costs in Early Design. Build. Res. Inf. 2000, 28, 376–386. [Google Scholar] [CrossRef]
  3. Li, D.H.; Yang, L.; Lam, J.C. Zero Energy Buildings and Sustainable Development Implications—A Review. Energy 2013, 54, 1–10. [Google Scholar] [CrossRef]
  4. Araji, M.T. Surface-to-Volume Ratio: How Building Geometry Impacts Solar Energy Production and Heat Gain through Envelopes. IOP Conf. Ser. Earth Environ. Sci. 2019, 323, 012034. [Google Scholar] [CrossRef]
  5. Liang, H.; Shen, J.; Yip, H.-L.; Fang, M.M.; Dong, L. Unleashing the Green Potential: Assessing Hong Kong’s Building Solar PV Capacity. Appl. Energy 2024, 369, 123567. [Google Scholar] [CrossRef]
  6. Sánchez-Pantoja, N.; Vidal, R.; Pastor, M.C. Aesthetic Perception of Photovoltaic Integration within New Proposals for Ecological Architecture. Sustain. Cities Soc. 2018, 39, 203–214. [Google Scholar] [CrossRef]
  7. Zhou, A.; Thomaschke, R.; Wessels, A.; Glunz, S.; Speck, T.; Kiesel, A. (Not) in My City: An Explorative Study on Social Acceptance of Photovoltaic Installations on Buildings. Technol. Soc. 2024, 79, 102725. [Google Scholar] [CrossRef]
  8. Haghighi, Z.; Dehnavi, M.A.; Konstantinou, T.; van den Dobbelsteen, A.; Klein, T. Architectural Photovoltaic Applications: Lessons Learnt and Perceptions from Architects. Buildings 2021, 11, 62. [Google Scholar] [CrossRef]
  9. Jakica, N. State-of-the-Art Review of Solar Design Tools and Methods for Assessing Daylighting and Solar Potential for Building-Integrated Photovoltaics. Renew. Sustain. Energy Rev. 2018, 81, 1296–1328. [Google Scholar] [CrossRef]
  10. Kanters, J.; Horvat, M.; Dubois, M.-C. Tools and Methods Used by Architects for Solar Design. Energy Build. 2014, 68, 721–731. [Google Scholar] [CrossRef]
  11. Panicker, K.; Anand, P.; George, A. Assessment of Building Energy Performance Integrated with Solar PV: Towards a Net Zero Energy Residential Campus in India. Energy Build. 2023, 281, 112736. [Google Scholar] [CrossRef]
  12. Imalka, S.T.; Yang, R.J.; Zhao, Y. Machine Learning Driven Building Integrated Photovoltaic (BIPV) Envelope Design Optimization. Energy Build. 2024, 324, 114882. [Google Scholar] [CrossRef]
  13. Vahdatikhaki, F.; Salimzadeh, N.; Hammad, A. Optimization of PV Modules Layout on High-Rise Building Skins Using a BIM-Based Generative Design Approach. Energy Build. 2022, 258, 111787. [Google Scholar] [CrossRef]
  14. Wijeratne, W.P.U.; Samarasinghalage, T.I.; Yang, R.J.; Wakefield, R. Multi-Objective Optimisation for Building Integrated Photovoltaics (BIPV) Roof Projects in Early Design Phase. Appl. Energy 2022, 309, 118476. [Google Scholar] [CrossRef]
  15. Muthumanickam, N.K.; Duarte, J.P.; Simpson, T.W. Multidisciplinary Concurrent Optimization Framework for Multi-Phase Building Design Process. Artif. Intell. Eng. Des. Anal. Manuf. 2023, 37, e3. [Google Scholar] [CrossRef]
  16. Freitas, J.d.S.; Cronemberger, J.; Soares, R.M.; Amorim, C.N.D. Modeling and Assessing BIPV Envelopes Using Parametric Rhinoceros Plugins Grasshopper and Ladybug. Renew. Energy 2020, 160, 1468–1479. [Google Scholar] [CrossRef]
  17. Ning, G.; Kan, H.; Zhifeng, Q.; Weihua, G.; Geert, D. E-BIM: A BIM-Centric Design and Analysis Software for Building Integrated Photovoltaics. Autom. Constr. 2018, 87, 127–137. [Google Scholar] [CrossRef]
  18. El Sayary, S.; Omar, O. Designing a BIM Energy-Consumption Template to Calculate and Achieve a Net-Zero-Energy House. Sol. Energy 2021, 216, 315–320. [Google Scholar] [CrossRef]
  19. Salimzadeh, N.; Vahdatikhaki, F.; Hammad, A. Parametric Modeling and Surface-Specific Sensitivity Analysis of PV Module Layout on Building Skin Using BIM. Energy Build. 2020, 216, 109953. [Google Scholar] [CrossRef]
  20. Lin, Q.; Kensek, K.; Schiler, M.; Choi, J. Streamlining Sustainable Design in Building Information Modeling BIM-Based PV Design and Analysis Tools. Archit. Sci. Rev. 2021, 64, 467–477. [Google Scholar] [CrossRef]
  21. Xiang, Y.; Mahamadu, A.-M.; Florez-Perez, L. Engineering Information Format Utilisation across Building Design Stages: An Exploration of BIM Applicability in China. J. Build. Eng. 2024, 95, 110030. [Google Scholar] [CrossRef]
  22. da Silva, T.F.L.; Vieira, D.R.; de Carvalho, M.M. Exploring the Challenges in Building Information Modeling (BIM) during the Design Phase: Evidence from Cross-Country Studies. IEEE Trans. Eng. Manag. 2024, 71, 14846–14860. [Google Scholar] [CrossRef]
  23. Bazafkan, E.; Pont, U.; Mahdavi, A. Usability and Usefulness of Non-Conventional Building Performance Simulation Tools in Architectural Design Processes. Appl. Mech. Mater. 2019, 887, 219–226. [Google Scholar] [CrossRef]
  24. Chopra, A.; Laura, T. Introduction to Google Sketchup, 1st ed.; John Wiley & Sons Inc.: Hoboken, NJ, USA, 2007. [Google Scholar]
  25. Tang, H.; Wang, C.X. Discussing Sketchup Software in the Application of Architectural Design Teaching. J. Theor. Appl. Inf. Technol. 2013, 48, 1319–1323. [Google Scholar]
  26. American Society of Heating Refrigerating and Air-Conditioning Engineers. 2013 ASHRAE Handbook—Fundamentals; American Society of Heating Refrigerating and Air-Conditioning Engineers: Atlanta, GA, USA, 2013. [Google Scholar]
  27. Gilman, P. SAM Photovoltaic Model Technical Reference Update; National Renewable Energy Laboratory (NREL): Golden, CO, USA, 2018. Available online: https://sam.nrel.gov/images/web_page_files/sam-help-2018-11-11-r4.pdf (accessed on 15 May 2025).
  28. CETC. Clean Energy Project Analysis: RetScreen® Engineering & Cases Textbook—Photovoltaic Project Analysis Chapter; CANMET Energy Technology Centre—Varennes (CETC): Varennes, QC, Canada, 2004. [Google Scholar]
  29. Reindl, D.T. Estimating Diffuse Radiation on Horizontal Surfaces and Total Radiation on Tilted Surfaces. Ph.D. Thesis, University of Wisconsin, Madison, WI, USA, 1988. [Google Scholar]
  30. Liu, B.Y.; Jordan, R.C. The Long-Term Average Performance of Flat-Plate Solar-Energy Collectors: With Design Data for the US, Its Outlying Possessions and Canada. Sol. Energy 1963, 7, 53–74. [Google Scholar] [CrossRef]
  31. King, D.L.; Kratochvil, J.A.; Boyson, W.E. Photovoltaic Array Performance Model; Sandia National Laboratories: Albuquerque, NM, USA, 2004; Volume 8. [Google Scholar]
  32. Evans, D.L. Simplified Method for Predicting Photovoltaic Array Output. Sol. Energy 1981, 27, 555–560. [Google Scholar] [CrossRef]
  33. Barber, K.A.; Krarti, M. A Review of Optimization Based Tools for Design and Control of Building Energy Systems. Renew. Sustain. Energy Rev. 2022, 160, 112359. [Google Scholar] [CrossRef]
  34. Bichiou, Y.; Krarti, M. Optimization of Envelope and HVAC Systems Selection for Residential Buildings. Energy Build. 2011, 43, 3373–3382. [Google Scholar] [CrossRef]
  35. Shi, Y.; Eberhart, R. A Modified Particle Swarm Optimizer. In Proceedings of the 1998 IEEE International Conference on Evolutionary Computation Proceedings, IEEE World Congress on Computational Intelligence (Cat. No.98TH8360), Anchorage, AK, USA, 4–9 May 1998; pp. 69–73. [Google Scholar]
  36. Clerc, M.; Kennedy, J. The Particle Swarm-Explosion, Stability, and Convergence in a Multidimensional Complex Space. IEEE Trans. Evol. Comput. 2002, 6, 58–73. [Google Scholar] [CrossRef]
  37. Blair, N.; DiOrio, N.; Freeman, J.; Gilman, P.; Janzou, S.; Neises, T.; Wagner, M. System Advisor Model (SAM) General Description (Version 2017.9.5); NREL: Golden, CO, USA, 2018. Available online: https://www.nrel.gov/docs/fy18osti/70414.pdf (accessed on 15 May 2025).
  38. Freeman, J.; Whitmore, J.; Blair, N.; Dobos, A.P. Validation of Multiple Tools for Flat Plate Photovoltaic Modeling against Measured Data. In Proceedings of the 2014 IEEE 40th Photovoltaic Specialist Conference (PVSC), Denver, CO, USA, 8–13 June 2014; pp. 1932–1937. [Google Scholar]
  39. Soo-Yeon, H. Statistical Analysis of Energy Use Intensity by End Use in Sample Office Buildings Based on Measurement Data; Ewha Womans University: Seoul, Republic of Korea, 2019. [Google Scholar]
  40. Attia, S.; De Herde, A.; Gratia, E.; Hensen, J.L.M. Achieving Informed Decision-Making for Net Zero Energy Buildings Design Using Building Performance Simulation Tools. Build. Simul. 2013, 6, 3–21. [Google Scholar] [CrossRef]
  41. Østergård, T.; Jensen, R.L.; Maagaard, S.E. Early Building Design: Informed Decision-Making by Exploring Multidimensional Design Space Using Sensitivity Analysis. Energy Build. 2017, 142, 8–22. [Google Scholar] [CrossRef]
  42. White, T.; Dec, M.; Troy, D.; Thornton, B. Effective Early Collaboration Between Engineers and Architects for Successful Energy-Efficient Design. In Proceedings of the SimBuild Conference 2008: 3rd Conference of IBPSA-USA, Berkeley, CA, USA, 30 July–1 August 2008; pp. 182–189. [Google Scholar]
  43. Akin, O.; Moustapha, H. Strategic Use of Representation in Architectural Massing. Des. Stud. 2004, 25, 31–50. [Google Scholar] [CrossRef]
  44. Huang, Y.-S.; Chang, W.-S.; Shih, S.-G. Building Massing Optimization in the Conceptual Design Phase. Comput.-Aided Des. Appl. 2015, 12, 344–354. [Google Scholar] [CrossRef]
  45. Villaggi, L.; Nagy, D. Generative Design for Architectural Space Planning: The Case of the Autodesk University 2017 Layout. 2019. Available online: https://static.au-uw2-prd.autodesk.com/Class_Handout_AS124721_Generative_Design_for_Architectural_Space_Planning_The_Case_of_the_Autodesk_University_2017_Layout_Lorenzo_Villaggi.pdf (accessed on 10 June 2025).
  46. Wang, L.; Janssen, P.; Ji, G. Optimization-Based Design Exploration of Building Massing Typologies—EvoMass and a Typology-Oriented Computational Design Optimization Method for Early-Stage Performance-Based Building Massing Design. Front. Archit. Res. 2024, 13, 1400–1422. [Google Scholar] [CrossRef]
  47. Catalina, T.; Virgone, J.; Iordache, V. Study on the Impact of the Building Form on the Energy Consumption. In Proceedings of the Building Simulation 2011, Sydney, Australia, 14–16 November 2011; pp. 1726–1729. [Google Scholar]
Figure 1. Flowchart of PV system energy performance calculation algorithm.
Buildings 15 02863 g001
Figure 2. Concept of ray casting-based simplified shading evaluation.
Buildings 15 02863 g002
Figure 3. Conceptual framework for SketchUp-based PV system design tool.
Buildings 15 02863 g003
Figure 4. Graphical User Interface (GUI) for simple user input.
Buildings 15 02863 g004
Figure 5. Optimal PV module deployment meeting the target ESR.
Buildings 15 02863 g005
Figure 6. Site model.
Buildings 15 02863 g006
Figure 7. Design alternatives.
Buildings 15 02863 g007aBuildings 15 02863 g007b
Figure 8. Determined PV module layouts satisfying the target ESR of 20%.
Buildings 15 02863 g008
Figure 9. Required number of PV modules and amount of energy production per PV module for each building design.
Buildings 15 02863 g009
Table 1. a, b, and T according to PV type and installation method.
PV TypeStructure and Mountingab T
Mono and polyGlass/Cell/Glass—Open Rack−3.47−0.05943
Glass/Cell/Glass—Close Roof Mount−2.98−0.04711
Thin filmPolymer/Thin Film/Steel—Open Rack−3.58−0.1133
Table 2. Specification of decision variables.
Variable NameUnitRangeStep Value
PV array tilt°0–905
PV array azimuth°−180–+1805
PV modules per array (Horizontal count)-1–201
PV modules per array (Vertical count)-1–201
Roof PV coverage ratio%0–1001
Exterior wall PV coverage ratio%0–1001
Inter-PV array spacingm 2 3 · h p v h p v · s i n   ( α s u n + θ p v ) s i n   ( θ p v ) 0.5
Table 3. Values of parameters for PSO algorithm.
Variable NameValues
Number of particles100
Maximum iterations100
Inertia weight (w)0.9–0.4
Cognitive coefficient (c1)2.45
Social coefficient (c2)1.65
Table 4. Verification cases.
Case No.RegionLocation of PVInstallation MethodNumber of PV Modules
Case1SeoulRoofFlush-mounting228
Case2 RoofOptimally tilted108
Case3 Exterior wall facing southFlush-mounting48
Case4 Exterior wall facing eastFlush-mounting36
Case5 Exterior wall facing westFlush-mounting36
Case6DaejeonRoofFlush-mounting228
Case7 RoofOptimally tilted99
Case8 Exterior wall facing southFlush-mounting48
Case9 Exterior wall facing eastFlush-mounting36
Case10 Exterior wall facing westFlush-mounting36
Case11BusanRoofFlush-mounting228
Case12 RoofOptimally tilted99
Case13 Exterior wall facing southFlush-mounting48
Case14 Exterior wall facing eastFlush-mounting36
Case15 Exterior wall facing westFlush-mounting36
Table 5. Parameters of PV systems.
ParametersUnitValue
PV module type-Mono
Area of PV modulem20.74
Efficiency of PV module%19.0
Temperature coefficient of PV cell%/°C0.4
Maximum power of PV modulekW0.14
Efficiency of inverter%95.777
Table 6. Loss factors applied in power generation performance calculation for PV systems.
ParametersDescriptionValue [%]
PV mismatchPV module mismatch losses 0.5
Diodes and connectionsDiode and interconnection losses2.0
DC wiringDC cabling losses between PV modules2.0
AC wiringInverter-to-grid AC wiring losses1.0
Table 7. Verification results for PV system energy performance evaluation.
Case No.Amount of Yearly Generated
Energy from PV System
Error in The Yearly Energy
Production
Absolute Error-to-PV Module Yield Ratio [-]
SAM [kWh/yr]PV Design Tool [kWh/yr]Relative Error [%]Absolute Error [kWh/yr]
Case165,31465,1590.241550.54
Case242,50542,1240.903810.97
Case310,08010,1530.72730.35
Case4712071620.59420.21
Case5530253861.60850.58
Case667,36667,2680.15980.33
Case742,07141,8390.552310.54
Case810,59810,6790.77810.37
Case9746775300.84630.30
Case10583159211.54900.56
Case1167,52167,3840.201370.46
Case1242,39442,0850.733100.72
Case13897990610.91820.44
Case14602560851.00600.36
Case15431844152.25970.81
Table 8. Annual energy consumption of office buildings per unit area by floor area range.
Total Floor Area Range (m2)Annual Energy Consumption Per Unit Area (kWh/m2·yr)
Less than 3000115.3
3000–9999126.4
More than 10,000171.9
Table 9. Values for major design variables for each building mass.
Design No.Number of Floors
[-]
Total Floor Area
[m2]
Roof Surface Area
[m2]
Exterior Wall Surface Area
[m2]
Estimated Yearly Energy Consumption
[kWh]
M13883412816151,787
M2413233361168227,388
M3411553411761198,625
M4714653401728251,838
M5514442111805248,224
M6513583041705233,355
M7510733021763184,363
M8411363511462195,193
M938514131115146,263
M10414924521504256,476
M11414684521344252,349
M12514373901546246,964
M13514884101728255,787
M14515324531600263,377
M15514344002008246,454
M16413424201324230,655
M173842349854144,820
M1849243241065158,913
M1939433691525162,147
M20513724351387235,898
Table 10. Numerical values of the optimal design alternative for each building mass. The number of PV module columns indicates the minimized result of the objective function for each case.
Design No.ESRAmount of Energy Production Per PV Module [kWh]Number of PV ModulesSpecifics of PV Modules Installation
At RoofAt Exterior WallsTilt Angle Azimuth Angle Inter-PV Array Spacing
M120.2%486630400-
M220.1%4919302002
M320.0%45787035−150.5
M420.0%3718848000
M520.0%47310503501.5
M620.1%4889603503
M720.7%35310803003
M820.0%4658403002.5
M920.1%4596404025-
M1020.0%5031020350-
M1120.0%451112020−200.5
M1220.1%500990400-
M1320.1%4891050450-
M1420.0%41812601000.5
M1520.2%519960400-
M1620.1%46410004001.5
M1720.1%46263035−53
M1820.0%46069040−35-
M1920.0%47768030−101
M2020.0%42611103000.5
Disclaimer/Publisher’s Note: The statements, opinions and data contained in all publications are solely those of the individual author(s) and contributor(s) and not of MDPI and/or the editor(s). MDPI and/or the editor(s) disclaim responsibility for any injury to people or property resulting from any ideas, methods, instructions or products referred to in the content.