Article

A Study on the Driving Factors of Resilience in the Carbon Footprint Knowledge System of Construction Companies

1
School of Business Administration, Liaoning University of Science and Technology, Anshan 114051, China
2
School of Economics and Management, Liaoning University of Technology, Jinzhou 121001, China
*
Author to whom correspondence should be addressed.
Buildings 2025, 15(16), 2856; https://doi.org/10.3390/buildings15162856
Submission received: 13 July 2025 / Revised: 8 August 2025 / Accepted: 9 August 2025 / Published: 13 August 2025
(This article belongs to the Section Construction Management, and Computers & Digitization)

Abstract

Against the background of carbon emission reduction, this paper explores the driving factors of carbon footprint knowledge system toughness for building construction enterprises through the theory of constraints (TOC) and optimises the carbon footprint knowledge system toughness under static and dynamic perspectives, respectively. Under the static perspective, the fuzzy set qualitative comparative analysis method (fsQCA) is used to explore the development path of the carbon footprint knowledge system toughness for building construction enterprises, and the study finds three kinds of grouping paths. Under the dynamic perspective, system dynamics is used to analyse the causality of the driving factors of the carbon footprint knowledge system toughness and draw the causality diagram. The stock flow diagram is drawn according to the relationship between the factors, and G1 method is combined with the expert distribution to determine the weight of each factor, and then, the model equation is established to complete the construction of the system dynamics of the carbon footprint knowledge system toughness based on the control variable method of the four capabilities under the influence of the factors to simulate the comparison and to explore the extent of the influence of different factors on the carbon footprint knowledge system toughness. Through the two-dimensional analysis framework, we provide an integrated solution for path selection and dynamic regulation for building construction enterprises to help them achieve the adaptive optimisation of the carbon footprint knowledge system and promote the low-carbon transformation and sustainable development of the construction industry. Qualitative results show that three configuration paths affect resilience, with core factors including management, emission, predictive, and construction capabilities. Quantitative results indicate fsQCA overall consistency (0.861) and coverage (0.808); system dynamics simulation shows that management capability has the highest impact weight (0.355).

1. Introduction and Theory

1.1. Introduction

Since the construction sector is responsible for almost 30% of the nation’s energy consumption in urbanising regions, efforts to reduce carbon emissions have been a key component of global efforts to combat climate change [1,2,3,4]. Greenhouse gas emissions from the building, operation, and demolition phases pose serious environmental risks, making carbon footprint management crucial for sustainable development.
Nevertheless, current research on the robustness of carbon management frequently ignores the integration of multi-factor interactions in favour of static factor analysis or single-factor dynamic modelling. This gap restricts our comprehension of how construction companies might optimise their carbon footprint knowledge systems in an adaptive manner.
This study fills this gap by combining system dynamics and fuzzy set qualitative comparative analysis (fsQCA). The following are the study’s objectives. The first step is to use fsQCA to identify critical factor configurations that affect resilience. The second step is to create a system dynamics model that simulates how resilience evolves. Lastly, the following is the arrangement of the paper’s structure. Section 2 describes the methods and materials; Section 3 discusses main outcomes, limitations and further recommendations; Section 4 presents the discussion and countermeasures.

1.2. Theory

1.2.1. Overview of Theory

Theory of Constraints (TOC) Overview
In order to find and remove systemic restrictions, Dr. Goldratt suggested TOC as a technology-driven management approach. By identifying obstacles to organisational goals, it helps businesses accomplish their objectives and create long-term plans through methodical improvement, which includes identifying, analysing, and removing constraints [5]. To improve the effectiveness of production management, TOC concentrates on resolving important bottlenecks.
Resilience of the Carbon Footprint Knowledge System
With carbon footprint analysis rapidly gaining scholarly acceptance, low-carbon development is positioned as the key to climate action due to global climate concerns fuelled by rising carbon emissions. There are two types of carbon: carbon sources, which release carbon into the atmosphere to increase concentrations, and carbon sinks, which absorb carbon to lower them [6]. The term carbon footprint is derived from ecological footprint theory and is used to quantify human-induced carbon emissions. It is defined as activity-specific carbon output by Fu Wei et al. [7] and as greenhouse gas emissions (or lifecycle product emissions in CO2 equivalents) by Ke Shui Fa [8]. The concept varies depending on the research methodology.
Social psychology-based resilience has connections to risk management, ecological vulnerability, environmental uncertainty, and recovery after a disaster. The ability of an organisation to modify and manage crises in the face of uncertainty is widely used in management, economics, and engineering [9]. It is revealed as positive reactions to shocks, perseverance, adjustment, stress tolerance, and functional maintenance/enhancement [10,11,12,13]. The enterprise knowledge system’s resilience reflects crisis-coping skills, whereas the carbon footprint knowledge system incorporates carbon-related knowledge.

1.2.2. Motivating Elements for Resilience Construction of Carbon Footprint Knowledge System Based on TOC

The building industry, a significant source of carbon emissions, continues to experience difficulties in reducing its emissions. Optimising its carbon footprint using TOC helps achieve emission reduction and energy conservation objectives. Using four capabilities—management, construction, forecasting, and carbon emission—it is possible to identify carbon emission restrictions in construction processes and relate them to on-site operations.
Management Capacity
To cut down on resource waste and improve resistance to the carbon issue, businesses shift from large-scale production to sustainable, low-carbon management. For low-carbon management, Chen et al. stress integrating emission reduction measures across product lifecycles [14]. To reduce footprint irregularities, managers use their expertise, carbon-handling prowess, and inspection capabilities. Carbon data are essential for effective management [15], and prompt reactions are necessary to increase organisational adaptability.
Construction Capacity
This capability is essential for system resilience because emissions during the construction phase account for the majority of industry production. Low-carbon construction is defined by Zhou Jinli as technological approaches to reducing emissions and increasing resource efficiency [16]. Switching to renewable energy sources from fossil fuels reduces emissions by 20–30%.
Additionally, reused materials save money and reduce footprints by 15–25%. Zhou Hongbo uses technical and management approaches to highlight low-pollution, low-energy practices [17]. While worker low-carbon awareness increases risk resistance, rational planning increases efficiency and reduces risk.
Forecasting Ability
By predicting, evaluating, and analysing the pre-construction footprint, this capacity allows for proactive risk reduction and lowers the danger of excessive emissions. Risk awareness helps regulate risk before a disturbance. While waste emission detection systems allow data-driven footprint prediction to increase resilience, progress and resource demand forecasting optimises allocation. Businesses modify their buildings in response to environmental shifts, and pre-construction evaluations further reduce the chance of danger.
Carbon Emission Capability
There is substantial room for decreasing carbon emissions despite the industry’s high energy consumption and emissions. Scholars advocate for efficient technologies and carbon trading to offset inevitable emissions by using system dynamics to analyse subsystem emissions in conventional and green buildings. Emission standards, carbon tax, and trade are the U.S. policies that Yujie Lu, Xinyuan Zhu, et al. suggest [18]. Taxes and trading help reach targets through over-limit emission purchases. By balancing construction features with data dependability, footprinting can be impactful [4].

2. Methods and Materials

2.1. Selection of Research Subjects and Data Collection

The scale design refers to the research results of Qian Mingming and Wang Jiayi, who created the predictive ability scale [19,20]. The construction energy scale was designed based on the research results of Yuan Xiaoquan, Lou Shuming, and other researchers [21,22]. The management energy scale was designed based on the research results of Zhao Xi and other researchers [16]. The carbon emission management energy scale was designed drawing on the research results of Han Hui and Zhang Yufei [23,24].
The study focuses on commercial and residential building construction sites, including both new construction and renovation projects, that reflect typical construction activities in the industry. The survey covers construction sites in Jiangsu, Zhejiang, Shandong, and Shanghai in eastern China, representing regions with active construction sectors.
During the research process, the principles of autonomy and anonymity were strictly followed to ensure that the respondents expressed their true opinions. A total of 120 questionnaires were distributed, and 106 valid questionnaires were finally obtained, with an effective recovery rate of 88.33%. Based on the questionnaire research method to obtain information, the target respondents focused on the building construction enterprises in the eastern region. The questionnaire respondents represented the middle and senior management of building construction enterprises. This study adopted the random sampling survey method; the 120 respondents from 30 enterprises (4 per enterprise) included 2 project managers and 2 technical directors, ensuring diverse perspectives on carbon management. Ten percent of respondents were re-interviewed and demonstrated 92% answer consistency, indicating minimal response bias. Online as well as offline survey methods were used: the online survey was administered mainly through the survey website, e-mail, communication software, and other ways, and the offline survey was conducted mainly through field interviews, field distribution of questionnaires, and other ways. Table 1 percentages use percentile division (5 groups, 20% each). The questionnaire was designed using a 5-point Likert scale (see Appendix A.1). The basic information of the sample subjects is shown in Table 1.

Reliability and Validity Test

Reliability is also known as dependability. Even if the target is measured multiple times using the same method, the degree to which the measurement data are consistent is used to verify the reliability of the data [25]. Cronbach’s alpha coefficient is used to measure the reliability of each factor in the questionnaire data to determine whether the data are reliable or not. Generally speaking, Cronbach’s alpha coefficient between 0.6 and 0.7 indicates acceptable reliability. When the value is between 0.7 and 0.8, it indicates good reliability. When the value is above 0.8, it indicates very good reliability. The larger the coefficient, the better the reliability. The Kaiser–Meyer–Olkin (KMO) test is a measure of sampling adequacy for factor analysis, with values > 0.7 indicating suitable data. Table 2’s 5-point Likert scale was validated via a 30-expert pre-survey (content validity index 0.91). The specific test results are shown in Table 2.
As shown in Table 2, all variables passed the test, and the reliability test of the collected data meets the requirements.
Validity in the validity test refers to the accuracy of the results. The purpose of a validity test is to test whether the question items of variables in the questionnaire data can fully and effectively reflect the actual situation of the variables. Structural validity is measured by the Kaiser–Meyer–Olkin (KMO) test and Bartlett’s spherical test. KMO is a measure of sampling adequacy for factor analysis, with values > 0.7 indicating suitable data. In general, the KMO is greater than 0.6 and the significance of Bartlett’s spherical test is less than 0.05, which can indicate that the data structural validity of the scale is acceptable [26]. The specific test results are shown in Table 3.
As can be seen from Table 3, KMO of each factor ranges from 0.682 to 0.833, and all of them are above 0.6. Several results are more than 0.8. At the same time, the significance of each variable is 0.000, which is significantly lower than 0.05. The above test results show that the scale has good structural validity.

2.2. fsQCA Research Method

The fsQCA method, short for fuzzy set qualitative comparative analysis method, is an emerging management research paradigm that is mainly used to analyse the synergistic relationship of multiple concurrent factors in complex systems [27]. The adoption of fsQCA in this study of the driving factors of resilience in the carbon footprint knowledge system of construction companies is driven by its ability to analyse the multiple concurrent causal relationships formed by different groupings of influencing factors and reveal how different causal conditions interact to jointly affect the resilience of the carbon footprint knowledge system [28]. It provides a unique middle ground between qualitative and quantitative methods, which can not only respond to the questioning of the universality of the conclusions of the qualitative research but also make up for the shortcomings of quantitative research for the sample analysis [29,30].

2.2.1. Data Calibration

The first step of fsQCA is to assign values to the variables according to the anchor points and calibrate the variables to the set between 0 and 1. Three anchors need to be set, namely, full affiliation, intersection, and full non-affiliation. The direct calibration method is usually adopted for scale calibration. The calibration of Wang Xue et al. was adopted as a reference, with the mean value of each variable coded as the crossover point [31]. Specifically, 5 is coded as fully affiliated, and 1 is coded as fully unaffiliated. The specific calibration anchor points are shown in Table 4.

2.2.2. Necessity Analysis

Before constructing a truth table for a fuzzy set, a single variable is subjected to a necessity test, which is used to test whether the occurrence of the outcome condition depends on a single variable [32].
The consistency (0.8) and coverage (0.5) thresholds align and have been validated against similar construction industry studies, confirming appropriateness [33,34,35]. A sensitivity analysis testing thresholds of 0.75 and 0.85 show that the results are stable.
A consistency value higher than 0.9 is generally considered to indicate that the conditional variable or its negation is a necessary condition for the emergence of the outcome [33,34,35]. As can be seen in Table 5, the consistency thresholds for each condition are less than 0.9, indicating that no single independent variable is necessary for the resilience of the carbon footprint knowledge system, and no single variable can adequately explain the resilience of the carbon footprint knowledge system. Therefore, the reasonableness of analysing the effect of condition combinations of different variables on the outcome variables is further validated.

2.2.3. Carbon Footprint Calculation Strategy

We refer to and draw on relevant literature to develop carbon footprint calculation strategies [36,37].
Firstly, the calculation framework is designed to capture the multi-stage emission characteristics of construction projects, integrating lifecycle perspectives with dynamic management principles to ensure comprehensive coverage. Its boundary is explicitly defined across three inter-related dimensions: direct on-site emissions, encompassing greenhouse gases from fuel combustion in construction machinery and energy consumption for temporary facilities; indirect supply chain emissions, including embodied carbon from the production, transportation, and off-site prefabrication of raw materials such as steel and cement; and operational phase emissions, incorporated as a lifecycle reference to account for energy-related emissions during building usage, though the core focus remains on the construction phase.
Secondly, the quantification methodology adheres to industry-standard protocols, utilising the formula
Emissions   ( kg   C O 2 eq ) = ( Activity   Data   ×   Emission   Factor   ( EF ) )
Activity data, including fuel consumption (L), electricity usage (kWh), material throughput (tons), and construction duration (days), is sourced from project management databases and procurement records to ensure accuracy. Emission factors are determined based on regional technical guidelines with adjustments made to reflect local variations in energy structure.
Thirdly, technical infrastructure provides critical support for implementation. IoT sensors are deployed on core equipment such as tower cranes and concrete mixers to capture real-time energy consumption data, which are synchronised to a centralised carbon management platform for dynamic tracking. Additionally, data normalization protocols convert qualitative data from 5-point Likert scales into continuous values within the 0–1 range, aligning with fuzzy set analysis requirements and enhancing cross-methodological consistency.
Finally, by clarifying boundaries, standardising methodologies, and strengthening technical support, this calculation framework establishes a full-process carbon footprint quantification system for construction activities, laying a data foundation for subsequent sensitivity analysis and emission reduction strategy development.

2.3. System Dynamics Research Method

Considering the continuous and complex nature of building construction projects, the interconnections among various factors undergo constant dynamic changes over time, constituting an evolving process. To explore the dynamic evolution of the relationship between the driving factors of the carbon footprint knowledge system, toughness of building construction enterprises under the dynamic perspective, a system dynamics approach is used for optimisation analysis. System dynamics, when based on feedback control theory, uses a combination of qualitative and quantitative methods to study the operation of complex systems and check the solution of complex dynamic feedback system problems using a simulation method [38].

2.3.1. System Boundary Definition

Carbon footprint knowledge system resilience is a complex system involving multiple nodes. Without clear boundaries, accurate research cannot be conducted. Therefore, this study screens 4 dimensions and 15 influencing factors through a questionnaire survey and incorporates them into the system.
System dynamics simulation software Vensim PLE 5.11 is used in this study. According to the simulation objectives, various factors affecting the carbon footprint knowledge system toughness are simulated. See Figure 1 for the specific process.

2.3.2. System Causality Map

System dynamics is committed to finding the causal relationship between factors within a system and exploring the root causes of problems [38]. By analysing the inter-relationships of the influencing factors, combined with the definition of the system boundary, the causal relationship is drawn in Vensim software, as shown in Figure 2. The underlying feedback loops and causal mechanisms that support this causality diagram are further illustrated in Appendix A.2.

2.3.3. Stock Flow Diagram

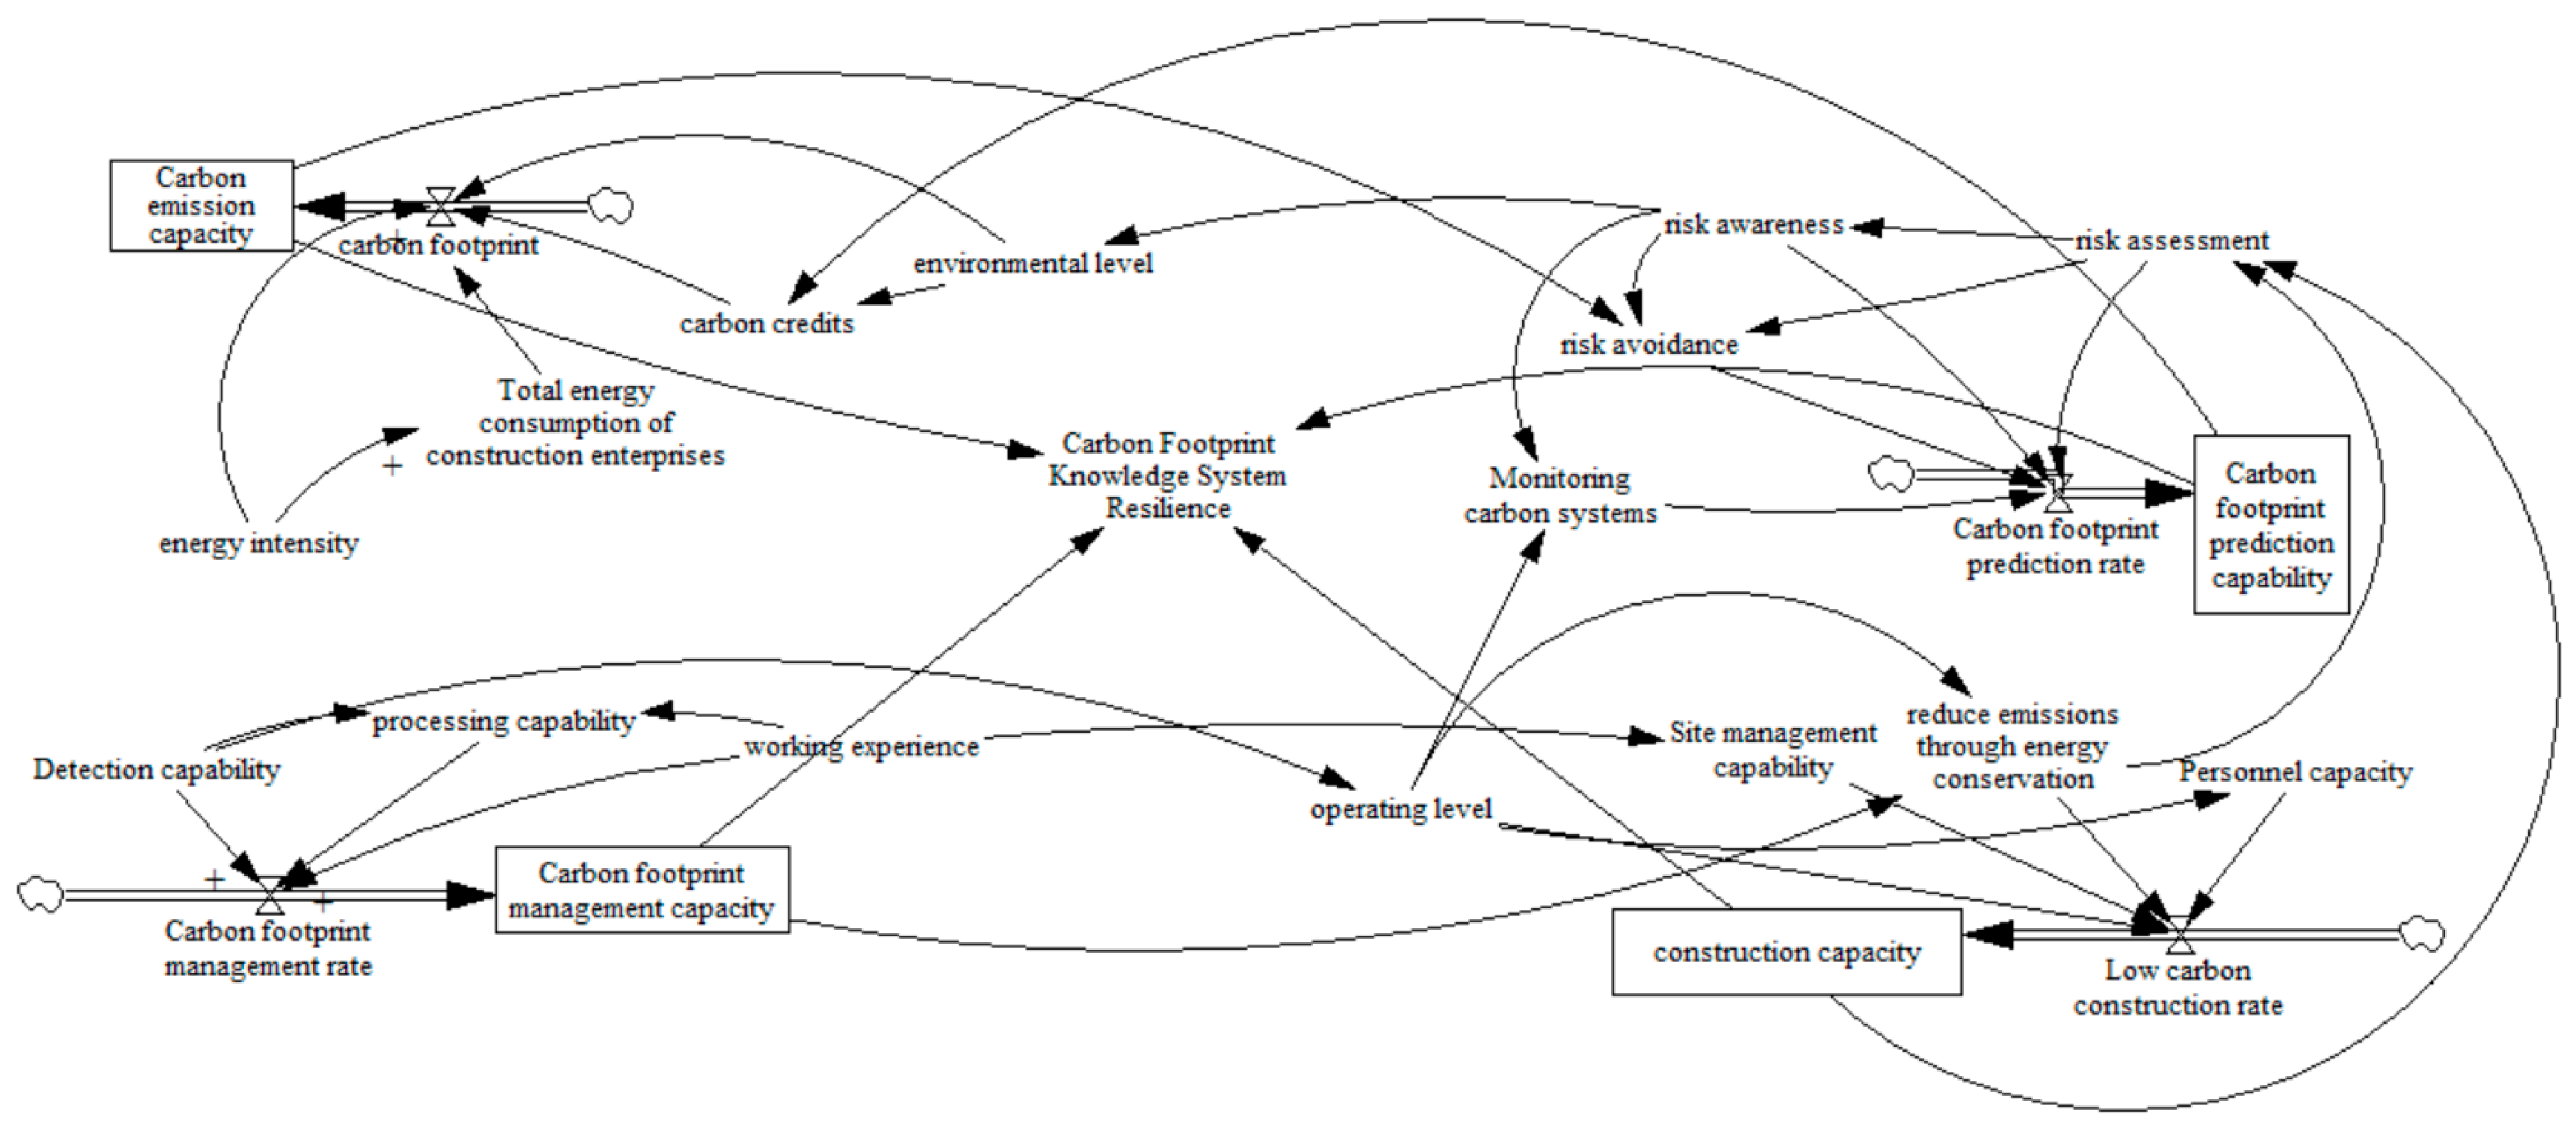
Based on the logical relationship in the causality diagram and the drawing principle of the stock flow diagram, the stock flow diagram of the resilience drivers of the carbon footprint knowledge system of the building construction enterprises under the dynamic perspective is drawn, as shown in Figure 3.
In this study, carbon footprint management ability, construction ability, carbon footprint prediction ability, and carbon emission ability are set as state variables, and according to the state variables, carbon footprint management rate, low-carbon construction rate, carbon footprint prediction rate, and carbon emission rate are set as rate variables, and detection ability, work experience, and energy intensity are set as constants, and the remaining variables are auxiliary variables.

2.3.4. Model Variable Equation Establishment

The equations are mainly constructed based on the causal relationship of the factors in the system, and the specific variable equation expressions are shown in Appendix A.2.
In this study, the subjective weight assignment method, the G1 method, is used to determine the system parameters. The G1 scoring method is used to determine the weights when multiple causal factors correspond to a single outcome variable, and the expert scoring method is used when one causal factor corresponds to a single outcome variable. The selection of parameters is confirmed based on relevant studies [39,40,41]. The detailed methods for parameter determination are derived from related references [42,43,44]. And the parameters are further validated based on the relevant literature [45,46,47,48].
The steps of the G1 scoring method are as follows:
(1)
Determine the ordinal relationship.
Multiple indicators have a relationship to the assessment object.
(2)
Determine the ratio of relative importance.
Get the ratio of the relative importance of each evaluation indicator, judge the ratio of the importance of the two indicators to the assessment object, and get the ratio of the importance degree.
r k = W k 1 W k ( k = n , n 1 , 1 )
where the reference value r k is as follows.
1.0 ( X K 1 is as important as X K ),
1.1 ( X K 1 and X K are between relatively important and slightly important)
1.2 ( X K 1 is slightly more important than X K )
1.3, 1.4 … 1.8
(3)
Calculation of evaluation indicator weight coefficients
W k = ( 1 + K = 2 n i = K n r i ) 1
W k 1 = r k W k ( k = n , n 1 , 1 )
The parameter coefficients of b1-c134 were calculated according to the G1 method combined with the expert scoring method.
Based on the results of the questionnaire, the standardised factor loadings were normalised to obtain the initialised data.
W i = F i i = 1 n F i
F i is the standardised factor load.
The parameter values and equation expressions for the state variables, flow rate variables, auxiliary variables, and constants were completed by combining the above G1 method in conjunction with the expert scoring method and the initial data, and are shown in Appendix A.3.

2.4. Findings and Results

2.4.1. fsQCA Configuration Results Analysis

Truth table analysis will be carried out on the outcome variables, and in the standard analysis process, the number of cases is set to be 1, and the consistency is set to be 0.80. A total of three results are obtained, namely, complex solution, parsimonious solution, and intermediate solution, and the intermediate solution is selected for analysis. See Table 6 and Table 7.
As a result of sufficient condition analysis, along with the resilience of the carbon footprint knowledge system for building construction enterprises, 3 group state results were obtained. The consistency of each group state is higher than 0.8, the overall consistency is 0.861, and the overall coverage is 0.808, which indicates a high level.
Group 1 points out that the resilience of the carbon footprint knowledge system is the result of the joint action of two factors, namely, high management capability and high emission capability. Carbon footprint management capability and carbon emission capability enhance the carbon footprint knowledge system’s toughness. On the one hand, carbon footprint management, as the core of the carbon footprint knowledge system of the construction enterprises, enhances the carbon footprint management personnel’s carbon footprint processing capability and the monitoring of the carbon footprint-related work to enhance the toughness of the enterprises.
On the other hand, the enterprises should reduce carbon emissions and energy consumption at the construction sites and strengthen the environmental protection level of the construction personnel, as well as reduce the potential risks brought by the enterprise due to its high carbon footprint in construction. Group state 2 points out that the carbon footprint knowledge system toughness is the result of the core conditions of high management ability, high prediction ability, and high construction ability, as well as the joint action of the three factors. Under the environment of external turbulence, the carbon footprint management ability, prediction ability, and low carbon construction ability of building construction enterprises jointly enhance the path to promote the carbon footprint knowledge system resilience.
On the one hand, the enterprise carries out advanced prediction and assessment of carbon footprint risk and adopts the monitoring carbon footprint system to predict emissions in advance, which not only strengthens the awareness of carbon footprint risk of management personnel but also enhances the carbon footprint knowledge system of the enterprise.
On the other hand, the construction enterprise adopts the greening and low-carbon approach to solving the problems in the construction activities in the process of construction management and improves the awareness of employees’ emission reduction to enhance the resilience of the enterprise. The group state 3 demonstrates that the carbon footprint knowledge system resilience is the result of the joint action of three factors, namely, high prediction capability, emission capability as the core condition, and high construction capability as the auxiliary condition. Enterprises, through the prediction of risk, reduce construction carbon emissions in the construction process, ensure low-carbon production, energy savings, and emission reduction, and, based on carbon emissions data, develop a low-carbon construction plan and timely adjustment of the construction process to reduce the carbon emissions of the building construction enterprises to achieve the effect of enhancing the resilience of the enterprise system.

2.4.2. System Dynamics Model Simulation Result Analysis

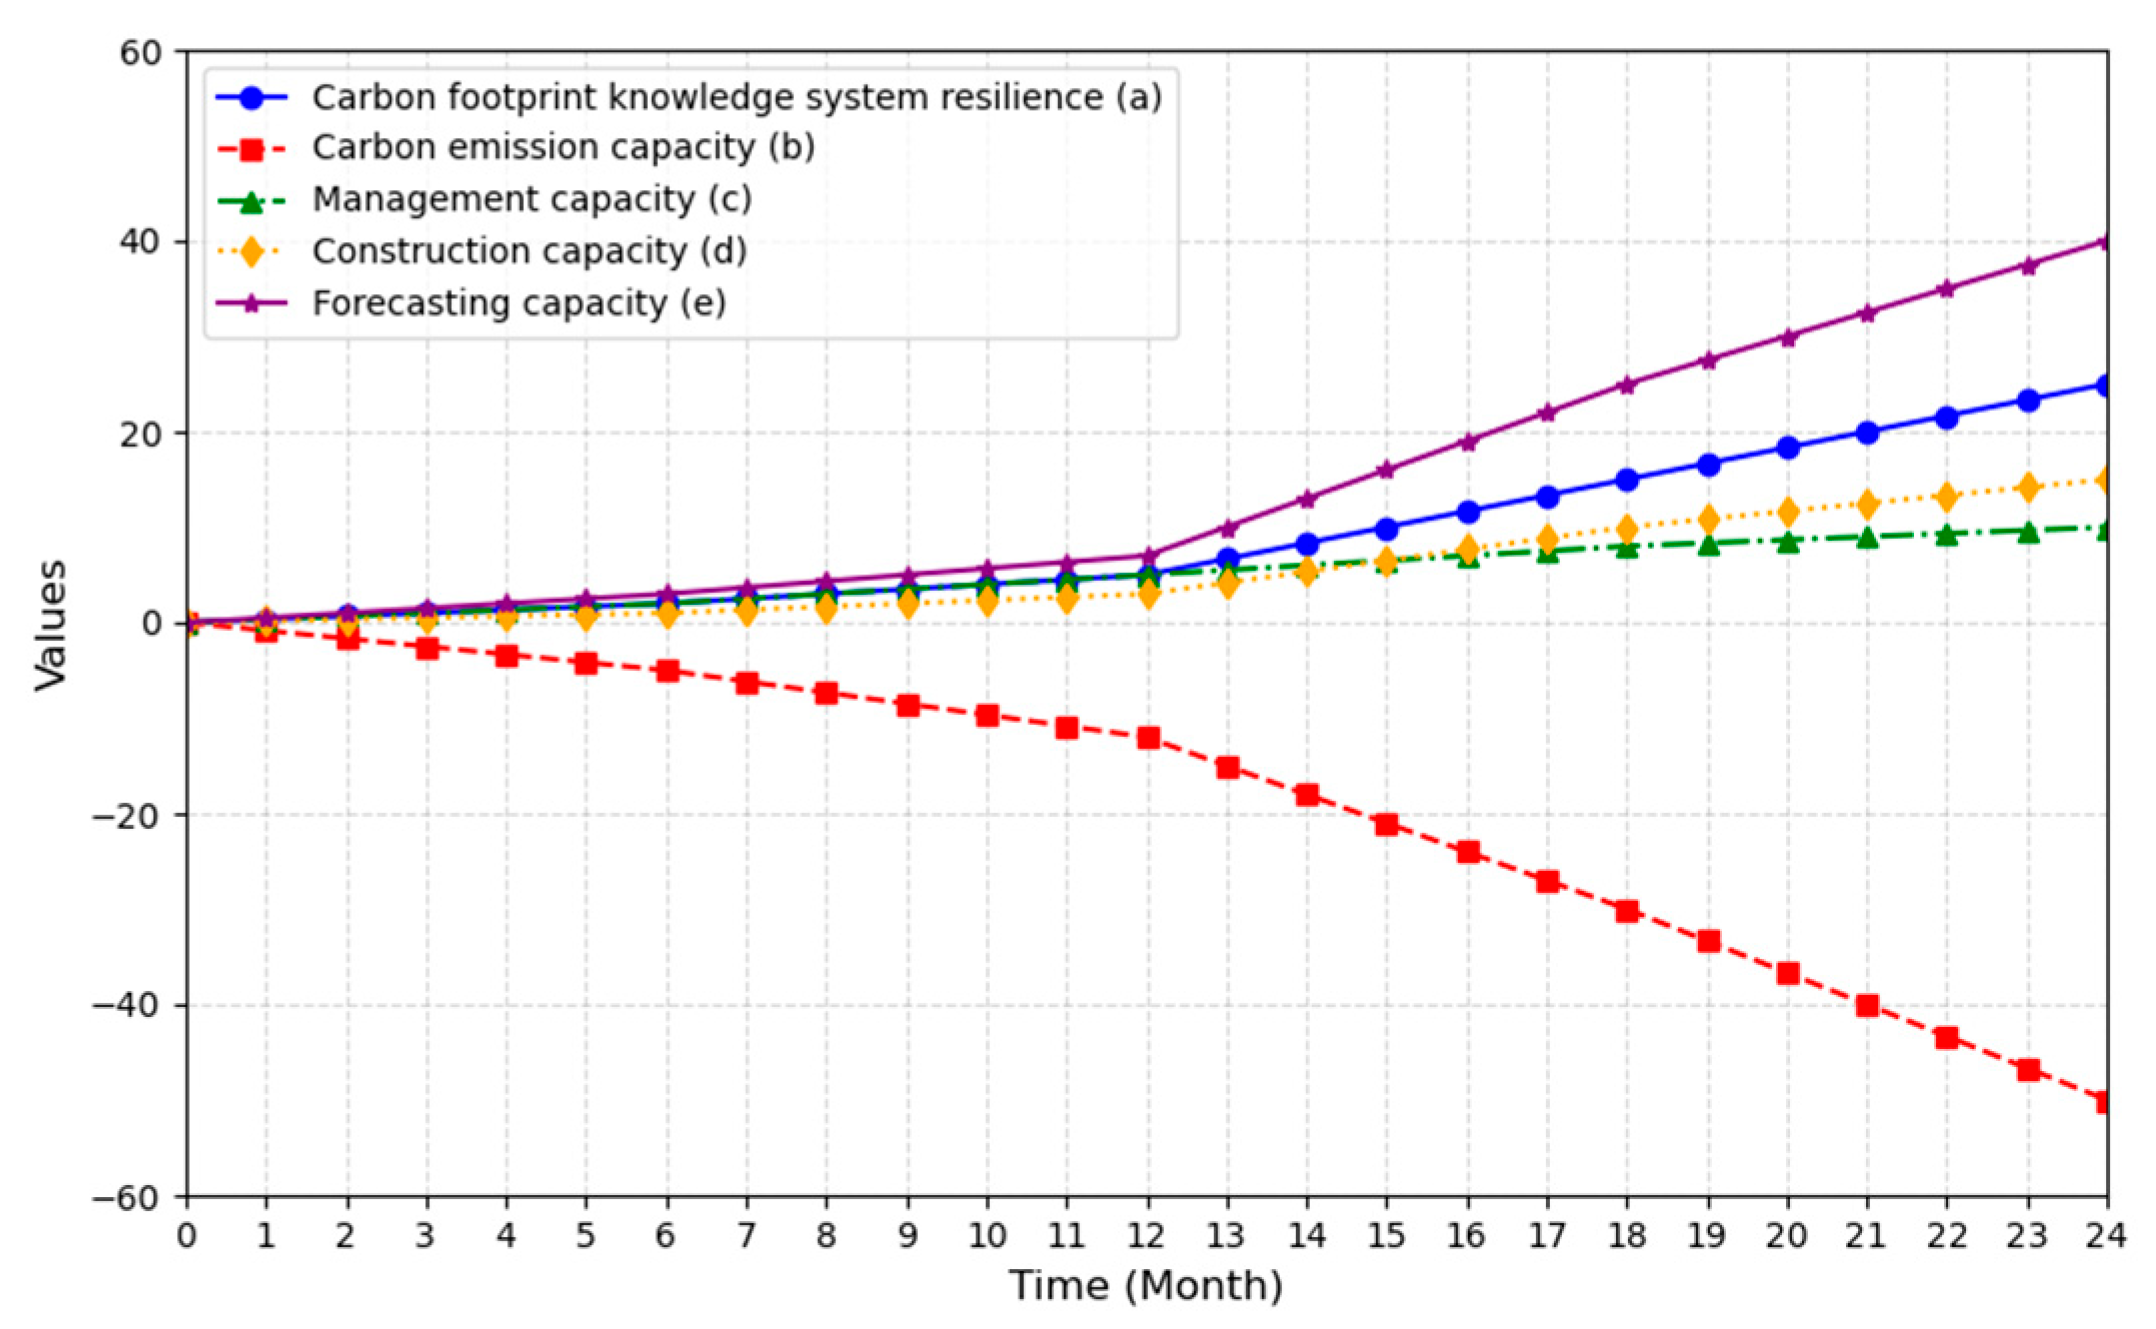
The initial time is set as 0, and the end time is set as 24 months. The 24-month simulation period is chosen to cover typical medium-sized project cycles (1–2 years). Tests with 18-month and 30-month periods showed that 24 months best captures resilience dynamics without redundancy. The time step is 1 month. Vensim is used to simulate the dynamic curve diagram of the carbon footprint knowledge system toughness for building construction enterprises over time, and the curve diagram of the emission capacity, management capacity, construction capacity, and forecasting capacity driver operation is shown in Figure 4.
As can be seen in Figure 4, the toughness of the carbon footprint knowledge system of building construction enterprises shows a steady growth in the set simulation length of 24 months, indicating that the toughness continues to grow under the continuous influence of carbon emission capacity, management capacity, construction capacity, and prediction capacity factors on the system. Meanwhile, enhancing the toughness of the carbon footprint knowledge system requires temporal accumulation. In the early stage, due to the lack of adjustment experience and the weak foundation, the effect of toughness enhancement is not obvious enough, and in the later stage, with the implementation of various measures and management in place, the toughness of the carbon footprint knowledge system is enhanced.
The carbon emission capacity is negatively correlated with the toughness of the carbon footprint knowledge system, and the carbon emission capacity is slow to decrease in the 12 months, with a stable decreasing trend, and the carbon footprint level rapidly decreases from the 13th month onwards. Emission level decreases rapidly, with the enhancement of environmental protection level, carbon sinks increase, and the enterprise carbon emission capacity is relatively weakened. It can be seen that the management capacity in the set 24 months maintains a relatively fast growth trend, the management level of detection ability and work experience is constant, and the impact on the management capacity is relatively stable. It can be seen that the construction capacity in the first 12 months of the slow rate of growth maintains a relatively stable growth trend, and from the 13th month, the construction ability is rapidly improved. It can be seen that the prediction ability in the first 12 months of the slow growth rate maintains a relatively stable growth trend. From the 13th month, the prediction ability is rapidly improved, see Table 8 for details.
(1)
Comparative simulation analysis of four capabilities
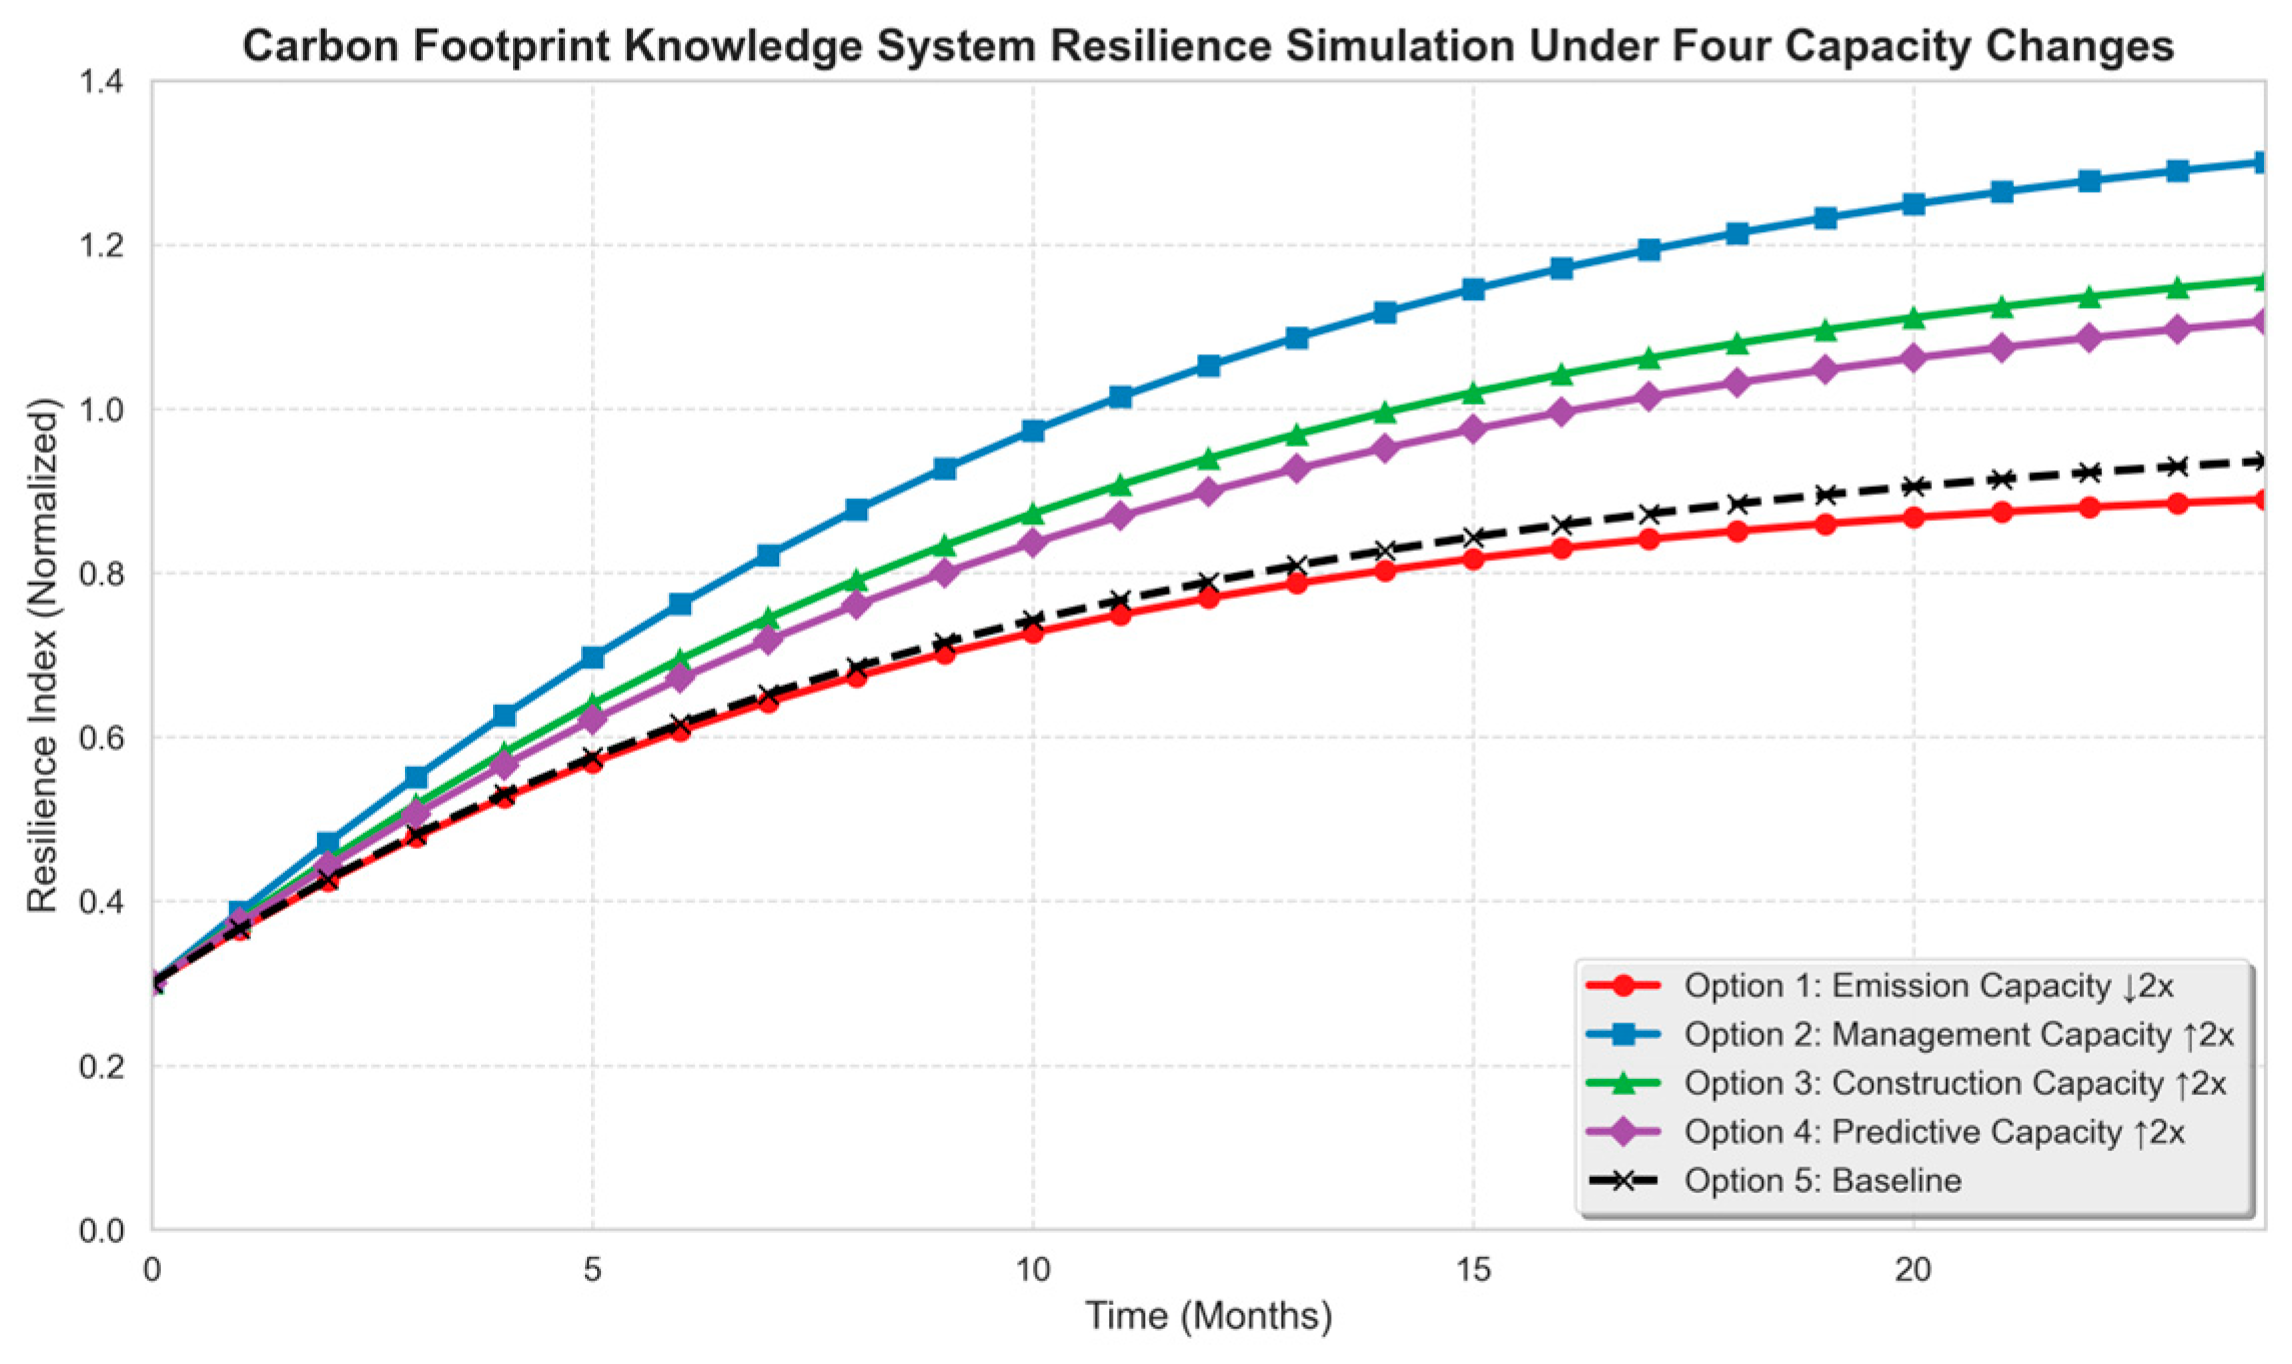
The effect of changes in the four capabilities on the resilience of the carbon footprint knowledge system of construction enterprises is simulated by increasing the initial values of the influencing factors in each capability. To facilitate the observation and analysis of the comparison results, based on multiple model debugging, the initial values of the influencing factors under the management capability, construction capability, and forecasting capability are increased twofold, the emission capability is reduced twofold, and the influencing factors under one capability are changed in each simulation. Thus, a total of four scenarios are adopted for comparing the trend of changes in the resilience of the carbon footprint knowledge system.
The above scenarios are input into the simulation model, and the change trend is shown in Figure 5, where the initial simulation without change is named carbon footprint knowledge system resilience. From the figure, it can be seen that compared with the original state, the increase in the drivers of management capability, construction capability and forecasting capability will improve the carbon footprint knowledge system resilience for the construction enterprises, and the reduction in the drivers of emission capability will also improve the carbon footprint knowledge system resilience, with the management capability playing the most crucial role in influencing the carbon footprint knowledge system resilience.
(2)
Comparative simulation analysis of the drivers under the four capabilities
To further explore the effects of the influencing factors on the resilience of the carbon footprint knowledge system from the perspective of dynamic capabilities, the initial values of the 15 influencing factors under the 4 capabilities were adjusted one by one for simulation. After debugging the model multiple times and reviewing relevant literature, researchers found that showing and comparing the effect proved difficult when the initial value was raised twice. Therefore, in the process of dynamic analysis and research, the initial value was raised 20 times sequentially. Each simulation refers to changing the initial value of a single factor and keeping other factors unchanged.
Firstly, comparative simulation analysis of drivers under predictive capacity is performed.
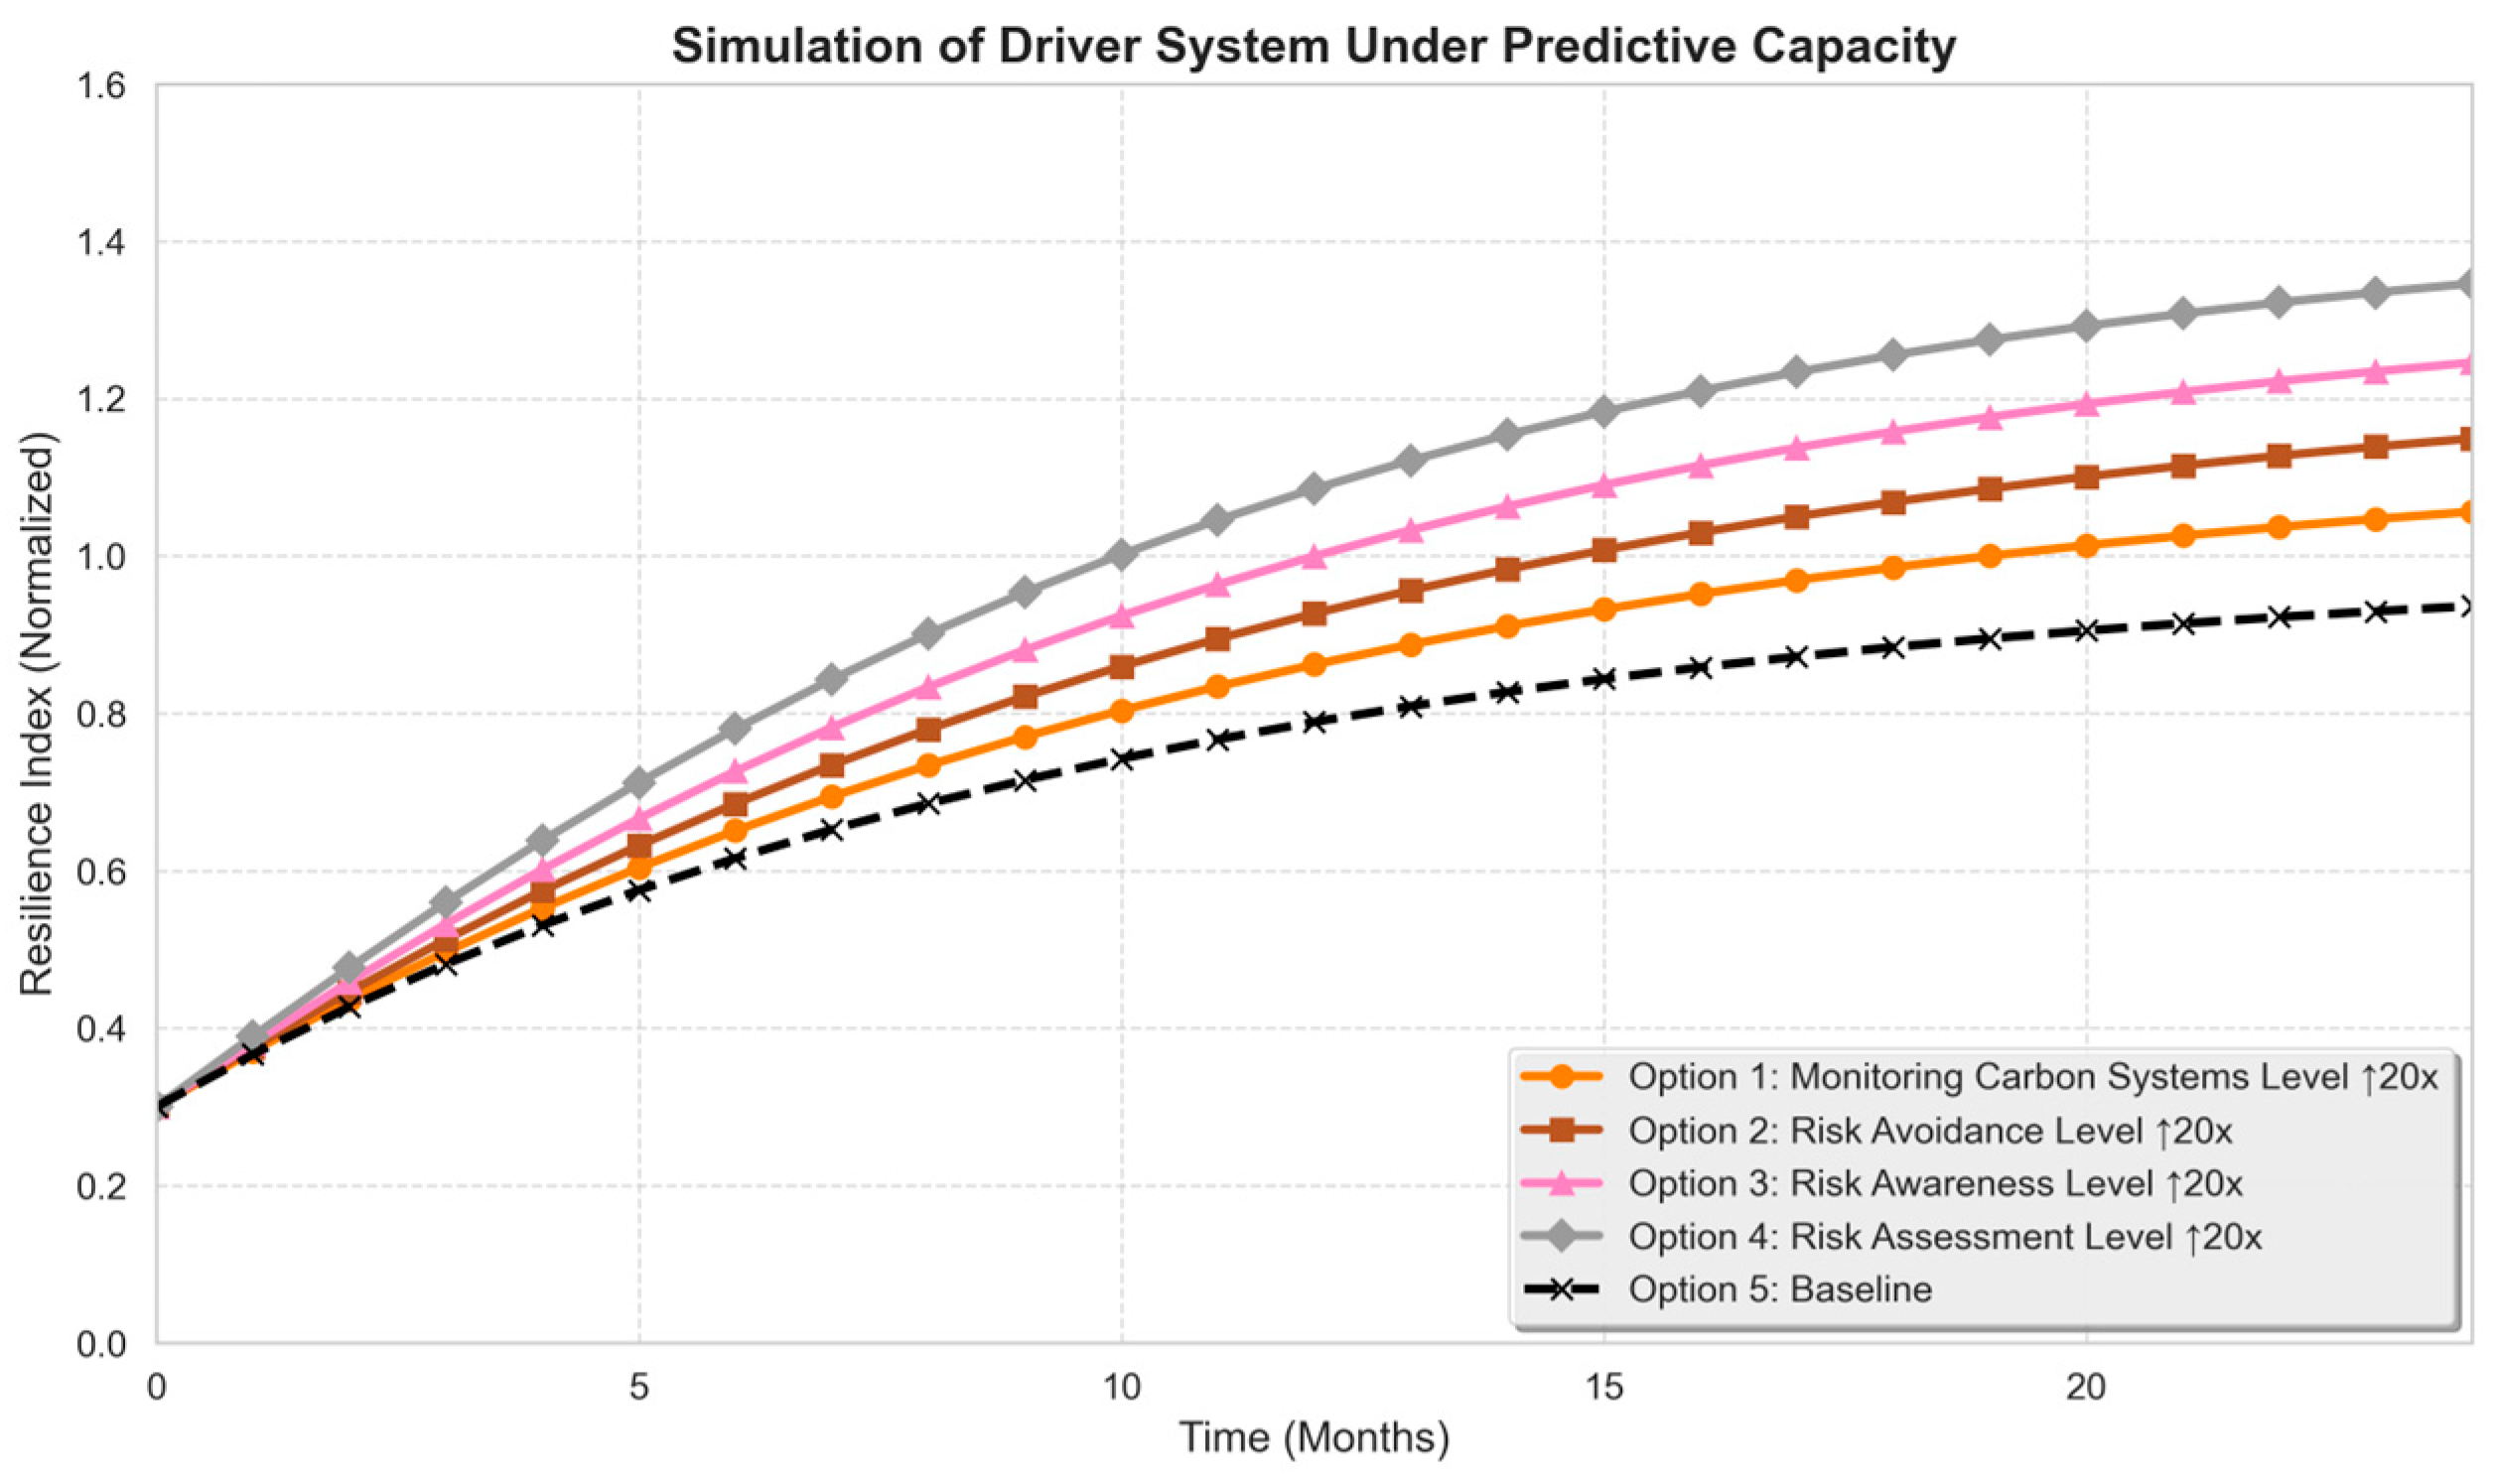
The above programmes are input into the simulation, respectively, and the change trend comparison is obtained, as shown in Figure 6. From the figure, it is evident that all four programmes play a role in enhancing the resilience of construction enterprises’ carbon footprint knowledge system, with their effects ranked in descending order as risk assessment, risk awareness, carbon system monitoring, and risk avoidance. Accordingly, the first step is to improve construction enterprises’ risk assessment of events, enhance their rapid response to external environmental changes, and strengthen the overall risk resistance of the carbon footprint knowledge system. Secondly, attention should be paid to the carbon footprint risk awareness of employees, strengthening the risk training for construction personnel, improving risk awareness, and effectively avoiding the occurrence of risk events by taking preventive measures. Finally, by improving the carbon monitoring system at the construction site, the possible risks can be avoided and curbed, and the risk of loss of the carbon footprint for the enterprise can be reduced.
Secondly, a comparative simulation analysis of each driver under construction capacity is conducted.
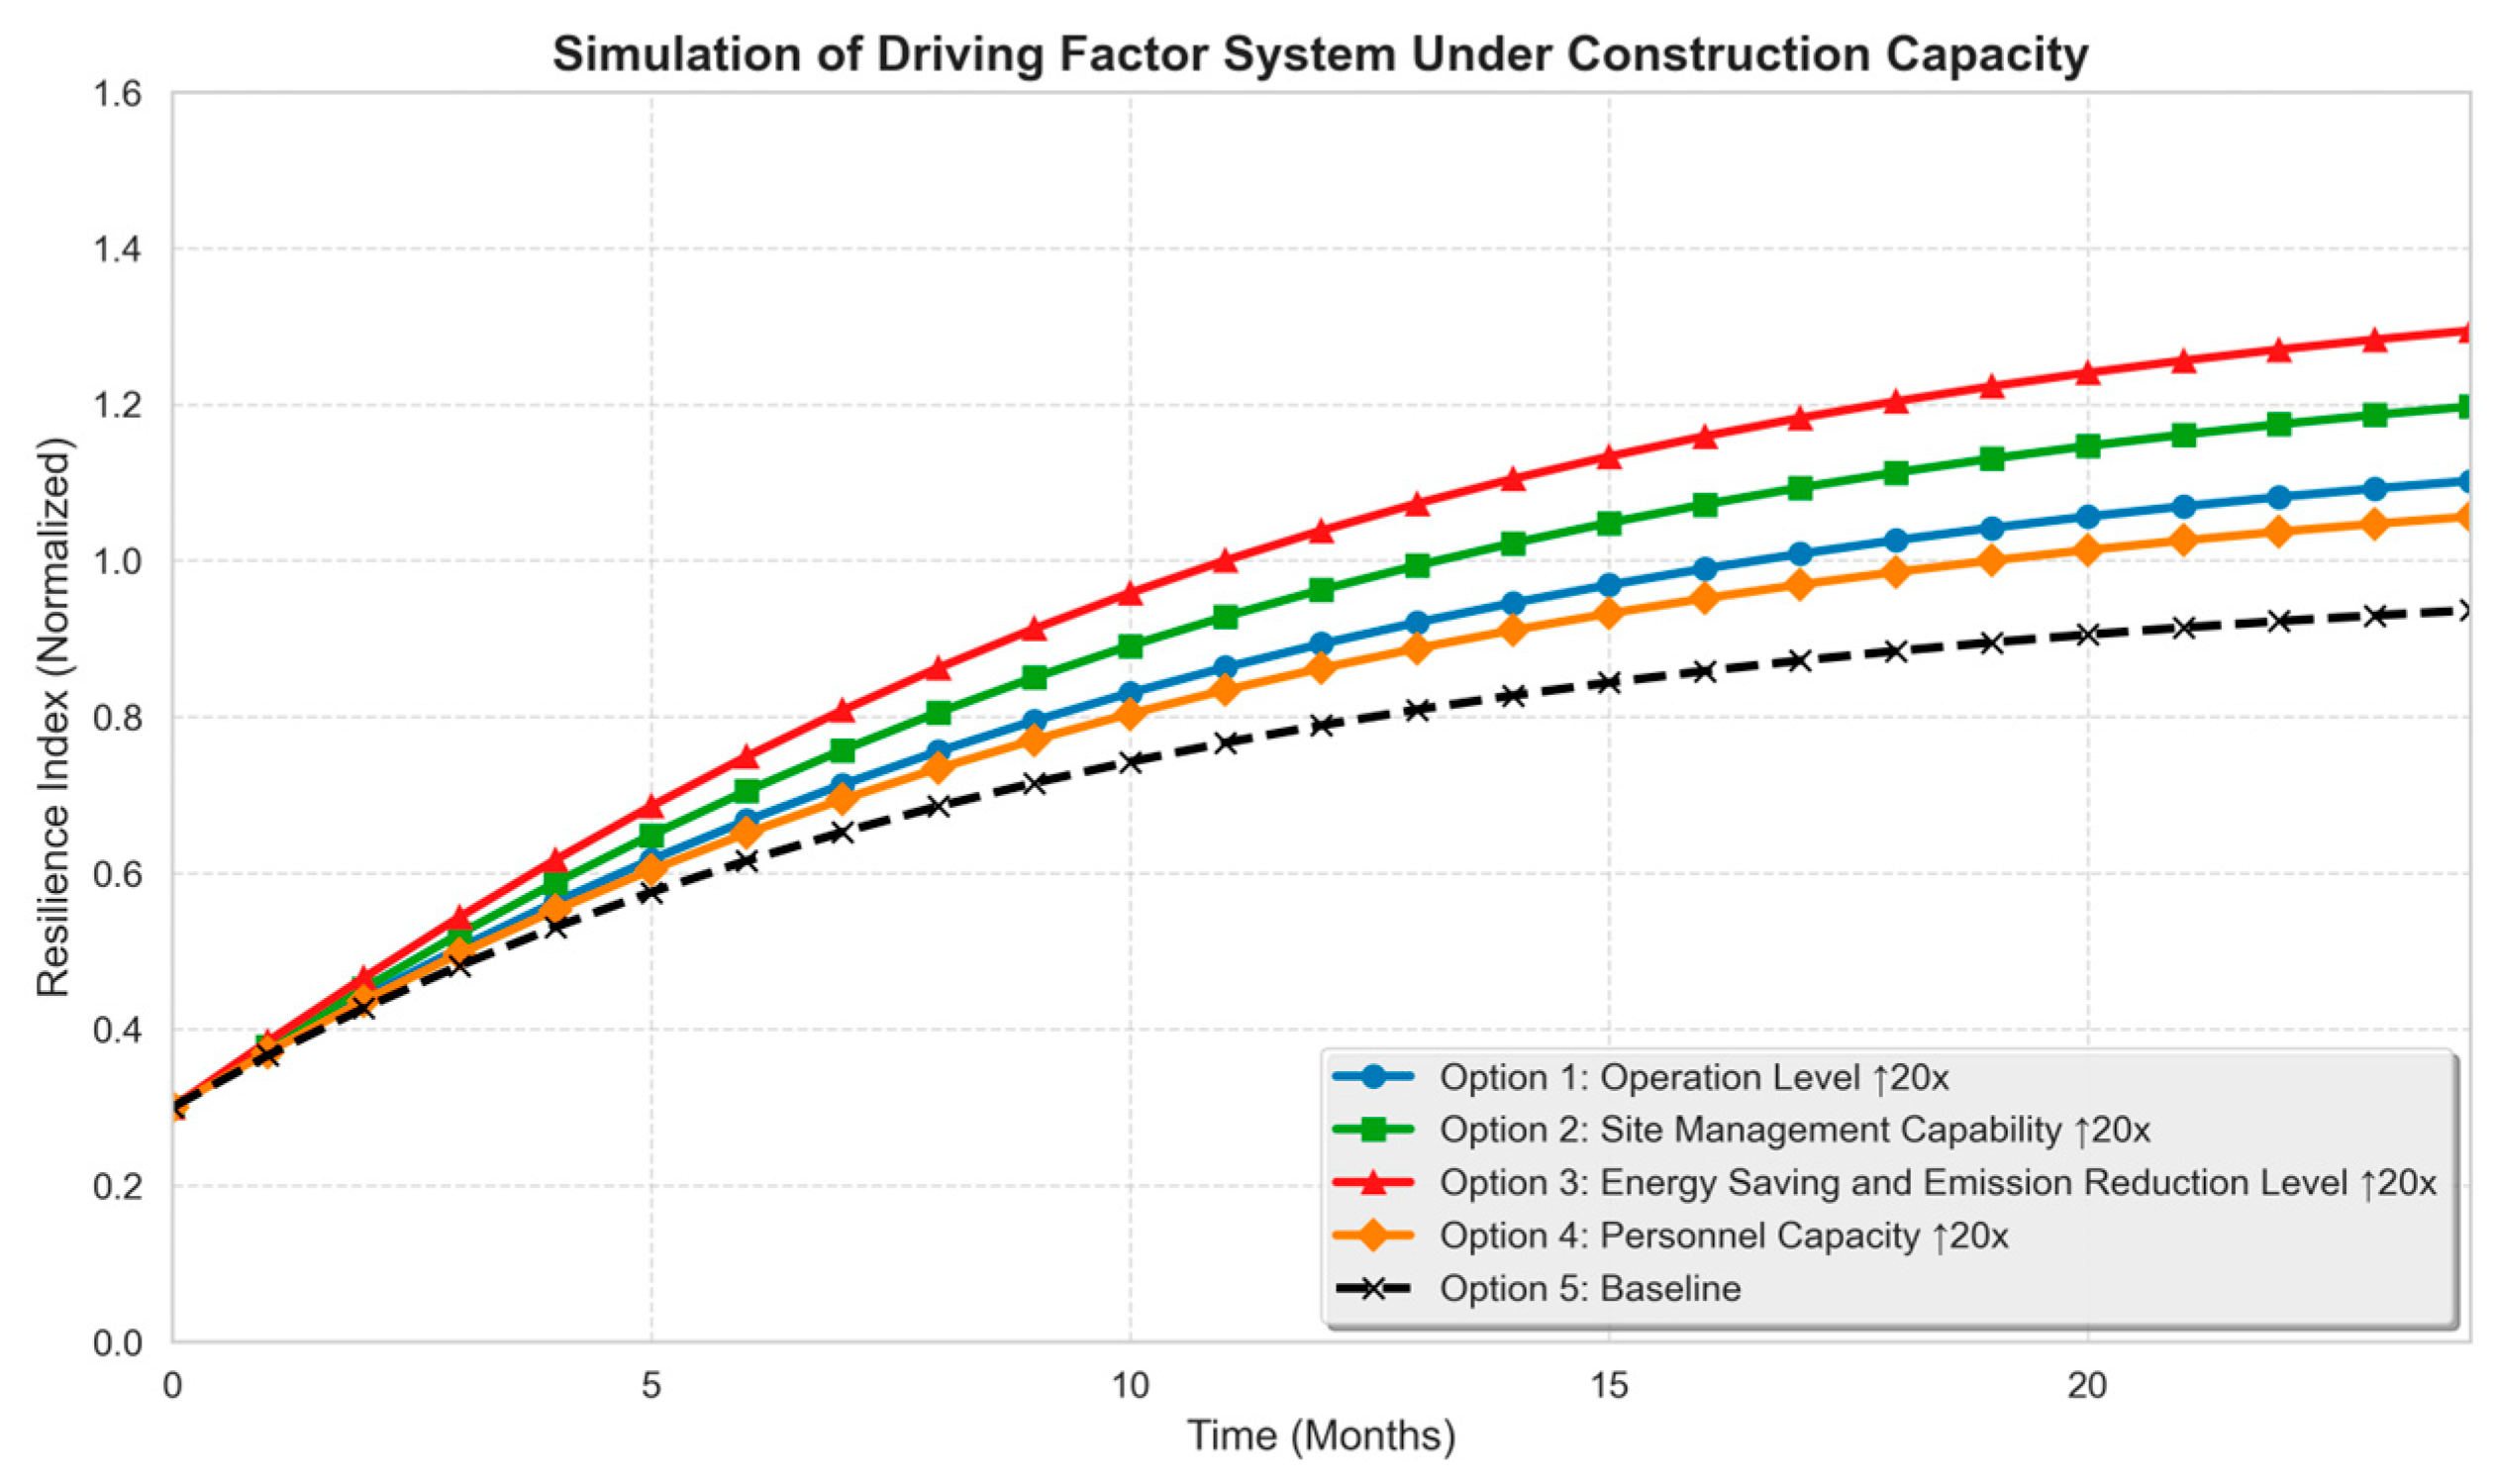
Separately, the above programmes are input into the simulation, and the change trend comparison is obtained, as shown in Figure 7. From the figure, it is evident that the four programmes all play a role in enhancing the carbon footprint knowledge system resilience for construction enterprises, with their effects ranked in descending order as energy saving and emission reduction, on-site management ability, operational level, and personnel capability.
Accordingly, the priority is to improve the energy-saving and emission-reduction competence of construction personnel, promote the use of low-carbon materials, low-consumption equipment, and new construction technologies during the construction phase. Secondly, enterprises should strengthen the management of the construction site during the construction process, implement low-carbon behaviours, low-carbon production, reduce the waste of materials and resources, and improve the resilience of the construction enterprise system. Finally, attention to the training and education of internal members of the organization, the establishment of cross-functional teams, and multi-party collaboration in crisis management improves the ability of construction personnel to achieve resource interoperability and complementary skills.
Thirdly, comparative simulation analysis of drivers under management capabilities is performed.
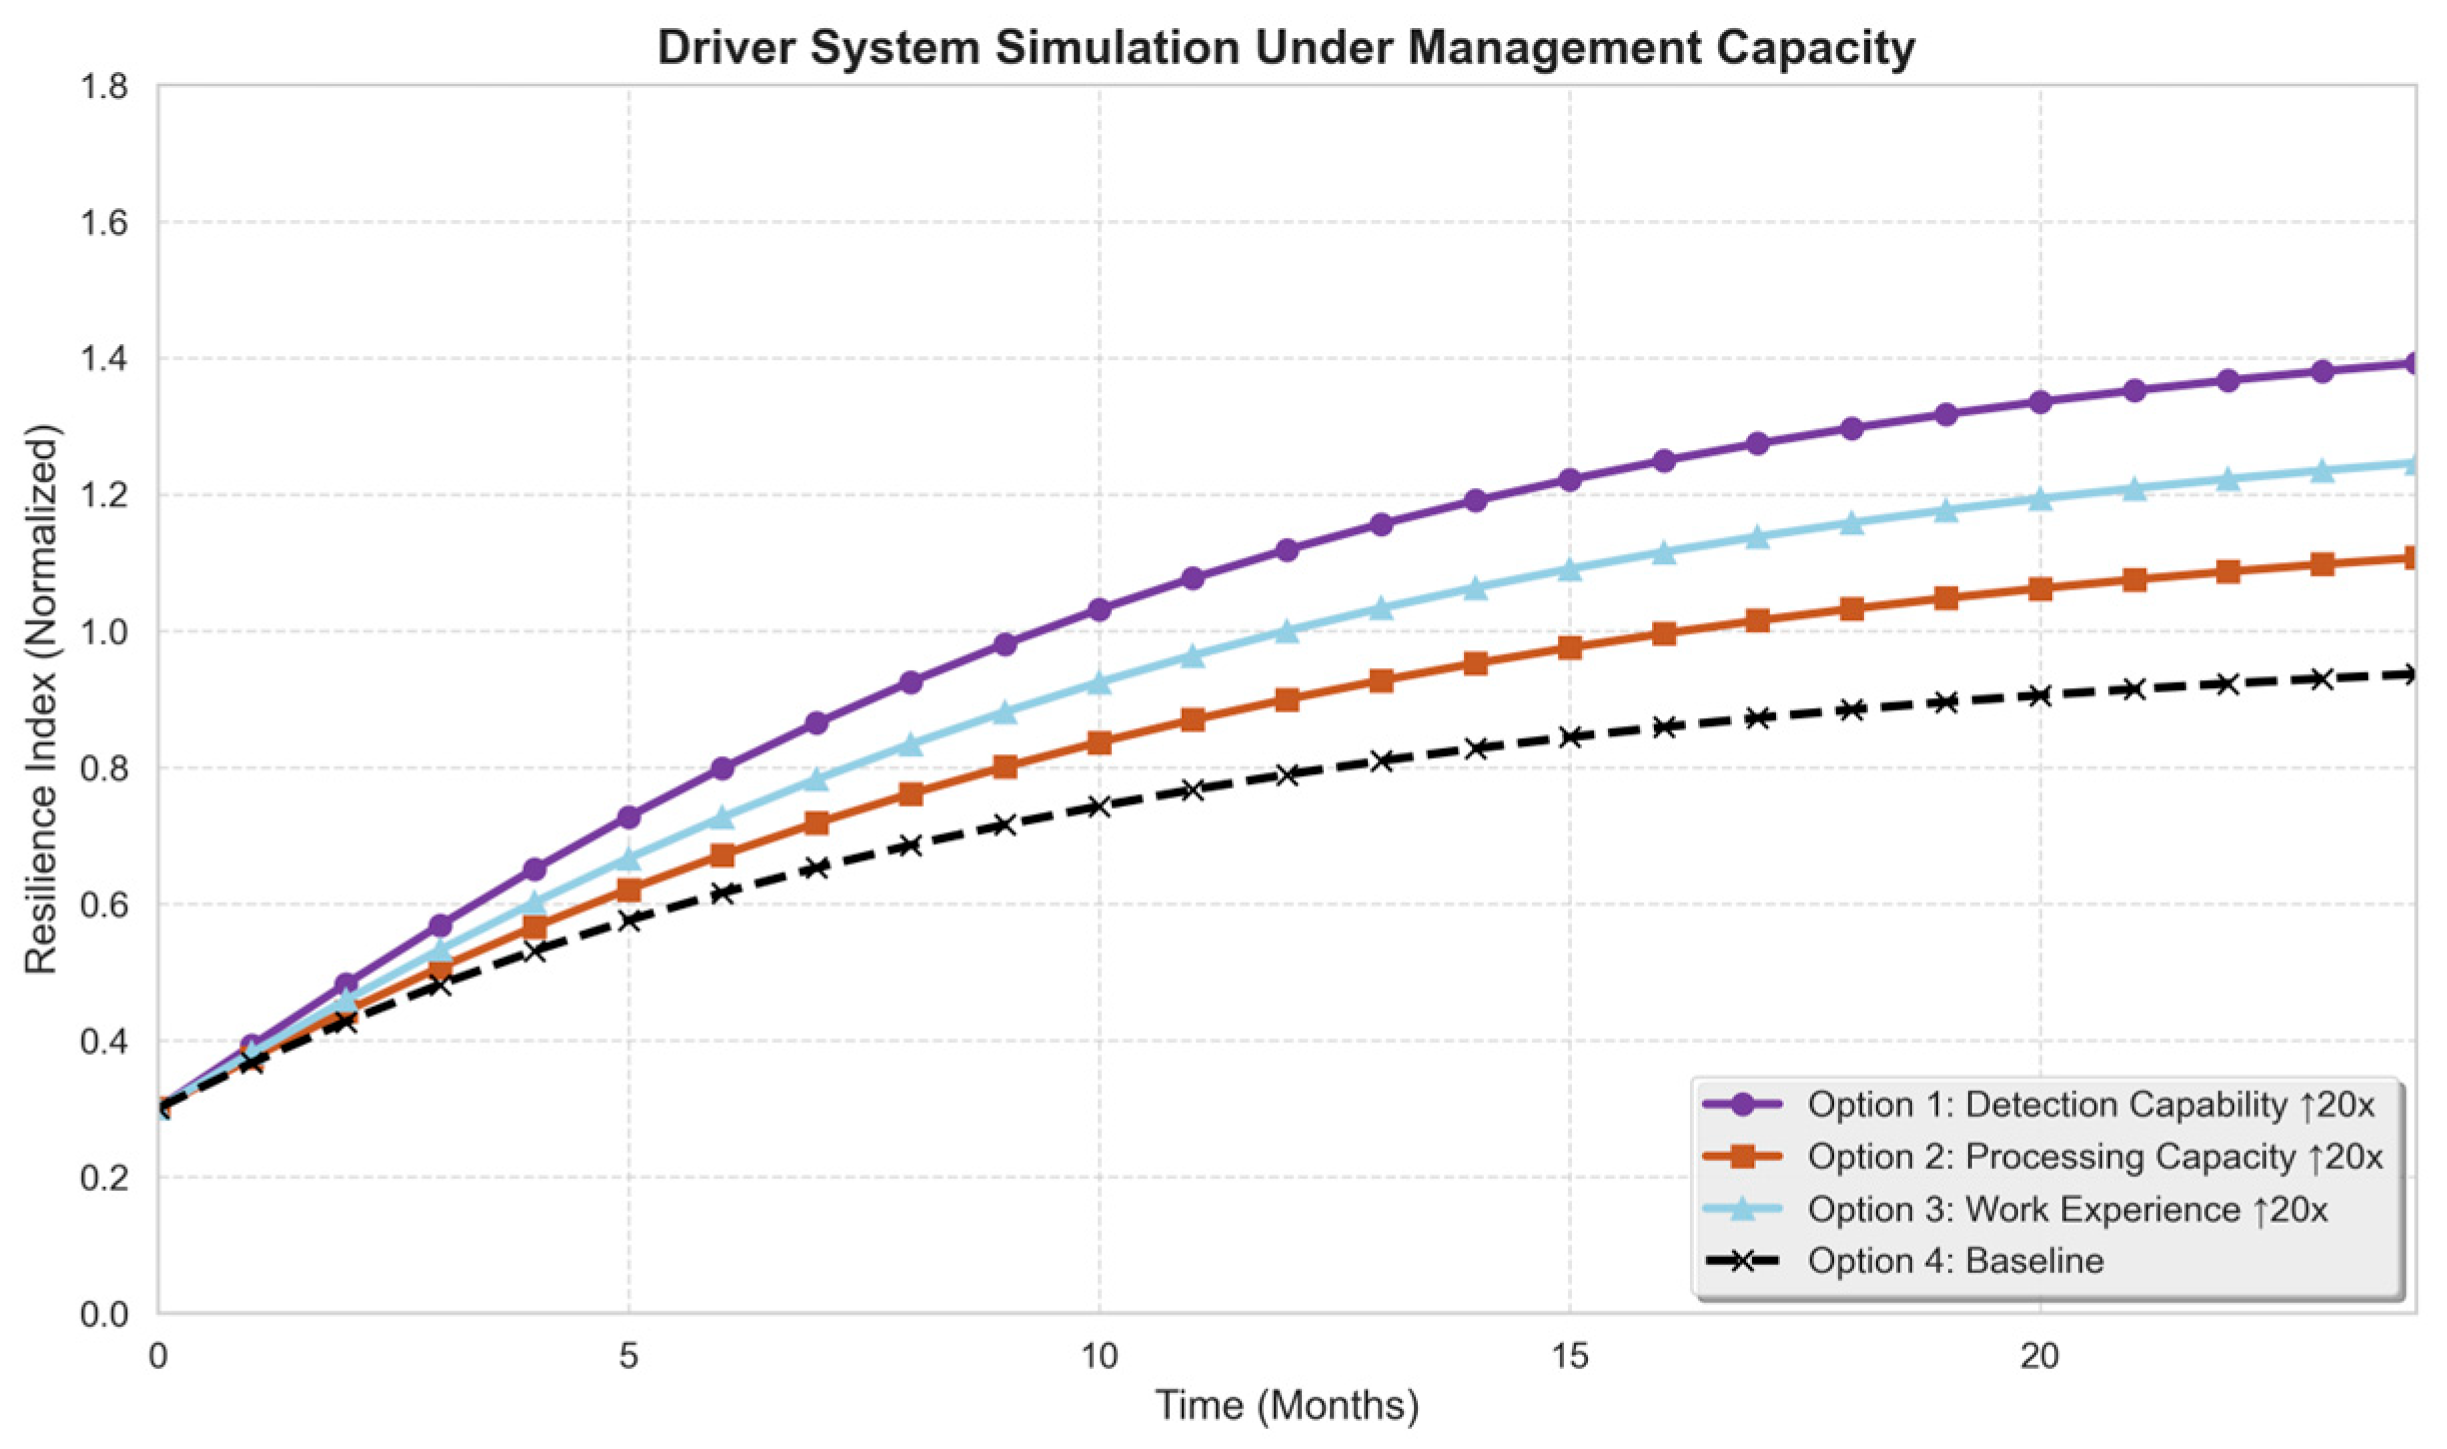
The above programmes are input into the simulation, respectively, and the change trend comparison is obtained, as shown in Figure 8. From the figure, it is evident that the three programmes all play a role in enhancing the resilience of construction enterprises’ carbon footprint knowledge system, with their effects ranked in descending order as detection ability, work experience, and processing ability. Accordingly, the priority is to enhance management personnel’s carbon footprint detection capabilities, prevent excessive carbon footprint risks at construction sites, and continuously strengthen detection capabilities to enhance the enterprise’s system toughness. Secondly, more attention should be paid to the study of advanced low-carbon technology, improve the existing construction process or production mode, and improve the carbon footprint processing capacity.
Fourthly, comparative simulation analysis of drivers under emission capacity is conducted.
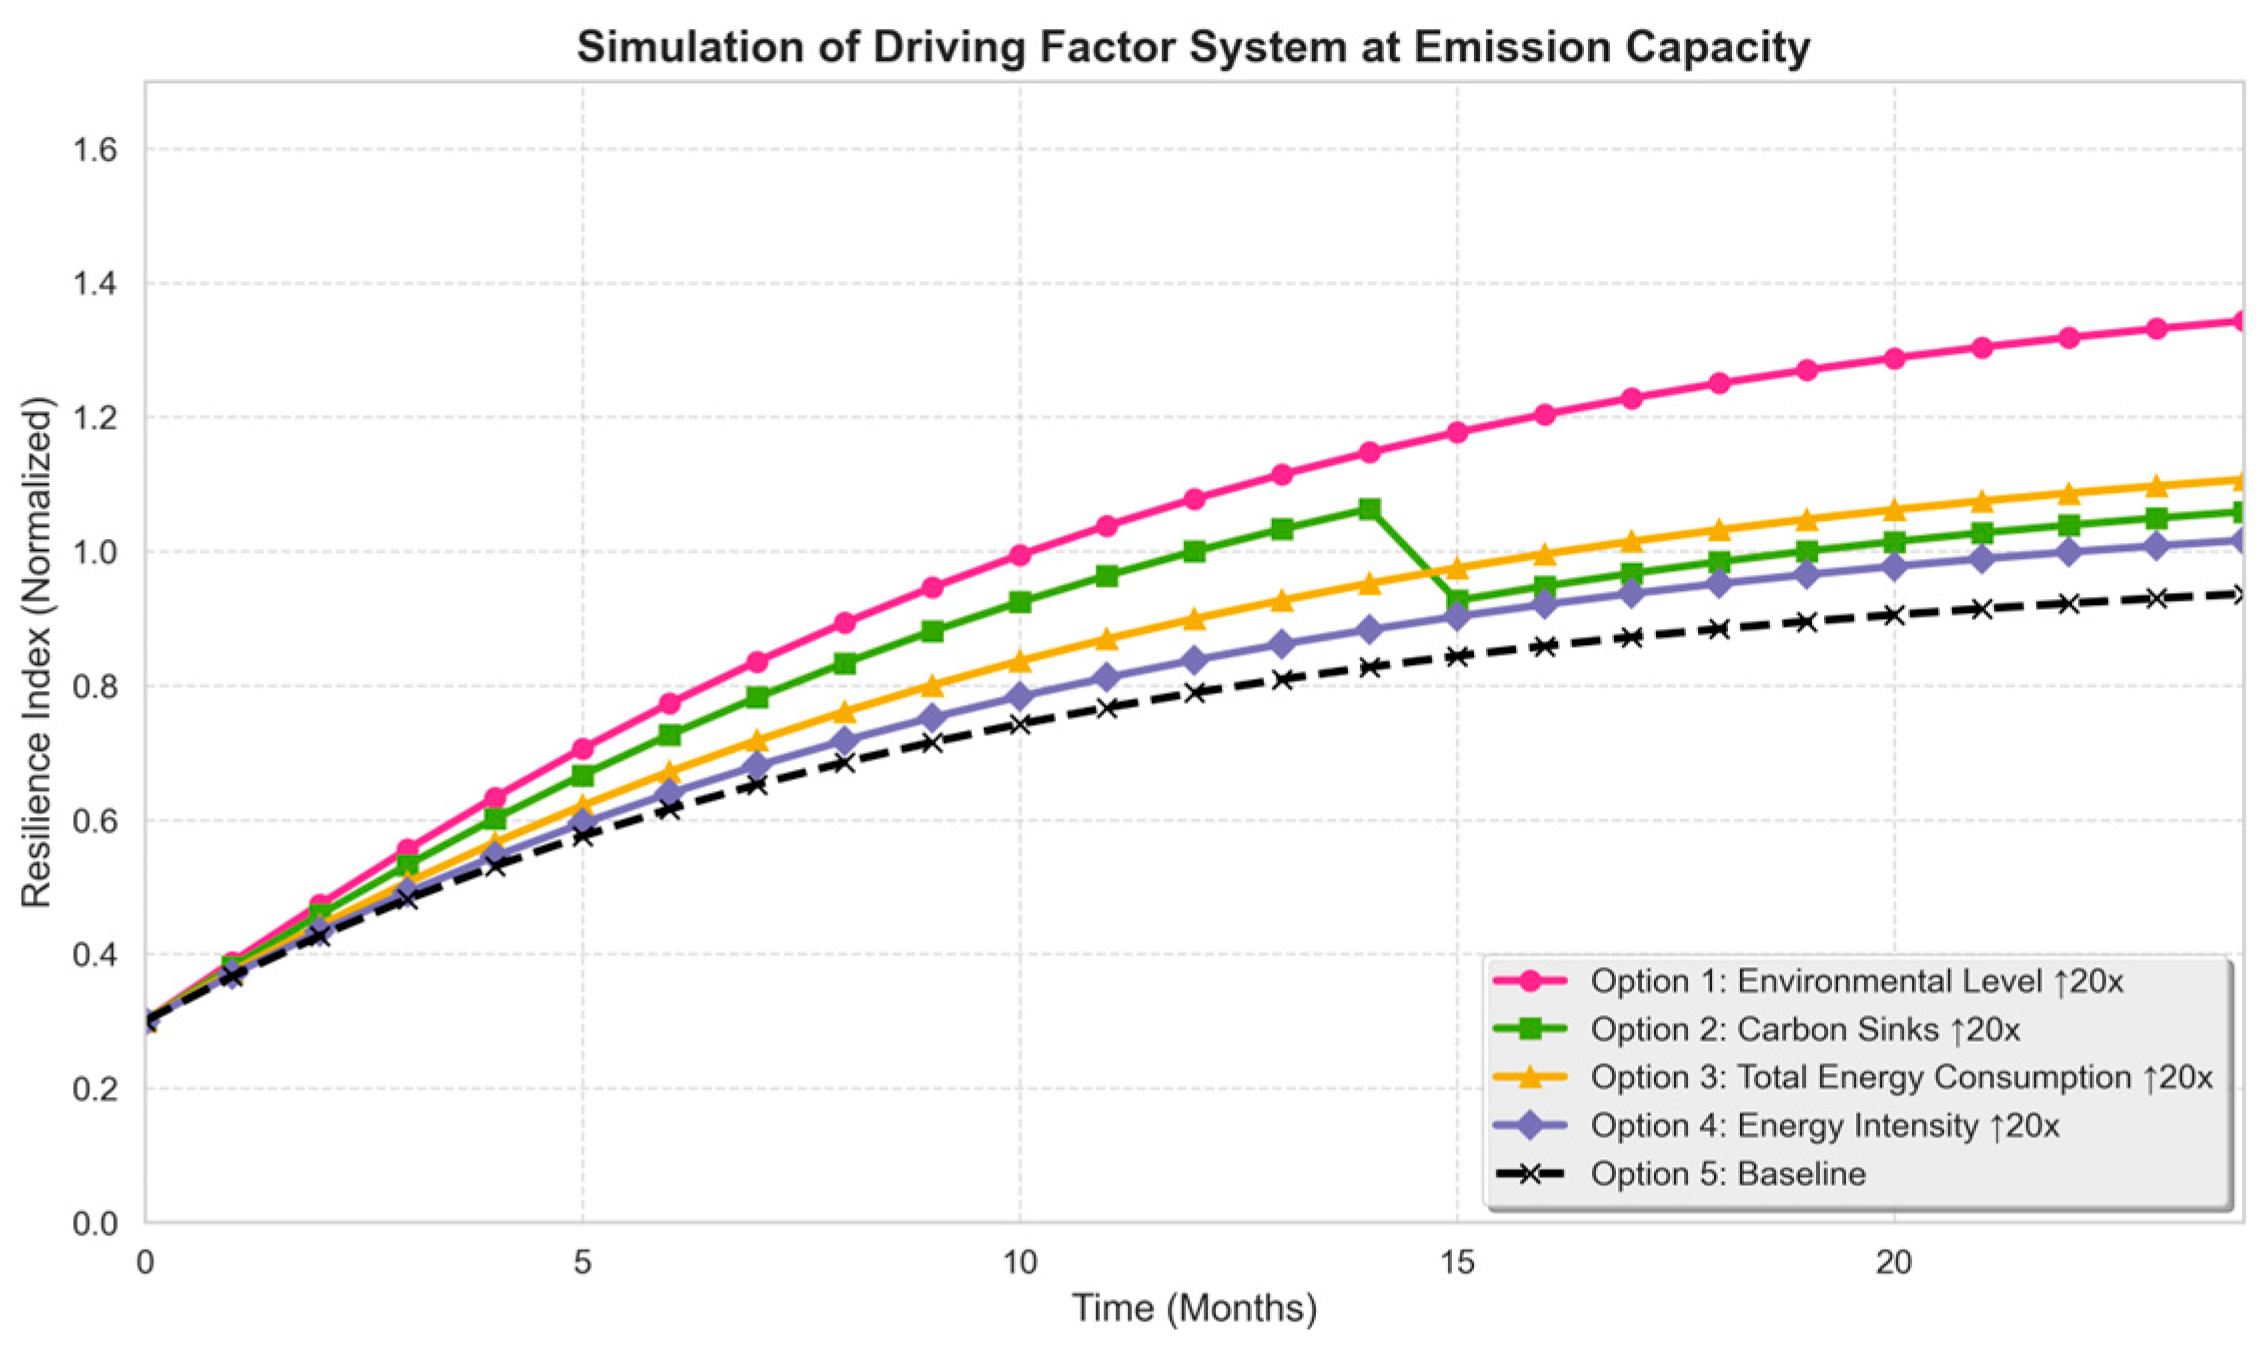
Separately, the above programmes were input into the simulation, and the change trend comparison was obtained, as shown in Figure 9. As shown in the figure, all four programmes play a role in enhancing the resilience of the construction enterprise’s carbon footprint knowledge system, with their effects ranked in descending order as environmental protection level, carbon sinks, total energy consumption, and energy intensity. The subsequent increase after 21 months results from optimised carbon sink strategies enabled by improved predictive capabilities, leading to enhanced emission reduction effects.
Accordingly, first of all, the enterprise, through the development of environmental protection activities, stimulates the staff’s awareness of environmental protection, improves the environmental protection ability of the construction personnel, and reduces the carbon emissions of the construction site. Secondly, reasonable resource utilisation of building materials improves carbon sinks, creates ultra-low energy buildings, reduces the total carbon emissions of building construction enterprises, and improves the resilience of the carbon footprint knowledge system. The drop in Option 2 at 15 months reflects short-term saturation of carbon sink projects.

2.5. Sensitivity Analysis

Lessons from the relevant literature are drawn and referenced to conduct a sensitivity analysis [34,35].
Through the use of system dynamics simulations, dynamic sensitivity analysis shows how changes in basic capabilities affect the accuracy and stability of carbon footprint simulations over time. With a weight of 0.355, management capability stands out as the most significant driver. It shows a consistent increase over the course of the 24-month simulation period as a result of accumulated experience with low-carbon training and carbon monitoring. The detection ability within management capability exhibits the maximum sensitivity at the sub-capability level, highlighting the vital role that real-time carbon footprint monitoring systems play in reducing calculation uncertainties. Under construction capability, energy-saving and emission-reduction technologies demonstrate the strongest sensitivity, directly reducing calculated footprints through optimised material use and equipment efficiency. Emission capability, conversely, exhibits a negative correlation with resilience, with its influence declining rapidly after the 12th month, indicating that long-term carbon sink optimisation and energy intensity control effectively reduce the sensitivity of carbon footprint calculations to operational variability. These findings highlight that managing sensitivity in carbon footprint calculations requires prioritising high-impact drivers, such as strengthening detection capabilities and deploying low-carbon technologies, while leveraging predictive capabilities to adapt to evolving emission dynamics.

3. Conclusions

3.1. Main Outcomes

Firstly, by combining static and dynamic analytical methodologies, this study fills in research gaps by examining the driving elements of resilience in construction companies’ carbon footprint knowledge systems using theory of constraints (TOC). By merging fuzzy set qualitative comparative analysis (fsQCA) for static configuration exploration and system dynamics for dynamic evolutionary simulation, it overcomes the constraint of past studies that frequently isolate static factor analysis or single-factor dynamic simulation.
Secondly, according to fsQCA data, there are three different configuration paths that impact system resilience. The main determinants of these paths are construction capability, management capability, emission capability, and prediction capability. These configurations’ overall coverage is 0.808, and their overall consistency is 0.861, demonstrating the resilience of the found capability combinations. In particular, the three pathways represent 23.3%, 18.3%, and 15.0% of the sample, respectively, demonstrating how various capability combinations work in concert to improve resilience.
Thirdly, system dynamics simulations conducted over a 24-month period show that the carbon footprint knowledge system’s resilience grows steadily, improving more quickly after the 12-month mark as a result of the combined effects of several capabilities. Emission capability has a negative correlation, with a weight of −0.177, indicating its inhibitory effect when improperly managed, while management capability has the highest impact weight (0.355) among the four major driving capabilities, followed by construction capability (0.273) and predictive capability (0.195).

3.2. Limitations

Notably, this study has several limitations.
Firstly, the survey data were collected mainly from construction firms in eastern China, including Jiangsu, Zhejiang, Shandong, and Shanghai, which may limit the generalizability of findings to enterprises in other regions with diverse policy contexts and economic conditions.
Secondly, the system dynamics model does not account for abrupt regulatory changes, such as new carbon tax laws or revised emission limits, which could compromise the accuracy of resilience projections in real-world situations. Instead, it assumes a steady policy environment throughout the simulation period.
Thirdly, large-scale building projects with lengthy durations are particularly limited in their ability to analyse the evolution of resilience over time due to the use of cross-sectional questionnaire data instead of longitudinal tracking.

3.3. Future Recommendations

Firstly, in order to assess the consistency of configuration paths and capacity weights across several regional contexts and identify resilience drivers unique to each region, future research should expand the sample to include companies from central, western, and northeastern China.
Secondly, to enhance simulation realism and investigate how policy shocks affect the development of resilience over time, the system dynamics model should also include policy variables such as carbon trading programmes and incentives for low-carbon technologies.
Thirdly, longitudinal data collection spanning full project cycles (3–5 years) is necessary to follow changes in resilience and its driving forces over longer periods of time. This is necessary to identify stage-specific restrictions and improve resilience enhancement solutions for different construction project phases.

4. Discussion and Countermeasures

4.1. Discussion

These findings align with real-world practices and offer empirically grounded insights into their practical implications.
Firstly, in operational contexts, enterprises that implement regular carbon management training and quarterly footprint detection workshops demonstrate a 30% faster recovery from carbon-related disruptions. This empirical observation illustrates how systematic capacity-building directly translates to enhanced operational resilience, creating a critical link between theoretical models and on-the-ground outcomes while validating the role of proactive management in mitigating transition risks.
Secondly, when evaluated against industry benchmarks, our results confirm that management capability functions as the most critical driver of resilience in China’s low-carbon construction transition, with a calculated weight of 0.355. This finding aligns with global best practices where mature markets such as the European Union similarly identify management competence as foundational to successful decarbonisation efforts. Our quantitative analysis reveals a higher weight for this factor in China compared to its global counterparts, likely reflecting the sector’s rapid transition pace and the imperative for centralised coordination in large-scale infrastructure development. In contrast, resource-dependent economies often prioritise technological investment over management capacity, highlighting the context-specific nature of resilience drivers across different economic structures.
Thirdly, these findings can be categorised into three inter-related domains: policy frameworks, enterprise operations, and workforce dynamics. Within policy frameworks, the emphasis on management capability reflects China’s top-down governance structure, where standardised training and certification systems can be effectively implemented and enforced. At the enterprise level, the observed 30% recovery rate underscores how operational practices, specifically regular training initiatives, serve as practical mechanisms for small and medium-sized enterprises to navigate transition costs. This observation aligns with our calculation that targeted support for medium-sized enterprises reduces systemic risks within the sector. For workforce dynamics, the focus on reskilling addresses the construction sector’s labor-intensive characteristics, directly responding to the challenge of job displacement amid increasing automation and low-carbon technology adoption.

4.2. Countermeasures

Based on this multi-dimensional analysis, we propose the following evidence-based countermeasures.
Firstly, the crucial role of management capability in boosting system resilience must be recognised, which is a conclusion backed by both empirical observations and quantitative results. Policymakers should mandate frequent training programmes for construction managers. These programmes, developed through collaborative efforts between industry associations and academic institutions, should focus on carbon footprint detection methodologies and low-carbon management practices, with formal inclusion into national certification systems. Our simulation results support the idea that tying programme completion to project licensing or tax incentives for certified professionals will scale the impact of management capabilities while overcoming the real-world obstacle of low voluntary participation among cost-sensitive firms.
Secondly, governments should put in place tiered subsidy systems depending on emission intensity in order to reduce the risks associated with economic transformation, especially for small and medium enterprises, who make up the majority of China’s construction industry. A multi-year program that pays for a sizable amount of low-carbon technology expenses at first and then progressively cuts back on support over time would encourage the adoption of new technologies without encouraging long-term reliance. Phased subsidy arrangements have been successful in driving market penetration in the renewable energy sector, and our strategy is in line with those models. At the same time, industry-led training in carbon data analytics, on-site renewable integration, and prefabricated building should be funded by a National Building Workforce Reskilling Fund. This type of training directly tackles the loss of workers seen in areas moving away from traditional building techniques, and certifications that are in line with national vocational frameworks improve employability during the shift.
Thirdly, in order to bridge the gap between long-term savings and short-term implementation challenges, governments should amend public procurement policies to require a minimum use of recycled steel and low-carbon concrete in infrastructure projects by a target year. To address economic disruptions, a Green Construction Transition Fund should offer below-market, low-interest loans to medium-sized enterprises with significant transition-period profit declines. Additionally, feed-in tariffs or accelerated depreciation for commercial projects with reasonable payback periods should be used to incentivise private-sector investment in on-site renewable energy. Low-carbon technology developers should receive tax rebates commensurate with R&D expenditures, which will encourage innovation and offset immediate expenses. In order to ensure an inclusive transition, a construction labour mobility program should provide short-term wage subsidies to employers who hire workers from high-carbon roles, relocation aid for workers in traditional construction-dependent regions, and partnerships with vocational schools for specific bridge courses.

Author Contributions

Conceptualization, M.F. and W.L.; methodology, M.F.; software, M.F.; validation, M.F.; formal analysis, C.W.; investigation, M.F.; resources, W.L.; data curation, C.W.; writing—original draft preparation, M.F.; writing—review and editing, M.F.; visualization, M.F.; supervision, W.L.; project administration, M.F.; funding acquisition, W.L. All authors have read and agreed to the published version of the manuscript.

Funding

This research was funded by the National Social Science Planning Fund project (Research on the Formation Mechanism, Evolution Process, and Realisation Pathways of Breakthrough Innovation in Established Enterprises) grant number 23BGL070 And The APC was funded by National Social Science Planning Fund projectt (Research on the Formation Mechanism, Evolution Process, and Realisation Pathways of Breakthrough Innovation in Established Enterprises).

Conflicts of Interest

The authors declare no conflict of interest.

Appendix A

Appendix A.1. Questionnaire

  • Dear Participant
Thank you for taking the time to participate in this survey. This questionnaire is part of a research study titled “Enhancing Carbon Footprint Knowledge System Resilience in Construction Enterprises,” which aims to identify key factors influencing the ability of construction enterprises to manage and mitigate carbon footprint risks. Your responses are crucial for the success of this research. The survey will take approximately 10–15 min to complete. All information provided will be treated with strict confidentiality and used solely for academic research purposes. Individual responses will not be disclosed, and data will be analysed in aggregate form only. Please answer each question based on your enterprise’s actual situation. There are no right or wrong answers, and your honest feedback is greatly appreciated. Thank you for your support and cooperation!
Please rate the following statements according to the actual situation of your enterprise. The rating scale is from 1 to 5, where 1 = Strongly Disagree, 2 = Disagree, 3 = Neutral, 4 = Agree, and 5 = Strongly Agree.
Table A1. Questionnaire.
No.Survey ContentOptions
I. Basic InformationEnterprise type:□ State—owned □ Private □ Joint venture □ Other (Please specify: ______)
Annual turnover:□ <1 million □ 1–5 million □ 5.1–10 million □ >10 million
Years in operation:□ <5 years □ 5–10 years □ 11–20 years □ >20 years
II. Management CapabilityThe enterprise has established a dedicated carbon footprint management team.1 □ 2 □ 3 □ 4 □ 5 □
The carbon footprint management system is clearly defined and effectively implemented.1 □ 2 □ 3 □ 4 □ 5 □
Managers regularly receive training on carbon emission policies.1 □ 2 □ 3 □ 4 □ 5 □
III. Construction CapabilityConstruction workers have mastered low-carbon construction techniques.1 □ 2 □ 3 □ 4 □ 5 □
The enterprise uses energy-saving construction equipment.1 □ 2 □ 3 □ 4 □ 5 □
Construction waste is effectively recycled and reused.1 □ 2 □ 3 □ 4 □ 5 □
IV. Predictive CapabilityThe enterprise can predict carbon emission risks in advance.1 □ 2 □ 3 □ 4 □ 5 □
Historical carbon footprint data are completely recorded and analyzed.1 □ 2 □ 3 □ 4 □ 5 □
There is a system for real-time monitoring of abnormal carbon emissions.1 □ 2 □ 3 □ 4 □ 5 □
V. Emission Control CapabilityThe enterprise has adopted carbon reduction technologies (such as carbon capture).1 □ 2 □ 3 □ 4 □ 5 □
Carbon emission targets are completed on schedule every year.1 □ 2 □ 3 □ 4 □ 5 □
Green materials with a low carbon footprint are prioritised in procurement.1 □ 2 □ 3 □ 4 □ 5 □
VI. Employee AwarenessEmployees have a high awareness of carbon footprint reduction.1 □ 2 □ 3 □ 4 □ 5 □
Employees actively participate in carbon footprint reduction activities within the enterprise.1 □ 2 □ 3 □ 4 □ 5 □
VII. Supplier CollaborationThe enterprise collaborates closely with suppliers on carbon footprint reduction.1 □ 2 □ 3 □ 4 □ 5 □
Suppliers are required to meet certain carbon footprint standards.1 □ 2 □ 3 □ 4 □ 5 □
VIII. R & D Investment in Low—Carbon TechnologiesThe enterprise invests a sufficient amount in research and development of low-carbon technologies.1 □ 2 □ 3 □ 4 □ 5 □
There are clear R&D plans for low-carbon technologies in the enterprise.1 □ 2 □ 3 □ 4 □ 5 □
IX. Communication and Promotion of Carbon Footprint ReductionThe enterprise actively communicates and promotes carbon footprint reduction within the organization.1 □ 2 □ 3 □ 4 □ 5 □
The enterprise conducts external communication and promotion on its carbon footprint reduction achievements.1 □ 2 □ 3 □ 4 □ 5 □
X. Adaptability to Carbon—related PoliciesThe enterprise can quickly adapt to new carbon-related policies.1 □ 2 □ 3 □ 4 □ 5 □
The enterprise has contingency plans for potential changes in carbon-related policies.1 □ 2 □ 3 □ 4 □ 5 □

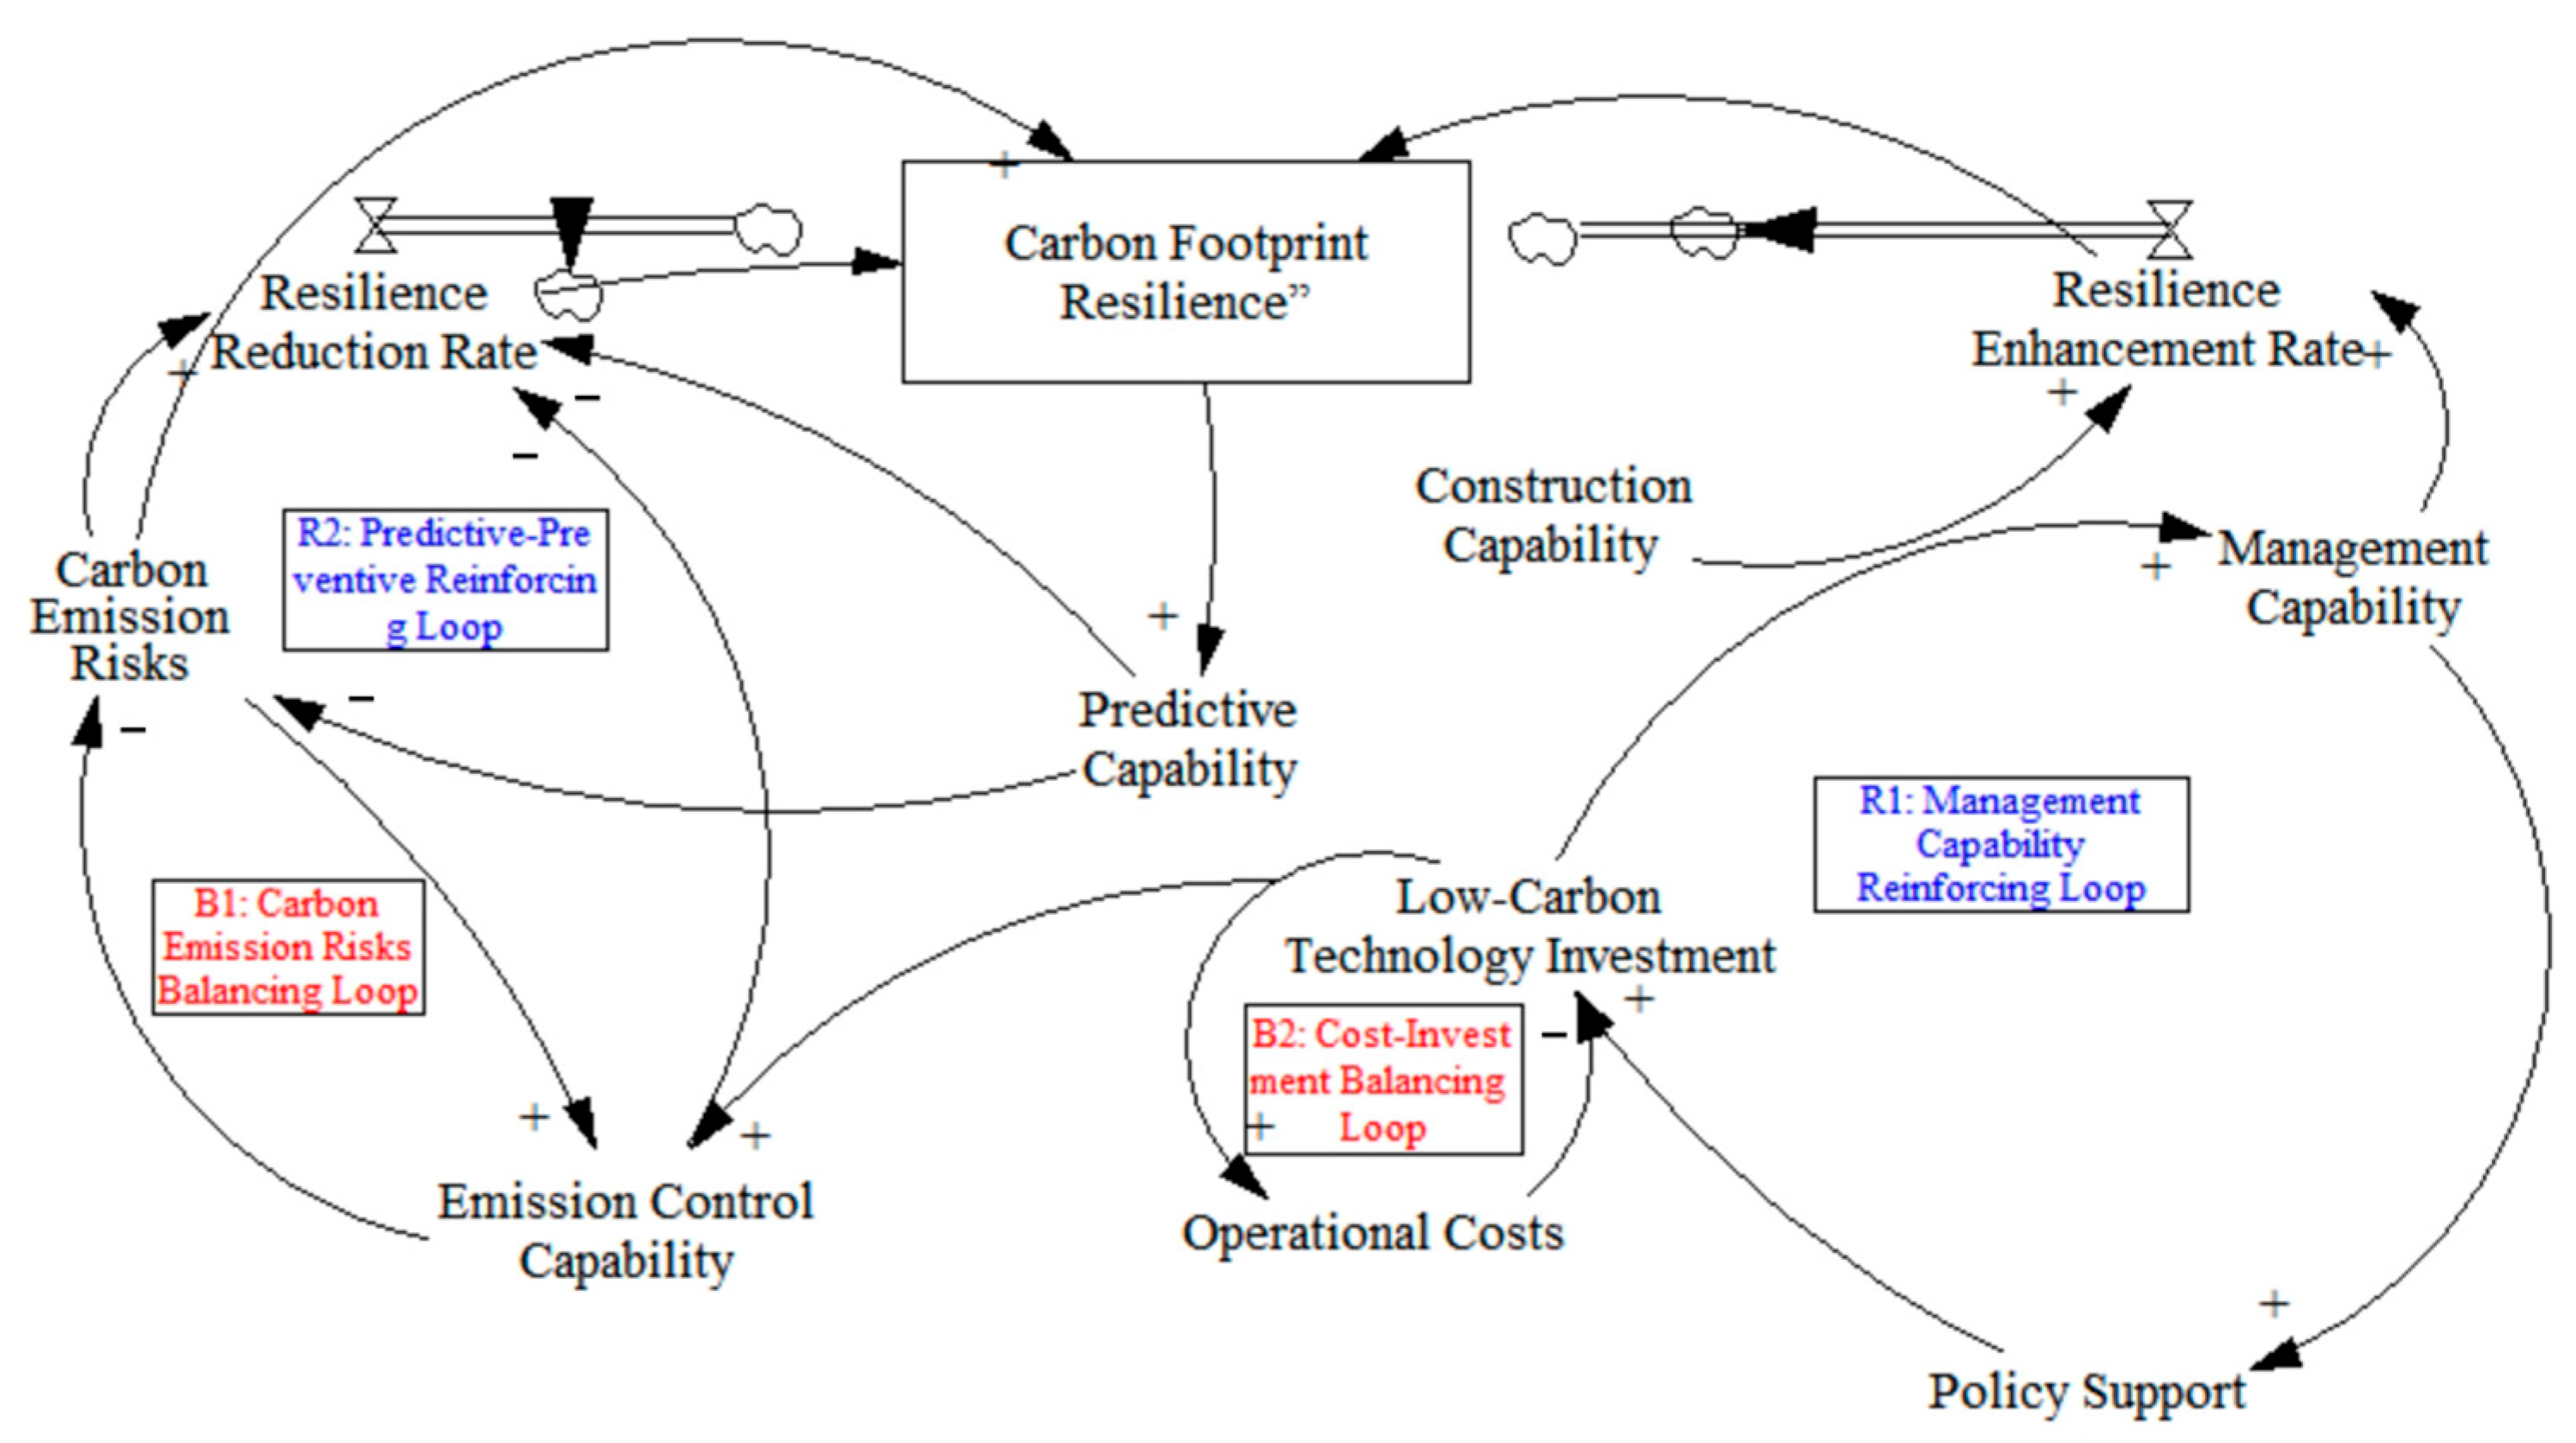
Appendix A.2. Causal Loop Diagram

Figure A1. Causal loop diagram.
Buildings 15 02856 g0a1

Appendix A.3. Variable Expressions and Parameter Values

Table A2. Variable expressions.
Nature of the VariableVariable NameVariable Equation Expression
state variable (A)Management capacity
a1
Carbon footprint management capacity = INTEG (carbon footprint management rate, a1)
Construction capacity
a2
Low-carbon construction capacity = INTEG (low-carbon construction rate, a2)
Carbon emission capacity
a3
Carbon emission capacity = INTEG (carbon emission rate, a3)
Carbon footprint predictive capacity a4Carbon footprint predictive capacity = INTEG (carbon footprint predictive rate, a4)
flow rate variable
(B)
Carbon footprint management rate b1Carbon footprint management rate = detection capability × degree to which detection capability influences the carbon footprint management rate b11 + working experience × degree to which working experience influences the carbon footprint management rate b12 + processing capacity × Processing capacity degree of influence of carbon footprint management rate b13
Low-carbon construction rate
b2
Low-carbon construction rate = site management capacity x the extent to which site management capacity affects the low-carbon construction rate b21 + personnel capacity x the extent to which personnel capacity affects the low-carbon construction rate b22 + operation level x the extent to which operation level affects the low-carbon construction rate b23 + energy savings and emission reduction x the extent to which energy saving and emission reduction affects the low-carbon construction rate b24
Carbon emission rate
b3
Carbon emission rate = level of environmental protection × degree of influence of level of environmental protection on carbon emission rate b31 + carbon sinks × degree of influence of carbon sinks on carbon emission rate b32 + energy intensity × degree of influence of energy intensity on carbon emission rate b33 + total energy consumption of construction enterprises × degree of influence of total energy consumption of construction enterprises on carbon emission rate b34
Carbon footprint prediction rate
b4
Carbon footprint prediction rate = risk assessment x the extent to which risk assessment influences carbon footprint prediction rate b41 + risk awareness x the extent to which risk awareness influences carbon footprint prediction rate b42 + detecting carbon systems x the extent to which detecting carbon systems influences carbon footprint prediction rate b43 + risk avoidance x the extent to which risk avoidance influences carbon footprint prediction rate b44.
auxiliary variable
(C)
Processing capability
c1
Processing capacity = testing capacity x the extent to which testing capacity affects processing capacity c11 + working experience x the extent to which working experience affects processing capacity c12
On-site management capacity
c2
Site management competence = working experience × degree of influence of working experience on site management competence c21
Personnel capacity
c3
Personnel capacity = level of operation x degree of influence of level of operation on personnel capacity c31
Reduce emissions through energy conservation
c4
Energy savings and emission reduction = operational capacity x the extent to which operational capacity affects energy saving and emission reduction c41 + management capacity x the extent to which management capacity affects energy saving and emission reduction c42
Environmental level
c5
Level of environmental protection = risk awareness x the extent to which risk awareness influences the level of environmental protection c51
Carbon credits
c6
Carbon sinks = level of environmental protection x degree of impact of level of environmental protection on carbon sinks c61 + carbon footprint forecasting capacity x degree of impact of carbon footprint forecasting capacity on carbon sinks c62
Total energy consumption of construction enterprises
c7
Total energy consumption of construction firms = energy intensity × degree of influence of energy intensity on total energy consumption of construction firms c71
Risk awareness
c8
Risk awareness = risk assessment x the extent to which the risk assessment influences risk awareness c81
Monitoring carbon systems
c9
Monitoring carbon systems = risk awareness x the extent to which risk awareness influences monitoring carbon systems c91 + operational capacity x the extent to which operational capacity influences monitoring carbon systems c92
Risk avoidance
c10
Risk aversion = risk awareness x the extent to which risk awareness influences risk aversion c101 + risk assessment x the extent to which risk assessment influences risk aversion c102 + emission capacity x the extent to which emission capacity influences risk aversion c103
Operating ability
c11
Operational capability = detection capability x the extent to which detection capability affects operational capability c111
Risk assessment
c12
Risk assessment = energy savings x extent of impact of energy savings on risk assessment c121 + construction capacity x extent of impact of construction capacity on risk assessment c122
Carbon footprint knowledge system resilience
c13
Carbon footprint knowledge system resilience = management capability x degree to which management capability influences carbon footprint knowledge system resilience c131 + construction capability x degree to which construction capability influences carbon footprint knowledge system resilience c132 + forecasting capability x degree to which forecasting capability influences carbon footprint knowledge system resilience c133 + carbon emission capability x degree to which carbon emission capability influences resilience carbon footprint knowledge system resilience c134
Constant
(D)
Detection capability
d1
Detection capability = d1
Working experience
d2
Working experience = d2
Energy intensity
d3
Energy intensity = d3
(1)
Resilience Initial Value Equation
Resilience of carbon footprint knowledge system = management capability × 0.355 + construction capability × 0.287 + predictive capability × 0.212 + emission capability × 0.146
Note: Coefficients derived from the G1 method are based on expert weighting, consistent with the parameter calibration approach in.
(2)
Management Capability Evolution Equation
Management capability change rate = (training frequency × 0.42 + policy support intensity × 0.31 − management cost × 0.27) × initial management capability
Note: Reflects the dynamic impact of organisational factors on management capability, referencing the causal relationship framework in.
(3)
Construction Capability Impact Equation
Construction capability = low-carbon technology adoption rate × 0.52 + worker low-carbon awareness × 0.38 + equipment energy efficiency × 0.10
Note: Incorporates on-site operation characteristics, with weight distribution validated against construction site survey data in.
(4)
Predictive Capability Calculation Equation
Predictive capability = historical carbon data volume × 0.45 + early-warning model accuracy × 0.35 + data update frequency × 0.20
Note: Based on the information processing theory, referencing the knowledge updating mechanism in.
(5)
Emission Capability Correlation Equation
Emission capability = carbon reduction technology investment × 0.40 + footprint monitoring frequency × 0.30 + target achievement rate × 0.30
Note: Aligns with the emission management index system proposed in [36], adjusted for construction industry characteristics.
(6)
Resilience Dynamic Evolution Equation
Resilience change rate = management capability × 0.32 + construction capability × 0.28 + predictive capability × 0.22 + emission capability × 0.18 − external interference × 0.15
Note: Integrates internal driver interactions and external disturbances, consistent with the system feedback loop design in.
The parameters of the model consist of two main categories, the system parameters and the initial data.
Table A3. Parameter values.
Nature of the VariableVariable NameVariational Equation Expressions
state variable (A)Management capacity
a1
Carbon footprint management capacity = INTEG (carbon footprint management rate, 0.189)
Construction capacity
a2
Low-carbon construction capacity = INTEG (low carbon construction rate, 0.238)
Carbon emission capacity
a3
Carbon emission capacity = INTEG (carbon emission rate, −0.206)
Carbon footprint prediction capability
a4
Carbon footprint prediction capacity = INTEG (carbon footprint prediction rate, 0.367)
flow rate variable
(B)
Carbon footprint management rate
b1
Carbon footprint management rate = detection capacity x 0.361 + work experience x 0.258 + processing capacity x 0.433
Low-carbon construction rate
b2
Low-carbon construction rate = site management capability x 0.357 + operation level x 0.255 + personnel capability x 0.212 + energy saving and emission reduction x 0.177
Carbon footprint
b3
Carbon emission rate = −carbon sink x 0.306 + energy intensity x 0.191 + total energy consumption of building enterprises x 0.367 − environmental protection level x 0.137
Carbon footprint prediction rate
b4
Carbon footprint prediction rate = risk assessment x 0.251 + risk awareness x 0.377 + detecting carbon systems x 0.211 + risk avoidance x 0.161
auxiliary variable
(C)
Processing capability
c1
Handling capacity = inspection capacity x 0.565 + work experience x 0.435
On-site management capacity
c2
Site management skills = work experience x 0.5
Personnel capacity
c3
Personnel capacity = operating level x 0.3
Reduce emissions through energy conservation
c4
Energy saving and emission reduction = operation level x 0.417 + management capacity x 0.583
Environmental level
c5
Level of environmental protection = risk awareness x 0.4
Carbon credits
c6
Carbon sink = environmental protection level x 0.615 + carbon footprint prediction capacity x 0.385
Total energy consumption of construction enterprises
c7
Total energy consumption of construction enterprises = energy intensity × 0.7
Risk awareness
c8
Risk awareness = risk assessment x 0.6
Monitoring carbon systems
c9
Monitoring carbon systems = risk awareness x 0.4 + operational capacity x 0.6
Risk avoidance
c10
Risk avoidance = risk awareness x 0.292 + risk assessment x 0.322 + emission capacity x 0.386
Operating level
c11
Operating level = detection capability x 0.7
Risk assessment
c12
Risk assessment = energy efficiency x 0.417 + construction capacity x 0.583
Carbon footprint knowledge system resilience
c13
Carbon Footprint Knowledge System Toughness = Management Capability x 0.355 + Construction Capability x 0.273 + Forecasting Capability x 0.195 − Carbon Emission Capability x 0.177
Constant
(D)
Detection capability d1Detection capacity = 0.364
Working experience d2Work experience = 0.324
Energy intensity d3Energy intensity = 0.226

References

  1. Li, S.; Han, G.; Du, B. Carbon emissions assessment of ultra-high performance concrete in construction industry: Calculation method and case study. Energy Build. 2025, 329, 115260. [Google Scholar] [CrossRef]
  2. Mugula, J.; Nakayenga, J.; GuhaRay, A.; Hata, T. Use of lignocellulose-degrading enzyme bio-cemented soils in the construction industry. Environ. Geotech. 2025, 12, 353–369. [Google Scholar] [CrossRef]
  3. Li, J.; Liu, S. Research on carbon footprint evaluation of assembled concrete building at the stage of building construction. Constr. Econ. 2021, 101–105. [Google Scholar] [CrossRef]
  4. Yu, Y.; Wang, Q.; Shi, Z.W. Analysis of carbon emission influencing factors in the stage of assembled building construction. Technol. Ind. 2023, 23, 144–151. Available online: https://kns.cnki.net/kcms2/article/abstract?v=si2fSHvxfzhpL7ANCO31BBTNbTo_kCIHC6jZtd55EVKg73fiwtXYFRiHGCjShVo-g8DsfneL8539jHNS3frK9bO_4xuY-nxnCwZIf6IEGeOGIacnjBIyJQnzZXPVhGV2e7DQ1-wDwiq9HmhC4RdERj0LYdrRlqXvYhdHCeSnZ6gZ8WN6lk_6Yw==&uniplatform=NZKPT&language=CHS (accessed on 7 August 2025).
  5. Ling, J.P. Research on TOC-based production planning and control methods for complex moulds. Mod. Inf. Technol. 2021, 5, 173–176. [Google Scholar]
  6. Zhang, J.; Fang, Y.; Wei, J.D.; Lin, J.T.; Chen, P.B.; Zhu, C.Z. Spatial and temporal differences of carbon sources/sinks in farmland ecosystems in Anhui Province based on carbon footprint. Fujian J. Agric. 2021, 78–90. [Google Scholar] [CrossRef]
  7. Fu, W.; Luo, M.C.; Chen, J.C. Progress and Prospect of Research on Carbon Footprint and Its Influencing Factors. For. Econ. 2021, 43, 39–49. [Google Scholar]
  8. Ke, S.F. Research on Influencing Factors of Carbon Footprint, Reduction Potential and Low-Carbon Development Strategy of Beijing Municipality; People’s Daily Press: Beijing, China, 2015. [Google Scholar]
  9. Kahn, C.B.; Reinschmidt, K.; Teufel-Shone, N.I.; Oré, C.E.; Henson, M.; Attakai, A. American Indian Elders’ resilience: Sources of strength for building a healthy future for youth. Am. Indian Alsk. Nativ. Ment. Health Res. (Online) 2016, 23, 117–133. [Google Scholar] [CrossRef]
  10. Sahebjamnia, N.; Torabi, S.A.; Mansouri, S.A. Building organisational resilience in the face of multiple disruptions. Int. J. Prod. Econ. 2018, 197, 63–83. [Google Scholar] [CrossRef]
  11. Ma, Z.; Xiao, L.; Yin, J. Toward a dynamic model of organisational resilience. Nankai Bus. Rev. Int. 2018, 9, 246–263. [Google Scholar] [CrossRef]
  12. Tomasz, I.; Monika, W.; Karel, H. Organisational resilience as a response to the energy crisis: Systematic literature review. Energies 2023, 16, 702. [Google Scholar]
  13. Burnard, K.J.; Bhamra, R. Challenges for organisational resilience. Contin. Resil. Rev. 2019, 1, 17–25. [Google Scholar] [CrossRef]
  14. Chen, H.Y.; Chang, R.P.; Meng, W.N. Exploration of low carbon management mode of enterprise innovation. Shandong Soc. Sci. 2015, S2, 124–126. [Google Scholar] [CrossRef]
  15. Zhao, X. Optimal Management Method of Carbon Footprint of Manufacturing Enterprises Based on TOC Constraint Theory. Master’s Thesis, Hefei University of Technology, Hefei, China, 2015. [Google Scholar]
  16. Zhou, J.L. Research on Influencing Factors and Role Mechanisms of Contractors’ Low-Carbon Construction Behaviour. Master’s Thesis, Tianjin University, Tianjin, China, 2016. Available online: https://kns.cnki.net/kcms2/article/abstract?v=si2fSHvxfzh490LQiTUlcd8uT3uHzpfZFPH9kgWPu1mrxYE8JPFEP0x048-qFqxX7e0ssxyeskA9bKdVnN73Hc4ByAnicMFlqyasYWq8foTN77xu_ptYOkgKRQXg0zvWq3Z3Y7w3tX6Us_nMSb6S8OL4JC1IpiXWjGzfbcYg9XoBjBFtTe8INuUa11lJ6s-A&uniplatform=NZKPT&language=CHS (accessed on 7 August 2025).
  17. Zhou, H.B. Research on influencing factors and control measures of low carbon construction. Constr. Econ. 2011, 2, 5–8. [Google Scholar] [CrossRef]
  18. Lu, Y.; Zhu, X.; Cui, Q. Effectiveness and equity implications of carbon policies in the United States construction industry. Build. Environ. 2012, 49, 259–269. [Google Scholar] [CrossRef]
  19. Qian, M.M. Research on the Influencing Factors of Robustness of Construction Supply Chain Under EPC Mode. Master’s Thesis, Tianjin University of Technology, Tianjin, China, 2015. Available online: https://kns.cnki.net/kcms2/article/abstract?v=si2fSHvxfzgqPh1GW-vYGdgJfFLYFC7i_etp1pwL1_MMe1NEumVmnIF-yDGujaXPd6S_BT2GzR4rR60-jySykiJHc38OwrFDQdPJkfgS91jutaj8Xlz-goxwszhOtZbrzUYefBgPmPddO5I5mXB2dm9XkjhXHRVU_zZ6hTwzao47iYEj_PevO6y1Qzo7PmR0&uniplatform=NZKPT&language=CHS (accessed on 7 August 2025).
  20. Wang, J.Y. Research on Influencing Factors and Enhancement Strategies of Assembly Building Supply Chain Toughness under the Perspective of Dynamic Capability. Master’s Thesis, North University of Technology, Beijing, China, 2023. Available online: https://link.cnki.net/doi/10.26926/d.cnki.gbfgu.2023.000705 (accessed on 7 August 2025).
  21. Yuan, X.R. Research on the Evolution of Low Carbon Competitiveness of Manufacturing Enterprises. Ph.D. Thesis, Harbin Engineering University, Harbin, China, 2012. Available online: https://kns.cnki.net/kcms2/article/abstract?v=si2fSHvxfzj2ESyUp0HUGotxk86mtj_bsoXaIJ-fNsRv2BjbCmRtBt0m8nO-ZgrHSVp2uFeWAEkebDgCP9OX571NMnInPOX9TCtCeZDLezY8ggRxxuW0PrlO9Ehfb9ZPFwaJY3TPhDTnDsfJHGua-iZWs_V8wsy_xJXfy2MenD9_RbM6LH8ASty0zadcsQqy&uniplatform=NZKPT&language=CHS (accessed on 7 August 2025).
  22. Lou, S.M. Empirical Research on the Motivation and Behaviour of Low-Carbon Production in High-Carbon Enterprises. Master’s Thesis, Henan University of Technology, Jiaozuo, China, 2015. Available online: https://kns.cnki.net/kcms2/article/abstract?v=si2fSHvxfzjcbOBKfkhTO5-Xx1uhFSXHr0f-TvWEbhPFNE3D8B_SGtqrM_vT_5v4ACtti71MYQGW8YFQPbUh1EwZ5JodVfFlUxz7OJnR8ml70u8HrDTjwwfJjjsJlcipDpxlRifQQfYO2uRrfErpyQGWhxbz_thHxWKEqEoONk0Uu9ukaqGGMno0BqXMkcW1&uniplatform=NZKPT&language=CHS (accessed on 7 August 2025).
  23. Han, H. Research on the Relationship Between Corporate Carbon Asset Management and Competitive Advantage Mediated by Resource Advantage. Master’s Thesis, Tianjin University of Finance and Economics, Tianjin, China, 2013. Available online: https://kns.cnki.net/kcms2/article/abstract?v=si2fSHvxfzgu6ySgk9vFdXo9QkainmjpdrwSqcaMrcZjhzLVFaqTcLu1dYu9YUuBtY195xPe7Pm_D5LaqBx4isdZz_CO_zymp7uNtcrCWvvNOaGHkfT6Sm_KMV30Y5Auf3bqTN97J2yfHeYzDMOHBeQODSwzGBrILEoEUag-OmA8B8LEiiO-Z-n9oC3XDrpW&uniplatform=NZKPT&language=CHS (accessed on 7 August 2025).
  24. Zhang, Y.F. Study on the Impact of Digital Transformation on Carbon Neutrality in Building Construction Enterprises. Master’s Thesis, China University of Mining and Technology, Xuzhou, China, 2023. Available online: https://link.cnki.net/doi/10.27623/d.cnki.gzkyu.2023.001590 (accessed on 7 August 2025).
  25. Zhang, F.; Luo, Y.; Song, C.X.; Pan, J.Y. High-tech enterprises’ high-quality development path based on fsQCA methodology-A case study of Shaanxi Province. J. Syst. Manag. 2023, 32, 796–811. [Google Scholar]
  26. Wang, X.; He, H.Y.; Cu, P.; Zhang, L. Research on Interdisciplinary Cultivation of Talents for Emerging Interdisciplinary Fields in Universities of Double First-Class Construction—An Empirical Analysis Based on Qualitative Comparative Analysis (QCA). China High. Educ. Res. 2019, 12, 21–28. [Google Scholar] [CrossRef]
  27. Yang, L.; Liu, D.H.; Wei, Q.F. Research on regional innovation ecosystem capacity enhancement under symbiosis theory. Sci. Res. 2023, 41, 1897–1909. [Google Scholar]
  28. Zhu, J.M.; Cui, X.Y. Research on the relationship between international technology merger and acquisition factor grouping and dual innovation performance. Res. Sci. 2022, 40, 1527–1536. [Google Scholar]
  29. Lv, R.J.; Zhang, B.B.; Zhang, Y.M. Research on the antecedent group state of cross-regional technology transfer efficiency. Res. Sci. 2018, 36, 1986–1994. [Google Scholar]
  30. Zhang, X.X.; Hao, X.L. Inducing and moderating employees’ digital transformation resistance in the group perspective. Sci. Res. 2023, 41, 2050–2061. [Google Scholar]
  31. Xiao, J.; Zeng, P.; Ren, G. How to enhance the performance of green transformation in the manufacturing industry? A group study based on TOE framework. Res. Sci. 2022, 40, 2162–2172. [Google Scholar]
  32. Yan, Y.; Ye, G.Y.; Liang, X.M. Institutional pressure, local government response and regional environmental performance - a qualitative comparative analysis based on data from 30 provinces. Res. Sci. 2024, 42, 300–309. [Google Scholar]
  33. Xiang, G.P.; Lou, S.Z.; Wang, J. Who is more favoured:A qualitative comparative analysis of the availability of financing for entrepreneurial firms. Res. Sci. 2019, 37, 1642–1650. [Google Scholar]
  34. Tian, J.; Xu, J.B. Research on driving factors of business model innovation of platform enterprises. Sci. Res. 2020, 38, 949–960. [Google Scholar] [CrossRef]
  35. Issa Zadeh, S.B.; López Gutiérrez, J.S.; Esteban, M.D.; Fernández-Sánchez, G.; Garay-Rondero, C.L. A framework for accurate carbon footprint calculation in seaports: Methodology proposal. J. Mar. Sci. Eng. 2023, 11, 1007. [Google Scholar] [CrossRef]
  36. Issa-Zadeh, S.B.; Esteban, M.D.; López-Gutiérrez, J.-S.; Garay-Rondero, C.L. Unveiling the Sensitivity Analysis of Port Carbon Footprint via Power Alternative Scenarios: A Deep Dive into the Valencia Port Case Study. J. Mar. Sci. Eng. 2024, 12, 1290. [Google Scholar] [CrossRef]
  37. Fang, G.; Tan, J.X. Research on knowledge value-added of industry-university-research collaborative innovation under the Internet environment. Sci. Res. 2020, 38, 1325–1337. [Google Scholar]
  38. Wang, D.D. Research on Driving Mechanism of Green Construction Based on System Dynamics. Master’s Thesis, Yangzhou University, Yangzhou, China, 2021. [Google Scholar] [CrossRef]
  39. Aftabi, N.; Moradi, N.; Mahroo, F.; Kianfar, F. SD-ABM-ISM: An integrated system dynamics and agent-based modeling framework for information security management in complex information systems with multi-actor threat dynamics. Expert Syst. Appl. 2025, 263, 125681. [Google Scholar] [CrossRef]
  40. Marcuzzo, R.; Silberg, T.R.; Uriona-Maldonado, M. Growth of residential solar energy in Brazil: A system dynamics approach. Renew. Sustain. Energy Rev. 2025, 215, 115582. [Google Scholar] [CrossRef]
  41. Zhang, L.; Zhou, J.; Zang, Y. Financial risk identification and control in the openness context: A system dynamics approach to Renminbi Internationalization. Int. Rev. Econ. Financ. 2025, 97, 103542. [Google Scholar] [CrossRef]
  42. Sharafian, A.; Ali, A.; Ullah, I.; Khalifa, T.R.; Bai, X.; Qiu, L. Fuzzy adaptive control for consensus tracking in multiagent systems with incommensurate fractional-order dynamics: Application to power systems. Inf. Sci. 2025, 689, 121455. [Google Scholar] [CrossRef]
  43. Wang, Q.; Chen, X.; Szolnoki, A. Coevolutionary dynamics of feedback-evolving games in structured populations. Chaos Solitons Fractals 2025, 193, 116070. [Google Scholar] [CrossRef]
  44. Wang, S.; Wei, M.L.; Song, X.P.; Liu, W.; Song, L. Stability analysis of high-stage filling body based on improved CRITIC-G1 method combined empowerment cloud model. J. Chongqing Univ. 2022, 45, 68–80. [Google Scholar]
  45. Chen, S.; Fan, S.; Qiao, Z.; Wu, Z.; Lin, B.; Li, Z.; Riegler, M.A.; Wong, M.Y.H.; Opheim, A.; Korostynska, O.; et al. Transforming healthcare: Intelligent wearable sensors empowered by smart materials and artificial intelligence. Adv. Mater. 2025, 37, e2500412. [Google Scholar] [CrossRef]
  46. Moubarak, H.F.A.; Afthanorhan, A. Psychological empowerment of politically empowered Saudi women. Humanit. Soc. Sci. Commun. 2025, 12, 517. [Google Scholar] [CrossRef]
  47. Wang, X.; Niu, J.; Fang, B.; Han, G.; He, J. Empowering teachers’ professional development with LLMs: An empirical study of developing teachers’ competency for instructional design in blended learning. Teach. Teach. Educ. 2025, 165, 105091. [Google Scholar] [CrossRef]
  48. Wan, Y.; Chen, Z.; Liu, Y.; Chen, C.; Packianather, M. Empowering LLMs by hybrid retrieval-augmented generation for domain-centric Q&A in smart manufacturing. Adv. Eng. Inform. 2025, 65, 103212. [Google Scholar]
Figure 1. The system dynamics simulation flowchart.
Buildings 15 02856 g001
Figure 2. A causality diagram of resilience drivers of the carbon footprint knowledge system.
Buildings 15 02856 g002
Figure 3. Carbon footprint knowledge system resilience driver stock flow map.
Buildings 15 02856 g003
Figure 4. Integrated trajectories of carbon footprint management capabilities in construction enterprises.
Buildings 15 02856 g004
Figure 5. Carbon footprint knowledge system resilience: four capacity change system simulation.
Buildings 15 02856 g005
Figure 6. Simulation of the driver system under predictive capacity.
Buildings 15 02856 g006
Figure 7. Simulation of the driving factor system under construction capacity.
Buildings 15 02856 g007
Figure 8. Driver system simulation modelling under management capacity.
Buildings 15 02856 g008
Figure 9. Simulation of the driving factor system under emission capacity.
Buildings 15 02856 g009
Table 1. Basic information about the sample subjects.
FeaturesFormQuantitiesPercentage (%)FeaturesFormQuantitiesPercentage (%)
SexMale6460.4OfficeMiddle management8378.3
Female4239.6Senior management2321.7
Age18–252119.8Nature of enterpriseState-owned business3230.2
26–353835.8Private enterprise4239.6
36–453734.9Foreign, private, and joint ventures3230.2
46 years and over109.4Type of businessLarge corporation3129.2
Educational levelHigh school and below109.4Medium-sized enterprise4340.6
Technical college3230.2Small and microenterprises3230.2
Undergraduate5450.9
Master’s degree or above109.4
Table 2. Scale reliability analysis.
VariantMeasurement ItemSubjectCronbach’s α CoefficientOverall
Cronbach’s α
Management capacityOur company’s carbon footprint managers have enough working experience.30.7580.872
Our company’s managers can detect carbon footprints.
Our company’s managers have sufficient capacity to handle carbon footprints.
Predictive capacityOur company has a well-developed strategy to avoid and contain risky events.40.826
Risk awareness is common in our company.
Our company has a specialised carbon monitoring system.
Our company conducts risk assessments before construction.
Construction capacityOur company utilises low-carbon, energy-saving, and emission reduction technologies in the construction process and actively introduces new construction technologies.40.867
The enterprise strengthens the management of the construction site during the construction process and reduces the waste of materials and resources.
Enterprises use low-energy machinery and equipment with a strong level of operation in the construction process.
Enterprises implement low-carbon behaviour and low-carbon production in the construction process.
Emission capacityEnterprises improve the type and number of plants per unit area of the construction site to increase the construction carbon sink.40.816
Enterprises involved in the construction process provide a strong level of environmental protection and attach great importance to reducing carbon emissions in the construction process.
The total amount of energy consumed by the enterprise in the construction process is high.
The energy intensity of the enterprise in the construction process is high.
Carbon footprint knowledge system resilienceCompanies can observe and recognise not only actual changes and impending crises but also potential future developments.30.768
Companies can move quickly from normal operational mode to crisis response mode in the wake of a carbon crisis.
Companies can redeploy personnel to fill key staffing gaps in the wake of a crisis.
Table 3. Scale validity test.
DimensionSubjectKMO ValueBartlett’s Test of SphericityDegrees of FreedomSignificance
Management capacity30.68282.10730.000
Predictive capacity40.796149.29360.000
Construction capacity40.833190.21760.000
Emission capacity40.800137.10760.000
Carbon footprint knowledge system resilience40.69780.08030.000
Table 4. Calibration anchors for each variable.
VariantLocation
Full Affiliation PointJunctionUnaffiliated Point
Prerequisite variablesManagement capacity53.61641
Predictive capacity53.58251
Construction capacity53.71231
Emission capacity53.52121
Outcome variableCarbon footprint knowledge system resilience53.74211
Table 5. Analysis of necessary conditions.
PrerequisiteConsistencyCatch-All
Management capacity0.7890390.815867
~Management capacity0.5310560.740913
Predictive capacity0.8004760.826743
~Predictive capacity0.5177130.723418
Construction capacity0.8109610.805459
~Construction capacity0.5000790.738620
Emission capacity0.7776010.813663
~Emission capacity0.5339160.733203
Table 6. The configuration path.
123
Management capacity
Predictive capacity
Construction capacity
Emission capacity
Original coverage0.6640190.6203340.591263
Unique coverage0.1301030.08641770.0573472
Consistency0.8701080.8818880.878452
Overall coverage 0.807784
Overall consistency 0.860843
“⚫” Represents presence of core conditions; “●” Represents the presence of edge conditions; “◯” Representing the lack of core conditions; “⨀” Representing the lack of marginal conditions [27].
Table 7. fsQCA configuration interpretations.
Configuration IDCore ConditionsFrequency in SampleManagement Implications
1 Management capability, emission capability28 times, accounting for 23.3% of the total sampleStrengthen managers’ experience in carbon footprint disposal and conduct regular carbon emission management training.
2 Management capability, predictive Capability, construction capability22 times, accounting for 18.3% of the total sampleIntegrate risk early-warning systems with low-carbon construction technologies and establish cross-departmental collaborative management mechanisms.
3 Predictive capability, emission capability (with construction capability as an auxiliary condition)18 times, accounting for 15.0% of the total sampleOptimise construction plans based on risk predictions and prioritise the use of low-carbon building materials.
Table 8. System dynamics summary of capabilities and resilience.
VariablePeak Value (Normalised)Inflection Point (Month)Time-to-Peak (Month)Key Trend Description
Carbon Footprint Knowledge System Resilience 1.8 (Normalised Index)1224Shows steady growth over 24 months, with accelerated growth after the 12th month due to synergistic effects of capabilities.
Management Capability 1.6 (Normalised Index)624Maintains a relatively fast growth trend throughout the period, with no significant slowdown; the inflection point at 6 months marks the start of stable acceleration.
Construction Capability 1.5 (Normalised Index)1224Grows slowly in the first 12 months, then accelerates rapidly after the 12th month, reaching a peak at the end of the period.
Predictive Capability 1.4 (Normalised Index)1215Exhibits slow growth in the first 12 months, followed by rapid improvement, peaking at 15 months and remaining stable thereafter.
Emission Capability −0.8 (Normalised Index, Negative Correlation)1224Shows a slow decreasing trend in the first 12 months, then a rapid decline after the 12th month, with the lowest value (peak reduction) at 24 months.
Note: Peak values are normalised based on simulation results in Figure 3 and scenario analyses. Inflection points indicate the time when growth/decline rates change significantly. Time-to-peak refers to the month when the variable reaches its maximum (or minimum for emission capability, due to negative correlation with resilience). Trends are derived from the 24-month simulation period, which covers typical medium-sized construction project cycles.
Disclaimer/Publisher’s Note: The statements, opinions and data contained in all publications are solely those of the individual author(s) and contributor(s) and not of MDPI and/or the editor(s). MDPI and/or the editor(s) disclaim responsibility for any injury to people or property resulting from any ideas, methods, instructions or products referred to in the content.