Article

Climate-Adaptive Archetypes of Vernacular Villages and Their Application in Public Building Design: A Case Study of a Visitor Center in Chaoshan, China

1
School of Architecture and Urban Planning, Guangzhou University, Guangzhou 510006, China
2
School of Smart City Engineering, Guangzhou Vocational and Technical University of Science and Technology, Guangzhou 510555, China
*
Authors to whom correspondence should be addressed.
Buildings 2025, 15(16), 2848; https://doi.org/10.3390/buildings15162848
Submission received: 29 June 2025 / Revised: 29 July 2025 / Accepted: 7 August 2025 / Published: 12 August 2025

Abstract

The Sixth Assessment Report of the IPCC highlights that global surface temperatures have risen by 1.1 °C above pre-industrial levels, with a marked increase in the frequency and intensity of extreme heat events in hot–humid regions. Buildings in these areas urgently require passive design strategies to enhance climate adaptability. Employing Zhupu Ancient Village in Chaoshan region in China as an example, this study analyzes and evaluates the wind-driven ventilation archetype and buoyancy-driven ventilation archetype of the village through integrated meteorological data analysis (ECMWF) and computational fluid dynamics (CFD) simulations. The results indicate that the traditional climate-adaptive archetype facilitates wind speeds exceeding 0.5 m/s in over 80% of outdoor areas, achieving unobstructed airflow and a discernible stack ventilation effect. Through archetype translation, the visitor center design incorporates open alleyway systems and water-evaporative cooling strategies, demonstrating that over 80% of outdoor areas attain wind speeds of 0.5 m/s during summer, thereby achieving enhanced ventilation performance. The research provides a climate-response-archetype translation-performance validation framework and practical case studies for climate-adaptive design of public buildings in hot–humid regions.

1. Introduction

Global warming is intensifying: average surface temperature has risen by 1.1 °C above the pre-industrial level [1]. This trend poses serious health challenges [2,3,4]; in subtropical South China, heat-stroke exposure risk is increasing markedly [5,6]. Rising temperatures also drive up cooling demand: air conditioning and electric fan use now account for nearly 20% of global electricity consumption, placing heavy pressure on power systems and simultaneously elevating carbon emissions [7]. Improving outdoor microclimates via natural ventilation encourages outdoor activity and lowers indoor cooling loads [8,9,10]. In naturally ventilated environments, occupants can adapt behaviorally and psychologically to attain thermal comfort [11,12]; appropriate increases in air speed alleviate the discomfort caused by high temperature and humidity [13,14]. The spatial configuration of building clusters affects outdoor airflow and, consequently, the thermal comfort of activity areas [15,16].
Research on archetype theory has evolved in multiple dimensions. Alexander et al. [17,18,19] defined archetype theory, while later studies [20,21] developed configuration-based design methods. Li, He, and co-authors [22,23,24] integrated thermodynamic concepts into architectural design, proposing thermodynamic building archetypes that formalize energy as an intrinsic design language. Subsequent work extended archetype theory to urban energy models [25,26,27,28] and system optimization [29,30,31,32,33], demonstrating the theory’s systemic capacity to address complex architectural problems.
Traditional architecture offers climate-tuned, sustainable strategies [34,35,36]. Recent studies adopting Chinese vernacular space as an archetype confirm the contemporary value of such wisdom [37,38,39]. Within the Lingnan tradition, extensive practice has yielded effective hot–humid ventilation forms with high relevance to modern design [40]. Most Lingnan investigations focus on geometry or thermodynamics: Hui [41] quantified the “cool-alley–courtyard” system; Tang [42] derived planning-level climatic design archetypes for humid–hot settlements and verified them through CFD. Chen [43] simulated village, alley, and dwelling scales in Chaoshan settlements, analyzing their influence on airflow organization. Lei et al. [44] modeled solar and ventilation characteristics of streets across three topographies in Lingnan, proposing climate-responsive street-form strategies and parameters for subtropical urban design. These works provide a theoretical foundation for archetype research in Lingnan villages; however, studies on translating Chaoshan archetypes into public building design remain limited. Advancing this field will further integrate vernacular wisdom into contemporary practice.
While existing Lingnan studies lay a solid theoretical foundation, insights from recent CFD investigations in other tropical and hot–humid contexts can further inform the translation of vernacular archetypes into public building design. Recent hot–humid case studies—from heritage buildings [45] to museums [46] and courtyards [47]—underscore the broad applicability of combined wind- and buoyancy-driven strategies and strongly support the feasibility of applying Chaoshan archetypes in contemporary public buildings to enhance thermal environment performance through CFD-assisted design.
Previous CFD studies have evaluated passive ventilation in traditional villages but neither distilled overarching archetypes nor applied them to new designs [48,49]. Unlike typical climate-adaptive measures—such as adding shading devices or internal ventilation shafts to individual structures [50,51]—the proposed “climate responsive archetype translation” framework of this study operates at the cluster scale by extracting two Chaoshan ventilation archetypes, validating them under wind- and buoyancy-driven CFD scenarios, and embedding the results into a modern visitor center design. This approach is demonstrated through Zhupu Ancient Village and its adjacent scenic area visitor center.
The remainder of this article is organized as follows: Section 2 introduces the study area and case overview; Section 3 details the framework for prototype extraction and model simplification; Section 4 presents the boundary conditions and meshing scheme for both wind pressure- and buoyancy-driven CFD simulations; Section 5 reports the prototype performance analysis and its translation to the visitor center; Section 6 discusses research limitations; and Section 7 concludes the main findings.

2. Description of Study Area

2.1. Regional Context

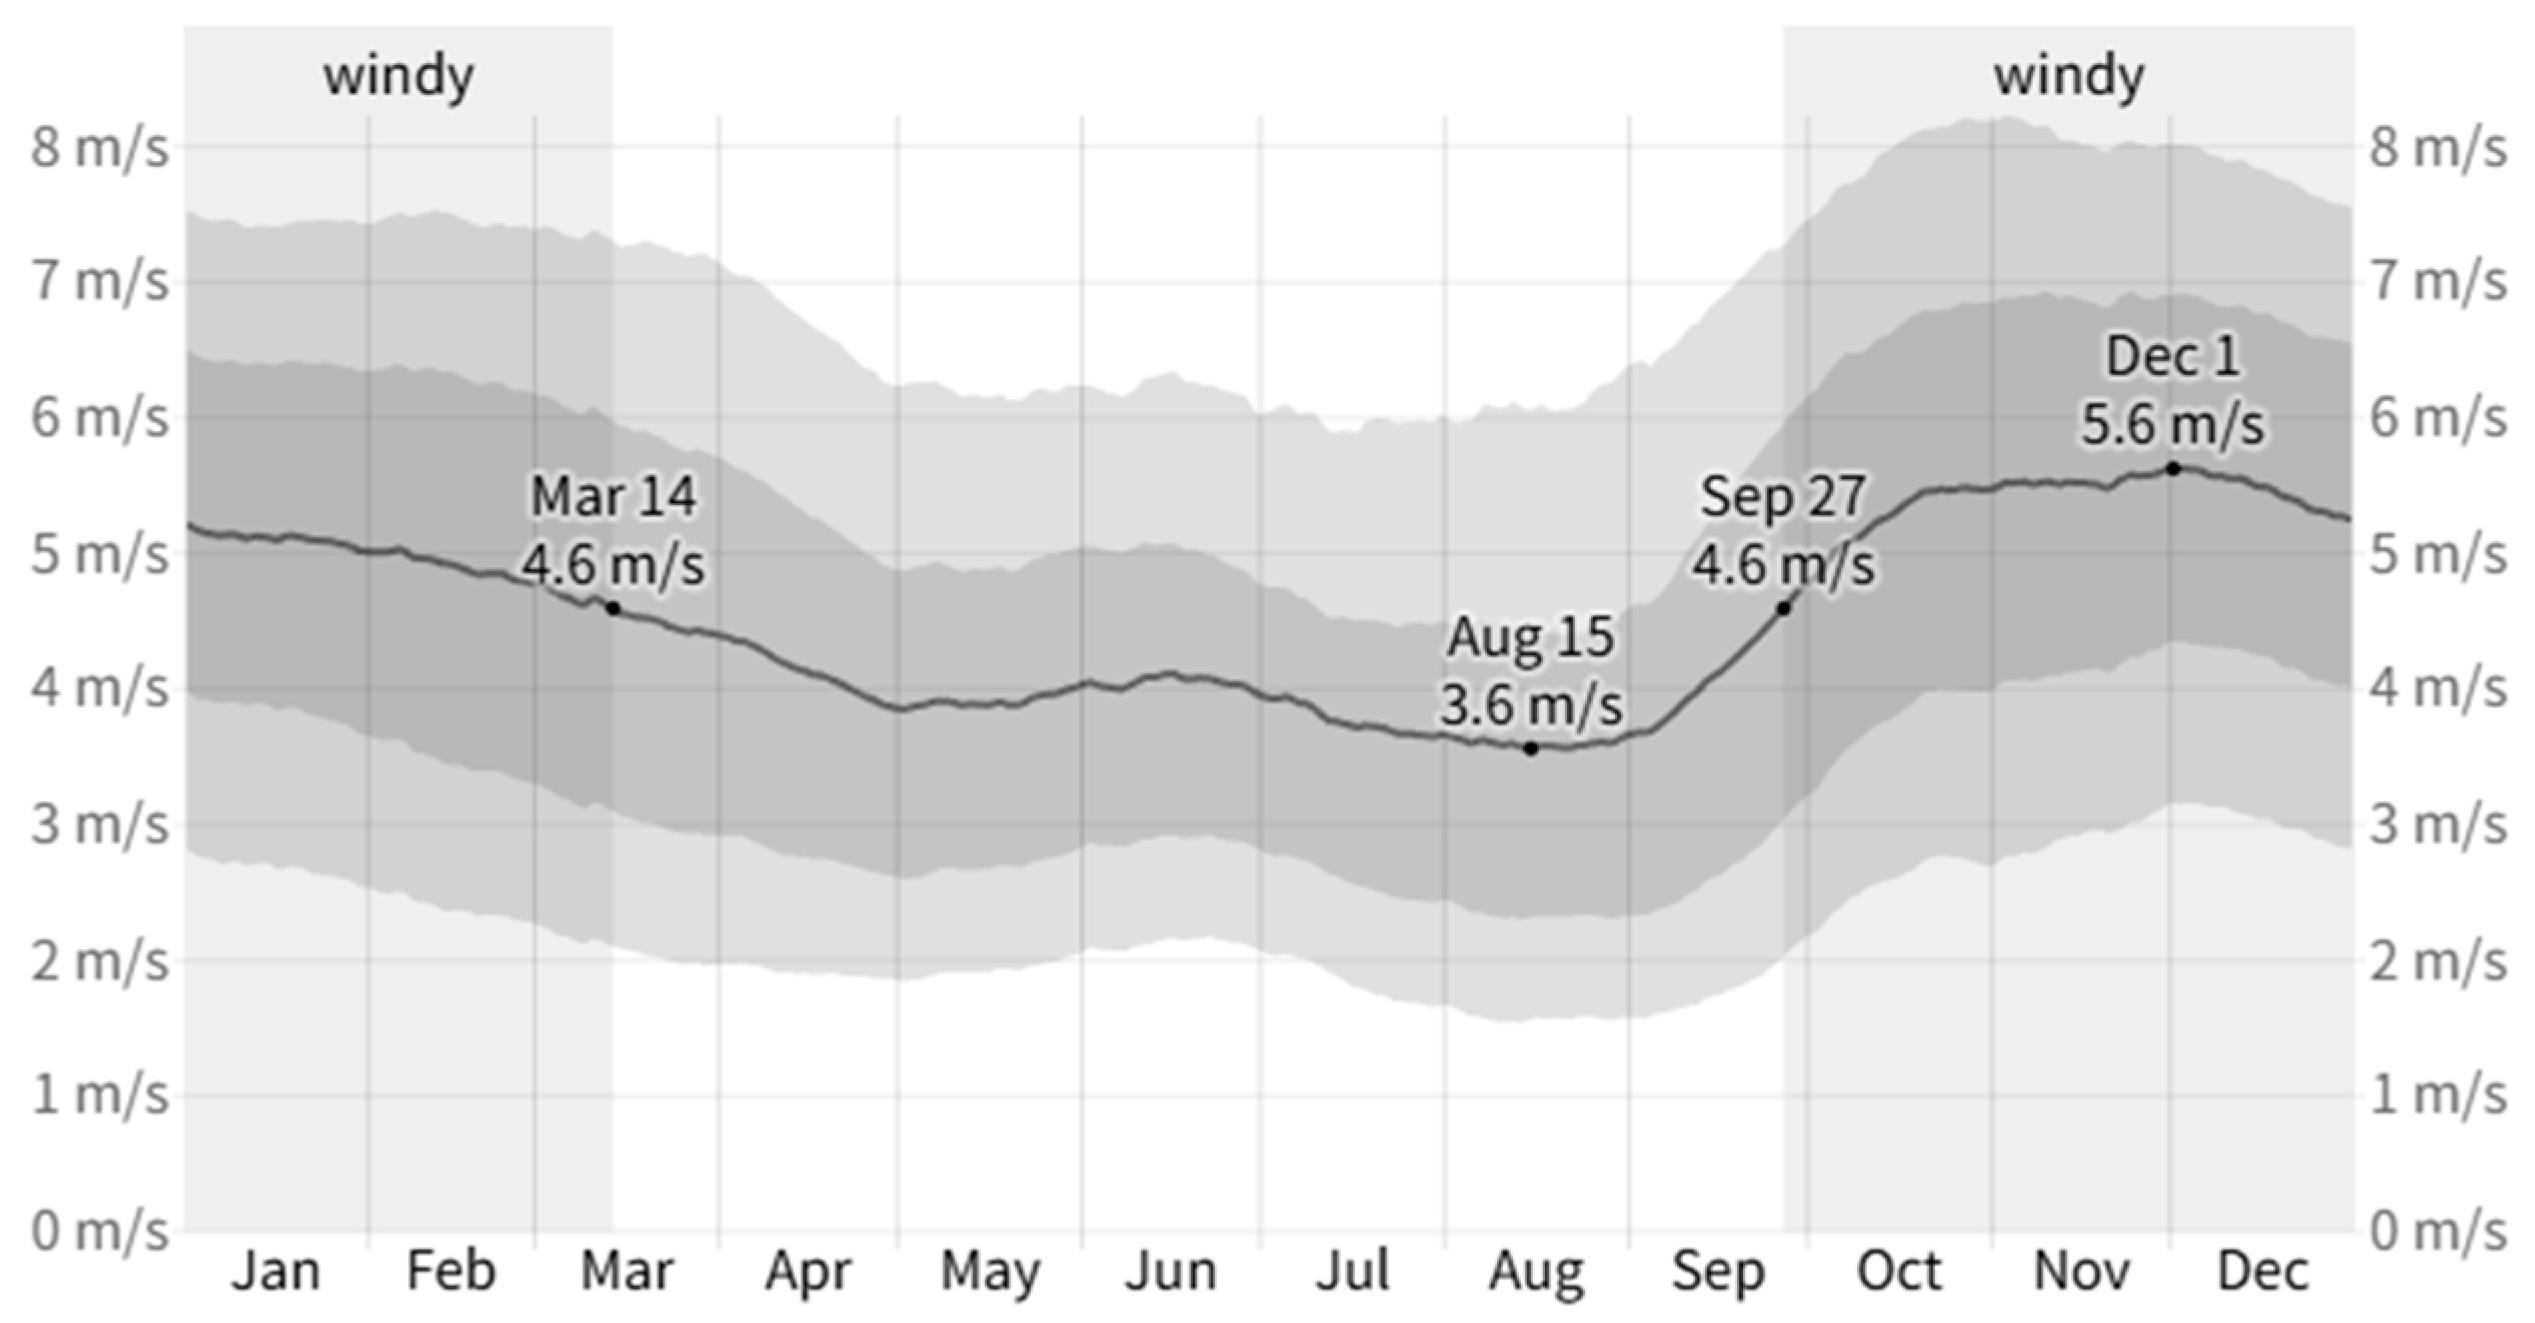
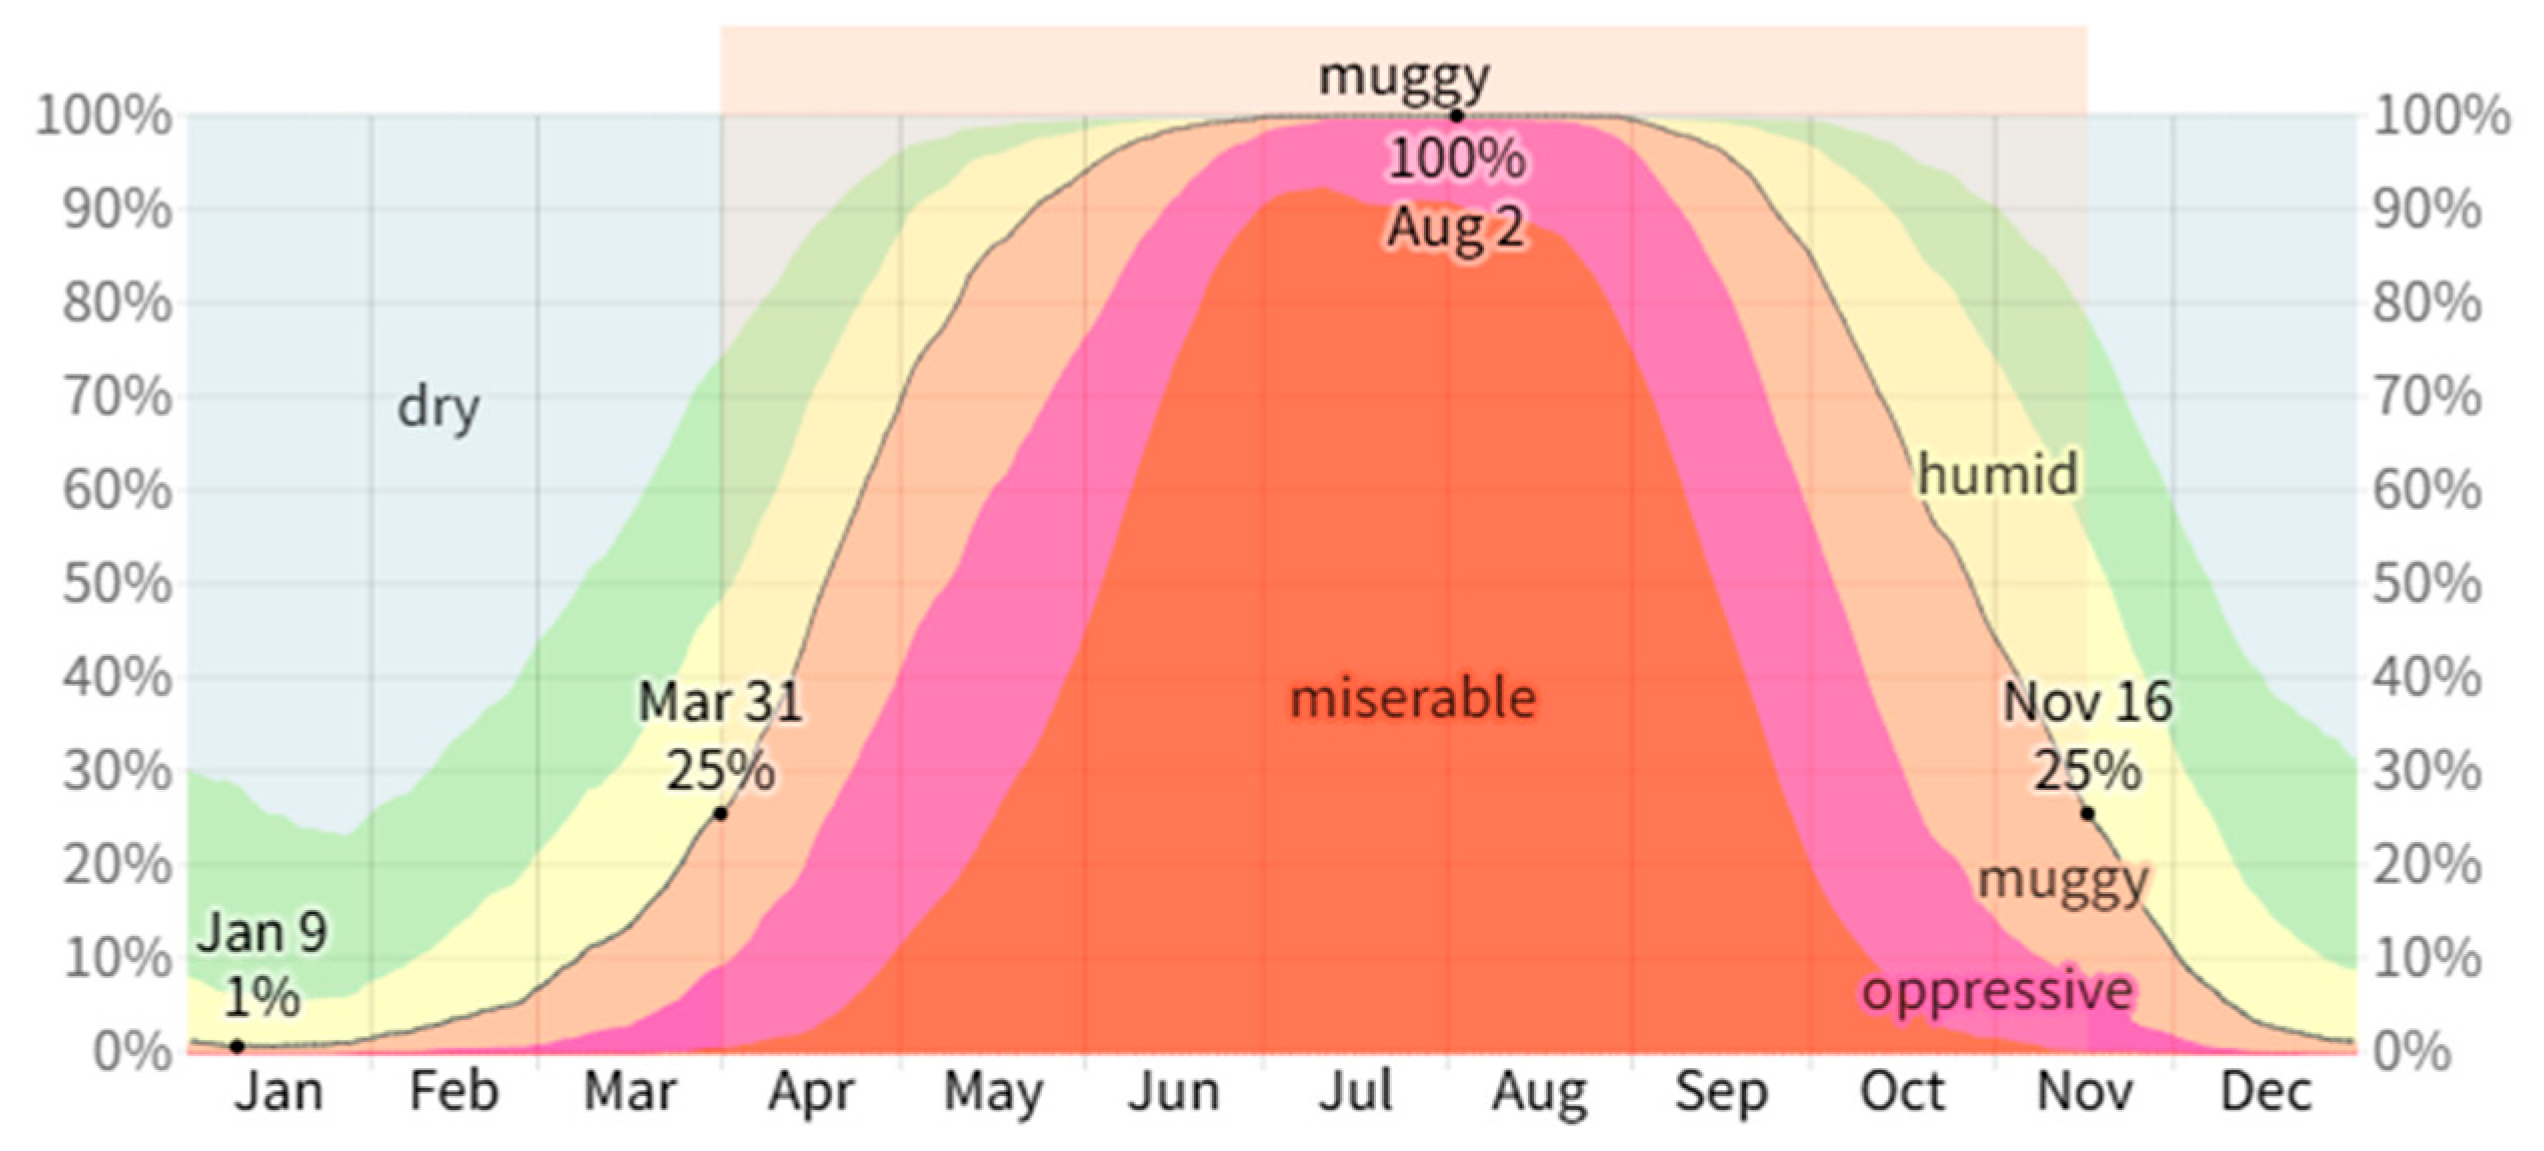
The case site is located in Shantou, Guangdong Province, within the Lingnan region of China. The city has a typical subtropical climate and, according to the Chinese standard “Thermal Design Code for Civil Buildings” (GB 50176-2016) [52], falls into the “hot-summer, warm-winter” zone. Northeasterly winds prevail in winter, whereas south-westerlies dominate in summer, as illustrated in Figure 1. Winter is generally windier, with mean velocities of 4.6–5.6 m/s; by contrast, the transitional seasons and summer exhibit lower wind speeds, averaging 3.6–4.6 m/s (Figure 2). The summer period is hot and humid, while winters are comparatively dry and comfortable (Figure 3).
As shown in Table 1, the hot season lasts approximately four months, from June to September, during which the mean daily maximum temperature exceeds 29 °C. July is the warmest month, with an average high of 31 °C and an average low of 26 °C. By contrast, the cooler period extends for about three months, from December to March, when mean daily maxima remain below 20 °C. January is the coldest month, with an average low of 11 °C and an average high of 17 °C.

2.2. Overview of Zhupu Ancient Village

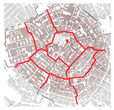
Zhupu Ancient Village, formerly known as Shapu Du (founded in AD 1078), is centrally located on Dahao Island in Shantou, Guangdong Province. Surrounded by hills, waterways, and farmland—with Jufeng Mountain to the north and Haojiang Channel to the south—the village features a radial street network centered on the octagonal bagua-patterned Dingqi Stone. Feng-shui ponds integrated with local water systems line the village perimeter (Figure 4).

3. Methodology

3.1. Archetype Generalization

This study extracts natural ventilation prototypes from traditional Chaoshan villages through typological analysis, field surveys, and spatial diagramming. Key architectural elements—such as narrow alleys, patios, and courtyard layouts—were identified for their passive ventilation performance. By comparing morphological patterns across case studies, recurring spatial strategies were generalized into archetypes. The generalization of the archetype formed a foundation for climate-adaptive design application.
Accordingly, the natural ventilation of Zhupu Ancient Village is categorized into wind-driven and buoyancy-driven forms. The study further examines how spatial geometry, building and waterbody layouts, and other morphological factors influence airflow at the streetscape-level scale.

3.2. Simplified Models

This study focuses on analyzing simulation data derived from simplified spatial models. Following the extraction of ventilation-related spatial prototypes from the ancient village, representative geometric forms were abstracted to reduce the need for simulating a large number of individual spatial segments. The simplified models correspond to real architectural elements, as shown in comparative diagrams with site photographs (Figure 5).
Simplified models retained essential spatial features, including block layouts, architectural dimensions, open spaces, and waterbody placement, while removing unnecessary complexity. Based on field investigation, representative zones were selected: the southwestern and northeastern residential sectors, the western water-adjacent area, and the newly planned visitor center. These areas served as the basis for archetype derivation and model simplification.
The models were constructed using architectural software including AutoCAD (v2020), SketchUp (v2021), and PHOENICS (v2018), which allow for precise geometry control and variable manipulation. These tools ensured the reliability of simulation results, enabling the study to examine the impact of spatial form on outdoor natural ventilation mechanisms in the context of the ancient village.

3.3. Simulation–Comparison Analysis

To assess the influence of spatial configurations on natural ventilation in the ancient village, this study adopts a three-step framework: modeling, simulation, and comparative analysis. Based on the extracted spatial archetypes, simplified models were constructed and imported into PHOENICS, a CFD simulation tool. Simulation settings were defined according to typical summer wind conditions, with boundary conditions calibrated to reflect real environmental scenarios.
Although statistical downscaling of meteorological data can enhance microclimate accuracy in CFD simulations [53], this study adopts raw ECMWF data without downscaling, as is common in many design-oriented CFD analyses and studies of building-form impacts on natural ventilation [54,55]. The objective here is to identify airflow patterns and prototype performance rather than absolute microclimate prediction. For future studies, incorporating localized field measurements and downscaling techniques will help refine boundary conditions and improve the precision of archetype-based design evaluations.
PHOENICS has been widely applied in recent ventilation studies, demonstrating its applicability and reliability in architectural airflow simulation [56,57]. Its precise geometric control and parameter flexibility enable accurate representation of airflow paths and velocity distribution at the street scale.
Key outputs, including wind speed and pressure, were extracted and visualized to compare ventilation performance across different spatial layouts. This analysis not only verifies the validity of the archetypes but also provides quantitative insights for climate-responsive design in traditional village environments.

4. Configurations for Simulations

4.1. Configuration for Wind Pressure Simulation

To investigate the characteristics of wind-driven natural ventilation in spatial archetypes of the ancient village, this study employs steady-state CFD simulations using the FLAIR module of PHOENICS with the Enhanced Flow Solver (EFS). Meteorological boundary conditions are based on Typical Meteorological Year (TMY) data provided by ECMWF.
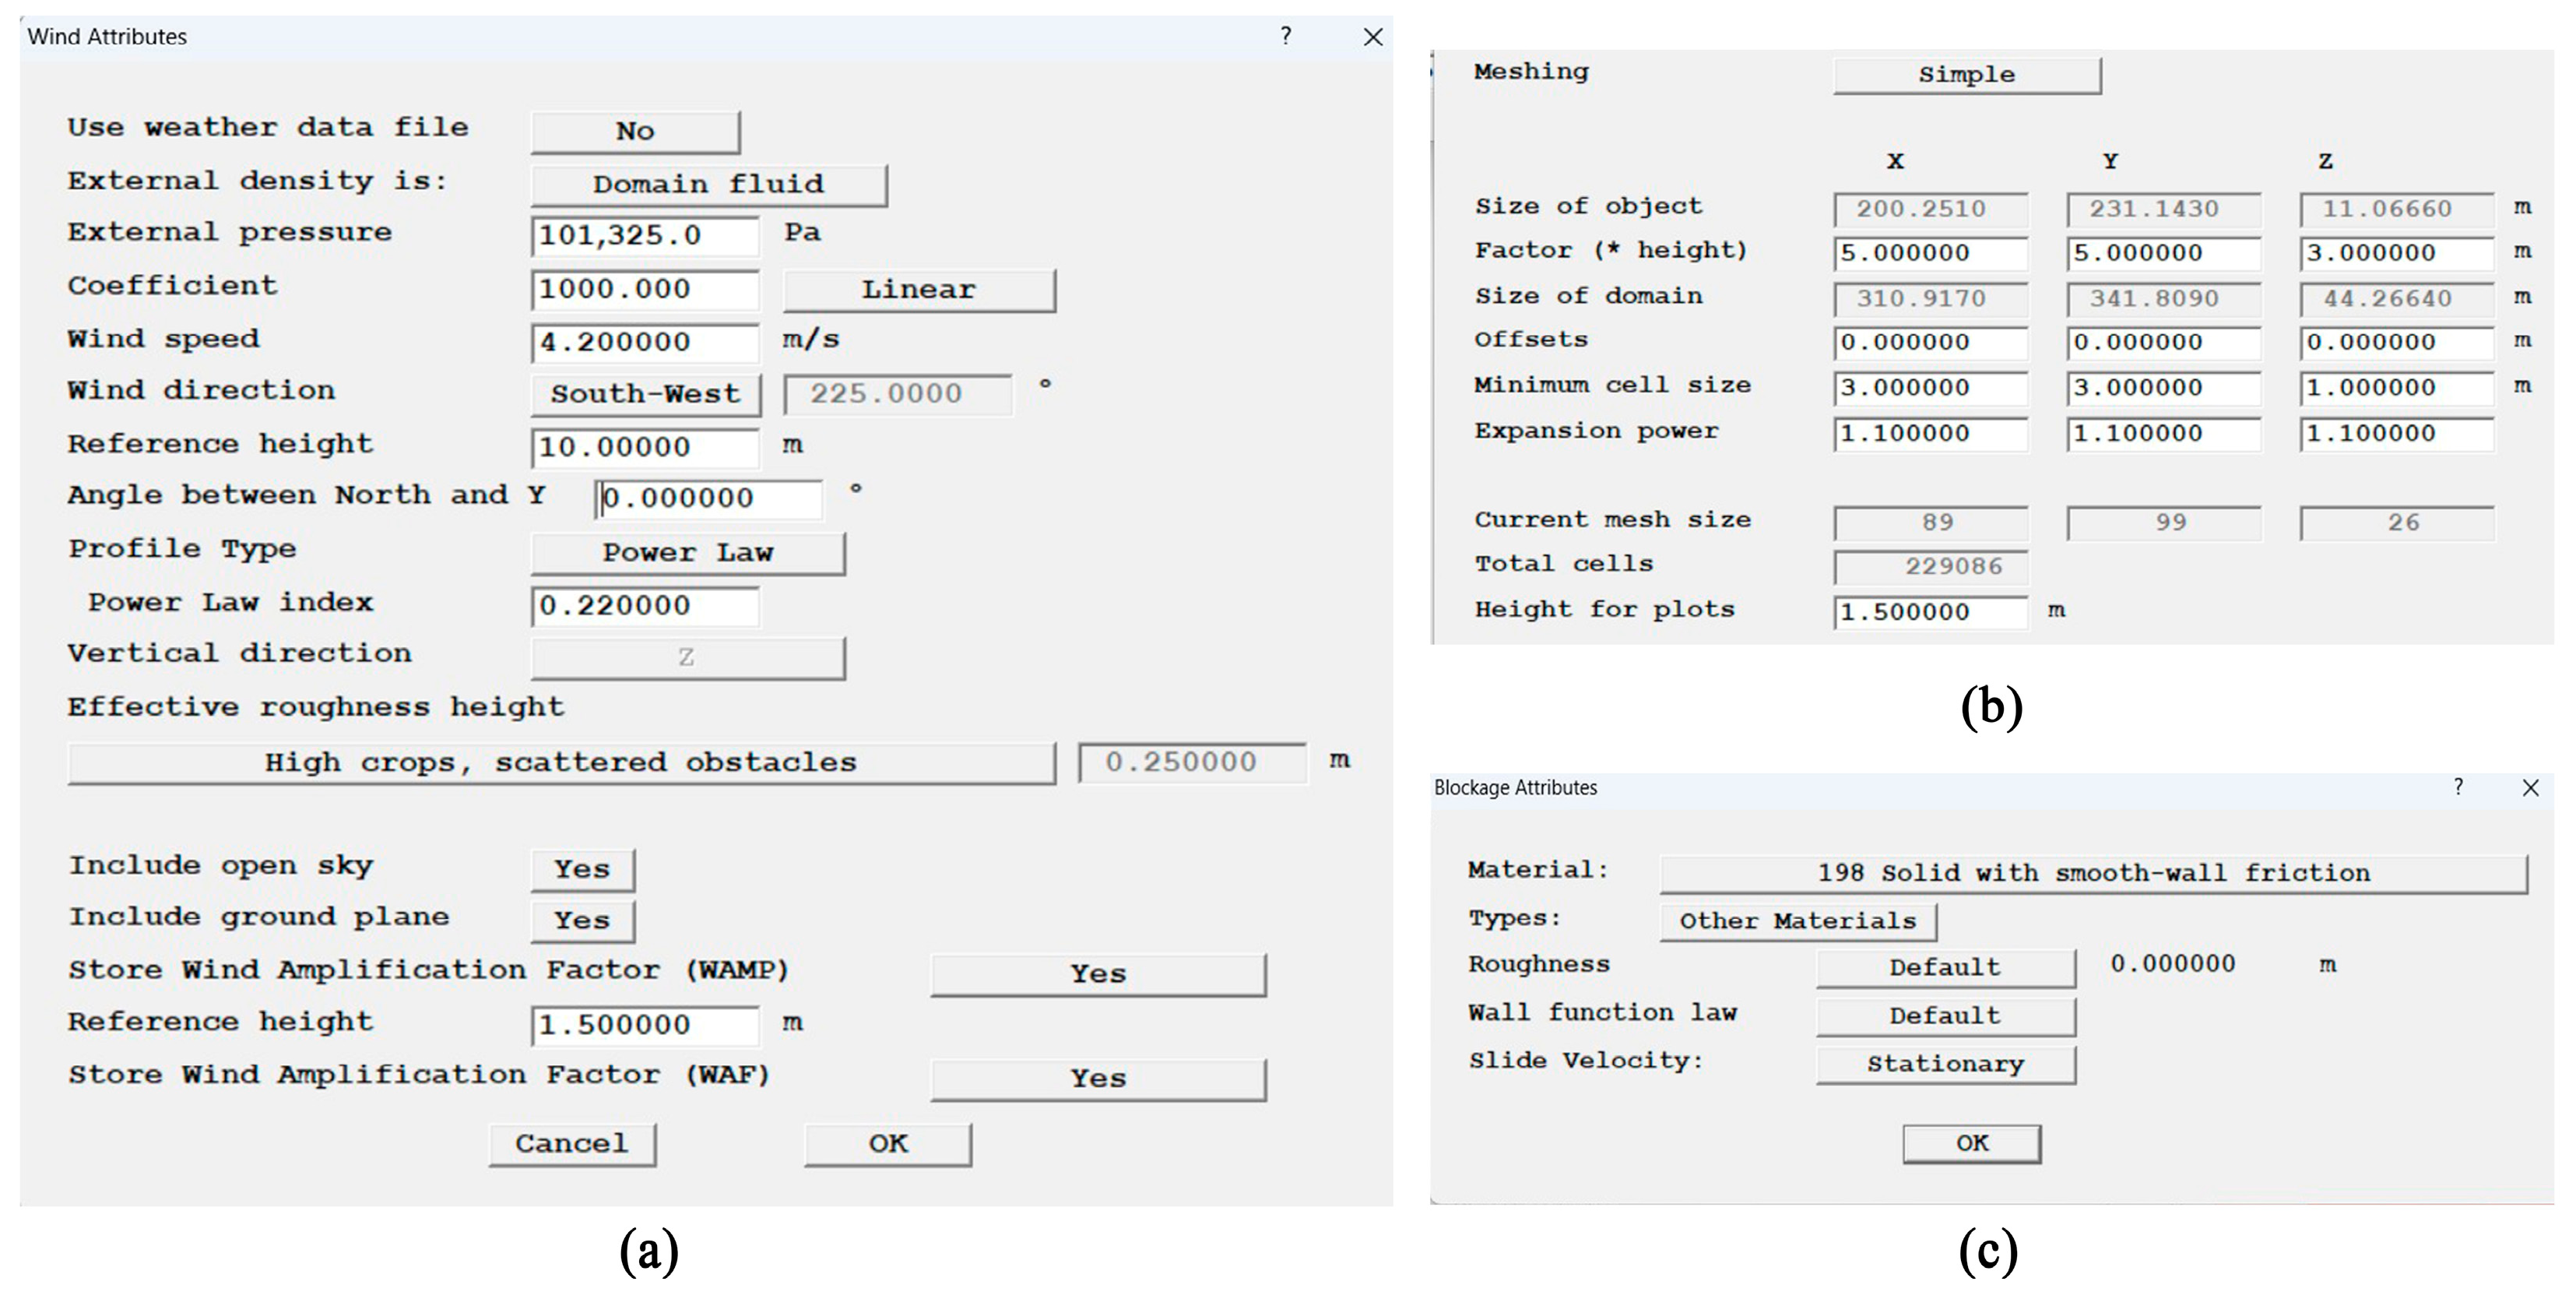
The simulation domain is configured with an observation height of 1.5 m above ground level and extends 5 m beyond the building boundaries horizontally and 3 m vertically. The computational mesh is structured, with a resolution of 3 m in both X and Y directions, and 1 m in the Z direction, balancing computational efficiency and accuracy.
The simulation uses the standard k–ε turbulence model and a structured hexahedral mesh with a geometric expansion ratio of 1.1, featuring local refinement at building facades and the ground. Inlet boundary conditions—wind speed and direction—are prescribed according to typical climate data for March, June, July, and September (Table 2), with a vertical power-law exponent α = 0.22. The outlet is defined as a pressure-outlet at zero-gauge pressure. The ground employs a rough-wall function with a roughness length z0 = 0.25 m. Other detailed settings are provided in Figure 6.
Four representative months—March, June, July, and September—were selected for simulation. March marks the onset of rising temperatures; June and July represent peak summer heat; while September, though slightly cooler, retains high humidity and thermal discomfort. These months also reflect the dominant wind directions in the region: ENE, SW, SSW, and NE, respectively.
Regarding spatial selection, two typical sectors—the southwest and northeast areas of the village—were chosen based on their alignment with prevailing wind directions, which is reflected in the orientation of buildings and alleyways. These sectors represent typical wind-adaptive spatial configurations. Additionally, a nearby area composed of recently built self-constructed houses was modeled as a comparative case to analyze differences in ventilation performance between traditional and contemporary spatial forms.
To identify wind-shadow zones, a threshold wind speed of 0.5 m/s was adopted. According to Song’s study in Shanghai [58], wind speeds below 0.25 m/s are barely perceptible to humans, while speeds between 0.25 and 0.5 m/s are considered pleasantly light. In Hong Kong, which is geographically close to Shantou and located at a lower latitude, comfortable wind speed during summer ranges from 0.6 to 1.3 m/s [59]. Osczevski’s research [60] suggests that wind speeds below 0.5 m/s have minimal cooling effects on human skin. Based on ASHRAE 55 (2020) and ISO 7730 (2005), for a summer clothing insulation of 0.5 clo under typical humidity conditions, the PMV ± 0.5 comfort zone spans approximately 24 °C to 29 °C at an air speed of 0.5 m/s, extending up to nearly 32 °C at 1.0 m/s [61,62].
Accordingly, we adopt an air speed threshold of 0.5 m/s in our simulations to maintain thermal comfort (–0.5 ≤ PMV ≤ +0.5) within expected outdoor temperature ranges. Areas below this threshold are displayed in white on wind velocity maps to support the identification of potential wind-shadow zones for design analysis.

4.2. Configuration for Buoyancy-Driven Simulation

To isolate buoyancy effects, inlet wind speed was set to 0 m/s, while all other settings matched the wind-driven cases: a standard k–ε turbulence model, a structured hexahedral mesh with expansion ratio 1.1, and local refinement at facades and ground. Air was treated as an ideal gas (p = 1 atm, T0 = 273 K). At the domain top, an “OPENING” patch imposed zero-gauge pressure, with turbulence intensity identical to the inlet. The ground used a smooth-wall function with roughness length z0 = 0.25 m.
Twenty PLATE elements were arranged on model surfaces corresponding to water, sun-exposed, and shaded areas per the solar-shading diagrams. Due to the lack of local field measurements, plate temperatures were selected based on other studies: sun-exposed conventional tiled roof plates were set to 60 °C, reflecting the 55–65 °C range reported by the U.S. DOE Energy Saver “Cool Roof” program [63] and measurements on Italian tiled roofs [64]. Plates adjacent to water surfaces were set to 22 °C and those in shaded areas to 26 °C, in line with Liao et al.’s observations of small open waterbodies [65] and Zhang’s observations of outdoor shaded spaces [66]. Mesh settings remained identical to the wind-driven simulations. Plate locations were determined via SketchUp 3D shadow simulations—a more precise placement method will be detailed in the Discussion Section. Other detailed settings are provided in Figure 7.
Given that buoyancy-driven ventilation is generally secondary to wind-driven flow in outdoor street environments, this simulation did not define wind-shadow zones. Instead, it aimed to reveal the mechanism and potential contribution of thermal pressure to airflow formation within the simplified spatial configurations.

5. Analysis of Natural Ventilation Archetypes

5.1. Wind-Driven Archetype Analysis

The spatial characteristics of Zhupu Ancient Village reflect long-term adaptation to the hot–humid climate of the Lingnan region. Field investigation shows that many outdoor spatial configurations contribute to wind-driven ventilation. This study identifies two typical strategies: (1) constructing interconnected alleyway systems, and (2) orienting building clusters along prevailing wind directions. Spatial archetypes can be derived from these strategies and further evaluated through CFD simulations.

5.1.1. Connected Alleyway Archetype

Zhupu Ancient Village features a hierarchically organized alleyway system composed of outer ring roads, primary radial alleys, narrow alleys, and fire lanes (a lane that serves as an isolation and fire prevention measure between houses). Together, these pathways form an integrated ventilation network consisting of inlets, main airflow corridors, and cooling alleys (shaded, narrow alleys with thermal buffering potential). Their spatial dimensions and characteristics are summarized in Table 3.
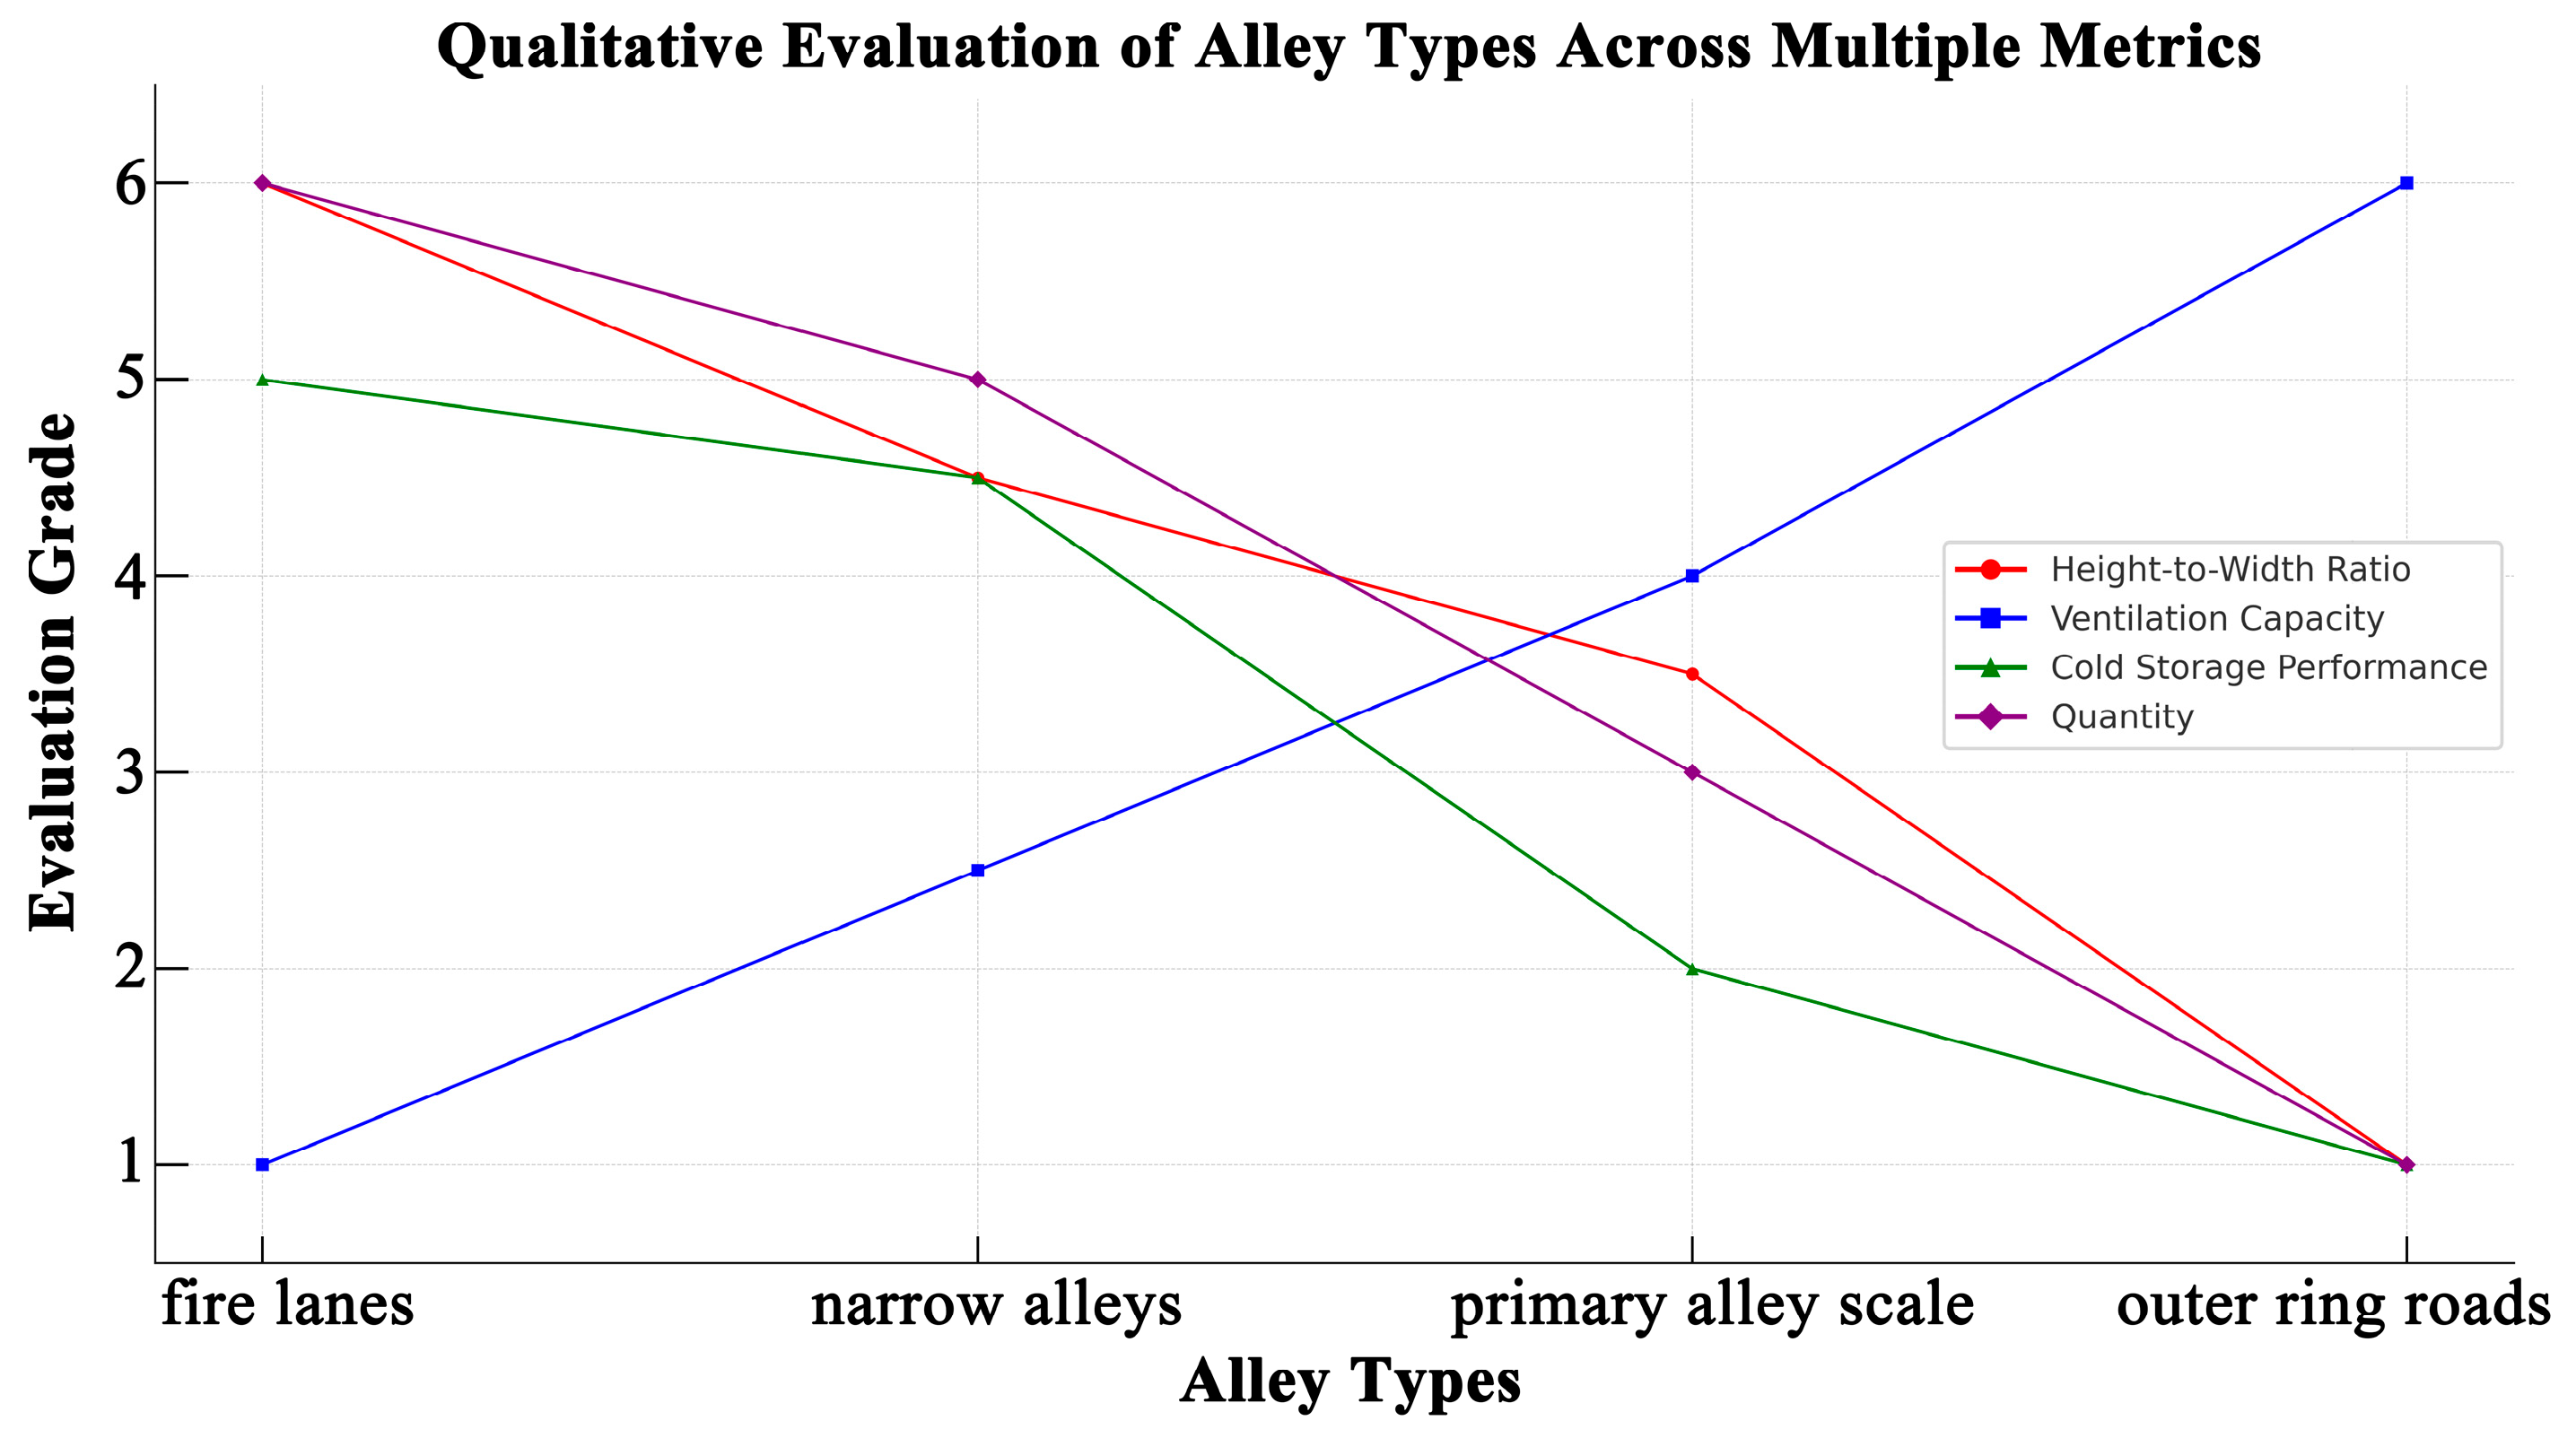
Fire lanes, typically less than 1.5 m wide with height-to-width ratios above 3, are common but not well-connected. While they provide strong shading and thermal mass for cooling, their airflow capacity is limited. Narrow alleys, wider at 1.5 m–2.4 m wide, balance ventilation and circulation, while contributing to microclimate moderation. Primary alleys, wider at 2.4 m–3.0 m with moderate enclosure (H/W ratio 1–2), radiate outward from the village center, linking inner cores to the outer ring roads. These roads, usually over 3.0 m wide and with lower enclosure (H/W ≈ 1), serve both vehicular access and wind collection.
A qualitative evaluation chart (Figure 8) presents the relative performance of four alley types—fire lanes, narrow alleys, primary alleys, and outer ring roads—across four dimensions: height-to-width ratio, ventilation capacity, cooling capacity, and quantity. The X-axis denotes alley types, while the Y-axis applies a six-point ordinal scale. The ratings are based on on-site field observations conducted by the author to assess each alley type’s spatial and climatic characteristics.
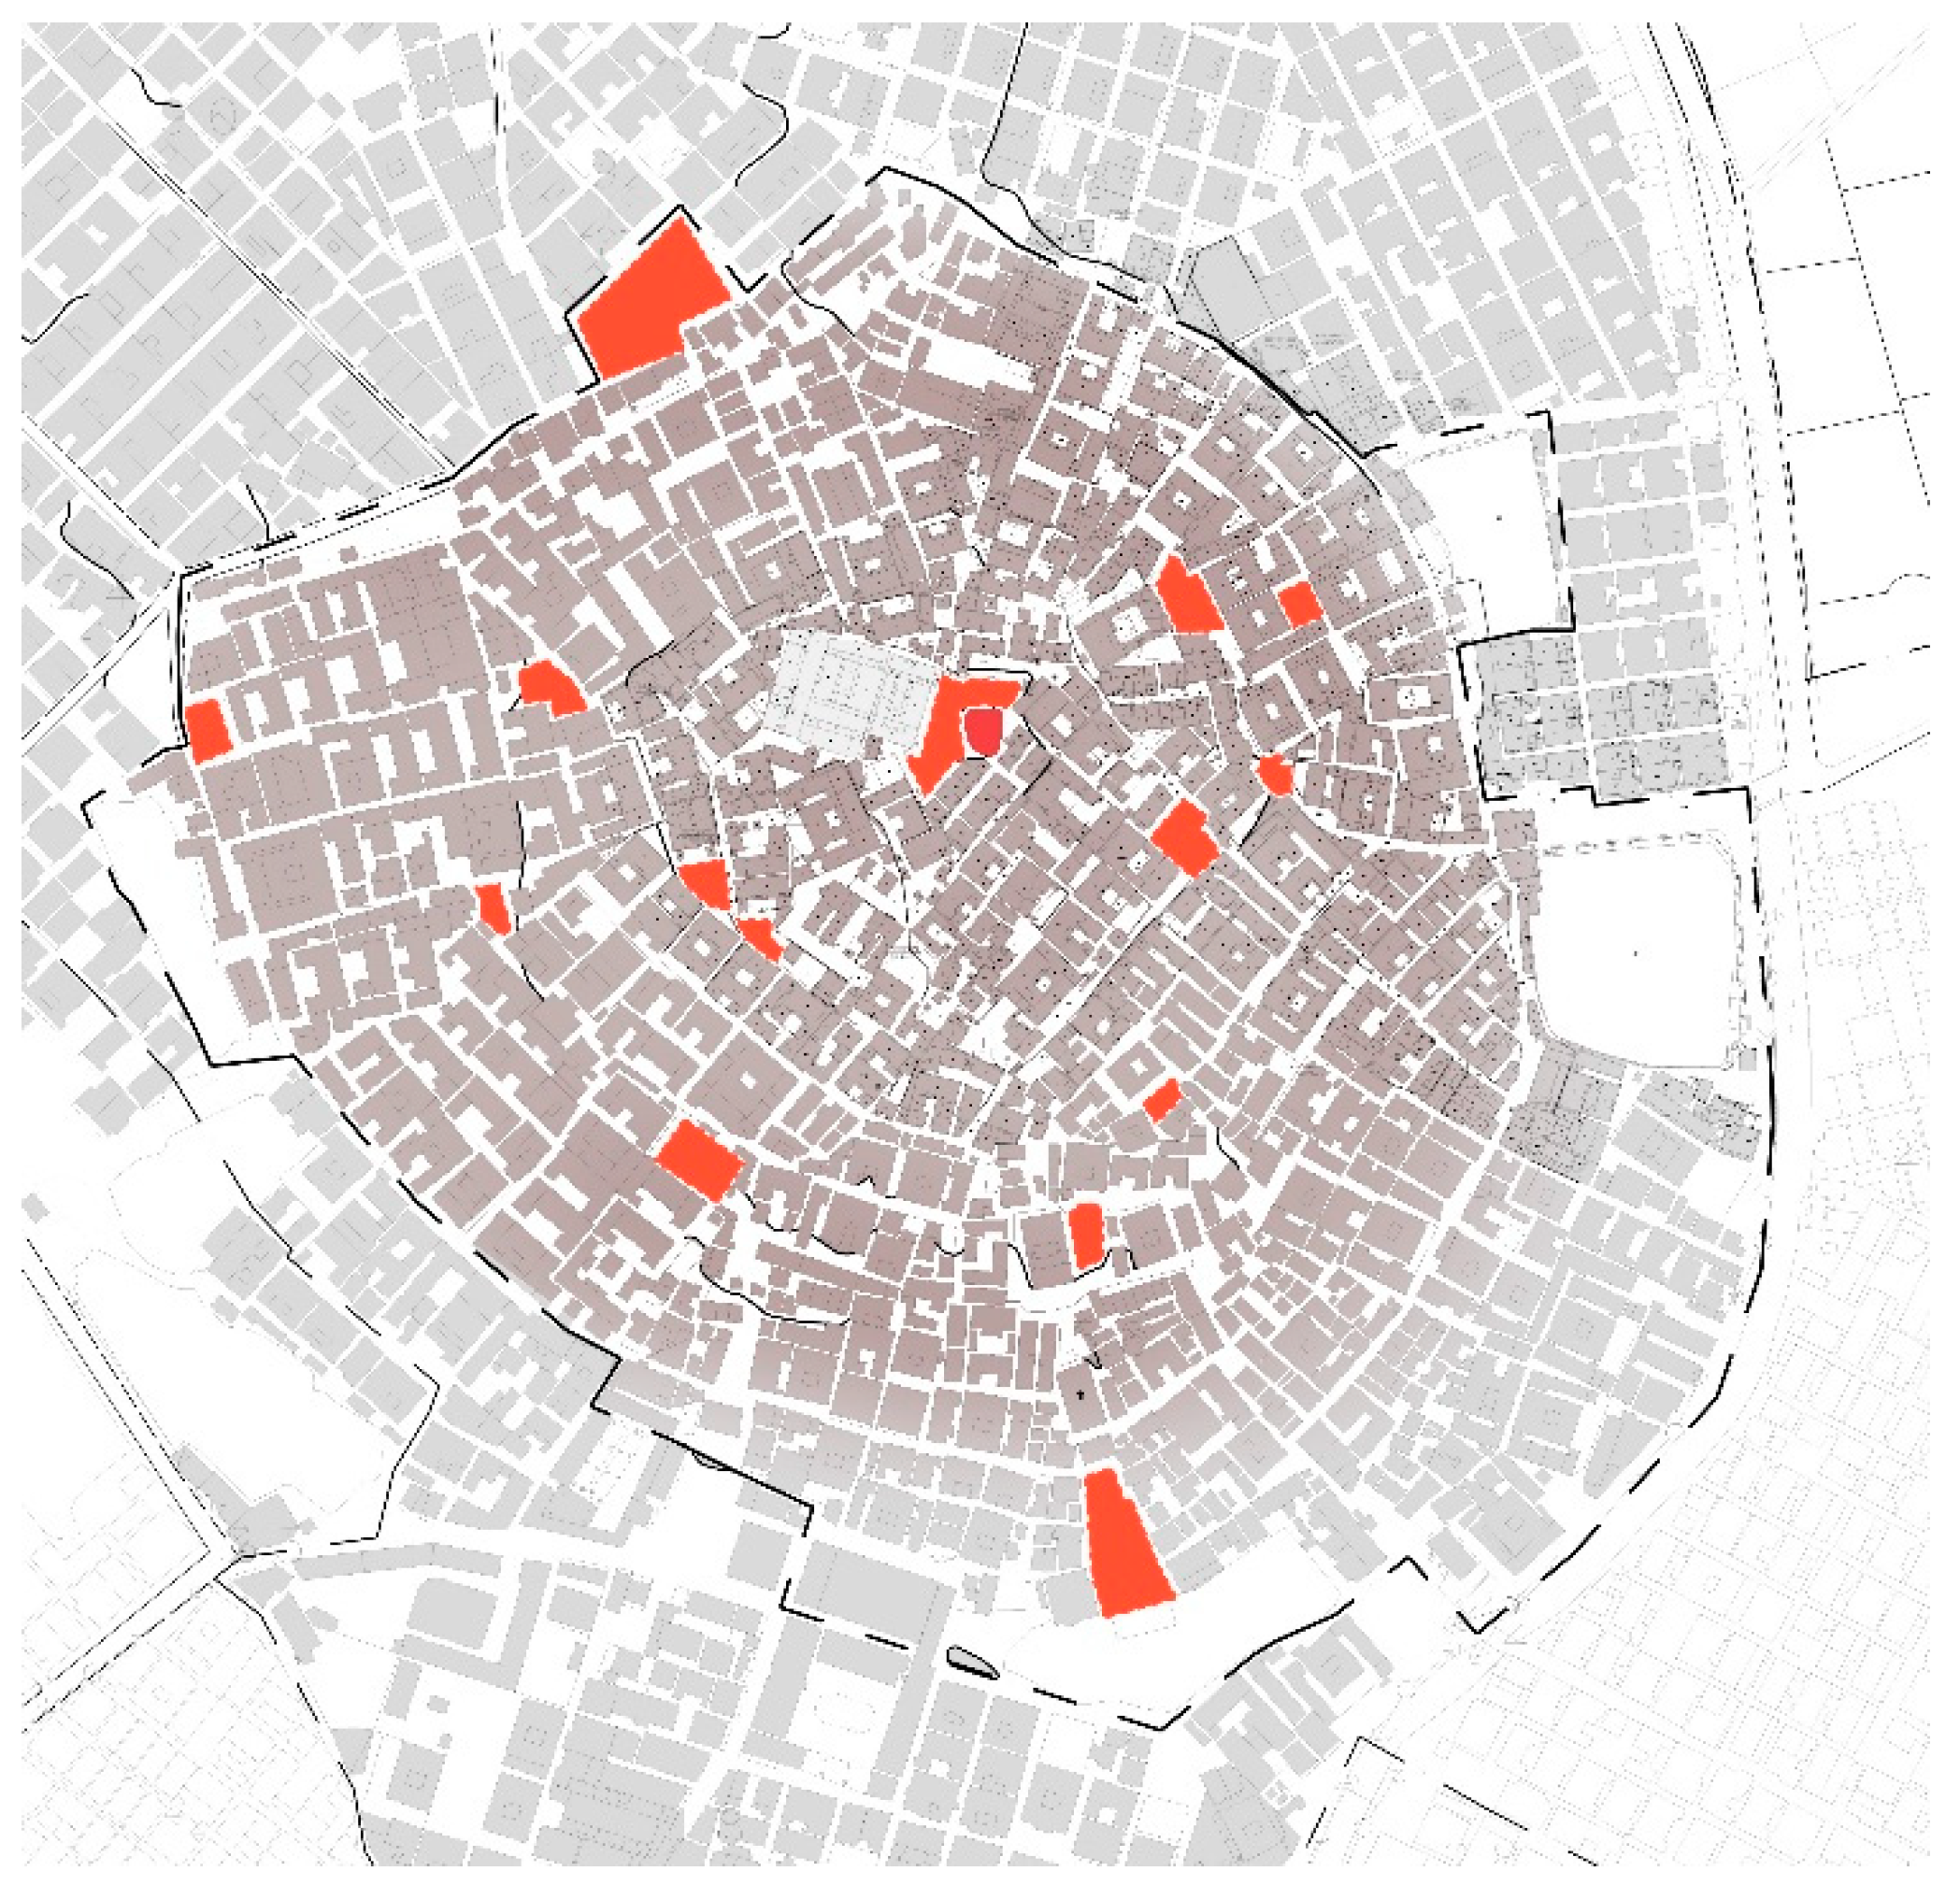
The interaction between open peripheral spaces and the bagua-like settlement pattern enhances wind entry by forming expanded openings. Once natural wind enters the alley network, it is guided through main corridors, passes through cooling alleys, and is redistributed to branch pathways. The effectiveness of a cooling alley depends on its geometry; when the length-to-width ratio exceeds 10:1, internal airflow becomes obstructed [67]. Open nodal spaces, such as zhuocheng (small open platforms), help regulate spatial proportions and redirect airflow from main corridors into side branches. These zhuocheng platforms are located in the village as shown in Figure 9.

5.1.2. Wind-Oriented Settlement Archetype

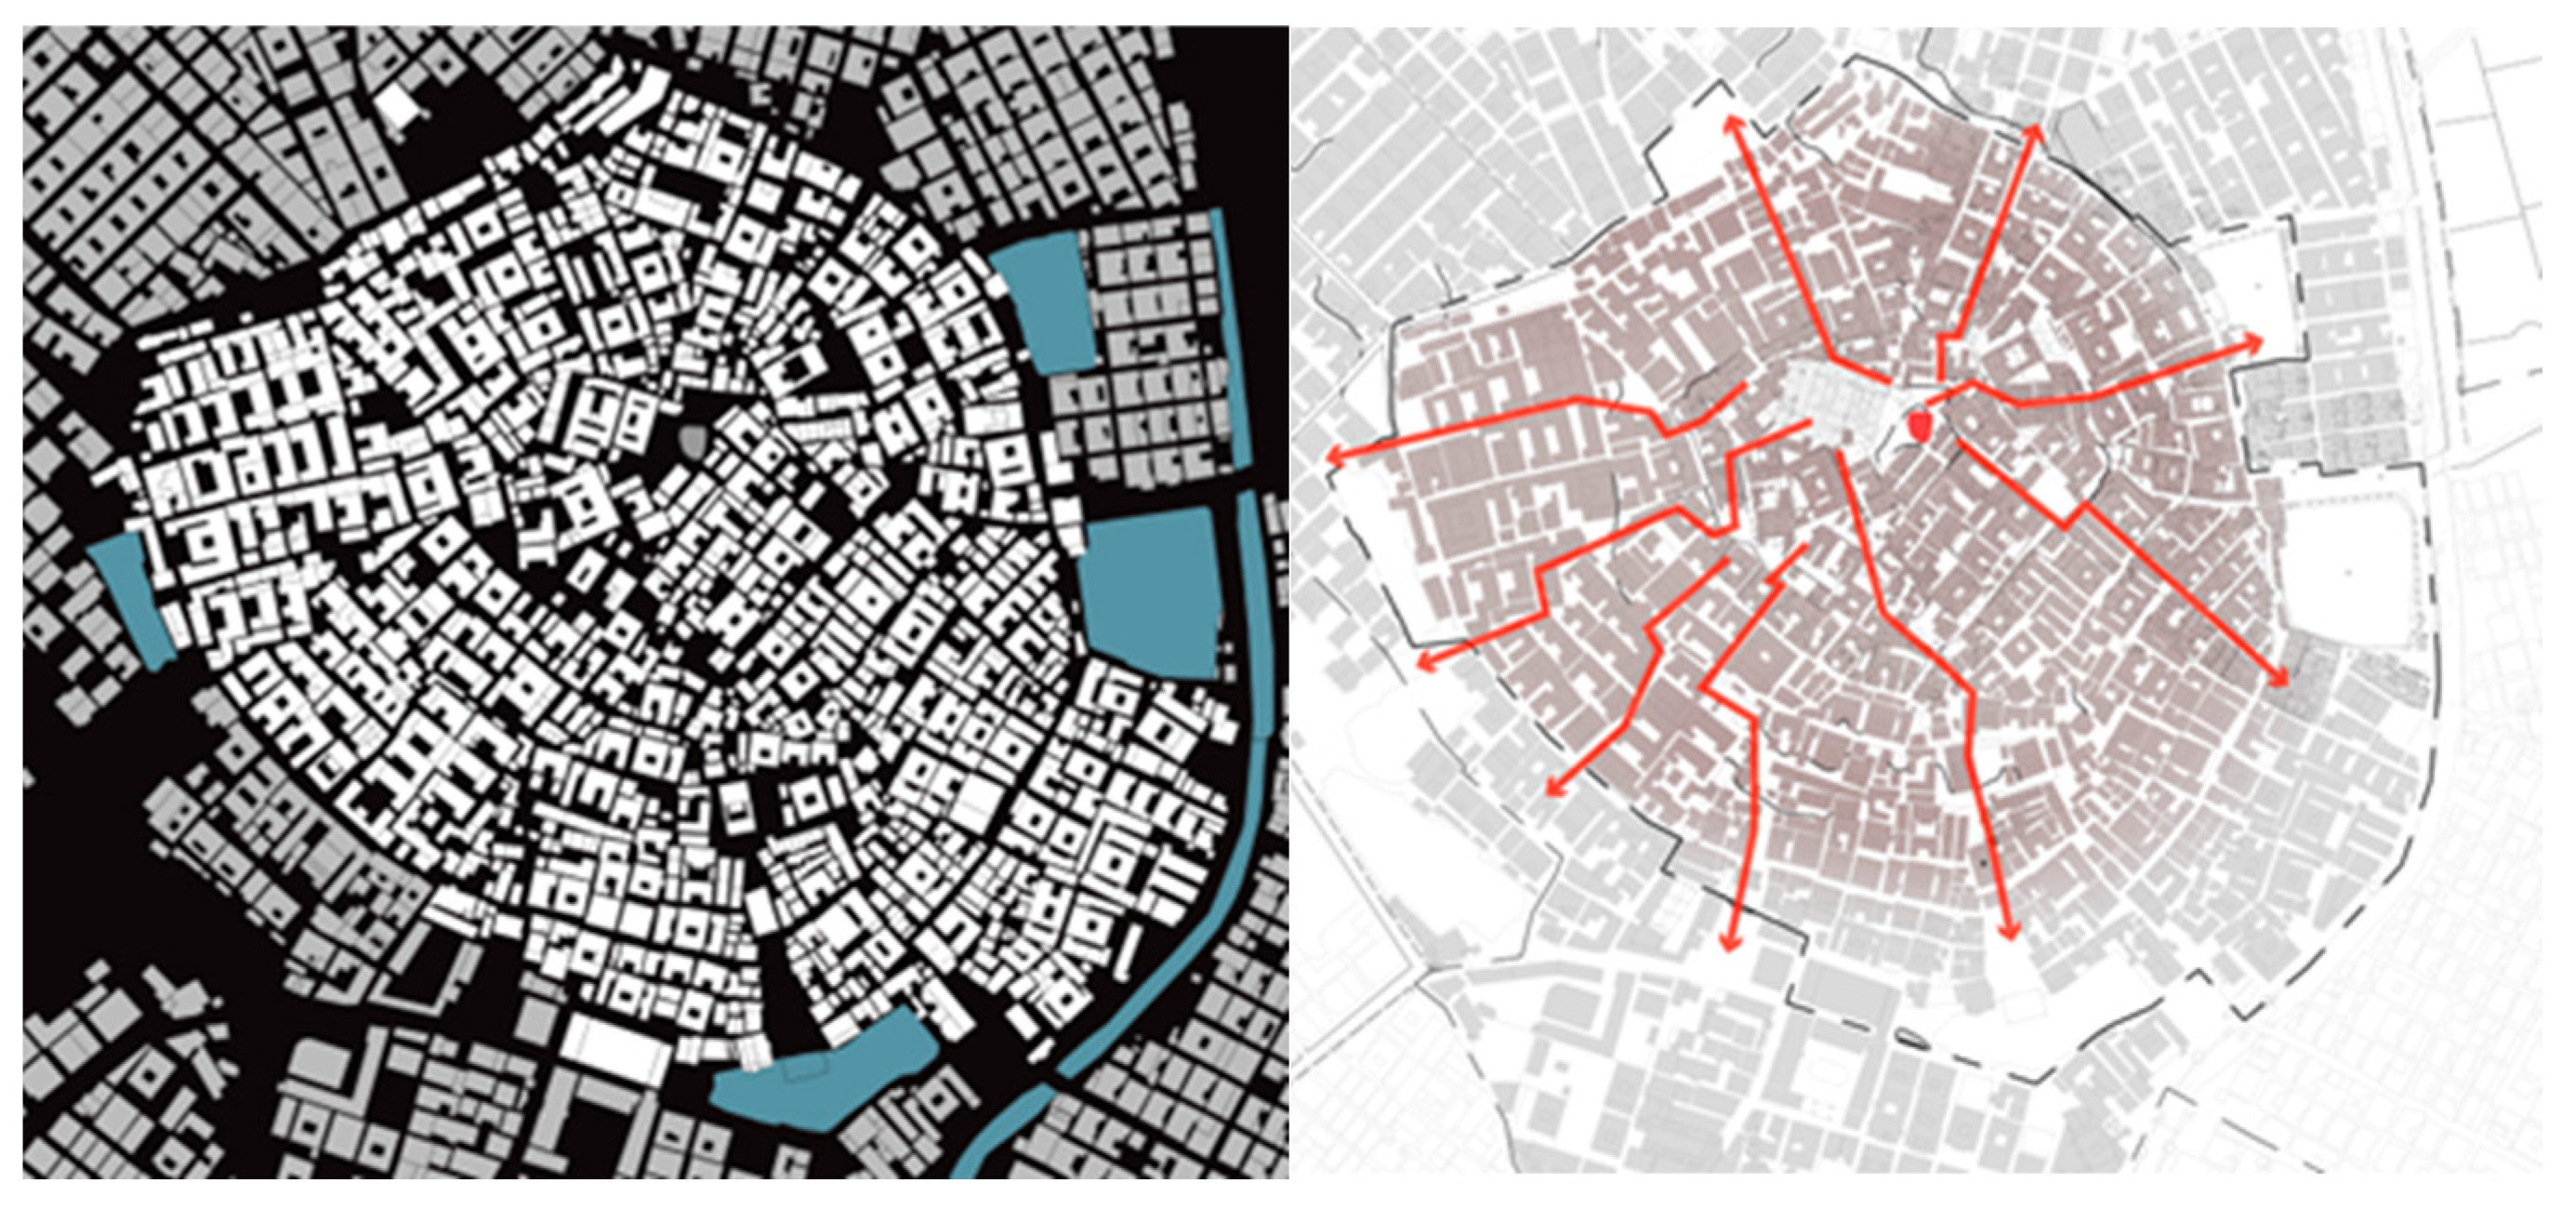
The overall spatial structure of Zhupu Ancient Village follows a radial layout centered on a large natural boulder. As a result, most alleyways deviate from the strict north–south axis and form oblique angles (Figure 10a). This configuration aligns more closely with the seasonal prevailing winds from the east–northeast and south–southwest between March and September, thereby facilitating wind penetration into the village from multiple directions. The fragmented orientation of streets and buildings increases the number of wind entry points and helps redirect airflow through the inner core.
Additionally, the village features several ponds located in different sectors, and nearby buildings are typically oriented toward these waterbodies. During daytime, solar radiation creates temperature differentials between the water surface and adjacent land, generating localized breezes. These breezes can be captured by the facade orientations and channeled through adjacent alleys, contributing to microclimate cooling in nearby zones (Figure 10b).
Together, the alignment of settlement orientation with dominant wind paths, along with pond-facing building clusters, forms a passive ventilation strategy that enhances airflow access and temperature regulation across the village.

5.1.3. Wind-Driven Archetype Simulation and Performance Evaluation

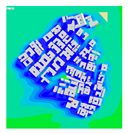
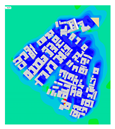
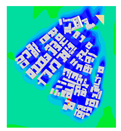
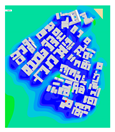
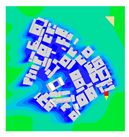
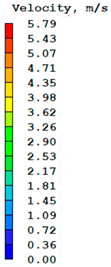
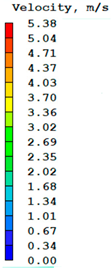
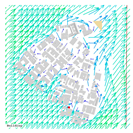
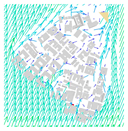
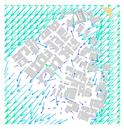
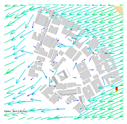
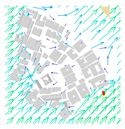
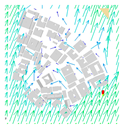
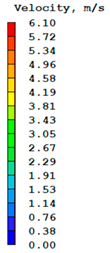
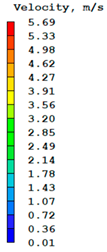
Based on the two wind-driven ventilation archetypes described earlier, several representative spatial sectors were extracted from the village and simplified into computational models, which were then analyzed with PHOENICS. All boundary and numerical settings match those detailed in Section 4. Table 4 presents the simulated wind velocity fields for the archetypes derived from the southwestern and north-western sectors of the historic core.
The simulation confirms that airflow circulates throughout each archetypal space, generating local breezes. Wind-field plots for the four representative months show that, in both archetypes, most outdoor areas experience velocities between 0.4 m/s and 2.0 m/s.
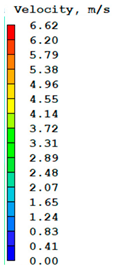
To quantify these patterns, the velocity maps were post-processed as images: after removing buildings and legends, pixels were sampled, RGB values were converted to the HSV color space, and hue thresholds were applied to calculate the proportion of pixels in each velocity band. Because all boundary cases exhibit similar velocity gradients, the color-coded ranges were consolidated into the three qualitative classes listed in Table 5. Velocities exceeding 2.40 m/s occupy only a negligible share of the alleys and, as draft discomfort lies beyond the scope of this study, that band is not analyzed separately.
Statistical results for the southwest archetype show that, in March, wind-shadow, comfort, and marked-cooling zones account for 9.78%, 18.95%, and 21.76% of the area, respectively; all shadow and comfort zones are concentrated in the alleys, whereas cooling zones lie mainly at the perimeter. In June, the corresponding shares are 10.40%, 14.68%, and 13.30%; in July, they are 8.85%, 11.90%, and 14.89%, with cooling extending into primary alleys and the outer edge; and in September, they are 15.74%, 13.87%, and 15.99%, again distributed along major alleys and the village fringe.
For the northeast archetype, wind-shadow, comfort, and marked-cooling zones represent 8.51%, 10.73%, and 21.11% in March; 7.67%, 9.76%, and 21.28% in June; 9.90%, 10.91%, and 22.14% in July; and 9.99%, 13.80%, and 14.07% in September. Cooling areas consistently exceed 10% of the footprint and occur mainly in wider nodes, primary alleys, and peripheral spaces.
The analysis indicates that both spatial models sustain a high share of comfort-range airflow; only the southwest model in September shows a larger wind-shadow area than comfort area. Under typical seasonal winds, more than 30% of outdoor areas maintain air speeds exceeding 0.5 m/s. In all cases, the marked-cooling zone exceeds 10% of the area and is located where street mouths are wider or in radial primary corridors—evidence that enlarging perimeter openings effectively captures external wind and that radial main alleys convey momentum to interior spaces with limited loss.
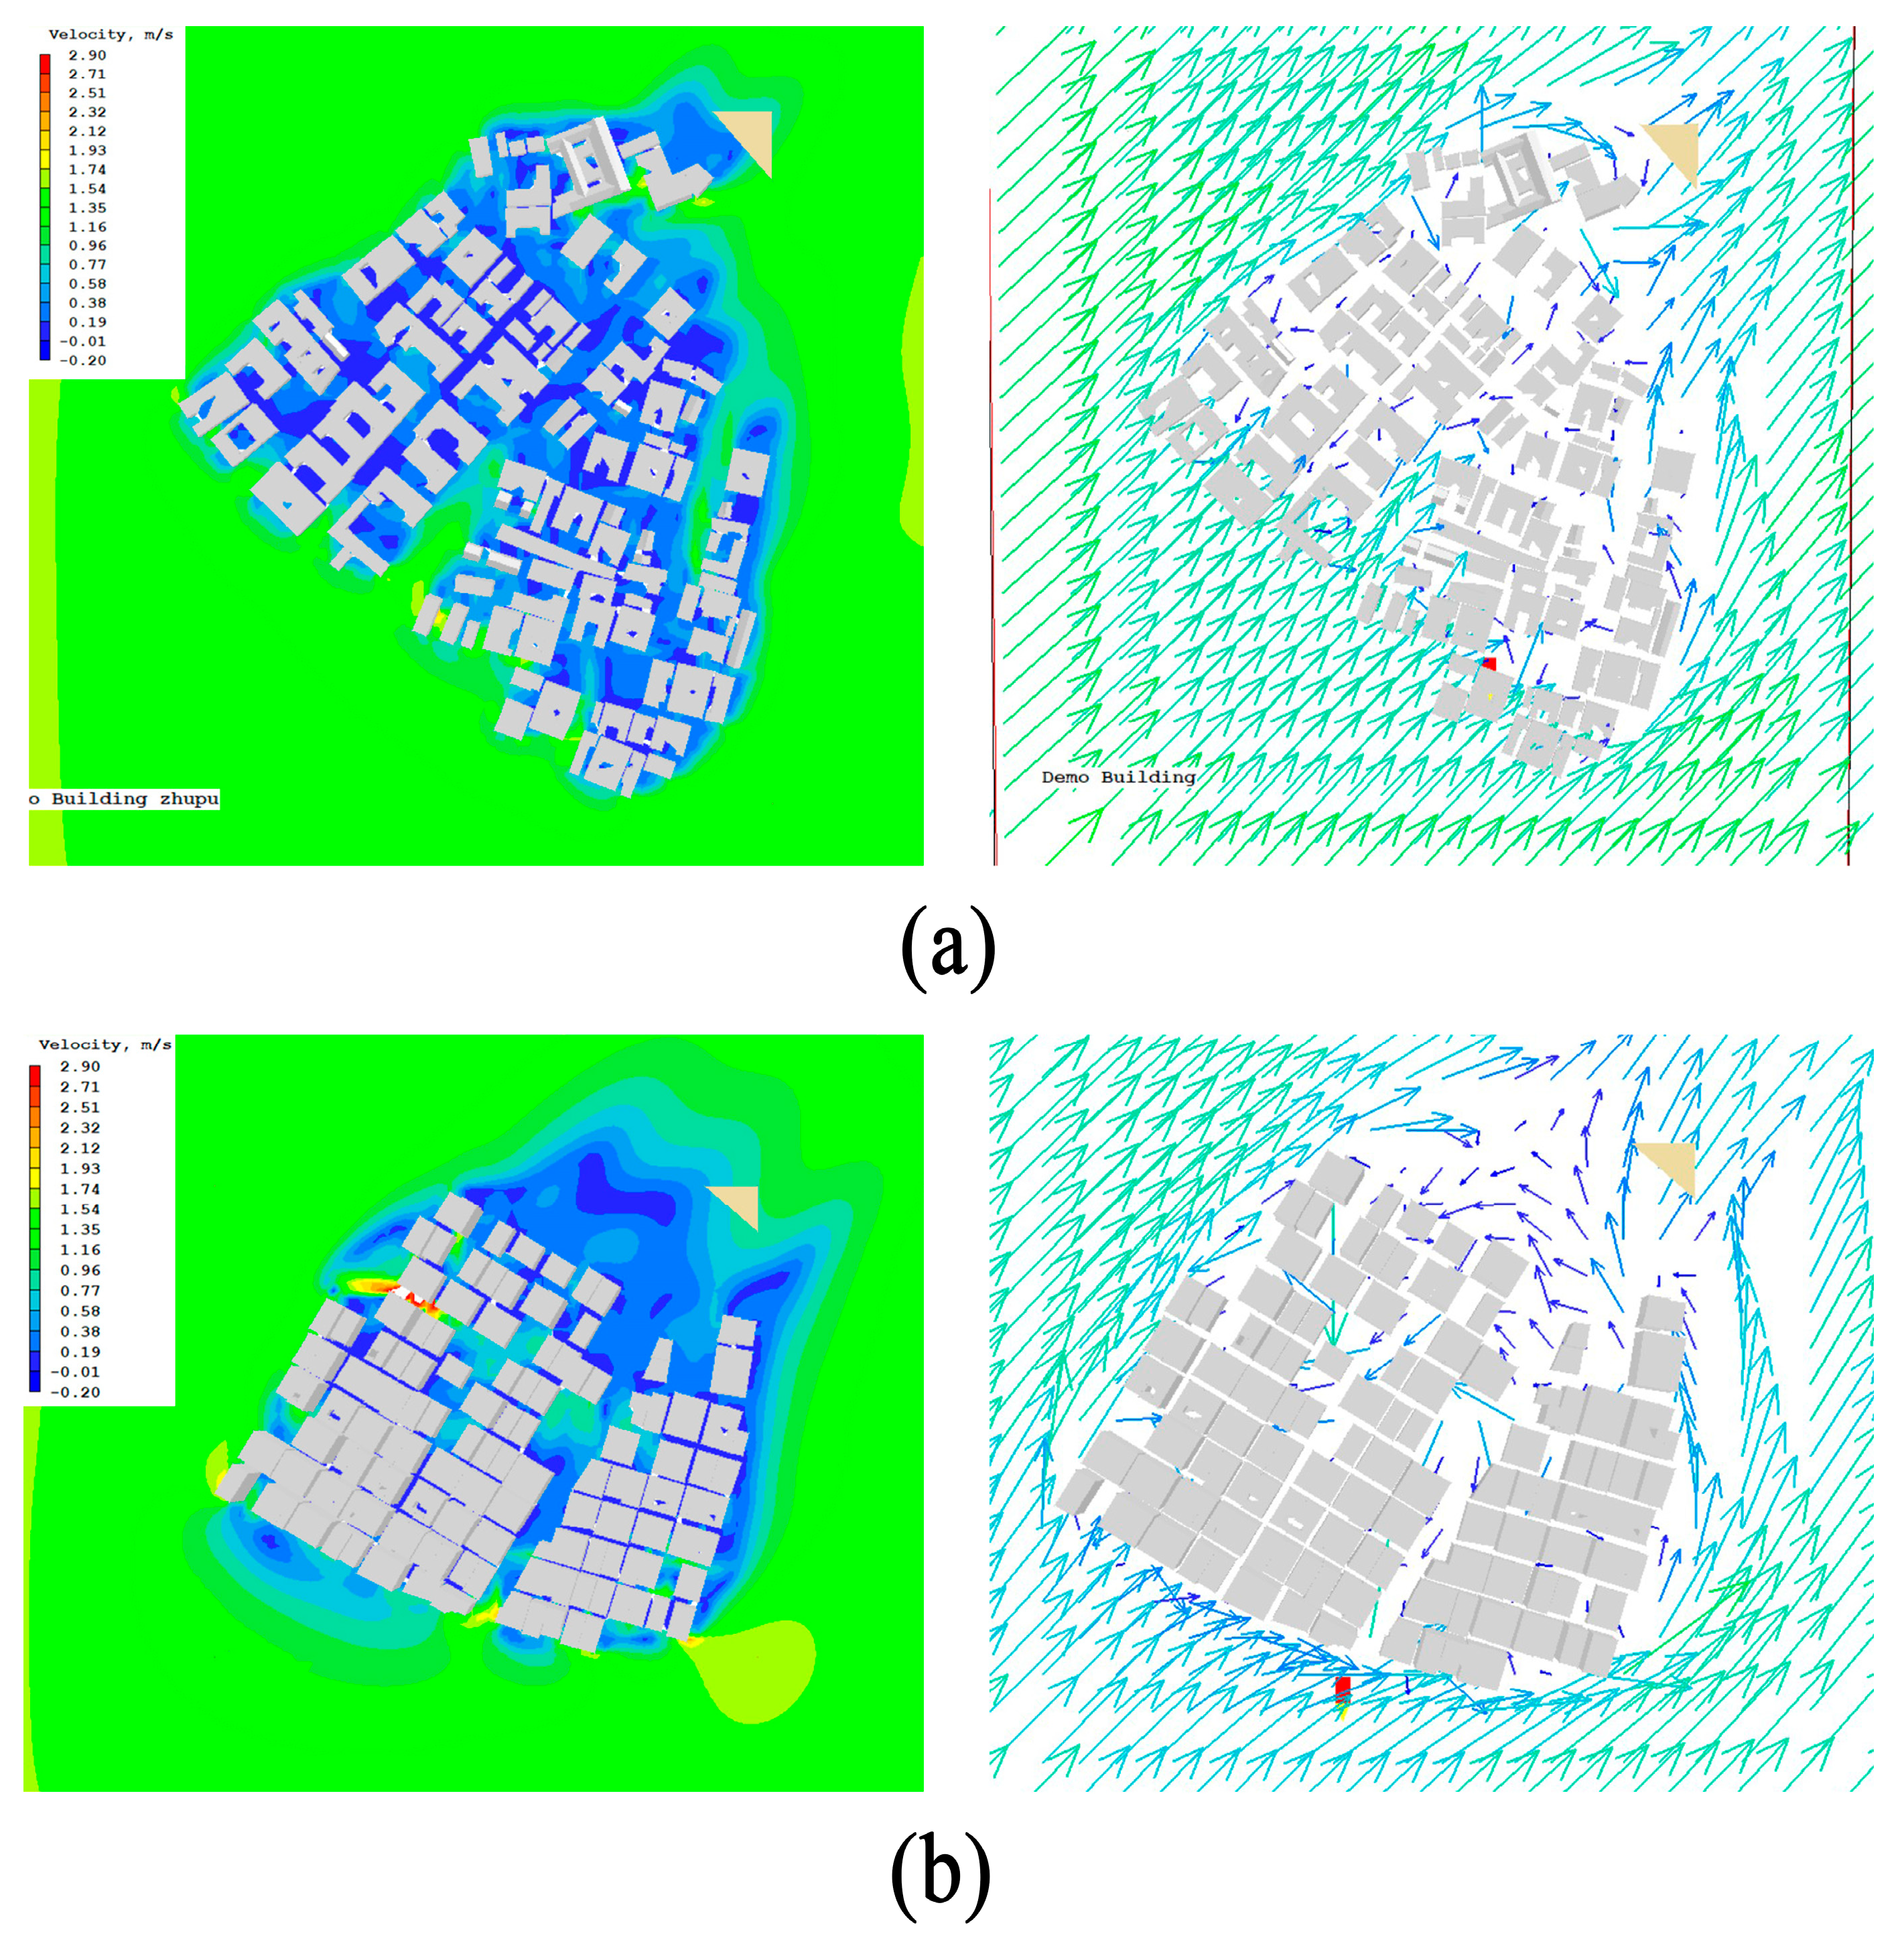
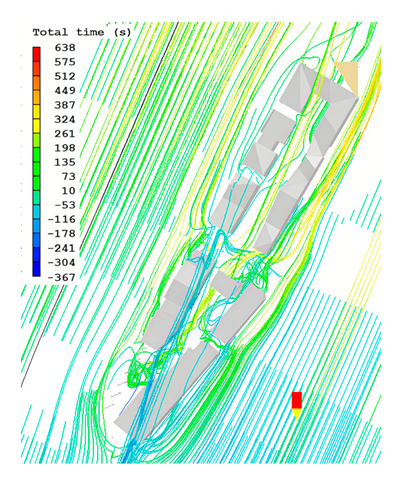
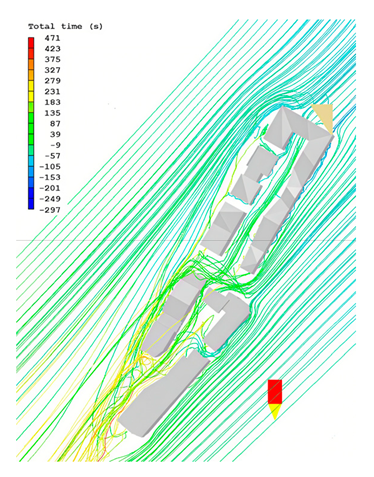
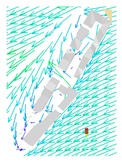
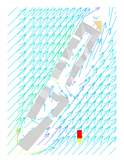
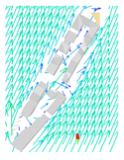
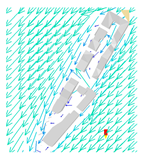
To further appraise the archetype’s performance, a June simulation compared the southwest cluster of Zhupu Village with a nearby, similarly oriented group of newly built rural houses; the results are presented in Figure 11.
After the 1970s, Zhupu Village was extended outward to create a “new village” that partially retained the historic radial street texture. Simulation results indicate that the main alleys in both sectors align with the prevailing wind directions and are capable of capturing incoming airflow. Image-recognition analysis shows that the historic sector’s combined comfort and marked-cooling zones occupy 27.98% of its area, compared with 25.6% in the new sector; conversely, low-speed zones (dark blue pixels) account for only 3.73% in the historic area but 5.10% in the new one.
Morphological differences explain the contrast. In the new village, most houses rise three stories or more, inter-building spacing is tight, and street canyons have large height-to-width ratios, so wind entering the primary alley rarely penetrates into side lanes, leaving some passages stagnant. In the historic core, buildings are lower, canyons narrower, and intermediate spaces such as zhuocheng courts and cool alleys break up the fabric; with more moderate spacing, natural wind reaches most lanes. Air circulation is therefore intrinsically better within the historic street network.
In summary, key features of the historic archetype—main alleys parallel to the prevailing wind, interconnected lanes, moderate height-to-width ratios, and reasonable building spacing—clearly promote natural ventilation. Extracting and judiciously applying this wind pressure archetype makes it feasible to design outdoor spaces that achieve effective passive ventilation.

5.2. Buoyancy-Driven Archetype Analysis

Zhupu Village is laid out in a distinctive bagua pattern—a traditional Chinese scheme that produces a circular, radial settlement form. During transitional seasons, the prevailing wind direction shifts, and the complex elevation changes within the settlement further disrupt airflow, so wind pressure alone cannot maintain ventilation at all times. Consequently, buoyancy-driven mechanisms must supplement and stabilize outdoor air movement during specific periods.
In addition to the feng-shui ponds—strategically positioned on different sides of the settlement to generate land–water breezes—temperature differentials within the building fabric also create local airflows. Because many alleys remain shaded for extended periods, their air temperature stays comparatively low. By contrast, open areas such as the zhuocheng—a kind of opening platform or small plaza, near the ancestral hall and the skylit courtyards of dwellings—receive little shading; their stone paving warms rapidly under solar radiation, producing higher local temperatures and, consequently, lower air pressure relative to the alleys. When these contrasting spaces are interconnected, the resulting pressure gradient induces natural airflow from the cooler shaded lanes toward the warmer sunlit zones, thereby enhancing ventilation.

5.2.1. Buoyancy-Driven Archetype

Zhupu Village contains several pond–zhuocheng–cool alley–sky well systems arrayed in different directions, each displaying a broadly similar spatial configuration. For detailed analysis, the western cluster was selected; it comprises a pond flanked by a sequence of buildings whose exterior spaces range from narrow cool alleys to wider sky wells and zhuocheng platforms.
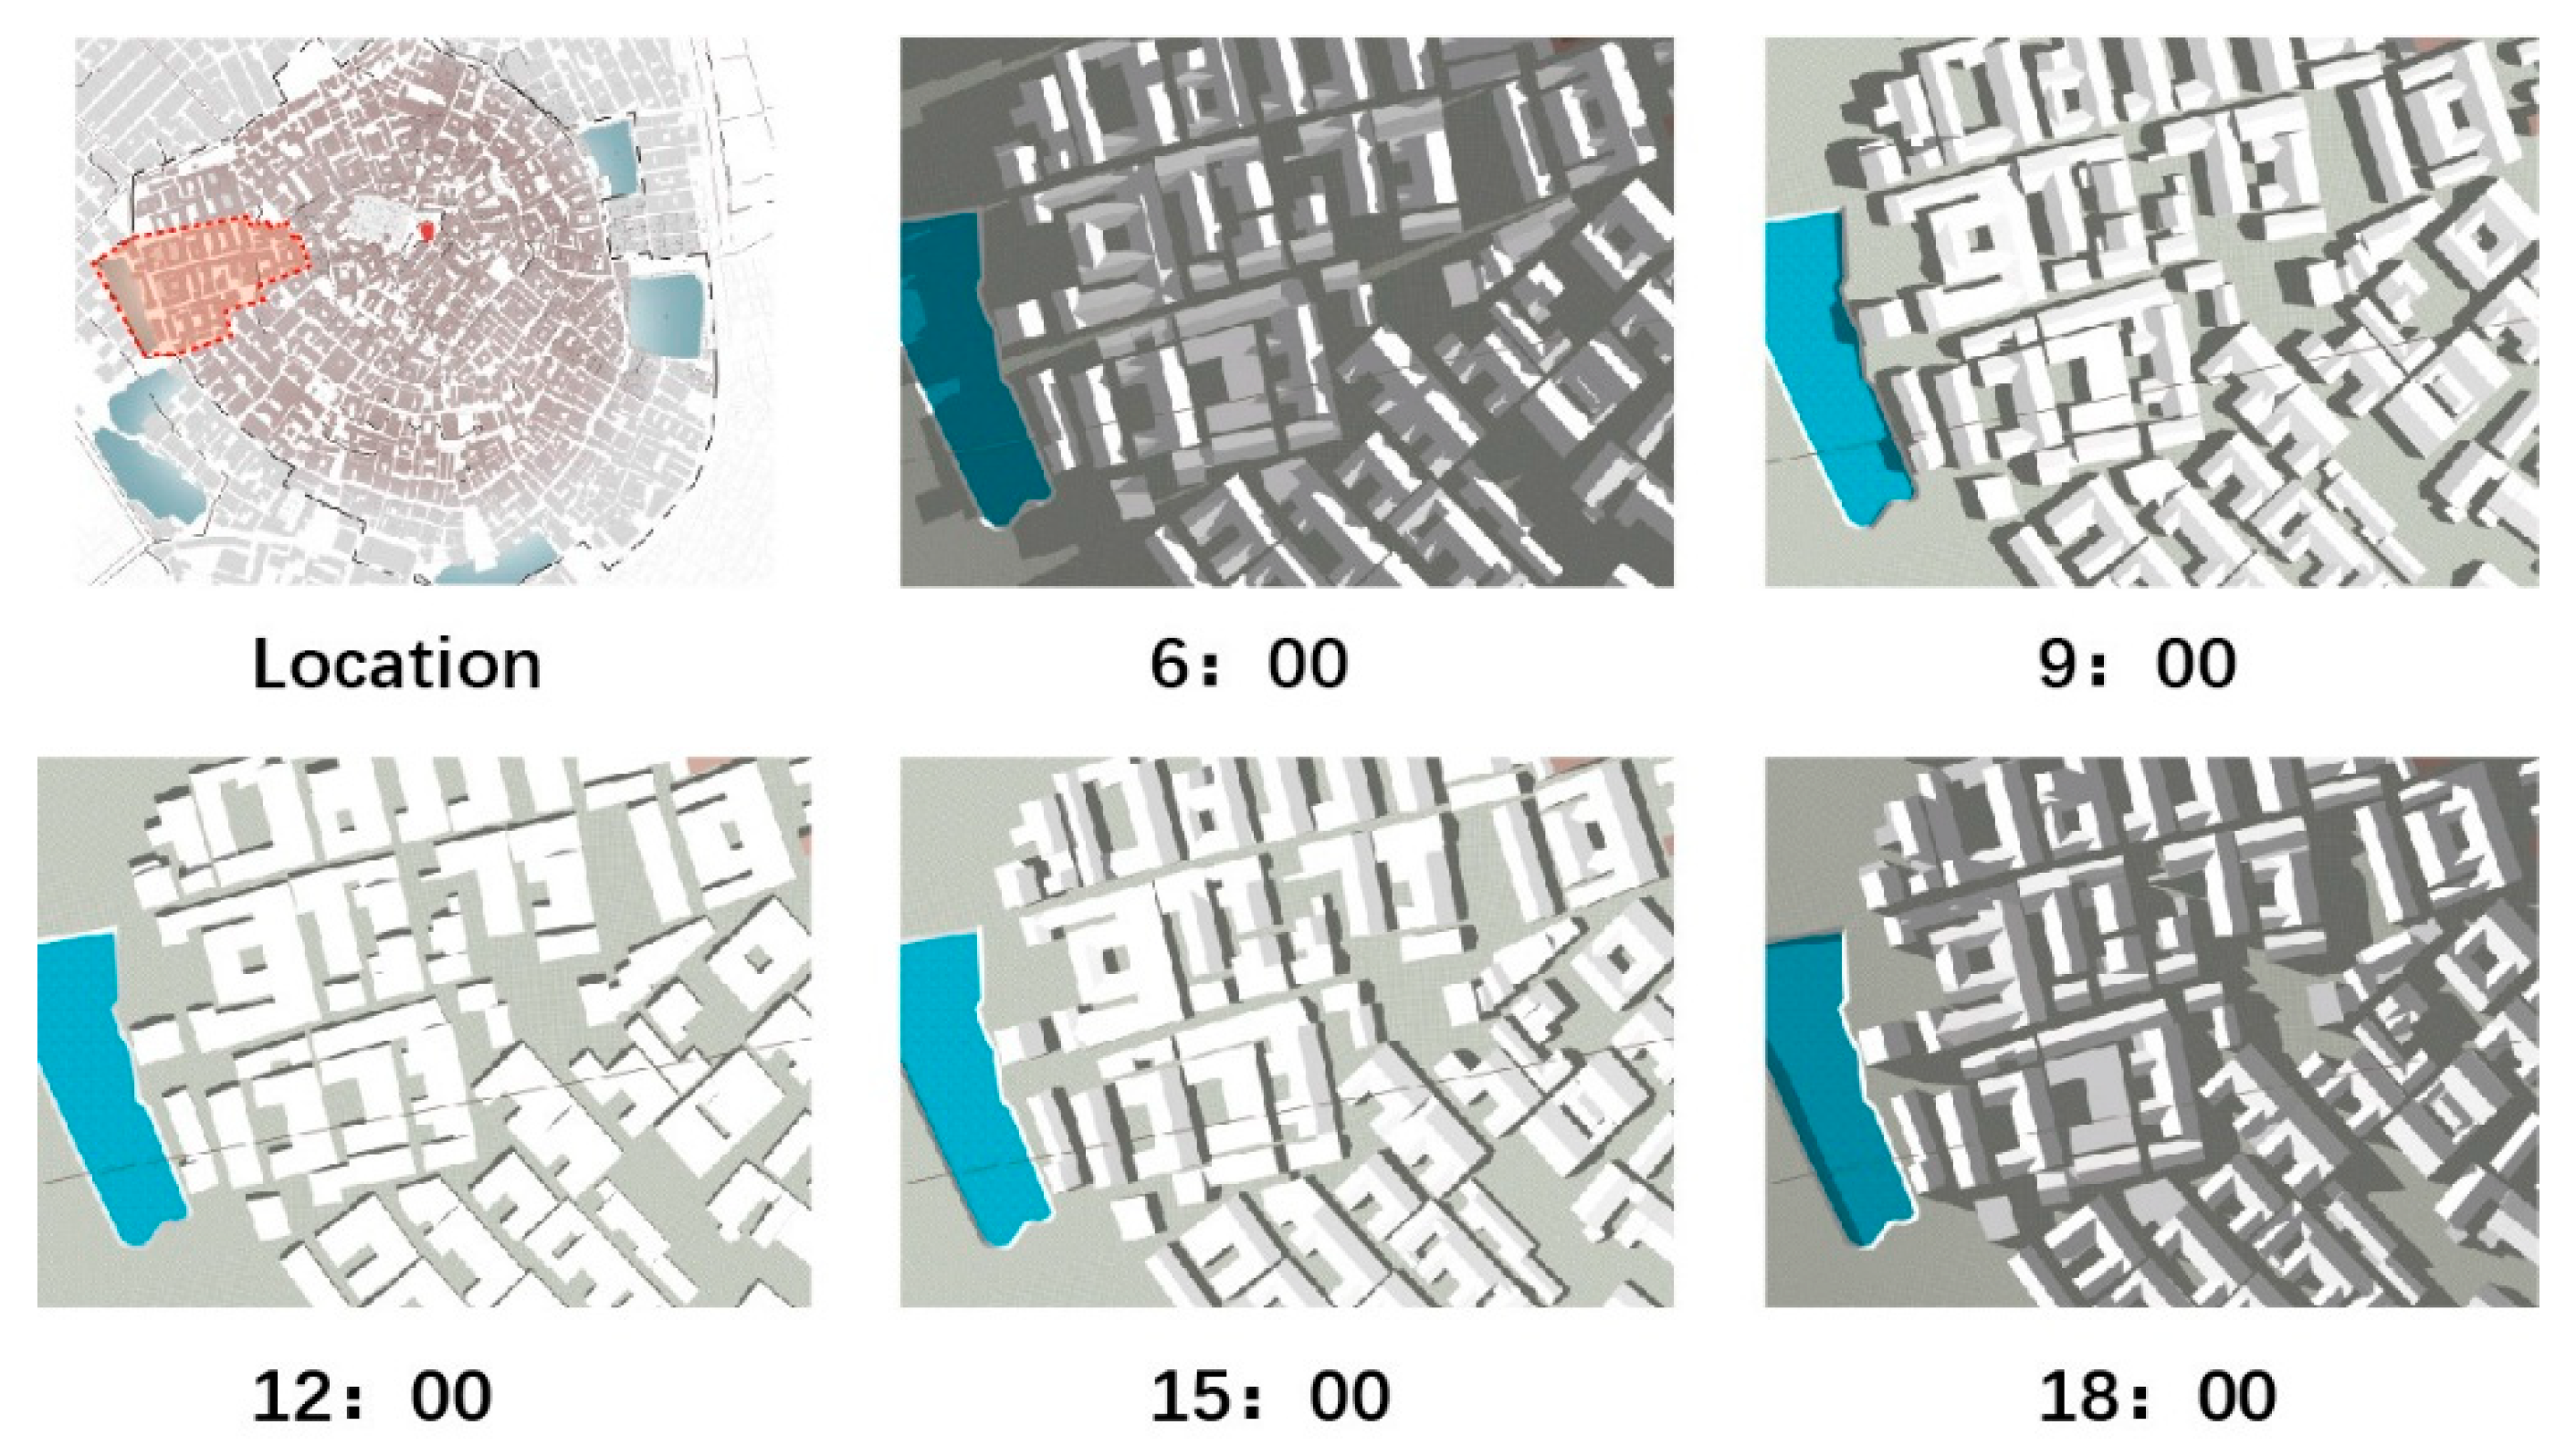
A base model of this cluster was built from field measurements, and solar exposure on the summer solstice day was simulated. Shadow patterns were extracted at 06:00, 09:00, 12:00, 15:00, and 18:00 to assess insolation conditions (Figure 12).
Using the sunlit and shaded areas at each time step, daylight exposure was classified for roofs, primary alleys, narrow alleys, and open spaces. Four qualitative levels were adopted: Fully sunlit corresponds to surfaces receiving direct sunlight on more than 75% of their area during the given time slot. Predominantly sunlit denotes 50–75% sunlit coverage, while predominantly shaded refers to 25–50% sunlit coverage. Fully shaded applies for areas where less than 25% of the surface is illuminated. The exposure ratings for each spatial element are summarized in Table 6.
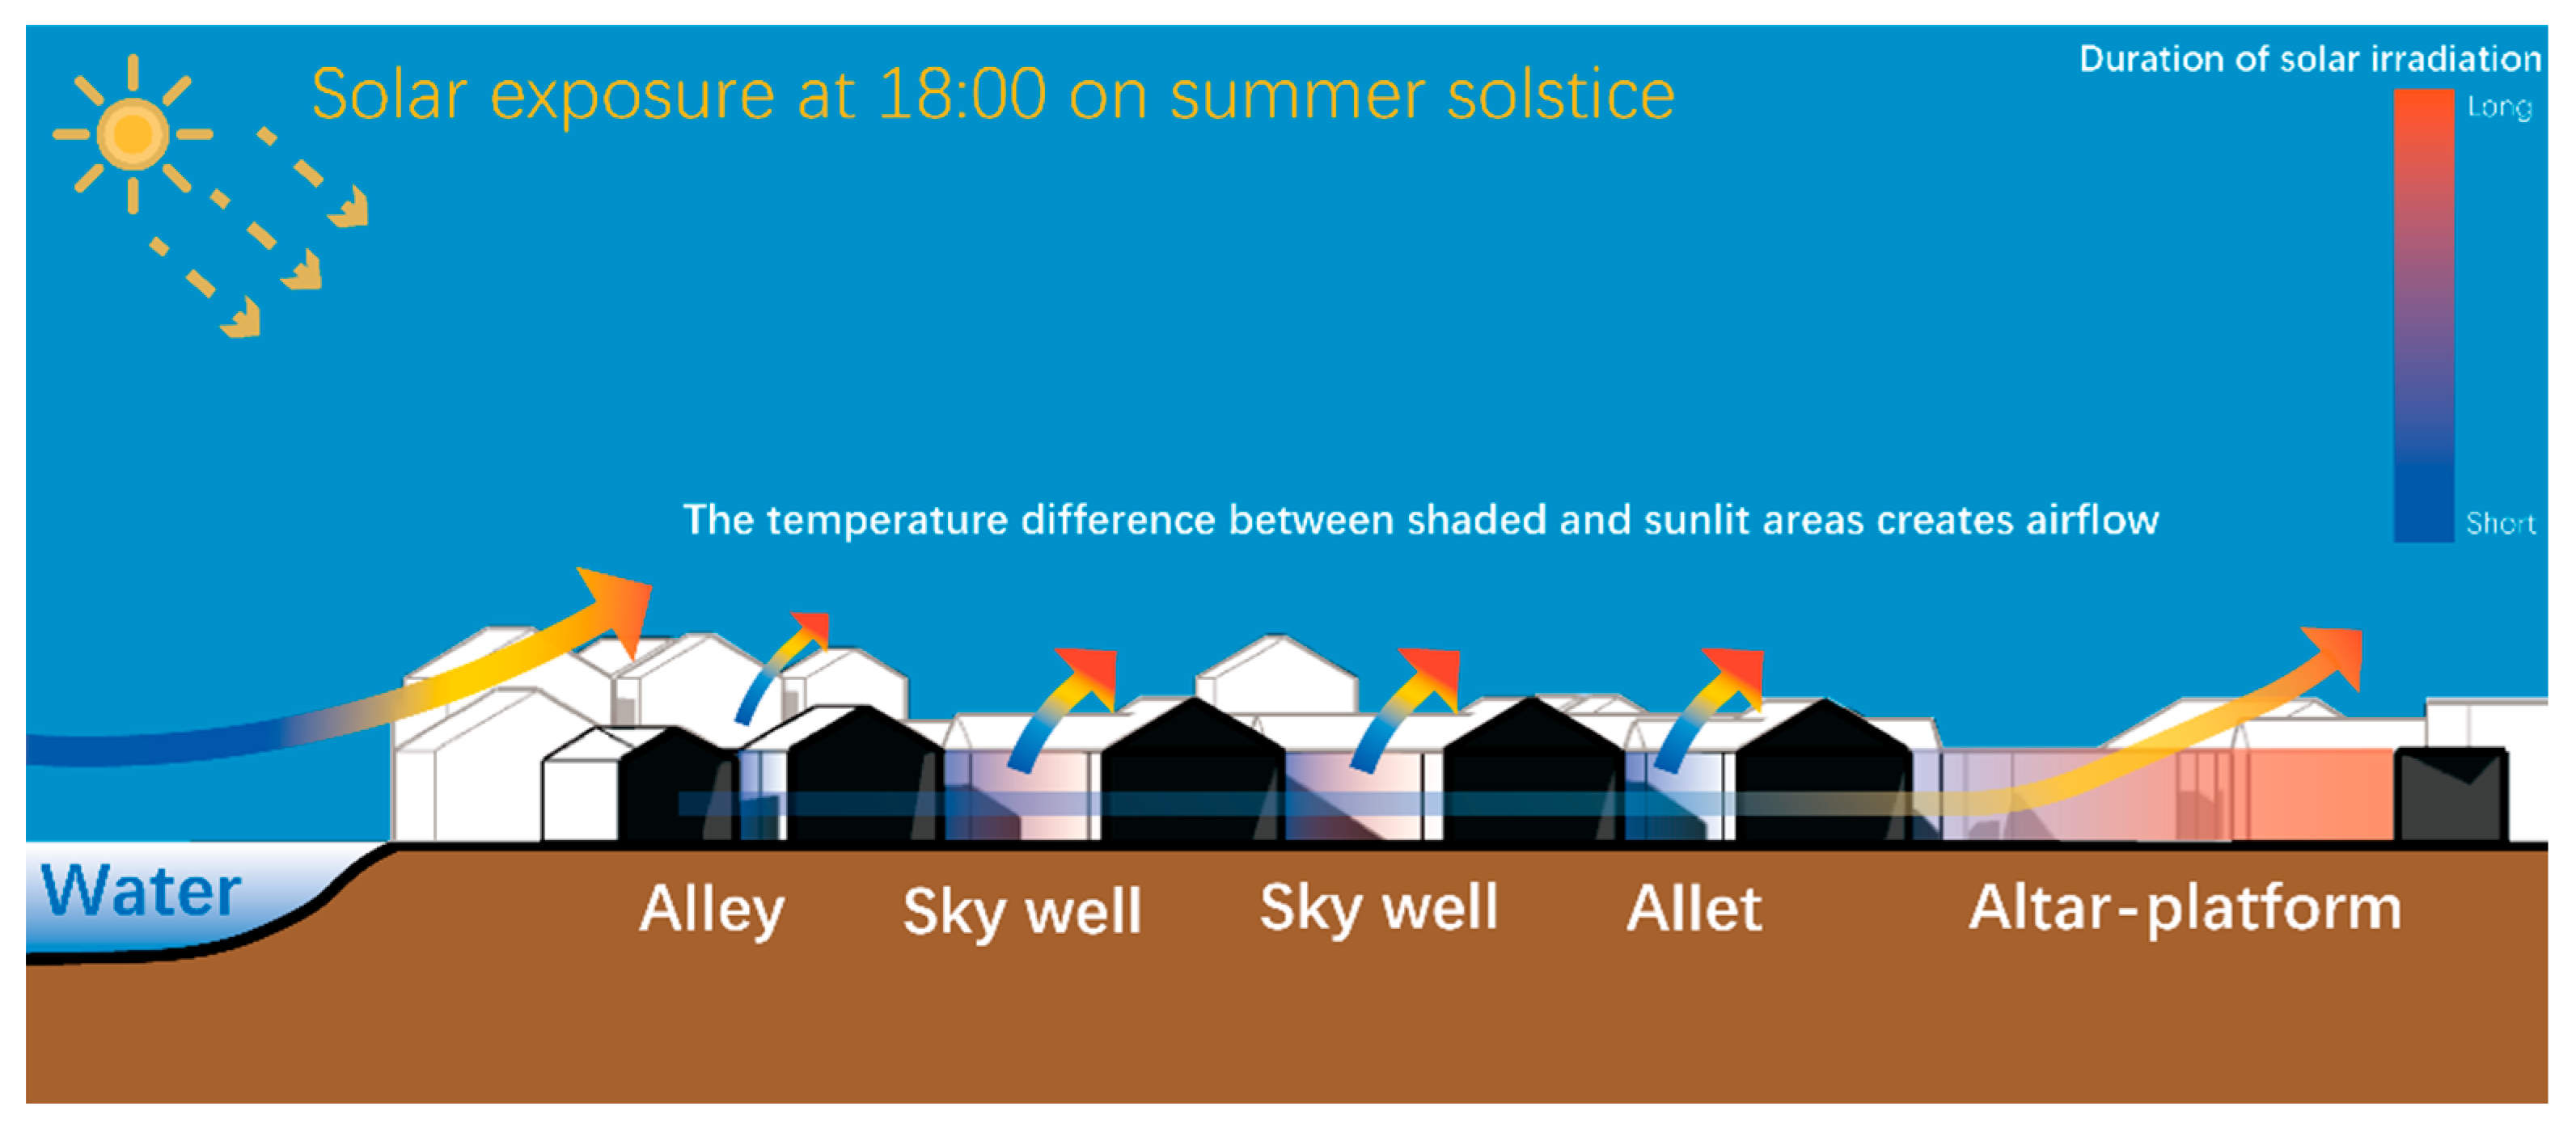
Based on the shadow distribution analysis, the cooling alleys within the building cluster remain shaded for extended periods, while sky wells and zhuocheng experience relatively shorter shading durations. Roof surfaces receive prolonged solar exposure, creating significant temperature differentials between shaded and sunlit zones. Additionally, the waterbody fronting the building cluster possesses high thermal mass, generating thermal gradients against adjacent paved surfaces and structures. Both scenarios induce airflow through thermal convection, effectively channeling natural breezes into the village spaces. The alley network further amplifies ventilation through a stack effect, driving outdoor air circulation while facilitating indoor–outdoor air exchange for village buildings (Figure 13).
Beyond airflow guidance, this spatial configuration provides passive cooling during peak summer months in July and August. The water features and cooling alleys reduce ambient air temperatures—the former through evaporative cooling and the latter through retained coolness in shaded passages—thereby tempering airflow entering the settlement.

5.2.2. Buoyancy-Driven Archetype Simulation and Performance Evaluation

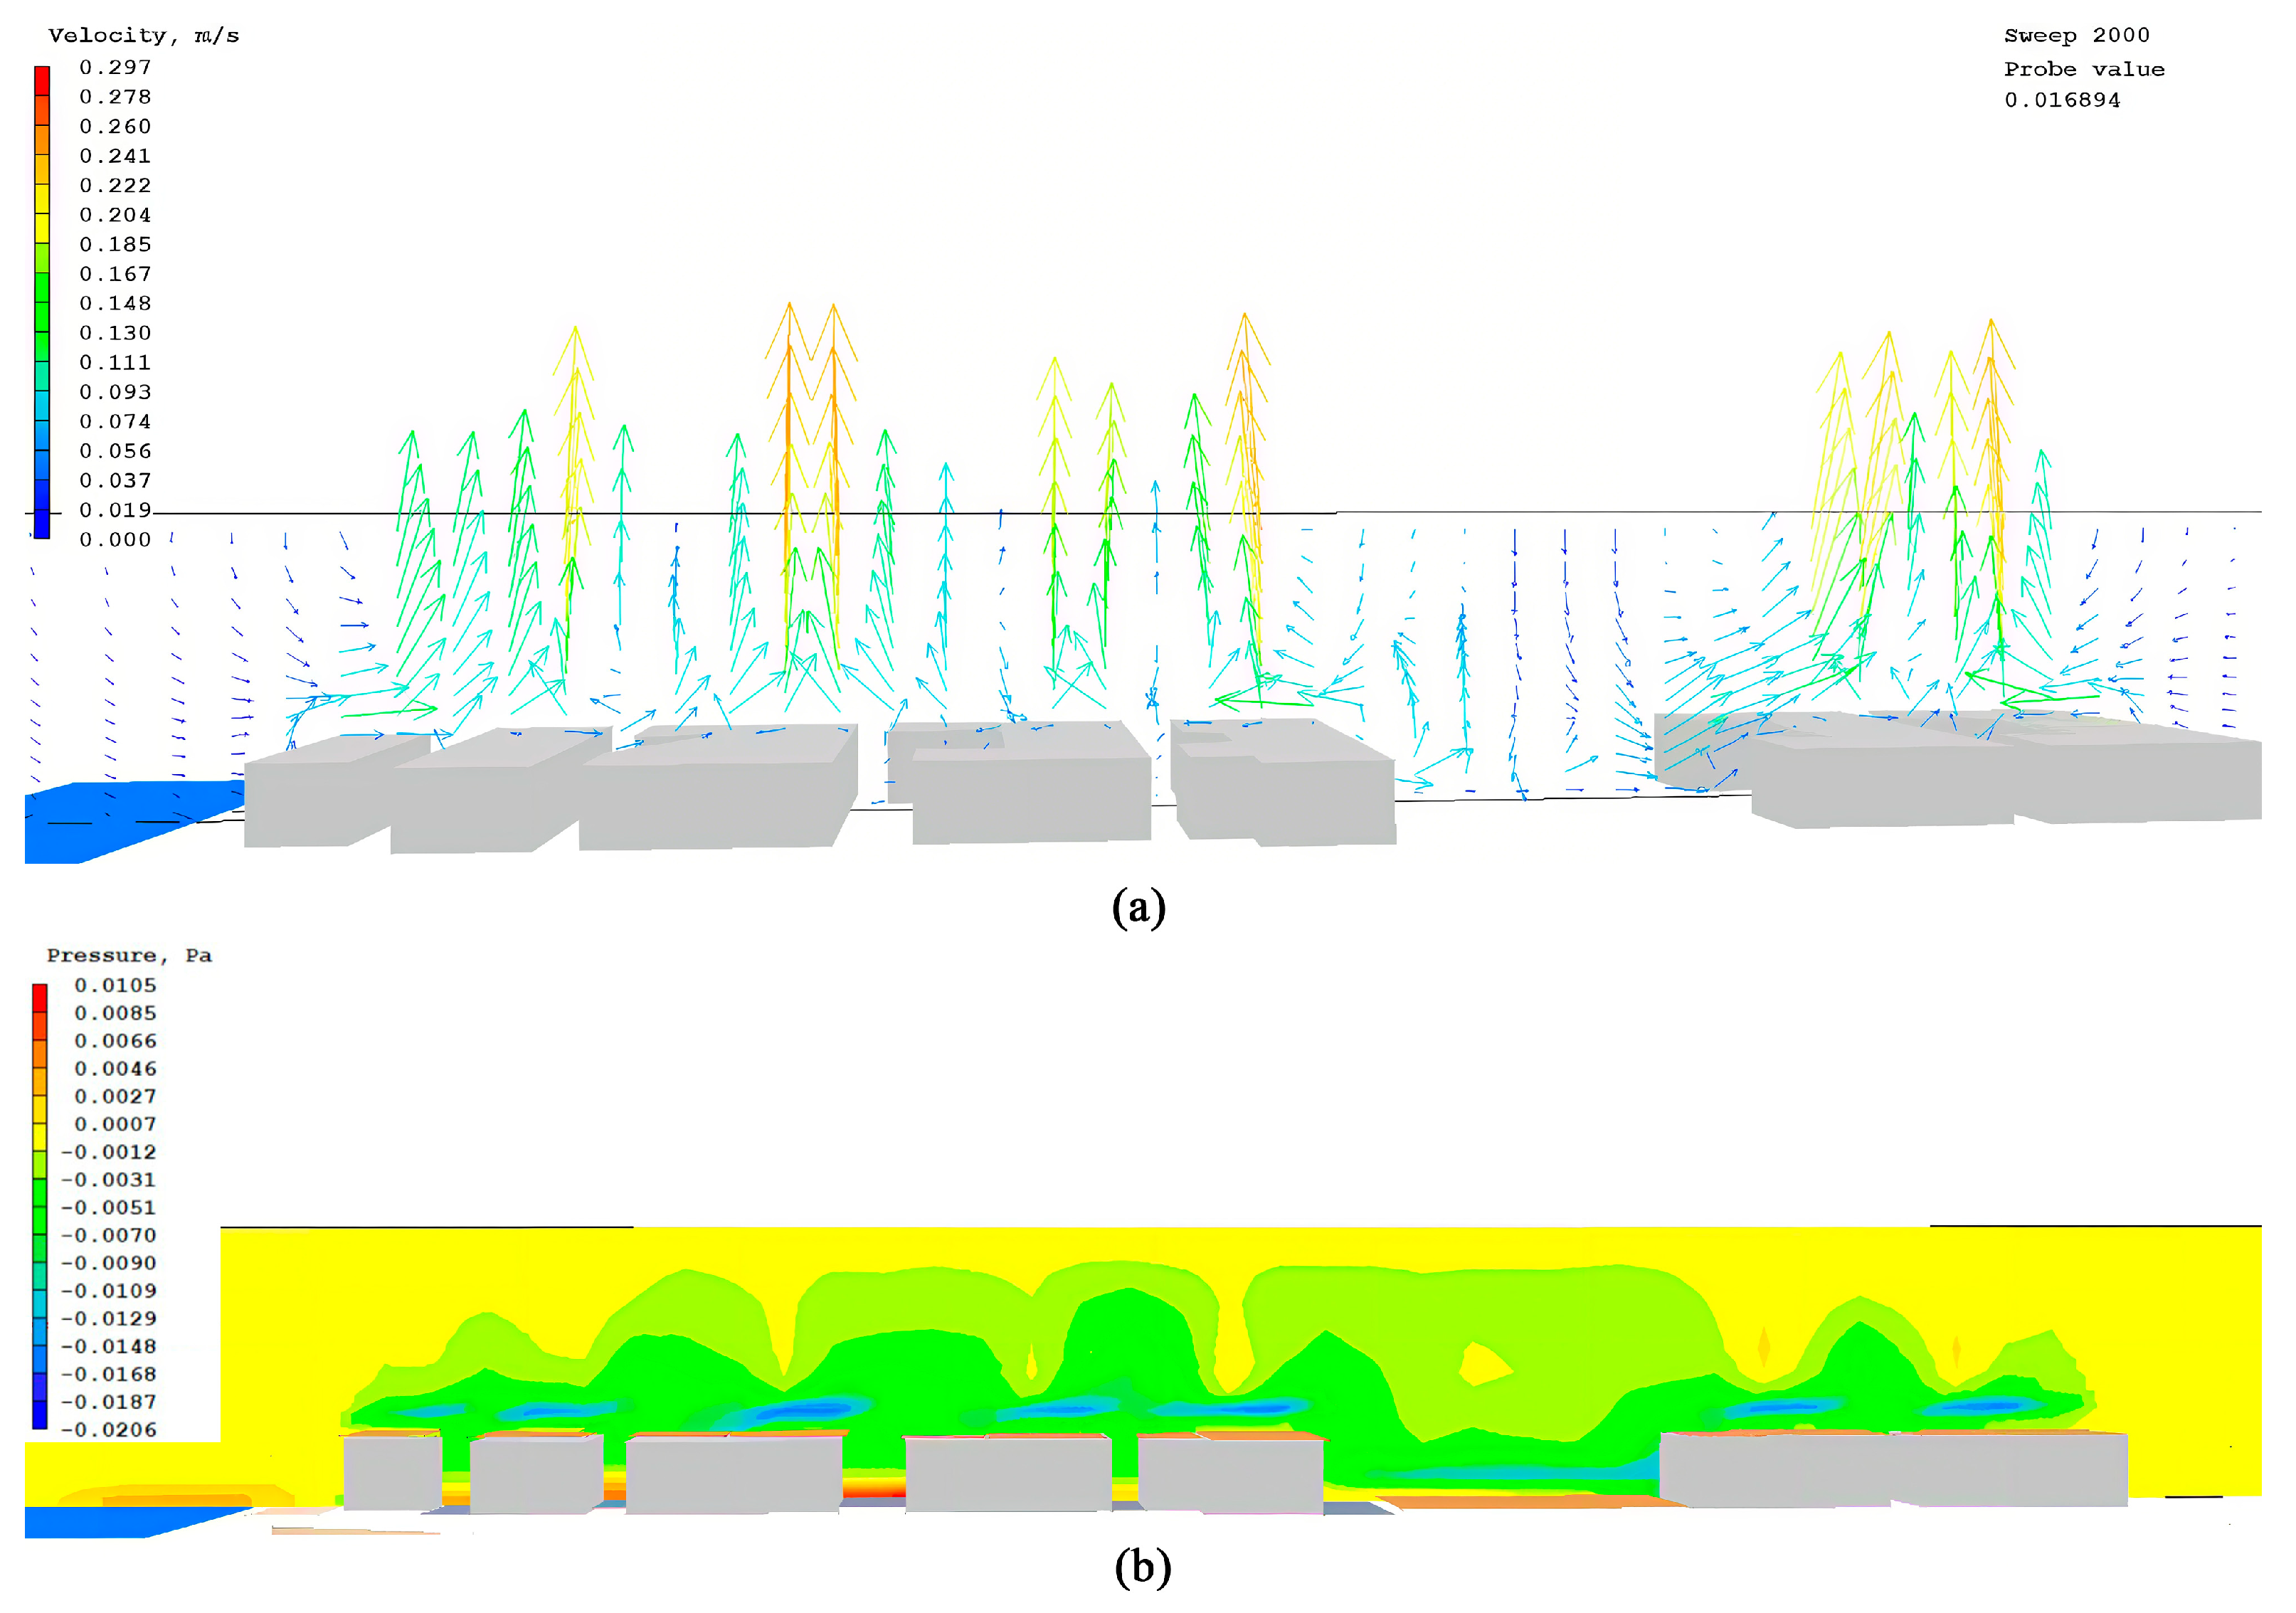
Following the buoyancy-driven archetype identified earlier, a simplified model of the western cluster—comprising the pond, sky well, surrounding buildings, alleys, and zhuocheng—was constructed and simulated in PHOENICS. Temperature zones within the model were assigned according to the daylight exposure analysis, and all boundary settings match those given in Section 4. The resulting sectional perspective figures, showing the wind velocity vector field and the pressure contour for the west area archetype, are presented in Figure 14.
The simulation indicates that buoyancy-driven ventilation in the outdoor space is weaker than its wind-driven counterpart. In the present model, the highest velocity generated solely by temperature differences does not exceed 0.3 m/s, a level barely perceptible to occupants. Based on the information from the pressure contour plot, the sun-exposed roof sections of the traditional village exhibit negative pressure, while the cooler waterbodies and unexposed alleyways show slight positive pressure—consistent with established thermodynamic principles. The pressure differential between sun-exposed and shaded surfaces drives gentle airflow. Under real conditions, however, wind pressure and buoyancy act together, and the temperature gradients created by well-planned site layouts can channel the natural airflow. The results clearly reveal such flow patterns: the temperature difference between the pond and the surrounding built surfaces directs air from the water toward the building cluster, while the differential between the cool alley and the sun-warmed roofs induces upward movement within the alley, producing a pronounced extraction effect.
In summary, the historic buoyancy archetype yields low absolute velocities on its own but retains a significant capacity to guide airflow. When wind and buoyancy act in concert, the layout channels air into the village fabric and enhances exchange between interior and exterior zones. Appropriately extracting and applying this buoyancy mechanism therefore offers a feasible strategy for outdoor ventilation design based on the Zhupu archetype.

5.3. Design Application of Ventilation Archetypes

The morphology of Zhupu Ancient Village embodies collective spatial intelligence, crystallizing empirical wisdom in climate adaptation. Abstracting key elements—interconnected alleyways, wind-aligned layout, moderate spatial proportions, water features, and airflow nodes (zhuocheng)—the visitor center synthesizes contemporary architecture resonant with cultural continuity. Alley entrances were enlarged, building masses perforated for permeability, and water elements simplified, adapting traditional geometries—primarily derived from the geometric typology of vernacular villages—for contemporary technical requirements, where specific dimensional parameters undergo calibrated adjustments according to prevailing design codes. This translation integrates Zhupu’s wind pressure- and buoyancy-driven ventilation archetypes via two primary methods: configuring street-and-alley morphologies and incorporating water-feature corridors.

5.3.1. Site Context of Design

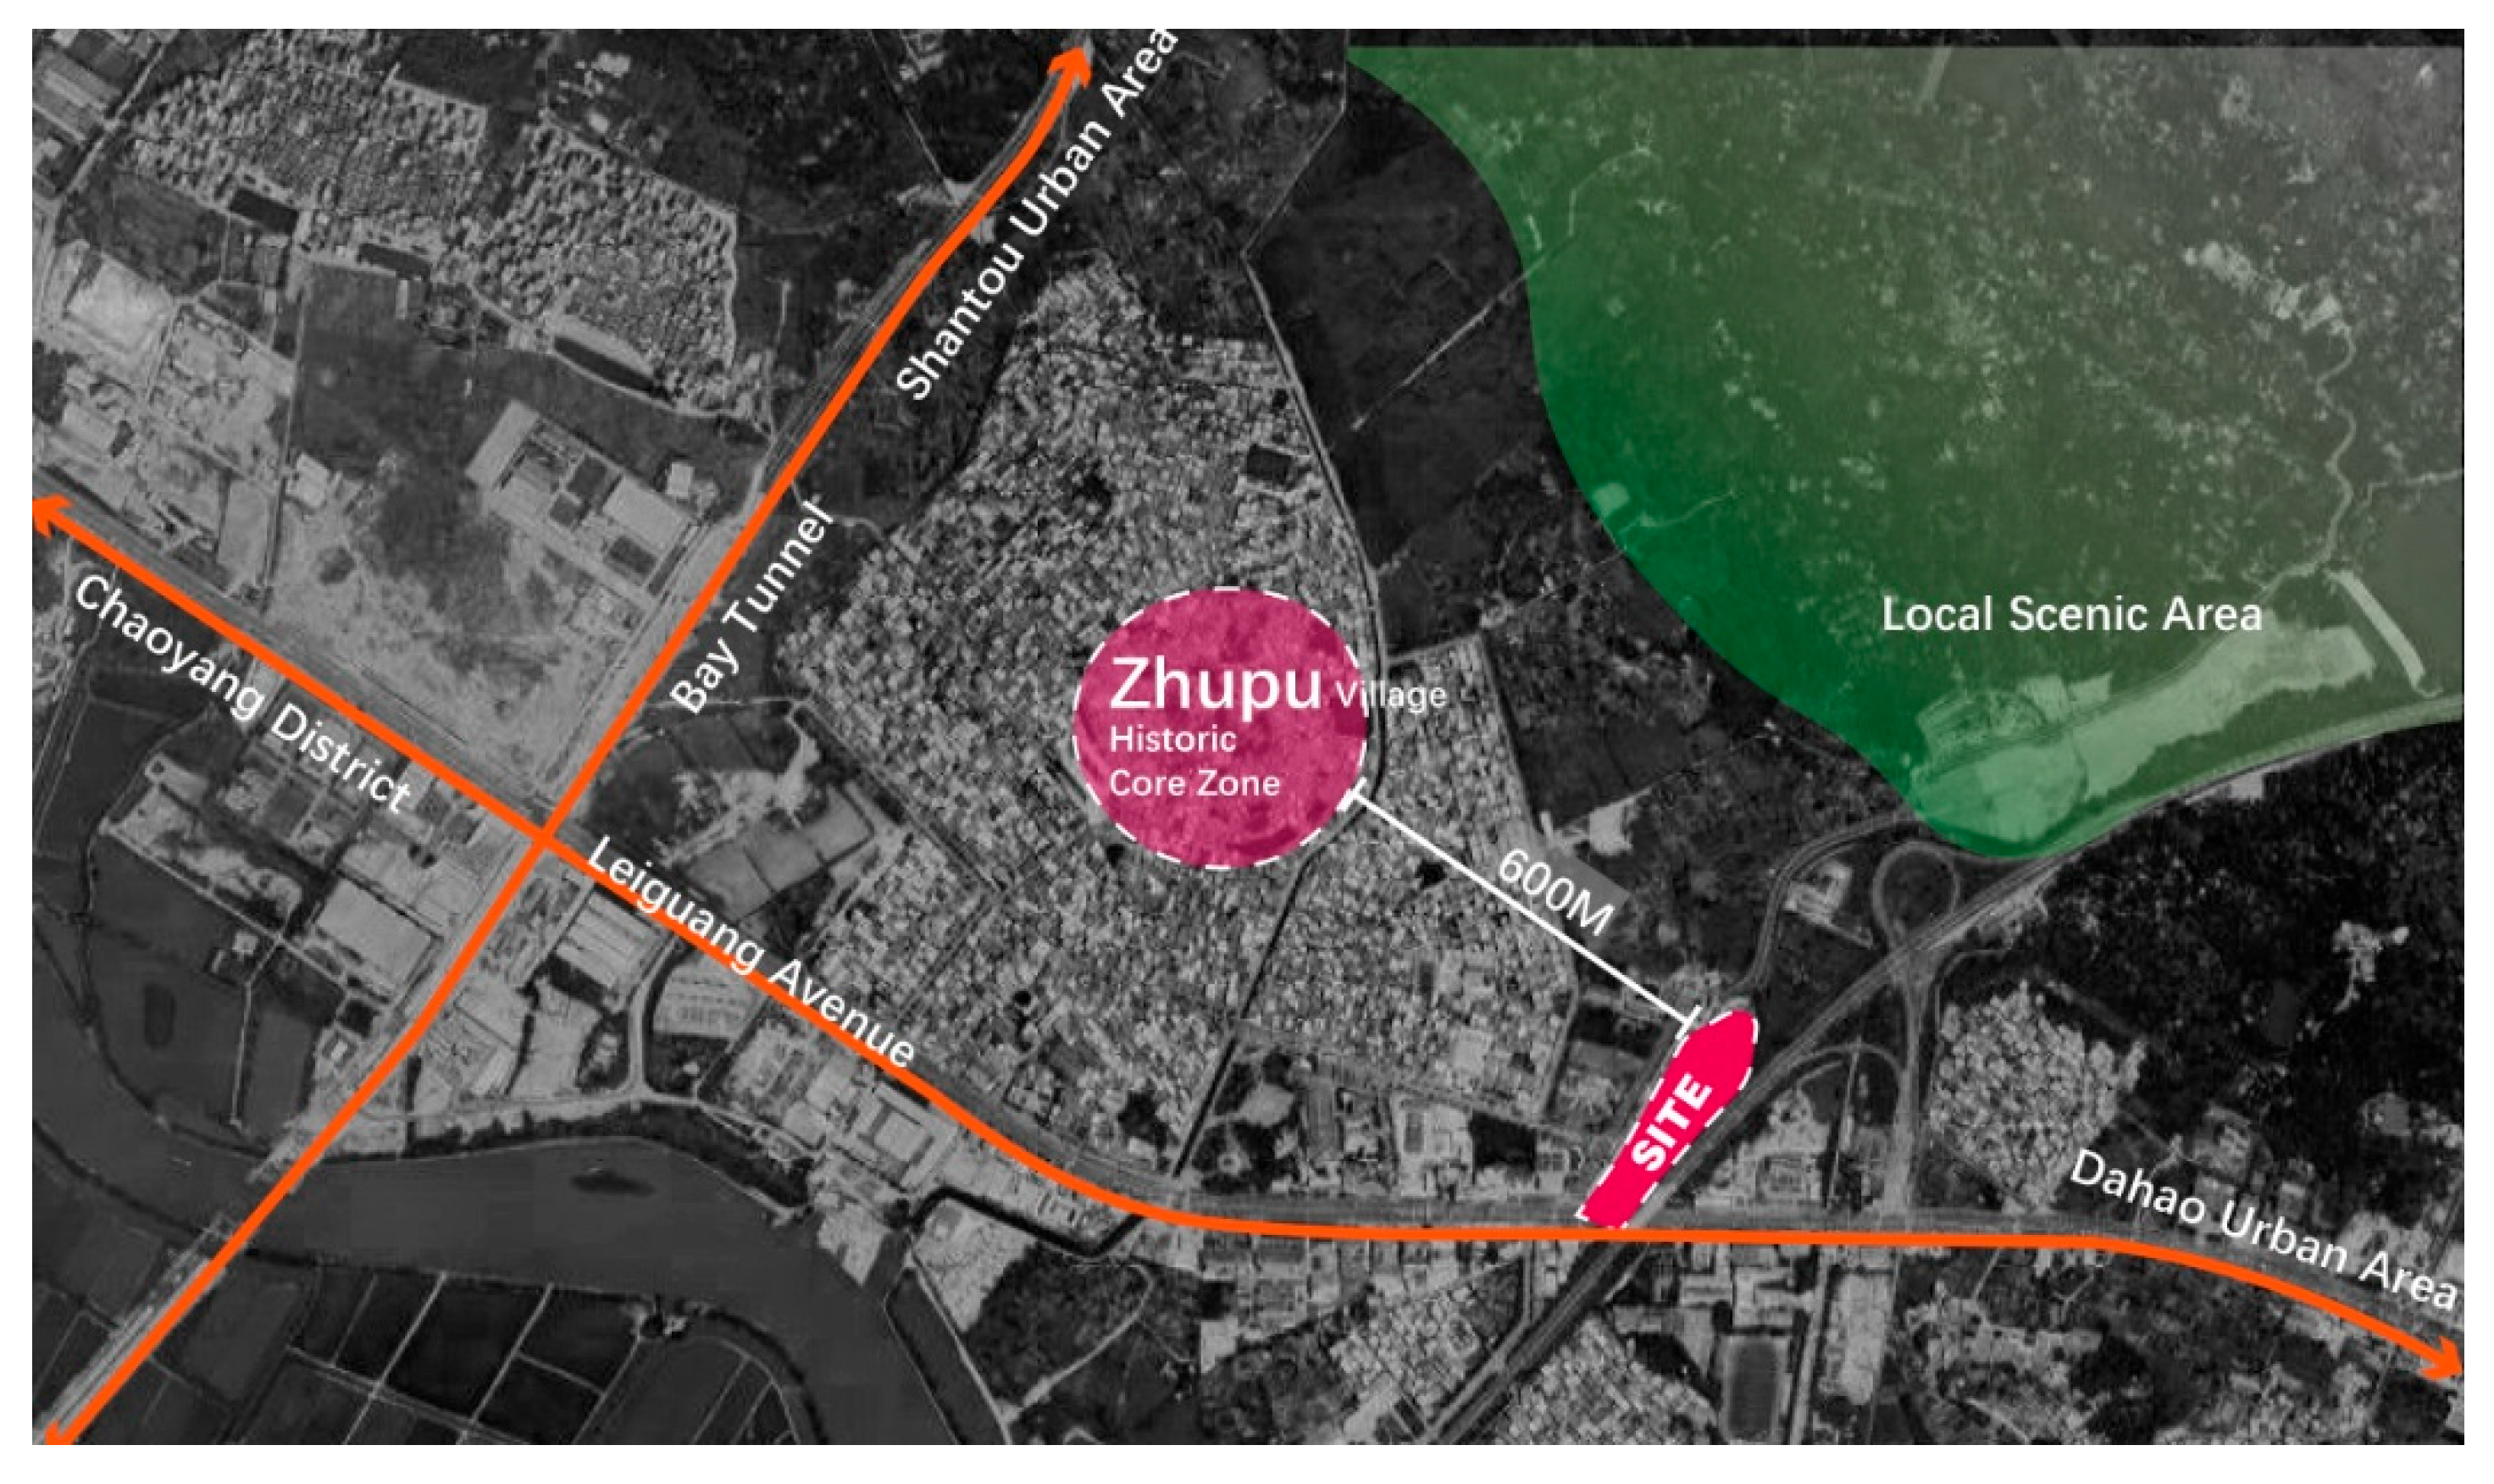
The site, 600 m north of Zhupu Ancient Village in central Haojiang District, Shantou (Figure 15), occupies a 30,296 m2 rectangle just 65 m wide yet nearly 400 m deep. It marks the southern gateway to the scenic area and hillside temple. The plot’s narrow width and great depth require a layout that maximizes natural ventilation while reflecting Chaoshan vernacular; the design arranges volumes using Zhupu-derived spatial archetypes.
This visitor center accommodates distinct user circulation patterns. Analysis indicates that tourists will predominantly enter from Leiguang Road at the southern boundary, subsequently proceeding northward toward the mountainous scenic area. Concurrently, provisions must be made for staff, business operators, village residents, etc. accessing the site from Zhupu Village at the western periphery.

5.3.2. Application of Wind Pressure Ventilation Archetype

The site abuts mountainous terrain with minimal surrounding built obstructions, offering favorable conditions for harnessing natural wind resources. Its predominant southwest–northeast orientation aligns with the region’s seasonal prevailing wind directions.
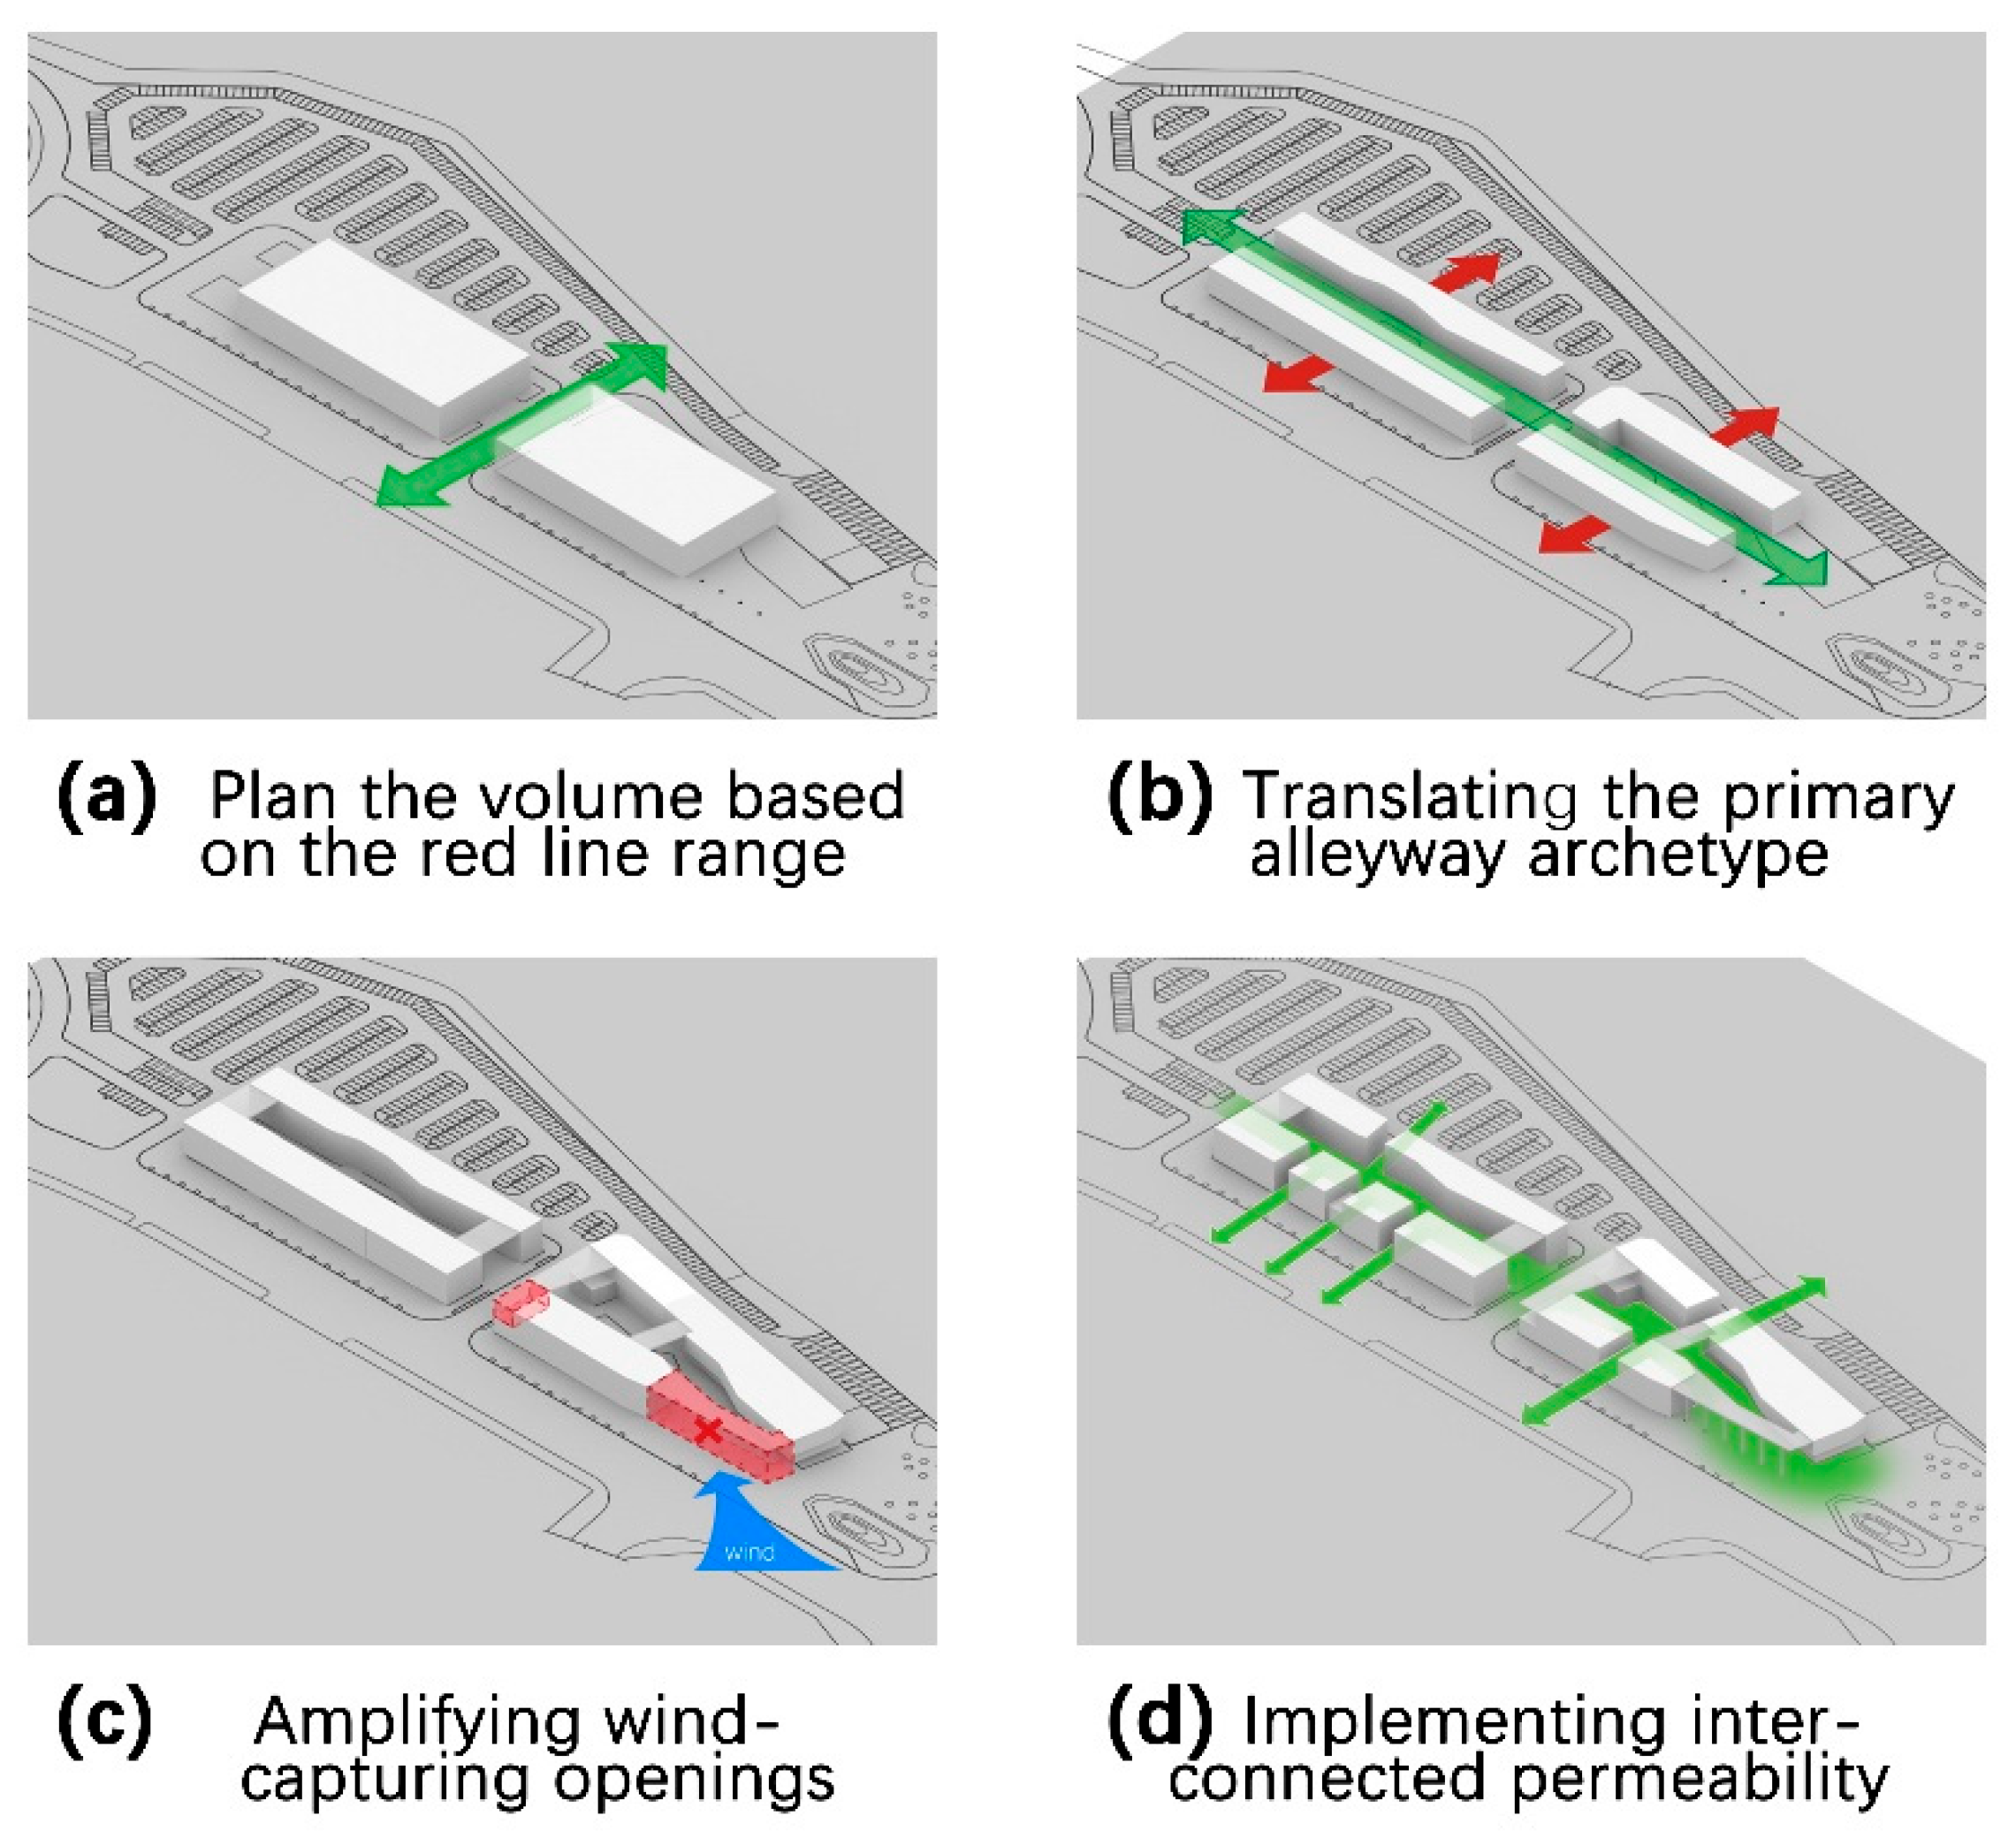
Adapting the wind-responsive settlement strategy observed in Zhupu Ancient Village, the design configures street–alley morphologies (Figure 16) by:
  • Translating the primary alleyway archetype: Building masses are oriented along the southwest–northeast axis, segmented to form a central arterial street space.
  • Amplifying wind-capturing openings: Inspired by the village’s expanded alley entrances, building volumes at the southwestern corner are recessed to widen inflow apertures.
  • Implementing interconnected permeability: Replicating the village’s hierarchical alley network, four western and two eastern through-openings pierce the elongated built form, fragmenting the massing to enhance cross-ventilation.
From a natural ventilation perspective, the wind-responsive layout—aligning with prevailing winds and emulating the ancient village’s street–alley matrix—facilitates airflow penetration into the building cluster, enabling passive cooling. The created through-spaces establish unimpeded passages for air exchange, effectively disrupting and reducing wind-shadow zones. Functionally, the design addresses public architecture’s requirement for spatial permeability: the visitor center serves as a hub for disseminating local tourism information and showcasing regional cultural narratives. The inherently permeable nature of the alley-inspired configuration guides visitors through internal streets while activating communal engagement. Crucially, the multiple western openings provide dual functionality—enhancing cross-ventilation and facilitating circulation for the Zhupu residents.
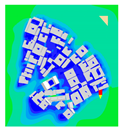
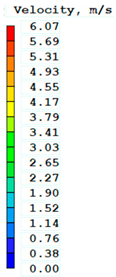
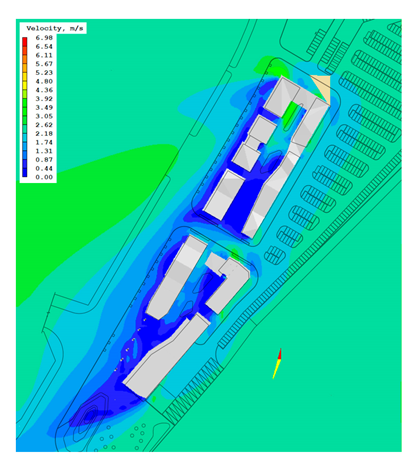
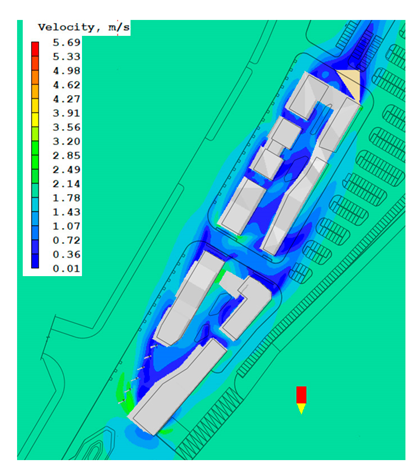
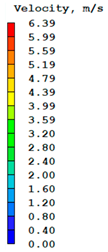
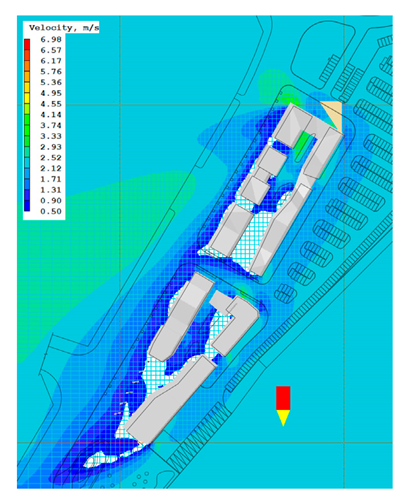
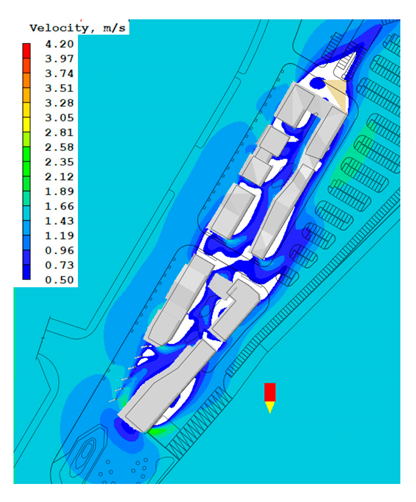
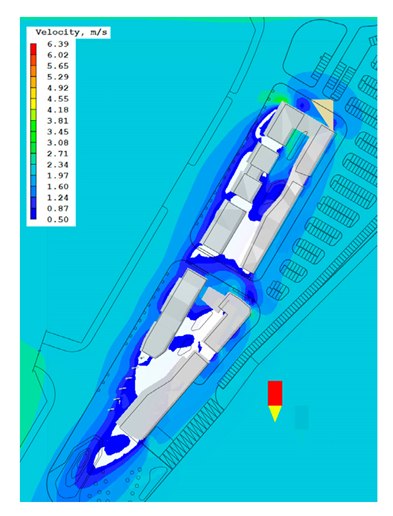
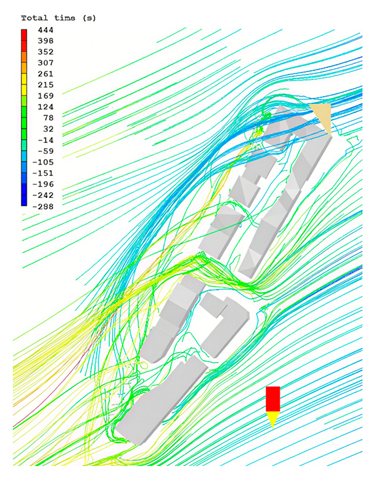
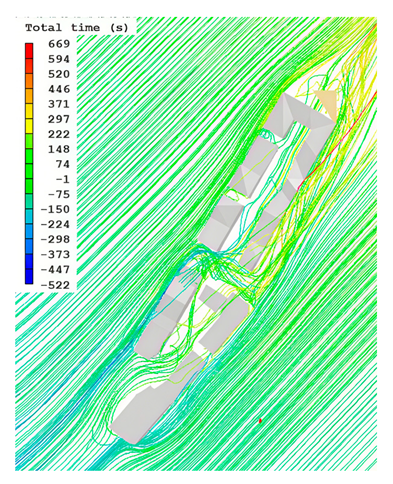
To validate the natural ventilation performance of this configuration, simulations employing identical boundary conditions (Section 4.1) were conducted for the visitor center across critical months. As summarized in Table 7, results demonstrate consistent airflow velocities ranging from 0.36 to 2.52 m/s throughout outdoor pedestrian zones during March, June, July, and September. Streamlined visualizations confirm uninterrupted wind penetration across the building cluster, indicating effective air exchange in circulation areas. Preliminary analysis nevertheless identifies persistent wind-shadow zones within select segments of the outdoor environment.
Image processing analysis quantified monthly distributions of wind velocity zones across pedestrian areas. During March, substantial wind-shadow zones below 0.5 m/s and low-velocity zones between 0.5 m/s and 0.8 m/s occupied 5.31% and 10.82% of pedestrian areas, respectively, in the central stretch and southern entrance of the internal street, aggregating to 16.13% suboptimal ventilation coverage. June exhibited fragmented wind-shadow zones totaling 6.26% across discrete segments of the internal street. July demonstrated optimal performance with wind-shadow coverage reduced to 5.29% where unimpeded airflow prevailed throughout pedestrian zones. September presented significant challenges as contiguous wind-shadow zones expanded to 8.81% in central–southern internal street sections, with combined suboptimal zones reaching 25.55% when incorporating adjacent low-velocity areas between 0.5 m/s and 0.8 m/s.
Simulation outcomes confirm that the permeability-enhanced configuration sustains natural airflow and fresh air exchange throughout all critical months, with wind-shadow zones consistently constituting less than 10% of pedestrian areas. Even during peak obstruction periods when continuous wind-shadow clusters develop, combined suboptimal zones integrating wind-shadow and low-velocity areas never exceed 20% coverage. Monthly performance variations reveal distinct climate responsiveness: during July’s peak heat at 31 °C, over 80% of pedestrian zones experience perceptible airflow above 0.5 m/s, delivering effective cooling despite high humidity; June maintains comparably efficient ventilation with over 80% well-ventilated areas; March achieves over 70% adequate ventilation despite airflow obstruction, meeting reduced cooling demands given its milder 17 °C average; September requires targeted optimization as combined suboptimal zones reach 25.55% during elevated thermal stress at 27 °C average.
In summary, the permeability-enhanced design ensures effective natural ventilation, particularly under summer prevailing winds where over 80% of pedestrian zones achieve perceptible airflow. September’s wind shift causes obstruction, evidenced by 25.55% inefficient coverage, indicating targeted refinement opportunities for transitional seasons.

5.3.3. Application of the Buoyancy-Driven Ventilation Archetype

To further enhance natural ventilation and overall spatial quality in the visitor center precinct, a compound archetype—comprising water, sun-exposed surfaces, and shaded zones—was abstracted from Zhupu Village’s pond–zhuocheng–cool alley–sky well system. The design inserts water features and creates shaded areas to regulate airflow according to this archetype.
From a ventilation perspective, the temperature difference between waterbodies and hard pavements, together with the pressure difference between shaded and sunlit surfaces, drives buoyancy flows that raise air speed in the internal street (Figure 17). This mechanism mitigates residual wind-shadow pockets and stagnant zones that remain when only wind pressure is considered. During summer, the pond at the entrance plaza cools the incoming air before it moves into the internal street of the building cluster. Water features interwoven among the buildings provide additional evaporative cooling, further supporting the natural ventilation strategy.
To enhance the spatial quality of the visitor center and accommodate the primary south–north visitor flow into the scenic area, a transitional precinct between the buildings and Leiguang Road was introduced, while the internal street was designed for enhanced vibrancy. Drawing inspiration from zhuocheng and sky wells in Zhupu Village, these archetypal elements shape the front plaza and open internal street, establishing a spatially rich sequence. Additionally, water features—informed by the village’s characteristic feng-shui ponds—are integrated into the front plaza and linear pools within the open street, evoking a vivid Lingnan “water street” ambiance with cohesive spatial hierarchy.
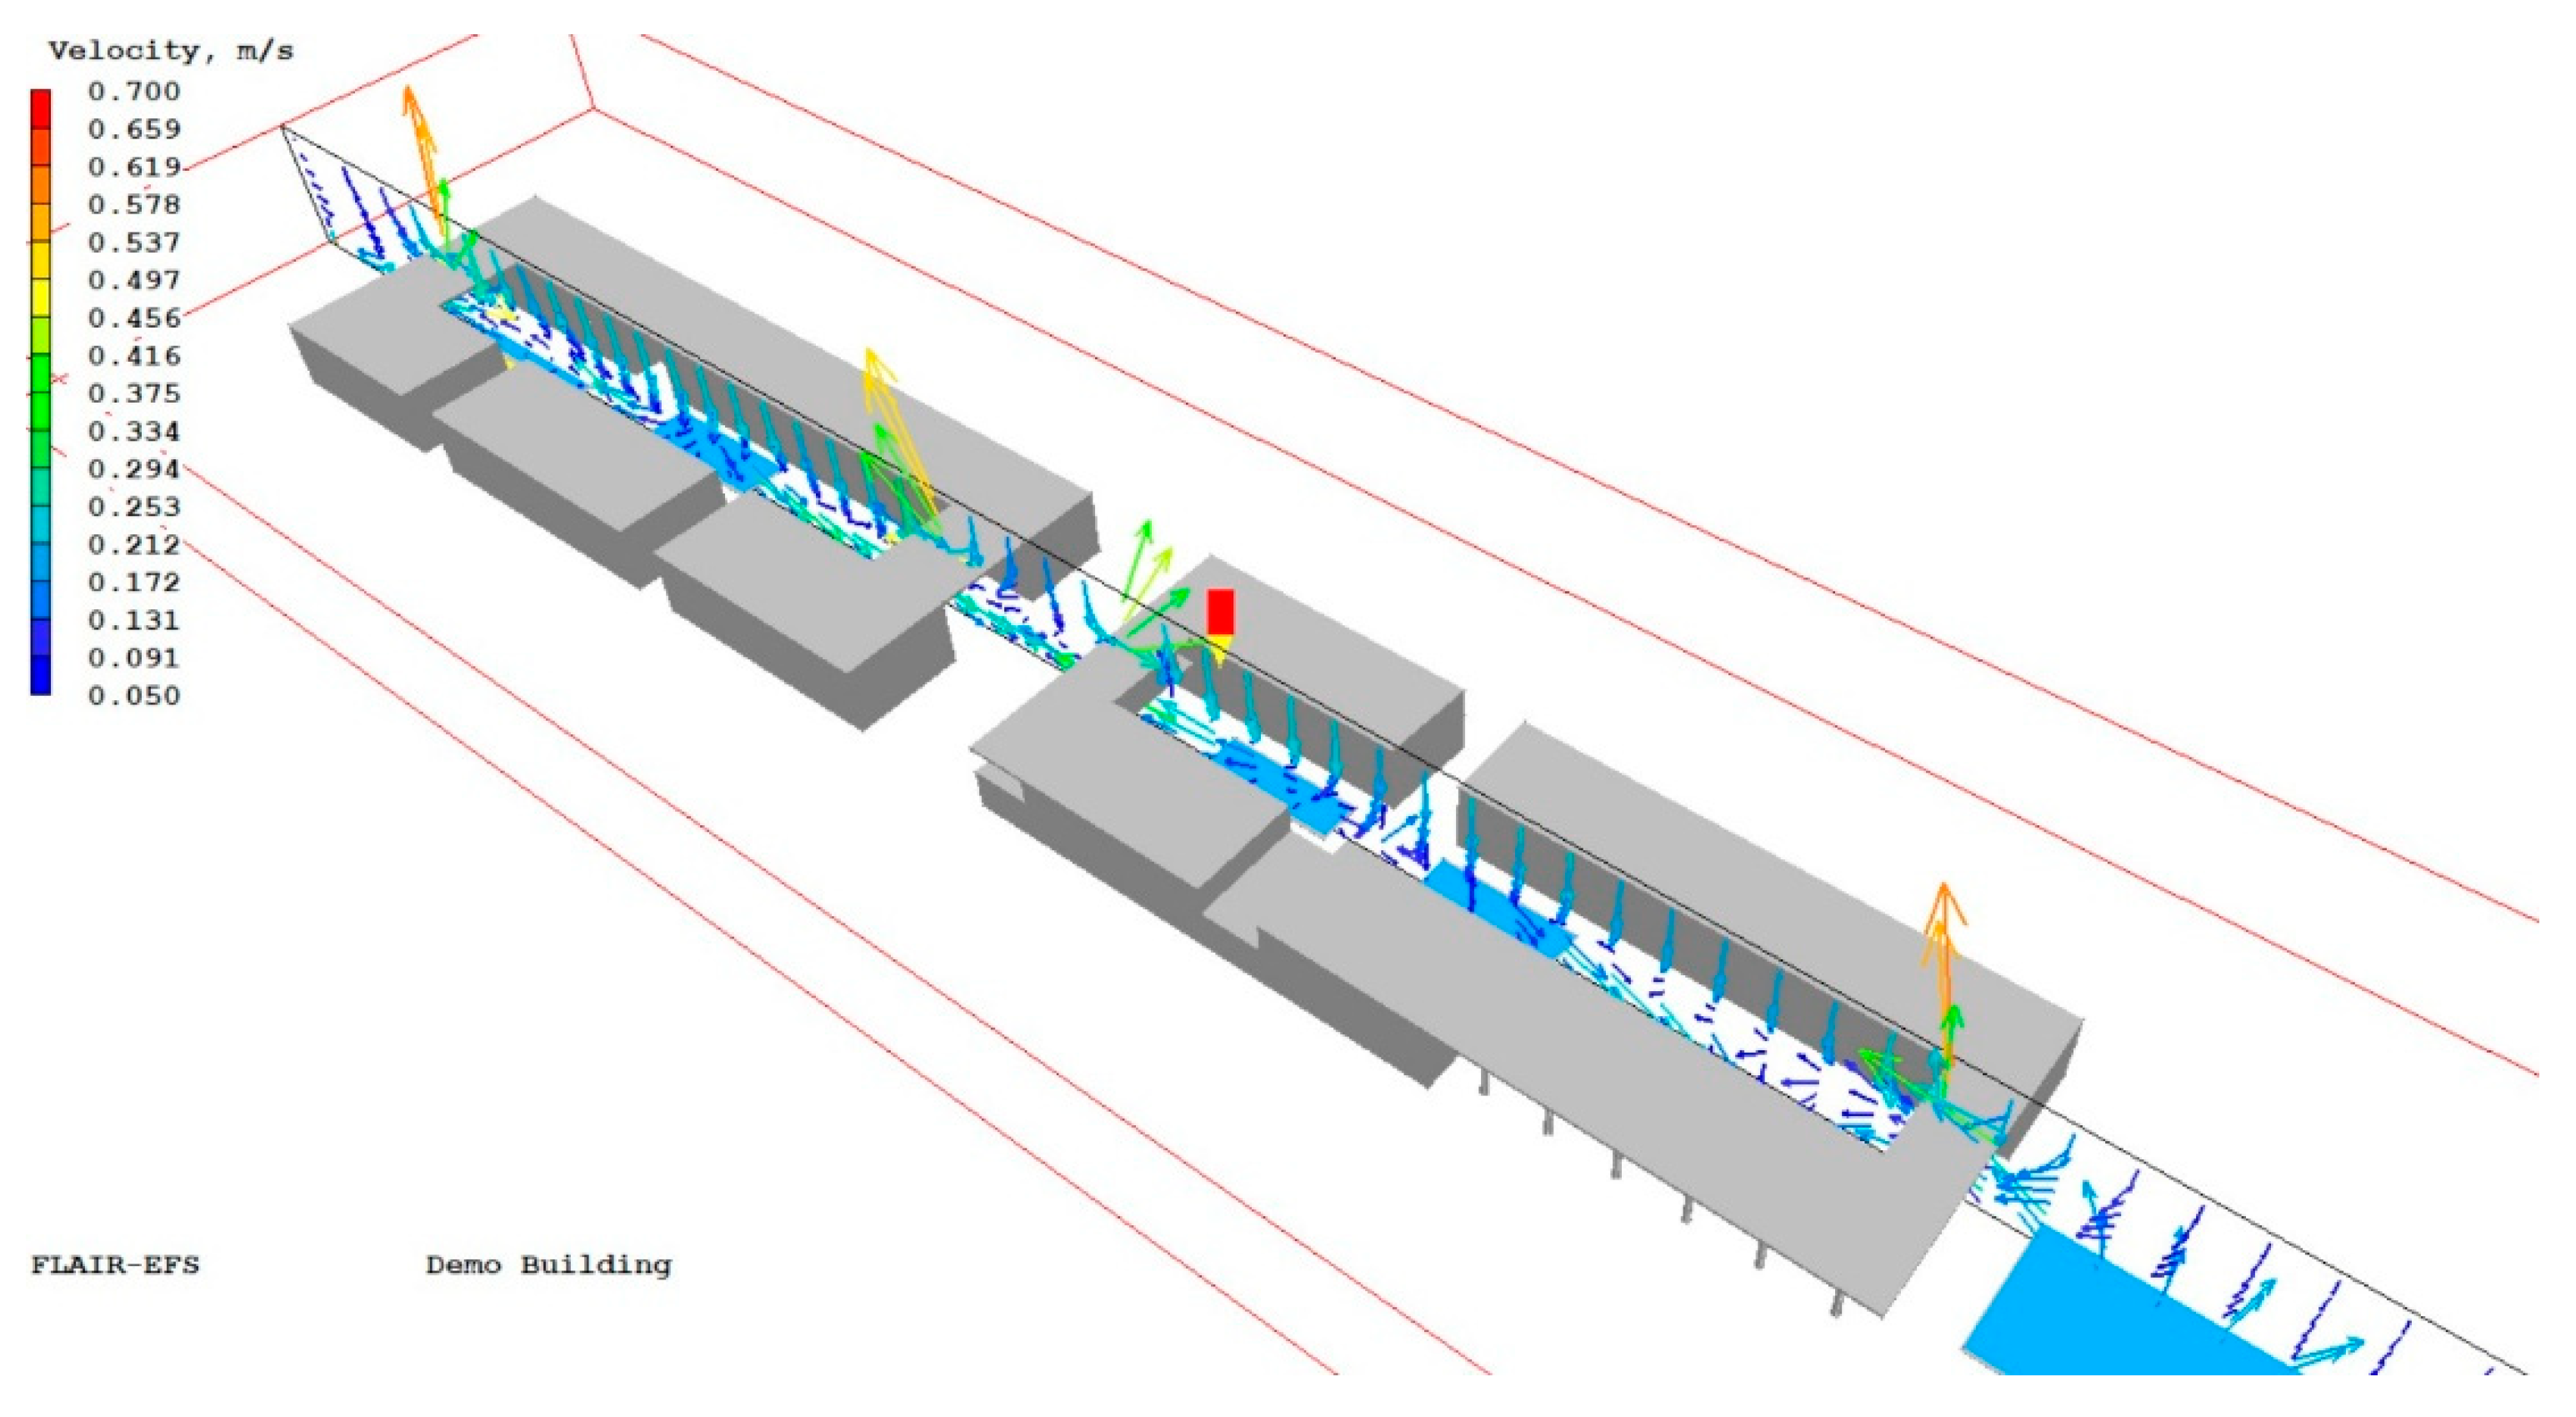
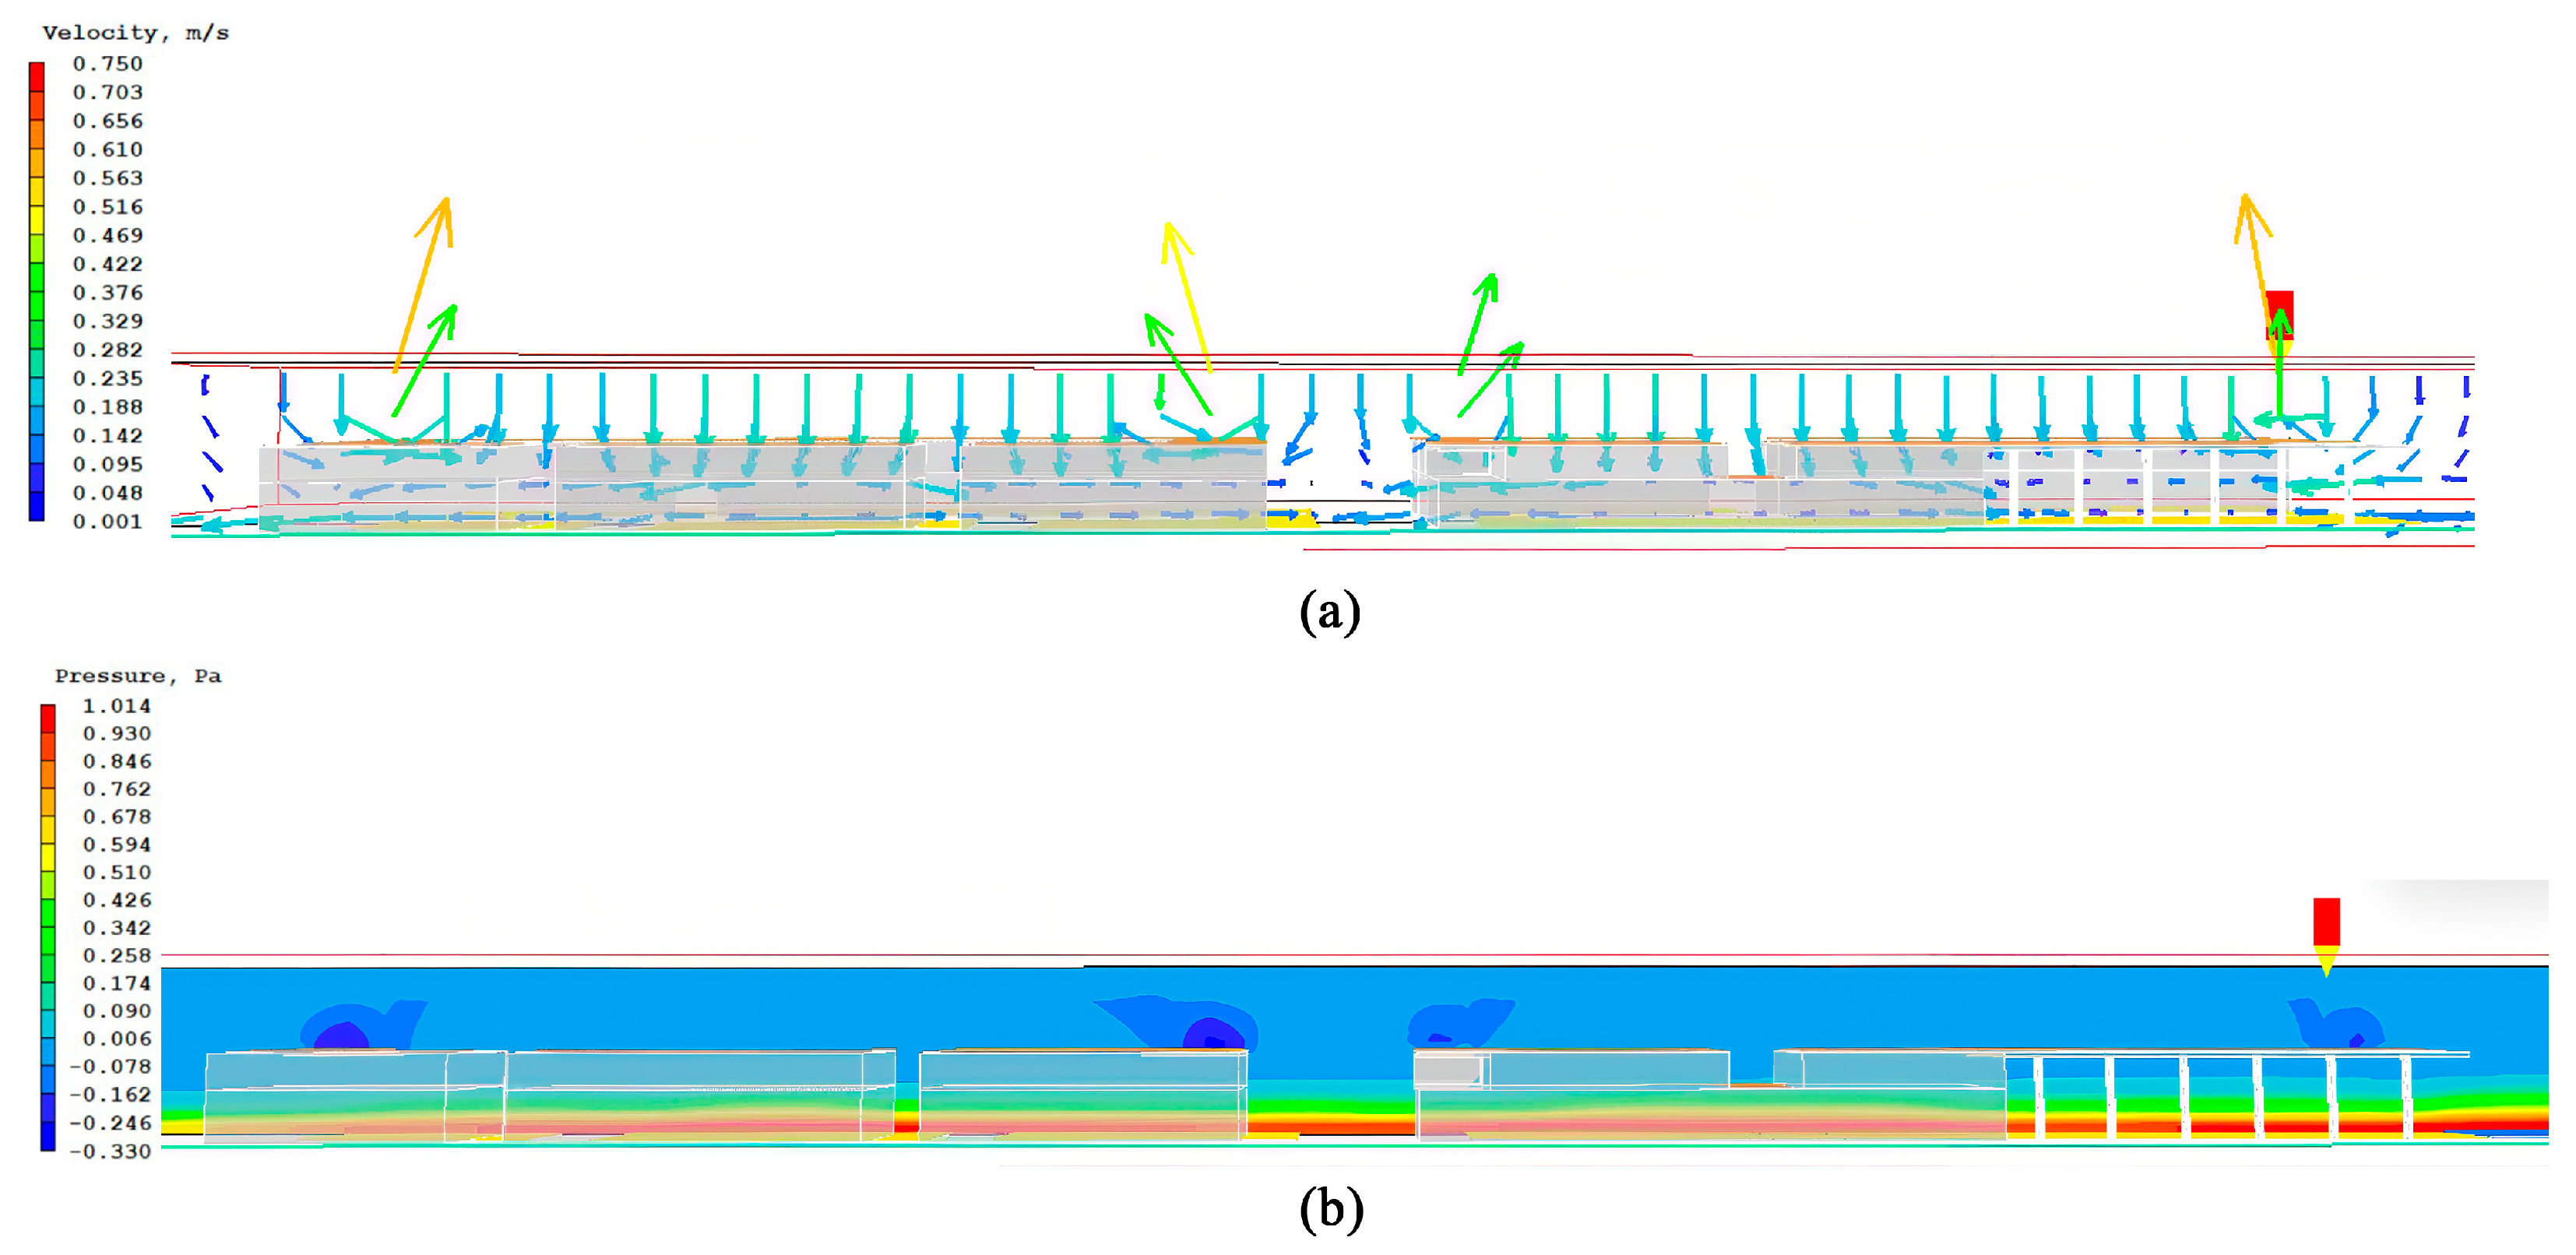
A buoyancy-driven ventilation simulation of the visitor center’s simplified model was conducted (Figure 18). Wind-vector plots demonstrate that strategically placed waterbodies and shaded zones create thermal differentials that induce airflow circulation through the internal street, with shading roofs generating a stack effect. Buoyancy-driven airflow proves weaker than wind pressure ventilation, exhibiting velocities of 0.05–0.375 m/s within the internal street and ≤0.7 m/s at roof level. Higher-velocity zones concentrate near the building cluster’s openings (Figure 19a). Within the inner street area of the visitor center, the zone near pedestrian height exhibits positive pressure of approximately 1 Pa, benefiting from abundant water features and shaded areas created by building obstructions. Concurrently, the dark roof surfaces at the top of the visitor center absorb solar radiation, generating negative pressure of 0.33 Pa beneath the four elevated roof structures over the inner street (Figure 19b). This pressure differential between the inner street and roof levels drives the formation of gentle airflow. These results confirm that buoyancy-driven airflow alone under idealized windless conditions fails to meet practical requirements, aligning with earlier simulations of the historic village archetype.
In practice, wind pressure- and buoyancy-driven ventilation operate synergistically. The spatial configuration derived from the buoyancy archetype effectively guides natural airflow, moderately increases velocity, compensates for low-speed zones, and reduces wind-shadow areas—collectively enhancing natural ventilation performance.

6. Discussion

6.1. Key Findings

The two Chaoshan archetypes perform well. A wind-driven, radially connected alley layout keeps >50% of pedestrian level space in the 0.50–1.65 m s−1 comfort band for all prevailing winds, while buoyancy-driven alleys create up drafts over sunlit roofs and a water street draws cool air from shaded lanes and ponds, pushing comfort coverage above that value in calm conditions. In the visitor center scheme, these patterns cut wind-shadow areas below 10% and show peak performance in June–July.

6.2. Contribution

Earlier Lingnan work quantified airflow but stopped at assessment [48,49]. This cluster scale framework links archetype extraction, CFD validation, and design deployment, integrating wind- and buoyancy-driven tactics at settlement-scale, rather than the component level measurements [50,51]. The method is already being built in the Zhupu visitor center, demonstrating implementation rather than theory alone.

6.3. Transferability

Because the framework relies on generic principles—wind corridors plus shaded water alleys—it can be returned to local plot sizes and facade porosity limits in other hot–humid regions. Passive elements imply modest upkeep; a life cycle cost study is planned for the next phase. By translating (not replicating) vernacular devices, the design also meets modern fire safety and accessibility codes. Compared to existing adaptive design strategies in hot–humid climates, the climate-response-archetype translation framework couples climate responsiveness with place-specific cultural identity, offering higher social acceptance when communicated to local stakeholders.

6.4. Limitations

Several limitations temper the present findings and set priorities for future work.
  • Machine learning downscaling reduces CFD errors by over 30% [68,69]; combining these techniques with on-site measurements should push the archetype framework to micro-scale accuracy.
  • Comfort was assessed only against the ASHRAE 55 air speed band, whereas many recent studies pair CFD with PMV or UTCI indices—for example, PMV maps for Bushehr dwellings [70] and UTCI grids for Guangzhou streets [71]. Coupling our CFD outputs with PMV/UTCI post-processing and field surveys will therefore give a fuller comfort picture.
  • Unlike Lyu et al. [72], who validated UTCI-based CFD with a one-day microclimate survey, this study used steady-state simulations under idealized boundaries and lacked multi-season field data; campaigns using ultrasonic anemometers, pyranometers, and IR cameras are planned.
  • PHOENICS cannot resolve latent heat exchange, so the evaporative cooling effect of small waterbodies—shown in field work to lower air temperature [73]—was omitted; ENVI-met or similar tools will be used to couple this process with airflow.
  • Aerodynamic penalties emerge in dense settings: inlet velocity drops by ~40% when plot density exceeds 0.6 [74]; deep canyons lose 30–40% of flow [75]; and facade porosity above 20% recovers only part of the loss while conflicting with heritage or structural limits [76]. Setbacks, targeted voids, and calibrated openings are therefore essential when exporting the prototype to high density sites.
  • Thermal imaging surveys and wind tunnel tests—proven aids for CFD validation [77,78]—were not performed owing to equipment constraints but remain a priority for the next phase. Addressing these issues will strengthen the framework’s reliability and broaden its applicability to other hot–humid urban contexts.

6.5. Outlook

Future work will combine field measurements, ML refined inputs, and coupled microclimate modeling to strengthen prediction accuracy; extend the framework to dense urban fabrics with tailored void/facade strategies; and quantify economic performance. These steps aim to deliver a transferable, code-compliant pathway for embedding vernacular ventilation wisdom in modern public buildings across hot–humid regions.

7. Conclusions

This study develops and validates a climate-responsive archetype framework by systematically extracting wind- and buoyancy-driven ventilation strategies from Zhupu Ancient Village and translating them into a contemporary visitor center design. CFD simulations demonstrate that over 80% of outdoor pedestrian areas in the visitor center achieve wind speeds exceeding 0.5 m/s during peak summer months, significantly reducing stagnant zones compared to conventional layouts. Unlike previous component-level analyses, this research uniquely integrates archetype extraction, simulation validation, and design application at the cluster scale, providing a practical, replicable approach for passive climate-adaptive design in hot–humid regions.

Author Contributions

Conceptualization, F.W. and Z.L.; Data Curation, Z.L.; Formal Analysis, Z.L.; Funding Acquisition, F.W. and X.X.; Investigation, Z.L. and H.L.; Methodology, Z.L. and L.L.; Project Administration, F.W., L.L. and X.X.; Software, Z.L.; Supervision, F.W. and L.L.; Validation, Z.L. and H.L.; Visualization, Z.L.; Writing—Original Draft, Z.L. and F.W.; Writing—Review and Editing, F.W., Z.L. and L.L. All authors have read and agreed to the published version of the manuscript.

Funding

Project of Guangzhou Science and Technology Bureau: Research on Climate Adaptive Renewal of Public Space in Street-Type Old Communities Based on the Synergistic Effect of Spatial Elements—A Case Study of Guangzhou; Project Number: 202201010313.

Data Availability Statement

The datasets generated during and analyzed during the current study are available from the corresponding author on reasonable request. The data are not publicly available due to privacy constraints.

Conflicts of Interest

The authors declare no conflicts of interest.

References

  1. IPCC. AR6 Synthesis Report: Climate Change 2023; Intergovernmental Panel on Climate Change: Geneva, Switzerland, 2023. [Google Scholar]
  2. Gasparrini, A.; Guo, Y.; Hashizume, M.; Lavigne, E.; Zanobetti, A.; Schwartz, J.; Tobias, A.; Tong, S.; Rocklöv, J.; Forsberg, B.; et al. Mortality risk attributable to high and low ambient temperature: A multicountry observational study. Lancet 2015, 386, 369. [Google Scholar] [CrossRef] [PubMed]
  3. Gong, W.; Li, X.; Zhou, M.; Zhou, C.; Xiao, Y.; Huang, B.; Lin, L.; Hu, J.; Xiao, J.; Zeng, W.; et al. Mortality burden attributable to temperature variability in China. J. Expo. Sci. Env. Epid. 2023, 33, 118–124. [Google Scholar] [CrossRef]
  4. Murray, C.J.L.; Aravkin, A.Y.; Zheng, P.; Abbafati, C.; Abbas, K.M.; Abbasi-Kangevari, M.; Abd-Allah, F.; Abdelalim, A.; Abdollahi, M.; Abdollahpour, I.; et al. Global burden of 87 risk factors in 204 countries and territories, 1990–2013; 2019: A systematic analysis for the global burden of disease study 2019. Lancet 2020, 396, 1223–1249. [Google Scholar] [CrossRef]
  5. Huang, D.; Zhang, L.; Gao, G.; Sun, S. Projected changes in population exposure to extreme heat in China under a RCP8.5 scenario. J. Geogr. Sci. 2018, 28, 1371–1384. (In Chinese) [Google Scholar] [CrossRef]
  6. Huang, M.; Li, Y.; Bai, P.; Yu, Z.; Yu, W.; Chen, T. Spatial evolution characteristics of population heat-stroke risk exposure in southeastern China and its driving factors. Geogr. Res. 2023, 42, 2121–2134. (In Chinese) [Google Scholar]
  7. IEA. The Future of Cooling; IEA: Paris, France, 2018. [Google Scholar]
  8. Djongyang, N.; Tchinda, R.; Njomo, D. Thermal comfort: A review paper. Renew. Sustain. Energy Rev. 2010, 14, 2626–2640. [Google Scholar] [CrossRef]
  9. Piselli, C.; Castaldo, V.L.; Pigliautile, I.; Pisello, A.L.; Cotana, F. Outdoor comfort conditions in urban areas: On citizens’ perspective about microclimate mitigation of urban transit areas. Sustain. Cities Soc. 2018, 39, 16–36. [Google Scholar] [CrossRef]
  10. Deng, Y.; Feng, Z.; Fang, J.; Cao, S.J. Impact of ventilation rates on indoor thermal comfort and energy efficiency of ground-source heat pump system. Sustain. Cities Soc. 2018, 37, 154–163. [Google Scholar] [CrossRef]
  11. Liu, W.; Deng, Q.; Ma, W.; Huangfu, H.; Zhao, J. Feedback from human adaptive behavior to neutral temperature in naturally ventilated buildings: Physical and psychological paths. Build. Environ. 2013, 67, 240–249. [Google Scholar] [CrossRef]
  12. Gou, Z.; Gamage, W.; Lau, S.S.Y.; Lau, S.S.Y. An Investigation of thermal comfort and adaptive behaviors in naturally ventilated residential buildings in tropical climates: A pilot study. Buildings 2018, 8, 5. [Google Scholar] [CrossRef]
  13. Zhou, J.; Zhang, X.; Xie, J.; Liu, J. Effects of elevated air speed on thermal comfort in hot-humid climate and the extended summer comfort zone. Energy Build. 2023, 287, 112953. [Google Scholar] [CrossRef]
  14. Ahmed, K.S. Comfort in urban spaces: Defining the boundaries of outdoor thermal comfort for the tropical urban environments. Energy Build. 2003, 35, 103–110. [Google Scholar] [CrossRef]
  15. Tantasavasdi, C.; Inprom, N. Impact of design features on natural ventilation of open-air malls in Thailand. Int. J. Low Carbon Tech. 2020, 16, 488–501. [Google Scholar] [CrossRef]
  16. Pouri, S.; Djo, A.; Rahimi, L. Exploring the effect of building form and arrangement on outdoor thermal comfort in residential complexes (case study: Tabriz city). Environ. Develop. Sustain. 2024, 27, 7817–7842. [Google Scholar] [CrossRef]
  17. Alexander, C. The Timeless Way of Building; Oxford University Press: Oxford, UK, 1979. [Google Scholar]
  18. Khalid, A. An archetype of architecture. Iconarp Int. J. Architect. 2022, 10, 503–529. [Google Scholar] [CrossRef]
  19. Pieczara, M. Archetypes in contemporary architecture. Tech. Trans. 2019, 116, 71–84. [Google Scholar] [CrossRef]
  20. Aslan, E.; Erturk, D.Z.; Erturk, S.; Piscitelli, M. Referential Interpretation of Vernacular Heritage in Recent Architectural Design. In Heritage and Technology: Mind Knowledge Experience; La Scuola di Pitagora s.r.l.: Napoli, Italy, 2015; Volume 56, pp. 104–113. [Google Scholar]
  21. Liu, S. Unearthing Shan–shui in the contemporary park: Landscape preferences are influenced by archetype. J. Asian Arch. Build. Eng. 2024. ahead of print. [Google Scholar]
  22. Li, L.; Hong, F. Energy simulation and integration at the early stage of architectural design. J. Asian Arch. Build. Eng. 2019, 19, 16–29. [Google Scholar] [CrossRef]
  23. He, M.; Li, L. Form follows environmental energy: Ecological heat in contemporary vernacular architecture. E3S Web Conf. 2019, 101, 02003. [Google Scholar] [CrossRef]
  24. He, M.; Li, L.; Tao, S. Sustainable design methods translated from the thermodynamic theory of vernacular architecture: Atrium prototypes. Buildings 2024, 14, 3142. [Google Scholar] [CrossRef]
  25. Shen, P.; Wang, H. Archetype building energy modeling approaches and applications: A review. Renew. Sustain. Energy Rev. 2024, 199, 114478. [Google Scholar] [CrossRef]
  26. Ma, Y.; Deng, W.; Xie, J.; Heath, T.; Izu Ezeh, C.; Hong, Y.; Zhang, H. A macro-scale optimisation of zero-energy design schemes for residential buildings based on building archetypes. Sol. Energy 2023, 257, 196–209. [Google Scholar] [CrossRef]
  27. Borges, P.; Travesset-Baro, O.; Pages-Ramon, A. Hybrid approach to representative building archetypes development for urban models—A case study in Andorra. Build. Environ. 2022, 215, 108958. [Google Scholar] [CrossRef]
  28. Akin, S.; Chrysogonus Nwagwu, C.; Heeren, N.; Hertwich, E. Archetype-based energy and material use estimation for the residential buildings in Arab Gulf countries. Energy Build. 2023, 298, 113537. [Google Scholar] [CrossRef]
  29. Hachem-Vermette, C.; Singh, K. Optimization of energy resources in various building cluster archetypes. Renew. Sustain. Energy Rev. 2022, 157, 112050. [Google Scholar] [CrossRef]
  30. Mata, É.; Sasic Kalagasidis, A.; Johnsson, F. Building-stock aggregation through archetype buildings: France, Germany, Spain and the UK. Build. Environ. 2014, 81, 270–282. [Google Scholar] [CrossRef]
  31. Palmer Real, J.; Møller, J.K.; Li, R.; Madsen, H. A data-driven framework for characterising building archetypes: A mixed effects modelling approach. Energy 2022, 254, 124278. [Google Scholar] [CrossRef]
  32. Arul Babu, A.D.C.; Srivastava, R.S.; Rai, A.C. Impact of climate change on the heating and cooling load components of an archetypical residential room in major Indian cities. Build. Environ. 2024, 250, 111181. [Google Scholar] [CrossRef]
  33. Schwartz, Y.; Raslan, R.; Mumovic, D. Refurbish or replace? The life cycle carbon footprint and life cycle cost of refurbished and new residential archetype buildings in London. Energy 2022, 248, 123585. [Google Scholar] [CrossRef]
  34. Sánchez, P.A.L.; Medrano, F.J.S. Sustainable Architecture in the traditional Rural Environment: Moratalla. In Vernacular Architecture: Towards a Sustainable Future; CRC Press: Boca Raton, FL, USA, 2015; pp. 449–454. [Google Scholar]
  35. Sari, L.H.; Wulandari, E.; Idris, Y. An investigation of the sustainability of old traditional mosque architecture: Case study of three mosques in Gayo Highland, Aceh, Indonesia. J. Asian Arch. Build. Eng. 2024, 23, 528–541. [Google Scholar] [CrossRef]
  36. Park, H.J.; Park, Y.K. Revitalization of environmental sustainability hidden in Yeongyeongdang. J. Asian Arch. Build. Eng. 2010, 9, 291–298. [Google Scholar] [CrossRef]
  37. Ng, J.K.P. Traditional Ventilation Skills of Lingnan Chinese architecture—A Case Study of Macau Mandarin’s House. In Proceedings of the 2nd International Civil Engineering and Architecture Conference, CEAC 2022, Singapore, 11–14 March 2022; Volume 279, pp. 556–563. [Google Scholar]
  38. Liu, Y.; Cheng, H.; Li, X. A Performance-oriented study on the archetype of traditional dwellings in Hehuang area in Qinghai province. Build. Energy Effic. 2024, 52, 58–66+130. (In Chinese) [Google Scholar]
  39. Ren, J.; Zhao, Y.; Yang, J.; Bi, S. Study on the climate responsive strategies of bayu vernacular architectural prototypes. J. Hum. Settl. West China 2024, 39, 129–135. (In Chinese) [Google Scholar]
  40. Ji, H.; Wu, S.; Ye, B.; Wang, S.; Chen, Y.; Deng, J. Exploring the Implementation Path of Passive Heat-Protection Design Heritage in Lingnan Buildings. Buildings 2023, 13, 2954. [Google Scholar] [CrossRef]
  41. Hui, X. Study on Climate Adaptation of Cold Lane–Courtyard Space System in Guangfu Traditional Villages. Master’s Thesis, South China University of Technology, Guangzhou, China, 2016. (In Chinese). [Google Scholar]
  42. Tang, L. Numerical Simulation of the Bioclimatic Design Strategies in Historic Settlements in Chinese Hot-Humid Regions. Ph.D. Thesis, Central South University, Changsha, China, 2013. (In Chinese). [Google Scholar]
  43. Chen, J. Research on Natural Ventilation System of Traditional Village in Chaoshan Area. Master’s Thesis, South China University of Technology, Guangzhou, China, 2014. (In Chinese). [Google Scholar]
  44. Lei, Y.; Zhou, H.; Li, Q.; Liu, Y.; Li, J.; Wang, C. Investigation and evaluation of insolation and ventilation conditions of streetscapes of traditional settlements in subtropical China. Buildings 2023, 13, 1611. [Google Scholar] [CrossRef]
  45. Bay, E.; Martinez-Molina, A.; Dupont, W.A. Assessment of natural ventilation strategies in historical buildings in a hot and humid climate using energy and CFD simulations. J. Build. Eng. 2022, 51, 104287. [Google Scholar] [CrossRef]
  46. Zhang, M.; Han, W.; He, Y.; Xiong, J.; Zhang, Y. Natural ventilation for cooling energy saving: Typical case of public building design optimization in Guangzhou, China. Appl. Sci. 2024, 14, 610. [Google Scholar] [CrossRef]
  47. Almhafdy, A.; Ibrahim, N.; Ahmad, S.S.; Yahya, J. Thermal performance analysis of courtyards in a hot humid climate using computational fluid dynamics CFD Method. Procedia–Soc. Behav. Sci. 2015, 170, 474–483. [Google Scholar] [CrossRef]
  48. Fang, H.; Yang, Y.; Wang, J.; Ji, X. Study on the adaptation of the outdoor wind environment of Xuzhou rural residence. Sci. Rep. 2025, 15, 23798. [Google Scholar] [CrossRef] [PubMed]
  49. Zhao, Y.; Li, K.; Han, M.; Xiong, J.; Zhang, Y. Natural ventilation in building buffer spaces of traditional Qiang dwellings: Field study in western China. Buildings 2025, 15, 794. [Google Scholar] [CrossRef]
  50. Rañeses, M.K.; Chang-Richards, A.; Wang, K.I.; Dirks, K.N. Housing for now and the future: A systematic review of climate-adaptive measures. Sustainability 2021, 13, 6744. [Google Scholar] [CrossRef]
  51. Muhy Al-din, S.; Jega, A. Implication of shading passive strategies in buildings of hot and humid climates for energy optimization: Lessons from vernacular dwellings in nigeria. J. Salutog. Arch. 2023, 2, 50–69. [Google Scholar]
  52. GB50176-2016; Code for Thermal Design of Civil Buildings. Ministry of housing and urban-rural development of the People’s Republic of China: Beijing, China, 2016. (In Chinese)
  53. Afzal, S.; Hittawe, M.M.; Ghani, S.; Jamil, T.; Knio, O.; Hadwiger, M.; Hoteit, I. The state of the art in visual analysis approaches for ocean and atmospheric datasets. Comput. Graph. Forum 2019, 38, 881–907. [Google Scholar] [CrossRef]
  54. Tang, L.; Nikolopoulou, M.; Zhao, F.Y.; Zhang, N. CFD modeling of the built environment in Chinese historic settlements. Energy Build. 2012, 55, 601–606. [Google Scholar] [CrossRef]
  55. Fang, H.; Ji, X.; Chu, Y.; Nie, L.; Wang, J. Study on skywell shape in Huizhou traditional architecture based on outdoor wind environment simulation. Sustainability 2023, 15, 8270. [Google Scholar] [CrossRef]
  56. Guo, P.; Ding, C.; Guo, Z.; Liu, T.; Lyu, T. Coupling CFD simulation and field experiments in summer to Prove Feng Shui optimizes courtyard wind environments: A case study of prince Kung’s mansion in Beijing. Buildings 2022, 12, 629. [Google Scholar] [CrossRef]
  57. Chen, H.; Zhu, S.; Ye, T.; Miao, Y. Optimizing urban ventilation in heritage settings: A computational fluid dynamics and field study in Zhao’an old town, Fujian. Buildings 2025, 15, 483. [Google Scholar] [CrossRef]
  58. Song, D. (Ed.) Energy-Saving Building Design and Technology; Tongji University Press: Shanghai, China, 2003. (In Chinese) [Google Scholar]
  59. Ng, E.; Cheng, V.; Chan, C. Urban Climatic Map and Standards for Wind Environment—Feasibility Study; Planning Department: Hong Kong, 2008. [Google Scholar]
  60. Osczevski, R.J. The basis of wind chill. Arctic 1995, 48, 372–382. [Google Scholar] [CrossRef]
  61. ANSI/ASHRAE Standard 55-2020; Thermal Environmental Conditions for Human Occupancy. American Society of Heating, Refrigerating and Air-Conditioning Engineers: Atlanta, GA, USA, 2020.
  62. ISO 7730; Ergonomics of the Thermal Environment—Analytical Determination and Interpretation of Thermal Comfort Using Calculation of the PMV and PPD Indices and Local Thermal Comfort Criteria. International Organization for Standardization (ISO): Geneva, Switzerland, 2005.
  63. U.S. Department of Energy. Cool Roofs|Energy Saver. Energy. gov: Washington, DC, USA. Available online: https://www.energy.gov/energysaver/cool-roofs (accessed on 17 July 2025).
  64. Pisello, A.L.; Rossi, F.; Cotana, F. Summer and winter effect of innovative cool roof tiles on the dynamic thermal behavior of buildings. Energies 2014, 7, 2343–2361. [Google Scholar] [CrossRef]
  65. Liao, M.C.; Sung, W.P.; Chen Shi, Q.Q. Comparing small water bodies’ impact on subtropical campus outdoor temperature: Measured vs. simulated data. Buildings 2024, 14, 1288. [Google Scholar] [CrossRef]
  66. Zhang, Y.; Zheng, Z.; Zhang, S.; Fang, Z.; Lin, Z. Exploring thermal comfort and pleasure in outdoor shaded spaces: Inspiration for improving thermal index models. Build. Environ. 2024, 265, 111933. [Google Scholar] [CrossRef]
  67. Zhou, Q. Numerical Simulation of Thermal Environment of Traditional Cold Alley in the Lingnan Area Based on Grasshopper. Master’s Thesis, Central South University, Changsha, China, 2023. (In Chinese). [Google Scholar]
  68. Hittawe, M.M.; Harrou, F.; Togou, M.A.; Sun, Y.; Knio, O. Time-series weather prediction in the Red sea using ensemble transformers. Appl. Soft Comput. 2024, 164, 111926. [Google Scholar] [CrossRef]
  69. Hittawe, M.M.; Harrou, F.; Sun, Y.; Knio, O. Stacked Transformer Models for Enhanced Wind Speed Prediction in the Red Sea. In Proceedings of the 2024 IEEE 22nd International Conference on Industrial Informatics (INDIN), Beijing, China, 18–20 August 2024. [Google Scholar]
  70. Shaeri, J.; Yaghoubi, M.; Aflaki, A.; Habibi, A. Evaluation of thermal comfort in traditional houses in a tropical climate. Buildings 2018, 8, 126. [Google Scholar] [CrossRef]
  71. Ding, X.; Zhao, Y.; Strebel, D.; Fan, Y.; Ge, J.; Carmeliet, J. A WRF-UCM-SOLWEIG Framework of 10m Resolution to Quantify the Intra-Day Impact of Urban Features on Thermal Comfort. arXiv 2023, arXiv:2310.18006. [Google Scholar]
  72. Lyu, Y.; Zhang, L.; Liu, X.; Ma, X. Microclimate-adaptive morphological parametric design of streets and alleys in traditional villages. Buildings 2024, 14, 152. [Google Scholar] [CrossRef]
  73. Peng, J.; Xie, P.; Liu, Y.; Ma, J. Urban thermal environment dynamics and associated landscape pattern factors: A case study in the Beijing metropolitan region. Remote Sens. Environ. 2016, 173, 145–155. [Google Scholar] [CrossRef]
  74. Nguyen, V.T.; Boppana, B.; Leong, J.; Poh, H.J.; Eng, Y.; Lee, I.; Tan, H.S. Analysis and assessment of natural ventilation in the design of urban precincts using an overset grid CFD approach. Build. Environ. 2025, 269, 112352. [Google Scholar] [CrossRef]
  75. Yang, A.S.; Li, Z.; Wang, H.H.; Wen, C.Y.; Lo, Y.L.; Lee, Y.T. Combined strategies of void layout and urban planning on air ventilation and pollutant removal in deep canyons. Build. Environ. 2025, 282, 113284. [Google Scholar] [CrossRef]
  76. Yuan, C.; Ng, E. Building porosity for better urban ventilation in high-density cities—A computational parametric study. Build. Environ. 2012, 50, 176–189. [Google Scholar] [CrossRef]
  77. Fabbri, K.; Costanzo, V. Drone-assisted infrared thermography for calibration of outdoor microclimate simulation models. Sustain. Cities Soc. 2020, 52, 101855. [Google Scholar] [CrossRef]
  78. Talwar, T.; Yuan, C. Impact of natural urban terrain on the pedestrian wind environment in neighborhoods: A CFD study with both wind and buoyancy-driven scenarios. Build. Environ. 2024, 261, 111746. [Google Scholar] [CrossRef]
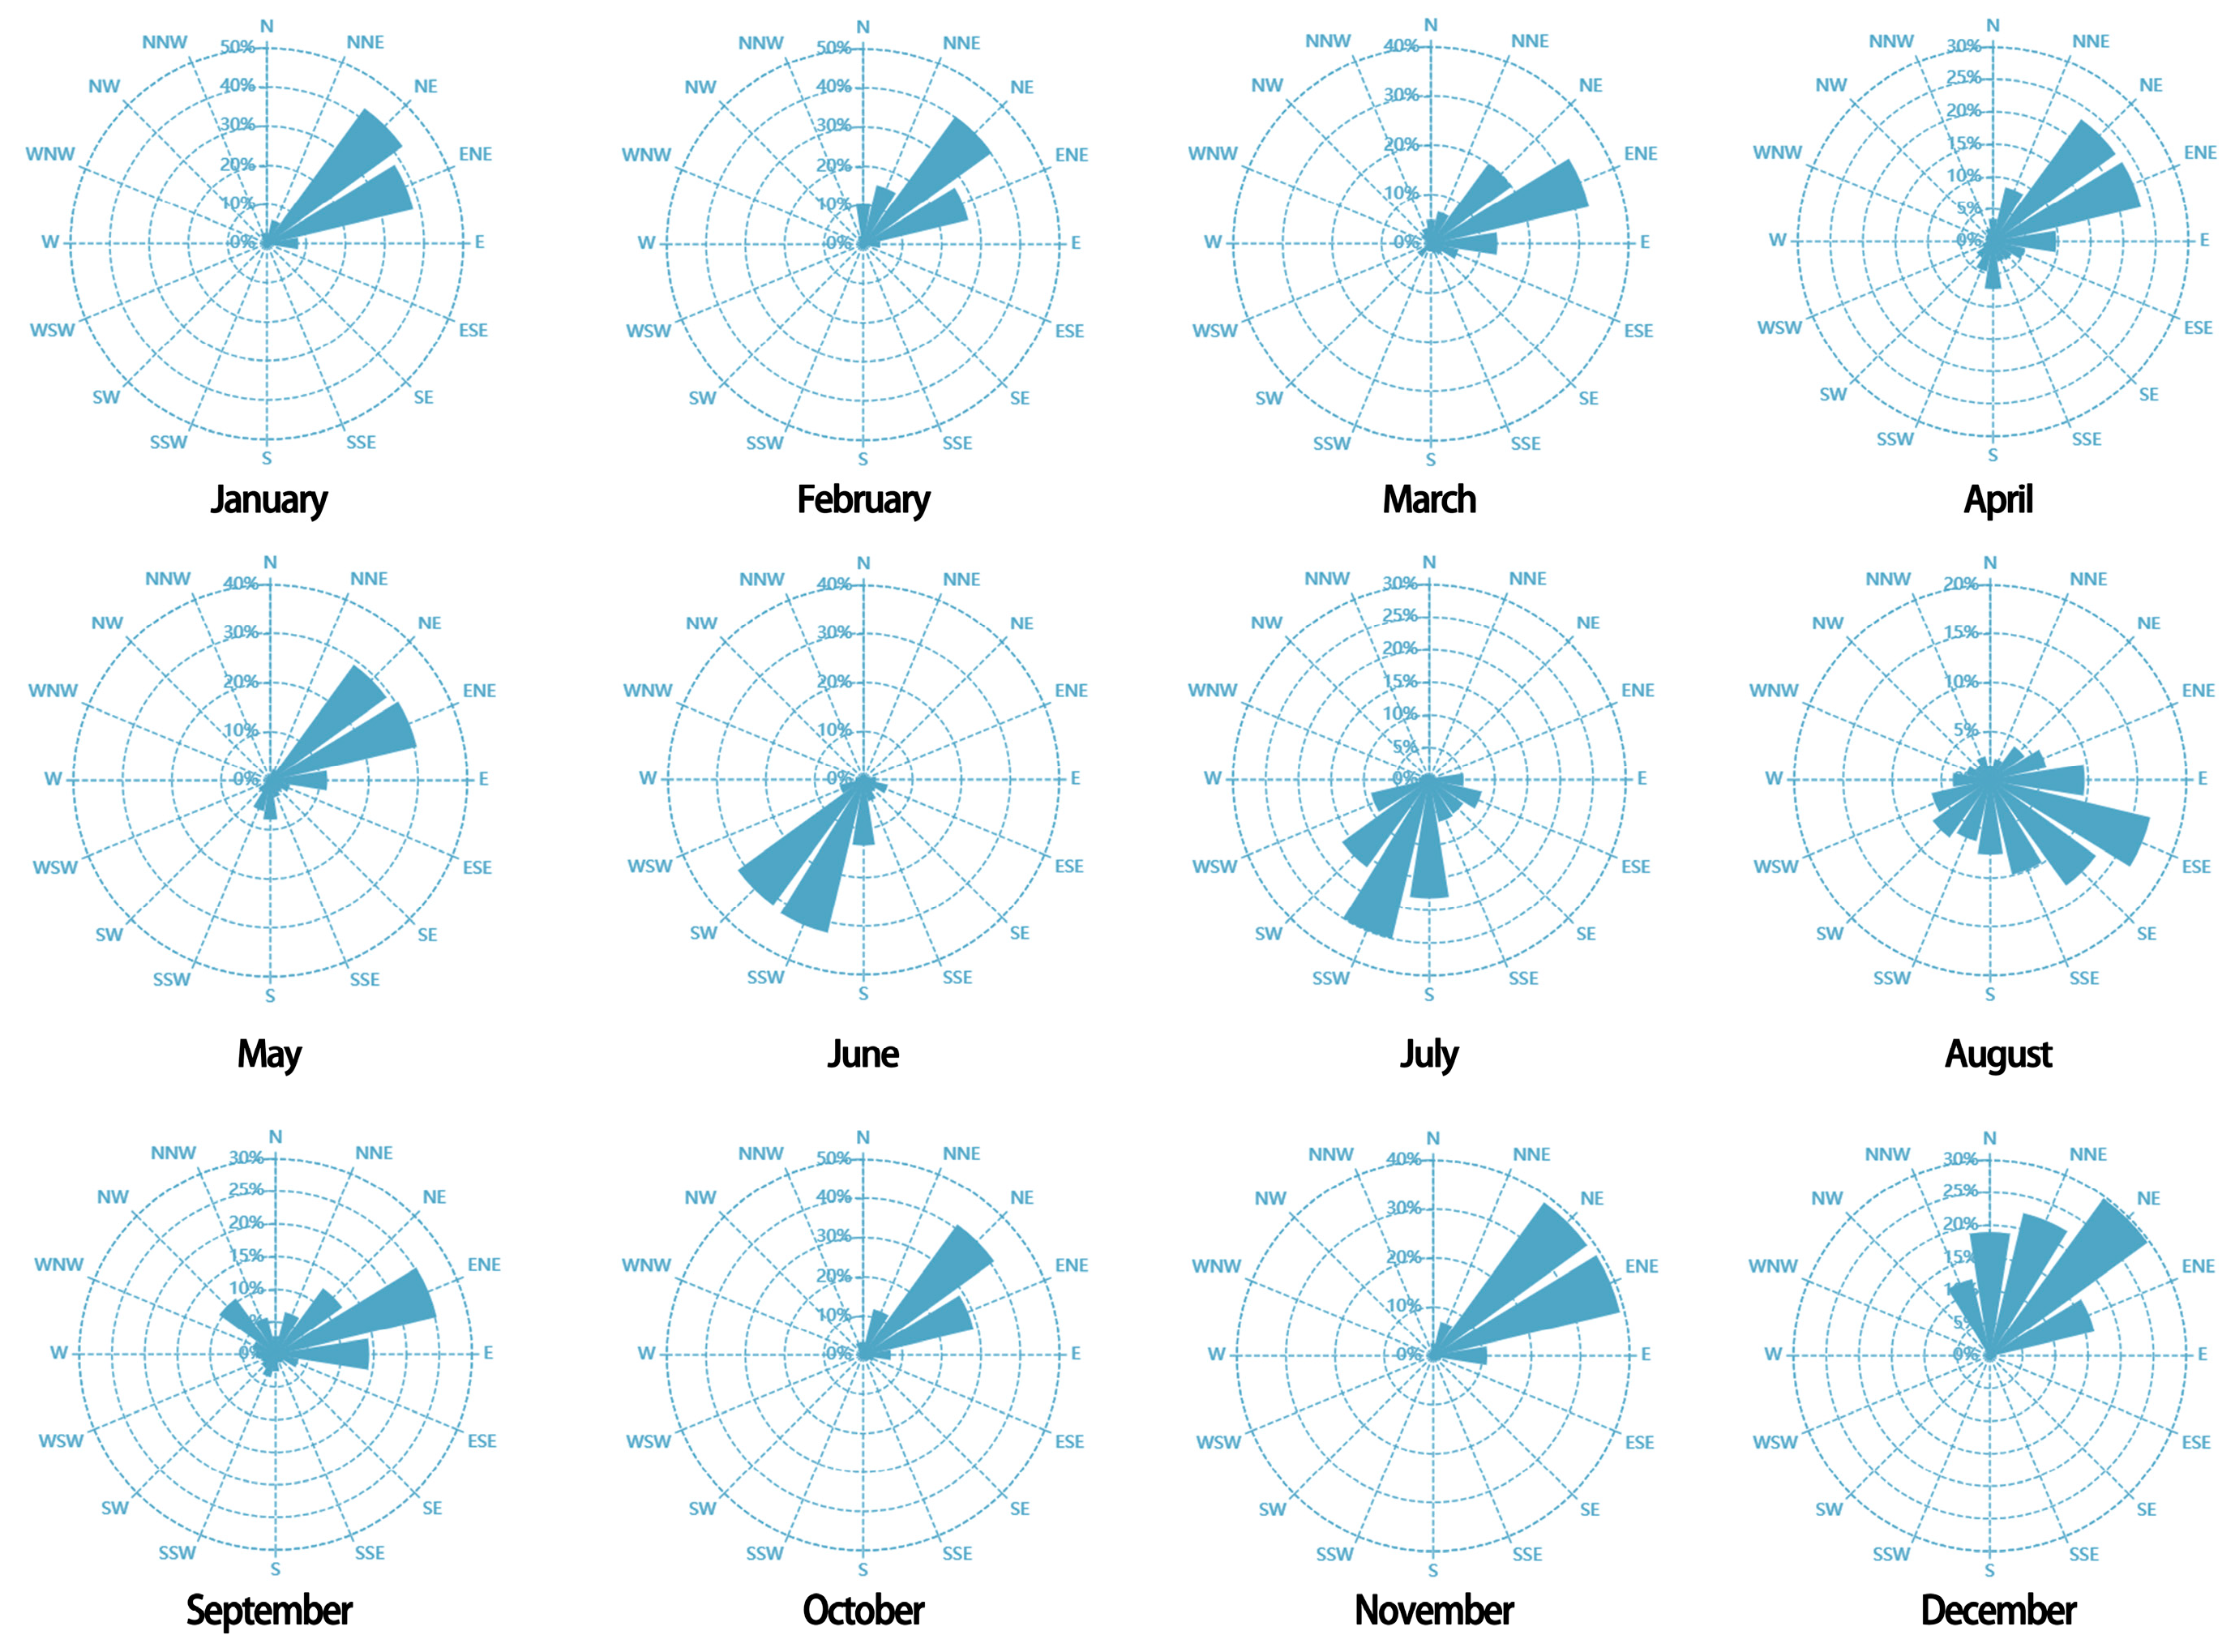
Figure 1. Monthly wind direction in Haojiang District, Shantou City throughout the year (Image source: https://xihe-energy.com/data from ECMWF, accessed on 6 August 2025).
Buildings 15 02848 g001
Figure 2. Monthly average wind speed range in Haojiang District, Shantou City (Image source: https://weatherspark.com/y/130310/Average-Weather-in-Shantou-China-Year-Round, accessed on 6 August 2025).
Buildings 15 02848 g002
Figure 3. Humidity comfort levels in Shantou (Image source: https://weatherspark.com/y/130310/Average-Weather-in-Shantou-China-Year-Round, accessed on 6 August 2025).
Buildings 15 02848 g003
Figure 4. Plan morphology and radial layout of Zhupu Ancient Village (Image source: drawn by the author).
Buildings 15 02848 g004
Figure 5. Comparison diagram of real architectural elements and simplified models (southwestern zone as an example) (Image source: drawn by the author).
Buildings 15 02848 g005
Figure 6. Detailed boundary-condition settings for wind pressure simulations. (a) Wind attributes, take June as an example; (b) FLAIR-EFS geometry settings; (c) blockage attributes (Image source: Pheonics VR simulation).
Buildings 15 02848 g006
Figure 7. Detailed boundary-condition settings for buoyancy-driven simulations. (a) Opening attributes; (b) plate attributes for sunlit roof plates; (c) plate attributes for water plates; (d) plate attributes for shaded plates (Image source: Pheonics VR simulation).
Buildings 15 02848 g007
Figure 8. Qualitative evaluation of alley types across multiple metrics (Image source: self-drawn by the author).
Buildings 15 02848 g008
Figure 9. Location of main zhuocheng platforms in village (orange highlighted) (Image source: drawn by the author).
Buildings 15 02848 g009
Figure 10. Wind-oriented settlement archetype. (a) The direction of the tunnel following the incoming wind direction. (b) The layout of the architectural complex guided the wind in the direction of the pond into the village (Image source: drawn by the author).
Buildings 15 02848 g010
Figure 11. Natural ventilation comparison between historic and new-build clusters in Zhupu Village. (a) Wind velocity and flow-vector maps for the historic village sector; (b) wind velocity and flow-vector maps for the adjacent new-build sector under the same boundary conditions (Image source: Pheonics VR simulation).
Buildings 15 02848 g011
Figure 12. Simulated shadow patterns at 06:00, 09:00, 12:00, 15:00, and 18:00 on summer solstice (Image source: drawn by the author).
Buildings 15 02848 g012
Figure 13. Schematic of buoyancy-driven ventilation mechanism in village (Image source: drawn by the author).
Buildings 15 02848 g013
Figure 14. Simulation results of buoyancy-driven ventilation in west area archetype. (a) Sectional perspective of wind flow-vector field; (b) sectional perspective of pressure contour (Image source: Pheonics VR simulation).
Buildings 15 02848 g014
Figure 15. Context diagram of visitor center and surrounding environment (Image source: drawn by the author).
Buildings 15 02848 g015
Figure 16. Conceptual diagram of visitor center design development (Image source: drawn by the author).
Buildings 15 02848 g016
Figure 17. Schematic of buoyancy-driven ventilation mechanism in visitor center’s internal street (Image source: drawn by the author).
Buildings 15 02848 g017
Figure 18. Buoyancy-driven ventilation simulation for internal street: wind-vector plot under ideal conditions (Image source: Pheonics VR simulation).
Buildings 15 02848 g018
Figure 19. Simulation results of buoyancy-driven ventilation in visitor center. (a) Sectional perspective of wind flow-vector field; (b) sectional perspective of pressure contour (Image source: Pheonics VR simulation).
Buildings 15 02848 g019
Table 1. Average high and low temperature in Shantou.
AverageJanuaryFebruaryMarchAprilMayJuneJulyAugustSeptemberOctoberNovemberDecember
High17 °C18 °C20 °C24 °C27 °C30 °C31 °C31 °C30 °C27 °C24 °C20 °C
Temp.14 °C15 °C17 °C21 °C25 °C27 °C29 °C28 °C27 °C24 °C20 °C16 °C
Low11 °C12 °C15 °C19 °C23 °C25 °C26 °C26 °C25 °C21 °C17 °C13 °C
Table 2. Inlet boundary conditions: wind speed and direction settings.
MonthMarchJuneJulySeptember
Wind speed (m/s)4.84.23.94.4
DirectionE–N–ES–WS–S–WN–E
Table 3. Dimensions and characteristics of alleyways in Zhupu Village.
CategoryFire LaneNarrow AlleyPrimary AlleyOuter Ring Road
Size range (d)d < 1.5 m2.4 m > d > 1.5 m3 m > d > 2.4 md > 3 m
Height-to-width ratio (n)n > 3n ≈ 22 > n > 1n ≈ 1
Plan locationBuildings 15 02848 i001Buildings 15 02848 i002Buildings 15 02848 i003Buildings 15 02848 i004
Section schematicBuildings 15 02848 i005Buildings 15 02848 i006Buildings 15 02848 i007Buildings 15 02848 i008
Table 4. Natural ventilation performance of village archetypes.
MarchJuneJulySeptember
Southwest prototype—wind velocity mapBuildings 15 02848 i009Buildings 15 02848 i010Buildings 15 02848 i011Buildings 15 02848 i012
Northeast prototype—wind velocity mapBuildings 15 02848 i013Buildings 15 02848 i014Buildings 15 02848 i015Buildings 15 02848 i016
Legend of prototype wind velocity mapBuildings 15 02848 i017Buildings 15 02848 i018Buildings 15 02848 i019Buildings 15 02848 i020
Southwest prototype—flow-vector field diagramBuildings 15 02848 i021Buildings 15 02848 i022Buildings 15 02848 i023Buildings 15 02848 i024
Northeast prototype—flow-vector field diagramBuildings 15 02848 i025Buildings 15 02848 i026Buildings 15 02848 i027Buildings 15 02848 i028
Table 5. Qualitative velocity classification used in image analysis.
Velocity BandWind Speed RangeColor Range on Velocity Map
Wind-shadow zone<0.50 m/sdark blue
Comfort zone0.50–1.65 m/smedium blue/light blue
Marked-cooling zone1.65–2.40 m/sbright blue/light cyan
Table 6. Daylight exposure ratings for key spatial elements on summer solstice.
Space Elements6:009:0012:0015:0018:00Legend
Roof244434 fully sunlit
Narrow alleys123213 predominantly sunlit
Primary alleys134312 predominantly shaded
Zhuocheng144421 fully shaded
Table 7. The natural ventilation performance of the visitor center derived from the archetype.
MarchJuneJulySeptember
Visitor center—wind velocity map (min = 0)Buildings 15 02848 i029Buildings 15 02848 i030Buildings 15 02848 i031Buildings 15 02848 i032
Legend of visitor center wind velocity map (min = 0)Buildings 15 02848 i033Buildings 15 02848 i034Buildings 15 02848 i035Buildings 15 02848 i036
Visitor center—wind velocity map (min = 0.5)Buildings 15 02848 i037Buildings 15 02848 i038Buildings 15 02848 i039Buildings 15 02848 i040
Legend of visitor center wind velocity map (min = 0.5)Buildings 15 02848 i041Buildings 15 02848 i042Buildings 15 02848 i043Buildings 15 02848 i044
Visitor center—comparative airflow diagramBuildings 15 02848 i045Buildings 15 02848 i046Buildings 15 02848 i047Buildings 15 02848 i048
Visitor center—flow-vector field diagramBuildings 15 02848 i049Buildings 15 02848 i050Buildings 15 02848 i051Buildings 15 02848 i052
Disclaimer/Publisher’s Note: The statements, opinions and data contained in all publications are solely those of the individual author(s) and contributor(s) and not of MDPI and/or the editor(s). MDPI and/or the editor(s) disclaim responsibility for any injury to people or property resulting from any ideas, methods, instructions or products referred to in the content.