Article

Efficient Hyperparameter Optimization Using Metaheuristics for Machine Learning in Truss Steel Structure Cross-Section Prediction

1
School of Industrial Design & Architectural Engineering, Korea University of Technology & Education, 1600 Chungjeol-ro, Byeongcheon-myeon, Cheonan 31253, Republic of Korea
2
Faculty of Civil Engineering, Wrocław University of Science and Technology, Wybrzeże Wyspiańskiego 27, 50-370 Wrocław, Poland
*
Author to whom correspondence should be addressed.
Buildings 2025, 15(15), 2791; https://doi.org/10.3390/buildings15152791
Submission received: 2 July 2025 / Revised: 28 July 2025 / Accepted: 5 August 2025 / Published: 7 August 2025
(This article belongs to the Special Issue Research on Structural Analysis and Design of Civil Structures)

Abstract

The optimal design of truss structures is one of the most complex problems, as it requires achieving high stiffness and stability while pursuing lightweight structures. With the recent advancements in AI technologies, machine learning-based approaches for predicting the optimal cross-sectional areas of truss structures have garnered significant attention from researchers. However, the design problem of truss structures poses substantial challenges for machine learning models due to the highly diverse and nonlinear characteristics of the optimal cross-sectional distributions, which may hinder effective learning. To address these limitations, the importance of hyperparameter optimization (HPO) has been increasingly recognized. This paper employs metaheuristic algorithms, which are efficient in searching for global optima, to perform HPO on 10-bar and 17-bar truss structure datasets. By balancing exploitation and exploration capabilities, metaheuristic algorithms demonstrate superior performance and time efficiency compared to conventional HPO methods. The results underscore the critical role of hyperparameters in machine learning-based truss structure design and suggest that leveraging metaheuristic algorithm-based HPO holds significant potential for addressing complex structural design problems in future applications.

1. Introduction

Truss structures are widely used structural mechanisms in architectural and civil engineering because they provide high stiffness and stability while maintaining a lightweight design. They are commonly applied in large-scale structures such as bridges, towers, and buildings. Additionally, due to their geometric characteristics, truss structures resist external loads primarily through axial forces, which enhances their resistance to torsion and deformation while maximizing the efficiency of load distribution. The optimization of cross-sectional areas for truss structures under various loading conditions has long been a subject of interest for many researchers. In this regard, numerous approaches have been proposed for truss structure size, shape, and topology optimization [1]. In particular, as the number of variables grows, their interactions become more complex. This highlights the need for advanced design techniques and diverse analytical methods leveraging state-of-the-art technologies such as machine learning and quantum computing [2].
Machine learning presents new opportunities for addressing the high computational costs and complexity of design variables inherent in traditional truss structure design. By modeling nonlinear relationships and learning significant patterns from multidimensional data, machine learning can significantly enhance the efficiency and accuracy of the design process. Several applications of machine learning in structural design and evaluation have been reported, as detailed below. In 2001, El-Kassas et al. identified the challenges of extensive iterative processes and high costs associated with optimal design in cold-formed steel structures [3]. To address these issues, they proposed using neural networks and demonstrated their effectiveness and efficiency in structural design. In 2009, Cheng and Li introduced a novel hybrid artificial neural network (ANN) for structural optimization and successfully applied it to problems involving simple beams and 10bar truss structures [4]. Their approach drastically reduced the size of the training dataset while accurately estimating the optimal solutions. In 2018, Yin and Zhu employed ANN for vibration-based structural health monitoring of steel truss bridge structures and validated the importance of network optimization in achieving accurate results [5]. In 2021, Liu et al. used an ANN model for cable truss structural health monitoring, confirming the reliability and consistency of their prediction outcomes [6]. In 2023, Mai et al. proposed a deep neural network (DNN)-based parameterization framework to address the optimal design of constrained truss structures [7]. By integrating DNN with Bayesian optimization (BO), they demonstrated that their model achieved high reliability and efficiency when applied to 25-bar space truss, 52-bar dome truss, 56-bar space truss, and 120-bar dome truss structures. Beyond these examples, numerous other studies have applied machine learning to truss structure design, verifying its efficiency and potential [8,9,10,11,12].
Numerous researchers have studied the significance of hyperparameter optimization (HPO) in machine learning since the 1990s [13,14]. HPO plays a critical role in maximizing the performance of machine learning models and preventing overfitting. This is particularly important for large datasets, complex models, or deep neural networks, which are highly dependent on hyperparameters. The importance of HPO can be summarized as follows:
  • Reducing human effort: HPO minimizes the manual labor required to apply machine learning effectively [15].
  • Enhancing reproducibility and fairness: HPO enhances reproducibility and fairness, thereby facilitating more equitable comparisons between models [16,17].
As the complexity of problems in HPO increases, finding the global optimum becomes even more critical, requiring a balanced performance between exploitation and exploration. Commonly used methods for HPO include Grid Search (GS), Random Search (RS), and BO. GS performs learning and compares performance results based solely on user-defined hyperparameter values, which makes it challenging to evaluate its exploitation and exploration capabilities. To address this limitation, RS was introduced, which selects hyperparameter values randomly within the given range, thereby improving exploration performance. BO balances exploitation and exploration by determining the utility of various candidate points [15] and has demonstrated its efficiency across various problems. However, if the balance between exploitation and exploration is not maintained, finding the global optimum becomes challenging, and the method may require significant computational time [18]. To overcome these drawbacks, metaheuristic algorithms have been increasingly applied in HPO. These algorithms perform exploitation and exploration probabilistically and have proven to be highly efficient in finding global optimal solutions.
As validated by numerous researchers, the balance between exploitation and exploration capabilities in metaheuristic algorithms significantly impacts their convergence performance [19]. Exploitation emphasizes refining the local search, while exploration broadens the global search for identifying global optima [20]. Recognized for their effectiveness in solving NP-hard problems, metaheuristic algorithms have been increasingly applied to HPO [21], with studies demonstrating their potential to enhance machine learning performance. Nematzadeh et al. highlighted that the growing volume of data in biology and biomedicine has increased computational costs and noted that current efforts to optimize hyperparameters for enhancing machine learning performance are not adequately addressing the growing computational costs [22]. Their study employed genetic algorithm (GA) and grey wolf optimization (GWO) for HPO, confirming that metaheuristic algorithms outperform GS. Bacanin et al. emphasized the importance of fine-tuning hyperparameters in LSTM (long short-term memory) models for energy forecasting and demonstrated improved performance using various metaheuristic algorithms, including GA, particle swarm optimization (PSO), artificial bee colony (ABC), firefly algorithm (FA), bat algorithm (BA), and sine cosine algorithm (SCA) [23]. In another study, Nair and Arivazhagan applied adaptive tunicate swarm optimization (ATSO), whale optimization algorithm (WOA), Rao-3, and driving training-based optimization (DTBO) to process data in active sludge systems in the textile industry. Their findings revealed that Rao-3 achieved the best performance [24]. Such applications of metaheuristic algorithms for HPO have consistently demonstrated their ability to improve machine learning performance and have been widely utilized across various engineering fields [25]. However, the importance of HPO remains underappreciated in the field of architecture. Many studies either neglect HPO entirely or rely solely on GS, RS, or BO to perform simple optimization tasks. Validating the effectiveness of metaheuristic algorithm-based HPO is crucial for improving the prediction accuracy of cross-sectional areas in various truss structures. In this study, we selected a diverse set of metaheuristic algorithms—including PSO, GWO, HSA, CSA, and ACO—based on their distinct exploration and exploitation strategies, ease of implementation, and proven efficiency in global optimization across various engineering problems. While previous studies such as Kazemi et al. [26] focused on optimizing high-level machine learning model parameters (e.g., for XGBoost, RF, or Stacked ML models), our work focuses specifically on tuning the internal hyperparameters of a lightweight ANN model for predicting cross-sectional areas in structural engineering contexts. Moreover, unlike existing studies that use metaheuristics to improve predictive accuracy on conventional tabular data, this research is grounded in structural mechanics, with datasets generated from truss structure optimization tasks. This highlights the practicality of our approach and its potential integration into actual design workflows. By addressing both prediction accuracy and computational efficiency through algorithmic comparison, this paper contributes novel insights to both the machine learning and structural engineering communities.
This study uses conventional methods and various metaheuristic algorithms to perform HPO on a 2D truss structure dataset. The performance results are then compared and analyzed to determine the most suitable HPO method for the 2D truss structure dataset. Furthermore, the proposed prediction model can be incorporated into real-world truss design workflows to efficiently generate feasible cross-sectional configurations based on minimal input, thereby reducing reliance on repetitive structural analysis in early design stages. The structure of this paper is as follows: Section 2 explains the methodologies employed for HPO in this study. Section 3 provides an overview of the 2D truss structure model used. Section 4 presents the results of HPO, comparing and analyzing the performance of conventional methods and metaheuristic algorithms. Section 5 concludes the paper with a summary of the findings.

2. Methodology

This study follows the workflow illustrated in Figure 1. A dataset of minimum cross-sectional areas for truss structures is constructed under various conditions using the advanced crow search algorithm (ACSA). The generated dataset is subjected to different normalization methods to compare the resulting performance, and the most effective normalization method is selected. The normalized dataset is then split into training (80%) and validation (20%) subsets, and HPO is performed using the training data. HPO is conducted using conventional methods such as GS, RS, and BO, as well as metaheuristic algorithms, including crow search algorithm (CSA), GA, ant colony optimization (ACO), GWO, harmony search algorithm (HAS), and PSO. The training and validation results are evaluated based on mean squared error (MSE), mean absolute error (MAE), and the R2 metric to compare and identify the HPO method yielding the best performance. MATLAB R2023a is used for weight optimization of the truss structures, while PyCharm v3.13.5 is employed for cross-sectional area prediction using machine learning models. The computations were performed on a system with an i9-13900H 2.6GHz CPU and 32 GB of RAM.

2.1. Data Collection

Training machine learning models require large datasets. However, acquiring datasets related to the cross-sectional areas of truss structures is challenging. Therefore, this study utilizes the ACSA, a metaheuristic algorithm, to optimize the weight of truss structures and generate datasets under various conditions. ACSA is an improved version of the CSA, inspired by the foraging behavior of crows. It incorporates three additional methods to improve upon the original algorithm [27,28], and its improved convergence performance has been demonstrated using benchmark functions and engineering problems. ACSA performs optimization in five steps.
Step 1: Define the optimization problem and configure the parameters for ACSA. The parameters include D (dimension of the problem), tmax (maximum iteration), N (flock size), fl (flight length), APmax (maximum awareness probability), APmin (minimum awareness probability), and FAR (flight awareness ratio).
Step 2: The positions of the crows are initialized, as shown in Equation (1), and their initial positions are evaluated. Each design variable ( x N D ) is assigned a random value within the range specified by the problem.
Crows   position = x 1 1 x 1 D x N 1 x N D
Step 3: The initial positions of the crows are updated based on the following procedure. If a random number is greater than or equal to the AP, the position is adjusted using the existing crow position. Conversely, if the random number is less than AP, the crow position is adjusted randomly. ACSA employs a dynamic AP that varies with the number of generations, defined by Equation (2), where t represents the current generation. Due to the dynamic AP, exploration is emphasized during the early generations, while exploitation becomes predominant in the later generations.
A P = A P m i n + A P m a x A P m i n ln t + 1
If the random number is greater than or equal to AP, the crow position is updated using Equation (3). Here, r, m t , and g b t denote a random number between 0 and 1, a randomly selected crow position from the t-th generation, and the best position in the t-th generation, respectively. On the other hand, if the random number is less than AP, the crow position is updated randomly using Equation (4). In this case, lower boundary (lb) and upper boundary (ub) are the problem-specific boundaries defined in Step 1.
x t + 1 = x t + r × f l × m t x t   x t + r × f l × g b t x t i f   r   F A R e l s e
x t + 1 = 2 x t + l b ( l b u b ) × r l b ( l b u b ) × r i f   r   0.5 e l s e
Step 4: The fitness values of the current positions are compared with those of the updated positions, and the better positions are retained for further iterations. This process is repeated until t reaches tmax.
Step 5: The final results are obtained. The parameters of ACSA used for weight optimization of truss structures in this study are summarized in Table 1. The weight optimization for each problem is performed 15 times to ensure reliability.

2.2. Hyperparameter Optimization

The predictive performance of ANNs heavily depends on the configuration of hyperparameters, such as hidden layer size, number of neurons, activation function, learning rate, batch size, and epochs. Improper hyperparameter values can degrade performance, slow convergence, or even lead to training failure. This is particularly critical when dealing with complex datasets or those containing numerous outliers, where appropriate hyperparameter tuning becomes essential. HPO can be defined as shown in Equation (5), where f(x) represents the objective score, which is the MSE in this study. The x* denotes the set of hyperparameters that yield the minimum objective score, and x can take any value within the domain X [29,30]. In essence, the goal of HPO is to identify the optimal hyperparameters that deliver the best performance based on the user-defined hyperparameter values or ranges.
x * = arg m x X f ( x )
The commonly used methods for HPO include GS, RS, and BO. GS involves manually defining the range and intervals for each hyperparameter and systematically exploring all possible combinations of the defined hyperparameter values. While simple to implement, GS suffers from a significant drawback: the number of evaluations increases exponentially as the number or range of hyperparameters grows. This inefficiency in exploring high-dimensional configuration spaces is often referred to as the “curse of dimensionality” [18,31]. To address the limitations of GS, Bergstra and Bengio proposed applying RS for HPO [32]. RS is similar to GS but selects random values within the user-defined hyperparameter ranges. It is generally more efficient in high-dimensional configuration spaces compared to GS. However, it requires careful consideration of continuous and discrete hyperparameter settings, and its randomness can make it challenging to locate the global optimal solution. Among the widely used HPO methods, BO stands out for its efficiency. It leverages previous search results to inform subsequent searches [33]. By utilizing prior results, BO can achieve high performance with fewer evaluations and increase the likelihood of finding the global optimal solution. However, it is more complex to implement and may involve significant computational costs.
To perform HPO using metaheuristic algorithms, an initial matrix, as defined in Equation (6), is required. In this matrix, HP represents the hyperparameters to be optimized, d denotes the number of hyperparameters, and n is the population size. The defined initial matrix is adjusted based on the core equations of each metaheuristic algorithm to update the hyperparameter values.
Initial   matrix = H P 1 1 H P 1 d H P n 1 H P n d
The defined initial matrix is adjusted using the core mathematical equations of each metaheuristic algorithm. As described earlier in Section 2.1, CSA is inspired by the foraging behavior of crows. It is simple to apply to engineering problems and requires fewer parameters [34]. Proposed by Holland in 1992, GA mimics Darwin’s theory of natural selection and survival of the fittest [35]. Optimization is performed using chromosome representation, fitness selection, and biologically inspired operators [36]. Introduced by Dorigo in 1992, ACO mimics the collective behavior of ants in finding and transporting food [37]. Ants leave pheromone trails on their paths, influencing subsequent ants and enabling them to find the shortest path [38,39]. GWO simulates the hierarchical leadership and hunting mechanisms of grey wolves. Optimization is achieved through stages of hunting, prey searching, prey encircling, and prey attacking [40]. GWO is considered a powerful optimization algorithm due to its adaptability, parameter-free nature, non-reliance on differentiation, low memory and computational requirements, and robust convergence [41]. Proposed by Geem et al. in 2001 [42], HSA mimics the behavior of musicians searching for the best harmony while playing various instruments [42]. HSA does not require a deep mathematical background, is computationally simple to implement, and converges quickly [43]. Developed by Kennedy and Eberhart in 1995, PSO is inspired by the collective behavior of animals [44,45]. PSO does not require function derivatives or continuity and is characterized by its fast convergence [46]. Metaheuristic algorithms demonstrate exceptional efficiency in searching for global optima, attributed to their robust exploitation and exploration capabilities and the effective balance between them. Considering the characteristics of the 10-bar and 17-bar truss structure datasets and the nonlinear hyperparameter space, this study evaluates the performance of HPO using metaheuristic algorithms.

3. Definition of 2D Truss Structures

This study evaluates the convergence performance of hyperparameter optimization methods using 10-bar and 17-bar truss structures. The objective function for the optimal cross-sectional design of truss structures is defined in Equation (7), aiming to minimize the weight of the structure. If the structural state at the current generation (t) violates the constraints, a penalty (fpenalty = 104) is imposed. In the objective function, n , ρ , and L represent the number of elements, density, and length of elements, respectively. A denotes the cross-sectional area of the members, which has predefined minimum and maximum bounds. The constraints are defined in Equation (8), which account for the yield strength ( σ y ) of the members and the maximum nodal displacement ( δ m a x ) [47,48,49].
To   minimize   F x = i = 1 n ρ i A i L i × f p e n a l t y
( A m i n A i A m a x )
Subject   to   g 1 x   :   σ y σ ,   g 2 x   :   δ m a x δ

3.1. The 10-Bar Truss Structure

The configuration of the 10-bar truss structure is shown in Figure 2. It consists of 10 members and 6 nodes. The elastic modulus and density of the structure are 10,000 ksi and 0.1 lb/in3, respectively. The minimum and maximum cross-sectional areas are 0.1 in2 and 35.0 in2, respectively. The applied loads, maximum member stress, and maximum nodal displacement are used to generate various datasets as specified in Table 2. The applied loads range from 10 kips to 160 kips, with an increment of 10 kips. The maximum member stress ranges from 19 ksi to 31 ksi, with an increment of 2 ksi. The maximum nodal displacement ranges from 0.5 in to 3.5 in, with an increment of 0.5 in.

3.2. The 17-Bar Truss Structure

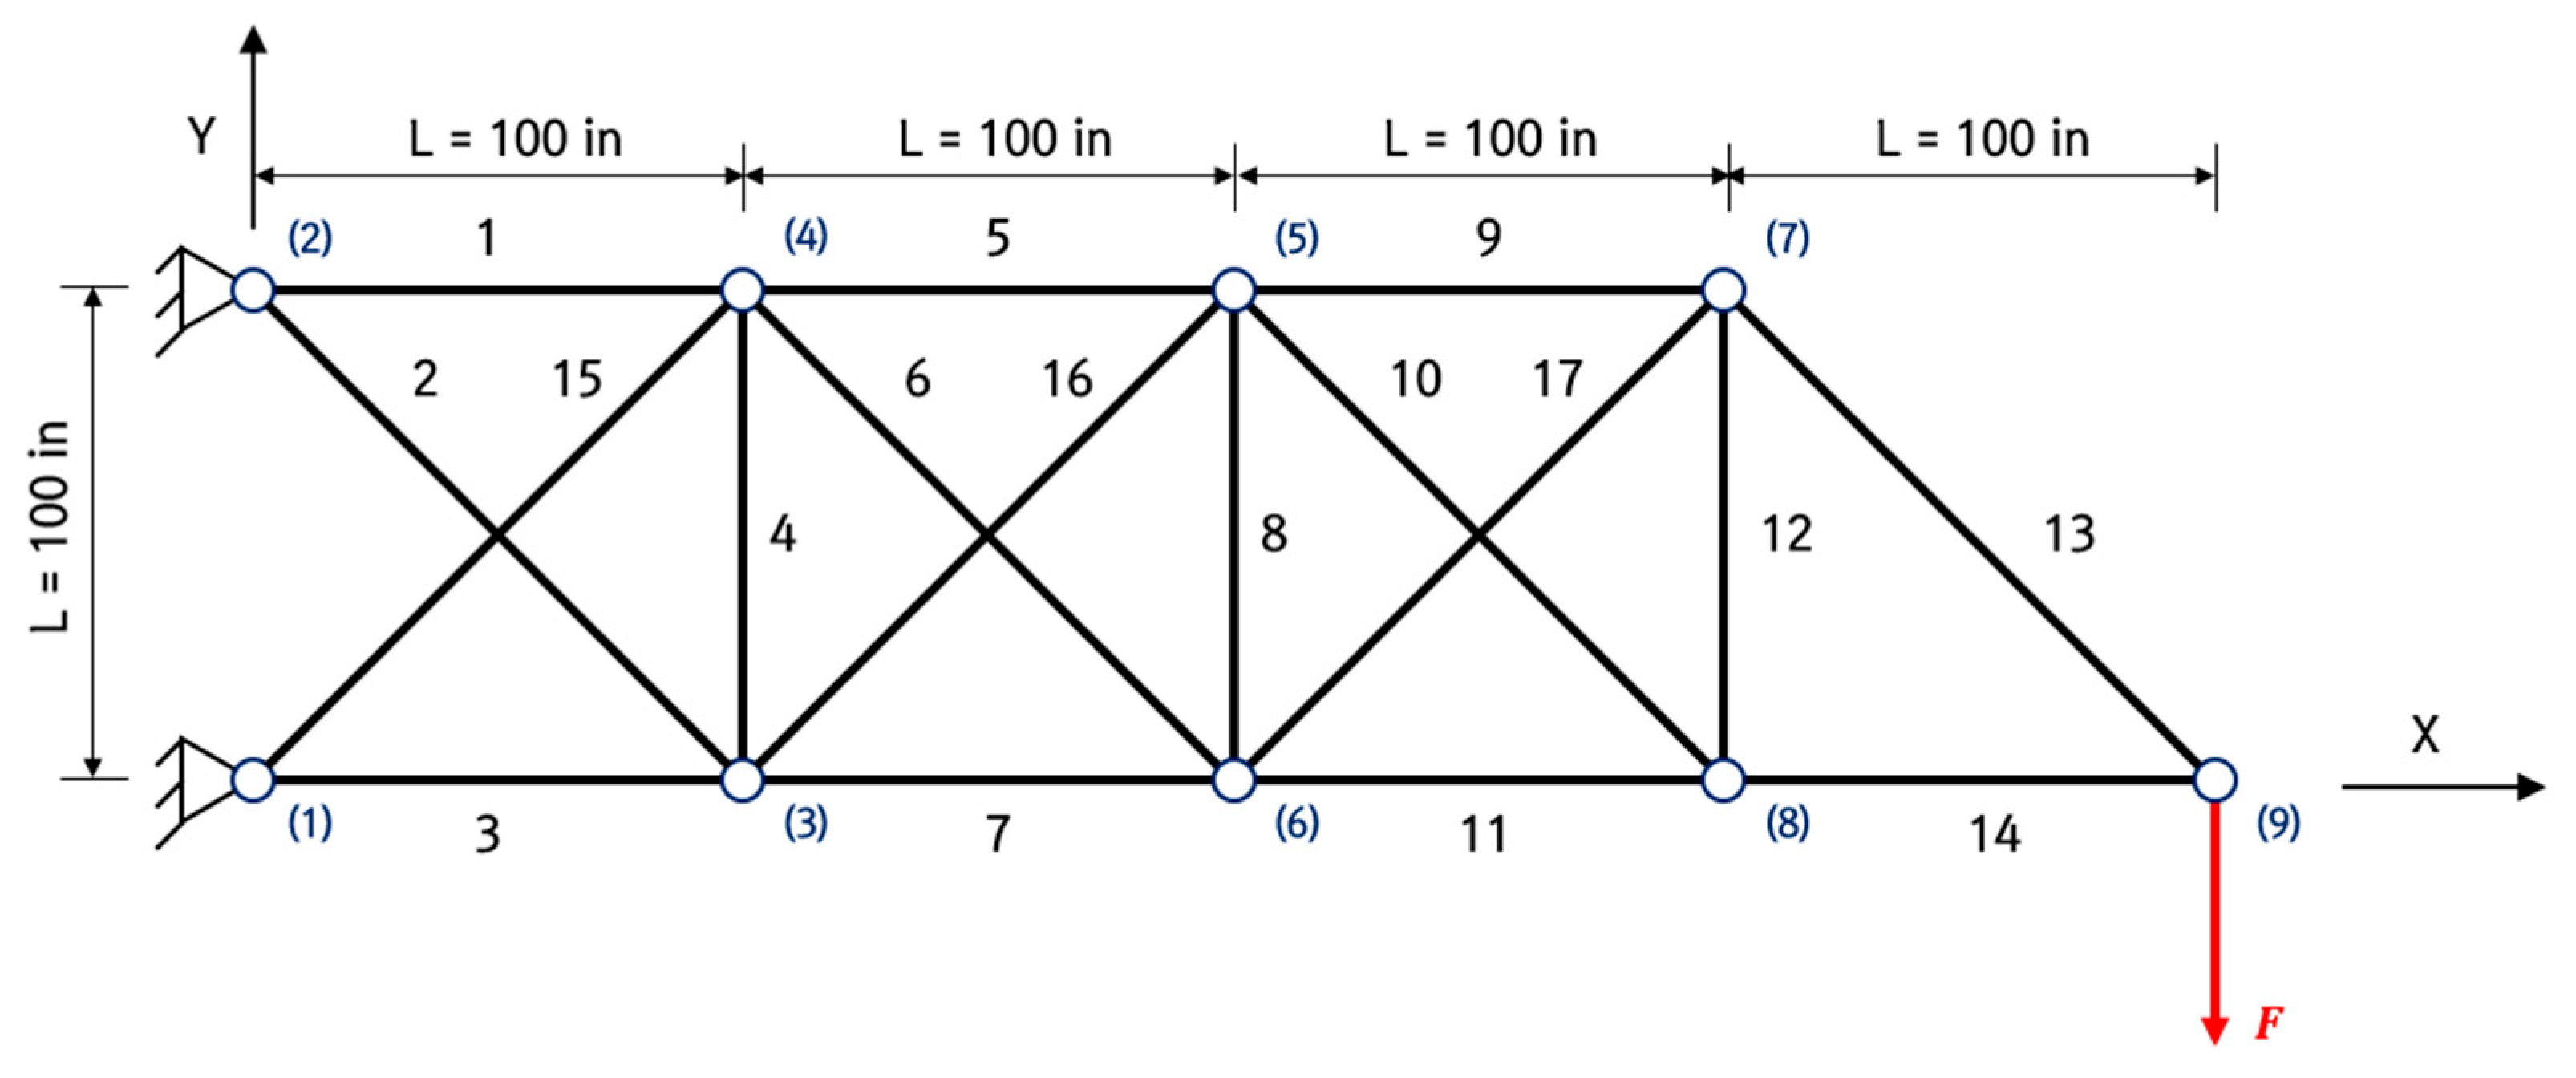
The configuration of the 17-bar truss structure is shown in Figure 3. It consists of 17 members and 9 nodes. The elastic modulus and density of the structure are 30,000 ksi and 0.268 lb/in3, respectively. The minimum and maximum cross-sectional areas are 0.1 in2 and 35.0 in2, respectively. To generate various datasets, the applied loads, maximum member stress, and maximum nodal displacement are set as specified in Table 3. The applied loads range from 10 kips to 160 kips in increments of 10 kips. The maximum member stress ranges from 44 ksi to 56 ksi in increments of 2 ksi. The maximum nodal displacement ranges from 0.5 in to 3.5 in, in increments of 0.5 in.

4. Comparison of Prediction Performance by Hyperparameters Optimization Methods

In this section, HPO is performed using the datasets of each truss structure, and the results are compared. The comparison is based on the MSE, which is one of the most commonly used metrics for evaluating regression performance in machine learning. MSE is calculated using Equation (9), while the MAE and the R2 are calculated using Equations (10) and (11), respectively. Here, m represents the number of data points, ti denotes the test values, pi the predicted values, and t ¯ the mean of the test values. MSE, MAE, and R2 are fundamentally based on the difference between the test and predicted values. Lower values of MSE and MAE indicate better prediction accuracy, while R2 values closer to 1 signify higher predictive performance.
M S E = 1 m i = 1 m t i p i 2
M A E = 1 m i = 1 m t i p i
R 2 = 1 i = 1 m t i p i 2 i = 1 m t i t ¯ 2
Table 4 presents the hyperparameter ranges used for HPO. For GS, RS, and BO, K-fold cross-validation is performed three times [32,50,51,52,53]. The learning rate is treated as a continuous variable, while other hyperparameters are assigned discrete variables.
GS performs evaluations for all specified hyperparameter combinations, resulting in a total of 2187 evaluations, including K-fold cross-validation. To ensure a fair comparison when all HPO methods have similar evaluations, the parameters for each method are set, as shown in Table 5. Here, nEva denotes the number of evaluations.

4.1. The 10-Bar Truss Structure

4.1.1. Datasets

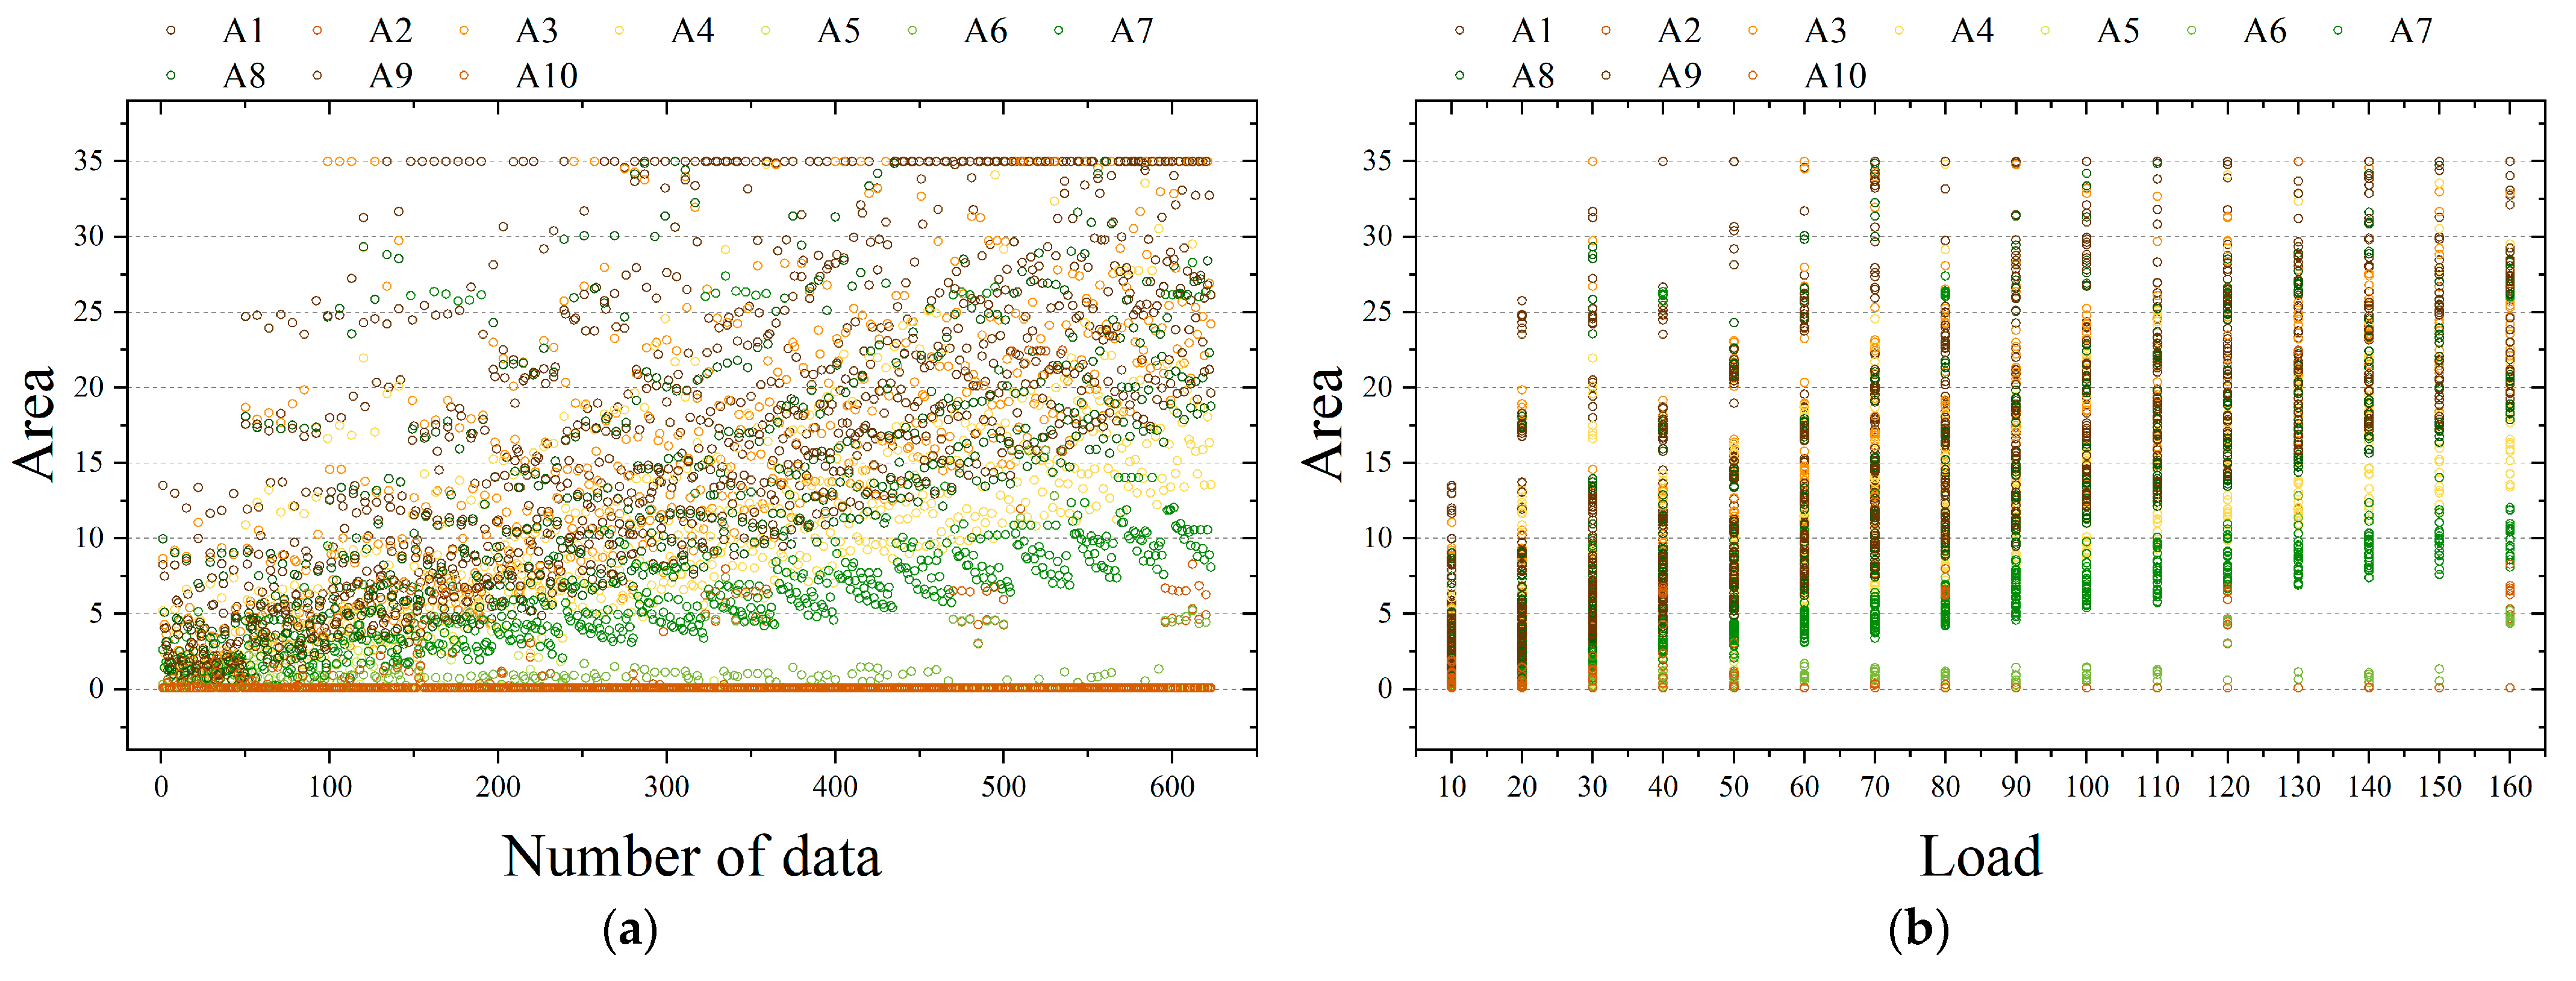
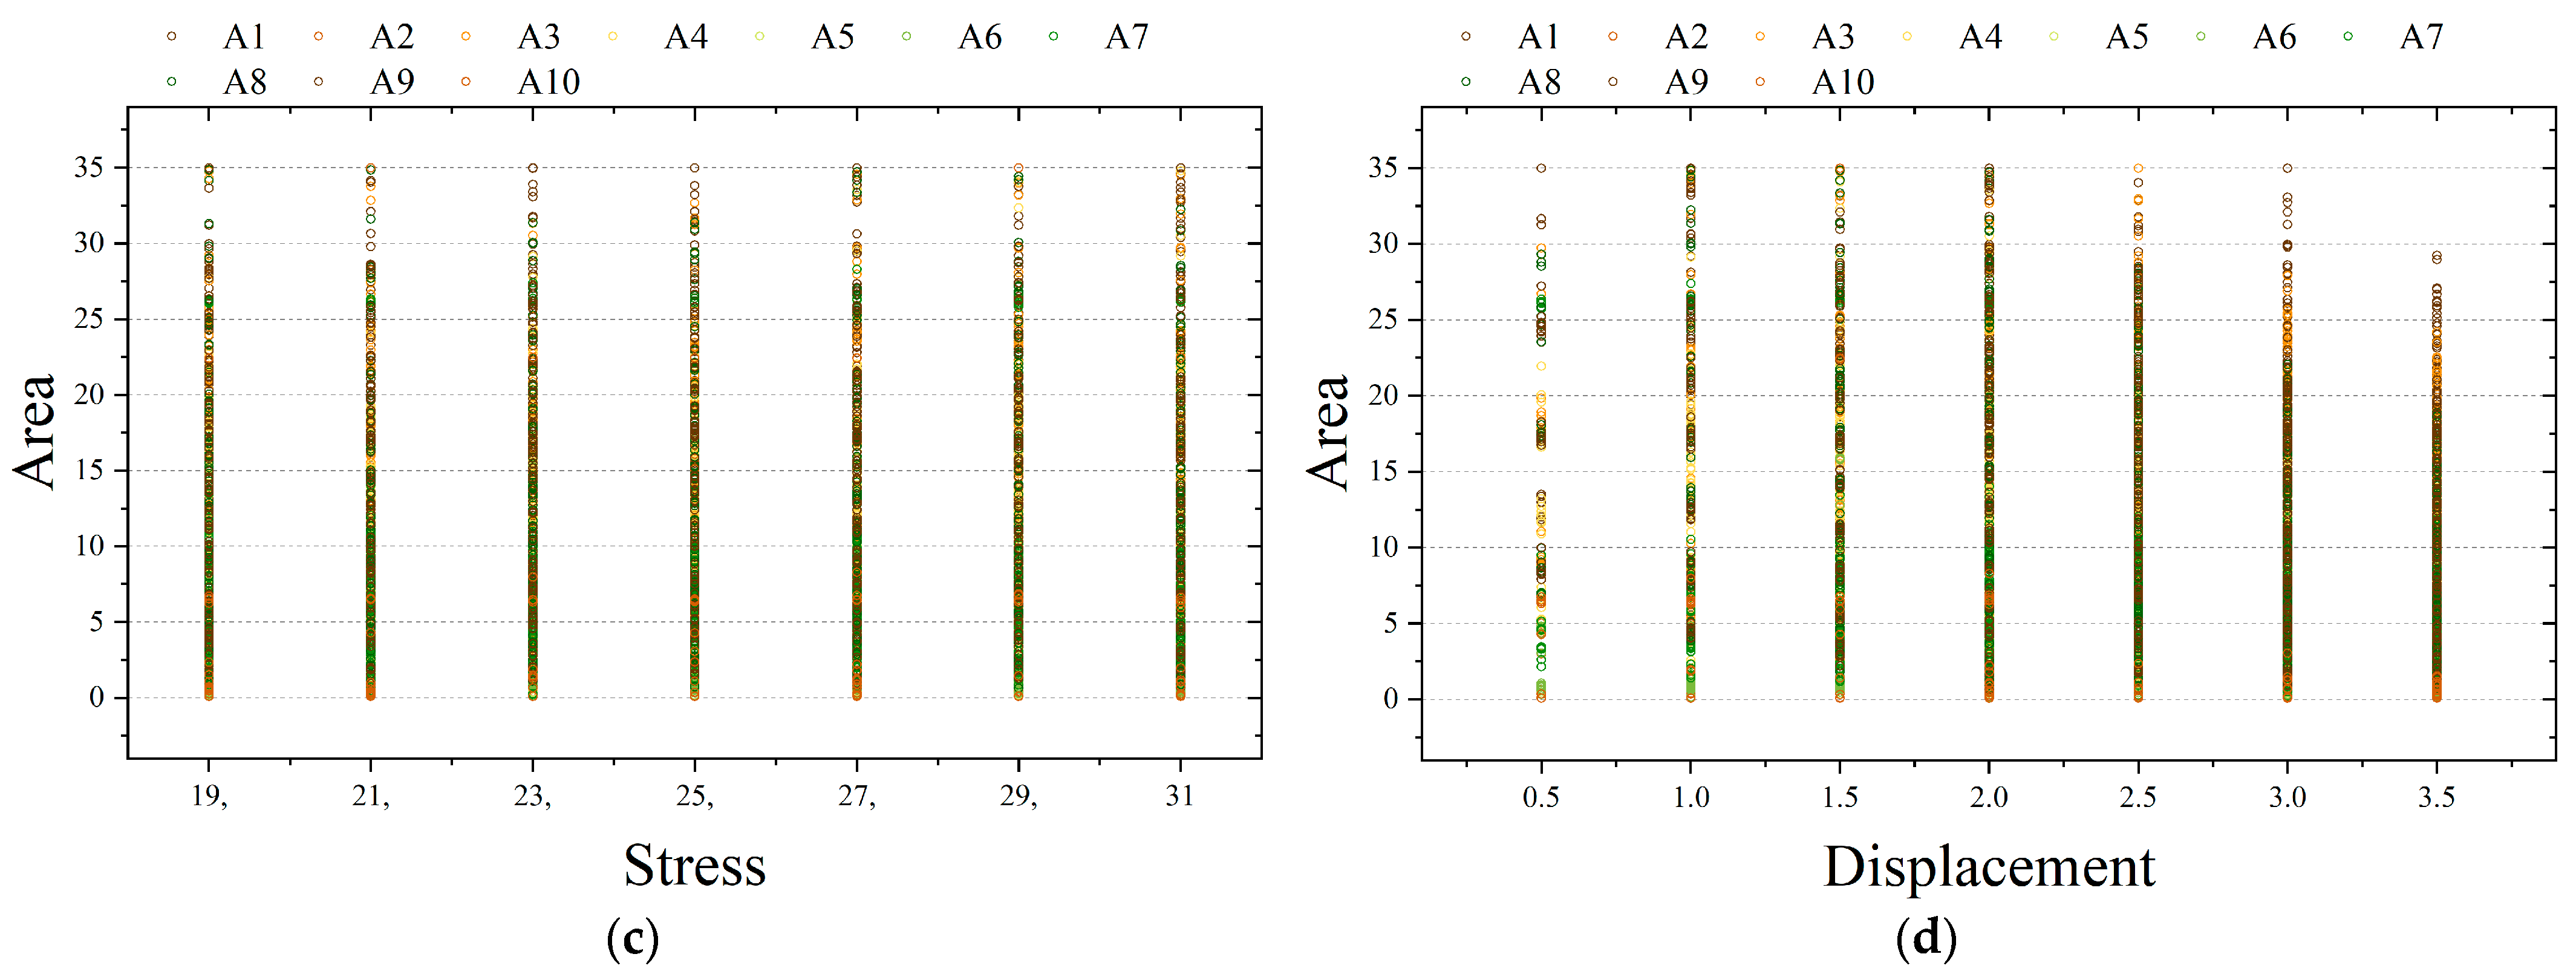
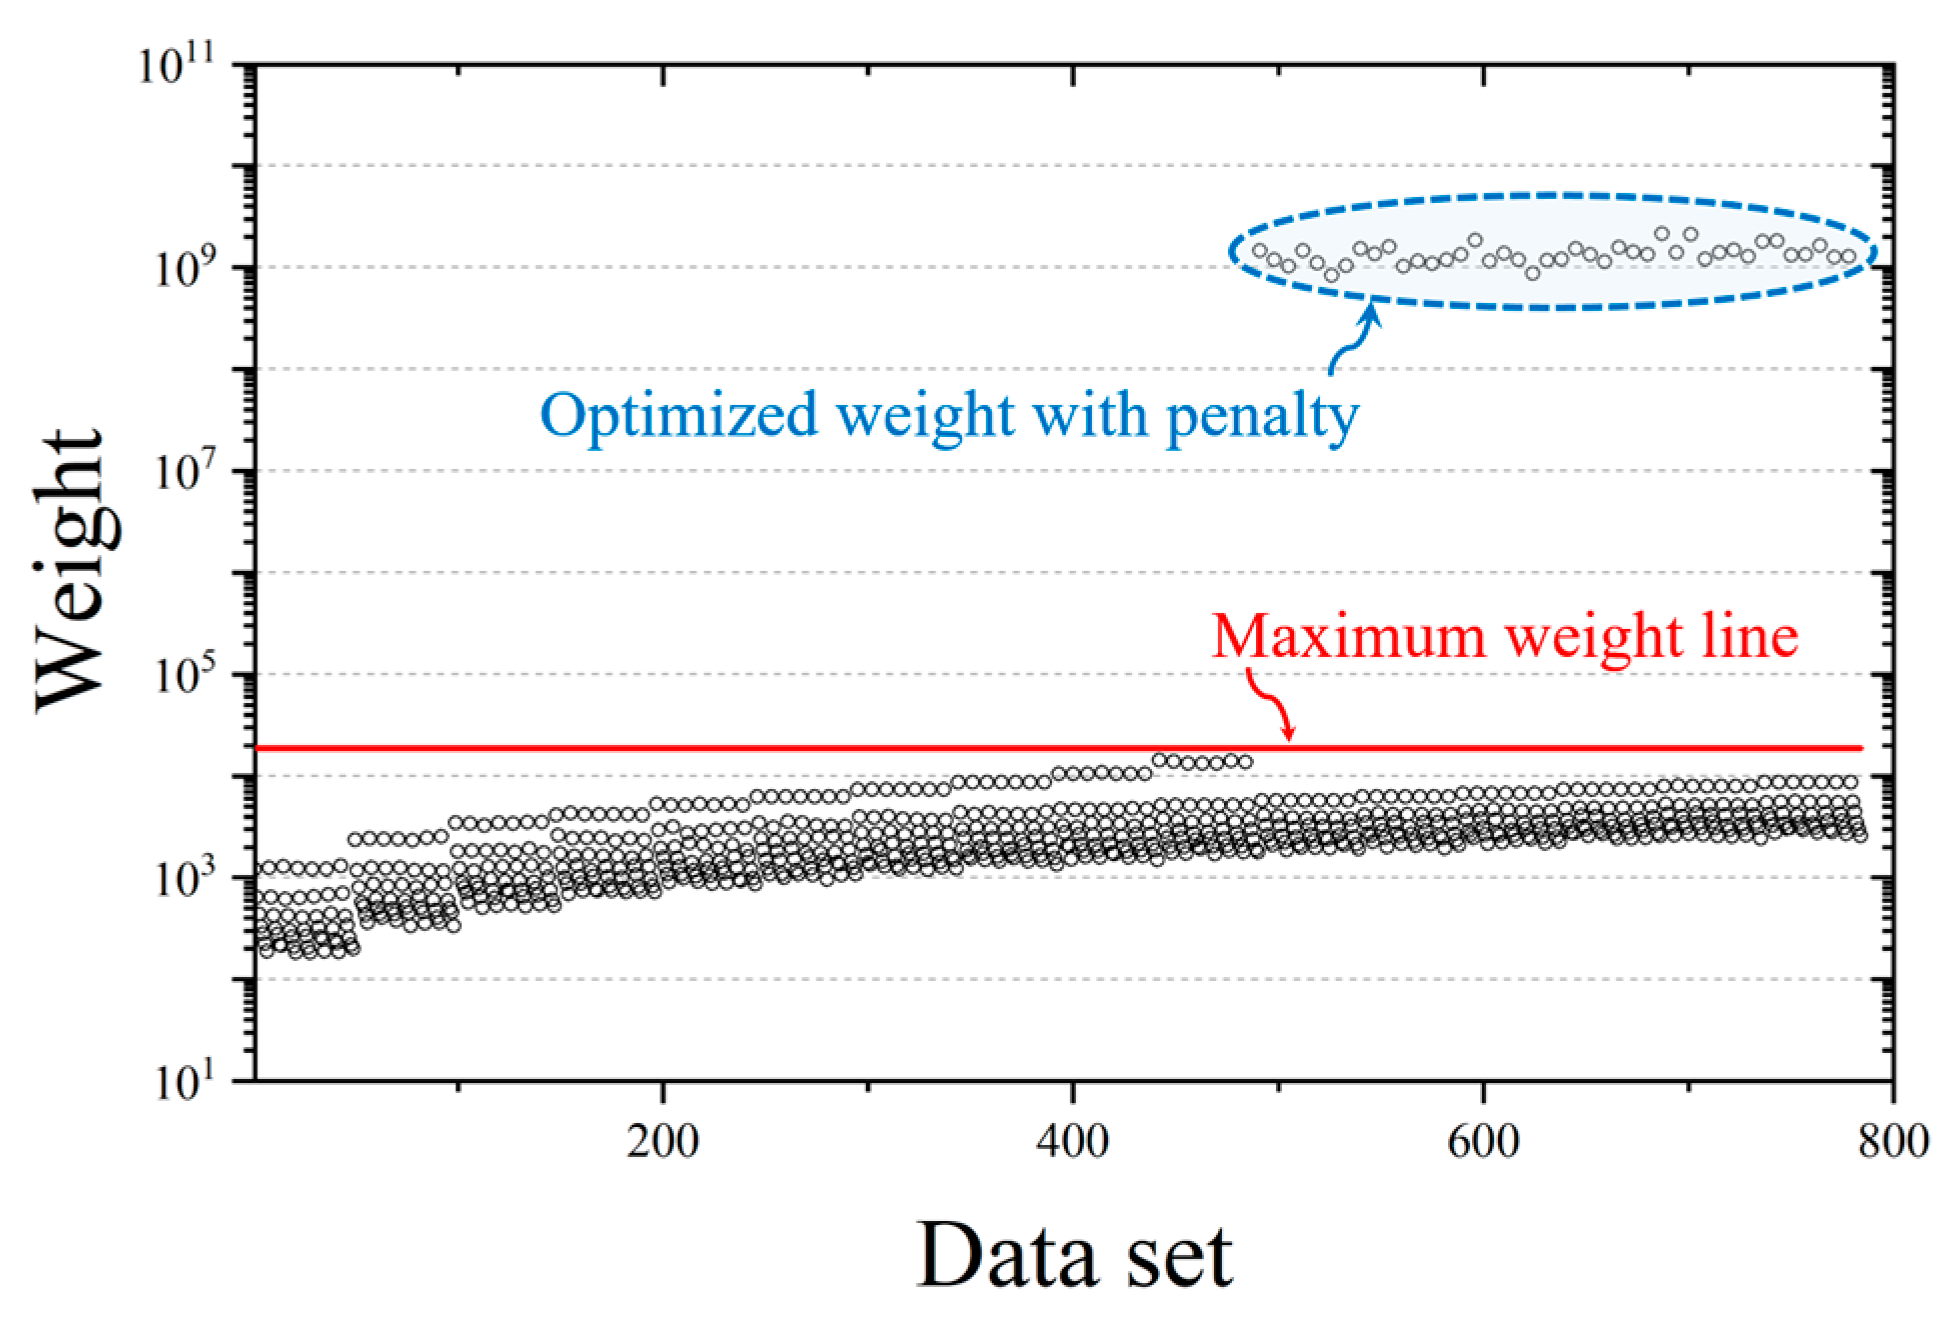
A total of 784 datasets were generated for the 10-bar truss structure, as shown in Figure 4. Among these, 161 datasets were removed due to penalty constraints, as they failed to produce valid solutions (Figure A1 in Appendix A). As the applied load increases, members subjected to higher forces must select larger cross-sectional areas to satisfy the constraints. However, since the maximum allowable cross-sectional area is predefined, some datasets fail to find valid solutions under these conditions. Consequently, a total of 623 datasets were finalized. Table 6 provides a summary of the minimum, maximum, mean, and standard deviation of the cross-sectional areas for each member. All cross-sectional areas fall within the predefined minimum and maximum bounds. Members 7, 8, and 10 occasionally reach either the minimum or maximum cross-sectional area, while member 5 shows a small standard deviation, indicating limited variation due to constraints. In contrast, members 1 and 3 exhibit a standard deviation greater than 10, reflecting substantial variability. These results highlight that the optimal cross-sectional area distribution varies significantly across truss members, exhibiting highly nonlinear patterns. This variability suggests the potential difficulty of accurately learning these patterns. To address this, appropriate normalization methods and hyperparameter settings are crucial to prevent overfitting. Consequently, this dataset underscores the importance of data normalization and HPO for achieving reliable predictive performance.

4.1.2. Data Normalization

As previously mentioned, normalization is essential for the 10-bar truss structure dataset. In this study, four normalization methods—Z-score, Min-Max, Max-Abs, and Robust—were applied, and the normalized datasets were used to predict the cross-sectional areas of truss members using a simple artificial neural network (ANN). For comparison, predictions were also performed using the original (non-normalized) dataset. The ANN model consists of two hidden layers with 16 neurons per layer, uses the ReLU activation function, a learning rate of 0.001, a batch size of 32, and is trained for 300 epochs. The loss function is set to MSE, and evaluation metrics include MAE and R2.
Figure 5 shows the learning convergence process, and Table 7 presents the prediction performance for each normalization method. The non-normalized dataset was highly affected by outliers, resulting in higher MSE values and lower R2 scores. In contrast, the Z-score normalization achieved the lowest MSE and MAE and the highest R2, and was therefore selected for use in the HPO experiments of this study. Meanwhile, Min-Max, Max-Abs, and Robust normalization methods showed slightly lower performance compared to Z-score. This is likely due to their sensitivity to outliers or limited ability to reflect the underlying data distribution. Since the design variables of truss structures often exhibit large deviations and non-linear distributions, the Z-score method, which uses the mean and standard deviation, proved to be more effective in this context.

4.1.3. Hyperparameter Optimization

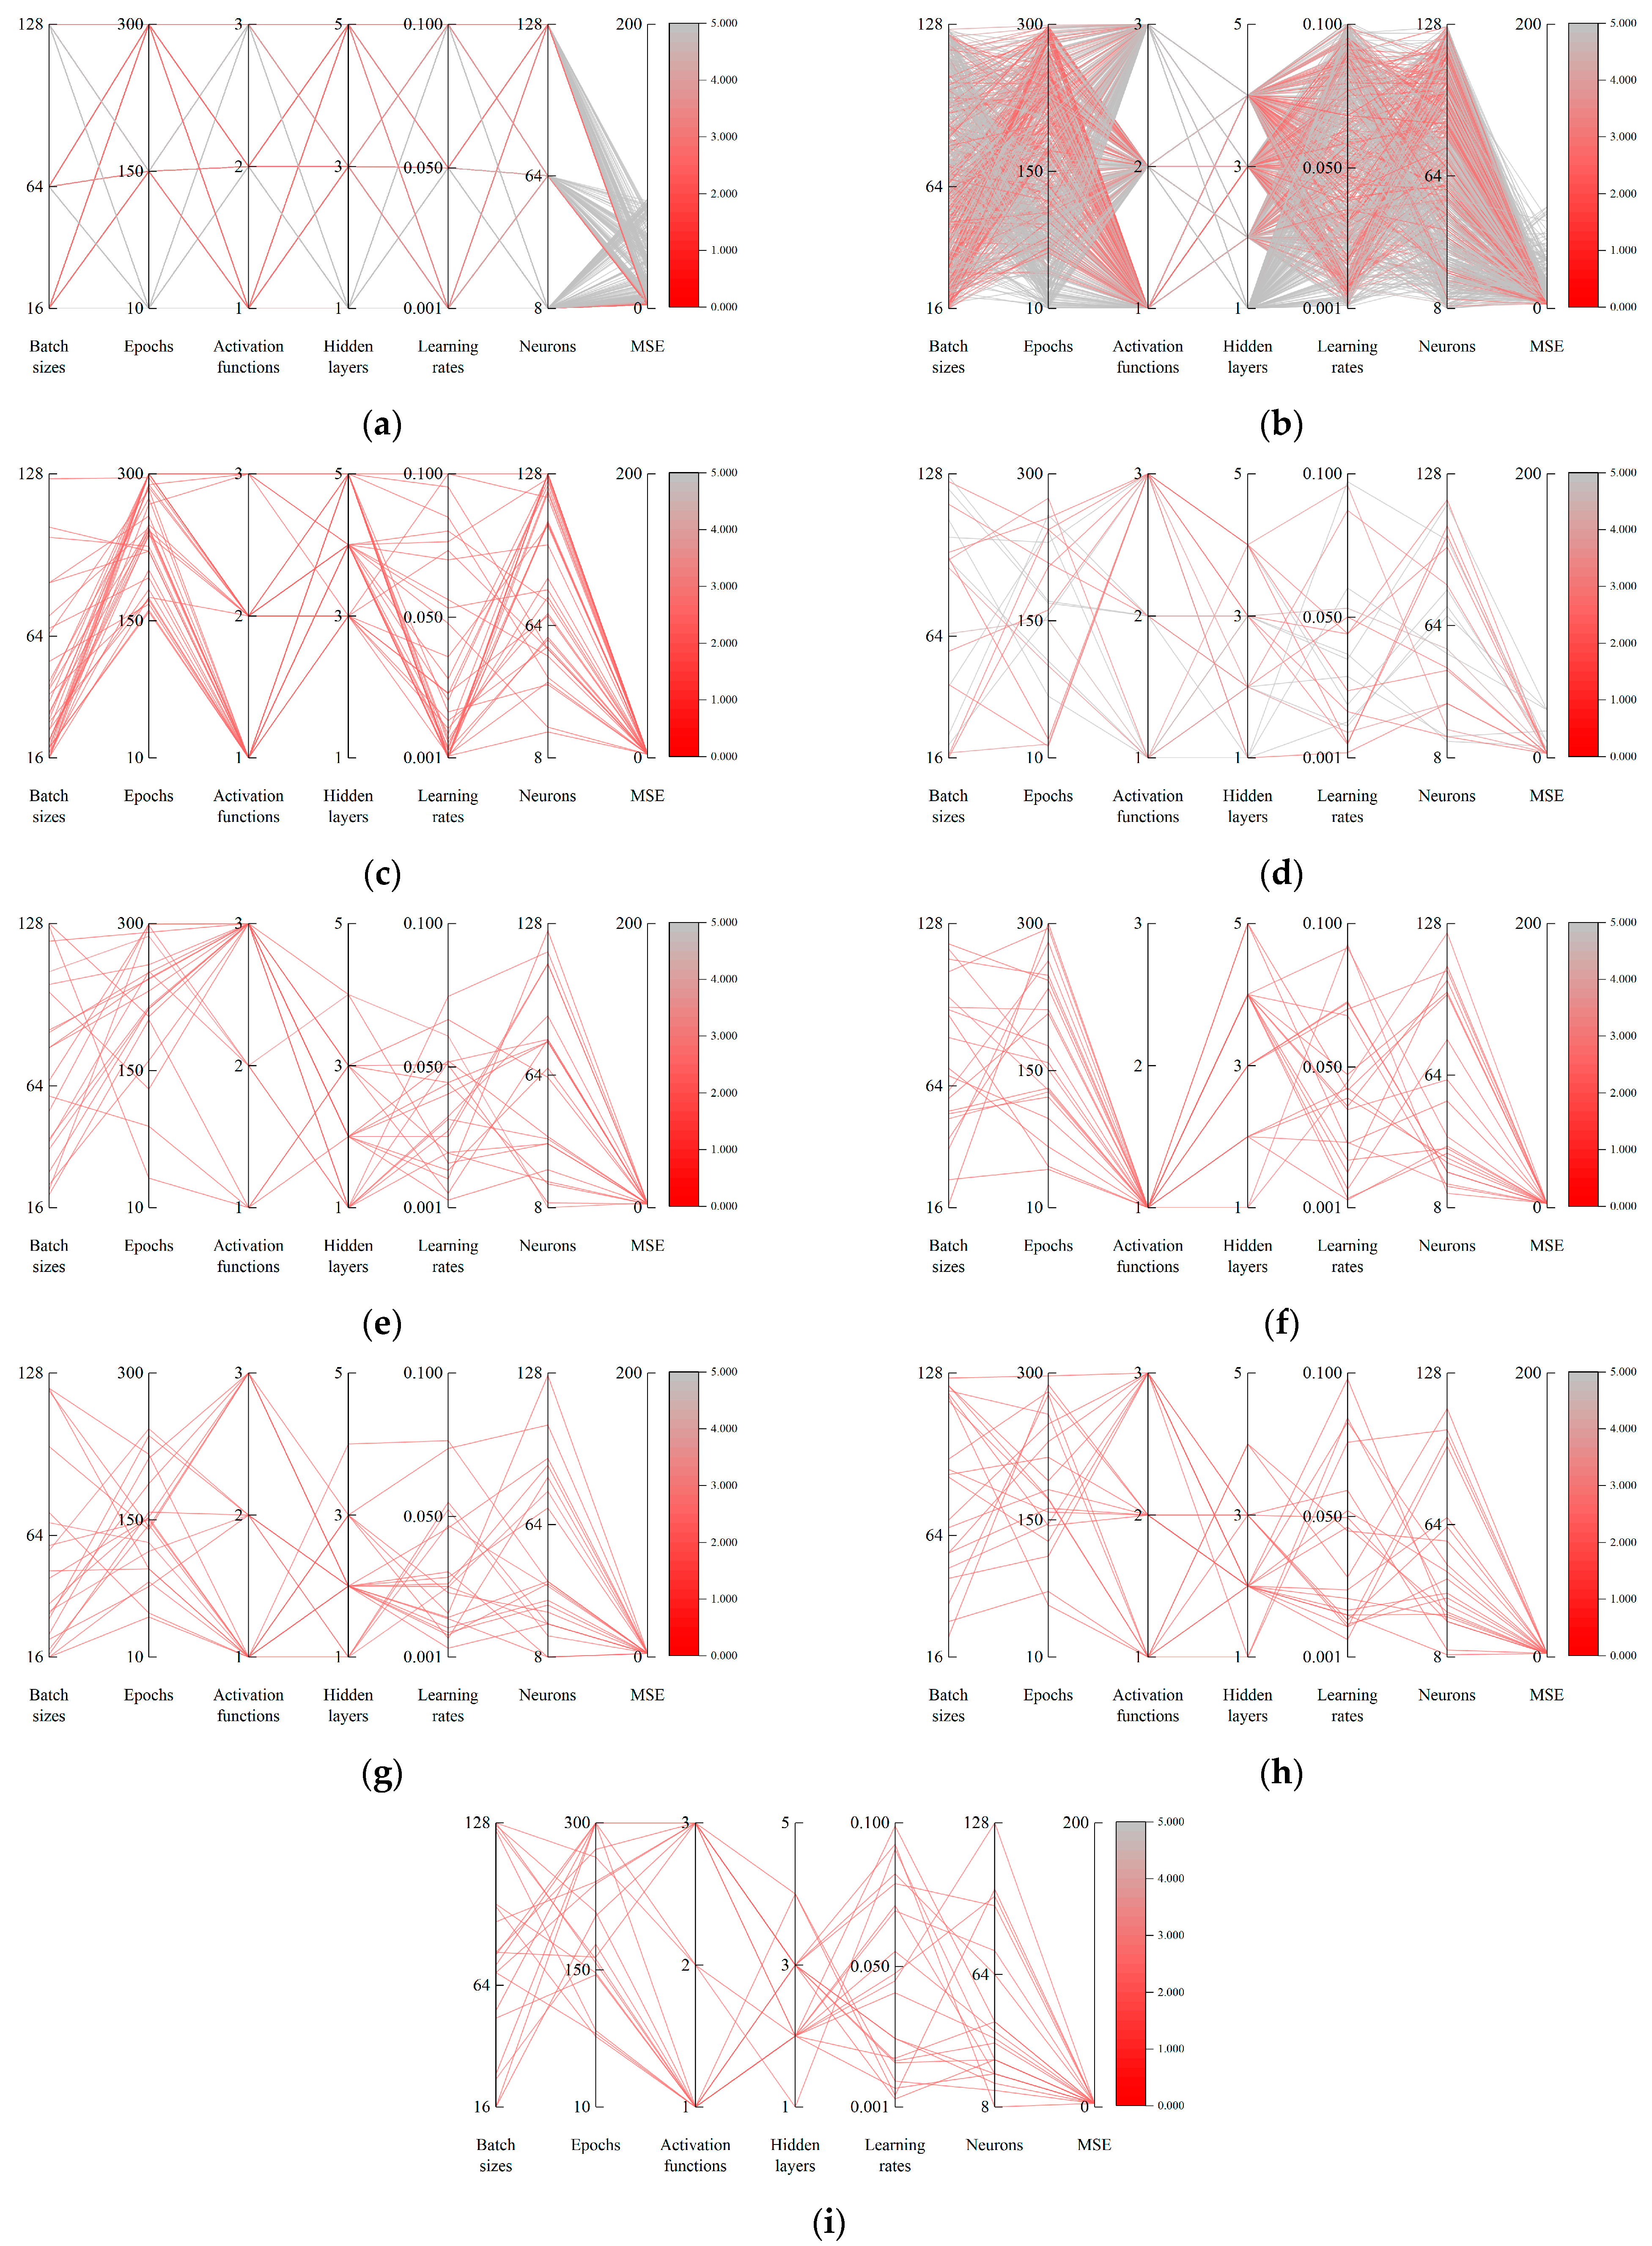
Figure 6 illustrates the hyperparameters explored by each HPO method using the 10-bar truss structure dataset. The closer the MSE is to 0, the redder the color, while values approaching 5 are displayed in gray. MSE values exceeding 5 are represented entirely in gray. GS explores a minimal range of hyperparameters, relying only on predefined user inputs. Consequently, its MSE results exhibit high variability. RS, due to its random selection of hyperparameters, explores a broader range but exhibits high MSE variability. In contrast, BO, CSA, GA, ACO, GWO, HSA, and PSO demonstrate a wide exploration range and achieve superior MSE results, as the outcomes from previous generations influence subsequent iterations.
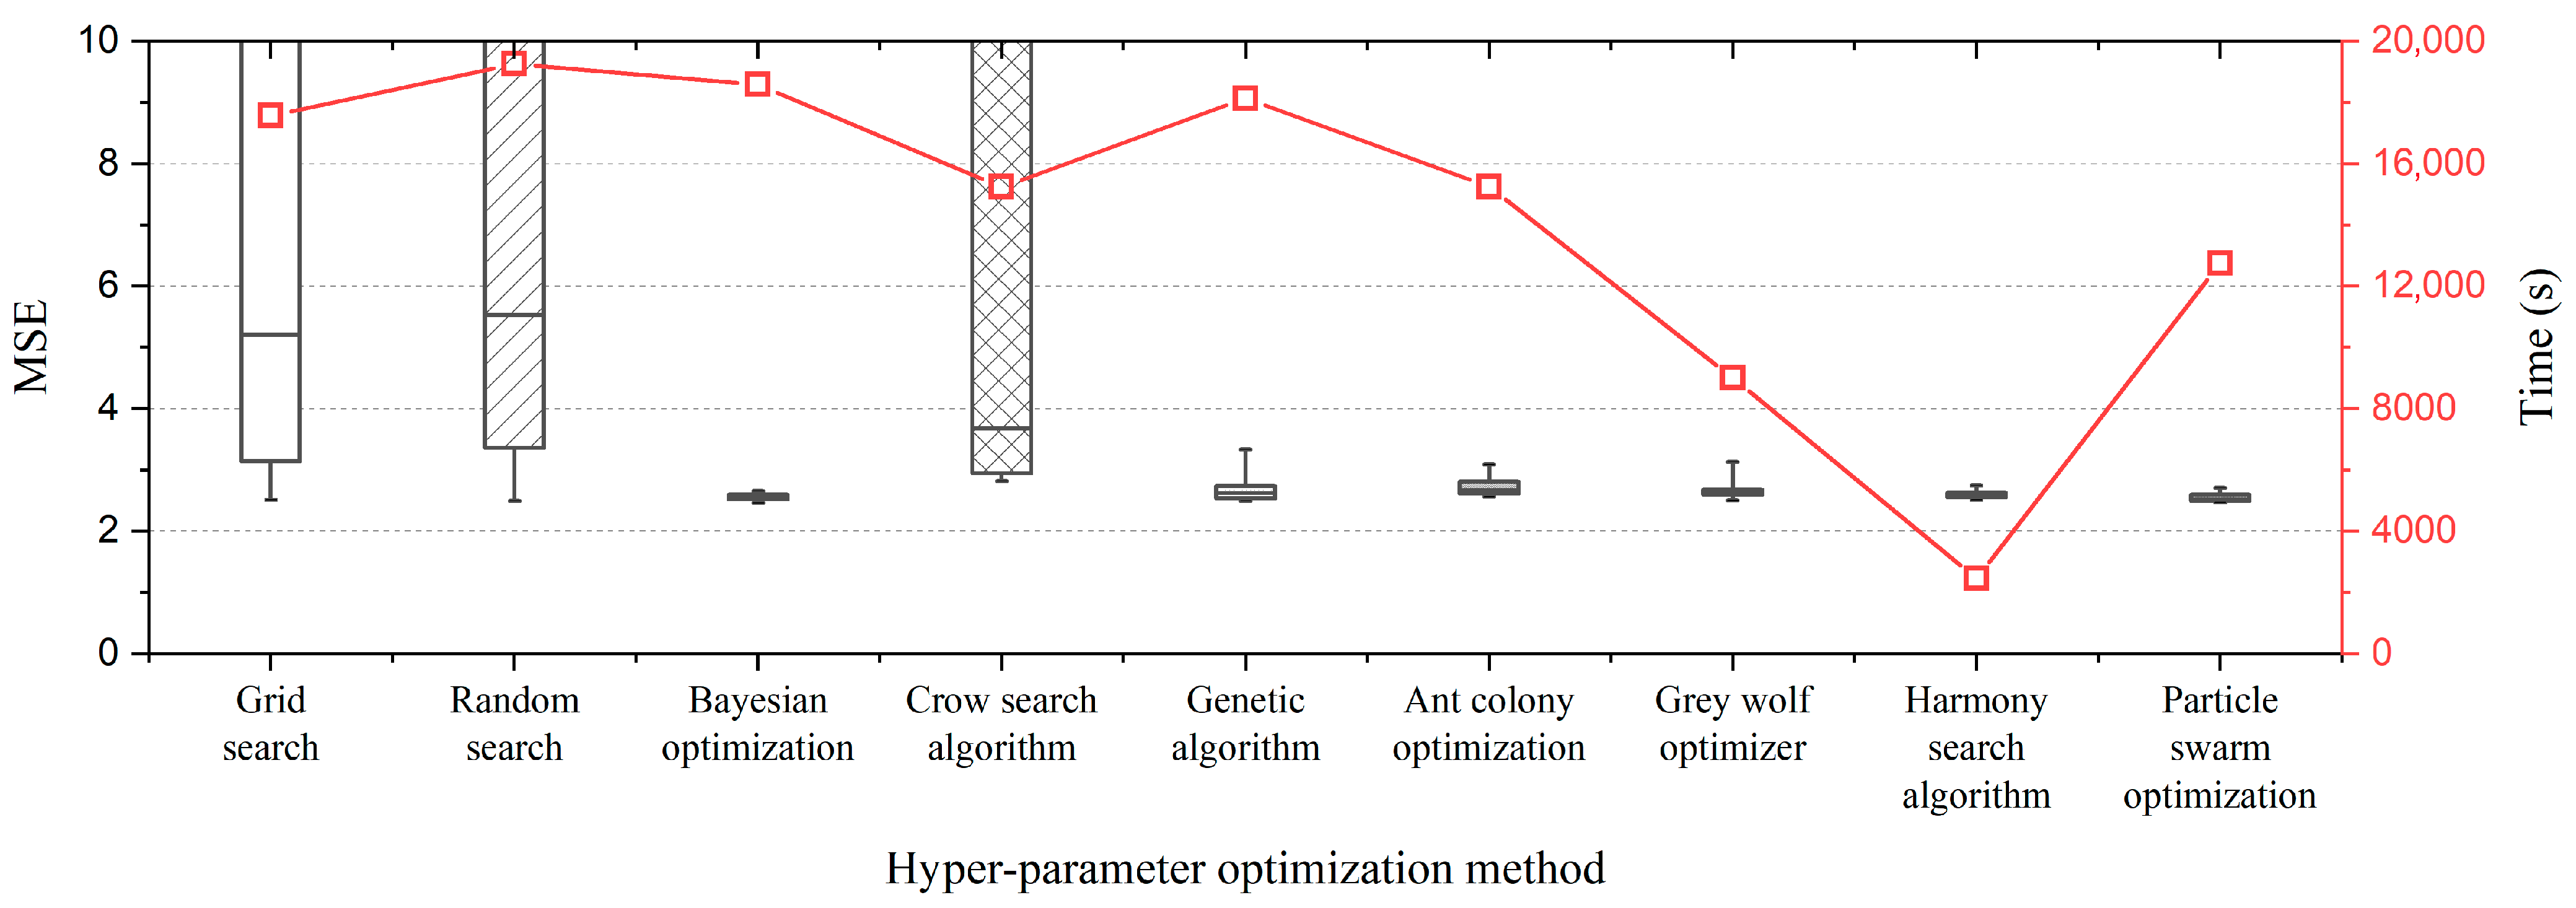
Figure 7 compares the MSE and computation time across different HPO methods. The black box plots represent the distribution of MSE results, while the red symbol plots indicate computation time. The MSE results reveal that GS, RS, and CSA exhibit relatively high MSE values, indicating lower average performance. Conversely, BO, GA, ACO, GWO, HSA, and PSO show significantly lower MSE values, demonstrating superior average performance.

4.2. The 17-Bar Truss Structure

4.2.1. Datasets

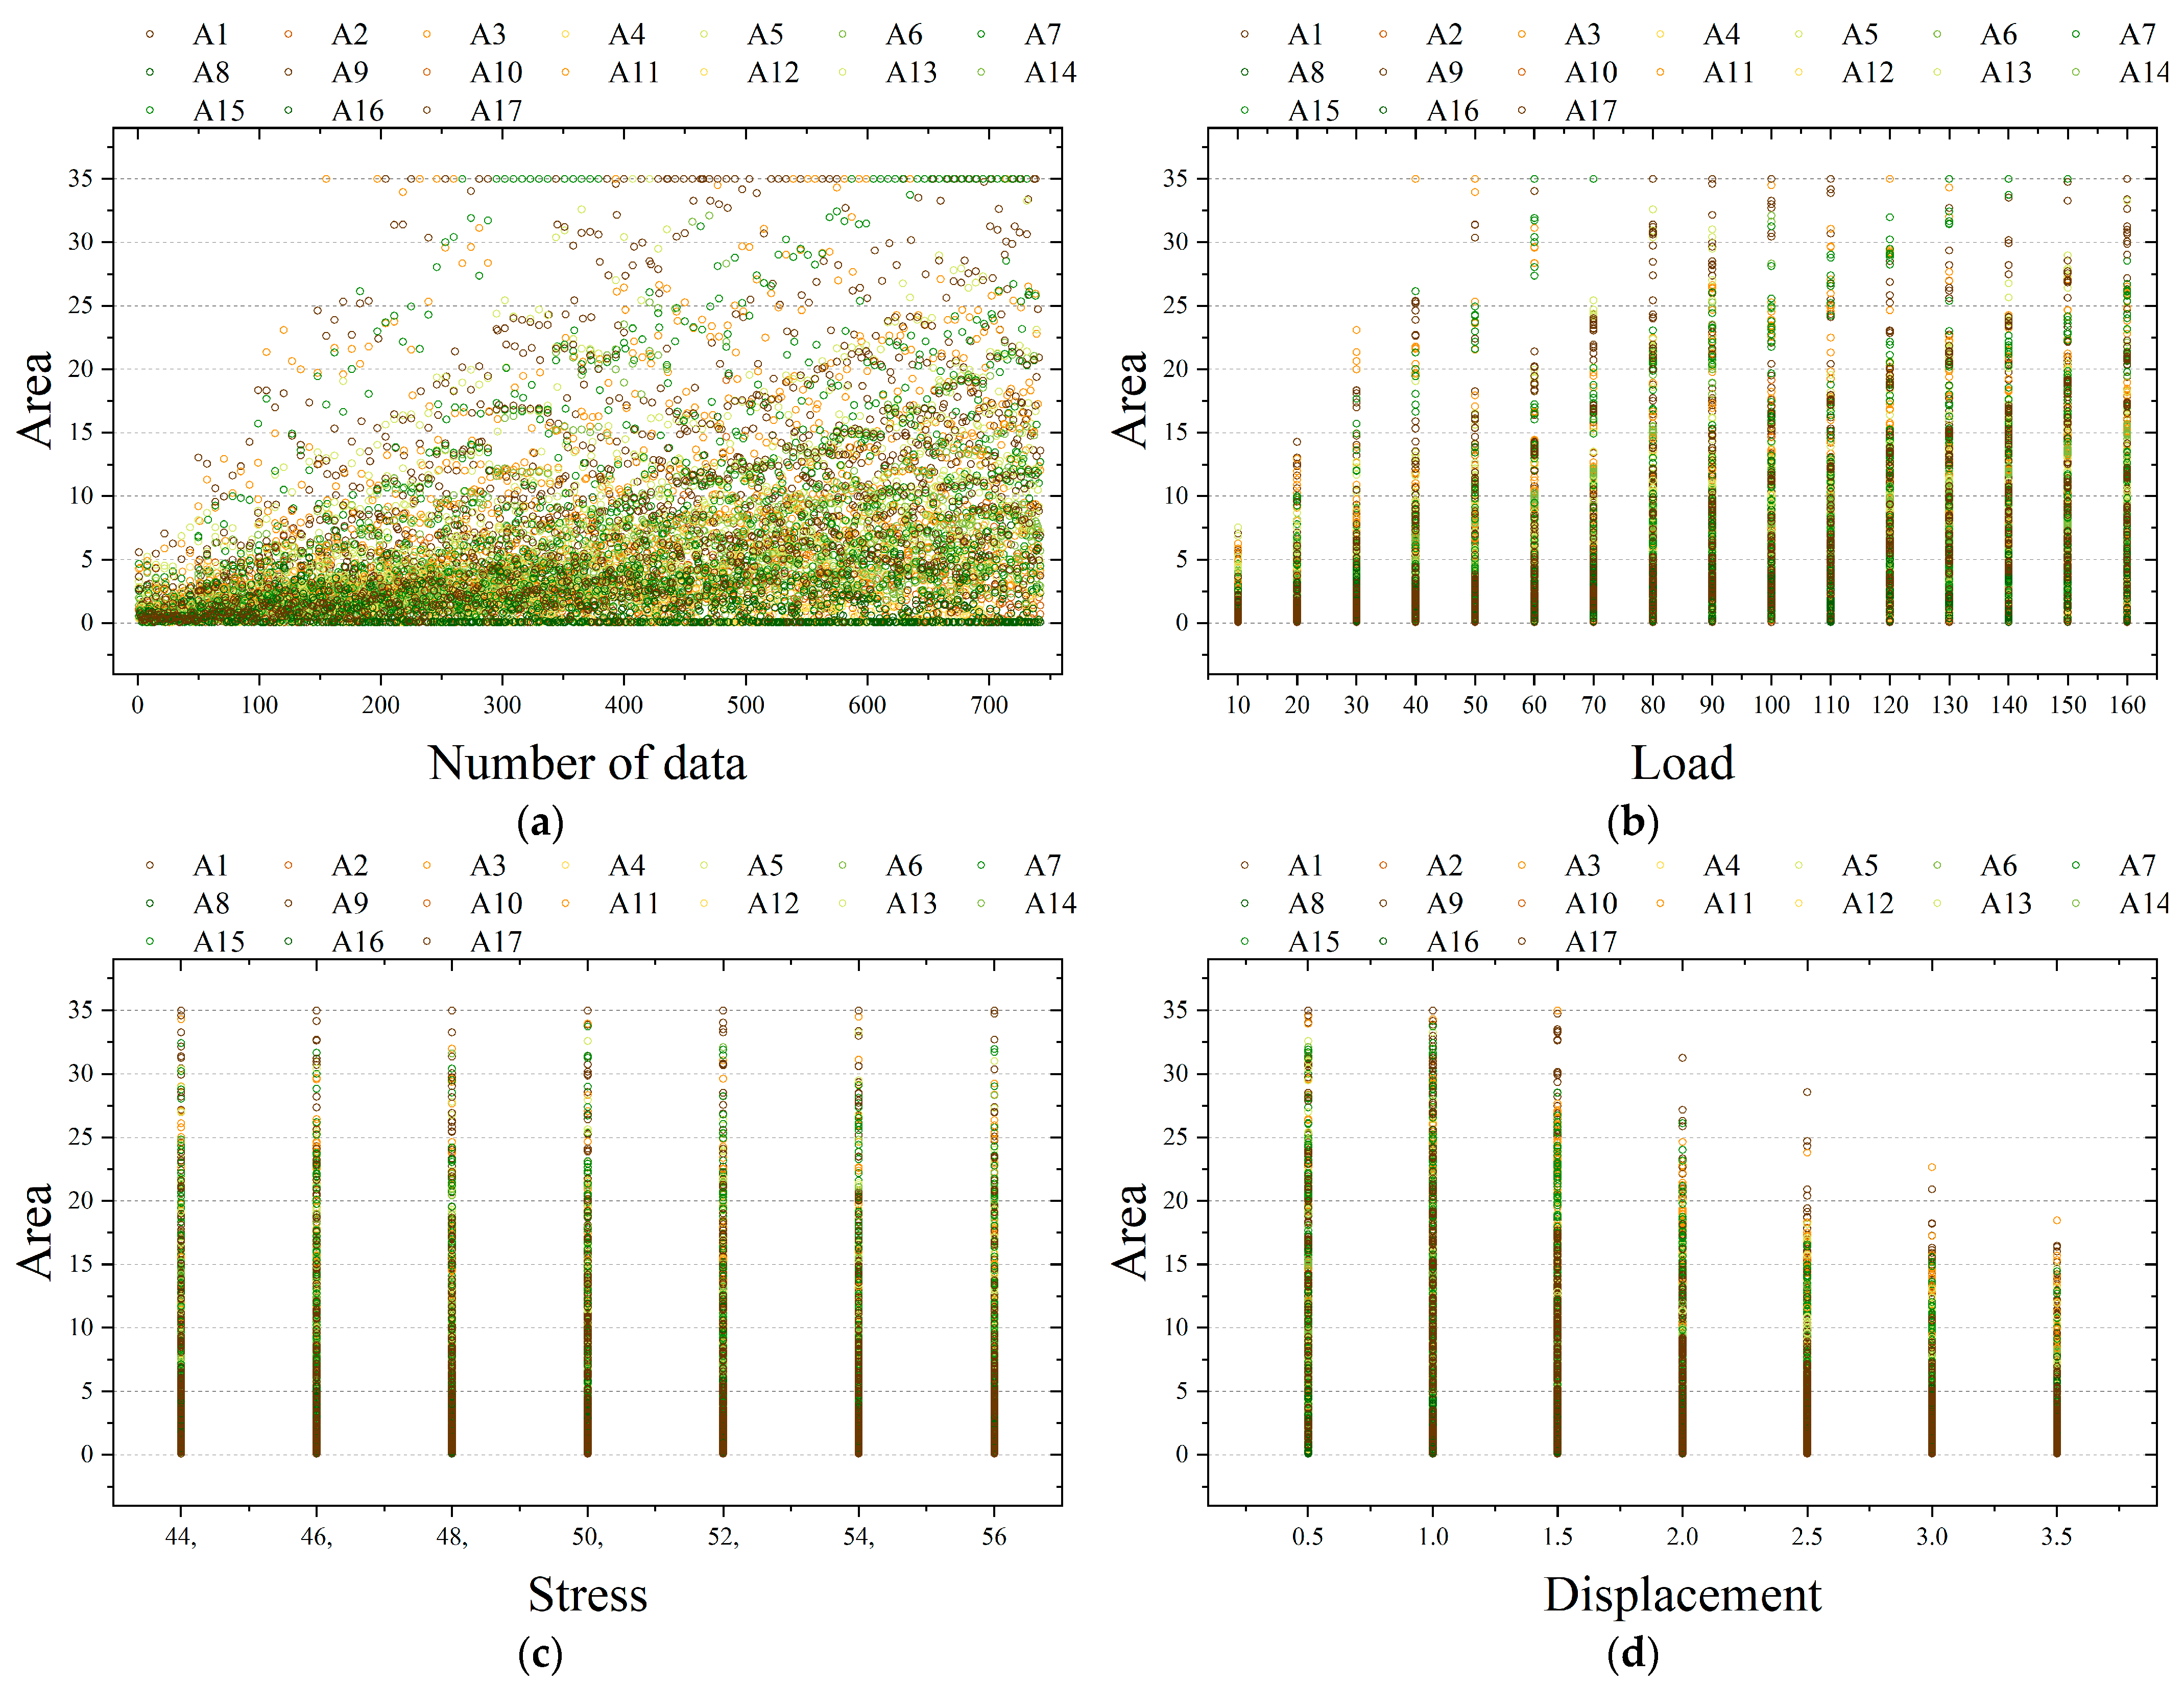
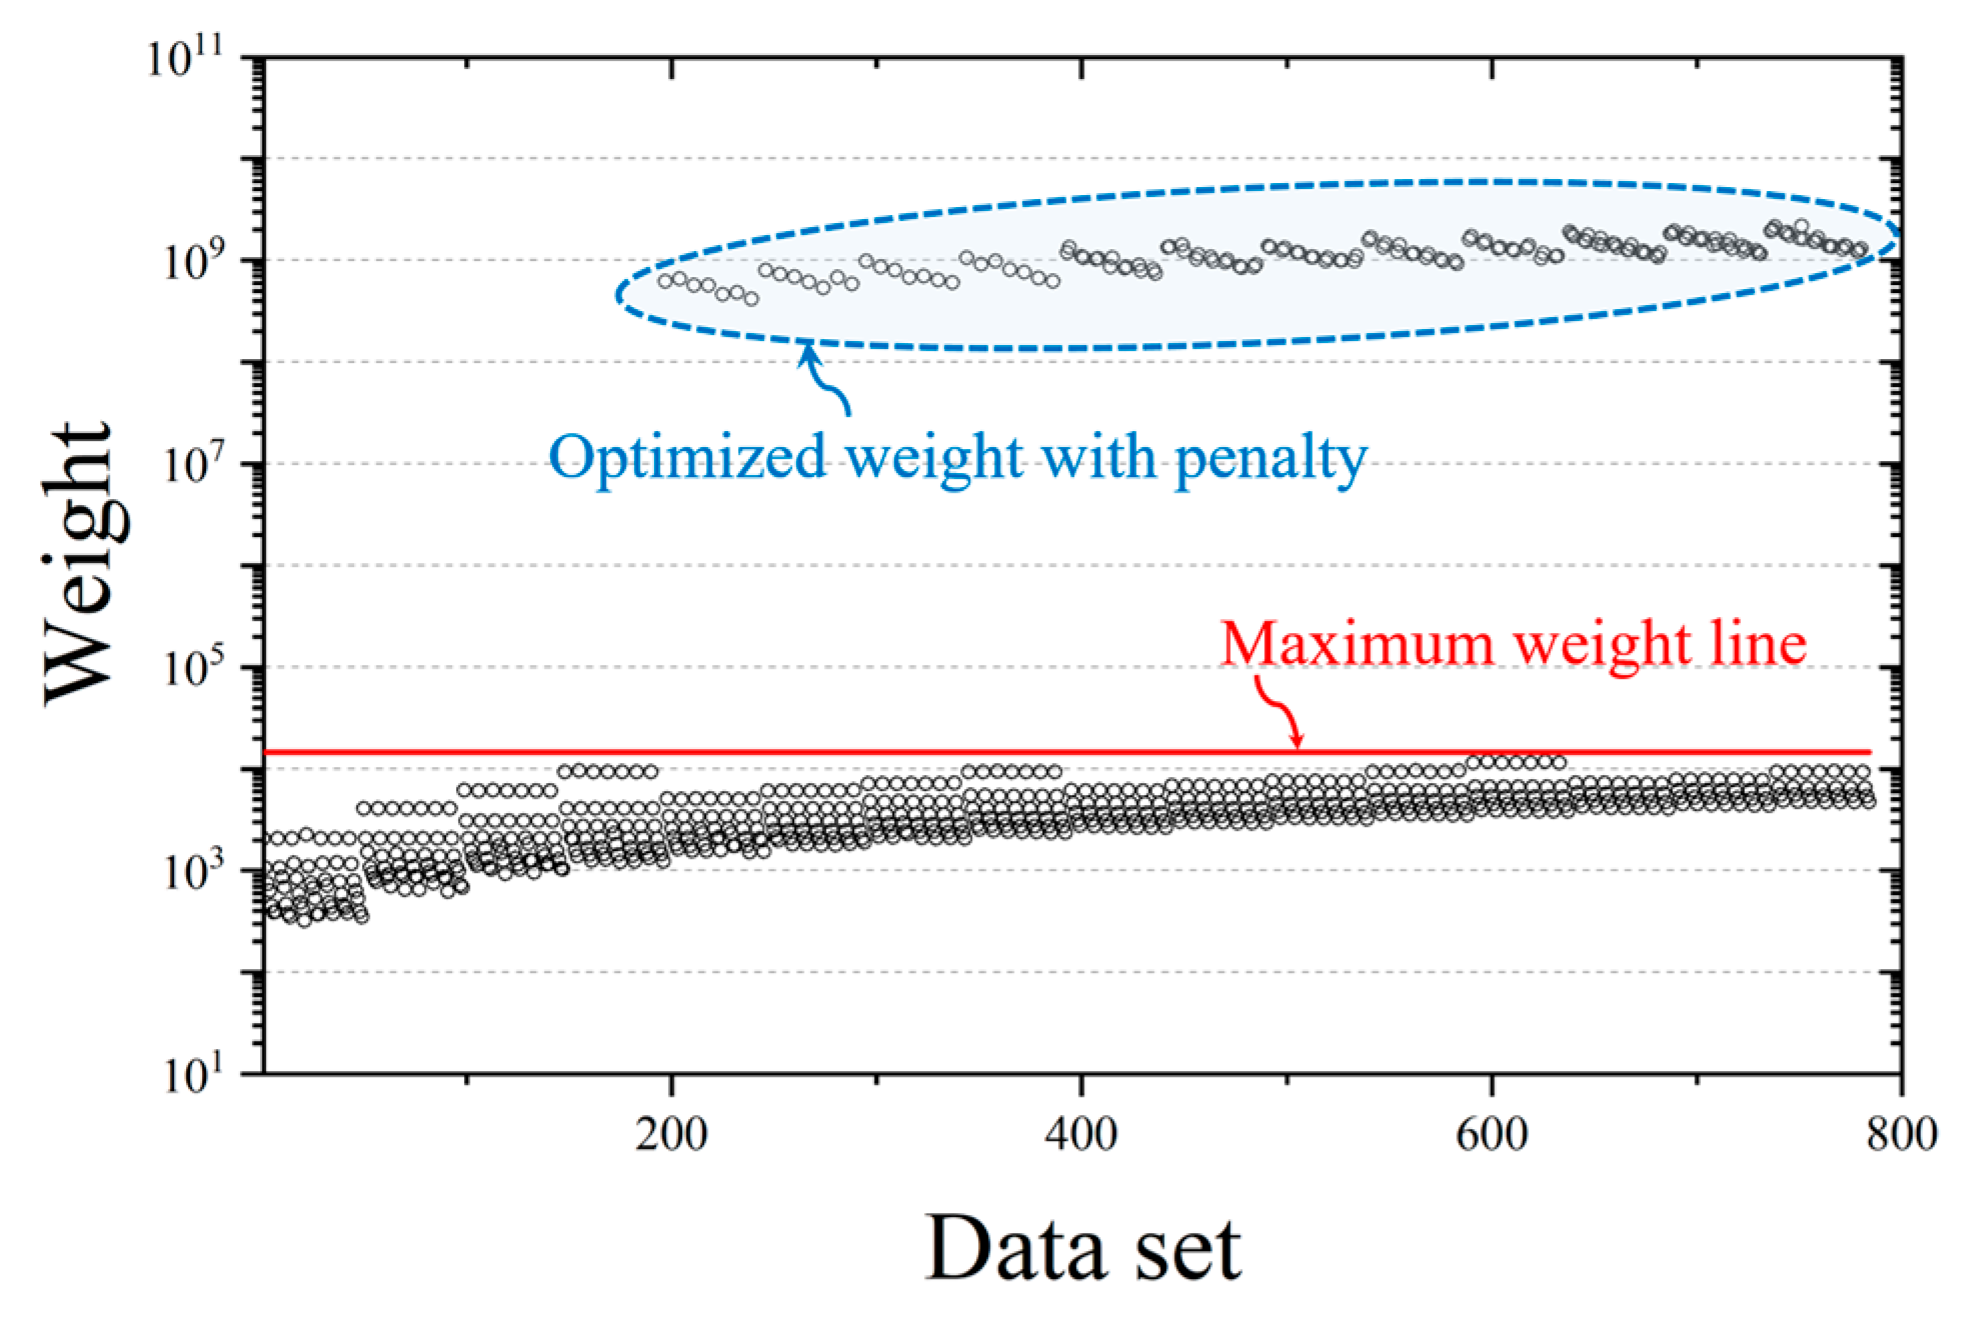
A total of 784 datasets were generated for the 17-bar truss structure, as shown in Figure 8. Forty-two datasets were removed due to penalty constraints, as they failed to produce valid solutions (Figure A2 in Appendix A). Consequently, 742 datasets were used for HPO.
Table 8 provides a summary of the minimum, maximum, mean, and standard deviation of the cross-sectional areas for each member. All cross-sectional areas fall within the predefined minimum and maximum bounds. Members 2, 4, 6, 8, 10, 12, 14, 15, 16, and 17 occasionally reach either the minimum or maximum cross-sectional area. Additionally, members 4 and 8 exhibit a standard deviation smaller than 2, indicating limited variation due to constraints. In contrast, member 1 shows a standard deviation greater than 10, indicating significant variation in cross-sectional area distribution. These results highlight that the optimal cross-sectional area distribution varies significantly across truss members, exhibiting highly nonlinear patterns. This variability suggests the potential difficulty of accurately learning these patterns. To address this, appropriate normalization methods and hyperparameter settings are essential to process the data effectively and prevent overfitting. Consequently, this dataset underscores the importance of data normalization and HPO for achieving reliable predictive performance.

4.2.2. Data Normalization

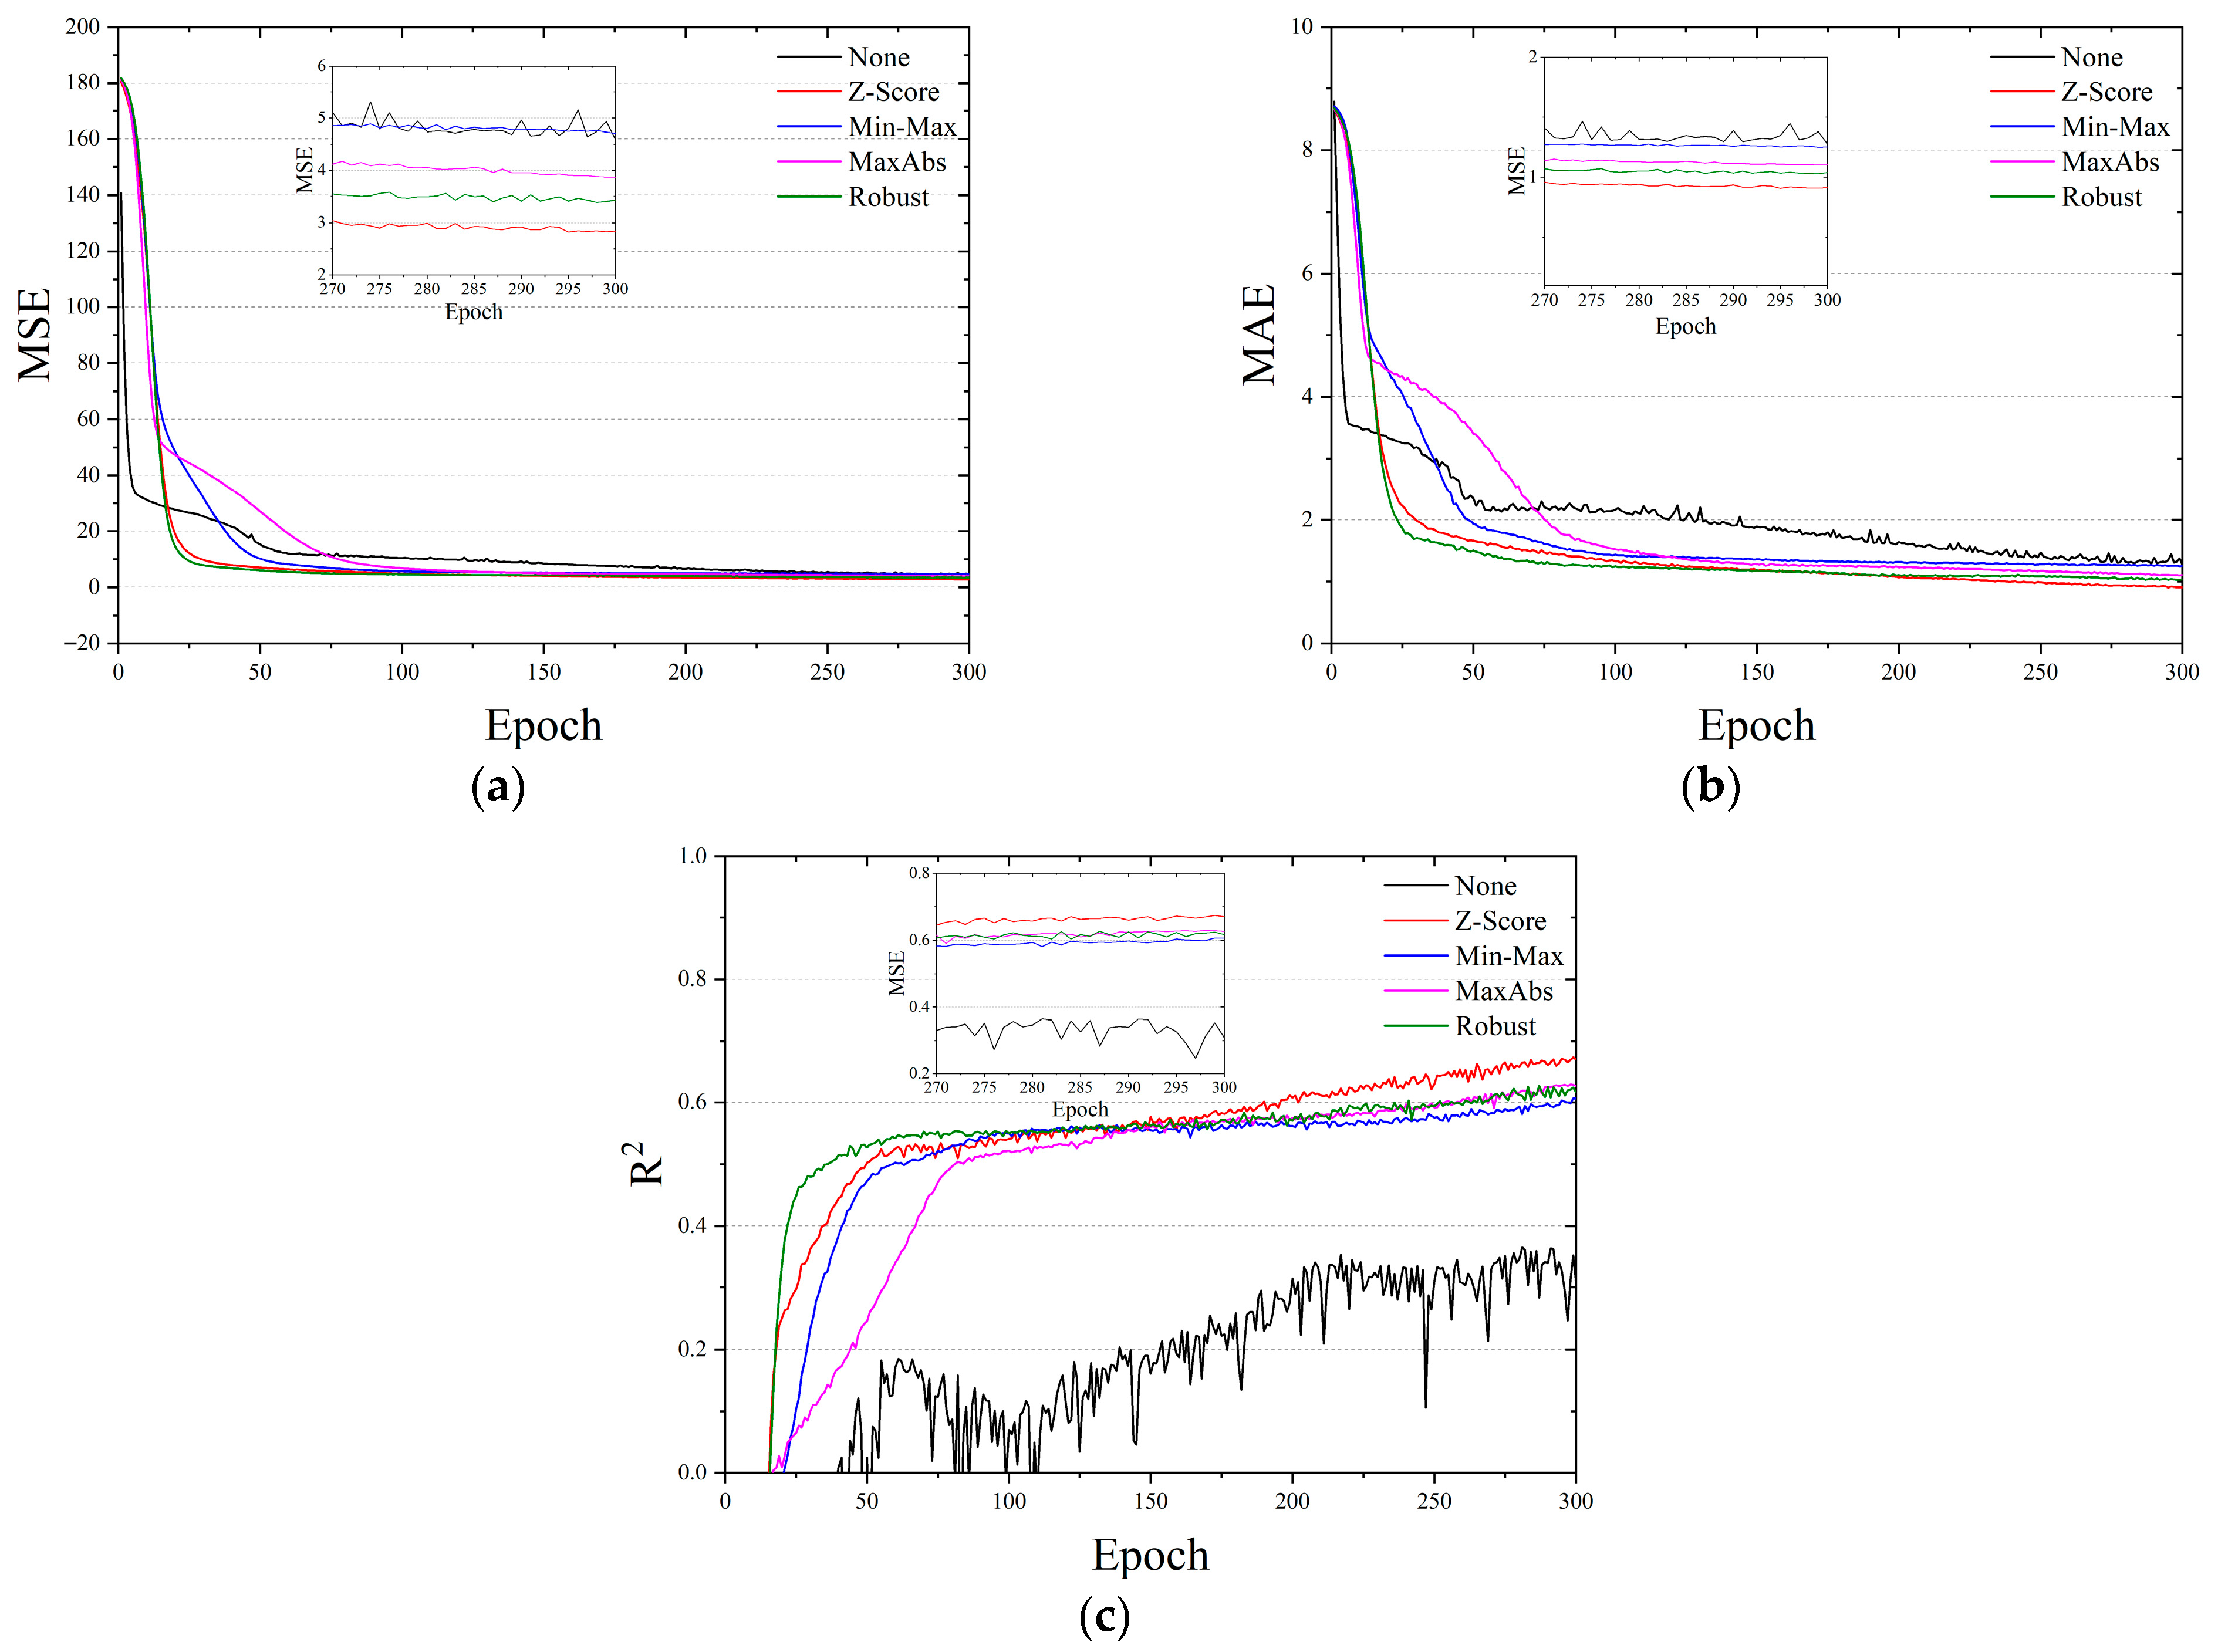
As with the 10-bar truss structure, the 17-bar truss structure dataset was normalized using Z-score, Min-Max, Max-Abs, and Robust scalers, and predictions were conducted using a simple ANN model. To evaluate the necessity and effectiveness of normalization, predictions were also performed using the non-normalized dataset. The ANN model consists of two hidden layers with 16 neurons each, employs the ReLU activation function, a learning rate of 0.001, a batch size of 32, and is trained over 300 epochs. MSE is used as the loss function, and MAE and R2 are adopted as evaluation metrics.
Figure 9 shows the convergence trends of MSE, MAE, and R2 during training. Table 9 presents the prediction results for each normalization method. The non-normalized dataset exhibited high sensitivity to outliers, resulting in the highest MSE and lowest R2. Among the normalized cases, the dataset scaled with the Robust method achieved the best performance, showing the lowest MSE and MAE and the highest R2. The relatively better performance of Robust scaling in the 17-bar case suggests that its resilience to outliers made it more suitable for this dataset. However, this study primarily aims to compare HPO techniques rather than normalization methods. Therefore, for consistency with the 10-bar case, the Z-score normalized dataset is used for HPO in the 17-bar truss structure as well.

4.2.3. Hyperparameter Optimization

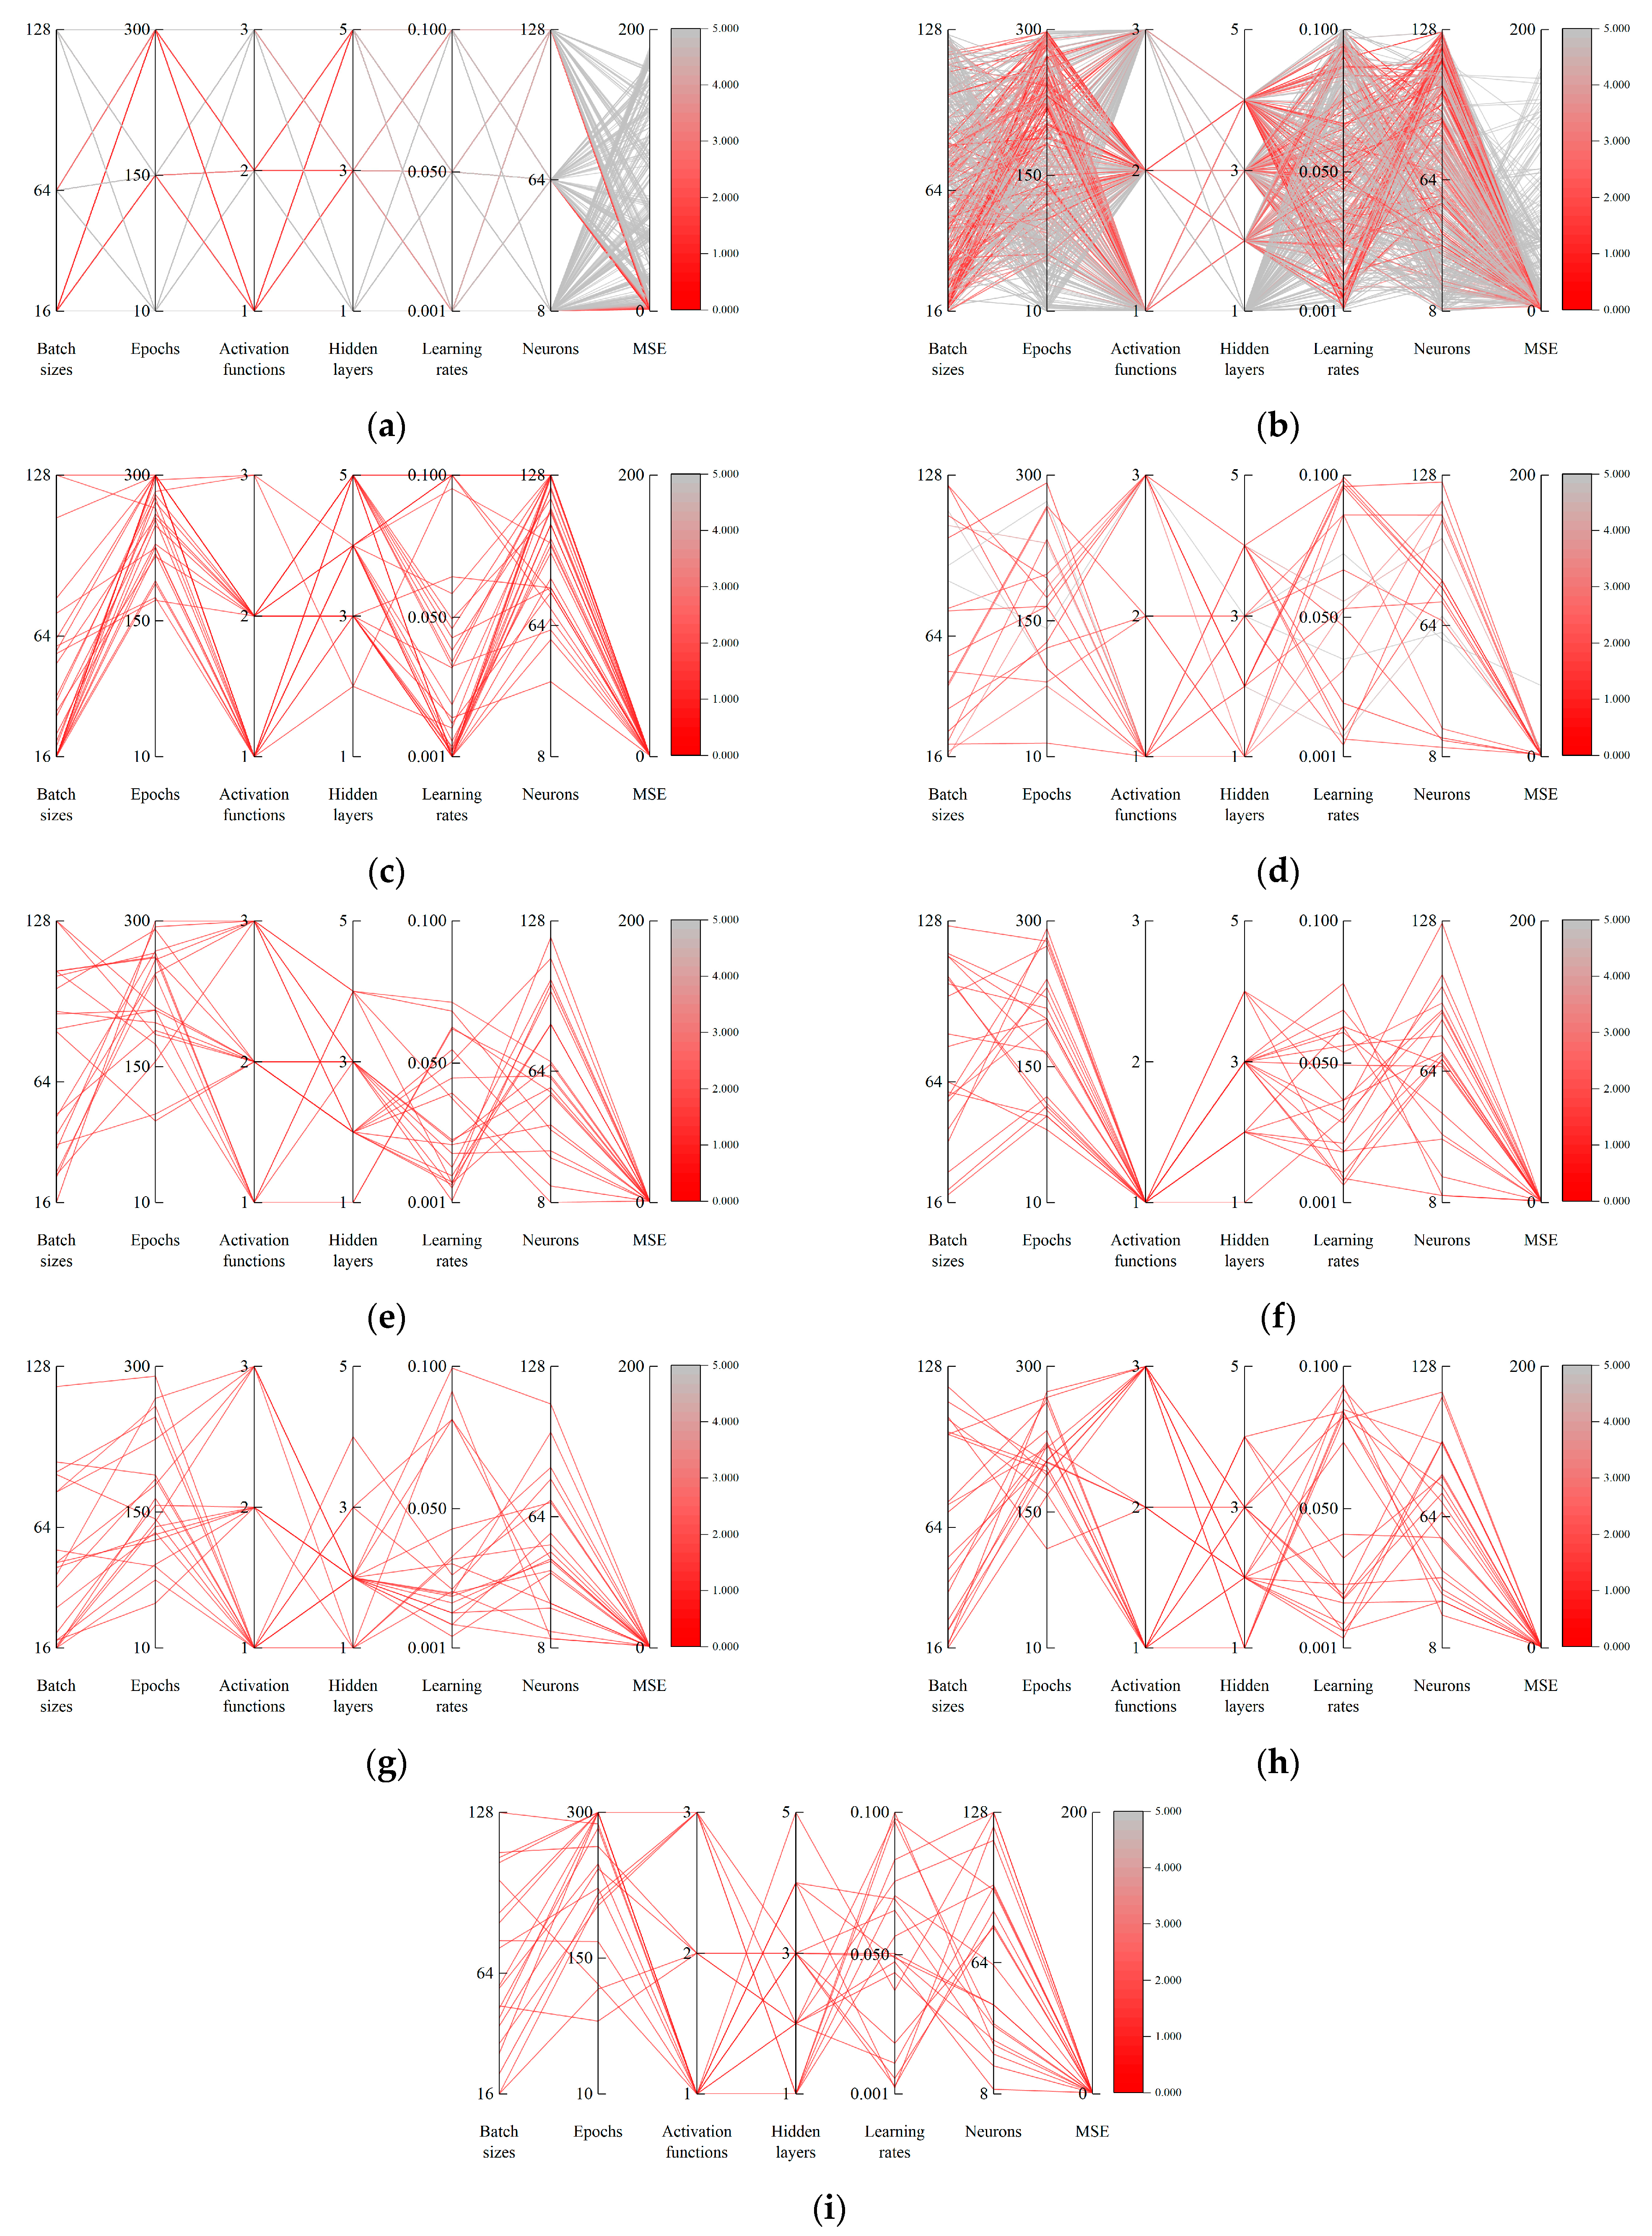
Figure 10 illustrates the hyperparameters explored by each HPO method using the 17-bar truss structure dataset. Similar to the findings from the 10-bar truss structure analysis, GS explores a minimal range of hyperparameters, relying only on predefined user inputs. Consequently, its MSE results exhibit significant variability. As a result of its random selection of hyperparameters, RS explores a broader range but still shows high variability in MSE results. In contrast, BO, CSA, GA, ACO, GWO, HSA, and PSO demonstrate broader exploration ranges and consistently outperform GS and RS in terms of MSE results. This is attributed to their ability to incorporate the outcomes of previous generations into subsequent iterations.
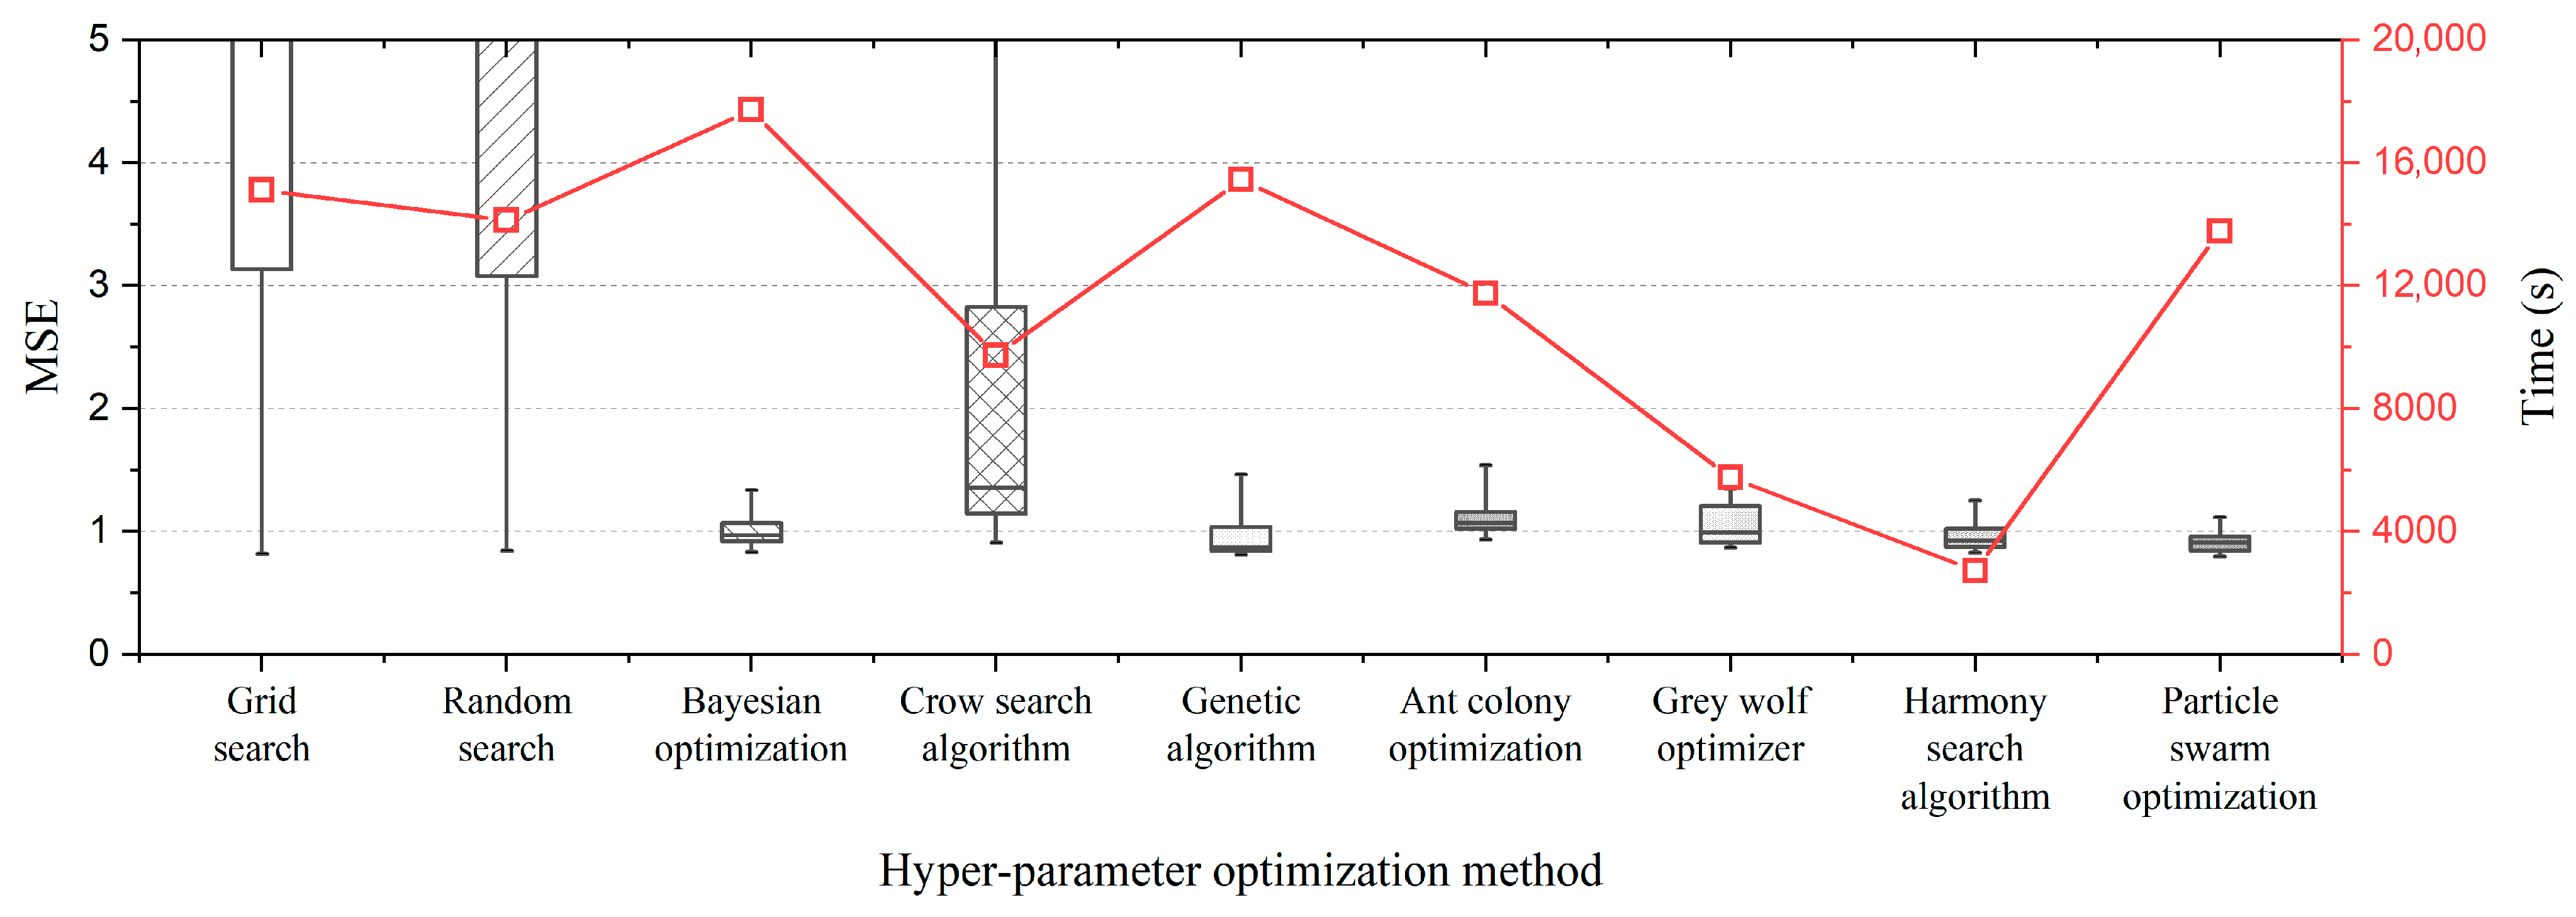
Figure 11 compares MSE and computation time across different HPO methods. The MSE results indicate that GS, RS, and CSA exhibit relatively high MSE values, demonstrating lower average performance. In contrast, BO, GA, ACO, GWO, HSA, and PSO achieve relatively low MSE values, indicating superior average performance.

4.3. Summary and Comparative Analysis of HPO Results

This section provides a comprehensive comparison and analysis of the prediction results for the 10-bar and 17-bar truss structures. By summarizing the prediction performance metrics (MSE, MAE, R2) and computational efficiency (total computation time and number of evaluations) of various HPO techniques applied to both structures, the overall performance trends and applicability of each algorithm are evaluated.
Table 10 and Table 11 present the average performance indicators (MSE, MAE, R2), total computation time (in seconds), and the number of evaluations (nEva) for each algorithm applied to the 10-bar and 17-bar truss structures, respectively. Overall, PSO achieved the best prediction accuracy for both structures, while HSA showed the shortest computation time. In contrast, conventional methods such as Grid Search (GS), Random Search (RS), and Bayesian Optimization (BO) required longer computation times due to a high number of evaluations caused by 3-fold cross-validation, and in many cases exhibited lower predictive performance compared to some metaheuristic algorithms. In particular, although PSO and BO showed similar levels of prediction accuracy, BO lagged significantly in terms of computation time. This discrepancy is attributed to differences in their search mechanisms. BO repeatedly trains and updates a Gaussian Process-based surrogate model during the optimization process, which incurs high computational costs. Moreover, since 3-fold cross-validation was applied to BO in this study, the evaluation time was further extended. On the other hand, PSO uses a population-based global search strategy without a surrogate model, resulting in fewer evaluations and a simpler computation process, which allows it to achieve comparable or even better performance in a shorter amount of time. These structural differences demonstrate that PSO may be more practical and efficient than BO in prediction problems such as those addressed in this study.
These results suggest that metaheuristic algorithms can achieve high predictive performance without repeated cross-validation, while also offering a cost-effective alternative for HPO. In particular, the low number of evaluations and simplicity of the computational process indicate that metaheuristic-based HPO methods hold high potential for real-world applications.

5. Conclusions

This study highlights the importance of hyperparameter optimization (HPO) in applying machine learning to the prediction of cross-sectional areas in truss structures. To address this, we performed a comparative analysis of conventional HPO methods, including Grid Search (GS), Random Search (RS), and Bayesian Optimization (BO), and six metaheuristic algorithms, including CSA, GA, ACO, GWO, HSA, and PSO, using datasets generated from 10-bar and 17-bar truss structures.
The results demonstrated that metaheuristic algorithms generally outperformed conventional methods in both prediction accuracy and computational efficiency. PSO achieved the best overall prediction performance, while HSA was the most time-efficient. Although BO showed comparable accuracy, it suffered from significantly longer computation times. The clear performance differences among the algorithms further emphasize the importance of selecting an appropriate HPO method based on the specific needs of the optimization task. In particular, the metaheuristic-based HPO used in this study achieved strong predictive performance and time efficiency without relying on k-fold cross-validation, demonstrating its potential as an alternative approach that can help mitigate overfitting while reducing computational cost. This characteristic suggests that metaheuristic algorithms can be a practical choice in real-world structural design tasks, especially in scenarios where quick decision-making and limited computational resources are critical.
The key contributions of this study are as follows.
  • First, we systematically applied HPO to the machine learning-based prediction of truss cross-sections—a topic that has received limited attention in prior research—and demonstrated its effectiveness using data derived from structural analysis.
  • Second, we conducted a fair and comprehensive comparison of nine HPO methods under consistent conditions, thereby providing practical guidelines for selecting suitable algorithms in structural design problems.
  • Third, we empirically analyzed the impact of various data normalization techniques on prediction performance and confirmed that Z-score normalization yields the most accurate results. This finding provides practical insight into the importance of data preprocessing in machine learning applications to structural optimization.
While this study is limited to 2D planar truss structures, the findings may not be fully generalizable to all structural types. Future research will aim to expand the dataset to include more complex 3D trusses, diverse geometric and material properties, and real-world design parameters such as elastic modulus and density. In addition, multi-objective optimization approaches that consider structural stability, constructability, and cost alongside prediction accuracy will be explored.

Author Contributions

Conceptualization, D.L. and J.K.; methodology, D.L. and J.K.; software, D.L.; validation, D.L., S.N., J.K. and S.L.; formal analysis, D.L. and S.N.; investigation, D.L.; data curation, D.L. and J.K.; writing—original draft preparation, D.L. and J.K.; writing—review and editing, D.L., J.K. and S.L.; visualization, D.L. and S.N.; supervision, D.L. and S.L.; project administration, D.L. and S.L.; funding acquisition, D.L. and S.L. All authors have read and agreed to the published version of the manuscript.

Funding

This research was supported by the National Research Foundation of Korea (NRF) grant funded by the Ministry of Science and ICT (RS-2024-00352968). In addition, this research was also supported by the Basic Science Research Program through the National Research Foundation of Korea (NRF), funded by the Ministry of Education (RS-2023-00244008).

Data Availability Statement

The data are contained within the article. The data from this research can be accessed upon request by contacting the corresponding author.

Conflicts of Interest

The authors declare no conflicts of interest.

Appendix A

Appendix A presents representative cross-sectional figures of the 10-bar and 17-bar truss structures used in this paper. These visualizations help demonstrate the geometric diversity of the generated datasets and their resemblance to real-word truss figures.
Figure A1. Distributions of cross-sectional areas for 10-bar truss structure. (a) Area vs. data index; (b) area vs. load; (c) area vs. stress; (d) area vs. displacement.
Buildings 15 02791 g0a1aBuildings 15 02791 g0a1b
Figure A2. Distributions of cross-sectional areas for 17-bar truss structure. (a) Area vs. data index; (b) area vs. load; (c) area vs. stress; (d) area vs. displacement.
Buildings 15 02791 g0a2

References

  1. Lee, D.; Shon, S.; Lee, S.; Ha, J. Size and Topology Optimization of Truss Structures Using Quantum-Based HS Algorithm. Buildings 2023, 13, 1436. [Google Scholar] [CrossRef]
  2. Lee, S.; Ha, J.; Shon, S.; Lee, D. Weight Optimization of Discrete Truss Structures Using Quantum-Based HS Algorithm. Buildings 2023, 13, 2132. [Google Scholar] [CrossRef]
  3. El-Kassas, E.; Mackie, R.; El-Sheikh, A. Using neural networks in cold-formed steel design. Comput. Struct. 2001, 79, 1687–1696. [Google Scholar] [CrossRef]
  4. Cheng, J.; Li, Q.S. A hybrid artificial neural network method with uniform design for structural optimization. Comput. Mech. 2009, 44, 61–71. [Google Scholar] [CrossRef]
  5. Yin, T.; Zhu, H.-P. Probabilistic damage detection of a steel truss bridge model by optimally designed Bayesian neural network. Sensors 2018, 18, 3371. [Google Scholar] [CrossRef]
  6. Liu, Z.; Jiang, A.; Shao, W.; Zhang, A.; Du, X. Artificial-neural-network-based mechanical simulation prediction method for wheel-spoke cable truss construction. Int. J. Steel Struct. 2021, 21, 1032–1052. [Google Scholar] [CrossRef]
  7. Mai, H.T.; Lee, S.; Kim, D.; Lee, J.; Kang, J.; Lee, J. Optimum design of nonlinear structures via deep neural network-based parameterization framework. Eur. J. Mech.-A/Solids 2023, 98, 104869. [Google Scholar] [CrossRef]
  8. Nguyen, L.C.; Nguyen-Xuan, H. Deep learning for computational structural optimization. ISA Trans. 2020, 103, 177–191. [Google Scholar] [CrossRef]
  9. Yu, Z. Frequency prediction and optimization of truss structure based on BP neural network. In Proceedings of the 2021 3rd International Conference on Artificial Intelligence and Advanced Manufacture, Manchester, UK, 23–25 October 2021; pp. 354–358. [Google Scholar]
  10. Liu, J.; Xia, Y. A hybrid intelligent genetic algorithm for truss optimization based on deep neutral network. Swarm Evol. Comput. 2022, 73, 101120. [Google Scholar] [CrossRef]
  11. Mai, H.T.; Lieu, Q.X.; Kang, J.; Lee, J. A novel deep unsupervised learning-based framework for optimization of truss structures. Eng. Comput. 2023, 39, 2585–2608. [Google Scholar] [CrossRef]
  12. Tran, M.Q.; Sousa, H.S.; Ngo, T.V.; Nguyen, B.D.; Nguyen, Q.T.; Nguyen, H.X.; Baron, E.; Matos, J.; Dang, S.N. Structural assessment based on vibration measurement test combined with an artificial neural network for the steel truss bridge. Appl. Sci. 2023, 13, 7484. [Google Scholar] [CrossRef]
  13. King, R.D.; Feng, C.; Sutherland, A. Statlog: Comparison of classification algorithms on large real-world problems. Appl. Artif. Intell. 1995, 9, 289–333. [Google Scholar] [CrossRef]
  14. Kohavi, R.; John, G.H. Automatic parameter selection by minimizing estimated error. In Proceedings of the Machine Learning Proceedings 1995 Morgan Kaufmann, Tahoe, CA, USA; 1995; pp. 304–312. [Google Scholar]
  15. Feurer, M.; Hutter, F. Hyperparameter optimization. In Automated Machine Learning: Methods, Systems, Challenges; Springer International Publishing: Cham, Switzerland, 2019; pp. 3–33. [Google Scholar]
  16. Bergstra, J.; Yamins, D.; Cox, D. Making a science of model search: Hyperparameter optimization in hundreds of dimensions for vision architectures. In Proceedings of the International conference on machine learning, Atlanta, GA, USA, 16–21 June 2013; pp. 115–123. [Google Scholar]
  17. Sculley, D.; Snoek, J.; Wiltschko, A.; Rahimi, A. Winner’s curse? On pace, progress, and empirical rigor. In Proceedings of the International Conference on Learning Representations 2018, Vancouver, BC, Canada, 30 April–3 May 2018. [Google Scholar]
  18. Yang, L.; Shami, A. On hyperparameter optimization of machine learning algorithms: Theory and practice. Neurocomputing 2020, 415, 295–316. [Google Scholar] [CrossRef]
  19. Jerebic, J.; Mernik, M.; Liu, S.-H.; Ravber, M.; Baketarić, M.; Mernik, L.; Črepinšek, M. A novel direct measure of exploration and exploitation based on attraction basins. Expert Syst. Appl. 2021, 167, 114353. [Google Scholar] [CrossRef]
  20. Zhang, Q.; Gao, H.; Zhan, Z.-H.; Li, J.; Zhang, H. Growth Optimizer: A powerful metaheuristic algorithm for solving continuous and discrete global optimization problems. Knowl. Based Syst. 2023, 261, 110206. [Google Scholar] [CrossRef]
  21. Hussain, K.; Salleh, M.N.M.; Cheng, S.; Shi, Y. Metaheuristic research: A comprehensive survey. Artif. Intell. Rev. 2019, 52, 2191–2233. [Google Scholar] [CrossRef]
  22. Nematzadeh, S.; Kiani, F.; Torkamanian-Afshar, M.; Aydin, N. Tuning hyperparameters of machine learning algorithms and deep neural networks using metaheuristics: A bioinformatics study on biomedical and biological cases. Comput. Biol. Chem. 2022, 97, 107619. [Google Scholar] [CrossRef] [PubMed]
  23. Bacanin, N.; Stoean, C.; Zivkovic, M.; Rakic, M.; Strulak-Wójcikiewicz, R.; Stoean, R. On the benefits of using metaheuristics in the hyperparameter tuning of deep learning models for energy load forecasting. Energies 2023, 16, 1434. [Google Scholar] [CrossRef]
  24. Nair, A.T.; Arivazhagan, M. Industrial activated sludge model identification using hyperparameter-tuned metaheuristics. Swarm Evol. Comput. 2024, 91, 101733. [Google Scholar] [CrossRef]
  25. Elaziz, M.A.; Dahou, A.; Abualigah, L.; Yu, L.; Alshinwan, M.; Khasawneh, A.M.; Lu, S. Advanced metaheuristic optimization techniques in applications of deep neural networks: A review. Neural Comput. Appl. 2021, 33, 14079–14099. [Google Scholar] [CrossRef]
  26. Kazemi, F.; Asgarkhani, N.; Jankowski, R. Optimization-based stacked machine-learning method for seismic probability and risk assessment of reinforced concrete shear walls. Expert Syst. Appl. 2025, 255, 124897. [Google Scholar] [CrossRef]
  27. Askarzadeh, A. A novel metaheuristic method for solving constrained engineering optimization problems: Crow search algorithm. Comput. Struct. 2016, 169, 1–12. [Google Scholar] [CrossRef]
  28. Lee, D.; Kim, J.; Shon, S.; Lee, S. An Advanced Crow Search Algorithm for Solving Global Optimization Problem. Appl. Sci. 2023, 13, 6628. [Google Scholar] [CrossRef]
  29. Andonie, R. Hyperparameter optimization in learning systems. J. Membr. Comput. 2019, 1, 279–291. [Google Scholar] [CrossRef]
  30. Shankar, K.; Zhang, Y.; Liu, Y.; Wu, L.; Chen, C.-H. Hyperparameter tuning deep learning for diabetic retinopathy fundus image classification. IEEE Access 2020, 8, 118164–118173. [Google Scholar] [CrossRef]
  31. Claesen, M.; Simm, J.; Popovic, D.; Moreau, Y.; De Moor, B. Easy hyperparameter search using optunity. arXiv 2014, arXiv:1412.1114. [Google Scholar]
  32. Bergstra, J.; Bengio, Y. Random search for hyper-parameter optimization. J. Mach. Learn. Res. 2012, 13, 281–305. [Google Scholar]
  33. Bischl, B.; Binder, M.; Lang, M.; Pielok, T.; Richter, J.; Coors, S.; Lindauer, M. Hyperparameter optimization: Foundations, algorithms, best practices, and open challenges. Wiley Interdiscip. Rev. Data Min. Knowl. Discov. 2023, 13, e1484. [Google Scholar]
  34. Hussien, A.G.; Amin, M.; Wang, M.; Liang, G.; Alsanad, A.; Gumaei, A.; Chen, H. Crow search algorithm: Theory, recent advances, and applications. IEEE Access 2020, 8, 173548–173565. [Google Scholar] [CrossRef]
  35. Holland, J.H. Genetic algorithms. Sci. Am. 1992, 267, 66–73. [Google Scholar] [CrossRef]
  36. Katoch, S.; Chauhan, S.S.; Kumar, V. A review on genetic algorithm: Past, present, and future. Multimed. Tools Appl. 2021, 80, 8091–8126. [Google Scholar]
  37. Dorigo, M. Optimization, Learning and Natural Algorithms. Ph.D. Thesis, Politecnico di Milano, Milan, Italy, 1992. [Google Scholar]
  38. Dorigo, M.; Blum, C. Ant colony optimization theory: A survey. Theor. Comput. Sci. 2005, 344, 243–278. [Google Scholar] [CrossRef]
  39. Dorigo, M.; Stützle, T. Ant colony optimization: Overview and recent advances. Springer Int. Public 2019, 272, 311–351. [Google Scholar]
  40. Mirjalili, S.; Mirjalili, S.M.; Lewis, A. Grey wolf optimizer. Adv. Eng. Softw. 2014, 69, 46–61. [Google Scholar] [CrossRef]
  41. Makhadmeh, S.N.; Al-Betar, M.A.; Abu Doush, I.; Awadallah, M.A.; Kassaymeh, S.; Mirjalili, S.; Abu Zitar, R. Recent advances in Grey Wolf Optimizer, its versions and applications. IEEE Access 2023, 12, 22991–23028. [Google Scholar] [CrossRef]
  42. Geem, Z.W.; Kim, J.H.; Loganathan, G.V. A new heuristic optimization algorithm: Harmony search. Simulation 2001, 76, 60–68. [Google Scholar] [CrossRef]
  43. Alia, O.M.; Mandava, R. The variants of the harmony search algorithm: An overview. Artif. Intell. Rev. 2011, 36, 49–68. [Google Scholar] [CrossRef]
  44. Eberhart, R.; Kennedy, J. A new optimizer using particle swarm theory, MHS’95. In Proceedings of the Sixth International Symposium on Micro Machine and Human Science, Nagoya, Japan, 4–6 October 1995; pp. 39–43. [Google Scholar]
  45. Kennedy, J.; Eberhart, R. Particle swarm optimization. In Proceedings of the ICNN’95-International Conference on Neural Networks, Perth, Australia, 4 November 1995; pp. 1942–1948. [Google Scholar]
  46. Wang, D.; Tan, D.; Liu, L. Particle swarm optimization algorithm: An overview. Soft Comput. 2018, 22, 387–408. [Google Scholar]
  47. Lee, K.S.; Geem, Z.W. A new structural optimization method based on the harmony search algorithm. Comput. Struct. 2004, 82, 781–798. [Google Scholar] [CrossRef]
  48. Hasançebi, O.; Azad, S.K.; Azad, S.K. Automated sizing of truss structures using a computationally improved SOPT algorithm. Int. J. Optim. Civ. Eng. 2013, 3, 209–221. [Google Scholar]
  49. Massah, S.R.; Ahmadi, H. Weight Optimization of Truss Structures by the Biogeography-Based Optimization Algorithms. Civ. Eng. Infrastruct. J. 2021, 54, 129–144. [Google Scholar]
  50. Smith, L.N. A disciplined approach to neural network hyper-parameters: Part 1—learning rate, batch size, momentum, and weight decay. arXiv 2018, arXiv:1803.09820. [Google Scholar]
  51. Fridrich, M. Hyperparameter optimization of artificial neural network in customer churn prediction using genetic algorithm. Trendy Ekon. Manag. 2017, 11, 9. [Google Scholar]
  52. Kalliola, J.; Kapočiūtė-Dzikienė, J.; Damaševičius, R. Neural network hyperparameter optimization for prediction of real estate prices in Helsinki. PeerJ Comput. Sci. 2021, 7, e444. [Google Scholar] [CrossRef]
  53. Keskar, N.S.; Mudigere, D.; Nocedal, J.; Smelyanskiy, M.; Tang, P.T.P. On large-batch training for deep learning: Generalization gap and sharp minima. arXiv 2016, arXiv:1609.04836. [Google Scholar]
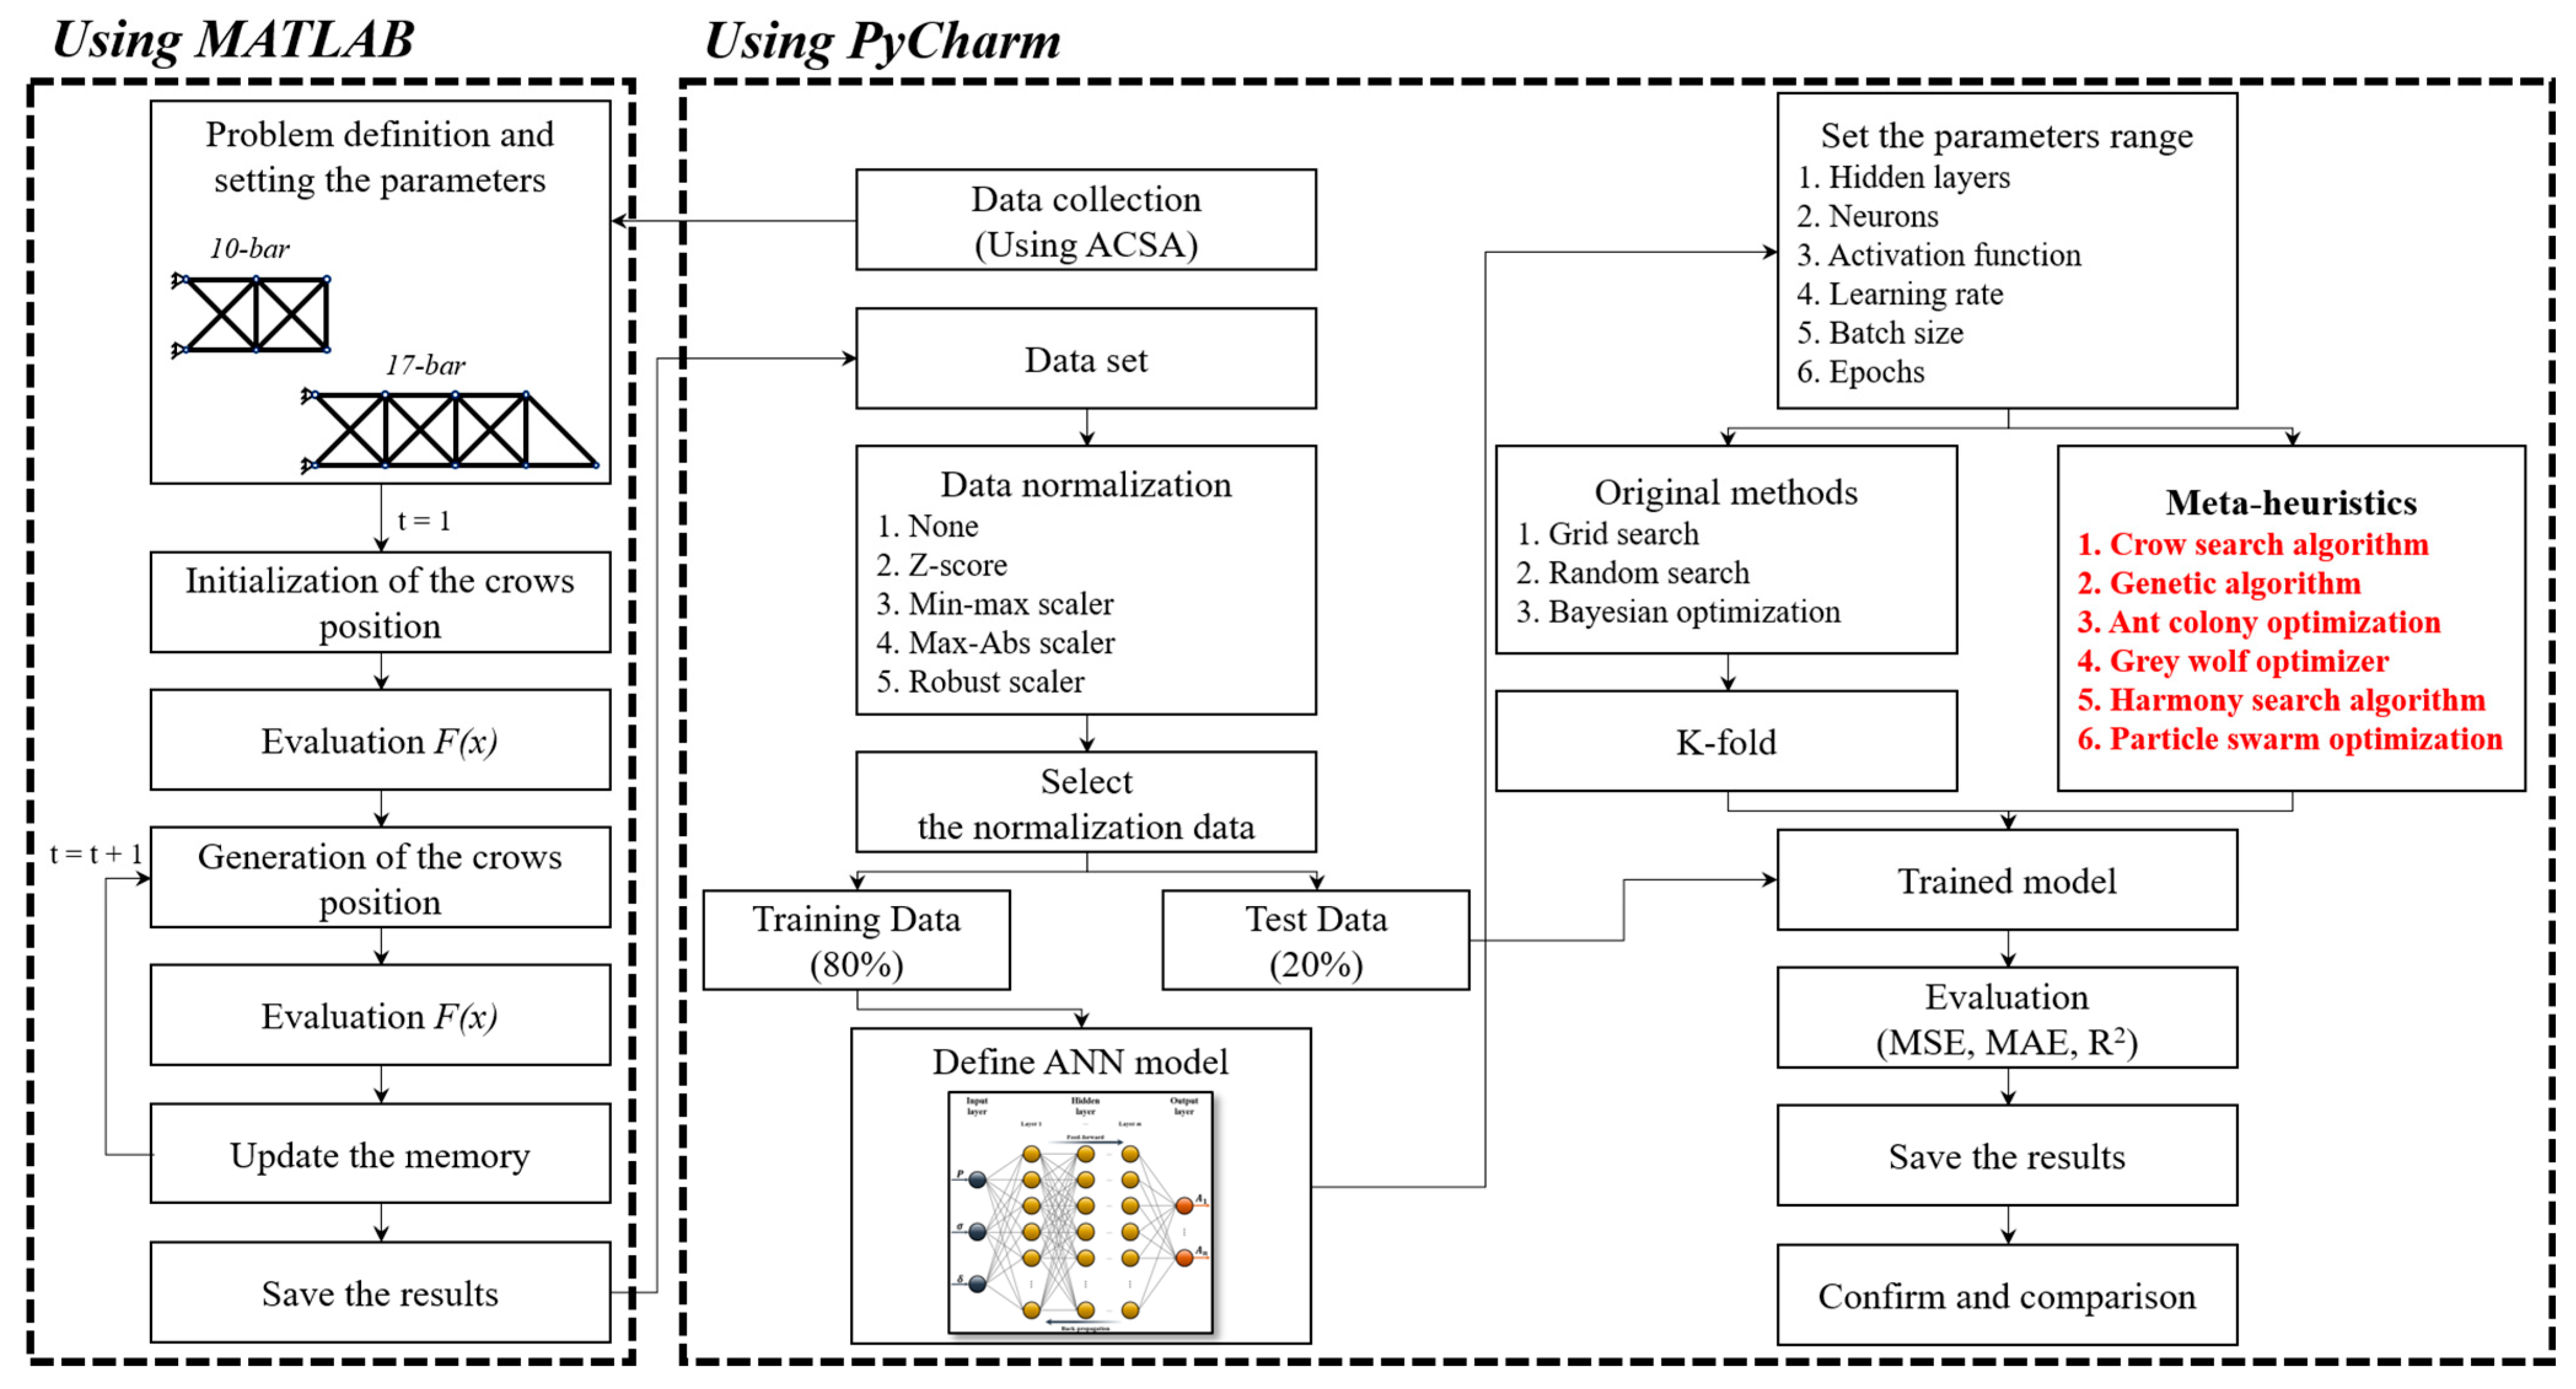
Figure 1. Workflow of the proposed framework.
Buildings 15 02791 g001
Figure 2. Modeling of 10-bar truss structure.
Buildings 15 02791 g002
Figure 3. Modeling of 17-bar truss structure.
Buildings 15 02791 g003
Figure 4. The 10-bar truss structure datasets by weight.
Buildings 15 02791 g004
Figure 5. Normalization results graph of 10-bar truss structure. (a) MSE; (b) MAE; (c) R2.
Buildings 15 02791 g005
Figure 6. Hyperparameters optimization range of 10-bar truss structure. (a) GS; (b) RS; (c) BO; (d) CSA; (e) GA; (f) ACO; (g) GWO; (h) HSA; (i) PSO.
Buildings 15 02791 g006
Figure 7. MSE and time results for 10-bar truss structure datasets.
Buildings 15 02791 g007
Figure 8. The 17-bar truss structure datasets by weight.
Buildings 15 02791 g008
Figure 9. Normalization results graph of 17-bar truss structure. (a) MSE; (b) MAE; (c) R2.
Buildings 15 02791 g009
Figure 10. Hyperparameter optimization range of 17-bar truss structure. (a) GS; (b) RS; (c) BO; (d) CSA; (e) GA; (f) ACO; (g) GWO; (h) HSA; (i) PSO.
Buildings 15 02791 g010
Figure 11. MSE and time results for 17-bar truss structure datasets.
Buildings 15 02791 g011
Table 1. ACSA parameters for weight optimization of examples.
TypeParameters
10-bar truss structureD = 10, tmax = 3000, N = 10, fl = 2.0, APmax = 0.4, APmin = 0.01, FAR = 0.4
17-bar truss structureD = 17, tmax = 5000, N = 10, fl = 2.0, APmax = 0.4, APmin = 0.01, FAR = 0.4
Table 2. Data range of 10-bar truss structure.
TypeRange
Load (kips)10, 20, 30, 40, 50, 60, 70, 80, 90, 100, 110, 120, 130, 140, 150, 160
Maximum stress (ksi)19, 21, 23, 25, 27, 29, 31
Maximum displacement (in)0.5, 1.0, 1.5, 2.0, 2.5, 3.0, 3.5
Table 3. Data range of 17-bar truss structure.
TypeRange
Load (kips)10, 20, 30, 40, 50, 60, 70, 80, 90, 100, 110, 120, 130, 140, 150, 160
Maximum stress (ksi)44, 46, 48, 50, 52, 54, 56
Maximum displacement (in)0.5, 1.0, 1.5, 2.0, 2.5, 3.0, 3.5
Table 4. Range of hyperparameter optimization methods.
MethodsRange
GSHidden layers = [1, 3, 5]
Neurons = [8, 64, 128]
Activation function = [1: ReLU, 2: Sigmoid, 3: Tan-Sigmoid]
Learning rates = [0.001, 0.05, 0.1]
Batch size = [16, 64, 128]
Epochs = [10, 150, 300]
RS, BO, CSA, GA, ACO, GWO, HAS, and PSOHidden layers = [1, 5]
Neurons = [8, 128]
Activation function = [1: ReLU, 2: Sigmoid, 3: Tan-Sigmoid]
Learning rates = [0.001, 0.1]
Batch size = [16, 128]
Epochs = [10, 300]
Table 5. Parameters for HPS methods.
MethodsParametersnEva
GSK-fold = 32187
RSnLoop = 729, K-fold = 32187
BSnIter = 20, nLoop = 35, K-fold = 32100
CSAnLoop = 20, n = 5, nGen = 20, AP = 0.2, fl = 22000
GAnLoop = 20, n = 5, nGen = 20, mutation = 0.1, crossover = 0.72000
ACOnLoop = 20, n = 5, nGen = 20, evaporation = 0.5, pheromone = 1.02000
GWOnLoop = 20, n = 5, nGen = 20, a_initial = 2.0, a_final = 02000
HSAnLoop = 20, n = 5, nGen = 20, HMCR = 0.9, PAR = 0.3, Pitch = 0.052000
PSOnLoop = 20, n = 5, nGen = 20, w = 0.5, c1 = 1.5, c2 = 1.52000
Table 6. Dataset information for 10-bar truss structure.
IndexMinMaxMeanStd.
A11.42035.00020.70310.864
A20.10015.8560.5401.829
A30.79035.00017.25610.263
A40.43535.00011.7488.097
A50.1002.6160.1700.305
A60.10015.9010.6801.830
A70.10035.0007.0266.191
A80.10035.00015.5149.457
A90.67535.00015.8309.567
A100.10035.0000.7383.071
Table 7. Normalization results of 10-bar truss structure.
IndexNoneZ-ScoreMin-MaxMax-AbsRobust
MSE4.58172.83554.70723.87173.4296
MAE1.27380.91191.25001.10401.0382
R20.30830.67040.60630.62670.6166
Table 8. Dataset information for 17-bar truss structure.
IndexMinMaxMeanStd.
A10.62635.00014.43610.725
A20.10035.0001.8142.467
A30.48435.00012.8849.725
A40.1009.2991.1281.471
A50.44135.0009.5327.612
A60.10035.0005.2845.641
A70.23135.00011.3899.719
A80.10035.0001.1451.910
A90.27235.0008.2327.572
A100.10035.0001.3252.126
A110.13035.0005.2374.927
A120.10035.0001.3802.039
A130.29635.0006.4505.808
A140.10035.0004.7564.574
A150.10035.0005.0075.626
A160.10035.0001.5612.564
A170.10035.0005.6315.913
Table 9. Normalization results of 17-bar truss structure.
IndexNoneZ-ScoreMin-MaxMax-AbsRobust
MSE5.41843.29374.28944.08073.1174
MAE1.47601.18301.36221.32231.1820
R20.56360.67810.60580.61170.7017
Table 10. Summary of HPO results of 10-bar truss structure.
MethodMSEMAER2Time (s)
MeanBestMeanBestMeanBest
GS45.6680.8173.2100.52440.0160.85015,109.48
RS18.8280.8432.0380.5470.4230.80614,120.52
BO1.0110.8300.5860.5430.8290.85017,726.25
CSA4.4990.9081.0220.5680.7040.8339730.93
GA0.9510.8100.6580.5290.7970.84415,446.18
ACO1.1010.9350.7430.6300.7810.83011,742.17
GWO1.0550.8690.7070.6100.7850.8355761.11
HSA0.9680.8260.6700.6320.7830.7912716.88
PSO0.9130.7990.7290.5660.7730.83413,771.43
Table 11. Summary of HPO results of 17-bar truss structure.
MethodMSEMAER2Time (s)
MeanBestMeanBestMeanBest
GS15.5172.5102.1051.0740.3430.74517,574.93
RS9.6852.4981.7431.0540.5090.75019,265.74
BO2.5592.4641.0711.0550.7440.74918,586.78
CSA9.7922.8141.8351.1700.5160.72815,244.83
GA2.6592.4961.2481.0700.6910.74218,135.92
ACO2.7212.5671.3171.0860.6680.73415,253.99
GWO2.6762.5071.1731.0750.7010.7339011.93
HSA2.5992.5091.2691.0820.6750.7452450.20
PSO2.5492.4691.2371.0550.6890.74512,747.31
Disclaimer/Publisher’s Note: The statements, opinions and data contained in all publications are solely those of the individual author(s) and contributor(s) and not of MDPI and/or the editor(s). MDPI and/or the editor(s) disclaim responsibility for any injury to people or property resulting from any ideas, methods, instructions or products referred to in the content.