Article

A Concise Grid-Based Model Revealing the Temporal Dynamics in Indoor Infection Risk

School of Energy and Environment, Southeast University, Nanjing 211189, China
*
Author to whom correspondence should be addressed.
Buildings 2025, 15(15), 2786; https://doi.org/10.3390/buildings15152786
Submission received: 28 May 2025 / Revised: 20 July 2025 / Accepted: 5 August 2025 / Published: 6 August 2025
(This article belongs to the Special Issue Development of Indoor Environment Comfort)

Abstract

Determining the transmission routes of pathogens in indoor environments is challenging, with most studies limited to specific case analyses and pilot experiments. When pathogens are instantaneously released by a patient in an indoor environment, the peak infection risk may not occur immediately but may instead appear at a specific moment during the pathogen’s spread. We developed a concise model to describe the temporal crest of infection risk. The model incorporates the transmission and degradation characteristics of aerosols and surface particles to predict infection risks via air and surface routes. Only four real-world outbreaks met the criteria for validating this phenomenon. Based on the available data, norovirus is likely to transmit primarily via surface touch (i.e., the fomite route). In contrast, crests of infection risk were not observed in outbreaks of respiratory diseases (e.g., SARS-CoV-2), suggesting a minimal probability of surface transmission in such cases. The new model can serve as a preliminary indicator for identifying different indoor pathogen transmission routes (e.g., food, air, or fomite). Further analyses of pathogens’ transmission routes require additional evidence.

1. Introduction

Pathogens in the environment can be transmitted from the source patient to susceptible individuals through various routes, including air, fomites, food, and water [1,2,3]. However, determining the relative contribution of each route to the transmission of a pathogen is often challenging [4].
Most studies investigating pathogen transmission routes have relied on indirect evidence from specific case studies [5,6] or controlled experiments conducted using pathogen surrogates [7,8]. Some studies have used animals in laboratories as the hosts to explore the transmission pathways of live viruses. For example, the influenza A virus was shown to be transmissible between guinea pigs via aerosolized fomites [7]. In field studies, different tracers (e.g., nonmicrobial markers, microbial surrogates, and genetic materials) have been used to observe the spatiotemporal dynamics of pathogens, demonstrating that contaminated surfaces contribute to disease transmission. However, animals and tracers do not perfectly represent humans and live viruses due to differences in behavior and viability. Although target viruses or their RNA materials have been detected on environmental surfaces in some case studies [9,10,11], they were present in very low levels, and few studies have isolated viable viruses on environmental surfaces [12]. Some studies have combined modeling and numerical simulation to predict or reproduce the infection risks of pathogens along different transmission routes in real outbreak scenarios [13,14]; however, these models and conclusions may not be generalizable to other scenarios. In most cases, it is difficult to balance a model’s complexity with its broad applicability.
Therefore, drawing on the principle of parsimony [15], we aimed to develop a streamlined, widely applicable model containing only the most essential elements to help identify indoor pathogen transmission routes. For a target disease from an instantaneous source, as the pathogen spreads across more surfaces or a larger air volume, more areas become contaminated. Simultaneously, the infection risk per unit area decreases due to pathogen degradation (e.g., death, dilution, or increased surface adhesion [16]). At a certain point during this process, the highest infection risk (quantified using models such as the multi-hit model [17]) is reached.
Inspired by the aforementioned phenomenon, we developed a model to describe dispersion events, in which the total “effect” of an assumed spreading agent is considered a combination of its unit intensity and effective scope. We then used the model to simulate infection risks for both fomite and airborne transmission routes under typical indoor conditions. Data in existing case studies suggest that the new model can provide a straightforward approach to identifying indoor pathogen transmission routes. Moreover, this new model could potentially be extended to characterize the temporal patterns of other diffusion phenomena, such as disease pandemics, product sales, and information dissemination.

2. Materials and Methods

2.1. Model Development

2.1.1. Model Framework

Pathogens spread across surfaces or through the air while simultaneously degrading in the environment. Thus, we developed a concise model to describe the latent rise-and-fall pattern in infection risk during the dispersion of pathogen-laden particles in an indoor environment (see Figure 1a).
The spread and degradation of pathogens was modeled using a two-dimensional (2D) grid. Each column in the model grid represents a surface (or a unit volume of air), and each row represents a certain pathogen-survival rate. Pathogen-laden particles spreading outward and downward from the top-center grid cell simulate a pathogen spreading across surfaces (or air parcels) while degrading. A single dispersion step of the model represents one instance of pathogen exchange between adjacent surfaces (or air volumes) or a one-level reduction in the survival rate. The detailed design of the model framework is introduced as follows.
Grid design: As shown in Figure 1b, we assume a vertical 2D grid with N columns and M rows representing different surfaces (or air volume) and different levels of infectivity, respectively.
Spreading rule: To simulate pathogen spread, a given number of pathogen-laden particles are released from the middle cell in the top row, and their movement is simulated step by step. At each step, each particle randomly moves one cell horizontally (left or right), moves one cell downward, or remains stationary. Based on these rules, in each step, a particle has a 1/4 probability of moving downward. This defines the degradation rate of the pathogens.
Pathogen survival rate: In the 2D grid model, the steps are assumed to last equal time intervals. During each step, particles are exchanged between adjacent columns, with each particle having a 1/4 probability of degrading (i.e., moving downward, as mentioned earlier). Statistically, the average degradation time equals a quarter of the total steps (i.e., T/4). The pathogen survival rate S is modeled as an exponential decay under constant indoor conditions and no particle interaction, as shown in Equation (1).
S = e x p λ × T / 4
where T represents the number of steps, and T/4 is the average number of rows by which a pathogen (particle n) moves downward in the model grid after T steps. According to the exponential decay principle (see Appendix A.1), λ = ln(2)/half-life of the pathogen.
Model of 3D grid: As shown in Figure 1c, the model can be extended to a 3D grid, where the two horizontal axes represent the spatial spread of particles, and the vertical axis represents particle degradation. In this framework, we assume that each particle has an equal probability of moving one cell downward (1/4), horizontally along the x-axis (1/8 left and 1/8 right), along the y-axis (1/8 forward and 1/8 backward), or remaining stationary (1/4).

2.1.2. Infection Risk in an Indoor Environment

Assume that an individual, upon touching a surface or inhaling an air volume (i.e., site n), acquires all the pathogen particles present, and any single particle retaining infectivity can result in the individual’s infection. Then, the infection probability of site n (pn) for this individual can be calculated using Equation (2).
p n = 1 1 S n 1 1 S n 2
where Sn1, Sn2, … denote the survival rates of particles 1, 2, … at site n, as calculated by Equation (1).
Equation (2) reflects a nonlinear relationship between pathogen viability and infection probability. When an individual randomly touches a surface or inhales an air volume (e.g., site n) with a touch or inhalation probability qn and acquires all the pathogen particles present, the average infection probability in the entire setting can be calculated using Equation (3).
P = n = 1 N p n × q n
where P reflects the ideal infection risk per unit occupancy time in an indoor environment at a specific moment of pathogen transmission, and n = 1 N q n = 1 . Although P should be a function of λ and T, we do not specify this in Equation (3). In practice, individuals can stay in a setting for a period during which they touch multiple surfaces (or inhale multiple air parcels). Thus, the practical infection risk should be calculated as described in Equation (4).
P R e , λ , T 1 , T 2 = 1 T = T 1 T 2 1 e × P λ , T
where e denotes the infective efficiency of a pathogen particle once it has been acquired via touch or inhalation, and PR is the practical infection risk for an individual during time steps T1T2. Thus, if a group of people is exposed to pathogens for the same period, the maximum-likelihood value of the attack rate (A)—defined as the ratio of infected people to the total number of people in the group—is equivalent to the practical infection risk for an individual, i.e., A = PR.
Different from the ideal infection risk P in Equation (3), the term A (or PR in Equation (4)) relates specific situations with a given exposure period (T1T2), infective efficiency (e), and pathogen viability (λ). Of these parameters, λ determines the timing of the crest, while T1T2 and e along with the particle numbers are approximately proportional to PR and have an equivalent effect such that an increase in one can compensate for another.

2.2. Simulation of Pathogen Spread

2.2.1. Particle Spread in Idealized Grids

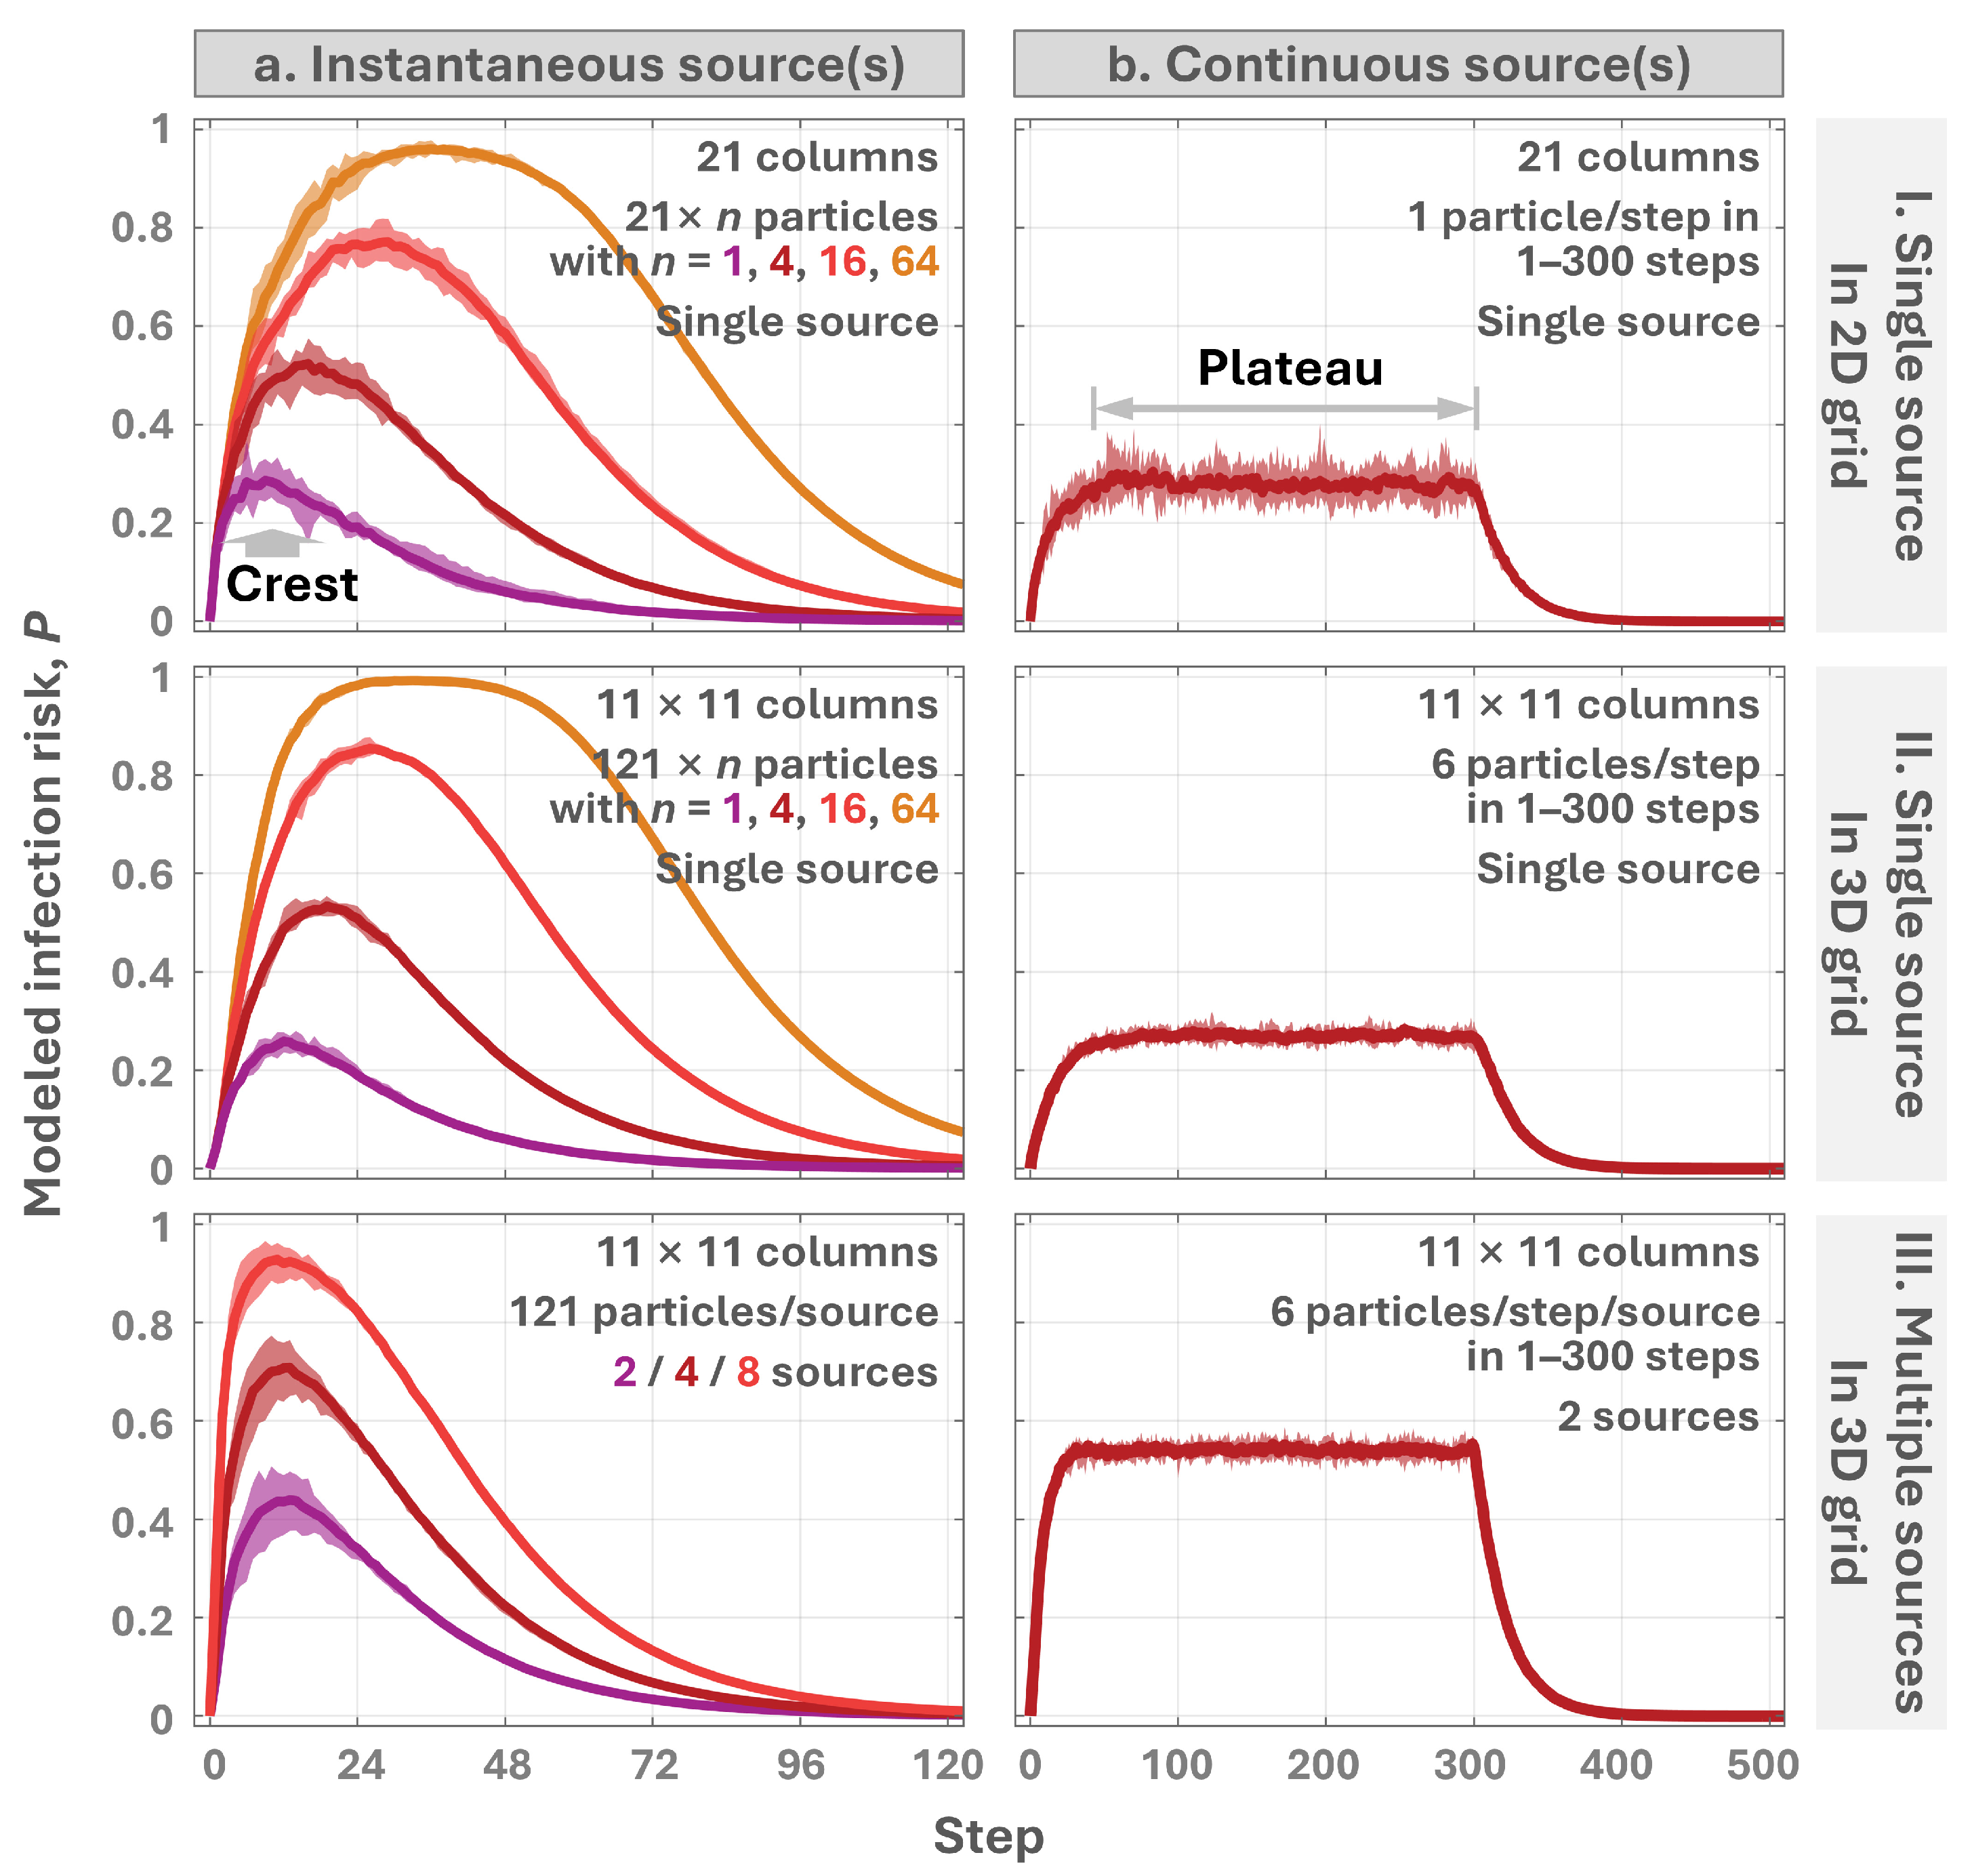
To examine the effects of model parameters, we simulated particle spread in idealized grids. First, a 2D grid with 21 columns and an infinite number of rows was established. Particles—equal in number to the columns—were released from the central top cell at step 0, spreading outward and downward while degrading with a half-life of 3 rows.
We further tested 3D grids with 11 × 11 columns and infinite rows, introducing varying particle densities (equal to 1, 4, 16, and 64 times the number of columns) and multiple release points (2, 4, and 8 sources randomly located in the top row). As a comparison, continuous sources were simulated by releasing one particle per step in 2D grids, or six per step in 3D grids, for the first 300 steps, maintaining a consistent particle-to-column ratio between the 2D and 3D grids.
Each scenario was simulated 10 times in parallel. The average infection risk (P in Equation (3)) was recorded at each step to capture its evolution over time.

2.2.2. Pathogen Spread via Surface Touch

Pathogen spread via surface touch is simulated based on typical parameter values collected from real-life scenarios [18,19]. According to prior studies, in a household or office environment [8,20,21], approximately 400–2000 surfaces are touched 10,000–200,000 times by occupants every day (as summarized in Table 1 in Zhao et al. [21]). Therefore, we assume that a source patient releases virus-laden particles at a single moment in an indoor environment. These particles gradually spread across 500 surfaces via surface touch, with each surface being touched an average of 50 times daily. Viruses on fomites have been observed to decay by 1–3 orders of magnitude over a period of two days to six weeks [22]. Accordingly, the pathogen’s half-life on these surfaces is set to one day.
Based on the aforementioned parameters, we set the model grid to have 500 columns representing the 500 surfaces. As each surface is estimated to be touched 50 times per day, the pathogen particles randomly move left, right, or downward or stay stationary for 50 steps/day and consequently drop 12.5 rows daily on average. Thus, the value of λ in Equation (1) is calculated to be ln(2)/12.5. We simulated the release of 500 pathogen-laden particles from the top-center grid cell. Step-by-step simulations were performed to track the variation in infection risk (P in Equation (3)).
We also changed the number of surfaces (N) to 250 and the pathogen’s half-life to two days (λ = ln(2)/25) to observe how the spreading scope and degradation rate affect the infection risk.

2.2.3. Pathogen Diffusion in Indoor Air

Pathogen diffusion in indoor air is simulated for typical settings. For a room with an area of 30–100 m2 and a height of 3–4 m [8,20,21], the air volume is approximately 90–400 m3. The typical airspeed for minimal comfort is around 0.15 m/s [23]. Therefore, we assume that pathogen-laden particles are continuously released by a source patient over 2 h in a 100 m3 room, with an average indoor airspeed of 0.1 m/s. The room is divided into 100 air parcels of 1 m3 each, which exchange pathogens every 10 s. The pathogen’s half-life in the room is set to 30 min [23] considering the effects of air ventilation (with a typical air-change rate of 0.5 h−1 [24]), particle deposition (with deposition rates of 2–4 h−1 in residential houses [25]), and microbial death (decay by 1–3 orders of magnitude over a period of 2 days to 6 weeks [22]).
Based on the aforementioned parameters, we set the model grid to have 100 columns, representing the 100 air cubes, each with a volume of 1 m3. An airspeed of 0.1 m/s yields a particle exchange interval of 10 s between adjacent air cubes. Therefore, each simulation step corresponds to 10 s, resulting in 360 steps/hour. The decay rate λ is thus calculated as ln(2)/45. We simulated the gradual release of 720 pathogen-laden particles over a two-hour period, with one particle released every 10 s (i.e., one particle per step) from the top-center grid cell. Step-by-step simulations were conducted to track the variation in infection risk (P in Equation (3)).
We also adjusted the release rate to one particle every two steps (20 s) over a four-hour period in order to observe its effect on infection risk. Note that a minimal airspeed of 0.1 m/s was set in the simulation to capture the most prominent potential crest of infection risk. A higher airspeed would lead to faster particle dispersion and an earlier crest that would merge with the source release period and become unobservable.

2.3. Model Validation

To validate the new model, we collected reports of disease outbreaks in confined spaces, which describe situations where multiple groups of visitors, without inter-group contact or overlapping visiting times, were infected after successive visits. Using Google Scholar, we searched for case studies published before 2024 using keywords such as “outbreak”, “attack rate”, “multiple groups”, and “infection.” Only four outbreaks, all caused by norovirus, met the criteria, as shown in Table 1.
Table 1. Reports of indoor disease outbreaks involving multiple groups of visitors without inter-group contact or overlapping visiting times.
No.StudyLocationTimeOnset/Total Interviewed People
I.Kimura et al., 2011 [26]A hotel2–10 December 2006345/approx. 2700
II.Isakbaeva et al., 2005 [27]A cruise ship16 November 2002–4 January 2003587/approx. 20,000
III.Thornley et al., 2011 [28]A flight cabin13–18 October 200927/63
IV.Jones et al., 2007 [29]Four houseboats9–29 May 200420/27
We use the attack rate A as a measure of infection risk in an indoor environment. Under every setting listed in Table 1, the pathogen attack rate is calculated separately for each of the consecutive visiting groups. Thus, the temporal variation in the infection risk and the potential crest of infection risk can be observed.
We assume that each setting includes 500 surfaces and an equal number of pathogen-laden particles. The maximum-likelihood attack rate via fomite route is also fitted based on Equation (4) with different e and λ values. Reasonable values of e and λ obtained from the simulation can be considered as a validation of fomite transmission.

2.4. Statistical Analysis

Each dataset of attack rate values was normalized so that the sum equaled 1, and its cumulative distribution was then calculated. The Kolmogorov–Smirnov (KS) test was conducted to compare the paired datasets from model prediction and empirical measurements in order to validate the new model. A p-value greater than 0.05 was considered indicative of no significant difference between the two distributions.

3. Results

3.1. Model Framework and Simulation Insights

The simulation results (Figure 2) show that for instantaneous pathogen sources (Figure 2a), the infection risk (P, as defined in Equation (3)) exhibits a crest over time, where time is measured in simulation steps. The timing and magnitude of this peak are independent of the grid dimension and column number. Comparing plots I and II, higher dimensions and finer grids improve prediction accuracy as they reduce variation across simulations. In fact, the half-life of the infectious particles primarily affects the infection risk after the crest, with minimal influence on the timing of the crest. In contrast, higher particle concentrations increase the average infection risk, and multiple sources accelerate spatial spread, leading to an earlier crest.
When particles are released continuously over time (Figure 2b), the infection risk forms a plateau. The duration of this plateau is determined more by the release behavior than by environmental spread. Once the release stops, the risk rapidly declines.
These two release modes reflect key differences between surface-touch and airborne transmission. In surface-touch scenarios, infection risk is mainly governed by the spread and persistence of particles. In contrast, airborne transmission exhibits infection risk that closely follows the active release period due to rapid air diffusion. Accordingly, we further analyze these two transmission routes within representative indoor environments.

3.2. Temporal Variation in the Infection Risk for Surface and Air Pathogens

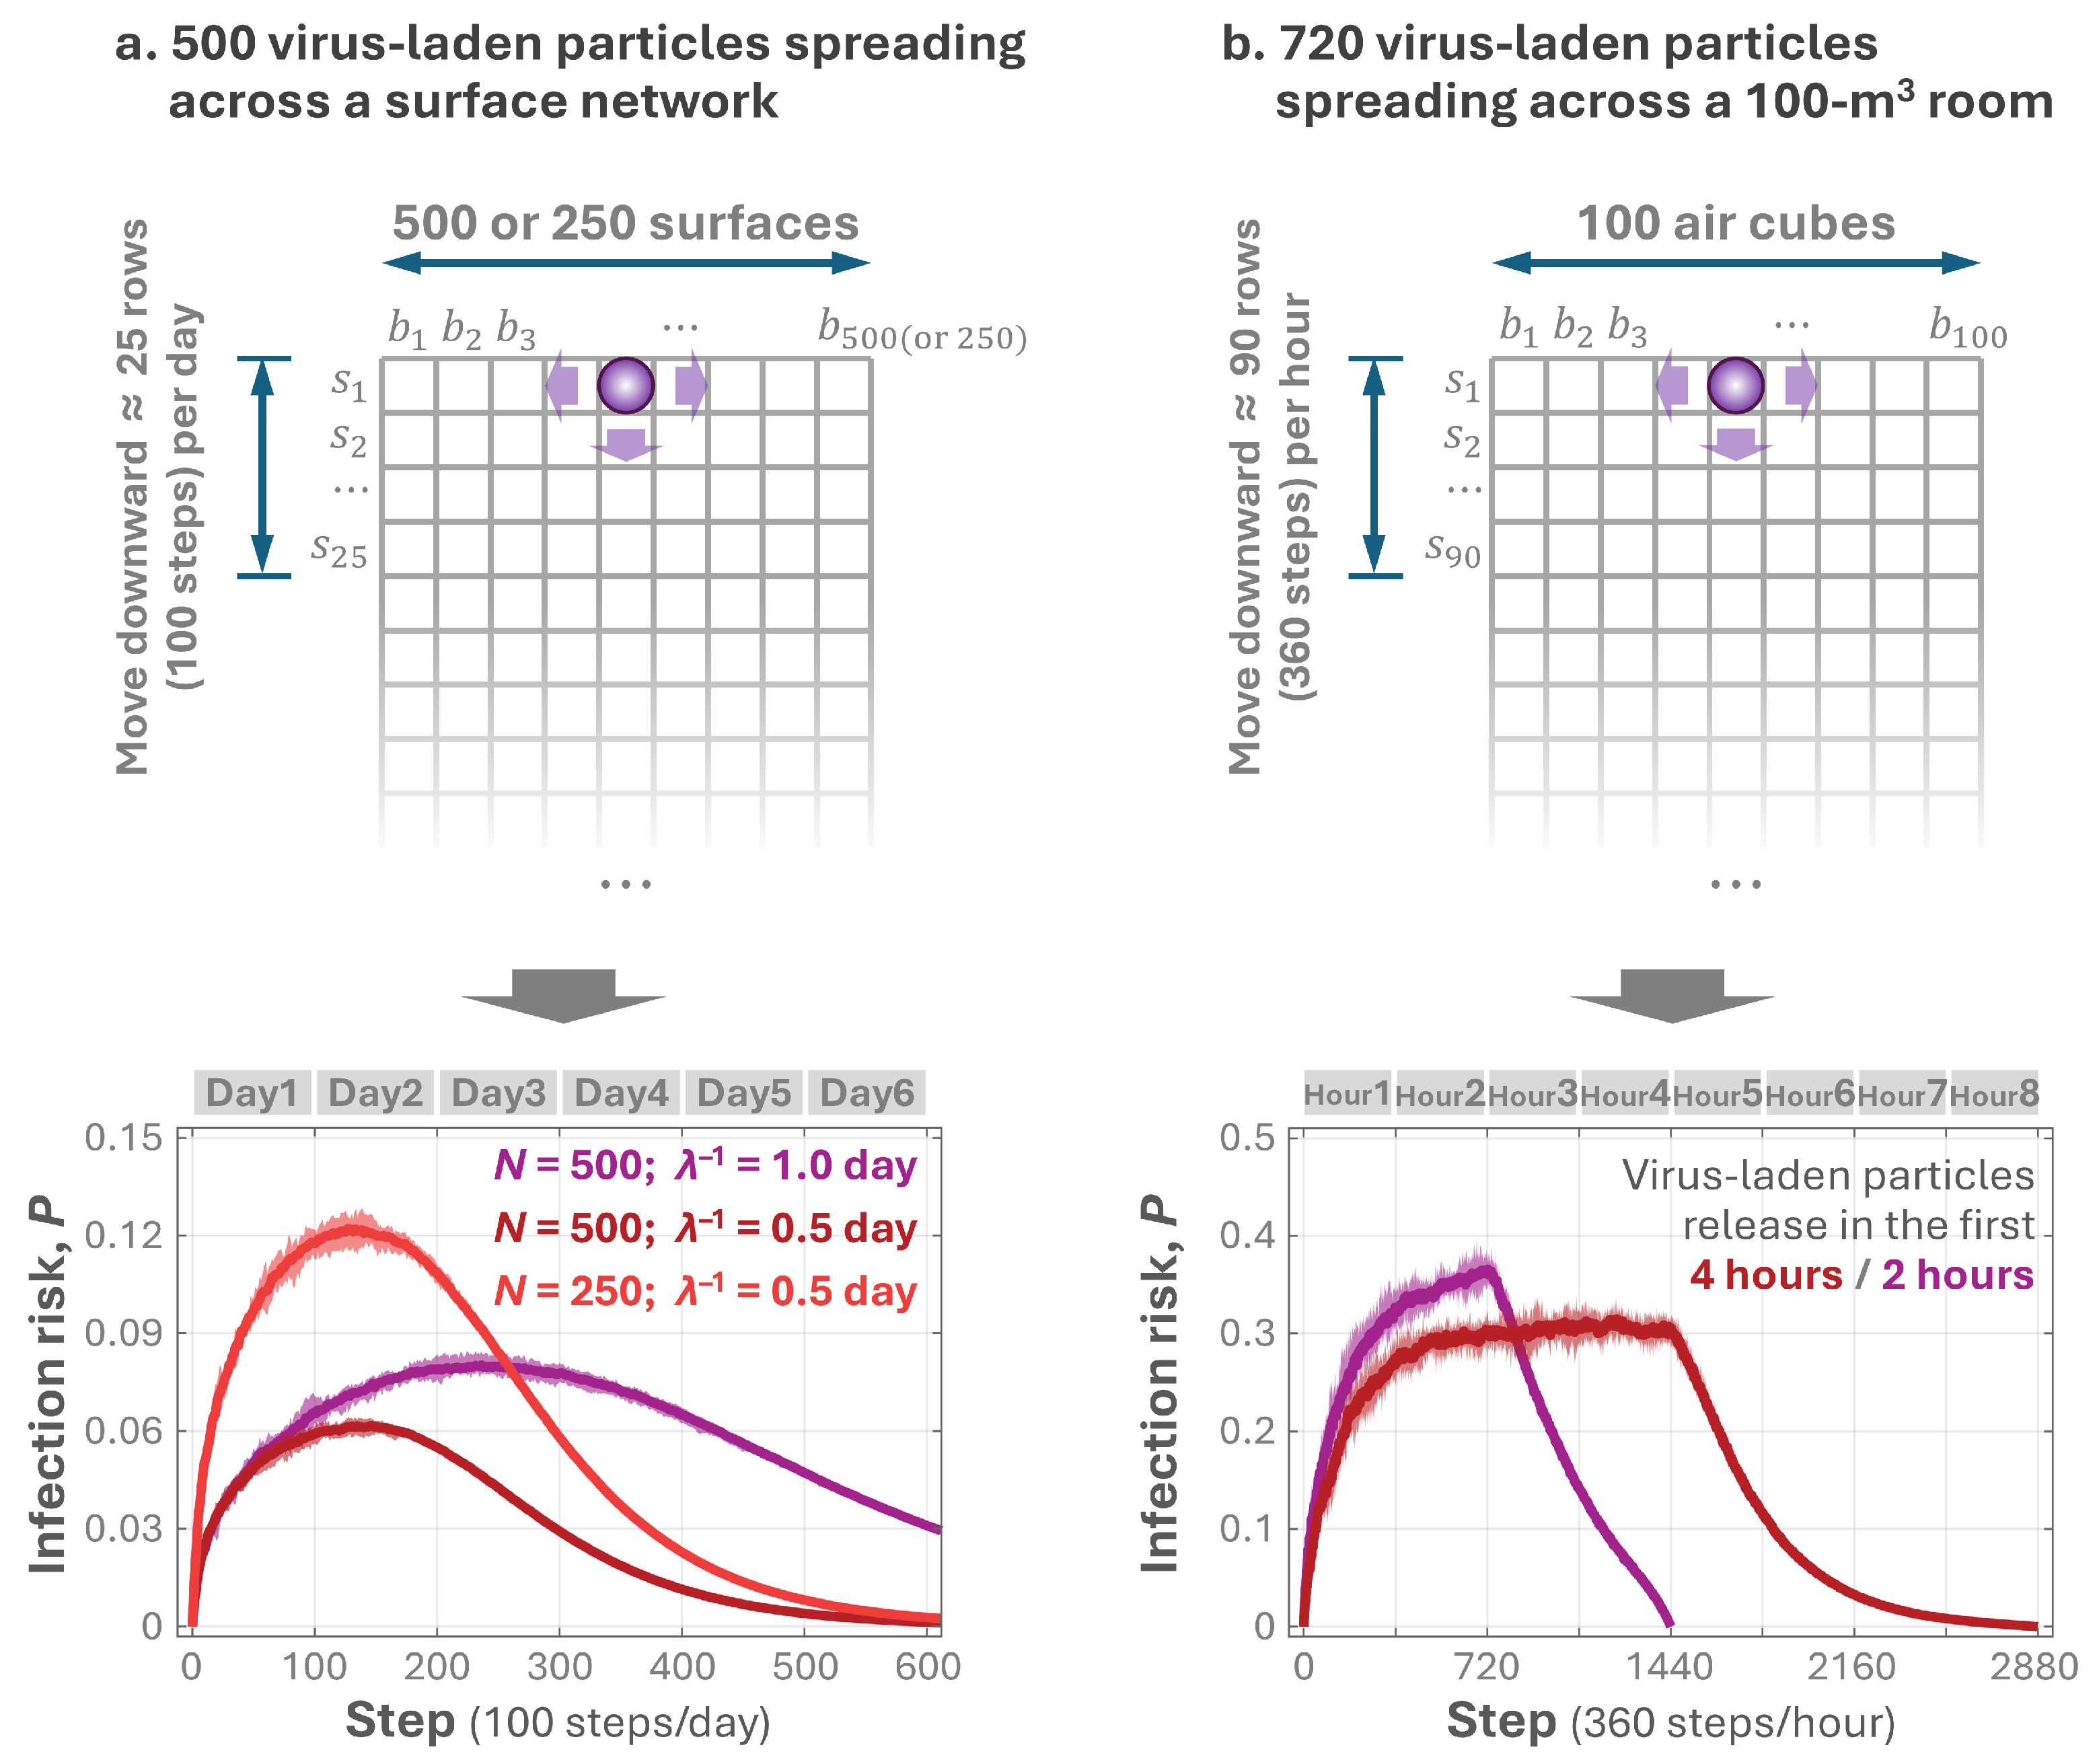
The grid-based model was used to simulate pathogen transmission via indoor surfaces and air. In each simulation, the parameters were set to represent typical real-life scenarios. Figure 3 presents the results from 10 simulations for each scenario. The infection risk curve is not smooth, with the crest containing multiple maxima. This variability is due to the random movement of pathogen-laden particles, which can change both the intensity and scope of the viral load.
For pathogen transmission on surfaces (Figure 3a), the highest infection risk may appear on the second day in some cases. A smaller network size (250 vs. 500 surfaces) and slower pathogen degradation (half-life of 2 days vs. 1 day) increase the infection risk, with the slower degradation rate also delaying the crest’s occurrence.
In indoor air, pathogens degrade faster due to the nature of the airflow [4]. Consequently, the pathogen release time must be considered. Under such circumstances, the pathogen source is close to a continuous source, and the infection risk reaches a “plateau” (Figure 3b), the width of which is determined by the pathogen release duration. Once the infected individual leaves the room, the infection risk drops rapidly.

3.3. Validation of the New Model

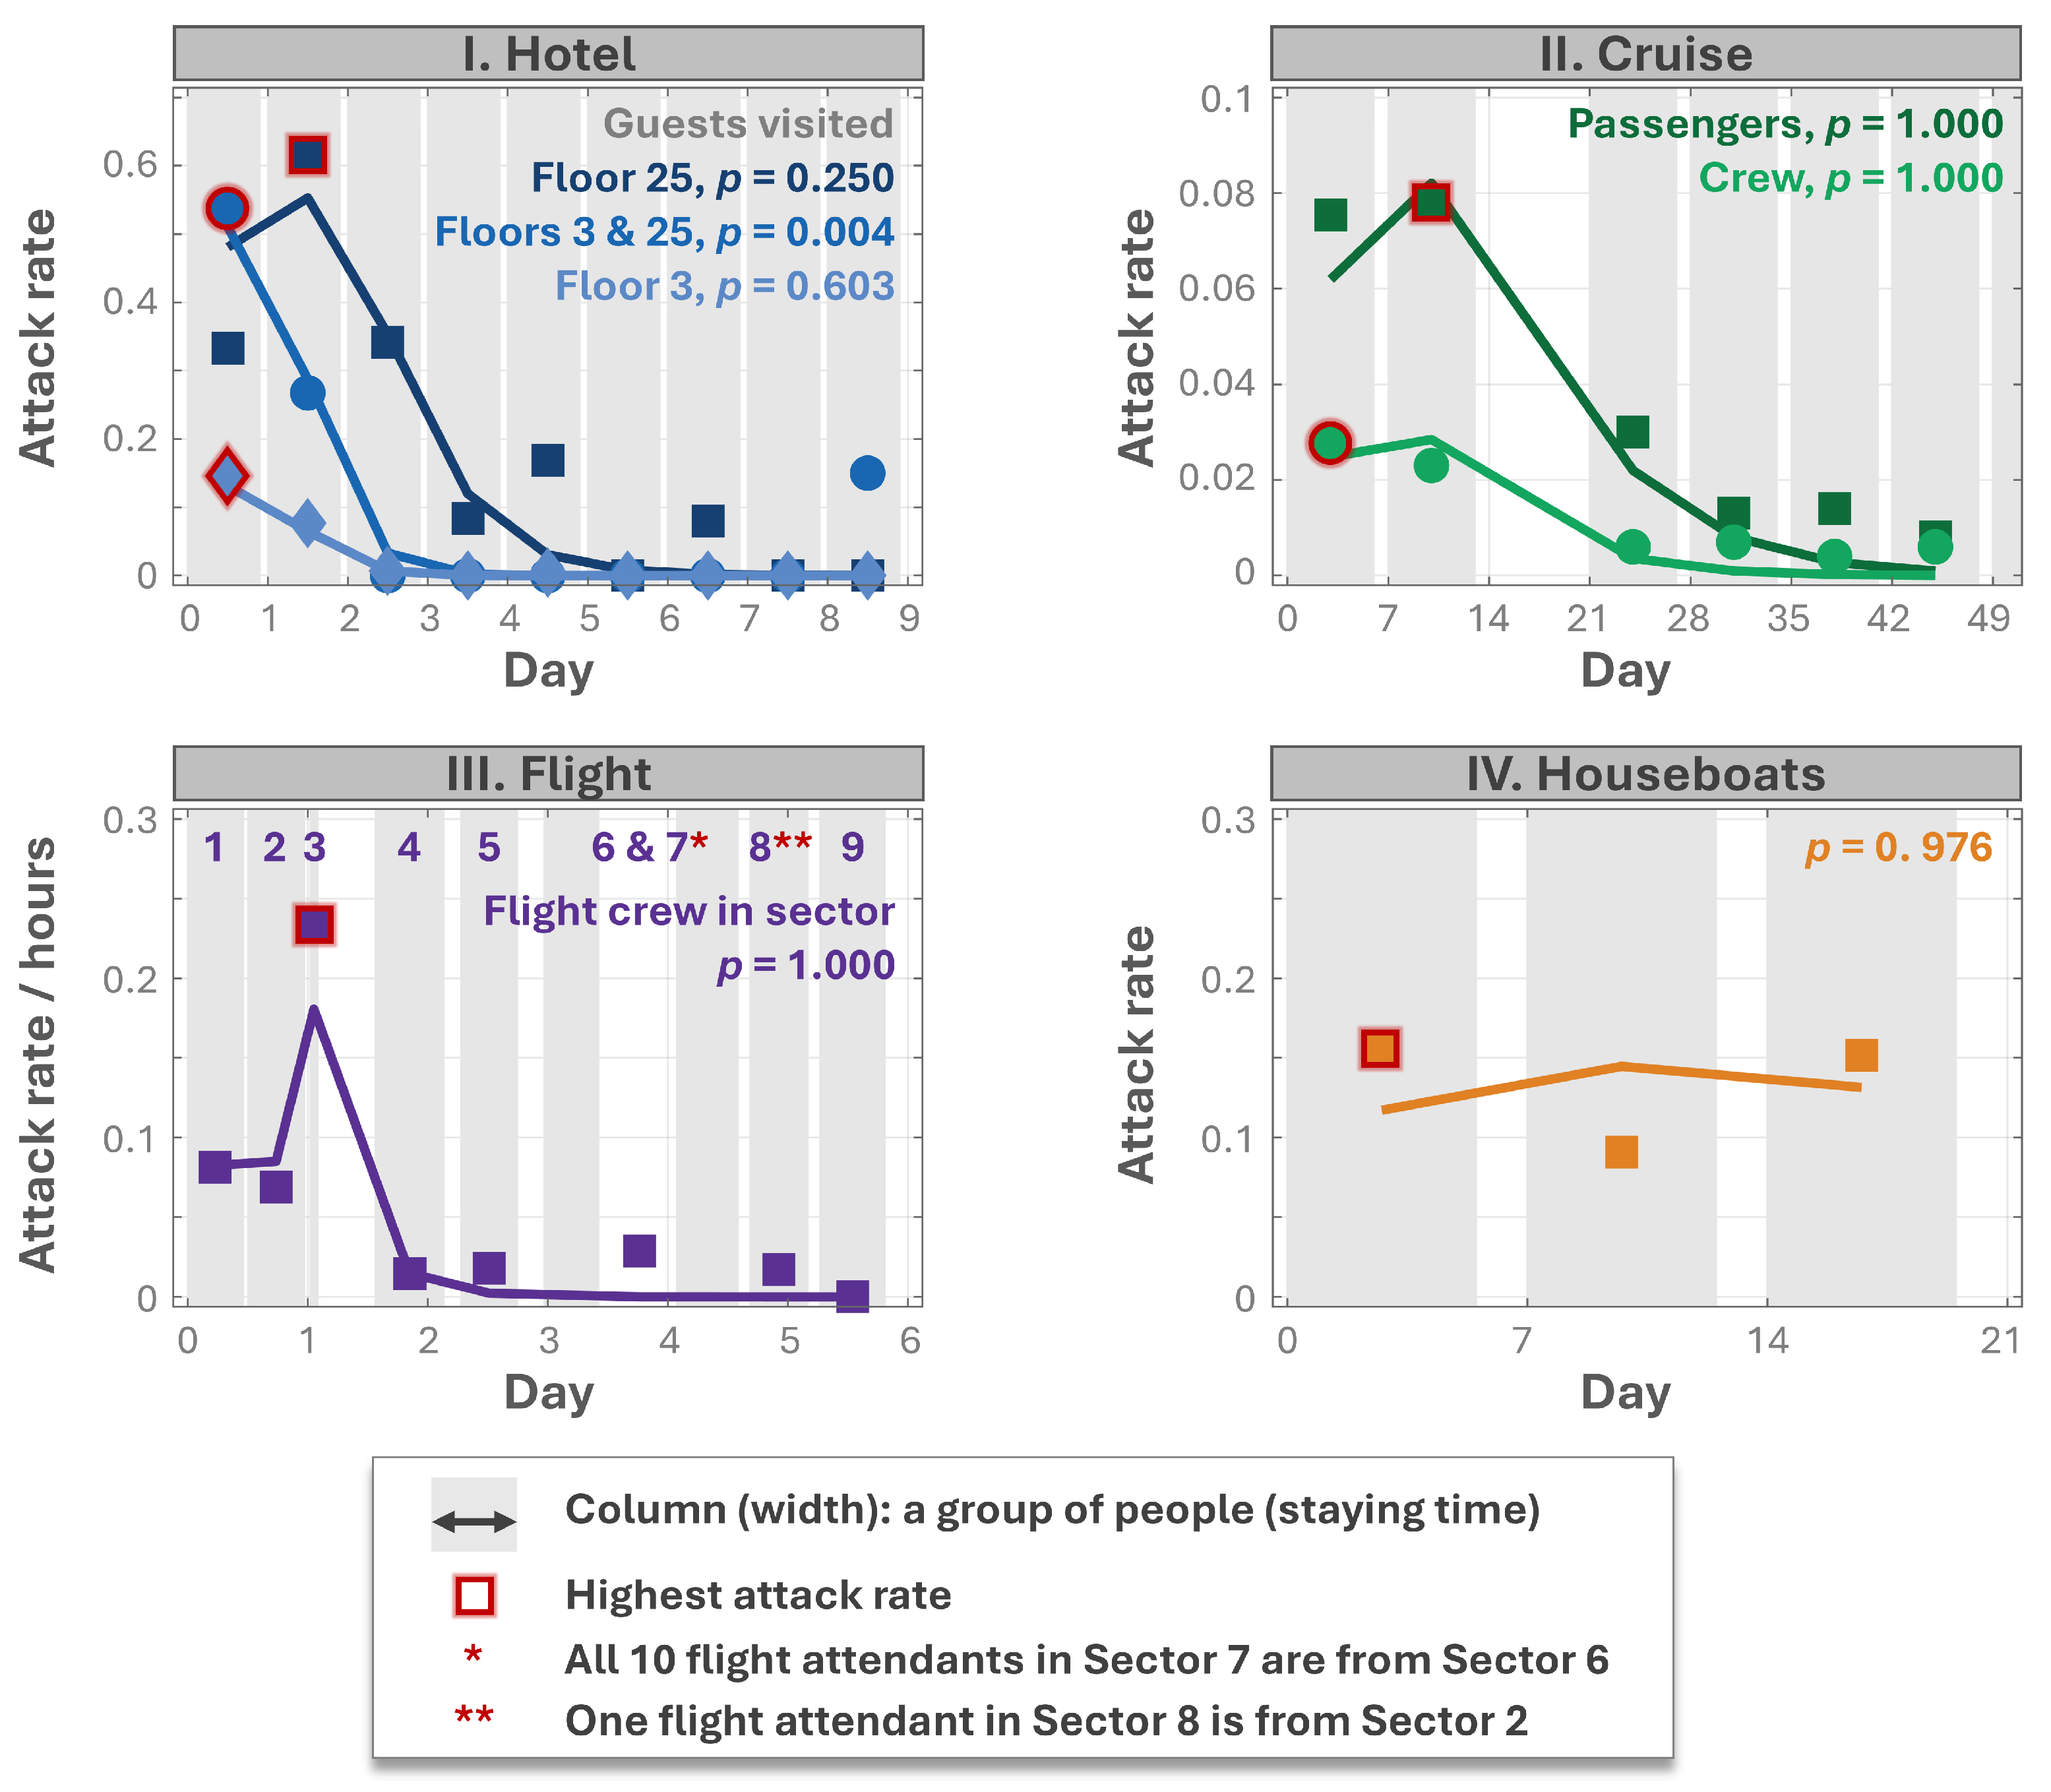
Data from four studies were used to validate the new model. The attack rates reported in these studies can be used as a measure of infection risk, although these two parameters are not equivalent. The rise-and-fall pattern can be observed from the reported attack rates. As the datapoints in Figure 4 show, cross-infection occurred among different groups of visitors in the indoor spaces, despite no inter-group contact or overlapping visiting times. Furthermore, of the seven curves in Figure 4, the crest appears at the first datapoint on four curves, at the second datapoint on two curves, and at the third datapoint on one curve. After the first several datapoints, the attack rate curves show a decreasing trend over time.
Pathogen transmission was also simulated for each scenario in Figure 4 based on the mechanism governing the new model. Different pairs of e and λ values were applied, and the maximum-likelihood attack rates were plotted, with different colors corresponding to the real data. As shown in Figure 4, of the seven pairs of attack rates tested using the K–S test, six yielded p-values greater than 0.05, indicating strong agreement between the simulated and empirical datasets. For the seven simulations, the median of λ is 0.251, indicating that the pathogen has a half-life of 2.76 days. This value falls into the ranges commonly reported in the literature [22]. In contrast, if we simulated the pathogen transmission based on the parameters of airborne route, the λ value would deviate substantially from normal range.
In Case IV in Figure 4, the downward trend of the curve is less evident. This could be partially due to the small sample size (Table 1). More importantly, each group was exposed to the established settings for nearly a week, which exceeds the symptom onset time. Thus, more visitors may have become sources of infection before leaving, and some visitors may have been infected by secondarily infected individuals. Such infection chains can cause prolonged outbreaks [30,31], where infections can proliferate over months or cause epidemics. In such circumstances, the pathogen transmission routes are difficult to identify based on the new model.

4. Discussion

4.1. Mechanism of the Rise-and-Fall Pattern

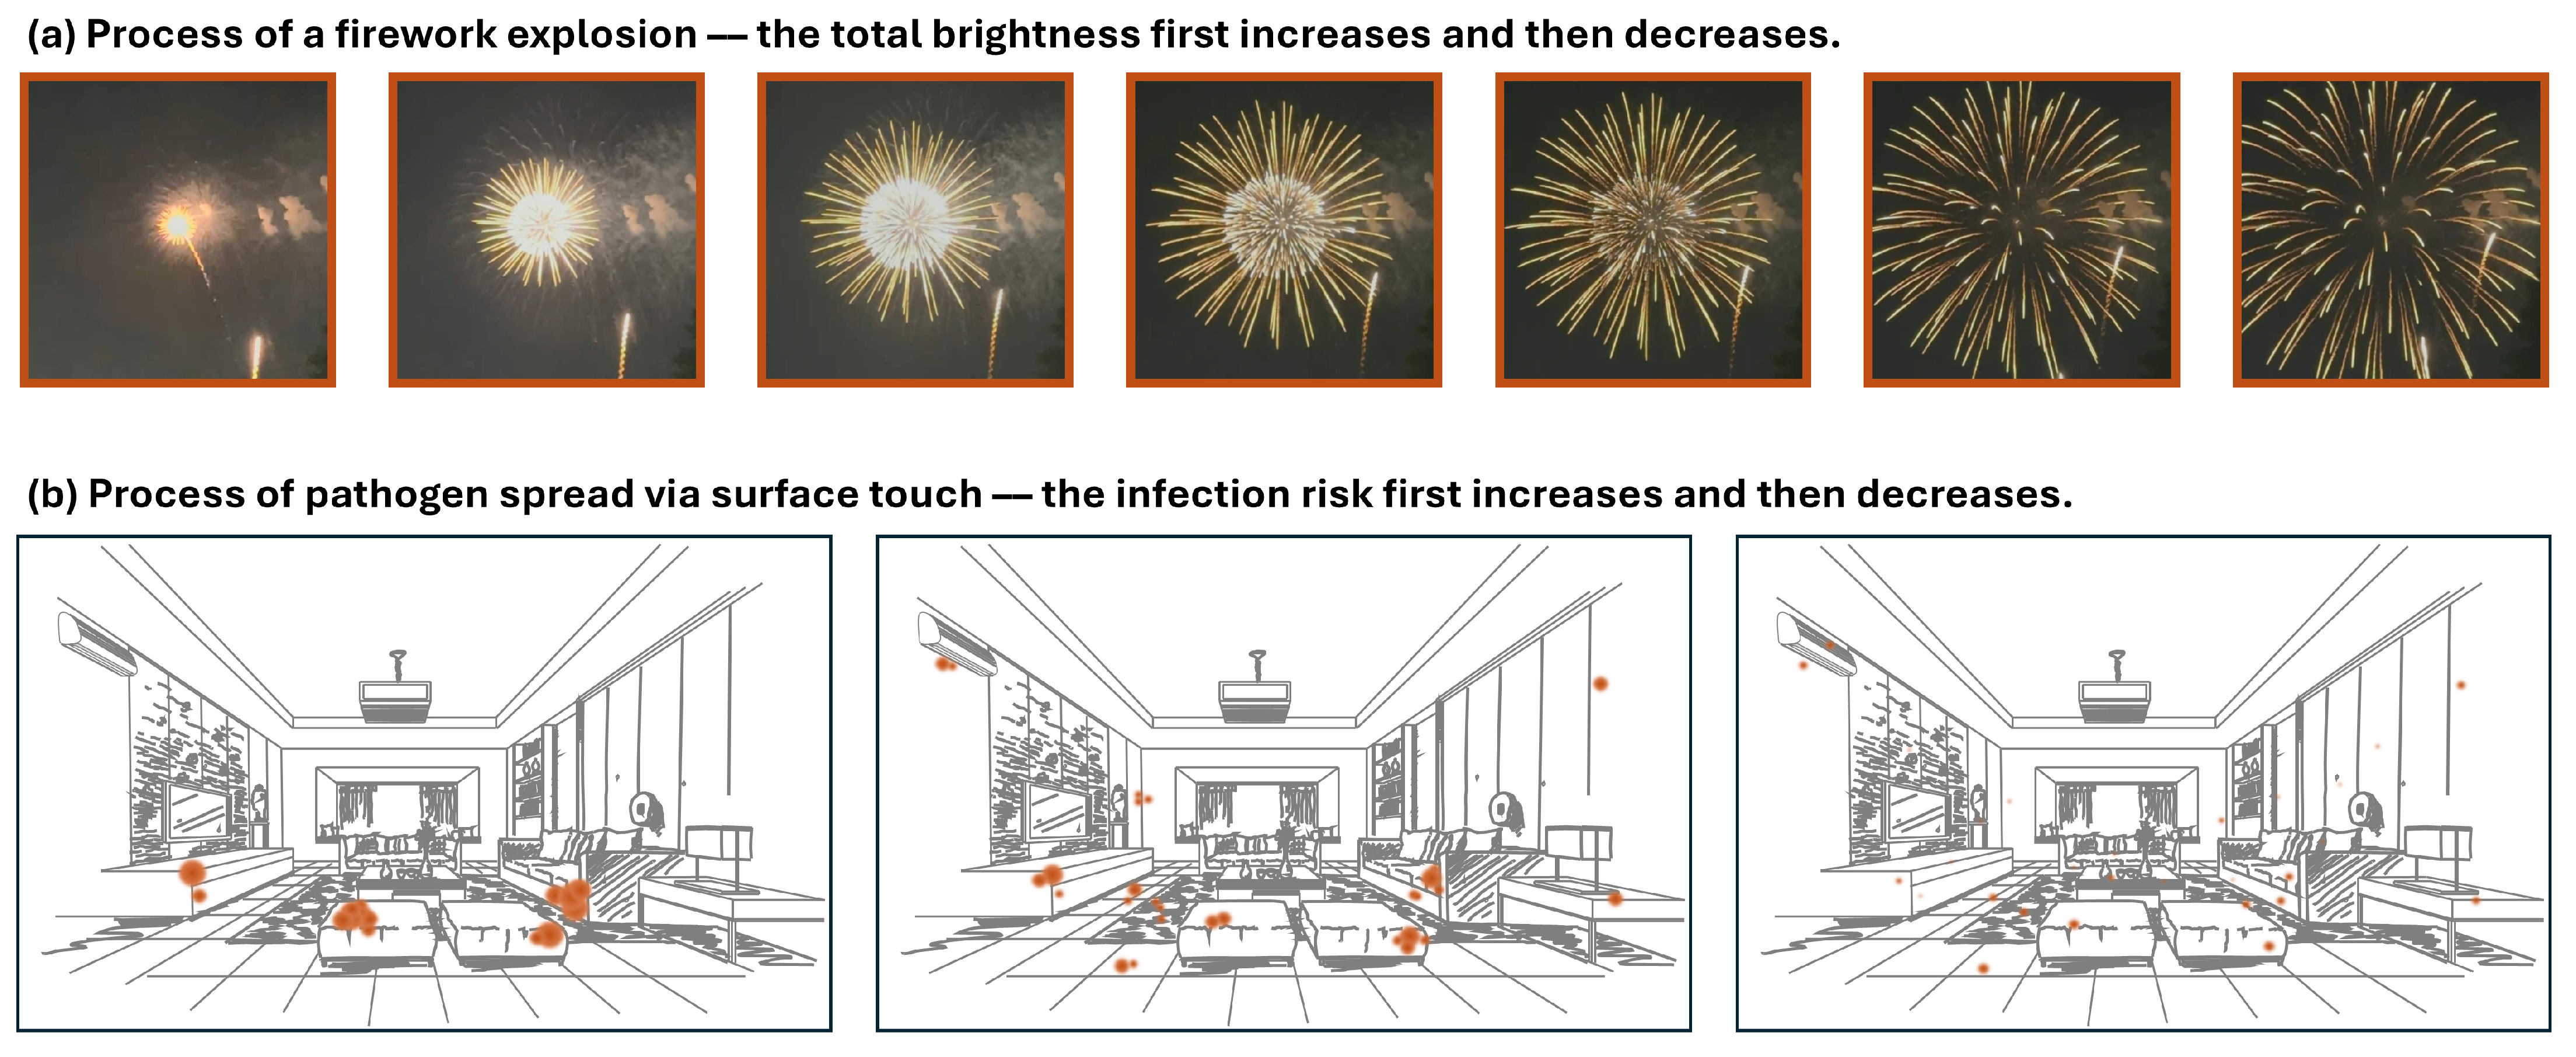
The rise-and-fall pattern proposed in this study differs from conventional epidemic curves in that it arises from the nonlinear variations in both the intensity and spatial extent (breadth) of the spreading agent, which are typically independent of each other. This independence allows the use of a 2D or higher-dimensional grid-based model for simulation. The nature of such a rise-and-fall pattern is like a firework explosion, during which a crest of illumination occurs at a certain moment after its initial explosion (see Appendix A.2). In contrast, traditional SEIR-based epidemic curves and those shaped by periodic effects in self-organizing systems may follow mechanisms distinct from that of this study.

4.2. Conciseness and Flexibility of the New Model

This study introduces a concise model to capture the temporal variation in infection risk during pathogen transmission. It focuses on the changes in the pathogen survival and spatial diffusion while deliberately omitting other variables. The model is self-organizing and employs minimal mathematical expressions to constrain state transitions. Its transmission rules can be flexibly adjusted to represent various scenarios. Additionally, this model allows customized behavior settings for specific sites (e.g., a surface or an air cube), individuals, and dispersal agents (e.g., pathogen-laden particles), offering greater flexibility than most existing physical models.
Previous studies have employed a range of methods—such as computational fluid dynamics, Monte Carlo simulations, and agent-based models—to explore infection risk. These approaches primarily aim to evaluate key factors, including the role of high-touch surfaces in pathogen transmission [21], the impact of close-contact frequency between individuals [32], and the effect of handwashing frequency [33]. However, when distinguishing between transmission routes—particularly airborne and surface-touch transmission—such complex methods are often unnecessary. The simple mathematical model proposed in this study can clearly elucidate the fundamental differences between these two routes.

4.3. Occurrence of the Crest as an Indicator of Fomite Transmission

The occurrence of the rise-and-fall pattern during pathogen spread is determined by environmental parameters and specific spreading routes. For surface pathogens in indoor environments, the infection risk could remain for days or weeks, and the risk crest could occur in the days following the pathogen’s release. In contrast, the crest of infection risk in aerial transmission occurs shortly after the pathogen’s release due to the nature of aerial diffusion. Thus, pathogen release duration must be considered when simulating airborne transmission. The numerical simulations in this study are based on previous data related to surface-touch behaviors and air ventilation [14,34]. In contrast, the transmission of respiratory diseases in unconfined spaces or outdoor environments is rare because of the high efficiency of air ventilation [35].
Previous outbreak case studies have primarily focused on three transmission routes: airborne, fomite, and foodborne transmission. In airborne transmission, the infection risk usually exhibits a plateau and rapidly decreases after the source individual’s departure [36,37,38]. For example, in a SARS-CoV-2 outbreak at a restaurant [19], all infected customers had overlapping dining times with the source individual. Although contaminated meals or water can cause infections across groups, the attack rate mainly fluctuates with the amount of food consumed [39,40,41]. Thus, the infection risks in airborne and foodborne transmissions seldom exhibit a rise-and-fall pattern. Conversely, fomite-based transmission likely causes continuous infection across consecutive groups of visitors without inter-group contact or overlapping visiting times, with the infection lasting days or weeks; the infection risk (or attack rate) exhibits a declining trend after a probable crest.
All four outbreak cases illustrated in Figure 4 involved norovirus; thus, our analysis suggests that norovirus can be transmitted via fomites. Additionally, norovirus is known to spread through food and air [39,42]. For other pathogens, different facilities and materials have been identified as transmission agents, such as drainage systems for SARS-CoV-2 [6], cooling towers for Legionella [43,44], and skin-surface temperature probes in hospitals for Candida auris [45]. However, aside from norovirus, we did not identify any outbreaks in confined indoor spaces that exhibited a rise-and-fall pattern. In an outbreak at an aquarium in Australia [44], the number of infected individuals coincidentally exhibited a rise-and-fall pattern in relation to the visiting dates, although the specific attack rates were not reported. However, based on the aforementioned case study [44], the outbreak may have been linked to the operation period of a poorly disinfected cooling tower rather than fomite transmission.

4.4. Limitation and Potential Applications

Although the crest in attack rate described by our new model has been observed in empirical data (see Section 3.3), the number of usable outbreak samples remains very limited. This is because the crest becomes more pronounced only in outbreaks involving multiple groups of visitors without inter-group contact or overlapping visiting times. Nonetheless, the underlying infection risk may still exhibit a rise-and-fall pattern, even if this is not reflected in the reported daily attack rates.
We observed this phenomenon only in norovirus outbreaks, which may serve as preliminary evidence that norovirus is transmitted via surface-touch routes. In contrast, for pathogens of greater public concern—such as SARS, MERS, and SARS-CoV-2—we did not observe a similar crest in their time-varying attack rates. This suggests that surface touch is unlikely to be the dominant environmental transmission route for these respiratory viruses, consistent with the conclusions of many previous studies [1,14,46].
However, the absence of a crest in attack rate should not be interpreted as evidence against surface-touch transmission. It merely indicates that the probability of such transmission is likely low for these pathogens. The presence of a crest may serve as an early indicator of surface-touch transmission; however, more definitive conclusions regarding transmission pathways require further direct evidence.
Different spreading objects can exhibit the rise-and-fall pattern in their “effects” because of the nonlinear variation in the spreading extent and effect intensity over time [47]. For example, as a finite volume of a hazardous material leaks from a source to its surroundings, a larger residential area is polluted, while the concentration decreases with increasing distance from the source. Thus, the number of affected people can exhibit a peak with respect to the distance from the source. Similarly, many other spreading events can involve a crest in their “effects” with respect to both space and time, irrespective of whether the spreading objects are physical substances or information. The significance of this study lies in its use of a simple model to describe the rise-and-fall pattern. In the future, it could be used to characterize various diffusion events and identify their peak “effects”—such as the optimal sales range of a product or the most effective coverage of an advertisement. It may also be applied to suppress unwanted diffusion events, such as the spread of hazardous materials or pathogens.

5. Conclusions

This study identified and validated a distinct pattern of infection risk peaking at specific moments after a pathogen’s release in indoor settings. This phenomenon was observed in simulating fomite transmission and corroborated by data on norovirus outbreaks. In typical indoor settings, airborne and foodborne transmission typically do not exhibit such patterns. Thus, this phenomenon may serve as a preliminary indicator for evaluating pathogen transmission routes in confined indoor spaces. However, the analysis of transmission routes for more pathogens requires additional data support. This research can help in understanding and managing indoor pathogen transmission. The new grid-based model is likely to be applicable in analyzing other types of spreading objects as well.

Author Contributions

Conceptualization, P.Z.; methodology, P.Z.; software, P.Z.; validation, X.Z.; formal analysis, X.Z.; writing—original draft preparation, P.Z.; writing—review and editing, X.Z.; visualization, P.Z.; funding acquisition, P.Z. All authors have read and agreed to the published version of the manuscript.

Funding

This research was funded by the National Natural Science Foundation of China, grant number 52408105.

Data Availability Statement

The original contributions presented in this study are included in the article. Further inquiries can be directed to the corresponding author.

Conflicts of Interest

The authors declare no conflicts of interest.

Appendix A

Appendix A.1. Assumptions in Modeling Indoor Pathogen Spread

One-dimensional spread of pathogens. We applied a grid-based model to simulate pathogen spread, with one or two dimensions representing spatial propagation. In reality, the network structures underlying both surface and airborne transmission are complex. However, the efficiency of pathogen spread is more strongly influenced by the transmission medium than by the structural complexity of the network. Based on typical indoor air change rates (ACH), airborne particles generally decay within a few hours, while surface pathogens can persist for days or even weeks due to relatively low transmission frequencies and slower decay rates. Therefore, focusing on the fundamental characteristics of different transmission routes—while abstracting away from specific environmental structures—enables us to better capture the core dynamics of infection risk.
First-order decay of pathogens. The emergence of the rise-and-fall pattern remains unaffected, regardless of whether we adopt a linear decay, first-order decay (i.e., exponential decay), or second-order decay.
Here we chose first-order decay because it is a canonical form of decay where the relative proportion degraded per unit time remains constant. This type of decay is widely used to describe radioactive decay, the deterioration of consumer goods, and other scenarios. It also best matches our research context—assuming indoor environmental conditions remain constant and pathogen particles do not interact. In this situation, the theoretical degradation of pathogen particles should follow first-order kinetics. In contrast, if we suppose that two pathogen particles interact (e.g., by competing for limited resources) and lead to the elimination of one, then the pathogen degradation would follow second-order decay, similar to the mechanism in the Malthusian population model.

Appendix A.2. Firework Explosion

The crest of infection risk resembles a firework explosion: As a firework explodes in the sky, the illuminated area expands, while the brightness per unit area decreases from the point of the explosion. Due to the nonlinear variations in the firework’s intensity per unit area and its expanding scope, the visual impact reaches its peak at a specific moment. Therefore, we can term this rise-and-fall pattern in spreading events the “firework phenomenon.” A comparison between the explosion of a firework and the spread of an indoor pathogen is illustrated in Figure A1.
In addition, the state of a spreading agent, when measured by entropy, also exhibits the rise-and-fall pattern, with the entropy value initially increasing and then decreasing. However, entropy differs slightly from the infection risk defined in this study. Assume that (i) an individual provides a single receptor receiving pathogens via touching surfaces or inhaling air and (ii) the receptor has a 100% chance of capturing a pathogen-laden particle. At this point, an individual’s infection risk is independent of the pathogen concentration; hence, we ignore the cumulative effect of multiple pathogen particles on the infection risk as per the assumption in Equation (2). The infection risk in such cases is equivalent to Shannon entropy.
Figure A1. An analogy between the brightness of a firework and the infection risk of an indoor pathogen. (a) A series of screenshots in a video capturing a real firework explosion. (b) Three schematic diagrams depicting a spreading event of a pathogen in an indoor environment.
Buildings 15 02786 g0a1

References

  1. Wang, C.C.; Prather, K.A.; Sznitman, J.; Jimenez, J.L.; Lakdawala, S.S.; Tufekci, Z.; Marr, L.C. Airborne transmission of respiratory viruses. Science 2021, 373, eabd9149. [Google Scholar] [CrossRef] [PubMed]
  2. Lopman, B.; Gastanaduy, P.; Park, G.W.; Hall, A.J.; Parashar, U.D.; Vinje, J. Environmental transmission of norovirus gastroenteritis. Curr. Opin. Virol. 2012, 2, 96–102. [Google Scholar] [CrossRef] [PubMed]
  3. Muder, R.R.; Victor, L.Y.; Woo, A.H. Mode of transmission of Legionella pneumophila: A critical review. Arch. Intern. Med. 1986, 146, 1607–1612. [Google Scholar] [CrossRef]
  4. Leung, N.H.L. Transmissibility and transmission of respiratory viruses. Nat. Rev. Microbiol. 2021, 19, 528–545. [Google Scholar] [CrossRef]
  5. Otter, J.A.; Yezli, S.; Salkeld, J.A.; French, G.L. Evidence that contaminated surfaces contribute to the transmission of hospital pathogens and an overview of strategies to address contaminated surfaces in hospital settings. Am. J. Infect. Control 2013, 41, S6–S11. [Google Scholar] [CrossRef]
  6. Wang, Q.; Lin, Z.; Niu, J.; Choi, G.K.-Y.; Fung, J.C.; Lau, A.K.; Louie, P.; Leung, K.K.; Huang, J.; Cheng, P. Spread of SARS-CoV-2 aerosols via two connected drainage stacks in a high-rise housing outbreak of COVID-19. J. Hazard. Mater. 2022, 430, 128475. [Google Scholar] [CrossRef]
  7. Asadi, S.; Gaaloul Ben Hnia, N.; Barre, R.S.; Wexler, A.S.; Ristenpart, W.D.; Bouvier, N.M. Influenza A virus is transmissible via aerosolized fomites. Nat. Commun. 2020, 11, 4062. [Google Scholar] [CrossRef]
  8. Wang, P.; Zhang, N.; Miao, T.; Chan, J.P.T.; Huang, H.; Lee, P.K.H.; Li, Y. Surface touch network structure determines bacterial contamination spread on surfaces and occupant exposure. J. Hazard. Mater. 2021, 416, 126137. [Google Scholar] [CrossRef]
  9. Harvey, A.P.; Fuhrmeister, E.R.; Cantrell, M.E.; Pitol, A.K.; Swarthout, J.M.; Powers, J.E.; Nadimpalli, M.L.; Julian, T.R.; Pickering, A.J. Longitudinal monitoring of SARS-CoV-2 RNA on high-touch surfaces in a community setting. Environ. Sci. Technol. Lett. 2021, 8, 168–175. [Google Scholar] [CrossRef]
  10. Hu, X.; Ni, W.; Wang, Z.; Ma, G.; Pan, B.; Dong, L.; Gao, R.; Jiang, F. The distribution of SARS-CoV-2 contamination on the environmental surfaces during incubation period of COVID-19 patients. Ecotoxicol. Environ. Saf. 2021, 208, 111438. [Google Scholar] [CrossRef] [PubMed]
  11. Chia, P.Y.; Coleman, K.K.; Tan, Y.K.; Ong, S.W.X.; Gum, M.; Lau, S.K.; Lim, X.F.; Lim, A.S.; Sutjipto, S.; Lee, P.H.; et al. Detection of air and surface contamination by SARS-CoV-2 in hospital rooms of infected patients. Nat. Commun. 2020, 11, 2800. [Google Scholar] [CrossRef]
  12. Meyerowitz, E.A.; Richterman, A.; Gandhi, R.T.; Sax, P.E. Transmission of SARS-CoV-2: A review of viral, host, and environmental factors. Ann. Intern. Med. 2021, 174, 69–79. [Google Scholar] [CrossRef]
  13. Xiao, S.; Jones, R.M.; Zhao, P.; Li, Y. The dynamic fomite transmission of Methicillin-resistant Staphylococcus aureus in hospitals and the possible improved intervention methods. Build. Environ. 2019, 161, 106246. [Google Scholar] [CrossRef]
  14. Zhang, N.; Chen, X.; Jia, W.; Jin, T.; Xiao, S.; Chen, W.; Hang, J.; Ou, C.; Lei, H.; Qian, H.; et al. Evidence for lack of transmission by close contact and surface touch in a restaurant outbreak of COVID-19. J. Infect. 2021, 83, 207–216. [Google Scholar] [CrossRef] [PubMed]
  15. Sober, E. The principle of parsimony. Br. J. Philos. Sci. 1981, 32, 145–156. [Google Scholar] [CrossRef]
  16. Zhao, P.; Li, Y. Modeling and experimental validation of microbial transfer via surface touch. Environ. Sci. Technol. 2021, 55, 4148–4161. [Google Scholar] [CrossRef]
  17. Sze To, G.N.; Chao, C.Y.H. Review and comparison between the Wells-Riley and dose-response approaches to risk assessment of infectious respiratory diseases. Indoor Air 2010, 20, 2–16. [Google Scholar] [CrossRef]
  18. Zhang, N.; Wang, P.; Miao, T.; Chan, P.-T.; Jia, W.; Zhao, P.; Su, B.; Chen, X.; Li, Y. Real human surface touch behavior based quantitative analysis on infection spread via fomite route in an office. Build. Environ. 2021, 191, 107578. [Google Scholar] [CrossRef]
  19. Li, Y.; Qian, H.; Hang, J.; Chen, X.; Cheng, P.; Ling, H.; Wang, S.; Liang, P.; Li, J.; Xiao, S.; et al. Probable airborne transmission of SARS-CoV-2 in a poorly ventilated restaurant. Build. Environ. 2021, 196, 107788. [Google Scholar] [CrossRef]
  20. Zhang, N.; Li, Y.; Huang, H. Surface touch and its network growth in a graduate student office. Indoor Air 2018, 28, 963–972. [Google Scholar] [CrossRef]
  21. Zhao, P.; Wang, P.; Lam, T.; Zhang, N.; Wang, H.; Zhang, H.; Liu, J.; Li, Y. High-touch surfaces with moderate contamination levels as key nodes in microbial dissemination. J. Hazard. Mater. 2025, 495, 138834. [Google Scholar] [CrossRef] [PubMed]
  22. Cook, N.; Knight, A.; Richards, G.P. Persistence and elimination of human Norovirus in food and on food contact surfaces: A critical review. J. Food Prot. 2016, 79, 1273–1294. [Google Scholar] [CrossRef]
  23. ANSI/ASHRAE Standard 55; Thermal Environmental Conditions for Human Occupancy. American Society of Heating, Refrigerating and Air-Conditioning Engineers: Atlanta, GA, USA, 1992.
  24. Nazaroff, W.W. Residential air-change rates: A critical review. Indoor Air 2021, 31, 282–313. [Google Scholar] [CrossRef] [PubMed]
  25. He, C.; Morawska, L.; Gilbert, D. Particle deposition rates in residential houses. Atmos. Environ. 2005, 39, 3891–3899. [Google Scholar] [CrossRef]
  26. Kimura, H.; Nagano, K.; Kimura, N.; Shimizu, M.; Ueno, Y.; Morikane, K.; Okabe, N. A norovirus outbreak associated with environmental contamination at a hotel. Epidemiol. Infect. 2011, 139, 317–325. [Google Scholar] [CrossRef]
  27. Isakbaeva, E.T.; Widdowson, M.A.; Beard, R.S.; Bulens, S.N.; Mullins, J.; Monroe, S.S.; Bresee, J.; Sassano, P.; Cramer, E.H.; Glass, R.I. Norovirus transmission on cruise ship. Emerg. Infect. Dis. 2005, 11, 154–157. [Google Scholar] [CrossRef]
  28. Thornley, C.N.; Emslie, N.A.; Sprott, T.W.; Greening, G.E.; Rapana, J.P. Recurring norovirus transmission on an airplane. Clin. Infect. Dis. 2011, 53, 515–520. [Google Scholar] [CrossRef]
  29. Jones, E.L.; Kramer, A.; Gaither, M.; Gerba, C.P. Role of fomite contamination during an outbreak of norovirus on houseboats. Int. J. Environ. Health Res. 2007, 17, 123–131. [Google Scholar] [CrossRef]
  30. Cheesbrough, J.S.; Green, J.; Gallimore, C.I.; Wright, P.A.; Brown, D.W. Widespread environmental contamination with Norwalk-like viruses (NLV) detected in a prolonged hotel outbreak of gastroenteritis. Epidemiol. Infect. 2000, 125, 93–98. [Google Scholar] [CrossRef] [PubMed]
  31. Katz, D.E.; Heisey-Grove, D.; Beach, M.; Dicker, R.C.; Matyas, B.T. Prolonged outbreak of giardiasis with two modes of transmission. Epidemiol. Infect. 2006, 134, 935–941. [Google Scholar] [CrossRef] [PubMed]
  32. Zhang, N.; Hu, T.; Zhang, J.; Mai, W.; Jian, M.; Li, J.; Chen, F.; Zhu, M.; Zhuang, L.; Jin, T.; et al. Probable close contact transmission in a restaurant in China. J. Infect. 2022, 85, 573–607. [Google Scholar] [CrossRef]
  33. Xiao, S.; Hao, Z.; Zhao, F.; Zhao, P.; Zhang, N.; Li, Y. Residence time of particles in indoor surface networks. J. Hazard. Mater. 2025, 488, 137267. [Google Scholar] [CrossRef]
  34. Xiao, S.; Li, Y.; Sung, M.; Wei, J.; Yang, Z. A study of the probable transmission routes of MERS-CoV during the first hospital outbreak in the Republic of Korea. Indoor Air 2018, 28, 51–63. [Google Scholar] [CrossRef]
  35. Bulfone, T.C.; Malekinejad, M.; Rutherford, G.W.; Razani, N. Outdoor Transmission of SARS-CoV-2 and Other Respiratory Viruses: A Systematic Review. J. Infect. Dis. 2021, 223, 550–561. [Google Scholar] [CrossRef] [PubMed]
  36. Cheng, P.; Luo, K.; Xiao, S.; Yang, H.; Hang, J.; Ou, C.; Cowling, B.J.; Yen, H.L.; Hui, D.S.; Hu, S.; et al. Predominant airborne transmission and insignificant fomite transmission of SARS-CoV-2 in a two-bus COVID-19 outbreak originating from the same pre-symptomatic index case. J. Hazard. Mater. 2022, 425, 128051. [Google Scholar] [CrossRef] [PubMed]
  37. Khanh, N.C.; Thai, P.Q.; Quach, H.L.; Thi, N.H.; Dinh, P.C.; Duong, T.N.; Mai, L.T.Q.; Nghia, N.D.; Tu, T.A.; Quang, N.; et al. Transmission of SARS-CoV 2 during long-haul flight. Emerg. Infect. Dis. 2020, 26, 2617–2624. [Google Scholar] [CrossRef]
  38. Groves, L.M. Community transmission of SARS-CoV-2 at three fitness facilities—Hawaii, June–July 2020. Morb. Mortal. Wkly. Rep. 2021, 70, 316–320. [Google Scholar] [CrossRef]
  39. Smith, A.J.; McCarthy, N.; Saldana, L.; Ihekweazu, C.; McPhedran, K.; Adak, G.K.; Iturriza-Gomara, M.; Bickler, G.; O’Moore, E. A large foodborne outbreak of norovirus in diners at a restaurant in England between January and February 2009. Epidemiol. Infect. 2012, 140, 1695–1701. [Google Scholar] [CrossRef][Green Version]
  40. Thornley, C.N.; Hewitt, J.; Perumal, L.; Van Gessel, S.M.; Wong, J.; David, S.A.; Rapana, J.P.; Li, S.; Marshall, J.C.; Greening, G.E. Multiple outbreaks of a novel norovirus GII.4 linked to an infected post-symptomatic food handler. Epidemiol. Infect. 2013, 141, 1585–1597. [Google Scholar] [CrossRef]
  41. Hirakata, Y.; Arisawa, K.; Nishio, O.; Nakagomi, O. Multiprefectural spread of gastroenteritis outbreaks attributable to a single genogroup II norovirus strain from a tourist restaurant in Nagasaki, Japan. J. Clin. Microbiol. 2005, 43, 1093–1098. [Google Scholar] [CrossRef] [PubMed][Green Version]
  42. Marks, P.J.; Vipond, I.B.; Carlisle, D.; Deakin, D.; Fey, R.E.; Caul, E.O. Evidence for airborne transmission of Norwalk-like virus (NLV) in a hotel restaurant. Epidemiol. Infect. 2000, 124, 481–487. [Google Scholar] [CrossRef]
  43. Sabria, M.; Alvarez, J.; Dominguez, A.; Pedrol, A.; Sauca, G.; Salleras, L.; Lopez, A.; Garcia-Nunez, M.A.; Parron, I.; Barrufet, M.P. A community outbreak of Legionnaires’ disease: Evidence of a cooling tower as the source. Clin. Microbiol. Infect. 2006, 12, 642–647. [Google Scholar] [CrossRef] [PubMed]
  44. Greig, J.E.; Carnie, J.A.; Tallis, G.F.; Ryan, N.J.; Tan, A.G.; Gordon, I.R.; Zwolak, B.; Leydon, J.A.; Guest, C.S.; Hart, W.G. An outbreak of Legionnaires’ disease at the Melbourne Aquarium, April 2000: Investigation and case-control studies. Med. J. Aust. 2004, 180, 566–572. [Google Scholar] [CrossRef] [PubMed]
  45. Eyre, D.W.; Sheppard, A.E.; Madder, H.; Moir, I.; Moroney, R.; Quan, T.P.; Griffiths, D.; George, S.; Butcher, L.; Morgan, M.; et al. A Candida auris outbreak and its control in an intensive care setting. N. Engl. J. Med. 2018, 379, 1322–1331. [Google Scholar] [CrossRef] [PubMed]
  46. National Center for Immunization and Respiratory Diseases (NCIRD), Division of Viral Diseases. Science Brief: SARS-CoV-2 and Surface (Fomite) Transmission for Indoor Community Environments; CDC COVID-19 Science Briefs; Centers for Disease Control and Prevention (US): Atlanta, GA, USA, 2021.
  47. Li, Y.; Wei, Z. Dynamics and optimal control of a stochastic coronavirus (COVID-19) epidemic model with diffusion. Nonlinear Dyn. 2022, 109, 91–120. [Google Scholar] [CrossRef]
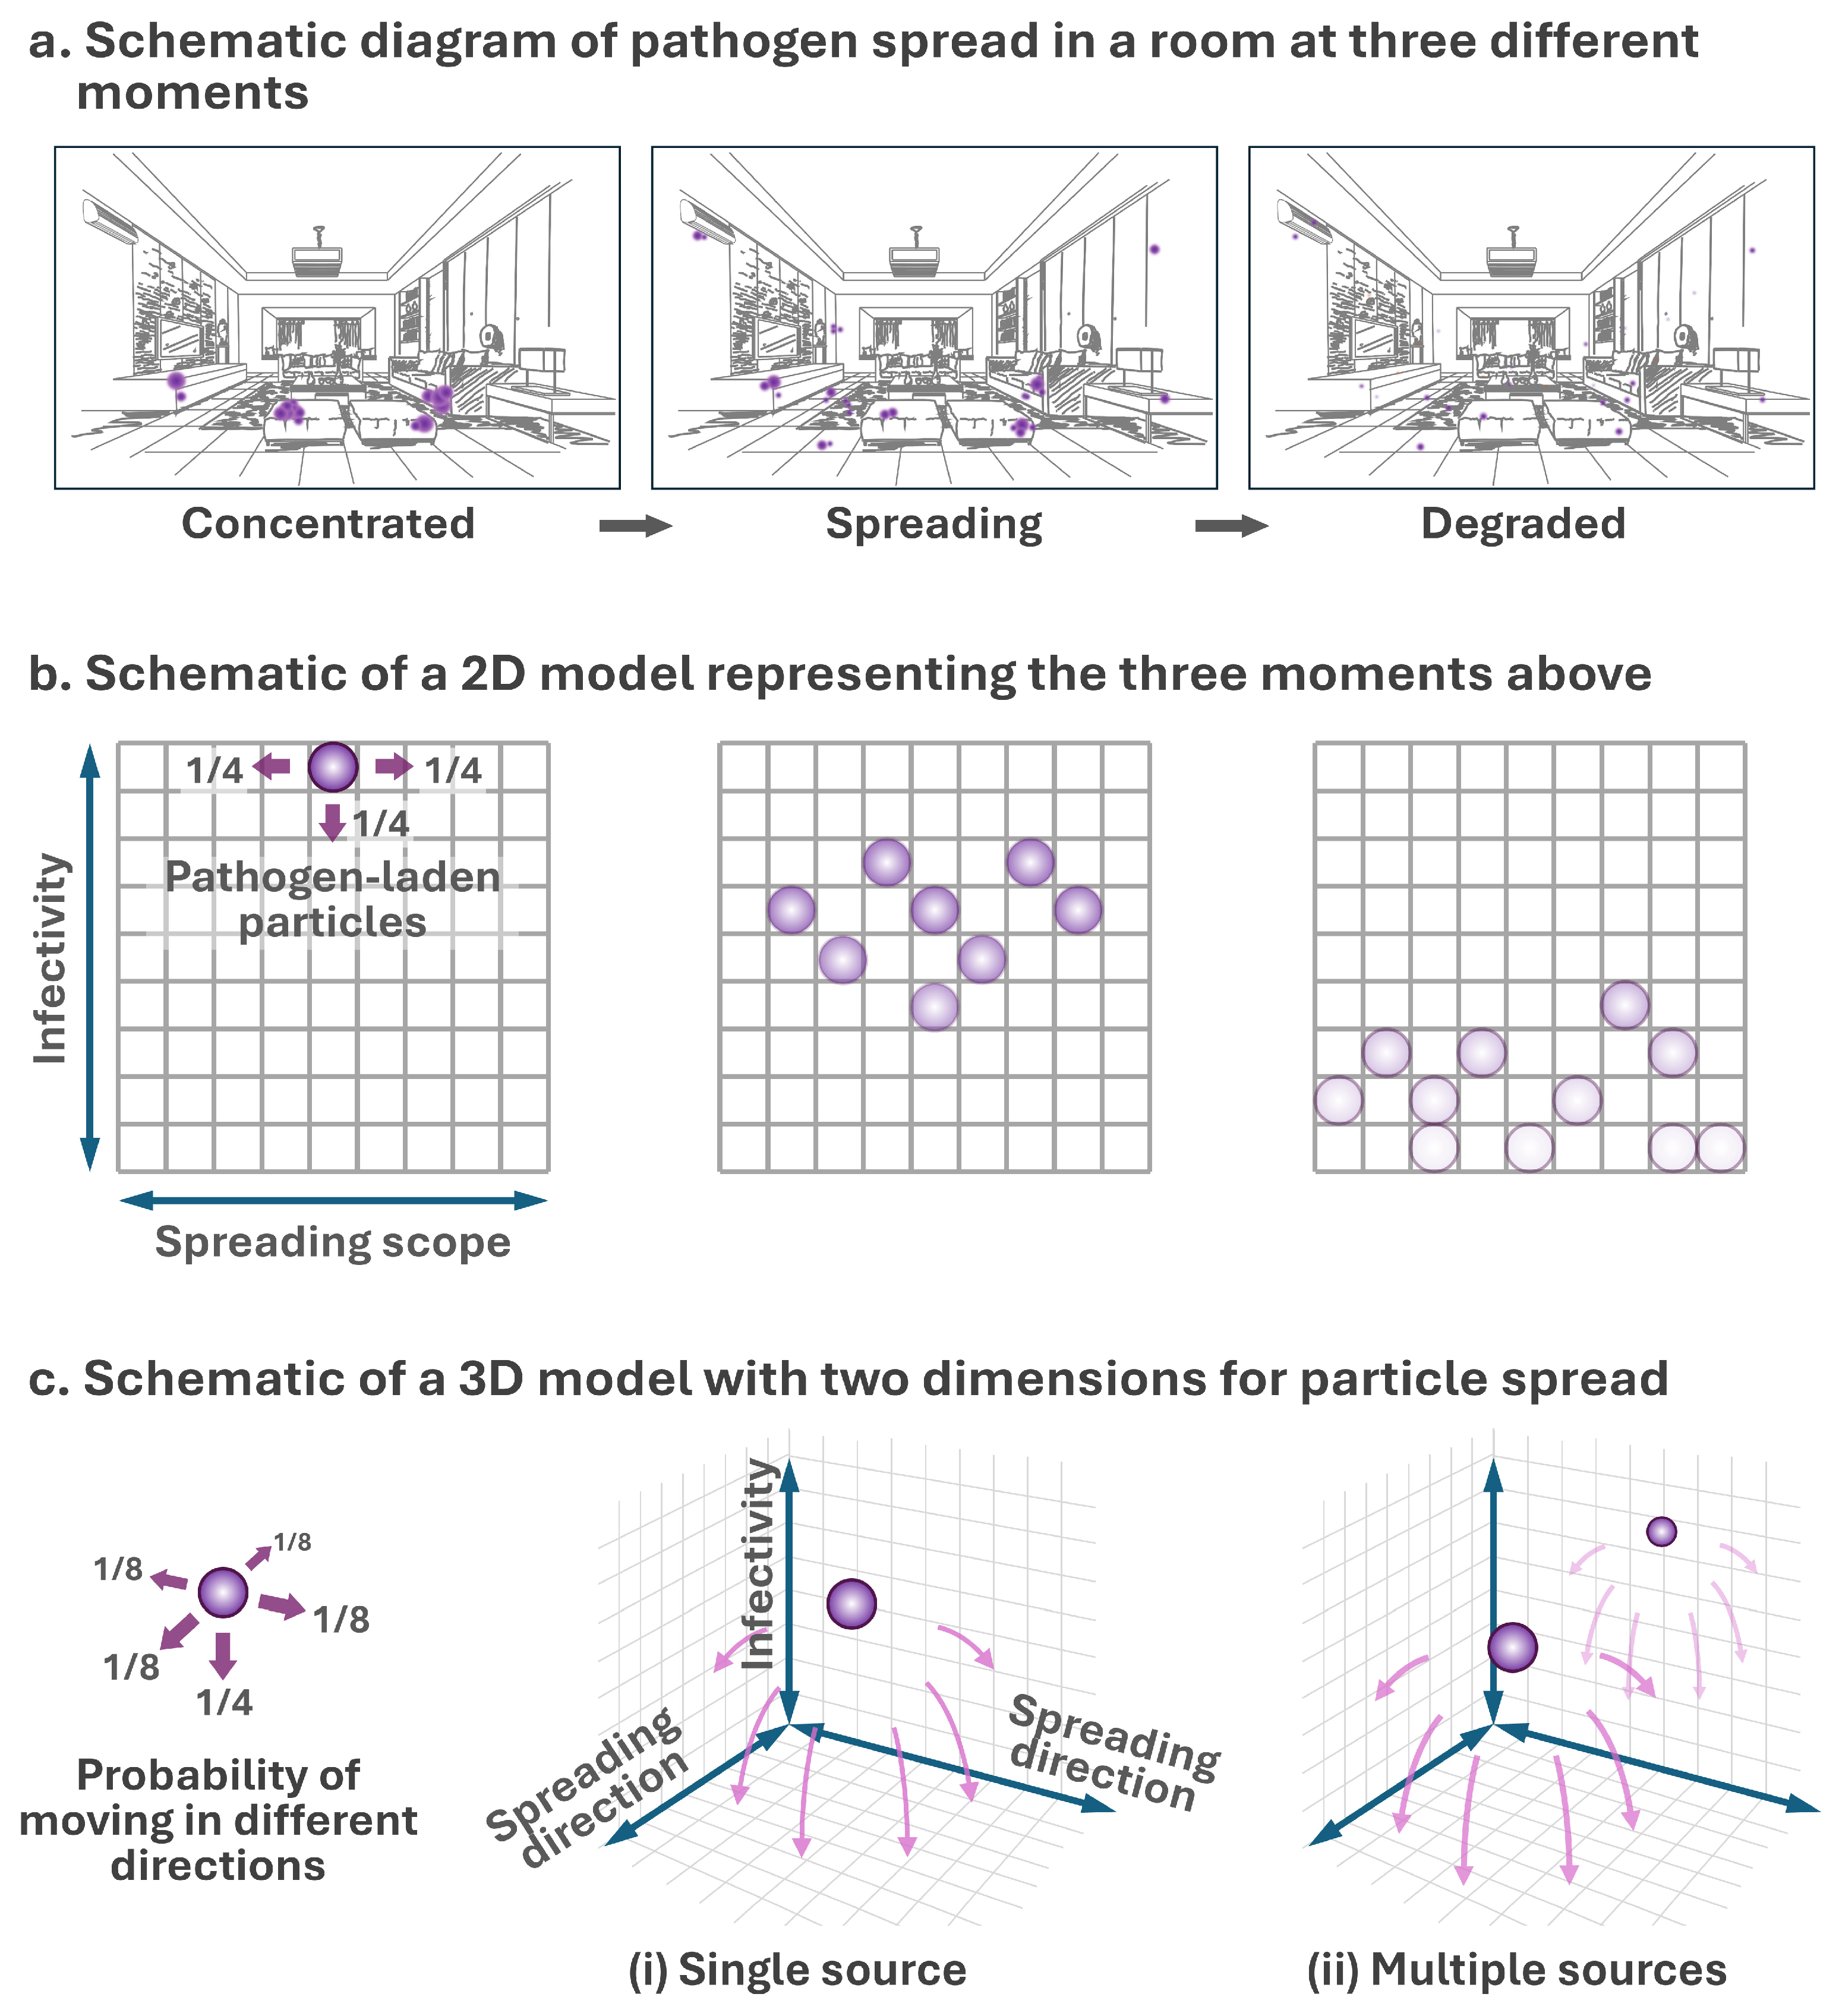
Figure 1. Modeling of pathogen spread. (a). Schematic diagram of pathogen spread in a room at three different moments. (b). Schematic of 2D model representing these three moments. (c). Schematic of a 3D model with two dimensions representing the spread of pathogen-laden particles. Each purple arrow, labeled with its corresponding fraction, is used to indicate the direction of particle movement with the given probability. The level of transparency is used to represent the decay of each pathogen-laden particle.
Buildings 15 02786 g001
Figure 2. Simulations of particle spread in idealized grids. Particles equal to or 4, 16, or 64 times the number of columns were released from (a) instantaneous source(s) at step 0 or (b) continuous source(s) over steps 0–300 and dispersed within a 2D or 3D grid while degrading with a half-life of 3 rows. Parameter settings are indicated in each plot. Each curve represents the mean of 10 simulations, and the shaded area shows the full range of these simulations.
Buildings 15 02786 g002
Figure 3. Modeling of spread of pathogen-laden particles via (a) surface touch and (b) indoor air. The simulated infection risk (P in Equation (3)) varied by simulation steps is presented for different scenarios. Each curve represents the mean of 10 simulations, and the shaded area shows the full range of these simulations.
Buildings 15 02786 g003
Figure 4. Attack rates per unit time for different groups in four indoor norovirus outbreaks (listed in Table 1). The infections occurred without inter-group contact or overlapping visiting times, except for one instance (Flight Sector 8 in Case III). For each data group (distinguished by colors), the maximum-likelihood attack rates via fomite route were calculated using the new model and are presented by the curves in corresponding colors. In Case III, “attack rate/hour” is used as the parameter for the vertical axis because of the different visiting periods of the different groups. p-values from Kolmogorov–Smirnov tests are presented to evaluate the agreement between simulated and measured attack rates.
Buildings 15 02786 g004
Disclaimer/Publisher’s Note: The statements, opinions and data contained in all publications are solely those of the individual author(s) and contributor(s) and not of MDPI and/or the editor(s). MDPI and/or the editor(s) disclaim responsibility for any injury to people or property resulting from any ideas, methods, instructions or products referred to in the content.