Learning the Value of Place: Machine Learning Models for Real Estate Appraisal in Istanbul’s Diverse Urban Landscape
Abstract
1. Introduction
2. Study Area and Data Description
3. Machine Learning Algorithms
3.1. Artificial Neural Network
- W is the weight vector for the neuron;
- x is the input vector;
- b is the bias term;
- z is the result of the linear transformation.
- Lastly, the activation function σ(z), where σ can be a non-linear function such as Rectified Linear Unit (ReLU), Sigmoid, or Tanh, is important for ANN algorithms. In this study, the ReLU function was used to test the algorithm.
3.2. Random Forest
- is the final predicted value;
- M is the number of decision trees;
- (x) is the j-th decision tree.
3.3. Extreme Gradient Boosting (XGBoost)
- is the first derivative (gradient) of the loss function;
- is the second derivative;
- () is the new tree;
- Ω() is the regularization term.
3.4. K-Nearest Neighbors (KNN)
3.5. Support Vector Regression (SVR)
- w is the weight vector;
- x is the input feature vector;
- b is the bias term.
3.6. Semi-Logarithmic Regression
3.7. Quality Metrics
4. Results
- ANN: The model was tested with different hidden layer configurations: (50, 25), (100, 50), and (150, 100) neurons. The maximum number of iterations was set to 1000, and the regularization parameter (alpha) was 0.0001, activation function; ReLU, Optimization algorithm; Adam, and the default mean squared error as the loss function;
- RF: The number of trees was varied among 100, 200, and 300;
- XGBoost: The number of trees was set to 100, 200, and 300, with the regularization parameter (alpha) set to 10;
- KNN: The number of neighbors was tested with values of 3, 5, and 10;
- SVR: Three combinations of training error and tolerance were tested: (1, 0.1), (10, 0.5), and (100, 0.1).
5. Discussion
Author Contributions
Funding
Data Availability Statement
Conflicts of Interest
Abbreviations
| ADBoost | Adaptive Boosting |
| ANN | Artificial Neural Networks |
| KNN | K-Nearest Neighbors |
| ML | Machine Learning |
| RF | Random Forest |
| ReLU | Rectified Linear Unit |
| SLR | Semi-Log Regression |
| SVR | Support Vector Regression |
| TEM | Trans-European North–South Motorway |
| XGBoost | Extreme Gradient Boosting |
References
- El Mouna, L.; Silkan, H.; Haynf, Y.; Nann, M.F.; Tekouabou, S.C. A comparative study of urban house price prediction using machine learning algorithms. Proc. E3S Web Conf. 2023, 418, 03001. [Google Scholar] [CrossRef]
- Park, B.; Bae, J.K. Using machine learning algorithms for housing price prediction: The case of Fairfax County, Virginia housing data. Expert Syst. Appl. 2015, 42, 2928–2934. [Google Scholar] [CrossRef]
- Choy, L.H.; Ho, W.K. The use of machine learning in real estate research. Land 2023, 12, 740. [Google Scholar] [CrossRef]
- Burhan, H.A. Konut fiyatları tahmininde makine öğrenmesi sınıflandırma algoritmalarının kullanılması: Kütahya kent merkezi örneği. Dumlupınar Üniv. Sos. Bilim. Derg. 2023, 76, 221–237. [Google Scholar] [CrossRef]
- Erdem, N. Toplu (küme) değerleme uygulama örnekleri ve ülkemiz için öneriler. In Proceedings of the 16th Turkish Surveying Scientific and Technical Congress (TMMOB Harita ve Kadastro Mühendisleri Odası), Ankara, Turkey, 3–6 May 2017; pp. 3–6. [Google Scholar]
- Standard on Mass Appraisal of Real Property; International Association of Assessing Officers: Kansas City, MO, USA, 2011. Available online: https://www.pinal.gov/DocumentCenter/View/6894/IAAO-Standard-on-Mass-Appraisal-of-Real-Property-PDF (accessed on 10 December 2024).
- Sladić, D.; Radulović, A.; Govedarica, M. Mass Property Valuation in Serbia. In Proceedings of the 11th International Workshop on the Land Administration Domain Model and 3D Land Administration, Gävle, Sweden, 11–13 October 2023. [Google Scholar]
- Zhao, Y.; Shen, X.; Ma, J.; Yu, M. Path selection of spatial econometric model for mass appraisal of real estate: Evidence from Yinchuan, China. Int. J. Strateg. Prop. Manag. 2023, 27, 304–316. [Google Scholar] [CrossRef]
- Bourassa, S.C.; Hoesli, M.; Merlin, L.; Renne, J. Big data, accessibility and urban house prices. Urban Stud. 2021, 58, 3176–3195. [Google Scholar] [CrossRef]
- Potrawa, T.; Tetereva, A. How much is the view from the window worth? Machine learning-driven hedonic pricing model of the real estate market. J. Bus. Res. 2022, 144, 50–65. [Google Scholar] [CrossRef]
- Zhou, Z.-H. Machine Learning; Springer Nature: Berlin/Heidelberg, Germany, 2021. [Google Scholar]
- Jui, J.J.; Imran Molla, M.; Bari, B.S.; Rashid, M.; Hasan, M.J. Flat price prediction using linear and random forest regression based on machine learning techniques. In Embracing Industry 4.0: Selected Articles from MUCET 2019; Springer: Berlin/Heidelberg, Germany, 2020; pp. 205–217. [Google Scholar]
- Aydınoğlu, A.Ç.; Bovkır, R.; Çölkesen, İ. Toplu taşınmaz değerlemede makine öğrenme algoritmalarının kullanımı ve konumsal/konumsal olmayan özniteliklerin tahmin doğruluğuna etkilerinin karşılaştırılması. Jeodezi Jeoinformasyon Derg. 2023, 10, 63–83. [Google Scholar] [CrossRef]
- Ho, W.K.; Tang, B.-S.; Wong, S.W. Predicting property prices with machine learning algorithms. J. Prop. Res. 2021, 38, 48–70. [Google Scholar] [CrossRef]
- Zilli, C.A.; Bastos, L.C.; da Silva, L.R. Machine learning models in mass appraisal for property tax purposes: A systematic mapping study. Aestimum 2024, 84, 31–52. [Google Scholar] [CrossRef]
- Almaslukh, B. A gradient boosting method for effective prediction of housing prices in complex real estate systems. In Proceedings of the 2020 International Conference on Technologies and Applications of Artificial Intelligence (TAAI), Taipei, Taiwan, 3–5 December 2020; pp. 217–222. [Google Scholar]
- Barns, S. Out of the loop? On the radical and the routine in urban big data. Urban Stud. 2021, 58, 3203–3210. [Google Scholar] [CrossRef]
- Iwai, K.; Hamagami, T. A New XGBoost Inference with Boundary Conditions in Real Estate Price Prediction. IEEJ Trans. Electr. Electron. Eng. 2022, 17, 1613–1619. [Google Scholar] [CrossRef]
- Ja’afar, N.S.; Mohamad, J. Application of machine learning in analysing historical and non-historical characteristics of heritage pre-war shophouses. Plan. Malays. 2021, 19, 72–84. [Google Scholar] [CrossRef]
- Sevgen, S.C.; Aliefendioğlu, Y. Mass apprasial with a machine learning algorithm: Random forest regression. Bilişim Teknol. Derg. 2020, 13, 301–311. [Google Scholar] [CrossRef]
- Abidoye, R.B.; Chan, A.P. Improving property valuation accuracy: A comparison of hedonic pricing model and artificial neural network. Pac. Rim Prop. Res. J. 2018, 24, 71–83. [Google Scholar] [CrossRef]
- Schernthanner, H.; Asche, H.; Gonschorek, J.; Scheele, L. Spatial modeling and geovisualization of rental prices for real estate portals. In Cognitive Analytics: Concepts, Methodologies, Tools, and Applications; IGI Global: Hershey, PA, USA, 2020; pp. 962–977. [Google Scholar]
- Mora-Garcia, R.-T.; Cespedes-Lopez, M.-F.; Perez-Sanchez, V.R. Housing price prediction using machine learning algorithms in COVID-19 times. Land 2022, 11, 2100. [Google Scholar] [CrossRef]
- Dureh, N.; Ueranantasan, A.; Eso, M. A comparison of multiple linear regression and random forest for community concern of youth and young adults survey. Methods 2018, 44, 481–487. [Google Scholar]
- Rampini, L.; Re Cecconi, F. Artificial intelligence algorithms to predict Italian real estate market prices. J. Prop. Invest. Financ. 2022, 40, 588–611. [Google Scholar] [CrossRef]
- McCluskey, W.J.; McCord, M.; Davis, P.T.; Haran, M.; McIlhatton, D. Prediction accuracy in mass appraisal: A comparison of modern approaches. J. Prop. Res. 2013, 30, 239–265. [Google Scholar] [CrossRef]
- Hoxha, V. Exploring the predictive power of ANN and traditional regression models in real estate pricing: Evidence from Prishtina. J. Prop. Invest. Financ. 2024, 42, 134–150. [Google Scholar] [CrossRef]
- Grybauskas, A.; Pilinkienė, V.; Stundžienė, A. Predictive analytics using Big Data for the real estate market during the COVID-19 pandemic. J. Big Data 2021, 8, 105. [Google Scholar] [CrossRef]
- Karamanou, A.; Kalampokis, E.; Tarabanis, K. Linked open government data to predict and explain house prices: The case of Scottish statistics portal. Big Data Res. 2022, 30, 100355. [Google Scholar] [CrossRef]
- Chen, T.; Guestrin, C. Xgboost: A scalable tree boosting system. In Proceedings of the 22nd ACM SIGKDD International Conference on Knowledge Discovery and Data Mining, San Francisco, CA, USA, 13–17 August 2016; pp. 785–794. [Google Scholar]
- Wang, Y.; Ni, X.S. A XGBoost risk model via feature selection and Bayesian hyper-parameter optimization. arXiv 2019, arXiv:1901.08433. [Google Scholar] [CrossRef]
- Babu, A.; Chandran, A.S. Literature review on real estate value prediction using machine learning. Int. J. Comput. Sci. Mob. Appl. 2019, 7, 8–15. [Google Scholar]
- Dha, T. A Literature Review on Using Machine Learning Algorithm to Predict House Prices. Int. Res. J. Adv. Sci. Hub 2023, 5, 132–137. [Google Scholar] [CrossRef]
- Pow, N.; Janulewicz, E.; Liu, L. Applied Machine Learning Project 4 Prediction of Real Estate Property Prices in Montréal; Course Project, COMP-598, Fall/2014; McGill University: Montreal, QC, Canada, 2014. [Google Scholar]
- Wang, H.; Hu, D. Comparison of SVM and LS-SVM for regression. In Proceedings of the 2005 International Conference on Neural Networks and Brain, Beijing, China, 13–15 October 2005; pp. 279–283. [Google Scholar]
- Turkstat. Construction and Housing Statistics. Yearly 2024. Available online: https://data.tuik.gov.tr/Kategori/GetKategori?p=Insaat-ve-Konut-116 (accessed on 3 January 2025).
- Taşabat, S.E.; Ersen, M. House Price Prediction: A Case Study for Istanbul. In Industry 4.0 and the Digital Transformation of International Business; Springer: Berlin/Heidelberg, Germany, 2023; pp. 233–250. [Google Scholar]
- Endeksa. Available online: https://www.endeksa.com/en/ (accessed on 12 January 2025).
- Acar, T. Determining housing prices using the semiparametric estimation within the hedonic price model framework: Case study of istanbul housing market example. Ekon. Polit. Finans. Araştırmaları Derg. 2020, 5, 561–575. [Google Scholar]
- Arslanlı, K.Y. Analysis of house prices: A hedonic model proposal for Istanbul metropolitan area. J. Des. Resil. Archit. Plan. 2020, 1, 57–68. [Google Scholar] [CrossRef]
- Bekar, E.; Çağlayan Akay, E. Modelling housing prices in Istanbul applying the spatial quantile regression. Empir. Econ. Lett. 2014, 8, 863–869. [Google Scholar]
- Keskin, B. Hedonic analysis of price in the Istanbul housing market. Int. J. Strateg. Prop. Manag. 2008, 12, 125–138. [Google Scholar] [CrossRef]
- Sisman, S.; Aydinoglu, A.C. A modelling approach with geographically weighted regression methods for determining geographic variation and influencing factors in housing price: A case in Istanbul. Land Use Policy 2022, 119, 106183. [Google Scholar] [CrossRef]
- Tekin, M.; Sari, I.U. Real estate market price prediction model of Istanbul. Real Estate Manag. Valuat. 2022, 30, 1–16. [Google Scholar] [CrossRef]
- Lorenz, F.; Willwersch, J.; Cajias, M.; Fuerst, F. Interpretable machine learning for real estate market analysis. Real Estate Econ. 2023, 51, 1178–1208. [Google Scholar] [CrossRef]
- Din, A.; Hoesli, M.; Bender, A. Environmental variables and real estate prices. Urban Stud. 2001, 38, 1989–2000. [Google Scholar] [CrossRef]
- Kang, Y.; Zhang, F.; Peng, W.; Gao, S.; Rao, J.; Duarte, F.; Ratti, C. Understanding house price appreciation using multi-source big geo-data and machine learning. Land Use Policy 2021, 111, 104919. [Google Scholar] [CrossRef]
- Peng, Y.; Tian, C.; Wen, H. How does school district adjustment affect housing prices: An empirical investigation from Hangzhou, China. China Econ. Rev. 2021, 69, 101683. [Google Scholar] [CrossRef]
- Zulkifley, N.H.; Rahman, S.A.; Ubaidullah, N.H.; Ibrahim, I. House price prediction using a machine learning model: A survey of literature. Int. J. Mod. Educ. Comput. Sci. 2020, 12, 46–54. [Google Scholar] [CrossRef]
- Toprak, M.F.; Güngör, O. Kayseri’de çoklu regresyon ve coğrafi ağırlıklı regresyon yöntemleri ile konutların toplu değerlemesi. Türk. Uzak. Algılama CBS Derg. 2023, 4, 114–124. [Google Scholar] [CrossRef]
- Hyun, D. Still prefer, but not that much: The premium of subway access on house prices during the COVID-19 pandemic period. Int. J. Urban Sci. 2024, 28, 675–700. [Google Scholar] [CrossRef]
- Lieske, S.N.; van den Nouwelant, R.; Han, J.H.; Pettit, C. A novel hedonic price modelling approach for estimating the impact of transportation infrastructure on property prices. Urban Stud. 2021, 58, 182–202. [Google Scholar] [CrossRef]
- Liu, X.; Jiang, C.; Wang, F.; Yao, S. The impact of high-speed railway on urban housing prices in China: A network accessibility perspective. Transp. Res. Part A Policy Pract. 2021, 152, 84–99. [Google Scholar] [CrossRef]
- Yang, L.; Chu, X.; Gou, Z.; Yang, H.; Lu, Y.; Huang, W. Accessibility and proximity effects of bus rapid transit on housing prices: Heterogeneity across price quantiles and space. J. Transp. Geogr. 2020, 88, 102850. [Google Scholar] [CrossRef]
- Zhang, X.; Zheng, Y.; Sun, L.; Dai, Q. Urban Structure, Subway Systemand Housing Price: Evidence from Beijing and Hangzhou, China. Sustainability 2019, 11, 669. [Google Scholar] [CrossRef]
- Nyanda, F. The effect of proximity and spatial dependence on the house price index for Dar es Salaam. Int. J. Hous. Mark. Anal. 2024, 17, 945–963. [Google Scholar] [CrossRef]
- Peng, T.-C.; Chiang, Y.-H. The non-linearity of hospitals’ proximity on property prices: Experiences from Taipei, Taiwan. J. Prop. Res. 2015, 32, 341–361. [Google Scholar] [CrossRef]
- Zheng, Z.; Yu, S.; Li, M.; Zhang, K.; Zhu, M.; He, Y.; Peng, Q. Mass Appraisal of Urban Housing Based on GIS and Deep Learning; SSRN 4510568; Elsevier: Amsterdam, The Netherlands, 2023. [Google Scholar]
- Conway, D.; Li, C.Q.; Wolch, J.; Kahle, C.; Jerrett, M. A spatial autocorrelation approach for examining the effects of urban greenspace on residential property values. J. Real Estate Financ. Econ. 2010, 41, 150–169. [Google Scholar] [CrossRef]
- Daams, M.N.; Sijtsma, F.J.; Veneri, P. Mixed monetary and non-monetary valuation of attractive urban green space: A case study using Amsterdam house prices. Ecol. Econ. 2019, 166, 106430. [Google Scholar] [CrossRef]
- McCord, M.; McCord, J.; Lo, D.; Brown, L.; MacIntyre, S.; Squires, G. The value of green and blue space: Walkability and house prices. Cities 2024, 154, 105377. [Google Scholar] [CrossRef]
- Janiesch, C.; Zschech, P.; Heinrich, K. Machine learning and deep learning. Electron. Mark. 2021, 31, 685–695. [Google Scholar] [CrossRef]
- Mahesh, B. Machine learning algorithms-a review. Int. J. Sci. Res. (IJSR) 2020, 9, 381–386. [Google Scholar] [CrossRef]
- Sarker, I.H. Machine learning: Algorithms, real-world applications and research directions. SN Comput. Sci. 2021, 2, 160. [Google Scholar] [CrossRef] [PubMed]
- Goodarzi, M.; Deshpande, S.; Murugesan, V.; Katti, S.B.; Prabhakar, Y.S. Is feature selection essential for ANN modeling? QSAR Comb. Sci. 2009, 28, 1487–1499. [Google Scholar] [CrossRef]
- Breiman, L. Random forests. Mach. Learn. 2001, 45, 5–32. [Google Scholar] [CrossRef]
- Breiman, L. Bagging predictors. Mach. Learn. 1996, 24, 123–140. [Google Scholar] [CrossRef]
- Zhang, S.; Li, X.; Zong, M.; Zhu, X.; Cheng, D. Learning k for knn classification. ACM Trans. Intell. Syst. Technol. 2017, 8, 1–19. [Google Scholar] [CrossRef]
- Gunn, S.R. Support Vector Machines for Classification and Regression. Technical Report, Image Speech and Intelligent Systems Research Group, University of Southampton. 1997. Available online: https://citeseerx.ist.psu.edu/document?repid=rep1&type=pdf&doi=91f6251257ab1642bf5742244a93da3a57a64b63 (accessed on 13 December 2024).
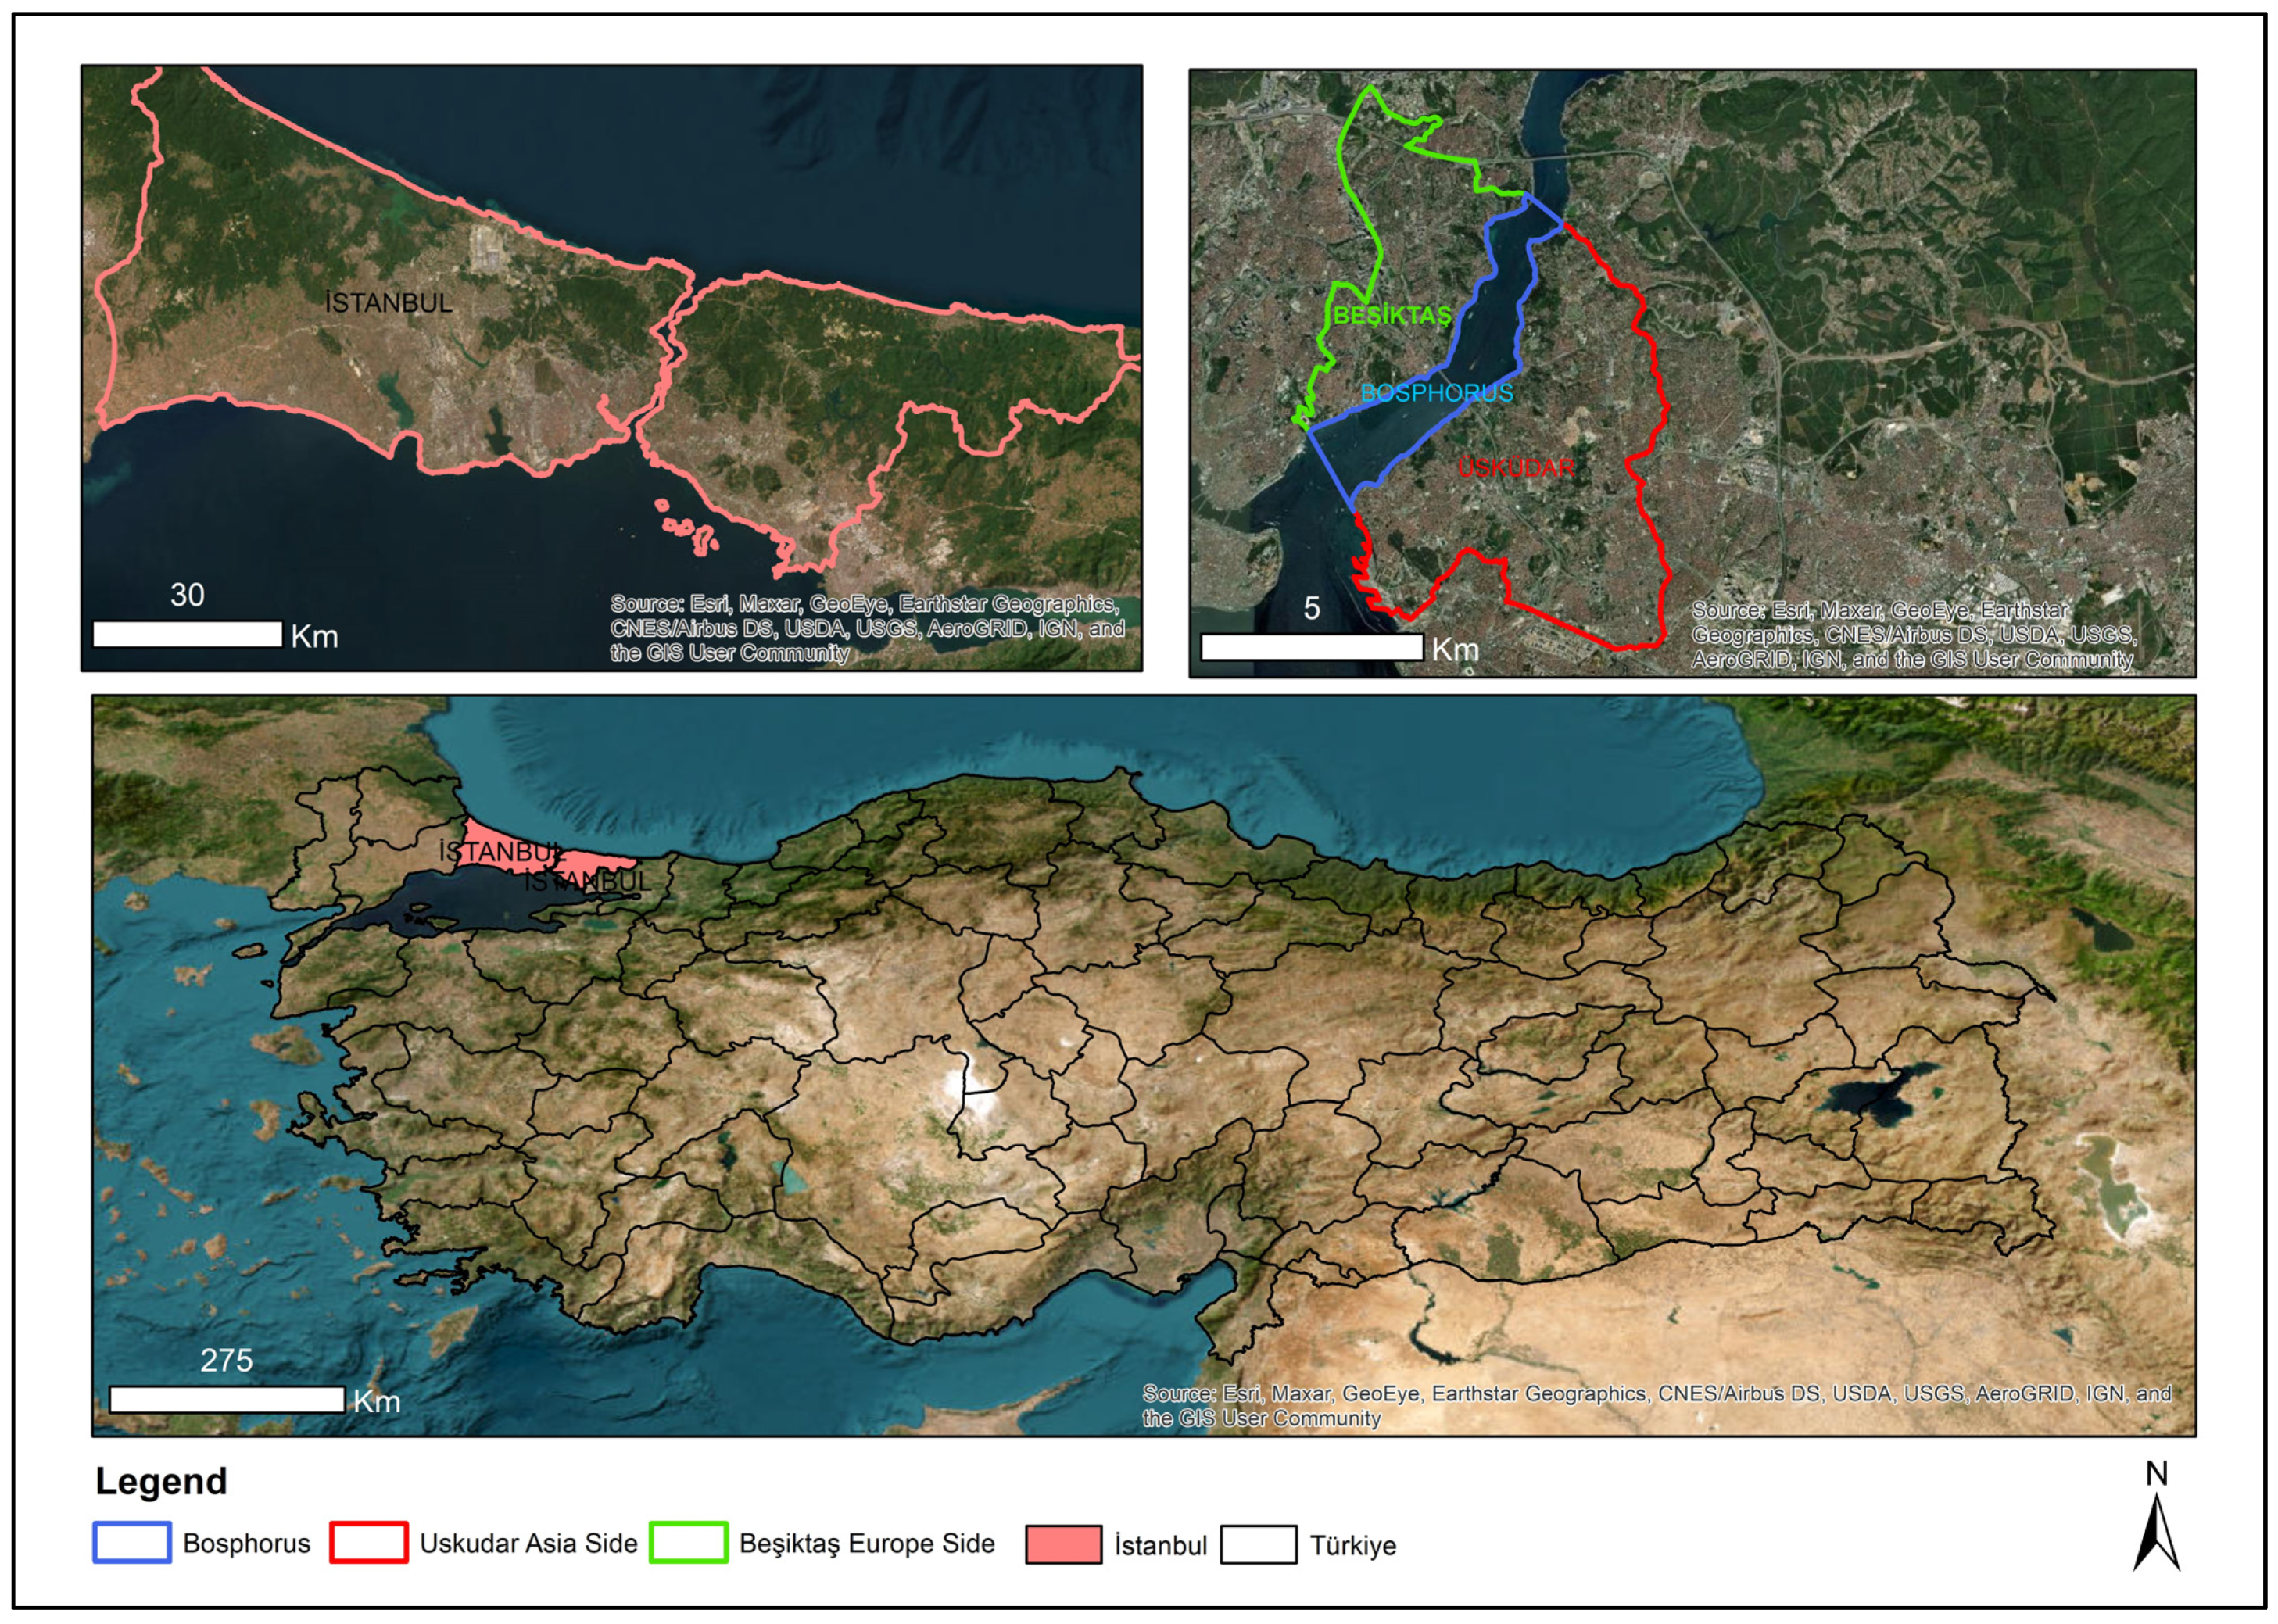
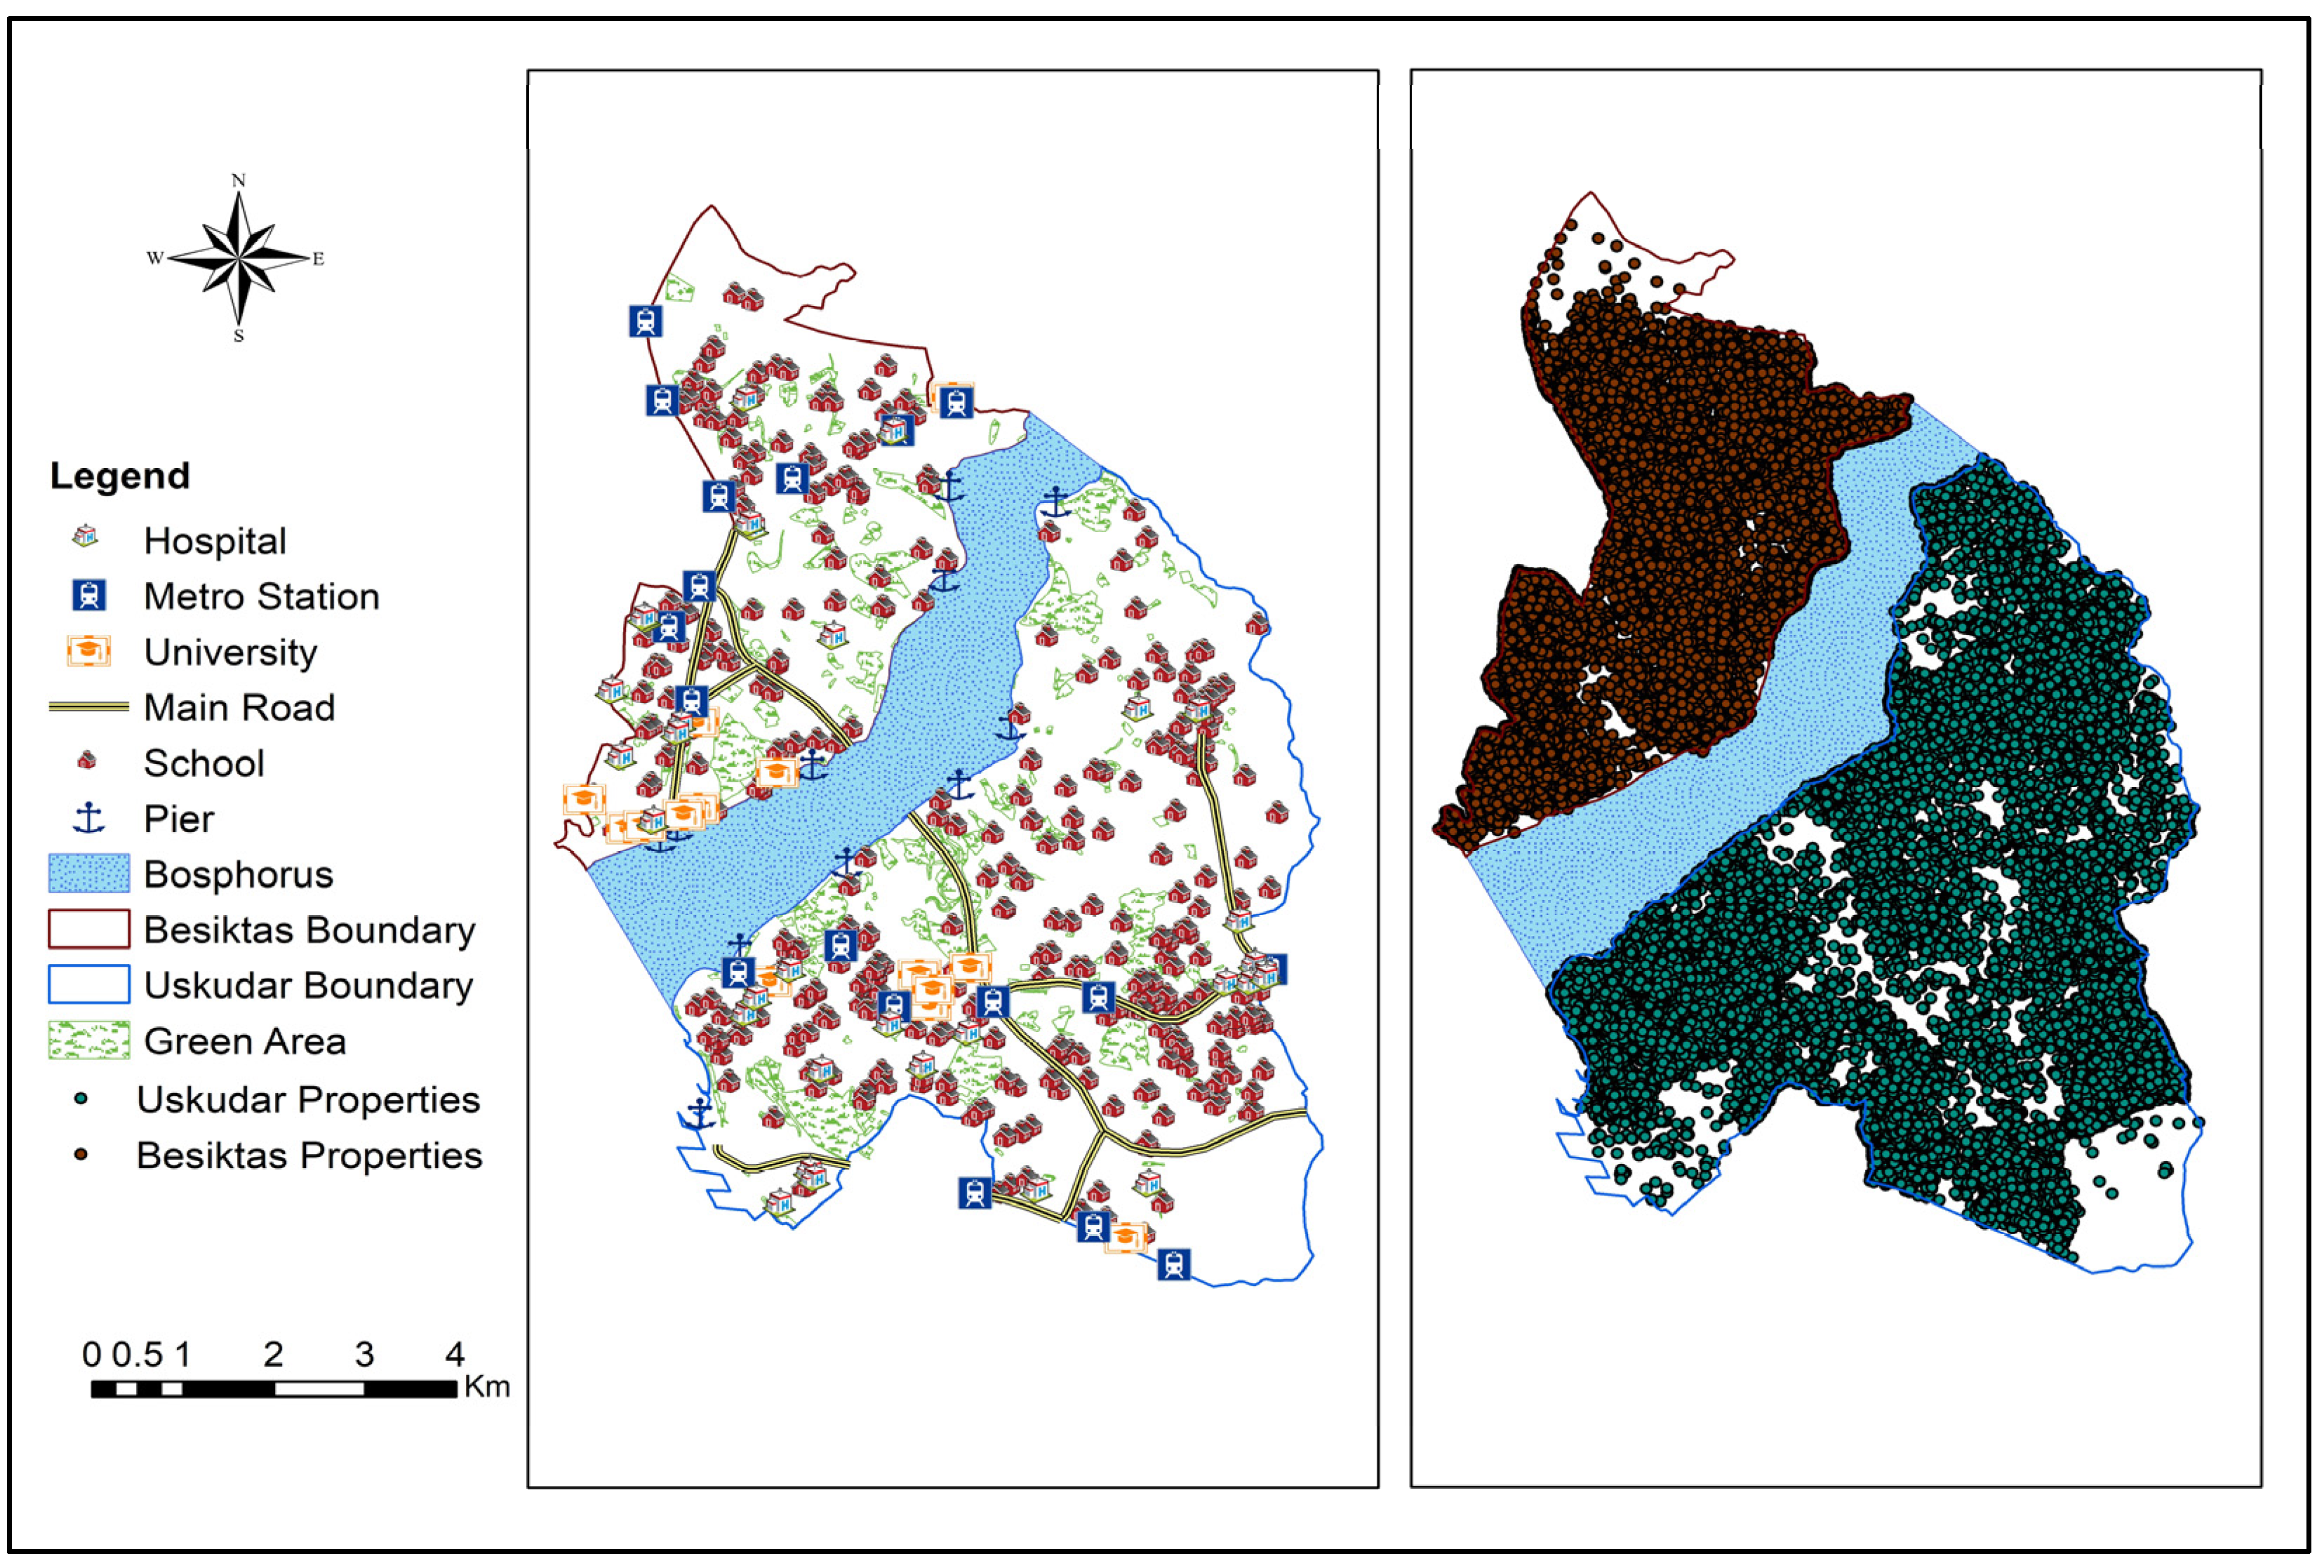
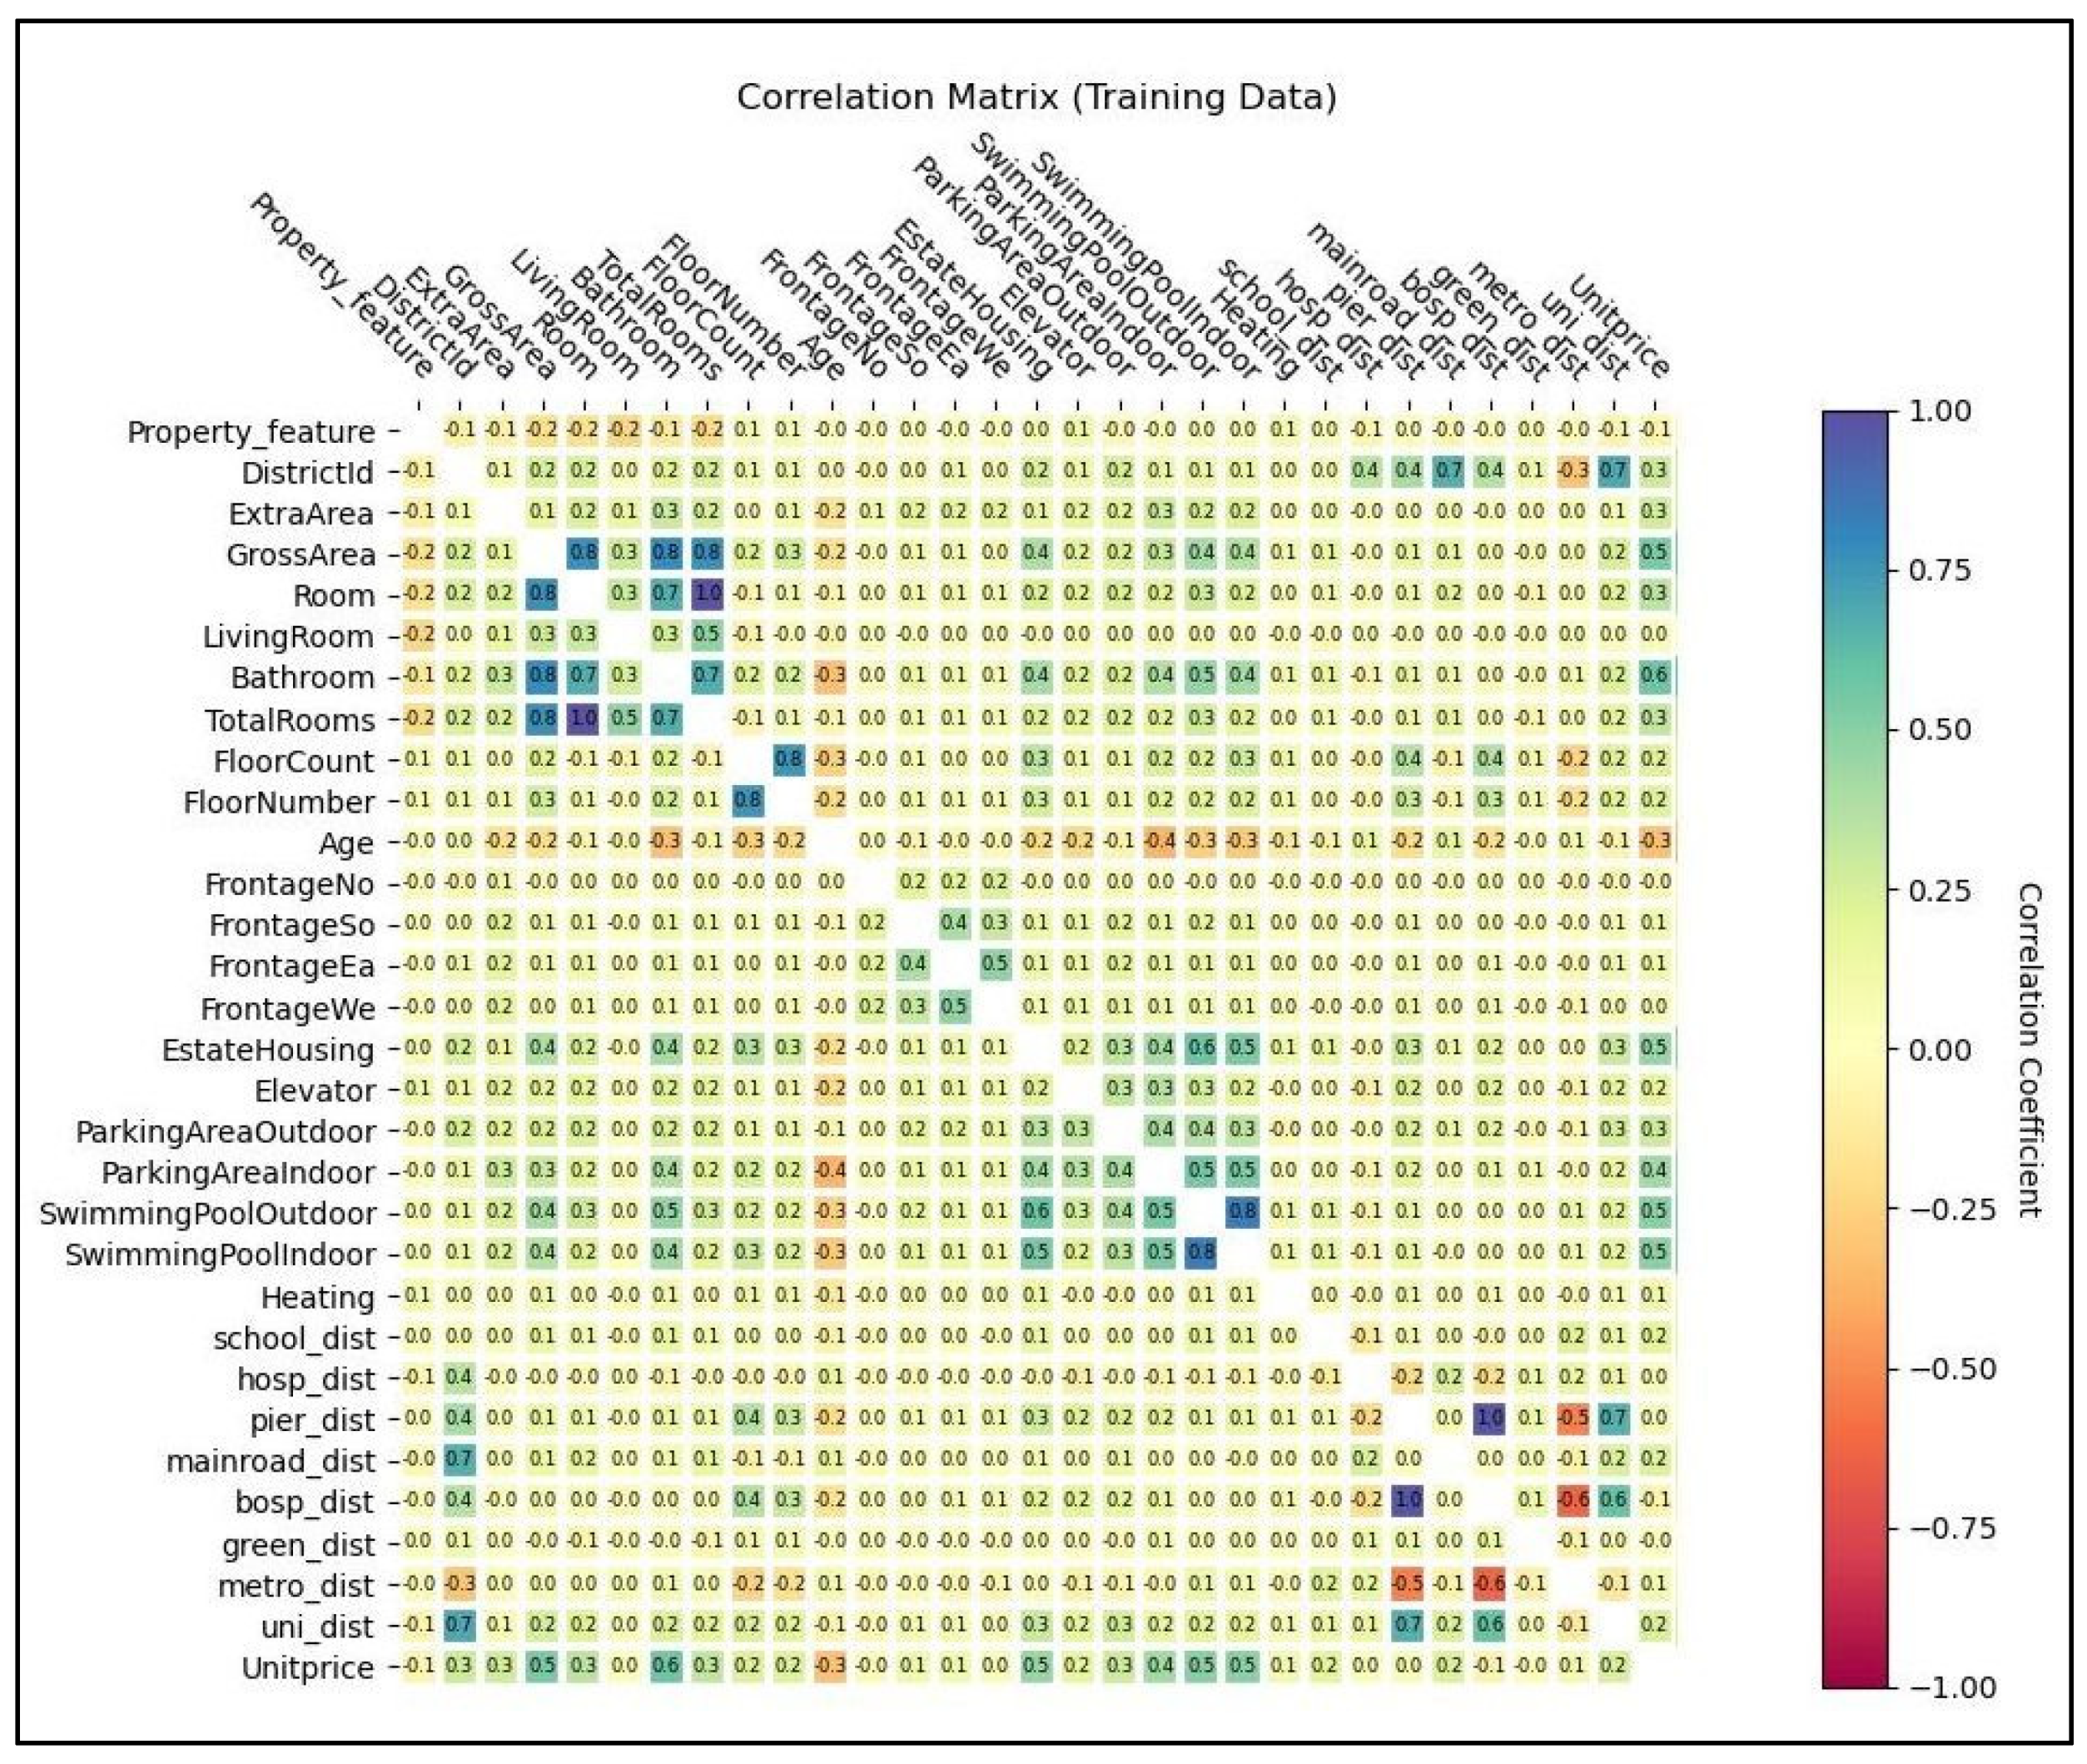

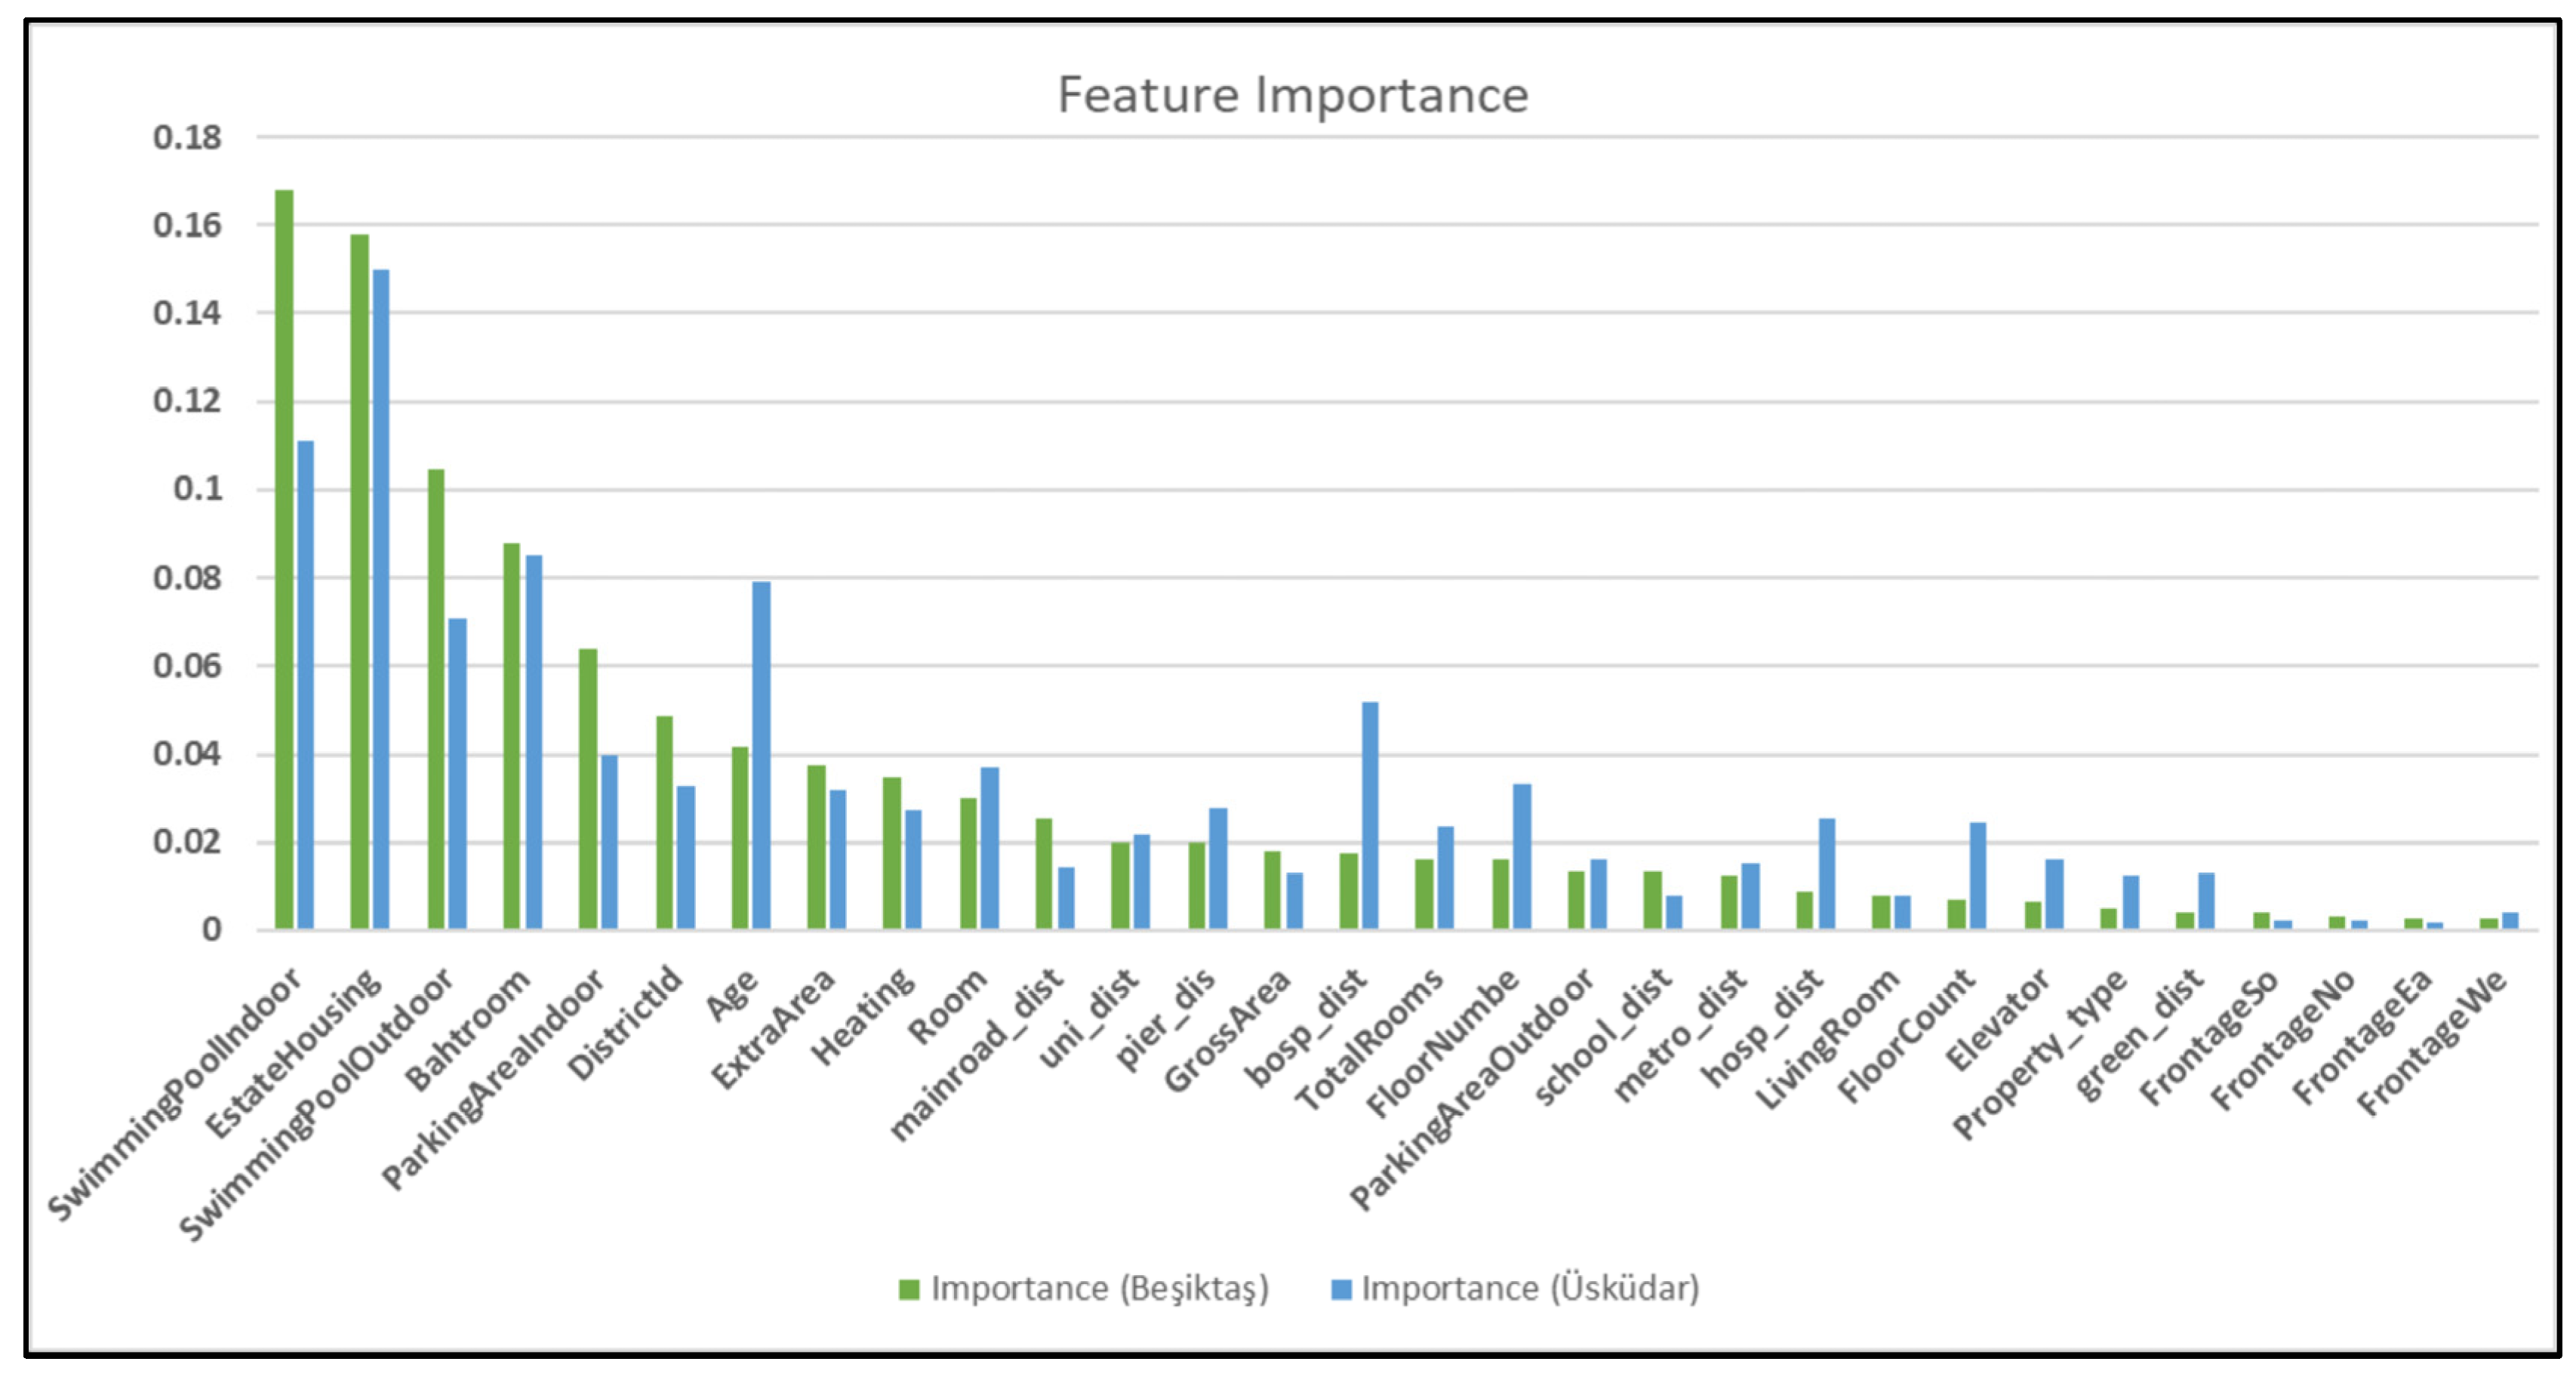
| Variable | Unit | Data Type | Data Class | Definition |
|---|---|---|---|---|
| Property_type | Dummy | Categorical | Structural | Detached House (1) or Flat (2) |
| ExtraArea | Dummy | Categorical | Structural | Does the property have a terrace? Yes (1) or No (0) |
| GrossArea | M2 | Continuous | Structural | Area of property |
| Room | Count | Discrete | Structural | Number of room(s) |
| LivingRoom | Count | Discrete | Structural | Number of living room(s) |
| Bathroom | Count | Discrete | Structural | Number of bathroom(s) |
| TotalRooms | Count | Discrete | Structural | Number of total room(s)—[Room + Living Room] |
| FloorCount | Count | Discrete | Structural | Number of floors of the apartment or house |
| FloorNumbe | Number | Discrete | Structural | Floor level of property |
| Age | Number | Continuous | Structural | The age of the building |
| FrontageNo | Dummy | Categorical | Structural | Facing north? Yes (1) or No (0) |
| FrontageSo | Dummy | Categorical | Structural | Facing south? Yes (1) or No (0) |
| FrontageEa | Dummy | Categorical | Structural | Facing east? Yes (1) or No (0) |
| FrontageWe | Dummy | Categorical | Structural | Facing west? Yes (1) or No (0) |
| EstateHousing | Dummy | Categorical | Structural | In a building complex? Yes (1) or No (0) |
| Elevator | Dummy | Categorical | Structural | Elevator existence Yes (1) or No (0) |
| ParkingAreaOutdoor | Dummy | Categorical | Structural | Outdoor parking existence Yes (1) or No (0) |
| ParkingAreaIndoor | Dummy | Categorical | Structural | Indoor parking existence Yes (1) or No (0) |
| SwimmingPoolOutdoor | Dummy | Categorical | Structural | Outdoor swimming pool Yes (1) or No (0) |
| SwimmingPoolIndoor | Dummy | Categorical | Structural | Indoor swimming pool Yes (1) or No (0) |
| Heating | Dummy | Categorical | Structural | Heating type of the property. None (1), Coil Stove (2), Natural Gas Stove (3), Floor Heater (4), Combi Boiler (5), Central Heating System (6), Heat Cost Allocator (7), Electric Heating (8), Air Conditioning (9), Geothermal Energy (10), Solar Energy (11), Other (12) |
| DistrictId | Dummy | Categorical | Locational | Administrative neighborhood of property |
| school_dist | Meter | Continuous | Locational | Distance to the nearest school (elementary and secondary) |
| hosp_dist | Meter | Continuous | Locational | Distance to the nearest hospital |
| pier_dis | Meter | Continuous | Locational | Distance to the nearest public sea transportation pier |
| mainroad_dist | Meter | Continuous | Locational | Distance to the nearest main road |
| bosp_dist | Meter | Continuous | Locational | Distance to the Bosphorus |
| green_dist | Meter | Continuous | Locational | Distance to the nearest green area |
| metro_dist | Meter | Continuous | Locational | Distance to the nearest metro station |
| uni_dist | Meter | Continuous | Locational | Distance to the nearest university |
| Parameters | MAE | MAPE | RMSE | R2 | ||
|---|---|---|---|---|---|---|
| ANN | Beşiktaş | Hidden layers # of neurons: 50, 25 | 42,711.97 | 29.35% | 64,962.35 | 0.72 |
| Hidden layers # of neurons: 100, 50 | 41,364.28 | 28.58% | 62,956.46 | 0.74 | ||
| Hidden layers # of neurons: 150, 100 | 40,810.38 | 28.09% | 62,394.98 | 0.74 | ||
| Hidden layers # of neurons: 150, 100 * | 44,380.95 | 30.89% | 67,352.54 | 0.70 | ||
| Hidden layers # of neurons: 150, 100 ** | 41,426.92 | 28.55% | 63,145.35 | 0.73 | ||
| Üsküdar | Hidden layers # of neurons: 50, 25 | 17,499.49 | 25.19% | 30,413.27 | 0.69 | |
| Hidden layers # of neurons: 100, 50 | 16,919.88 | 24.39% | 29,343.15 | 0.71 | ||
| Hidden layers # of neurons: 150, 100 | 17,278.90 | 24.76% | 29,180.05 | 0.72 | ||
| Hidden layers # of neurons: 150, 100 * | 16,965.53 | 24.24% | 29,731.69 | 0.71 | ||
| Hidden layers # of neurons: 150, 100 ** | 17,267.53 | 24.93% | 29,527.43 | 0.71 | ||
| RF | Beşiktaş | Number of trees:100 | 3351.93 | 22.84% | 54,566.22 | 0.80 |
| Number of trees:200 | 33,452.32 | 22.78% | 54,403.61 | 0.80 | ||
| Number of trees:300 | 33,408.08 | 22.75% | 54,341.15 | 0.80 | ||
| Number of trees:300 * | 37,345.59 | 25.69% | 59,815.44 | 0.76 | ||
| Number of trees:300 ** | 33,339.37 | 22.70% | 54,219.45 | 0.80 | ||
| Üsküdar | Number of trees:100 | 13,670.24 | 19.20% | 25,733.62 | 0.78 | |
| Number of trees:200 | 13,615.34 | 19.12% | 25,627.88 | 0.78 | ||
| Number of trees:300 | 13,599.35 | 19.10% | 25,601.47 | 0.78 | ||
| Number of trees:300 * | 14,092.31 | 19.81% | 26,407.75 | 0.77 | ||
| Number of trees:300 ** | 13,680.01 | 19.24% | 25,767.98 | 0.78 | ||
| XGBoost | Beşiktaş | Number of trees:100 | 41,141.41 | 28.33% | 62,452.78 | 0.74 |
| Number of trees:200 | 39,590.15 | 27.23% | 60,440,00 | 0.76 | ||
| Number of trees:300 | 38,782.90 | 26.66% | 59,351.94 | 0.77 | ||
| Number of trees:100 * | 43,146.35 | 30.18% | 65,218.29 | 0.72 | ||
| Number of trees:100 ** | 38,923.88 | 26.78% | 59,489.30 | 0.76 | ||
| Üsküdar | Number of trees:100 | 6704.12 | 24.03% | 29,183.04 | 0.72 | |
| Number of trees:200 | 15,950.74 | 22.78% | 28,036.05 | 0.74 | ||
| Number of trees:300 | 15,608.99 | 22.25% | 27,481.90 | 0.75 | ||
| Number of trees:300 * | 16,031.30 | 22.87% | 28,161.56 | 0.74 | ||
| Number of trees:300 ** | 15,844.88 | 22.61% | 27,807.46 | 0.74 | ||
| KNN | Beşiktaş | # of nearest neighbors:3 | 40,536.86 | 26.92% | 66,045.35 | 0.71 |
| # of nearest neighbors:5 | 40,229.05 | 26.78% | 64,633.47 | 0.72 | ||
| # of nearest neighbors:10 | 40,794.10 | 27.25% | 64,694.79 | 0.72 | ||
| # of nearest neighbors:10 * | 42,441.96 | 28.59% | 67,154.52 | 0.70 | ||
| # of nearest neighbors:10 ** | 41,140.30 | 27.45% | 65,246.79 | 0.72 | ||
| Üsküdar | # of nearest neighbors:3 | 18,324.96 | 25.65% | 33,528.64 | 0.63 | |
| # of nearest neighbors:5 | 18,199.75 | 25.52% | 33,045.64 | 0.64 | ||
| # of nearest neighbors:10 | 18,309.47 | 25.74% | 33,080.80 | 0.64 | ||
| # of nearest neighbors:10 * | 17,143.19 | 23.32% | 32,188.65 | 0.66 | ||
| # of nearest neighbors:10 ** | 18,761.38 | 26.46% | 33,714.08 | 0.62 | ||
| SVR | Beşiktaş | training error and tolerance: 1, 0.1 | 86,484.50 | 55.21% | 129,376.40 | −0.11 |
| training error and tolerance: 100, 0.1 | 59,428.14 | 36.00% | 94,623.36 | 0.40 | ||
| training error and tolerance: 10, 0.5 | 76,656.99 | 46.26% | 119,264.70 | 0.05 | ||
| training error and tolerance: 100, 0.1 * | 57,649.46 | 35.03% | 91,846.83 | 0.44 | ||
| training error and tolerance: 100, 0.1 ** | 59,458.12 | 36.12% | 94,552.14 | 0.41 | ||
| Üsküdar | training error and tolerance: 1, 0.1 | 31,421.64 | 38.00% | 56,665.68 | −0.07 | |
| training error and tolerance: 100, 0.1 | 23,043.50 | 28.65% | 44,559.86 | 0.34 | ||
| training error and tolerance: 10, 0.5 | 27,272.26 | 32.89% | 51,451.84 | 0.12 | ||
| training error and tolerance: 100, 0.1 * | 22,810.92 | 28.24% | 44,171.73 | 0.35 | ||
| training error and tolerance: 100, 0.1 ** | 23,215.81 | 28.89% | 44,699.73 | 0.34 | ||
| SLR | Beşiktaş | 54,097.47 | 33.89% | 85,542.16 | 0.51 | |
| * | 58,231.77 | 37.32% | 176,142.40 | 0.45 | ||
| ** | 55,135.33 | 34.63% | 181,093.75 | 0.50 | ||
| Üsküdar | 22,710.96 | 29.95% | 41,466.70 | 0.43 | ||
| * | 23,440.78 | 30.63% | 74,454.11 | 0.39 | ||
| ** | 23,001.77 | 30.21% | 75,308.68 | 0.42 |
Disclaimer/Publisher’s Note: The statements, opinions and data contained in all publications are solely those of the individual author(s) and contributor(s) and not of MDPI and/or the editor(s). MDPI and/or the editor(s) disclaim responsibility for any injury to people or property resulting from any ideas, methods, instructions or products referred to in the content. |
© 2025 by the authors. Licensee MDPI, Basel, Switzerland. This article is an open access article distributed under the terms and conditions of the Creative Commons Attribution (CC BY) license (https://creativecommons.org/licenses/by/4.0/).
Share and Cite
Erciyes, A.H.; Atasoy, T.; Tursun, A.; Canaz Sevgen, S. Learning the Value of Place: Machine Learning Models for Real Estate Appraisal in Istanbul’s Diverse Urban Landscape. Buildings 2025, 15, 2773. https://doi.org/10.3390/buildings15152773
Erciyes AH, Atasoy T, Tursun A, Canaz Sevgen S. Learning the Value of Place: Machine Learning Models for Real Estate Appraisal in Istanbul’s Diverse Urban Landscape. Buildings. 2025; 15(15):2773. https://doi.org/10.3390/buildings15152773
Chicago/Turabian StyleErciyes, Ahmet Hilmi, Toygun Atasoy, Abdurrahman Tursun, and Sibel Canaz Sevgen. 2025. "Learning the Value of Place: Machine Learning Models for Real Estate Appraisal in Istanbul’s Diverse Urban Landscape" Buildings 15, no. 15: 2773. https://doi.org/10.3390/buildings15152773
APA StyleErciyes, A. H., Atasoy, T., Tursun, A., & Canaz Sevgen, S. (2025). Learning the Value of Place: Machine Learning Models for Real Estate Appraisal in Istanbul’s Diverse Urban Landscape. Buildings, 15(15), 2773. https://doi.org/10.3390/buildings15152773


