Passive Design for Residential Buildings in Arid Desert Climates: Insights from the Solar Decathlon Middle East
Abstract
1. Introduction
2. Literature Review
2.1. Passive Design
2.1.1. Passive Design Strategies
- Heat protection prevents external heat gains from entering the building’s inner space by using surrounding elements as heat barriers, such as water surfaces, shading vegetation, and neighboring buildings, as well as building components, such as orientation, shape, material properties, airtightness, and shading elements [11].
- Heat modulation uses the building’s thermal mass to absorb and store heat during the day and release it at night, smoothing temperature fluctuations. Heat storage is achieved by taking advantage of the thermal capacity of solid or liquid materials, either through sensible heat or latent heat. Materials with sensible heat storage change temperature as they store heat, whereas Phase Change Materials (PCMs) store latent heat during phase changes without a temperature change, offering higher storage capacity [11,13,14,15,16].
- Heat dissipation involves removing heat gains from both external and internal sources to an external body that acts as a cooling sink [11,15]. This requires a significant temperature difference and efficient thermal coupling between the building and the heat sink [12]. Methods include geothermal cooling (using the ground’s temperature) [12,14], evaporative cooling (using water to absorb heat from air) [11,15], convective cooling (utilizing natural ventilation) [11,15], and radiative cooling (emitting heat to the sky) [15,17].
2.1.2. Passive Design Measures (Design Elements)
- Compact building shapes minimize the heat exchange surface between the conditioned volume of the building and the outdoor environment. Two parameters describe building shape per the European Committee for Standardization: compactness (the ratio of the thermal envelope area to the building volume) and the shape factor (the ratio of the thermal envelope area to the conditioned floor area) [7,18]. A study in Baghdad’s hot desert climate reported that a square-shaped low-rise building saved 30% more energy than an L-shaped building did and 33% more energy than an H-shaped building did [19].
- The window-to-wall ratio (WWR) is the ratio of transparent to opaque vertical envelope areas, whereas the skylight-to-roof ratio (SR) applies to horizontal surfaces. Large transparent areas often lead to increased thermal transmittance, thermal bridges, and increased solar gains. In Muscat, a 10% increase in WWR led to a 4% increase in energy consumption [20]. In Al-Ain, reducing the WWR from 12% to 6% decreased cooling by 3.7% and electricity by 3.2%, whereas increasing the WWR to 20% increased cooling by 8.5% and electricity by 7.2% [21].
- Orientation affects exposure to solar radiation and wind [7]. In the hot climates of the Northern Hemisphere, maximizing the openings in northern façades and minimizing them in the western and eastern facades [22], placing service spaces in the west as thermal buffers, and positioning the main entrance to the north with a foyer to reduce heat gains are recommended [7].
- Shading elements can be fixed or movable and vertical or horizontal, such as overhangs, louvers, light shelves, and blinds [11,22]. In Dubai, low solar angles in the east and west make shading challenging, whereas southern orientations with higher angles are easier to shade. Shading generally saves more energy in commercial buildings than in residential buildings, as commercial buildings have larger glazing areas [22].
- Thermal bridges are created when the building envelope is interrupted, causing a change in thermal resistance [23]. They form where materials with different insulation properties meet or where the geometry of the envelope changes, such as wall–roof junctions and projecting balcony slabs (linear) or single penetrations in the thermal envelope (point) [23,24]. Point thermal bridges generally have a negligible effect.
- Airtightness quantifies the flow of air infiltrating buildings and is usually measured at a constant pressure difference of 50 PAs [25]. While it brings fresh air and dilutes pollutants, it also allows heat gains, compromising thermal comfort; therefore, it should be minimized [15]. Reducing airtightness from 0.7 to 0.5 air changes per hour (ACH) in an Omani low-rise residential building resulted in a 6.8% reduction in cooling and a 4.8% reduction in total energy consumption.
- Thermal transmittance (U-value) measures the heat flow through an envelope component per unit area, time, and temperature difference (W/m2K). Reducing the U-value of external walls (from 2.32 to 0.3 W/m2K) and the roof (from 0.6 to 0.2 W/m2K) in a low-rise residential building in Al-Ain, UAE, cuts cooling demand by 19.3% and total electricity use by 15.5% [21].
- Glazed areas, such as windows and skylights, are evaluated based on thermal and optical properties: U-value, solar heat gain coefficient (SHGC), and visible transmittance (Vt). Performance can be static (fixed properties) or dynamic, changing with solar intensity (photochromic), temperature (thermochromic), or electrical charge (electrochromic) [7,11].
- Thermal mass refers to a building’s capacity to absorb, store, and release heat, which is influenced by specific heat capacity, density, and thermal conductivity. High thermal mass materials, such as water and concrete, store more thermal energy, whereas foam insulation stores less thermal energy. Increasing the thermal mass in a low-rise residential building in Al-Ain, UAE, reduced cooling by 13.4% and overall electricity use by 11.9% [21].
- Light-colored and reflective coatings on a building’s exterior reduce heat transfer to interiors [22]. In Qatar, changing the exterior finishing of a low-rise residential building from medium to light color reduced the cooling load by 12% [26]. In Saudi Arabia, replacing a dirty roof with a conventional concrete roof reduced the peak cooling load by 5.68%, and replacing it with a cool roof by 8.23% [27].
- Green walls and roofs lower energy loads through evaporative cooling [22]. A study conducted in several cities worldwide revealed that, in Cairo, buildings with green roofs reduce cooling energy use by at least 27% [28]. However, green surfaces also increase maintenance costs and water consumption [22].
- Ventilation measures enhance energy efficiency and improve indoor air quality and comfort. These include double skin walls (with an air gap between layers), evaporative cooling (using water bodies), a thermal mass for night cooling, and solar chimneys (with water-absorbing sheets) [22,29]. However, evaporative measures are less effective in high-humidity climates.
2.2. Dubai Context
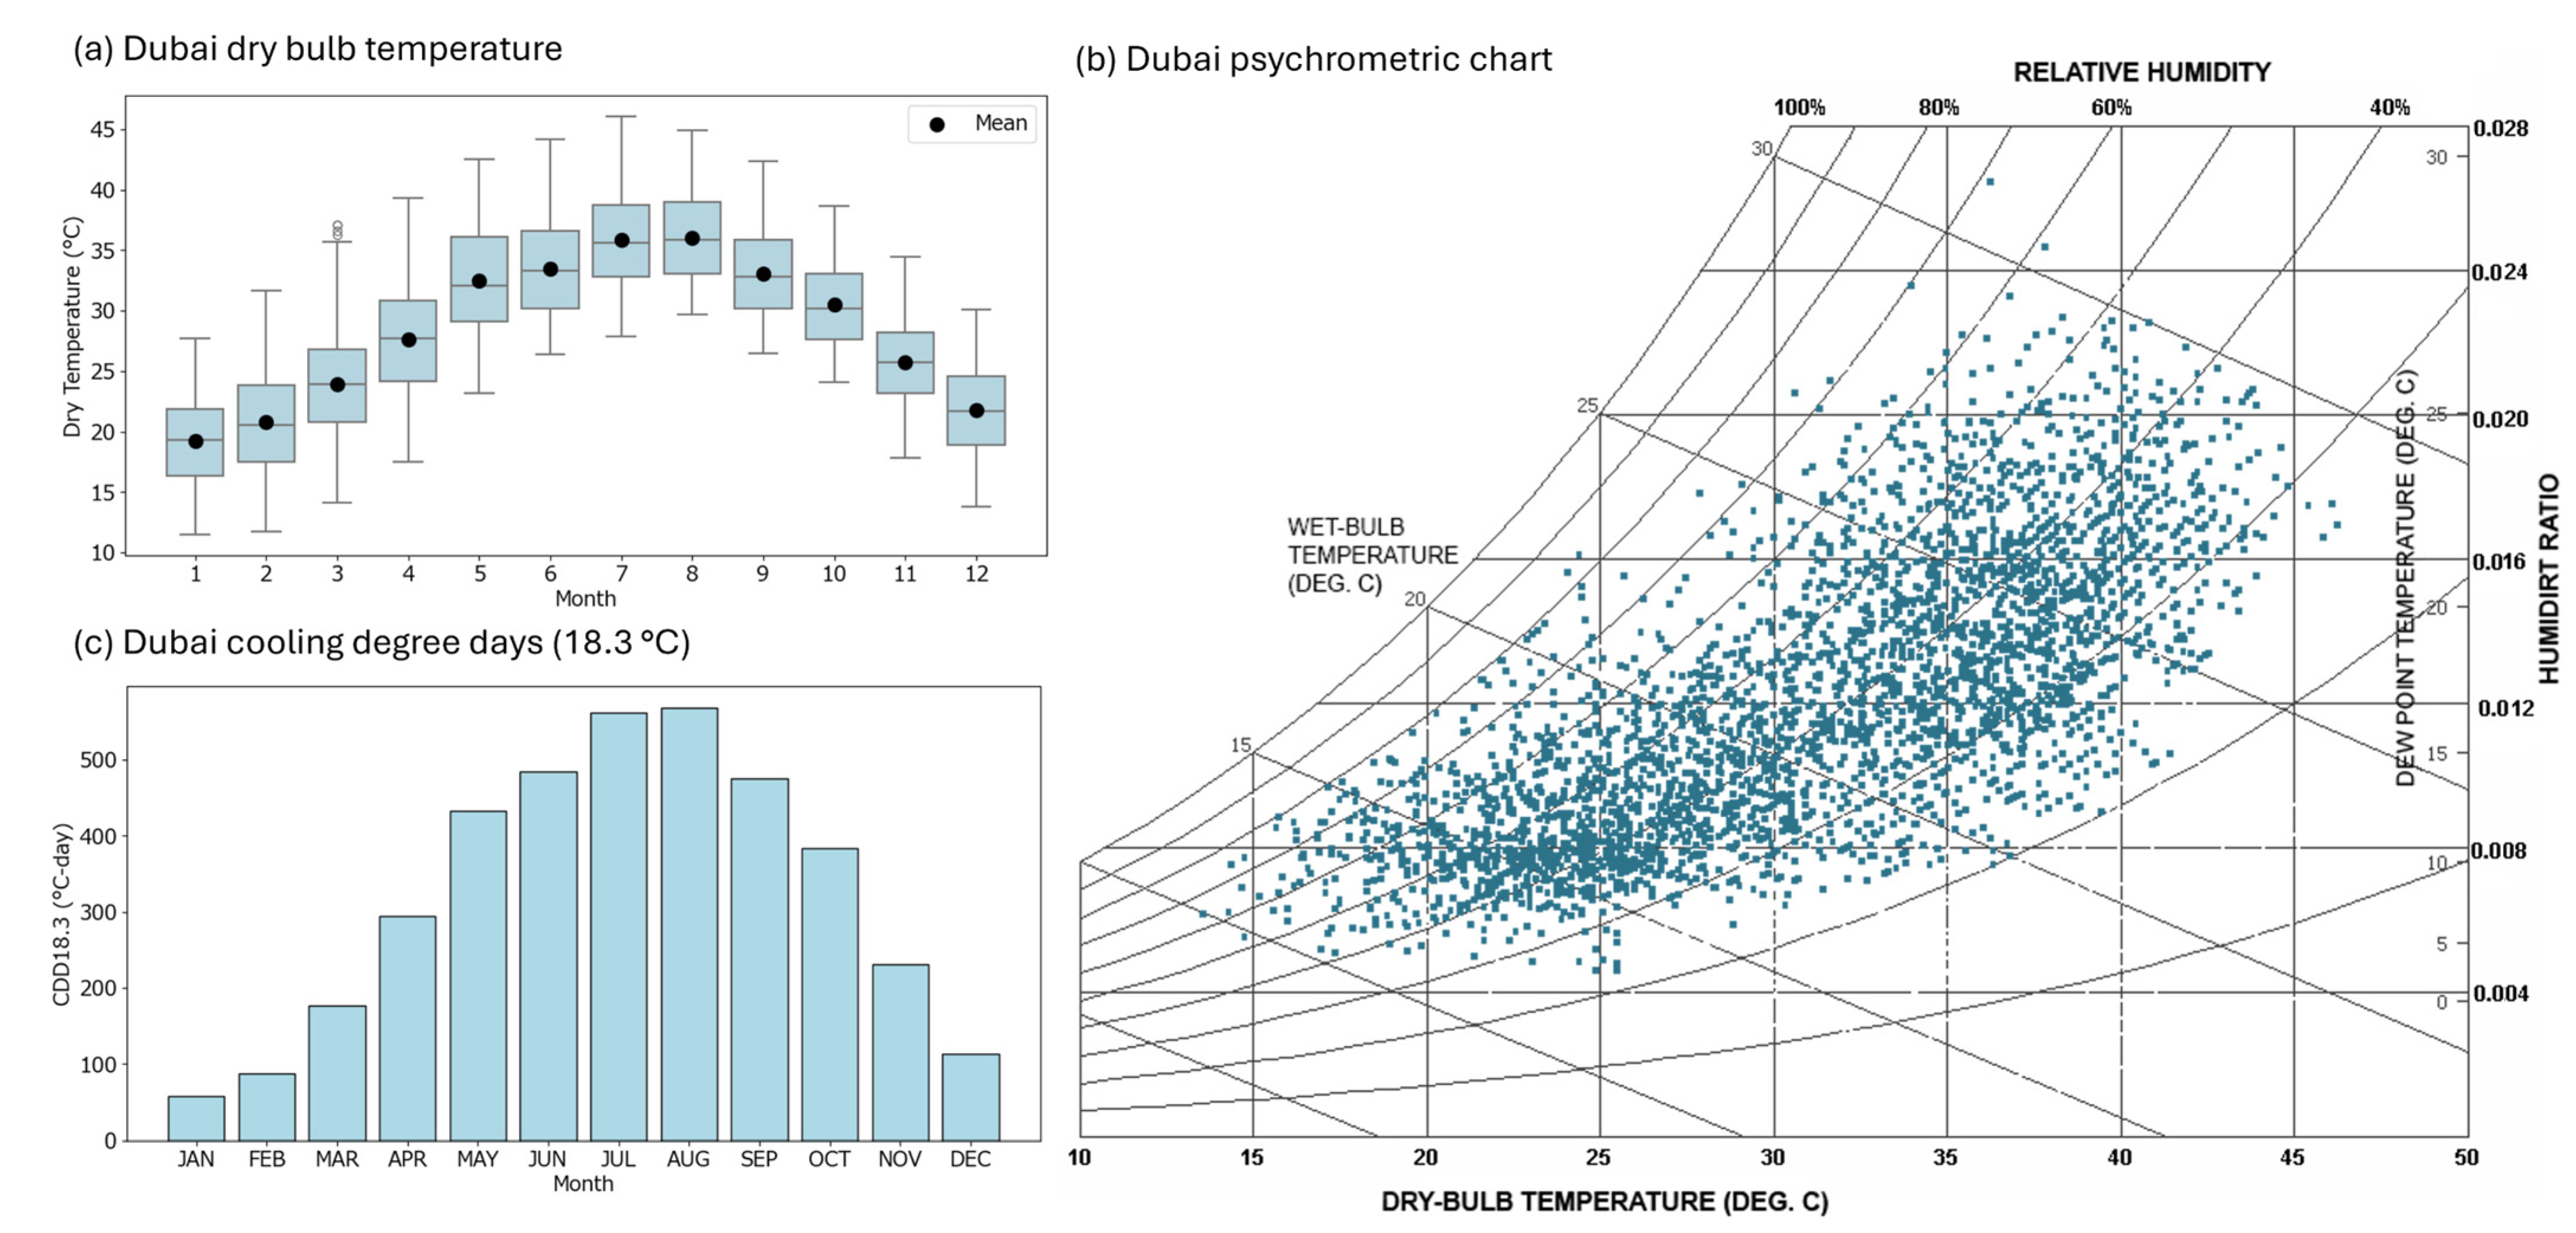
2.2.1. Dubai Climate
2.2.2. Vernacular Architecture
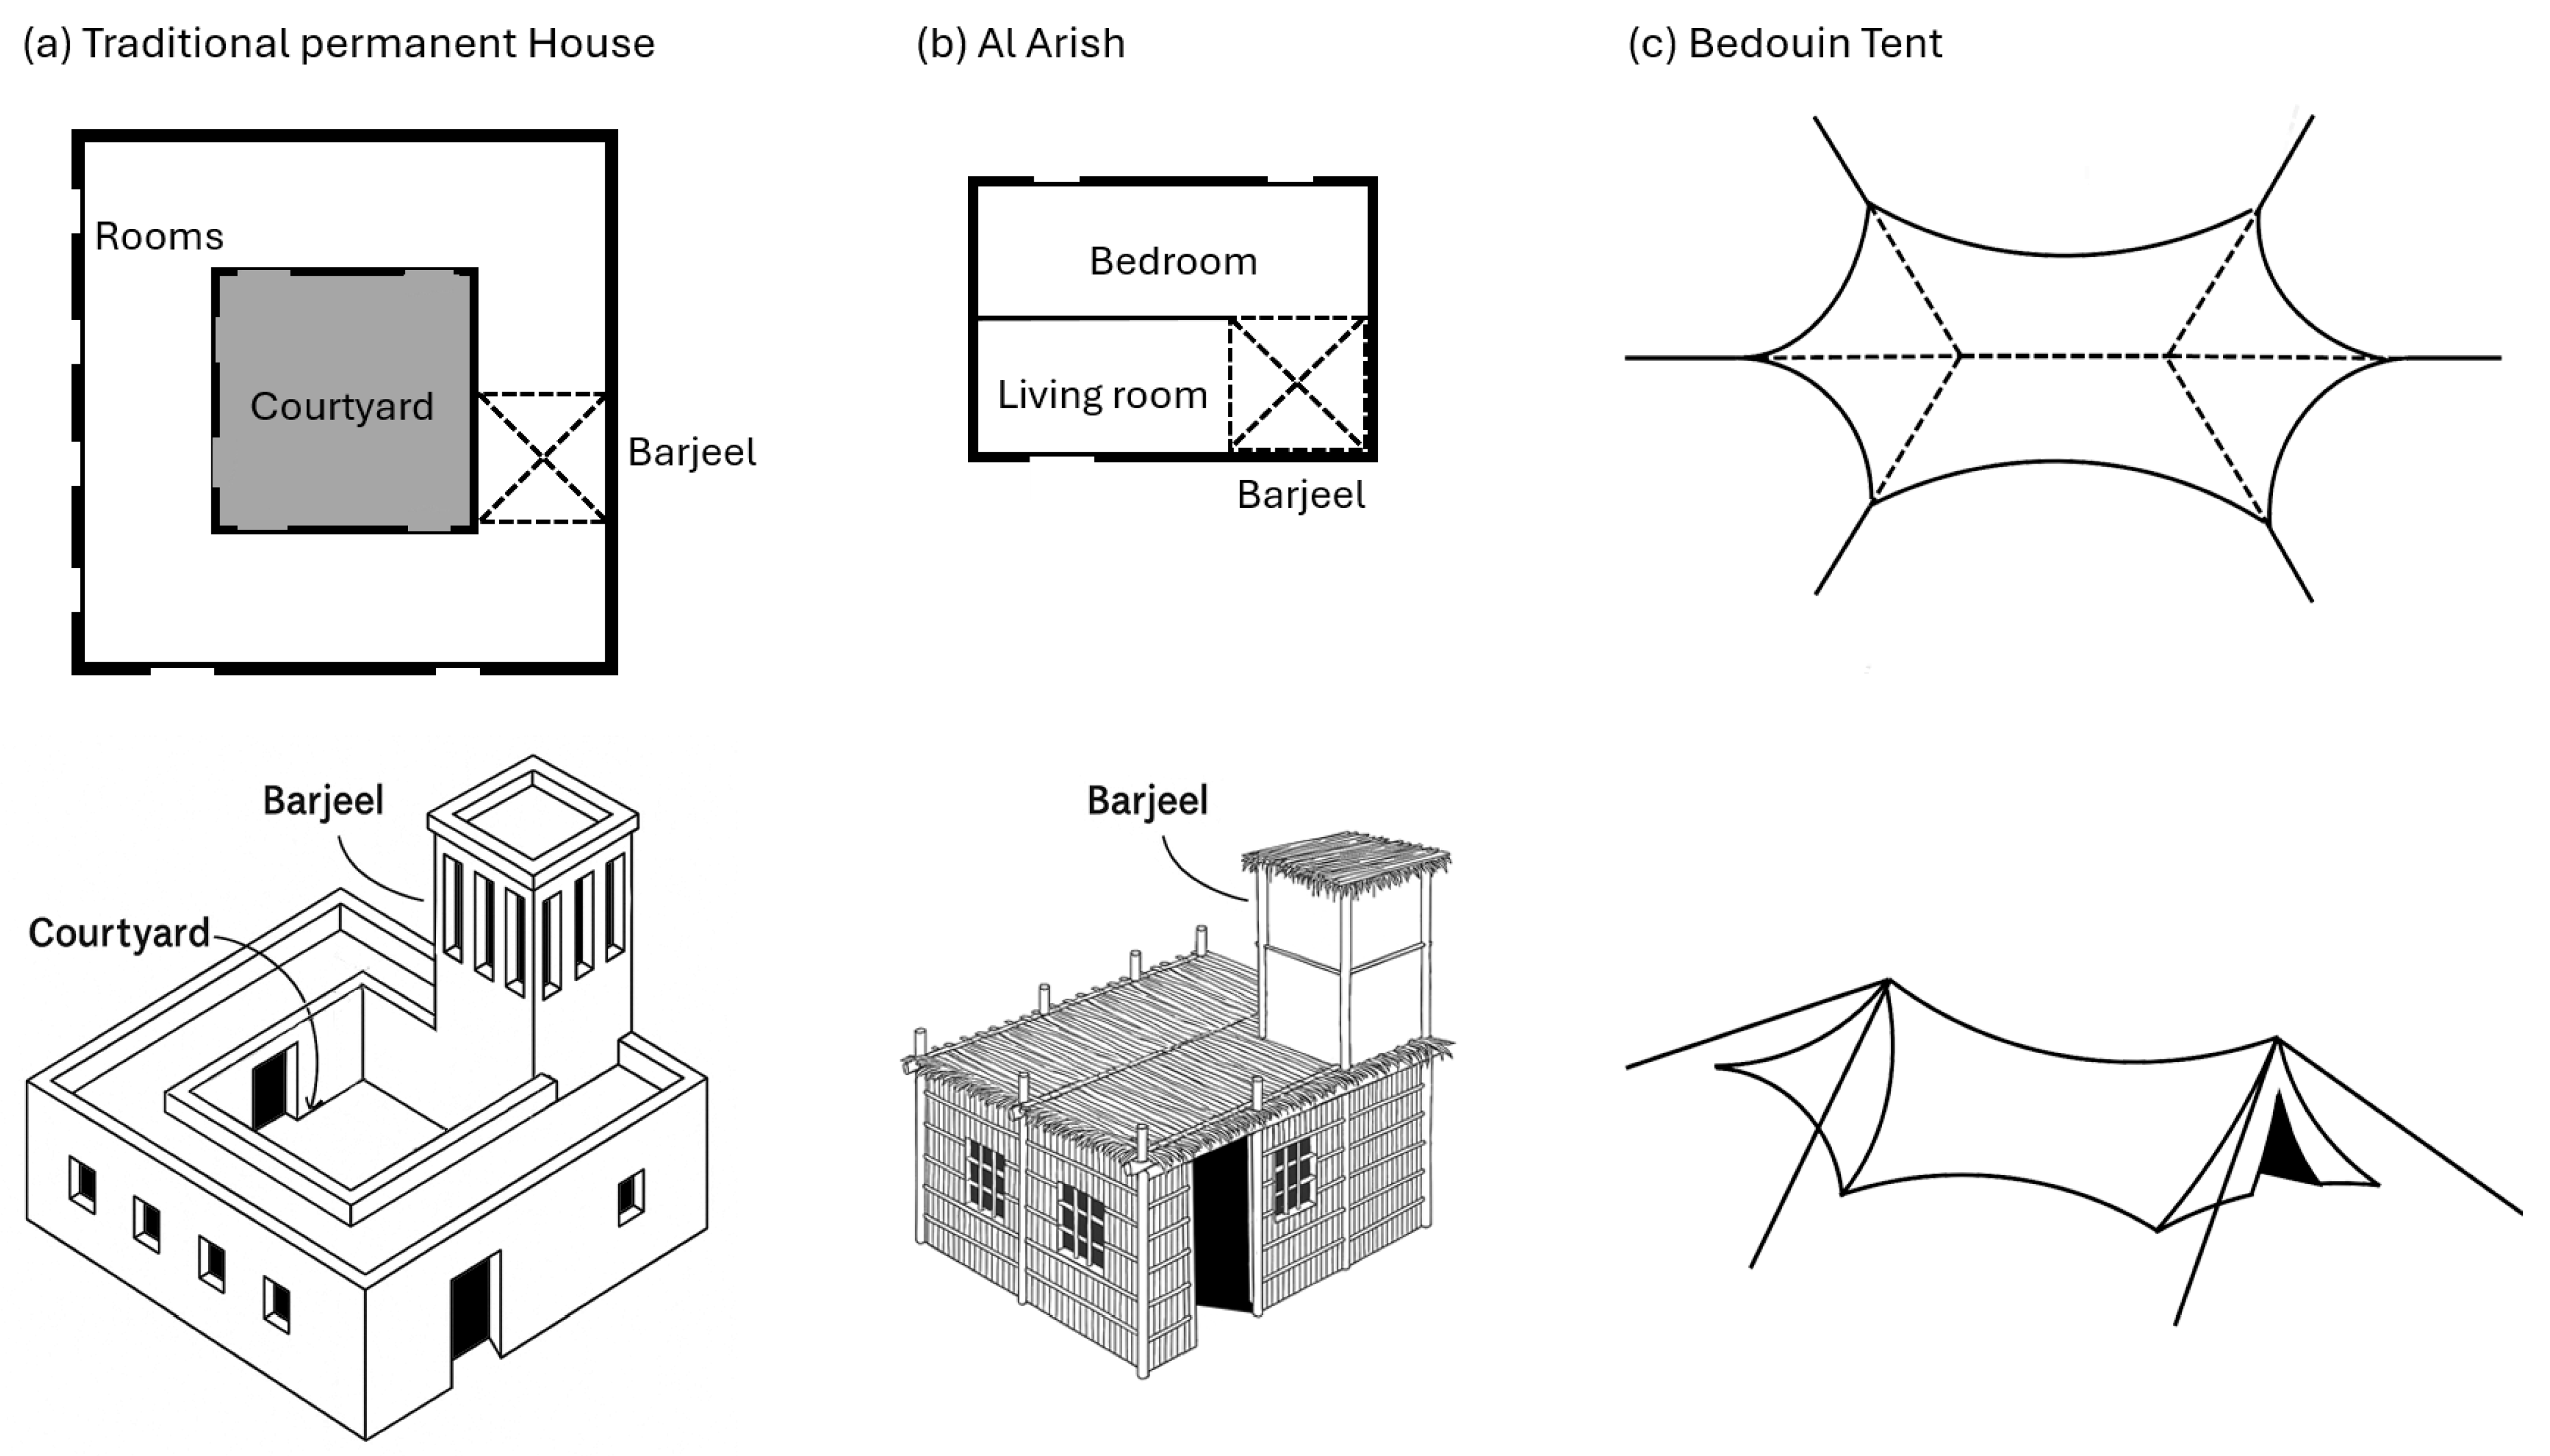
- Permanent houses are made of coral stones or guss (a mud mixture) and covered with palm tree trunks. They are organized around the interior courtyard and can be used as winter houses, built near coastal areas, or summer houses, built near palm tree farms.
- Al Arish, used by Bedouins during summer, is made of palm tree leaves. They are composed of two separate spaces: the main space for lounging and sleeping and the smaller space for cooking and storing.
- Traditional tents, used by Bedouin during the winter, are made of animal skin and hair. They are easy to fold and carry on camels during relocation. The main tents are divided into two parts based on gender segregation, and secondary, smaller tents are used for cooking and storage.
- The courtyard, central to the design of traditional dwellings, offers a shaded outdoor space inside the house, toward which the main openings of the house are oriented, whereas, socially, it provides a private area for family activities and gender-segregated socialization [31].
- The liwan, a colonnaded porch facing the inner courtyard, shades the walls of the house and serves as an outdoor space for more private family gatherings [32].
- Exterior openings toward the street are minimized for heat protection of the inner spaces and privacy, with the main ventilation and daylight coming from those oriented toward the shaded inner courtyards [31].
- Majlis is the room designated for male gatherings. It is located near the entrance and is often the only room in a house with street-facing windows [32].
- Barjeel, a wind tower that provides cross-ventilation, starts at approximately two meters above ground, is approximately fifteen meters high, and has a funnel and top openings to catch air from all directions, increasing its velocity and creating a cool area below, typically used for eating and entertaining [31].
- Construction materials come from local natural sources: coral blocks for permanent houses, approximately 60 cm thick, have low thermal conductivity due to their cellular nature, providing a comfortable interior space, and mountain stones for fortresses. Palm trees for Al Arish dwellings provide adequate ventilation in highly humid areas, and Bedouin tents use animal skin, a breathable material which helps moderate the effects of the environmental extremes [31].
2.2.3. Dubai Building Design Regulations
| Strategy |
Location/ Climate | Building Type | Characteristics/Dimensions | Age (yrs) | Simulation (S)/Measurements (M) | Method |
Temperature/ Thermal Load Reduction/ Comfort |
Energy Savings/ CO2 Reductions | Ref |
|---|---|---|---|---|---|---|---|---|---|
| Windcatchers | UAE (BWh-Hot desert climate) | House | 2-story, two X-blade windcatchers 15 × 25-m plot | N.S. ≈ 100 | (S) Whole-building energy simulations, plus CFD | Two scenarios: natural ventilation with windows only and a combination of windows and wind catchers. | Up to 5 °C lower than the exterior | 74–111 kg (CO2e)/mont h reduction. | [39] |
| Windcatcher + solar chimney + radiative cooling | Yazd, Iran (BWh-Hot desert climate) | Single and two-story buildings | Two designs: one with a separate solar chimney and windcatcher and the other combined. Spaces are 6 m wide and 3 m high. | N/A | (S) CFD | Five cases were analyzed, combining levels and the windcatcher configurations. | 3 °C reduction during peak hours | 60% (cooling), 80% (ventilation). During peak hours (Best cases). | [40] |
| Windcatcher | Riyadh, KSA (BWh-Hot desert climate) | University courtyard | Rectangular, open-to-sky courtyard surrounded by buildings (20 m wide, 60 m long, and 16.5 m high) | N/A | (S) CFD and (M) | Analysis of the thermal and flow conditions during peak outdoor summer conditions. | −8 to −12 °C | 37 metric tons of CO2 per tower (in the six hot months). | [41] |
| Courtyard + natural ventilation | Damascus, Syria (BWk-Cold desert climate, with hot, dry summers) | Traditional Courtyard house | Two halls: 1st floor north hall (light mass structure + cross ventilation) and ground floor south hall (heavy mass structure + single ventilation) | N.S. | (S) and (M) Summer period | Analyzed six ventilation mode for each of the two cases. | −3 °C (day) −6 °C (night). Heavy mass: up to 20% (daytime). | Up to 72% (summer energy saving, mixed mode) + peak load reduction. | [42] |
| Courtyard + natural ventilation | Kashan, Iran (BWh-Hot desert climate) | Courtyard house | Eight zones of the building were studied. | N.S. ≈130 | (S) Whole-building energy simulations | Analyzed four scenarios, two to determine the thermal loads and two for the cooling energy demand (with and without natural ventilation). | −2 to −5.6 °C. Add from 21 to 35 days in thermal comfort. | 0.6 to 47.3 (kWh/m2-yr) saving. | [43] |
| Courtyard | Riyadh, KSA (BWh-Hot desert climate) | New house | 2-story 303.9 m (net floor area) | 2 | (S) Whole-building energy simulations; (M) energy consumption | Study how to improve a new house’s performance by adding traditional solutions. | 4.08% to 5.15% annual energy saving. | [44] | |
| Courtyard | Seville, Spain (Csa-hot-summer Mediterranean) | Three residential buildings | 3 courtyard cases: 2-fl. (9.0 × 9.0 × 8.5 m), 2-fl. (5.6 × 4.0 × 8.5 m), and 4-fl. (7.3 × 6.6 × 14.0 m). | N/A | (S) and (M) in summer months | 3 simulations per case: reference, with the shading effect, and with the measured temperatures. | −10.5 to −14.4 °C (peak time ∆T outdoor vs. courtyard). | 8–18% cooling. Energy saving. | [45] |
| Iwan | Yazd, Iran (BWh-Hot desert) Cost of Bandar Abbas, Iran (BWh-Hot desert climate, coast: hot humid) Tabriz, Iran (BSk-Cold semi-arid climate) Sari, Iran (Cfa-Humid subtropical climates) | Room (south oriented) | Rooms L × W × H (4, 4, 3 m) window-to-wall ratio 16.6% | N/A | (S) energy simulations; (M) in Yazd in July | Each room was simulated without shading devices and with four shading solutions at each location. Plus, a study of the optimum shading depth. | - | Average savings with South Iwan: Yazd 29%; Bandar Abass coast 26%; Tabriz 14%; Sari 32%. | [46] |
| Mmashrabiya | Riyadh, KSA (BWh-Hot desert climate) | New house | 2-story 303.9 m (net floor area) | 2 | (S) Whole-building energy simulations; (M) energy consumption | Study how to improve a new house’s performance by adding traditional solutions. | - | 4.40% to 5.06%. Annual energy saving. | [44] |
| Mashrabiya + mud, coral stone, and wood reinforced walls | Jeddah, KSA (BWh-Hot desert climate) | Historic building | 2 identical rooms facing west, located on the first and second floors. Rooms L × W × H (4.0 × 3.6 × 3.9) Mashrabiyas W × H (2.4 × 3.1) | ≈170 | (M) The two rooms, Mashrabiya, and the adjacent courtyard (from 4 Aug to 1 Sep) | Analyzed the effect of open and closed Mashrabiya, building thermal mass, swing temperature, air movement, and differences between indoor and courtyard temperature. | 74–77% reduction in indoor temperature swing. The temperatures at peak times were 6.8° to 8.5 °C, lower than those of the courtyard. Open mashrabiyas enhance air movement and reduce temperature by up to 2.4 °C compared to closed ones. | - | [47] |
| Mashrabiya | Riyadh, KSA (BWh-Hot desert climate) | House (1950s) | Mashrabiyas on its west and south facades. House area: 315 m2. | ≈70 | (S) Whole-building energy simulations | Simulations with and without Mashrabiya. | 14% reduction in operative temperature; 77.8% (peak solar gain reduction); | 5.7% (monthly cooling load reduction. | [48] |
| Mashrabiya + wet cloth | Jeddah, KSA (BWh-Hot desert climate) | Traditional house | 2 identical rooms facing west, located on the first and second floors. Rooms L × W × H (4.0 × 3.6 × 3.9 m) Mashrabiyas W × H (2.4 × 3.1 m) | ≈170 | (M) The two rooms, Mashrabiya, and the adjacent courtyard (from 30 Jul to 8 Aug) | Two periods (Mashrabiya closed in both rooms, open in one room). Evaporative cooling (pots, water, spray, and cloth). | −5.8 °C (lower than outdoor temp. without wet cloth). But none of the solutions were able to maintain comfort in the summer at midday. −7.8 °C (lower than outdoor temp. without wet cloth). | - | [49] |
| Shading, local materials, and natural ventilation | Bushehr, Iran (BWh-Hot desert climate) | Traditional dwellings | TB1 (367.5 m2) TB2 (432.3 m2) MB1 (215.6 m2) MB2 (106.4 m2) | N.S. | (S) Whole-building energy simulations; (M) energy, gas, and short-term weather data | Two modes: passive ventilation during moderate periods of the year, and split units for cooling during hot, humid periods. | Reduction in discomfort hours TB1 34% and TB2 12% | Cooling energy TB1 is 26% lower than MB2. TB1 is 46% lower than MB1. | [50] |
| Rowshan | Jeddah, KSA (BWh-Hot desert climate) | Single-family home | A single room was studied with six Rowshan configurations, each of them in three orientations | N/A | (S) Room energy performance and CFD | Rowshans’ potential to provide comfort and reduce energy use. Optimum size of the opening grid. | With small openings: North 15–22% (reduction in indoor air temp. from Nov. to Apr.); South and Northwest: 2–3 °C (lower than outdoor). 42.3% hours in comfort in a year. | - | [51] |
| Criteria | Regulation/Certification | Wall and Floor | Roof | Vertical Glazed Area | Horizontal Glazed Area | ||||
|---|---|---|---|---|---|---|---|---|---|
| <40% | 40–60% | >60% | ≤10% | >10% | |||||
| U-value (W/m2K) | DBC and Al Sa’fat Silver Al Sa’fat Golden and Platinum | Mandatory Voluntary | ≤0.57 ≤0.42 | ≤0.3 ≤0.3 | ≤2.1 ≤1.9 | ≤1.9 ≤1.7 | ≤1.7 ≤1.5 | ≤1.9 ≤1.9 | ≤1.9 ≤1.9 |
| Shading coefficient | DBC and Al Sa’fat Silver Al Sa’fat Golden and Platinum | Mandatory Voluntary | - - | - - | ≤0.4 ≤0.32 | ≤0.32 ≤0.25 | ≤0.25 ≤0.25 | ≤0.32 ≤0.32 | ≤0.25 ≤0.25 |
| Light transmittance | DBC and Al Sa’fat Silver Al Sa’fat Golden and Platinum | Mandatory Voluntary | - - | - - | ≥0.4 ≥0.32 | ≥0.32 ≥0.25 | ≥0.25 ≥0.25 | ≥0.32 ≥0.32 | ≥0.25 ≥0.25 |
2.3. Case Studies Solar Decathlon Middle East (SDME)
2.3.1. SDME Rules
- Dimensional limitations ensure equal sun access, defining house volume as a truncated pyramid. For SDME 2018, the base is 20 m × 20 m, the top is 10 m × 10 m, and the height is 7 m. For SDME 2021, the base is 20 m × 20 m, the top is 13.2 m × 13.2 m, and the height is 7.5 m, as shown in Figure 4.
- Other rules include the following:
- The architectural footprint should not exceed 150 m2, excluding roofless areas, with a measurable area of 45–90 m2 for single-story House 1950s and up to 110 m2 for multistory houses, with no floor over 70 m2. Minor exceptions may be approved after verifying that they do not adversely affect the neighbors and do not confer any competitive advantage.
- Comfort conditions evaluate a house’s ability to provide interior comfort by controlling temperature, humidity, daylight, indoor air quality, and acoustic performance. The most relevant passive design strategies are related to temperature, relative humidity, and lighting levels, as summarized in Table 3.
- House functioning assesses task completion for ordinary household activities such as baking, washing dishes, preparing dinner, using electronics, and laundering.
- Occupancy rules require 2–6 occupants during contests, excluding jurors and visitors. During public tours, comfort condition measurements are temporarily suspended.
2.3.2. SDME Monitored Data
3. Materials and Methods
3.1. Prescriptive-Based Assessment
3.2. Modeled-Based Energy Performance Assessment
3.2.1. Data Gathering
3.2.2. Energy Modeling
3.2.3. Parameter Variations
3.2.4. Results and Energy Performance Analysis
3.3. Monitored Performance-Based Assessment
3.3.1. Energy Consumption
3.3.2. Indoor Comfort Conditions
3.3.3. Airtightness
4. Results and Discussion
4.1. Prescriptive-Based Assessment
4.1.1. Buildings’ Geometric Parameters and Envelope Metrics
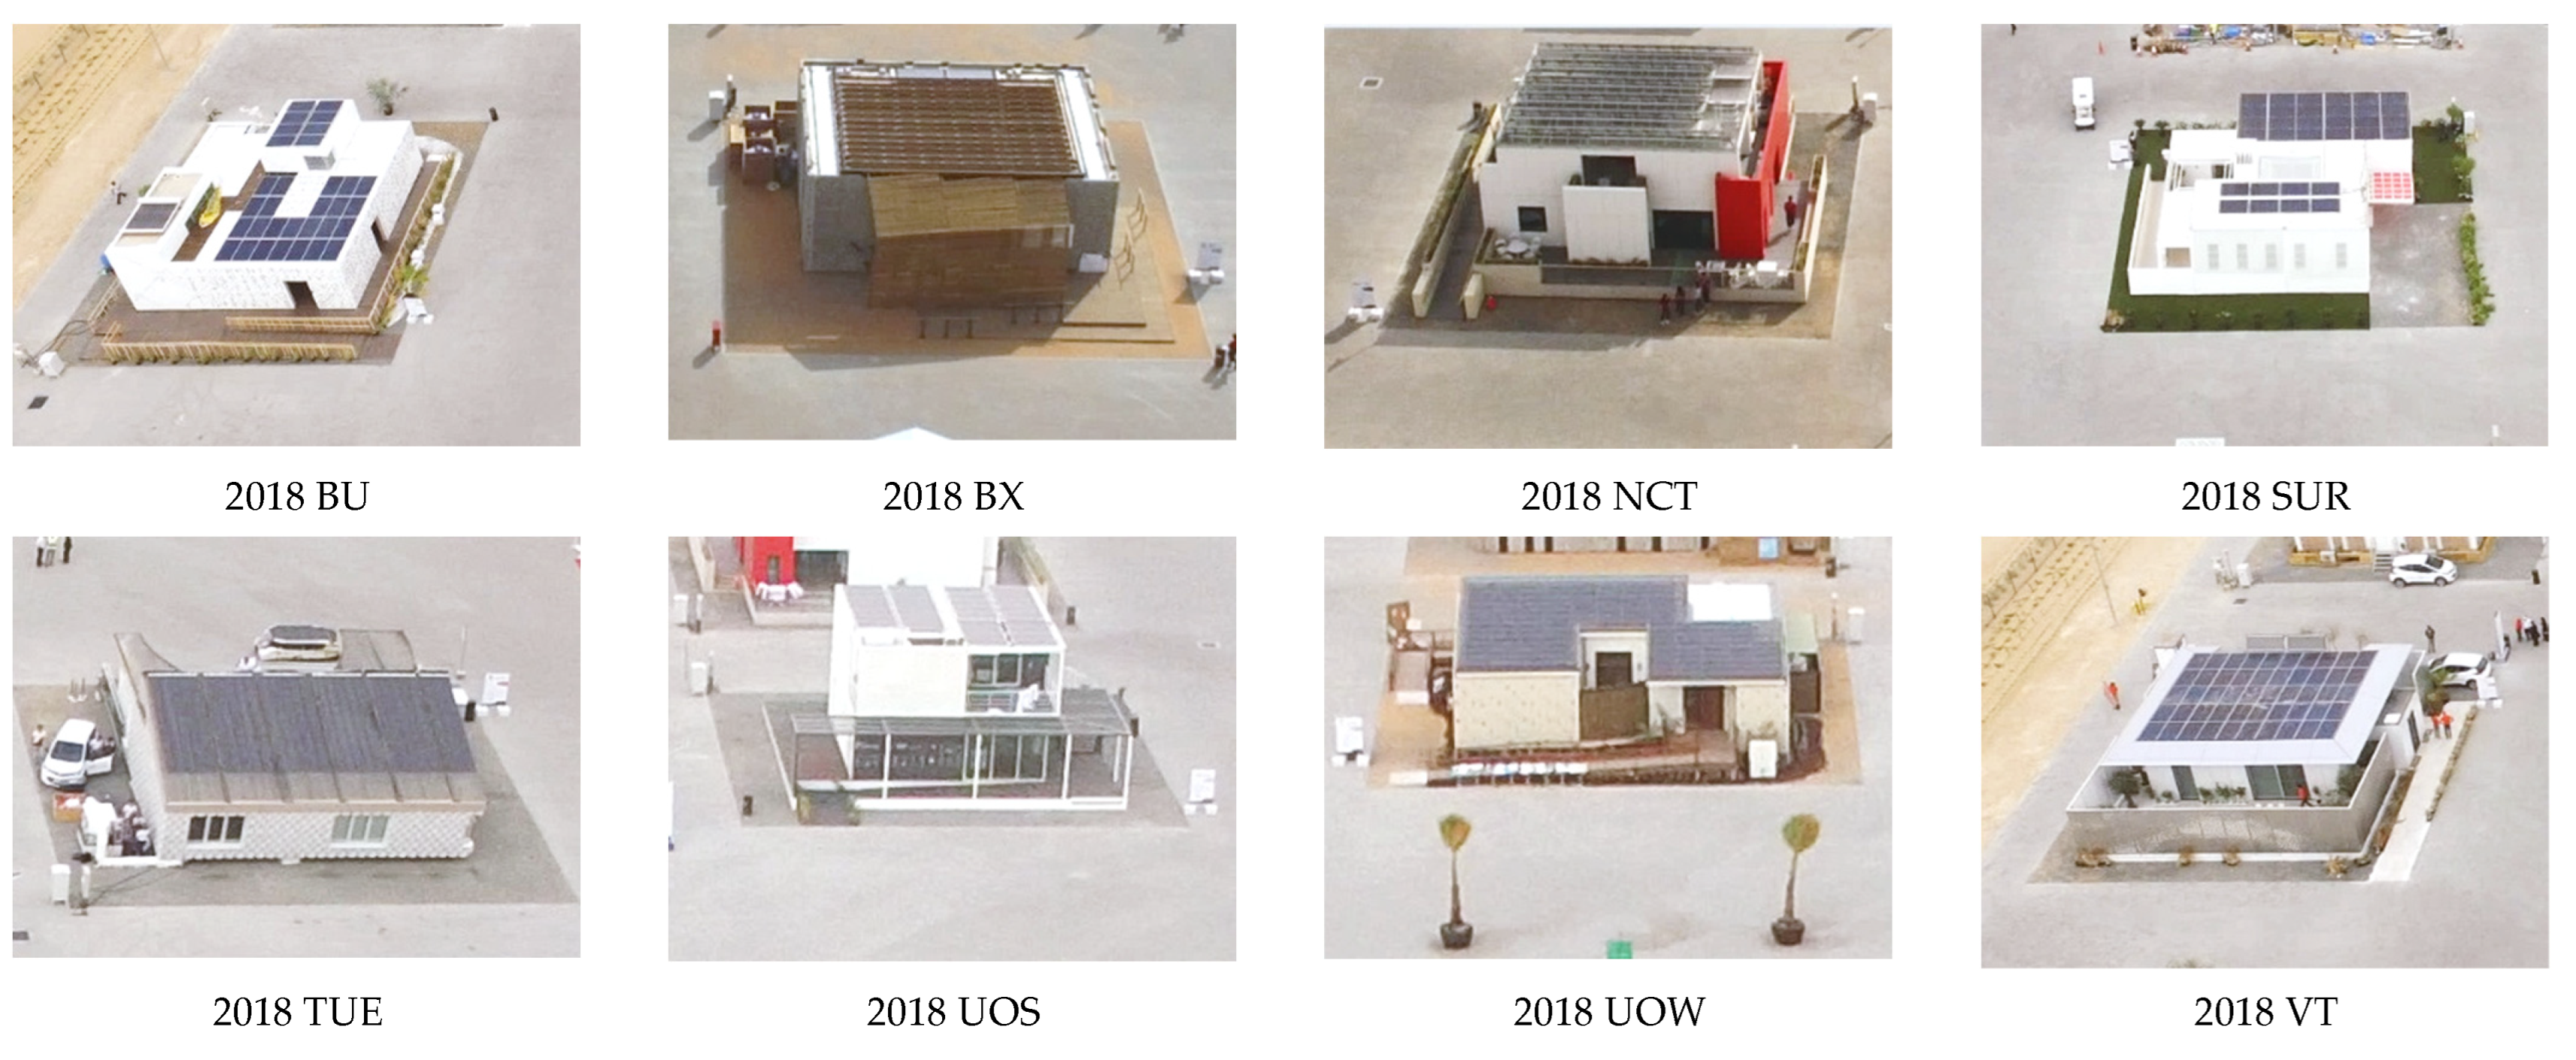
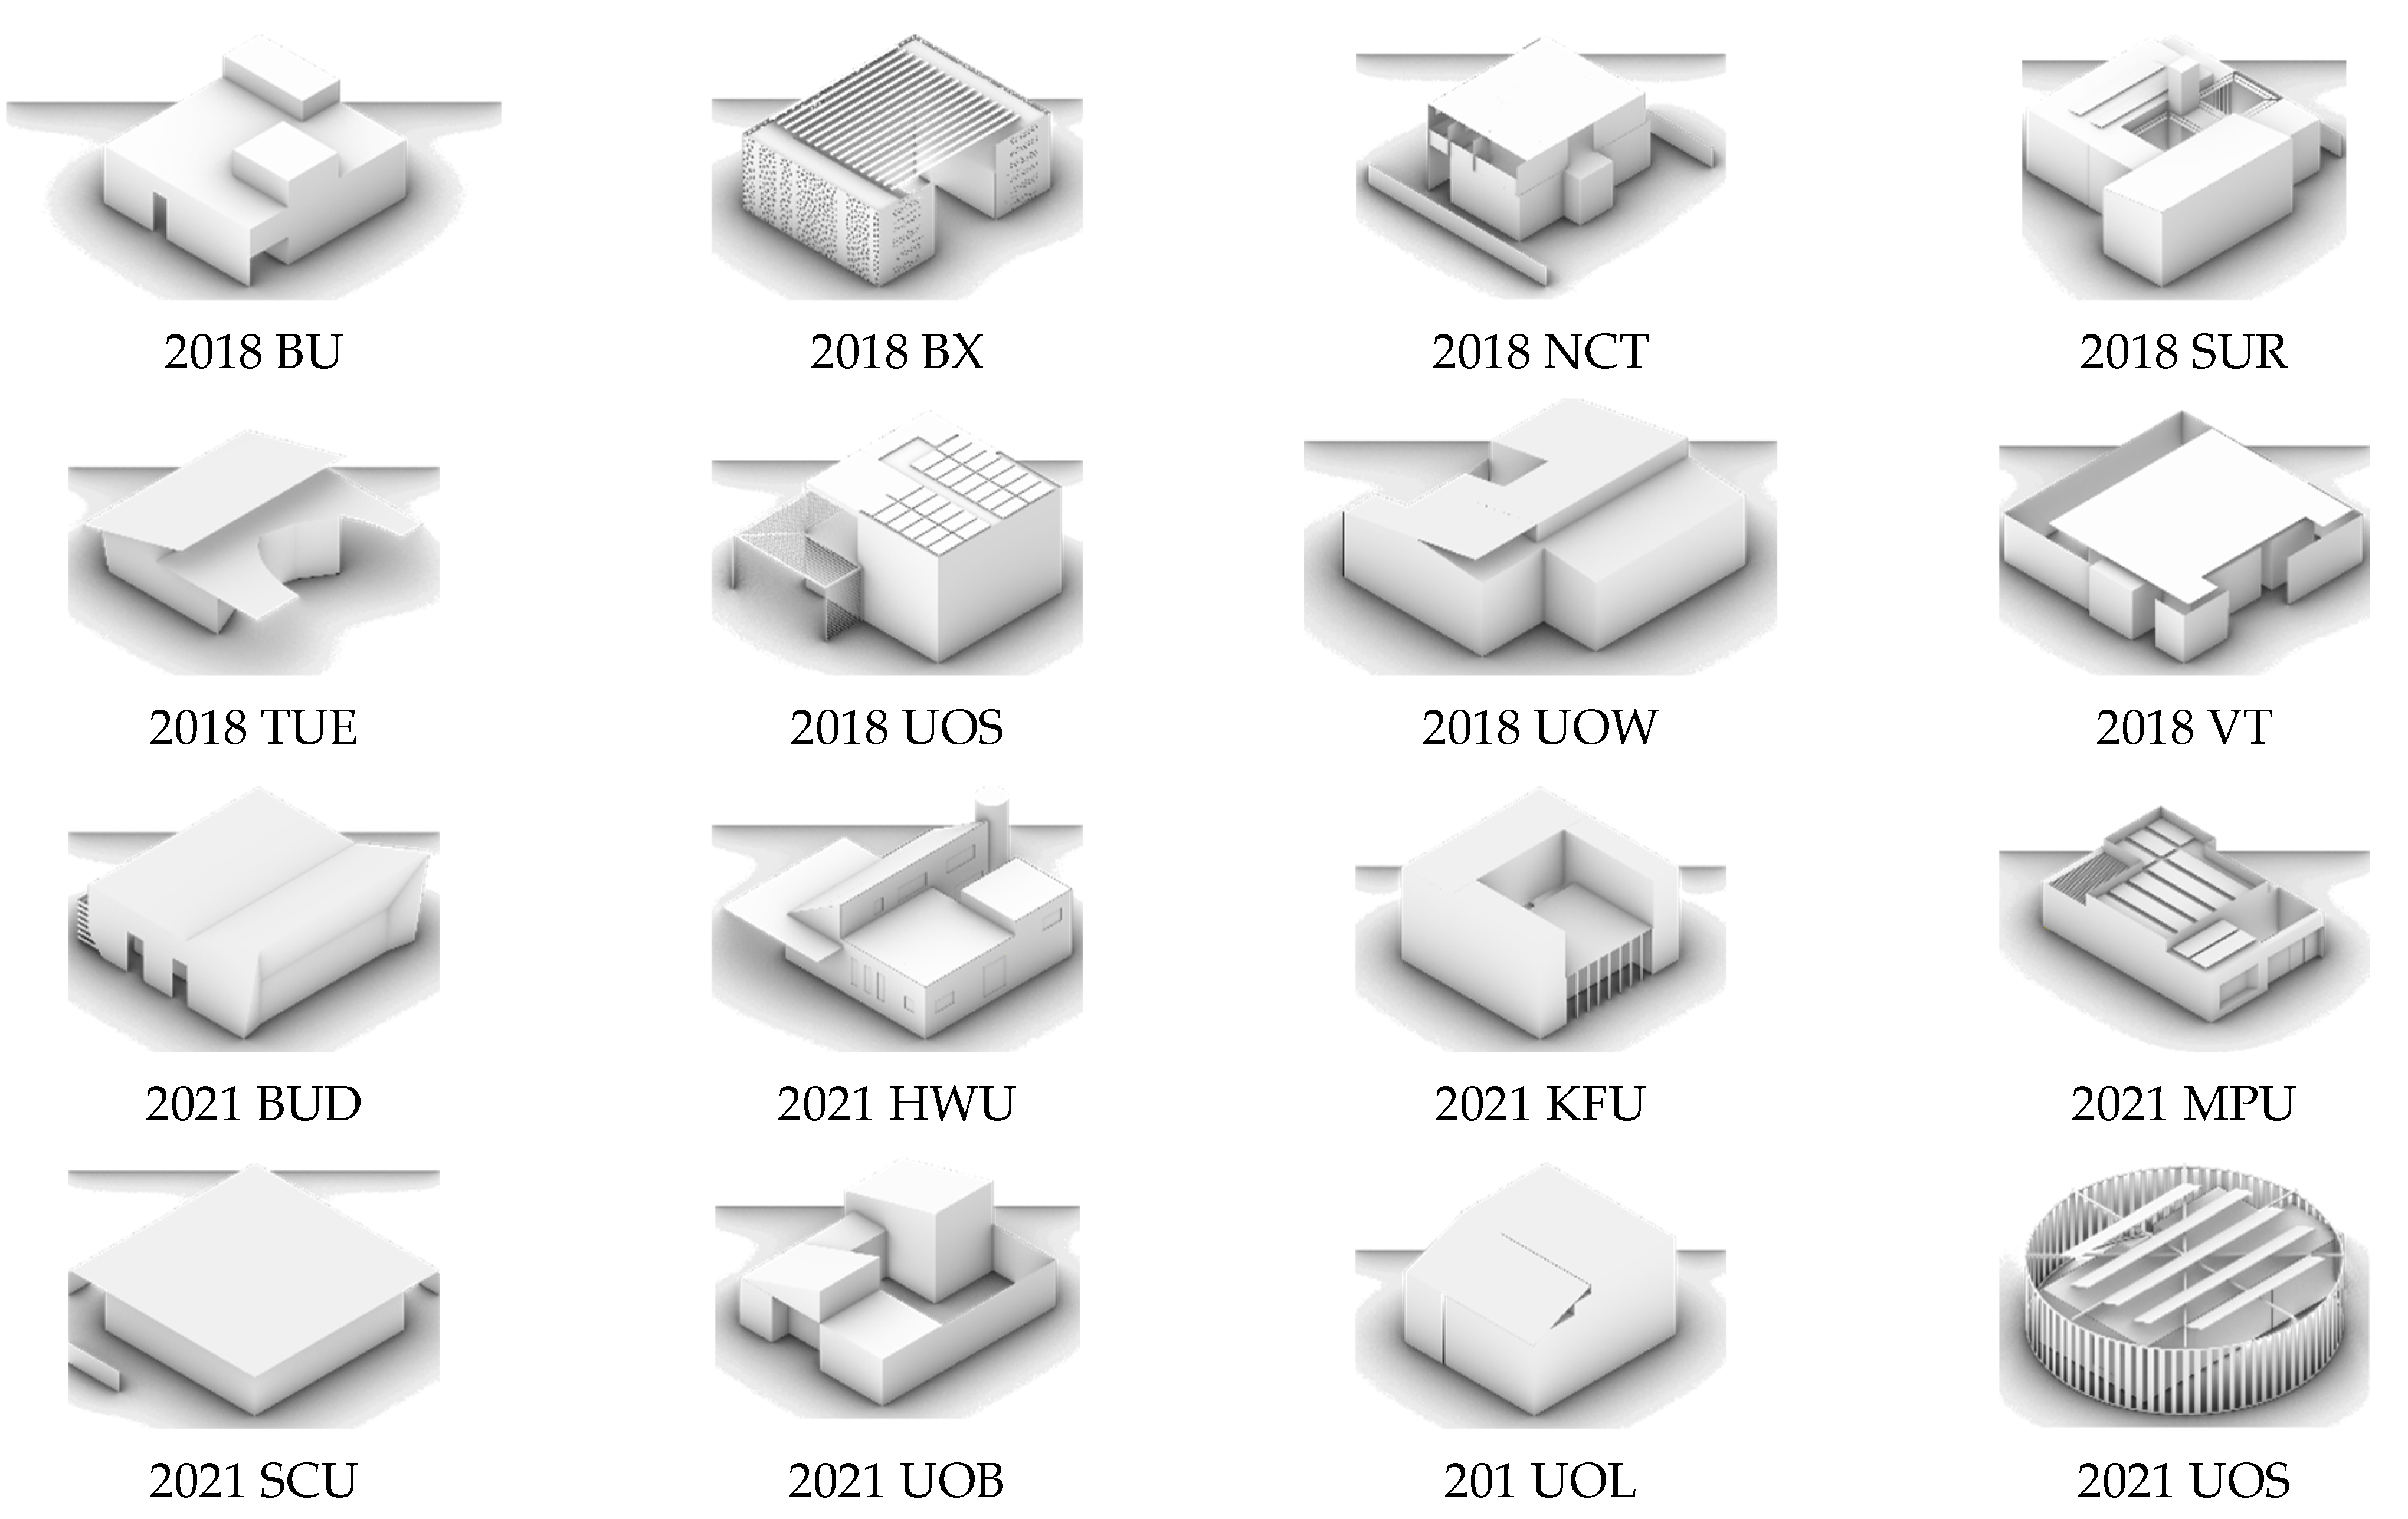
- Compactness, defined as the ratio between a building’s thermal envelope area and its volume (A/V), also known as the “surface-to-volume ratio”, significantly impacts energy efficiency in extreme climates. In this regard, among the projects studied, UOS and UOL are identified as the most efficient designs with a surface-to-volume ratio of 0.7. Both houses are characterized by a high degree of compactness, featuring floor areas comparable to those of other houses across two levels, resulting in a nearly cubic shape. The A/V ratio is used for preliminary comparisons of buildings with similar heights, but it becomes unreliable when the heights vary. Increasing the interior height increases the HVAC energy demand while lowering the A/V ratio, falsely suggesting greater compactness. Thus, it is considered insufficient to assess energy performance in such cases. Therefore, it is recommended to consider this ratio along with other ratios, such as the form factor or the relative compactness [57,58].
- Form factor, which represents the ratio of a building’s thermal envelope area to its conditioned (habitable) floor area (A/AF), is considered crucial for energy efficiency, particularly in arid desert climates where lower values are more favorable. Two-story houses UOL (2.8) and UOS (2.9) are found to have the most adequate shape factors among all the houses. The average shape factor across all projects is 3.7.
- Several projects, including BX and SUR, demonstrate design trade-offs by including shaded courtyards, but this results in “U-shaped” or “O-shaped” floor plans with reduced compactness and elevated shape factors. In contrast, apartment-style units benefit from lower shape factors due to reduced exposure to external environments. This is the case with TUE, which was designed as part of a multistory apartment complex. As an apartment, it would achieve a form factor of 2.7 or less, making it one of the most efficient geometries. The compactness and form factor ratios of the KU project are not as low as those of the other two-story projects (UOS and UOL) since this team prioritized their shading and ventilation strategies, placing most of the upper volume offset from the lower volume.
- The window-to-wall ratio (WWR) values range from a minimum of 6% (UOL) to a maximum of 27% (BUD). The average WWR value was 17%, which is considered a low value as required in extreme climates. A lower WWR can lead to better thermal efficiency in hot climates. Therefore, UOL has the lowest and most favorable ratio, whereas BUD has the highest and least favorable ratio.
- The WWR per orientation is analyzed as follows. The north-facing WWRs range from 3% (BX) to 66% (BUD), with an average of 34%. South-facing windows range from 3% (BX) to 62% (UOL), with an average of 29%. East-facing windows range from 0% (UOB) to 61% (BU), with an average of 19%. West-facing windows range from 0% (TUE) to 47% (BX), with an average of 17%. North-facing windows have the highest average WWR, which is considered advantageous in areas with latitudes similar to Dubai’s, as they increase daylight harvesting with reduced direct solar gain. South-facing windows have a moderate average, being a good daylight source, and the direct solar gains in this orientation can be effectively mitigated using small overhangs or other types of horizontal shading devices. East and west windows are shown to have the lowest averages, which is considered an ideal solution for hot climates since the solar angles in these orientations are the lowest and the hardest to block. Considering the opening orientation, houses with high WWR are advised to include adequate shading to minimize the potential of increasing the cooling loads. A low WWR in all facades, with the lowest WWR in the east and west, and adequate shading are considered essential to balance natural light, direct solar heat gain, and thermal efficiency in arid desert climates.
- The thermal transmittance values, often referred to as the U-value (W/m2K) values for walls, roofs, floors, and glazing across different SDME houses, including the overall U-value average and the Dubai Building Code (DBC) minimum requirement, are shown in Table 5. This table is color-coded to highlight the efficiency of the envelope components, with green indicating greater thermal insulation. The wall U-values range from 0.12 (BX) to 0.26 (UOB), which are 79% to 54% lower than the DBC requirement (≤0.57 W/m2K). The roof U-values range from 0.10 (VT and KU) to 0.33 (UOB), with UOB slightly exceeding the DBC benchmark of ≤0.3 W/m2K.
- Owing to the temporary nature of onsite assembly, most SDME houses feature floors elevated above ground level. The U-values of these exposed floors range from 0.14 W/m2K (VT) to 0.53 W/m2K (SCU), all of which are below the maximum limit of 0.57 W/m2K set by the code. The KU house stands out as the only two-story unit, with part of the upper floor exposed and the lower floor slab directly in contact with the ground. Its exposed floors have a U-value of 0.19 W/m2K, and the ground-contact slab includes perimeter insulation with an F-factor of 1.263 W/m·K, in accordance with ASHRAE Standard 90.1 [64], and the DBC, which requires one meter of insulation around the perimeter of the ground slabs in contact with the ground [37].
- The U-values range from 0.33 (VT) to 1.67 (UOS), all of which comply with the DBC benchmark of ≤2.1 W/m2K. All the houses are found to exceed the DBC requirements for envelope thermal transmittance, except for UOB, whose value is close to the maximum roof requirements. Therefore, the thermal losses are minimized in all the houses, especially in VT, BU, and BX. Overall, the data emphasize the importance of optimizing the compactness, shape factor, and window-to-wall ratios to improve the thermal efficiency and energy performance of buildings. These metrics serve as benchmarks for identifying areas where specific houses excel or need further enhancement.
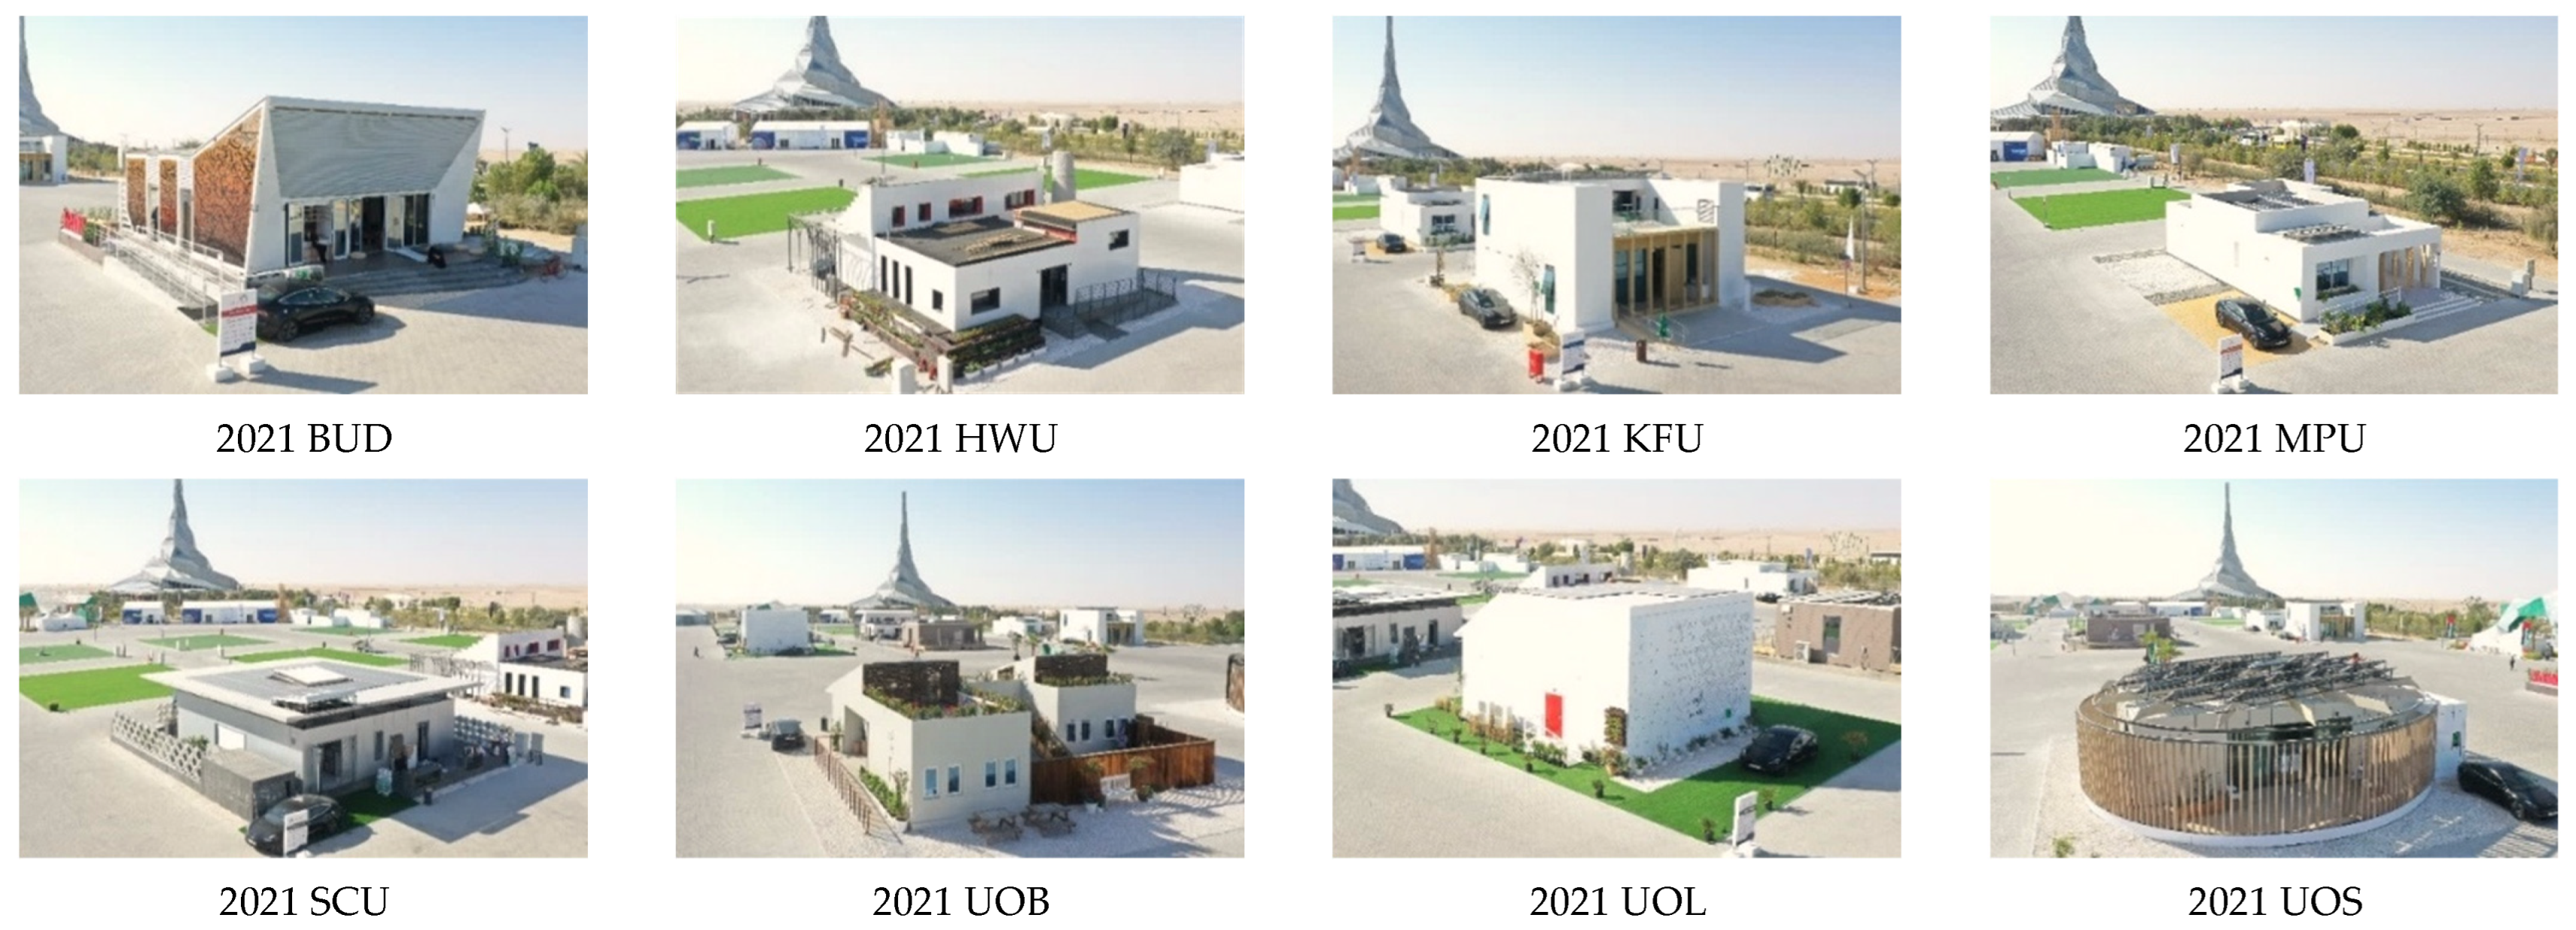
- The shading elements adopted by the SDME houses vary in shape, form, size, and orientation. Several houses, including 2021 BUD, HWU, KFU, MPU, SCU, and UOB, opted for horizontal shading on the southern façades due to the high radiation in Dubai. For example, the 2021 SCU designed shading to cover the entire southern façade throughout peak summer days, whereas the KFU used an upper volume shift to create a shaded courtyard. Other shading configurations included the 2021 UOS, which shaded the entire courtyard with vertical fencing, and the 2021 BUD, which used a double-shell façade for wind circulation and shading. The 2021 MPU project implemented a unique solution inspired by traditional Islamic architecture, using a mashrabiya, a type of oriel window enclosed in carved wooden panels [33].
4.1.2. Distinctive Passive Design Elements from Traditional Techniques and Modern Innovations
- A double shell system, inspired by the Barjeel (traditional wind tower), is featured in the BUD house, providing extra insulation and reducing heat gain. Similarly, a roof-based system is used in the SCU house to enhance natural ventilation. A traditional wind tower is incorporated into the HWU house to direct cooler air into its courtyard, creating a natural cooling effect. The Green Moss Wall, included in the BUD house, increases its insulation level and improves its air quality by filtering pollutants.
- Advanced window technologies are employed in several houses. Double-row windows are used in the HWU house to reduce thermal bridging, whereas interior windows are integrated into the KFU for wall shading and natural cooling. Mashrabia, a traditional carved wooden panel, is adapted by the MPU to allow air circulation while providing shade. Vacuum windows, which provide superior insulation, are used by the MPU and UOS, whereas building-integrated PV windows are featured in the VT house.
- Ventilation strategies, skylight, and ventilated façades are applied in the SCU house to enable free cooling, daylighting, and minimize thermal gains through the walls. The UOB and HWU utilize hollow spaces under the house for cooling via air circulation. BUD, SCU, and UOS use movable interior partitions to offer flexible space arrangements and, in the case of UOS, provide acoustic insulation. The UOS and SCU employ ventilated façades to improve airflow and cooling.
- Shaded courtyards are incorporated into several houses. An inner courtyard, covered with a skylight, is featured in the SCU, which is designed to function as either an open or enclosed space.
- Phase Change Materials (PCM) are used in the HWU house to regulate indoor temperatures, whereas volumes for thermal inertia are strategically placed in the KFU house design to act as buffers and provide self-shading.
4.2. Modeled Performance-Based Assessment
4.2.1. Geometric Parameters Combined
4.2.2. Thermal Transmittance
4.2.3. Shading Elements
4.3. Monitored Performance-Based Assessment
4.3.1. Indoor Comfort Conditions
4.3.2. Airtightness
4.3.3. Electricity Consumption
5. Conclusions
6. Limitations and Future Research Work
Author Contributions
Funding
Data Availability Statement
Acknowledgments
Conflicts of Interest
Abbreviations and Symbols
| 3D | Three-Dimensional |
| ACH | Air Changes per Hour |
| A/AF | Area-to-Airflow Ratio |
| A/V | Surface Area-to-Volume Ratio |
| BEM | Building Energy Modeling |
| COP | Coefficient of Performance |
| DBC | Dubai Building Code |
| DEWA | Dubai Electricity and Water Authority |
| GCC | Gulf Cooperation Council |
| HVAC | Heating, Ventilation, and Air Conditioning |
| PCM | Phase Change Material |
| SDME | Solar Decathlon Middle East |
| SHGC | Solar Heat Gain Coefficient |
| SR | Shading Ratio (%) |
| U-value | Thermal Transmittance (W/m2K) |
| UAE | United Arab Emirates |
| Vt | Visible Transmittance |
| WWR | Window-to-Wall Ratio (%) |
Appendix A
| # | SDME | Abbrev. | Team Name | Universities |
|---|---|---|---|---|
| 1 | 2018 | BU | EFdeN | Ion Mincu University of Architecture and Urbanism, Romania; University Politehnica of Bucharest, Romania; Technical University of Civil Engineering Bucharest, Romania; and Birla Institute of Technology and Science Pilani Dubai Campus, UAE. |
| 2 | 2018 | BX | BaityKool | University of Bordeaux, France; Amity University, UAE; and An-Najah National University of Palestine. |
| 3 | 2018 | NCT | TDIS | National Chiao Tung University, Taiwan. |
| 4 | 2018 | SUR | Sapienza | Sapienza University of Rome, Italy. |
| 5 | 2018 | TUE | VIRTUe | Eindhoven University of Technology, The Netherlands. |
| 6 | 2018 | UOS | Know-Howse | University of Sharjah, UAE; and University of Ferrara, Italy. |
| 7 | 2018 | UOW | UOW | University of Wollongong-Australia, Australia; and University of Wollongong Dubai, UAE. |
| 8 | 2018 | VT | FutureHAUS | Virginia Tech University, USA. |
| 9 | 2021 | HWU | ESTEEM | Heriot Watt University, UK and UAE. |
| 10 | 2021 | KFU | KU | Khalifa University, UAE. |
| 11 | 2021 | MPU | TAWAZUN | Manipal Academy of Higher Education, UAE. |
| 12 | 2021 | SCU | SCUT | South China University of Technology, China. |
| 13 | 2021 | BUD | HARMONY | The British University in Dubai, UAE. |
| 14 | 2021 | UOB | Go Smart | University of Bahrain, Bahrain. |
| 15 | 2021 | UOS | Sharjah | University Of Sharjah, UAE. |
| 16 | 2021 | UOL | Desert Phoenix | University of Louisville, USA. American University in Dubai, UAE. American University in Sharjah, UAE. Higher Colleges of Technology, UAE. |
| Parameter | Value Unit | Description |
|---|---|---|
| Building Program | Midrise Apartment | |
| People | default 0.028 [people/m2] | Object that describes the occupancy of the program. |
| Lighting | default 6.5 [W/m2] | Object that describes the lighting usage of the program. |
| Electric Equipment | default 6.7 [W/m2] | Object that describes the electric usage within the program. |
| Gas Equipment | N/A | Object that describes the gas equipment usage within the program. |
| Service Hot Water | default 0.15 [L/h-m2] | Object that describes the service hot water of the program. |
| Infiltration | default 0.00057 [m3/m2 of façade] | Object that describes the outdoor air leakage of the program. |
| Ventilation | default 0.35 [ACH] | Object that describes the outdoor air requirement of the program. |
| Cooling Setpoint | customized 24 °C | Object that describes the cooling setpoint temperature of the program. |
| Heating Setpoint | customized 0 °C | Object that describes the heating setpoint temperature of the program. |
| Opaque Elements | ||
| R-value | customized [m2-K/W] | Thermal resistance of material. |
| Roughness | default “medium rough” | Very rough; rough; medium rough; medium smooth; smooth; very smooth. |
| Thermal Absorption | default 0.9 | A number between 0 and 1 for the fraction of incident long-wavelength radiation that is absorbed by the material. |
| Solar Absorption | default 0.7 | A number between 0 and 1 for the fraction of incident solar radiation that is absorbed by the material. |
| Visual Absorption | default 0.7 | A number between 0 and 1 for the fraction of incident visible wavelength radiation that is absorbed by the material. |
| Transparent Elements | ||
| U-factor | customized [W/m2K] | Thermal transmittance of the glazing system. |
| SHGC | customized | Value 0–1, heat gain coefficient of the glazing system. Includes both directly transmitted heat as well as solar heat that is absorbed by the glazing system and conducted toward the interior. |
| Tvis | default 0.6/customized | Value 0–1, visual transmittance of the glazing system. |
References
- United Arab Emirates Government. UAE Net Zero 2050. Available online: https://u.ae/en/more/uae-net-zero-2050 (accessed on 4 July 2025).
- Dubai Electricity and Water Authority. DEWA Supports Net-Zero by 2050 Through Pioneering Projects and Initiatives. Available online: https://www.dewa.gov.ae/en/about-us/media-publications/latest-news/2024/05/dewa-supports-netzero (accessed on 4 July 2025).
- Aldogom, D.; Aburaed, N.; Al-Saad, M.; Al Mansoori, S.; Al Shamsi, M.R.; Al Maazmi, A.A. Multi Temporal Satellite Images for Growth Detection and Urban Sprawl Analysis; Dubai City, UAE. In Proceedings of the Remote Sensing Technologies and Applications in Urban Environments IV, Strasbourg, France, 9–12 September 2019; International Society for Optics and Photonics: Bellingham, WA, USA, 2019; Volume 11157, p. 111570C. [Google Scholar]
- Destek, M.A. Investigating the Impact of Financial Development on Energy Consumption in GCC Countries. In Proceedings of the 4th International Conference on Economics, Business Management and Social Sciences, Budapest, Hungary, 4–8 September 2019; p. 87. [Google Scholar]
- D’Agostino, D.; Mazzarella, L. What Is a Nearly Zero Energy Building? Overview, Implementation and Comparison of Definitions. J. Build. Eng. 2019, 21, 200–212. [Google Scholar] [CrossRef]
- Torcellini, P.; Pless, S.; Deru, M.; Crawley, D. Zero Energy Buildings: A Critical Look at the Definition; National Renewable Energy Lab. (NREL): Golden, CO, USA, 2006. [Google Scholar]
- Rodriguez-Ubinas, E.; Montero, C.; Porteros, M.; Vega, S.; Navarro, I.; Castillo-Cagigal, M.; Matallanas, E.; Gutiérrez, A. Passive Design Strategies and Performance of Net Energy Plus Houses. Energy Build. 2014, 83, 10–22. [Google Scholar] [CrossRef]
- Hu, M.; Zhang, K.; Nguyen, Q.; Tasdizen, T. The Effects of Passive Design on Indoor Thermal Comfort and Energy Savings for Residential Buildings in Hot Climates: A Systematic Review. Urban Clim. 2023, 49, 101466. [Google Scholar] [CrossRef]
- Solar Decathlon Middle East Organizers. SDME Expo Edition: Rules and Building Code; Dubai Electricity and Water Authority: Dubai, United Arab Emirates, 2021. [Google Scholar]
- Jeong, N.-Y.; Lee, J. Thermal Performance Evaluation of Passive Design Techniques for Green Buildings in Temperate Climates. J. Green Build. 2023, 18, 191–218. [Google Scholar] [CrossRef]
- Bhamare, D.K.; Rathod, M.K.; Banerjee, J. Passive Cooling Techniques for Building and Their Applicability in Different Climatic Zones—The State of Art. Energy Build 2019, 198, 467–490. [Google Scholar] [CrossRef]
- Santamouris, M.; Kolokotsa, D. Passive Cooling Dissipation Techniques for Buildings and Other Structures: The State of the Art. Energy Build. 2013, 57, 74–94. [Google Scholar] [CrossRef]
- Verbeke, S.; Audenaert, A. Thermal Inertia in Buildings: A Review of Impacts across Climate and Building Use. Renew. Sustain. Energy Rev. 2018, 82, 2300–2318. [Google Scholar] [CrossRef]
- Samuel, D.G.L.; Dharmasastha, K.; Nagendra, S.M.S.; Maiya, M.P. Thermal Comfort in Traditional Buildings Composed of Local and Modern Construction Materials. Int. J. Sustain. Built Environ. 2017, 6, 463–475. [Google Scholar] [CrossRef]
- Al-Badi, A.H.; Al-Saadi, S.N. Toward Energy-Efficient Buildings in Oman. Int. J. Sustain. Energy 2020, 39, 412–433. [Google Scholar] [CrossRef]
- Caliano, M.; Bianco, N.; Graditi, G.; Mongibello, L. Numerical Analysis of Cold Thermal Energy Storage Systems Using Macro-Encapsulated Phase Change Materials (PCM) in Residential Cooling Applications. J. Energy Storage 2025, 125, 117043. [Google Scholar] [CrossRef]
- Aili, A.; Jiang, T.; Chen, J.; Wen, Y.; Yang, R.; Yin, X.; Tan, G. Passive Daytime Radiative Cooling: Moving beyond Materials towards Real-World Applications. Next Energy 2024, 3, 100121. [Google Scholar] [CrossRef]
- BS EN ISO 52003-1:2017; Energy Performance of Buildings—Indicators, Requirements, Ratings and Certificates—General Aspects and Application to the Overall Energy Performance. British Standards Institution: London, UK, 2017.
- Hasan, S.A. The Impact of Residential Building’s Design on the Energy Consumption in Hot Desert Climate (Baghdad City as an Example). J. Urban Environ. Eng. 2018, 12, 88–92. [Google Scholar] [CrossRef]
- Al-Saadi, S.N.J.; Al-Jabri, K.S. Energy-Efficient Envelope Design for Residential Buildings: A Case Study in Oman. In Proceedings of the 2017 Smart City Symposium Prague (SCSP), Prague, Czech Republic, 25–26 May 2017; IEEE: Piscataway, NJ, USA, 2017; pp. 1–8. [Google Scholar]
- Radhi, H. Evaluating the Potential Impact of Global Warming on the UAE Residential Buildings—A Contribution to Reduce the CO2 Emissions. Build. Environ. 2009, 44, 2451–2462. [Google Scholar] [CrossRef]
- Fereidani, N.A.; Rodrigues, E.; Gaspar, A.R. A Review of the Energy Implications of Passive Building Design and Active Measures under Climate Change in the Middle East. J. Clean. Prod. 2021, 305, 127152. [Google Scholar] [CrossRef]
- Alhawari, A.; Mukhopadhyaya, P. Mitigating Balcony Thermal Bridging: Experimental and Numerical Investigation of Innovative Solutions for Energy-Efficient Building Envelopes. Energy Build. 2025, 328, 115152. [Google Scholar] [CrossRef]
- Kotti, S.; Teli, D.; James, P.A.B. Quantifying Thermal Bridge Effects and Assessing Retrofit Solutions in a Greek Residential Building. Procedia Environ. Sci. 2017, 38, 306–313. [Google Scholar] [CrossRef]
- Prignon, M.; Van Moeseke, G. Factors Influencing Airtightness and Airtightness Predictive Models: A Literature Review. Energy Build. 2017, 146, 87–97. [Google Scholar] [CrossRef]
- Kharseh, M.; Al-Khawaja, M. Retrofitting Measures for Reducing Buildings Cooling Requirements in Cooling-Dominated Environment: Residential House. Appl. Therm. Eng. 2016, 98, 352–356. [Google Scholar] [CrossRef]
- Algarni, S. Potential for Cooling Load Reduction in Residential Buildings Using Cool Roofs in the Harsh Climate of Saudi Arabia. Energy Environ. 2019, 30, 235–253. [Google Scholar] [CrossRef]
- Jia, S.; Weng, Q.; Yoo, C.; Xiao, H.; Zhong, Q. Building Energy Savings by Green Roofs and Cool Roofs in Current and Future Climates. npj Urban Sustain. 2024, 4, 1–13. [Google Scholar] [CrossRef]
- Fereidoni, S.; Fereidooni, L.; Tamjid Shabestari, S.; Esmaeili, M.S.; Zare, M.; Kasaeian, A. Application of Solar Chimneys and Hybrid Solar Chimneys for Ventilation in Buildings: A Review. Sol. Energy 2025, 288, 113246. [Google Scholar] [CrossRef]
- ASHRAE Climatic Design Conditions—2021 ASHRAE Handbook—Foundamentals (SI). Available online: https://ashrae-meteo.info/v2.0/ (accessed on 16 June 2025).
- Mahgoub, Y. Sustainable Architecture in the United Arab Emirates: Past and Present. In Proceedings of the CAA-IIA International Conference on Urbanisation and Housing, Goa, India, 2–5 October 1997; pp. 2–5. [Google Scholar]
- El Amrousi, M.; Elhakeem, M.; Caratelli, P. Reinterpreting Tradition; Hybridization and Vernacular Expression in Emirati Housing. In Proceedings of the IOP Conference Series: Materials Science and Engineering; IOP Publishing: Bristol, UK, 2019; Volume 603, p. 52045. [Google Scholar]
- Ashour, A.F. Islamic Architectural Heritage: Mashrabiya. WIT Trans. Built Environ. 2018, 177, 245–253. [Google Scholar] [CrossRef]
- Babsail, M.O.; Al-Qawasmi, J. Vernacular Architecture in Saudi Arabia: Revival of Displaced Traditions. In Vernacular architecture: Towards a Sustainable Future, Proceedings of the International Conference on Vernacular Heritage, Sustainability and Earthen Architecture, Valencia, Spain, 11–13 September 2014; Routledge: London, UK; pp. 11–13.
- Aguilar-Sanchez, M.; Almodovar-Melendo, J.M.; Cabeza-Lainez, J. Thermal Performance Assessment of Burkina Faso’s Housing Typologies. Buildings 2023, 13, 2719. [Google Scholar] [CrossRef]
- Dubai Municipality. Al Sa’fat—Dubai Green Building System, 2nd ed.; Dubai Government: Dubai, United Arab Emirates, 2023. [Google Scholar]
- Dubai Municipality. Dubai Building Code; Dubai Government: Dubai, United Arab Emirates, 2021. [Google Scholar]
- TAQATI 2019 Annual Report Demand Side Management Strategy; Dubai Supreme Council of Energy: Dubai, United Arab Emirates, 2020.
- Chohan, A.H.; Awad, J.; Elkahlout, Y.; Abuarkub, M. Evaluating Windcatchers in UAE Heritage Architecture: A Pathway to Zero-Energy Cooling Solutions. Ain Shams Eng. J. 2024, 15, 102936. [Google Scholar] [CrossRef]
- Kahkzand, M.; Deljouiee, B.; Chahardoli, S.; Siavashi, M. Radiative Cooling Ventilation Improvement Using an Integrated System of Windcatcher and Solar Chimney. J. Build. Eng. 2024, 83, 108409. [Google Scholar] [CrossRef]
- Kassir, R.M. Passive Downdraught Evaporative Cooling Wind-Towers: A Case Study Using Simulation with Field-Corroborated Results. Build. Serv. Eng. Res. Technol. 2016, 37, 103–120. [Google Scholar] [CrossRef]
- Mousli, K.; Semprini, G. Passive Systems in Traditional Houses in Middle East Areas: Solutions and Effects of Natural Ventilation. In Proceedings of the 10th International Conference IAQVEC 2019: Indoor Air Quality, Ventilation and Energy Conservation in Buildings, Bari, Italy, 5–7 September 2019; Institute of Physics Publishing: Bristol, UK, 2019; Volume 609, p. 032056. [Google Scholar]
- Cho, S.; Mohammadzadeh, N. Thermal Comfort Analysis of a Traditional Iranian Courtyard for the Design of Sustainable Residential Buildings. In Proceedings of the 13th Conference of International Building Performance Simulation Association, Chambéry, France, 26–28 August 2013. [Google Scholar]
- ALshabanat, A.; Omer, S. The Potential of Green Engineering Solutions for Energy Conservation in Residential Buildings Towards Sustainability: A Case Study of Saudi Arabia. Architecture 2023, 3, 713–738. [Google Scholar] [CrossRef]
- Diz-Mellado, E.; Ruiz-Pardo, Á.; Rivera-Gómez, C.; Sanchez de la Flor, F.J.; Galán-Marín, C. Unravelling the Impact of Courtyard Geometry on Cooling Energy Consumption in Buildings. Build Environ. 2023, 237, 110349. [Google Scholar] [CrossRef]
- Eskandari, H.; Saedvandi, M.; Mahdavinejad, M. The Impact of Iwan as a Traditional Shading Device on the Building Energy Consumption. Buildings 2017, 8, 3. [Google Scholar] [CrossRef]
- Bagasi, A.A.; Calautit, J.K.; Karban, A.S. Evaluation of the Integration of the Traditional Architectural Element Mashrabiya into the Ventilation Strategy for Buildings in Hot Climates. Energies 2021, 14, 530. [Google Scholar] [CrossRef]
- Taki, A.; Kumari, H. Examining Mashrabiya’s Impact on Energy Efficiency and Cultural Aspects in Saudi Arabia. Sustainability 2023, 15, 10131. [Google Scholar] [CrossRef]
- Bagasi, A.A.; Calautit, J.K. Experimental Field Study of the Integration of Passive and Evaporative Cooling Techniques with Mashrabiya in Hot Climates. Energy Build. 2020, 225, 110325. [Google Scholar] [CrossRef]
- Mohammadi, A.; Saghafi, M.R.; Tahbaz, M.; Nasrollahi, F. The Study of Climate-Responsive Solutions in Traditional Dwellings of Bushehr City in Southern Iran. J. Build. Eng. 2018, 16, 169–183. [Google Scholar] [CrossRef]
- Mezaien, A.A.; Baltazar, J.C. Potential Regenerative Impact of Implementation of Cultural Vernacular Elements (Rowshan) in Jeddah, Saudi Arabia. Energies 2024, 17, 1995. [Google Scholar] [CrossRef]
- Qureshi, O.A.; Trepci, E.; Shahzad, A.A.; Manandhar, P.; Rodriguez-Ubinas, E. Quantitative Assessment of the HVAC System of Zero-Energy Houses of the Solar Decathlon Middle East 2021. Energy Rep. 2023, 9, 1050–1060. [Google Scholar] [CrossRef]
- Alhammadi, N.; Alantali, M.; Rodriguez-Ubinas, E. Crystalline Silicon Solar PV Integration in Residential Buildings: Case Studies From Solar Decathlon Middle East. In Proceedings of the 2023 Middle East and North Africa Solar Conference (MENA-SC), Dubai, United Arab Emirates, 15–18 November 2023; IEEE: Piscataway, NJ, USA; pp. 1–5. [Google Scholar]
- Polo, C.; Frontini, F.; Rodriguez-Ubinas, E. A Jury Experience in Solar Decathlon Middle East (SDME 2021) Contest. In Proceedings of the WCPEC-8 Proceedings, Milan, Italy, 26–30 September 2022; pp. 1190–1197. [Google Scholar]
- Trepci, E.; Rodriguez-Ubinas, E.; Alshikh, Z.; Sgouridis, S. Passive Design Strategies for Zero Energy Houses in Desert Environments: The Case of Solar Decathlon Middle East 2021; WIT Press: Billerica, MA, USA, 2019. [Google Scholar]
- Trepci, E.; Rodriguez, E.U.; Barbosa, J.D. Quantitative Assessment of Passive Design Measures on Building Energy Demand in Arid Climates. Case Study: Solar Decathlon Middle East Houses, Dubai. In Proceedings of the E3S Web of Conferences, Les Mureaux, France, 21–22 November 2024; EDP Sciences: Les Ulis Cedex A, France, 2024; Volume 546. [Google Scholar]
- Tuhus-Dubrow, D.; Krarti, M. Genetic-Algorithm Based Approach to Optimize Building Envelope Design for Residential Buildings. Build. Environ. 2010, 45, 1574–1581. [Google Scholar] [CrossRef]
- AlAnzi, A.; Seo, D.; Krarti, M. Impact of Building Shape on Thermal Performance of Office Buildings in Kuwait. Energy Convers. Manag. 2009, 50, 822–828. [Google Scholar] [CrossRef]
- Toutou, A.; Fikry, M.; Mohamed, W. The Parametric Based Optimization Framework Daylighting and Energy Performance in Residential Buildings in Hot Arid Zone. Alex. Eng. J. 2018, 57, 3595–3608. [Google Scholar] [CrossRef]
- Hoseinzadeh, P.; Khalaji Assadi, M.; Heidari, S.; Khalatbari, M.; Saidur, R.; Nejad, K.H.; Sangin, H. Energy Performance of Building Integrated Photovoltaic High-Rise Building: Case Study, Tehran, Iran. Energy Build. 2021, 235, 110707. [Google Scholar] [CrossRef]
- Peres Suzano e Silva, A.C.; Flora Calili, R. New Building Simulation Method to Measure the Impact of Window-Integrated Organic Photovoltaic Cells on Energy Demand. Energy Build. 2021, 252, 111490. [Google Scholar] [CrossRef]
- Lotfinejad, P.; Tarkashvand, A.; Sanaieian, H. A Computational Approach for Integration of Greenhouse and ‘Shanashir’ to Enhance Thermal Comfort of Occupants, Utilizing NSGA-II Algorithm. Build. Environ. 2025, 273, 112717. [Google Scholar] [CrossRef]
- ASTM E779-16; Test Method for Determining Air Leakage Rate by Fan Pressurization. ASTM International: West Conshohocken, PA, USA, 2019.
- ANSI/ASHRAE/IESNA 90.1-2007; Energy Standard for Buildings Except Low-Rise Residential Buildings. ASHRAE: Atlanta, GA, USA, 2007.
- Al-Tamimi, N. Passive Design Strategies for Energy Efficient Buildings in the Arabian Desert. Front. Built. Environ. 2022, 7, 805603. [Google Scholar] [CrossRef]





| Temperature | Relative Humidity | Air CO2 Content | Lighting Level | Façade Airborne Sound Insulation | HVAC Acoustic Values | |
|---|---|---|---|---|---|---|
| Full points | 23 °C ≤ T ≤ 25 °C | 35% < RH < 60% | CO2 < 800 ppm | LL > 300 lx | SI > 42 dB | AV < 25 dB |
| No points | 27 °C ≤ T ≤ 21 °C | 70%< RH < 25% | CO2 > 1200 ppm | LL < 100 lx | SI < 30 dB | AV > 35 dB |
| BU | BX | NCT | SUR | TUE 4 | UOS | UOW | VT | BUD | HWU | KFU | MPU | SCU 5 | UOB | UOL | UOS | Mean | |
|---|---|---|---|---|---|---|---|---|---|---|---|---|---|---|---|---|---|
| Num of Floors | 1 | 1 | 2 | 1 | 1 | 2 | 1 | 1 | 1 | 1 | 2 | 1 | 1 | 1 | 2 | 1 | - |
| Floor Area [m2] | 92.6 | 98.7 | 70.3 | 103.2 | 73 | 93.9 | 125.5 | 91.2 | 95.1 | 117.6 | 132.5 | 100.6 | 138.6 | 100.5 | 141.2 | 99.8 | 116 |
| Compactness 1 | 0.8 | 1.4 | 1.4 | 1.2 | 1.0 | 0.7 | 0.9 | 1.0 | 0.9 | 1.1 | 1.2 | 1.1 | 1.0 | 1.0 | 0.7 | 0.9 | 1.0 |
| Form Factor 2 | 3.9 | 4.7 | 4.1 | 4.0 | 4.1 | 2.9 | 3.5 | 3.4 | 3.4 | 4.0 | 4.0 | 3.8 | 3.7 | 3.5 | 2.8 | 3.3 | 3.7 |
| WW Ratio | 13% | 14% | 21% | 12% | 11% | 16% | 12% | 11% | 27% | 12% | 18% | 18% | 16% | 16% | 6% | 23% | 17% |
| North 3 WWR | 25% | 3% | 19% | 36% | 38% | 31% | 50% | 13% | 66% | 62% | 47% | 49% | 40% | 41% | 15% | 41% | 34% |
| East 3 WWR | 61% | 47% | 33% | 7% | 14% | 25% | 18% | 13% | 11% | 14% | 11% | 16% | 14% | 0% | 12% | 14% | 19% |
| South 3 WWR | 7% | 3% | 34% | 35% | 48% | 36% | 26% | 61% | 9% | 18% | 35% | 17% | 32% | 21% | 62% | 23% | 29% |
| West 3 WW | 7% | 47% | 14% | 22% | 0% | 9% | 6% | 13% | 13% | 6% | 7% | 18% | 14% | 38% | 12% | 21% | 17% |
| Exterior Envelope | BU | BX | UOW | VT | KFU 1 | SCU | UOB | UOS | Mean | DBC |
|---|---|---|---|---|---|---|---|---|---|---|
| U-value walls [W/m2K] | 0.13 | 0.12 | 0.16 | 0.20 | 0.15 | 0.14 | 0.26 | 0.22 | 0.17 | ≤0.57 |
| U-value roof [W/m2K] | 0.13 | 0.15 | 0.19 | 0.10 | 0.10 | 0.16 | 0.33 | 0.20 | 0.17 | ≤0.30 |
| U-value exposed floor [W/m2K] | 0.19 | 0.17 | 0.16 | 0.14 | 0.19 | 0.53 | 0.26 | 0.24 | 0.24 | ≤0.57 |
| U-value glazing 2 [W/m2K] | 0.50 | 1.10 | 1.40 | 0.33 | 1.30 | 0.70 | 1.52 | 1.67 | 1.06 | ≤2.10 |
Disclaimer/Publisher’s Note: The statements, opinions and data contained in all publications are solely those of the individual author(s) and contributor(s) and not of MDPI and/or the editor(s). MDPI and/or the editor(s) disclaim responsibility for any injury to people or property resulting from any ideas, methods, instructions or products referred to in the content. |
© 2025 by the authors. Licensee MDPI, Basel, Switzerland. This article is an open access article distributed under the terms and conditions of the Creative Commons Attribution (CC BY) license (https://creativecommons.org/licenses/by/4.0/).
Share and Cite
Trepci, E.; Rodriguez-Ubinas, E. Passive Design for Residential Buildings in Arid Desert Climates: Insights from the Solar Decathlon Middle East. Buildings 2025, 15, 2731. https://doi.org/10.3390/buildings15152731
Trepci E, Rodriguez-Ubinas E. Passive Design for Residential Buildings in Arid Desert Climates: Insights from the Solar Decathlon Middle East. Buildings. 2025; 15(15):2731. https://doi.org/10.3390/buildings15152731
Chicago/Turabian StyleTrepci, Esra, and Edwin Rodriguez-Ubinas. 2025. "Passive Design for Residential Buildings in Arid Desert Climates: Insights from the Solar Decathlon Middle East" Buildings 15, no. 15: 2731. https://doi.org/10.3390/buildings15152731
APA StyleTrepci, E., & Rodriguez-Ubinas, E. (2025). Passive Design for Residential Buildings in Arid Desert Climates: Insights from the Solar Decathlon Middle East. Buildings, 15(15), 2731. https://doi.org/10.3390/buildings15152731


