An Investigation of the Effectiveness of Super White Cement in Improving the Engineering Properties of Organic Soils by Laboratory Tests

 , ,
, ,  , , and
Abstract
1. Introduction
2. Materials and Methods
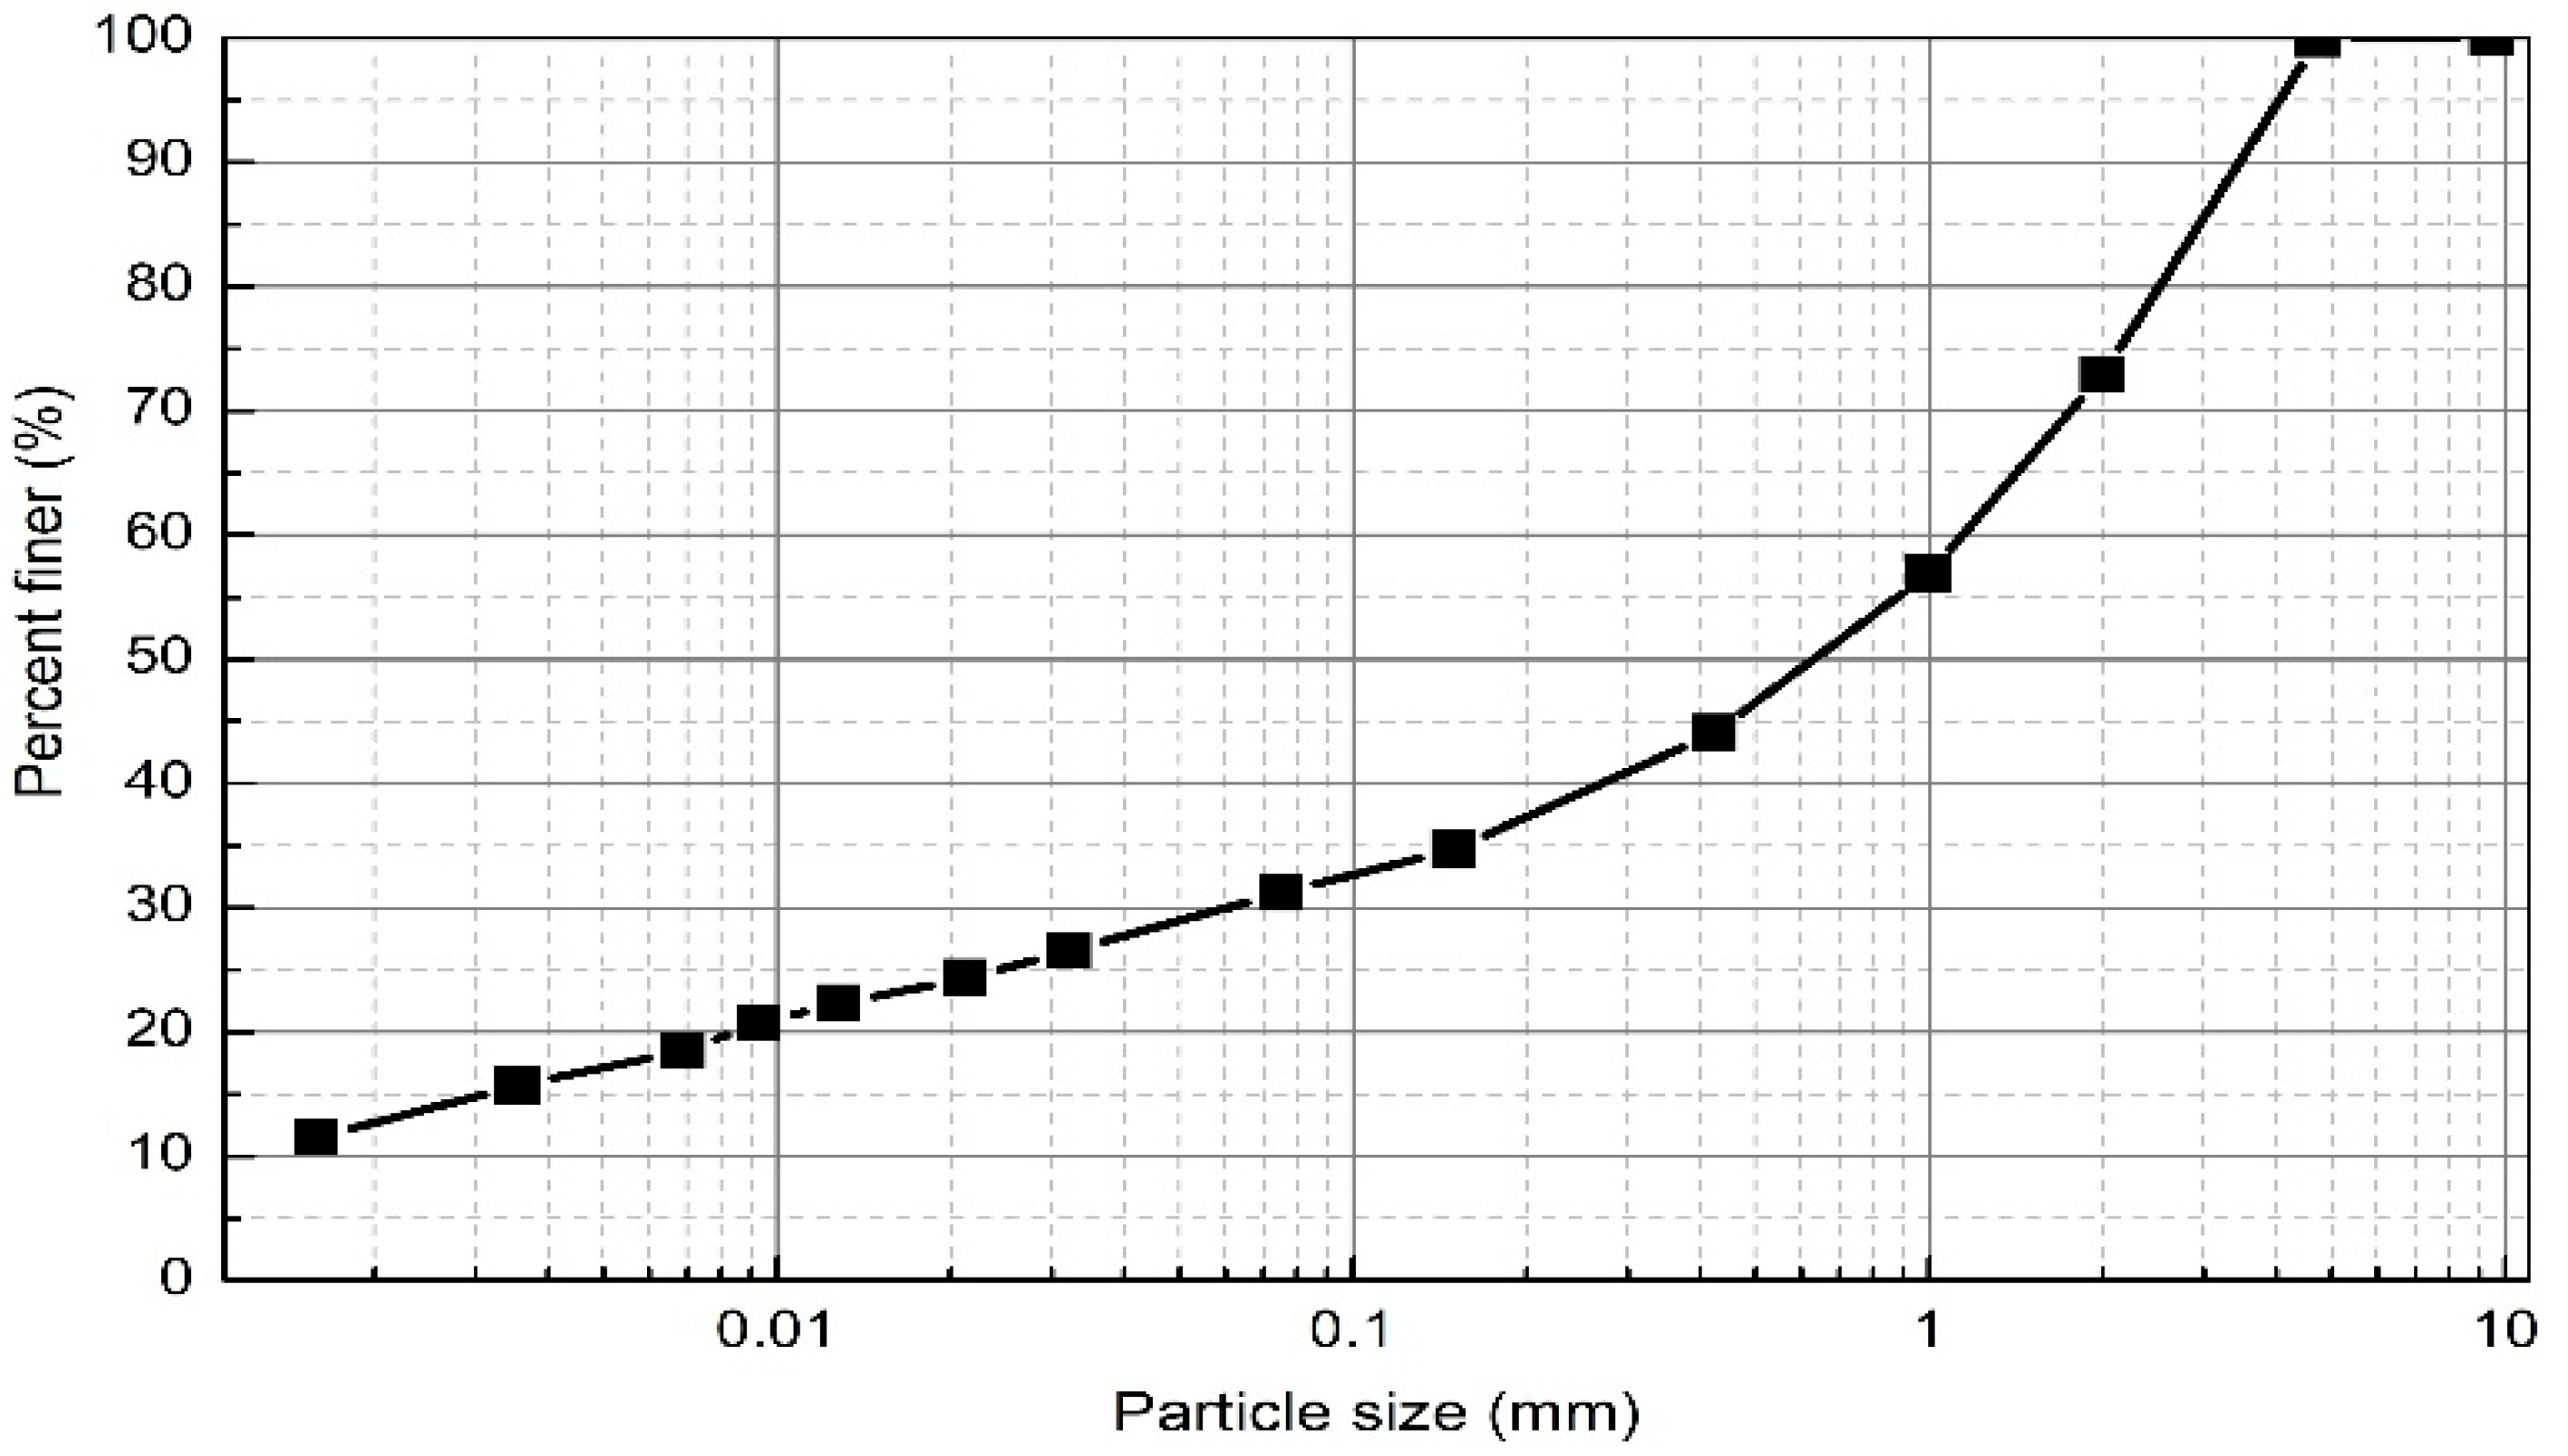
2.1. Soil
2.2. Super White Cement (SWC) and Pozzolanic Cement (PC)
2.3. Specimen Preparation Procedure
2.4. Determination of Atterberg Limits
2.5. Determination of Compaction Characteristics
2.6. Preparation of the Amended Soil Samples for Unconfined Compressive Strength (UCS) and Triaxial (TA) Tests
2.7. Swell Potential
2.8. Compressibility
3. Results and Discussion
3.1. Atterberg Limits
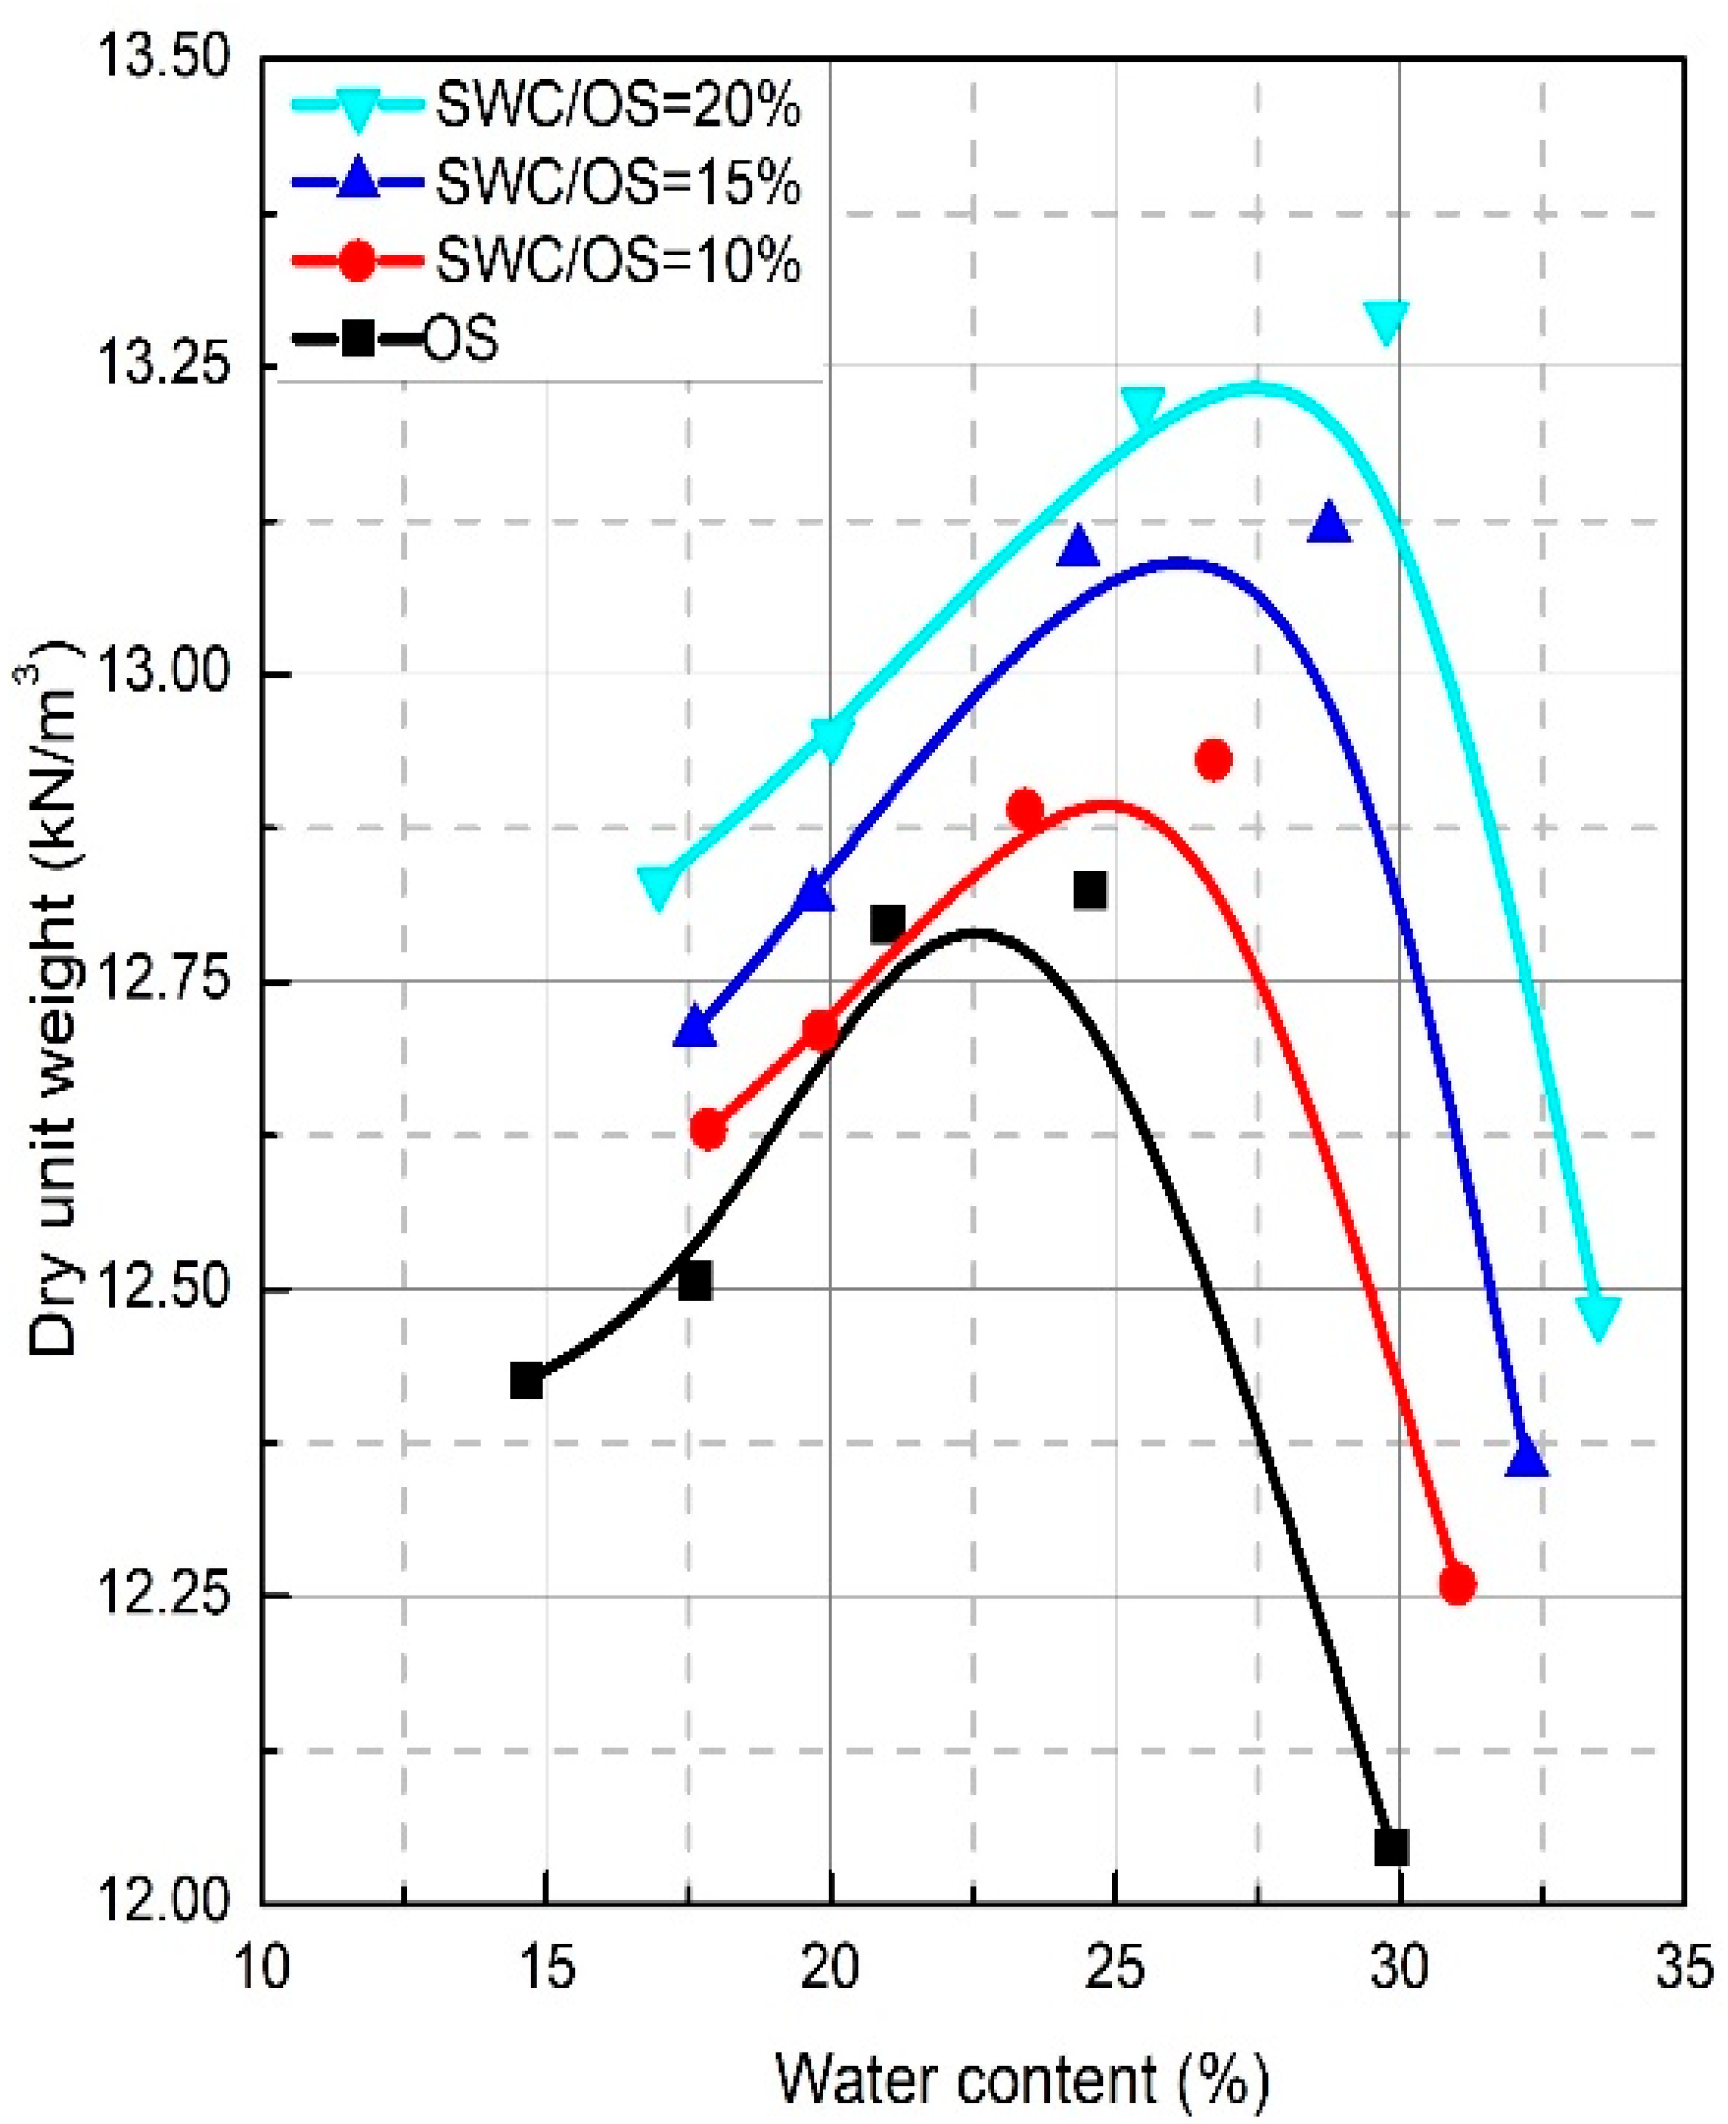
3.2. Compaction Characteristics
3.3. Unconfined Compressive Strength
3.4. Triaxial Tests
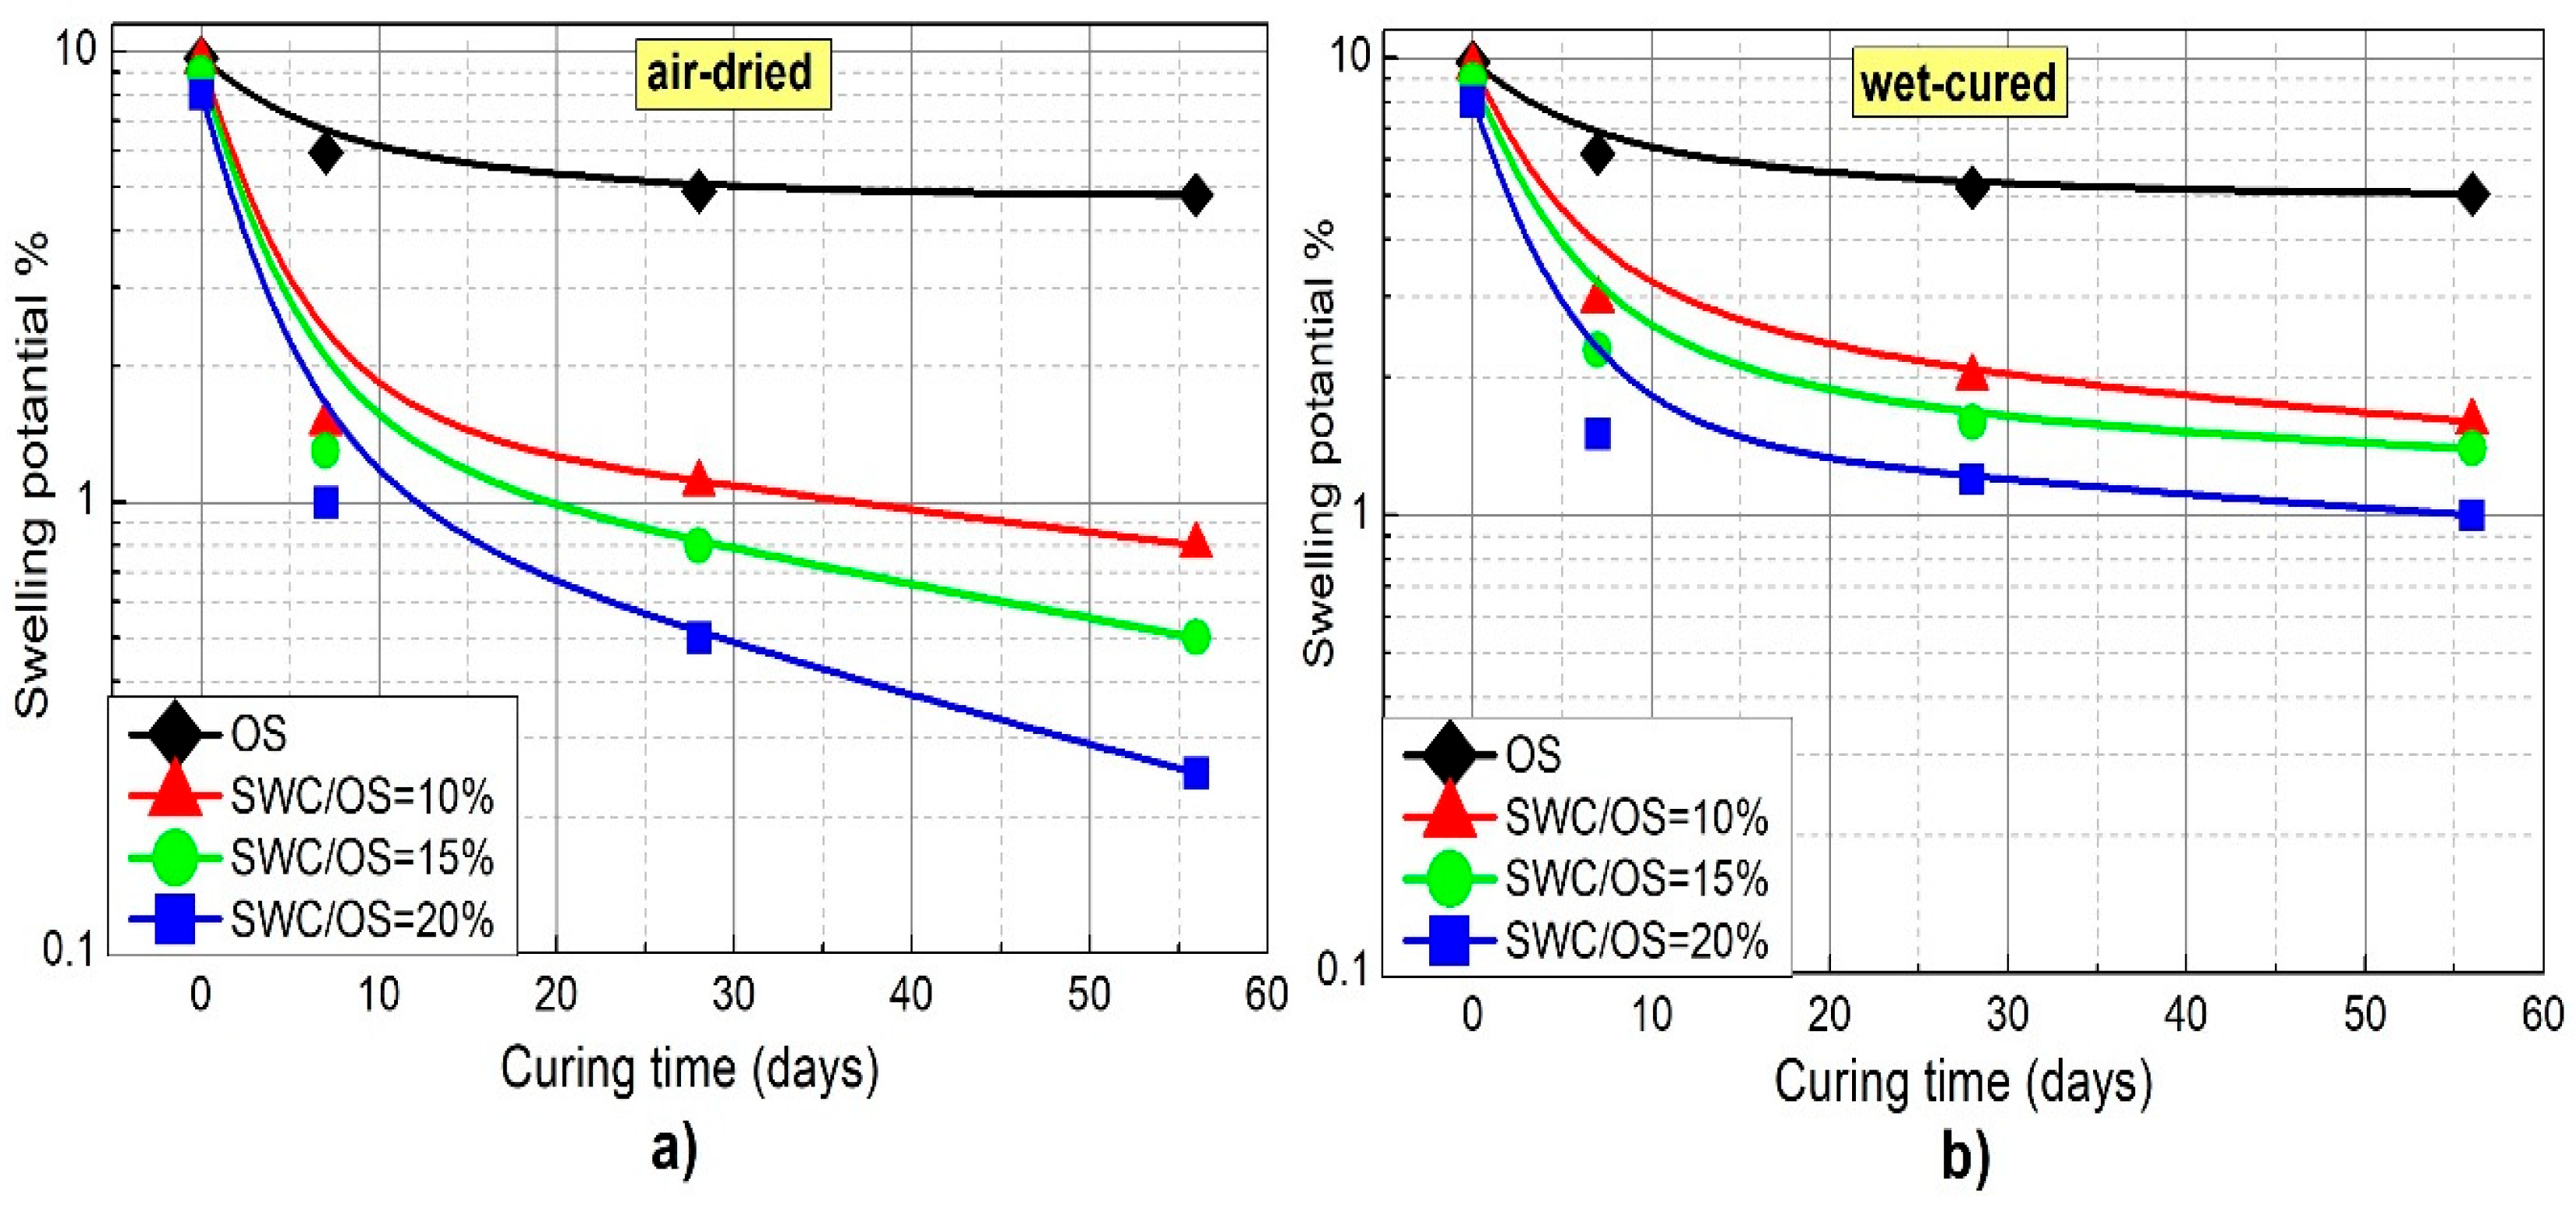
3.5. Swelling
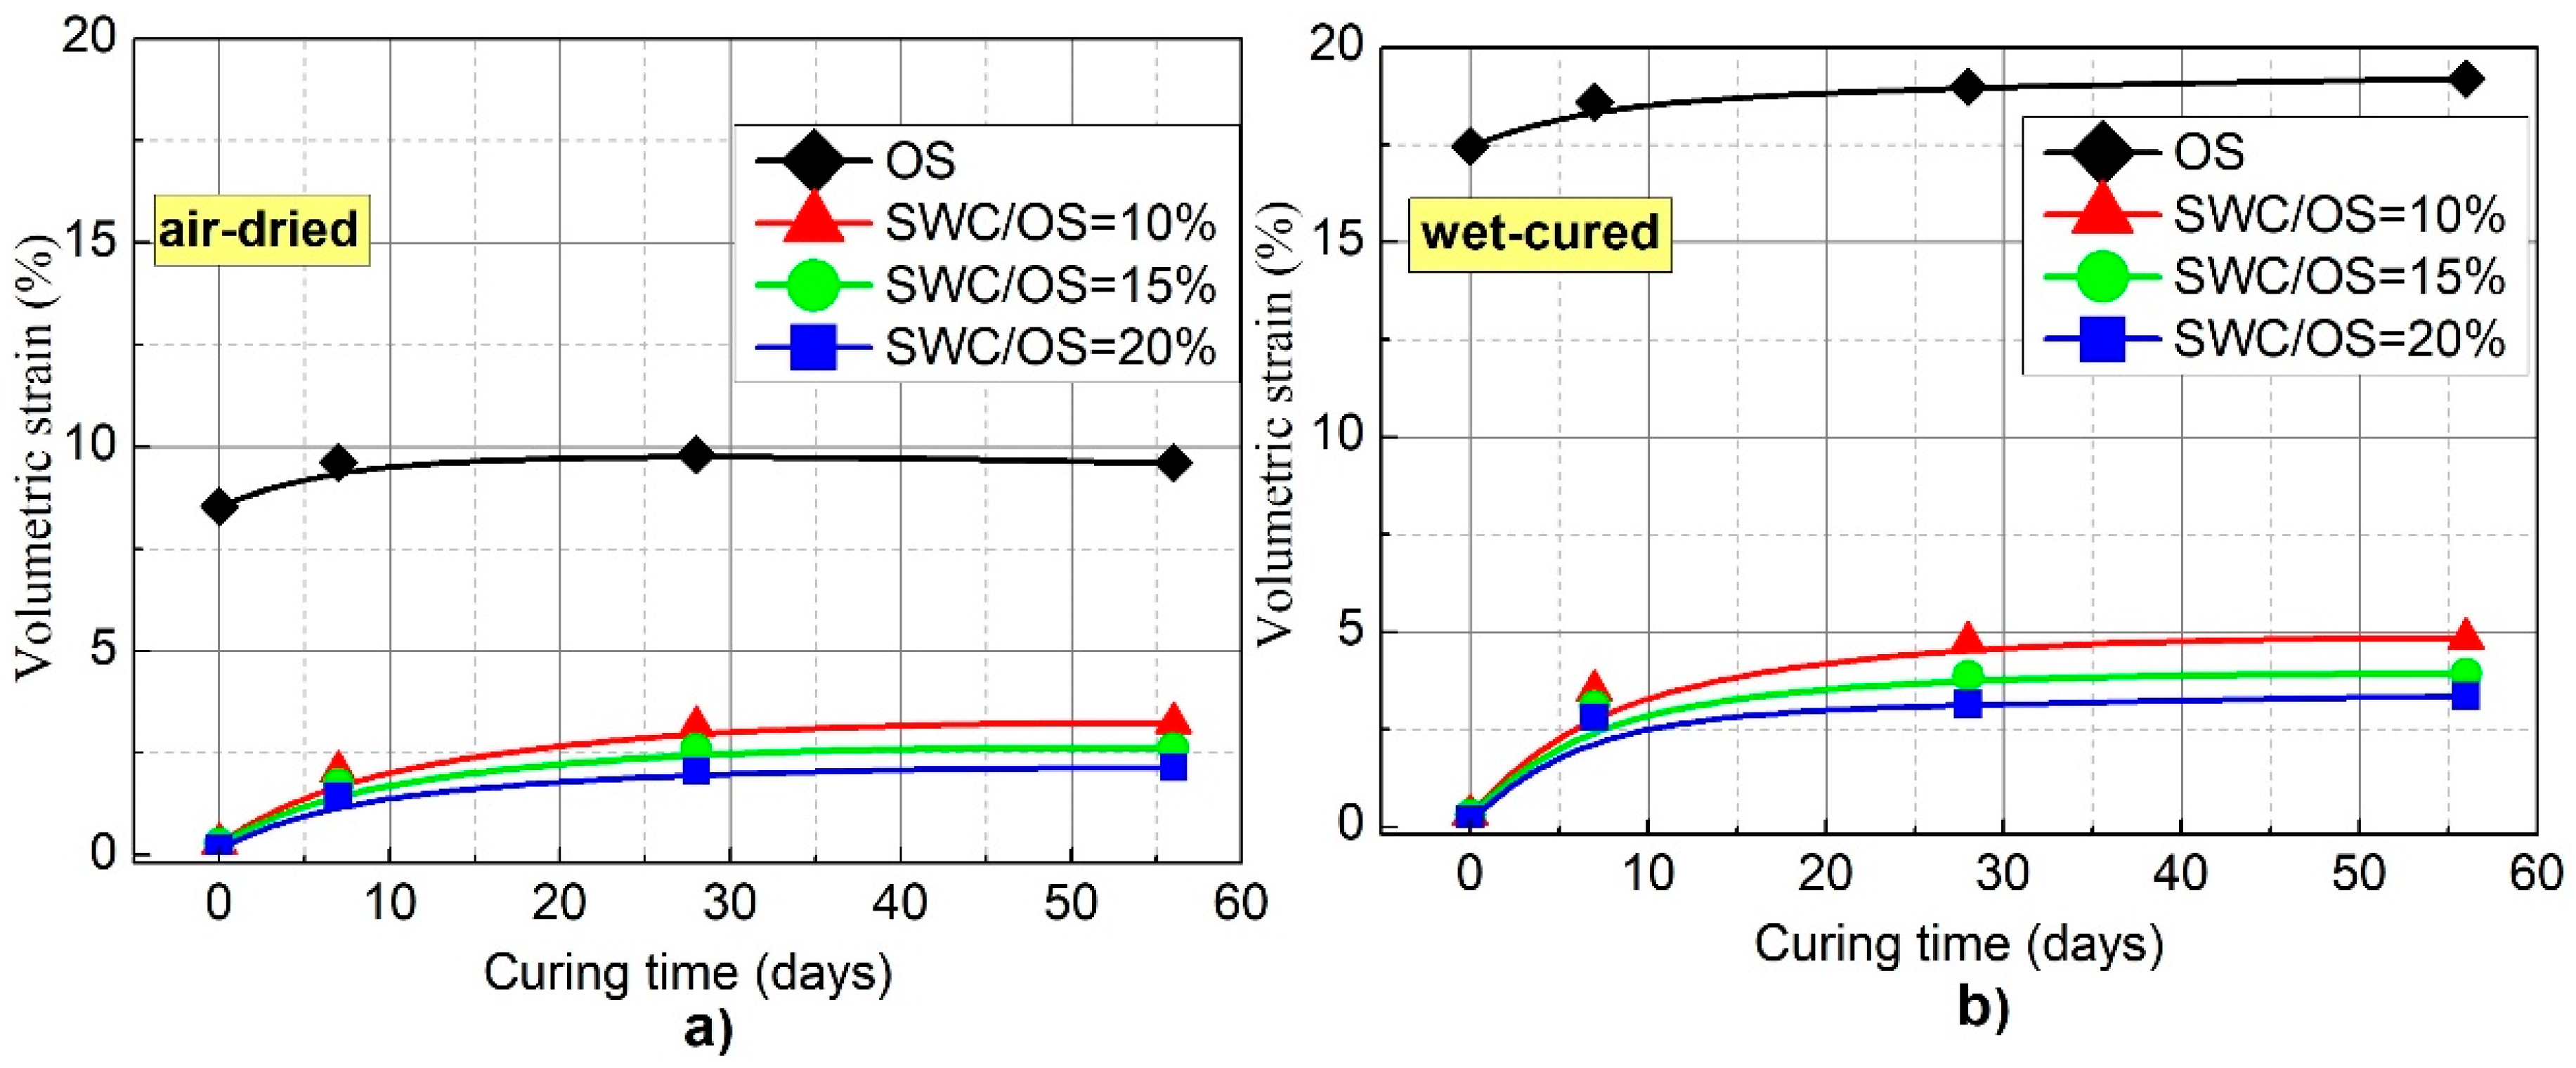
3.6. Compressibility Tests
3.7. Microstructural Analysis
4. Conclusions
- Stabilization of OS with SWC increased the LL, PL, and PI values. This situation can be explained by the increasing amount of SWC in the OS with the addition of SWC and the resulting flocculation.
- The increase in cement proportions in OS stabilized with SWC increased the OMC and MDD values. With the increase in cement proportion in OS stabilized with SWC, the Proctor curves were observed to move up toward the right. As the cement ratio increases, the amount of water required for the reaction that will occur after mixture will also increase. Therefore, as the cement ratio increased, the OMC values also increased. With the increase in the cement ratio, the MDD values increased as well. This is due to the cement’s outstanding flocculation characteristics. Flocculation improves in mixtures with added SWC, and when the flocs are packed, they readily reorient to their new positions and become more compact.
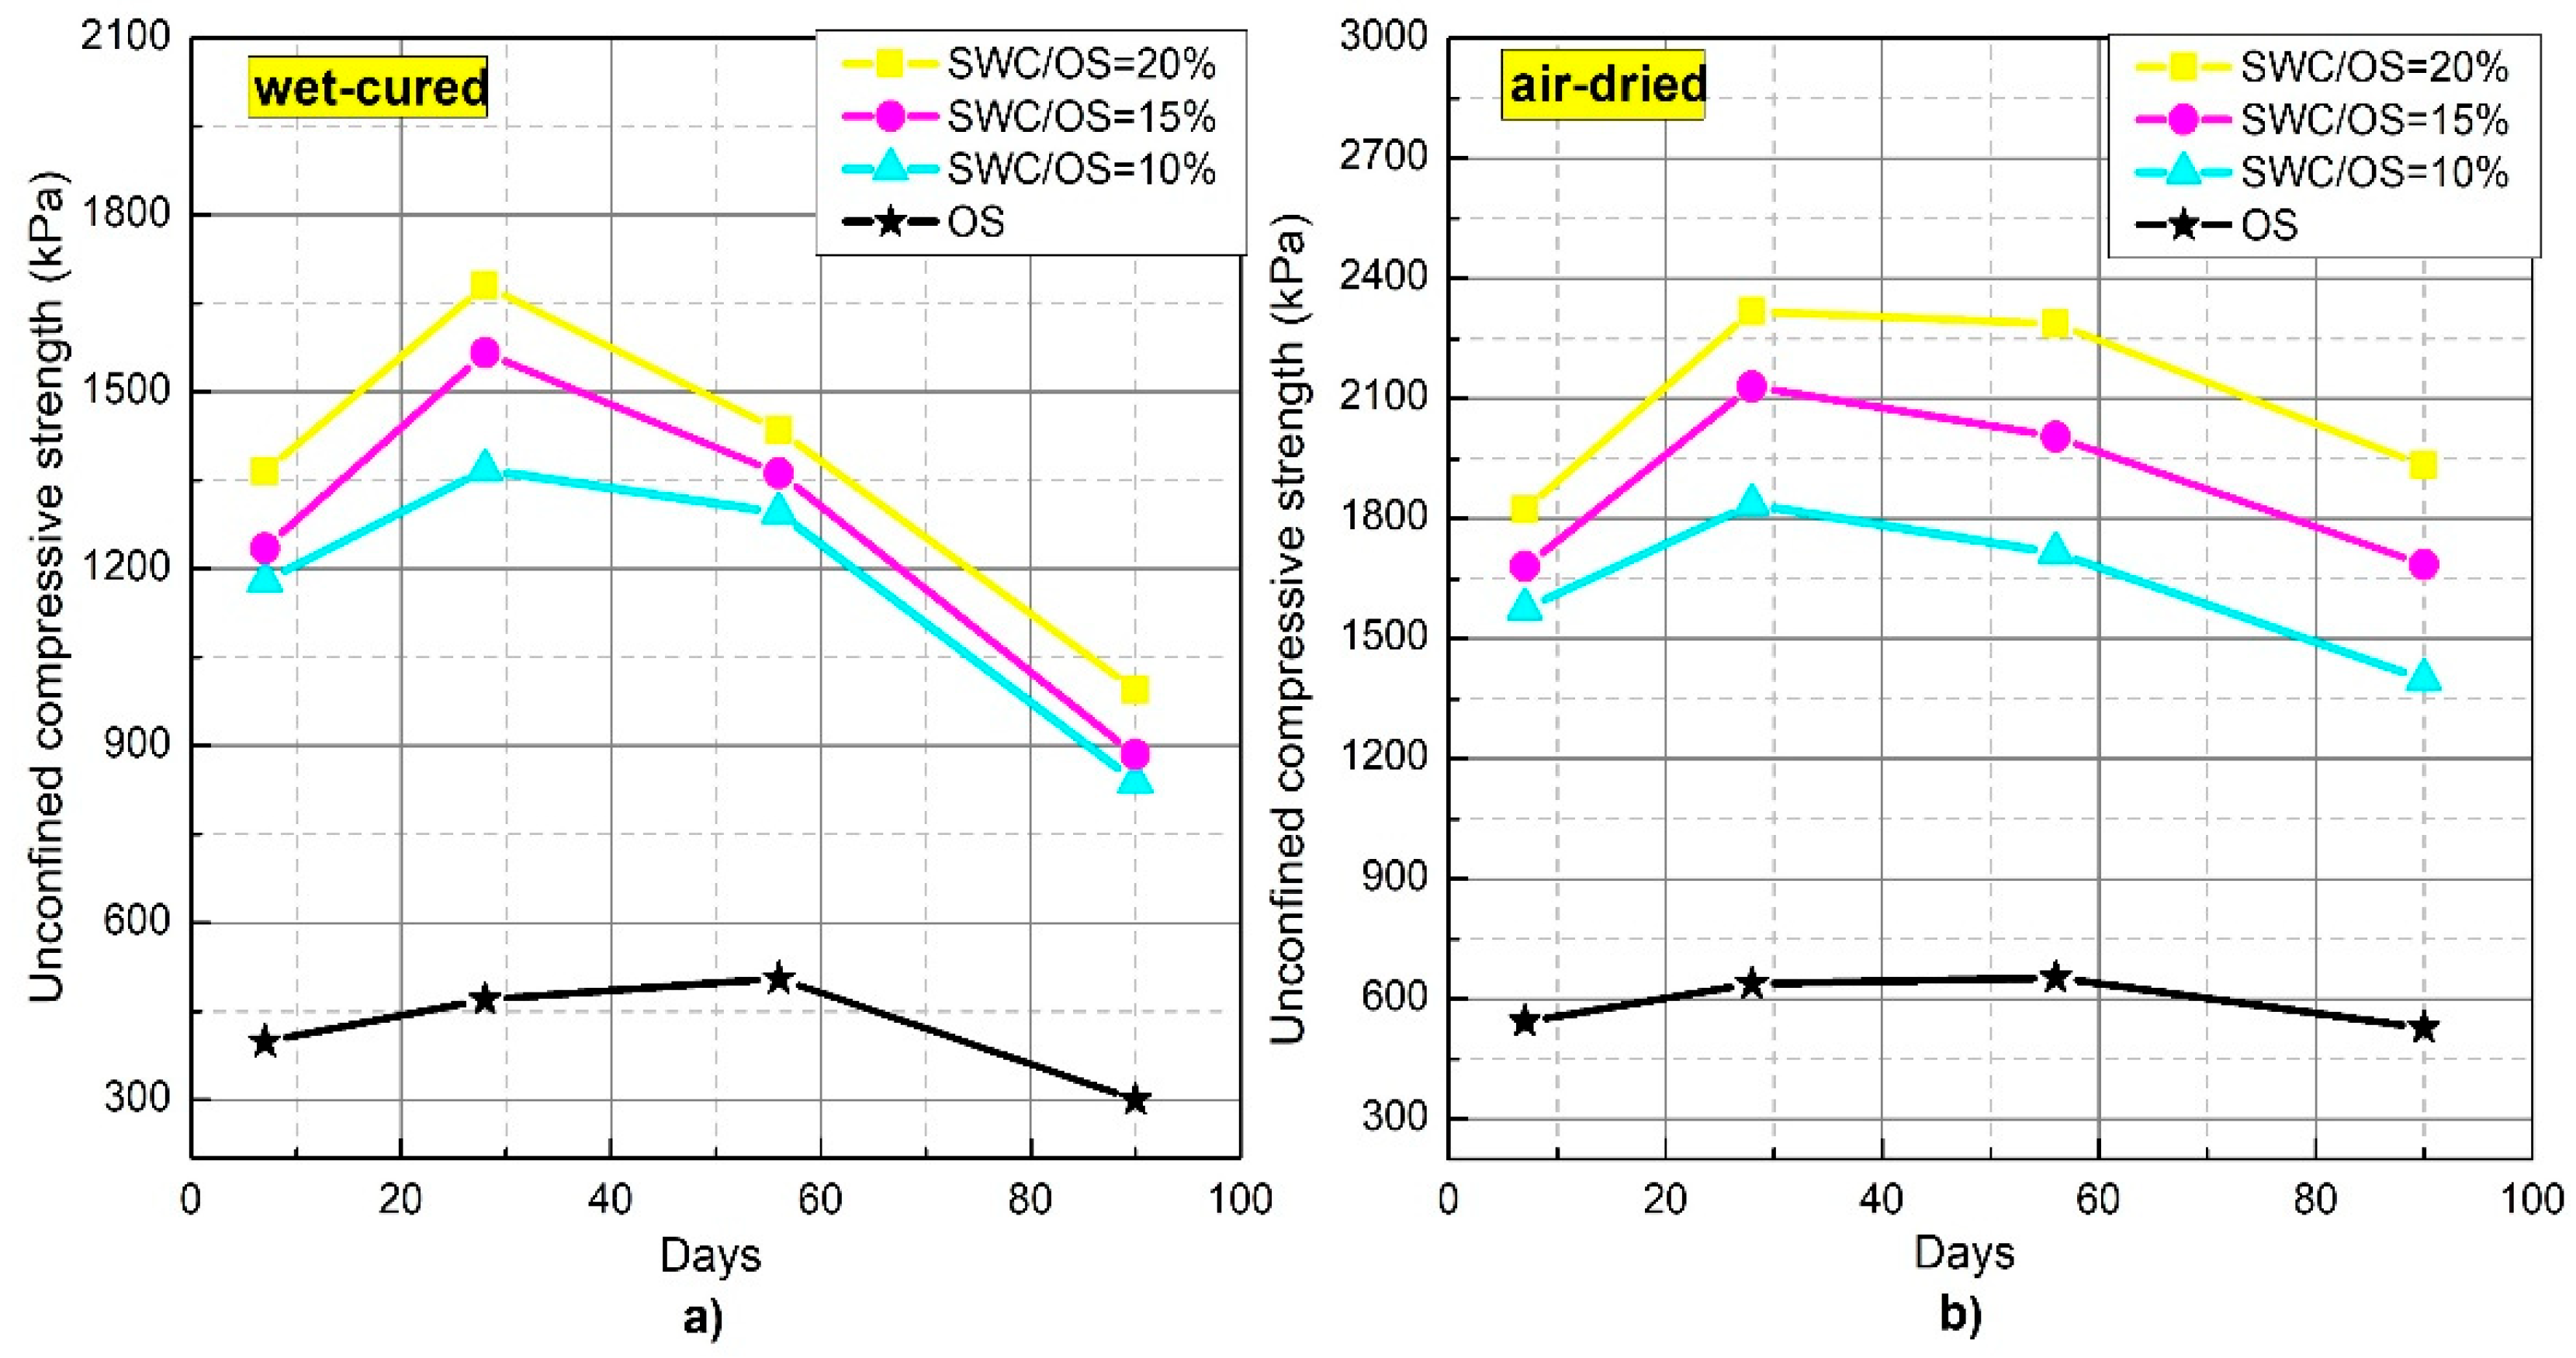
- The unconfined compressive strength values for OS left in both the wet-cured and air- dried environments rapidly increased until day 56 and then had a reducing tendency after 56 days.
- Linked to time, the unconfined compressive strength values of the samples stabilized with SWC increased rapidly until day 28, and then, there was a reducing tendency after day 28. The reaction between SWC and OS, as well as the time-dependent behavior of OS, played a role in this type of behavior.
- Samples stabilized with SWC gained strength rapidly.
- The unconfined compressive strength of OS stabilized with SWC increased with the increase in cement proportion.
- Due to the stabilization of OS with SWC, the unconfined compressive strength of the samples left in the air-dried environment was higher than the strength of the samples left in the wet-cured environment.
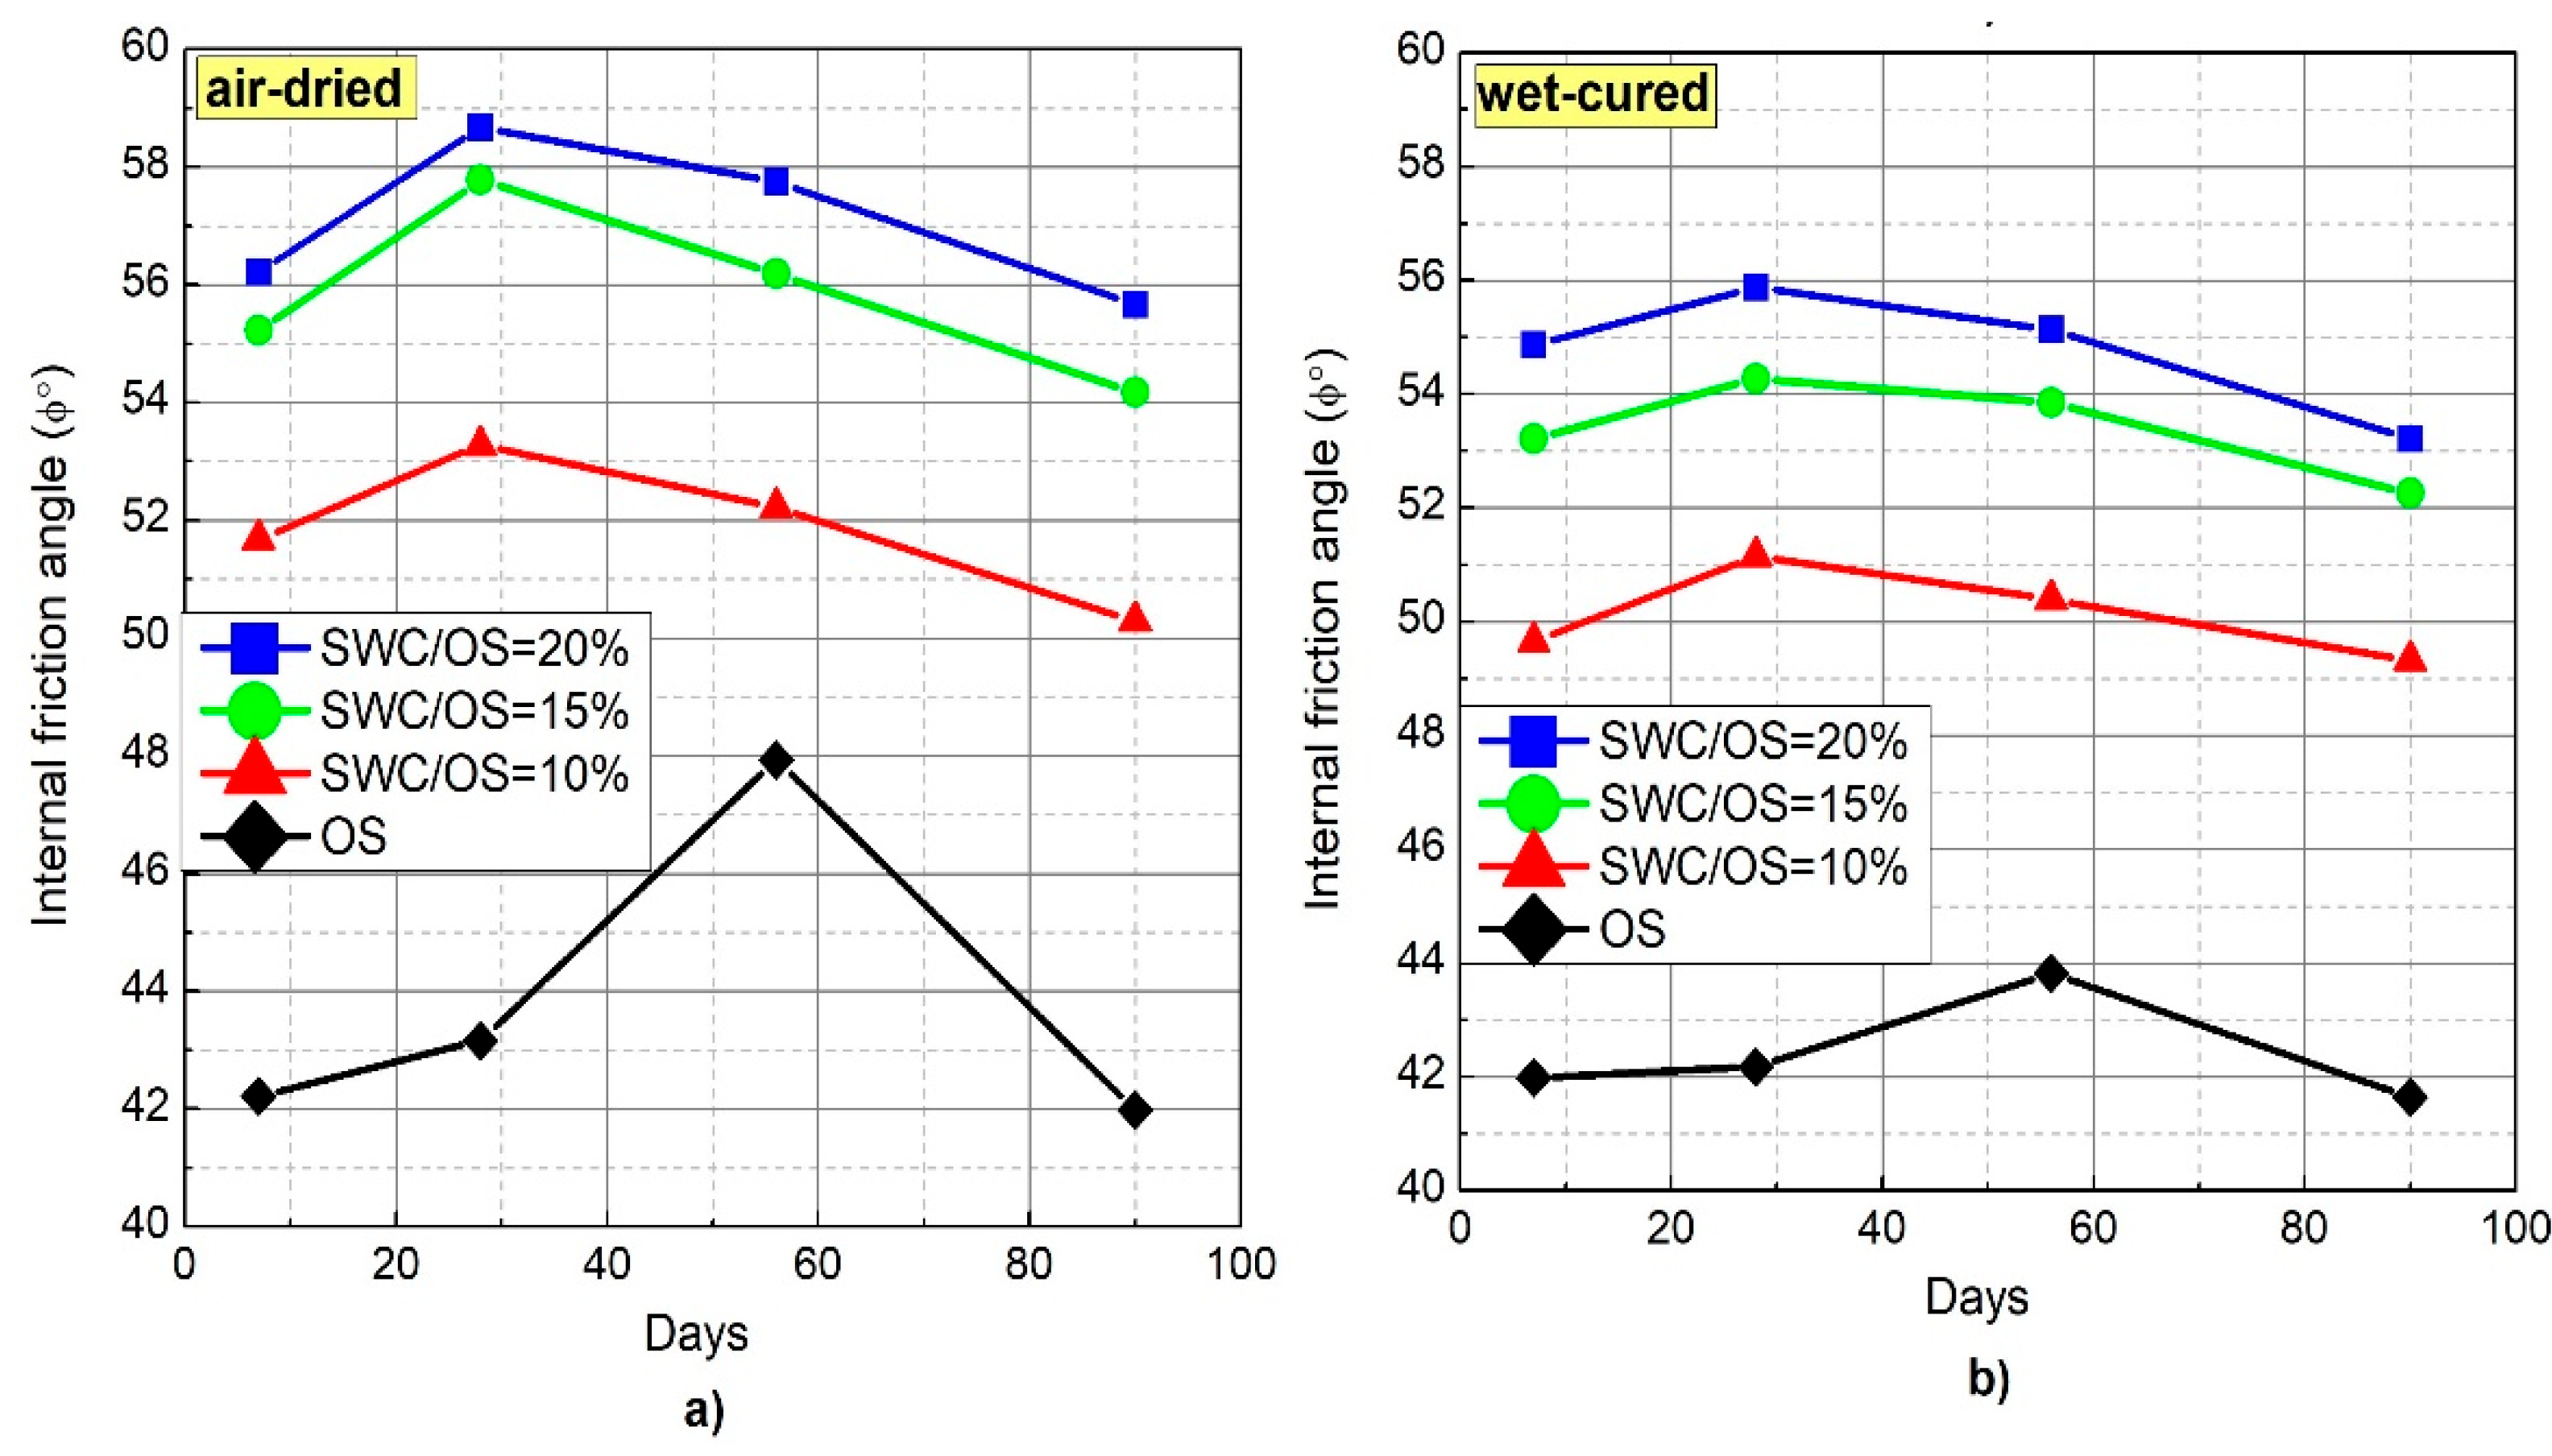
- The cohesion intercept and internal friction angle values for OS left in both the wet-cured and air-dried environments increased until day 56 and then had a reducing tendency after day 56.
- The cohesion intercept and internal friction angle values for OS left in the air-dried environment were higher than the cohesion intercept and internal friction angle values for OS left in the wet-cured environment.
- For both the wet-cured and air-dried environments, OS stabilized with SWC had increases in cohesion intercept and internal friction angle values until day 28, with a reducing trend after day 28. With the increase in cement proportion in OS stabilized with SWC, the internal friction angle and cohesion intercept values increased.
- After stabilization of OS with SWC, the UCS and shear strength values increased. The reason for this increase is the chemical reaction that occurs between SWC and OS. The fact that SWC is an early and high-strength cement contributed to the increase in these parameters.
- Addition of SWC within OS reduced the swelling percentage and compressibility values of the samples. Cation replacement between monovalent cations, like sodium and potassium, present in the OS and higher-valence calcium cations due to hydration has reduced the swelling potential and compressibility by decreasing the attraction of water molecules.
Author Contributions
Funding
Data Availability Statement
Conflicts of Interest
References
- Larsson, R. Chapter 1 Organic Soils. In Developments in Geotechnical Engineering; Hartlén, J., Wolski, W., Eds.; Elsevier: Amsterdam, The Netherlands, 1996; Volume 80, pp. 4–30. [Google Scholar] [CrossRef]
- Núñez, V.; Lotero, A.; Bastos, C.A.; Sargent, P.; Consoli, N.C. Mechanical and microstructure analysis of mass-stabilized organic clay thermally cured using a ternary binder. Acta Geotech. 2024, 19, 741–762. [Google Scholar] [CrossRef]
- Siddiqua, S.; ElMouchi, A.; Wijewickreme, D. Characterization of an organic soil deposit using multi-faceted geotechnical field and laboratory investigations. Eng. Geol. 2024, 328, 107365. [Google Scholar] [CrossRef]
- Mesri, G.; Stark, T.D.; Ajlouni, M.A.; Chen, C.S. Secondary compression of peat with or without surcharging. J. Geotech. Geoenviron. Eng. 1997, 123, 411–421. [Google Scholar] [CrossRef]
- Mesri, G.; Ajlouni, M. Engineering properties of fibrous peats. J. Geotech. Geoenviron. Eng. 2007, 133, 850–866. [Google Scholar] [CrossRef]
- Andersland, O.B.; Al-Khafaji, A.A.W. Organic material and soil compressibility. J. Geotech. Eng. Div. 1980, 106, 749–758. [Google Scholar] [CrossRef]
- McBrierty, V.J.; Wardell, G.E.; Keely, C.M.; O’neill, E.P.; Prasad, M. The characterization of water in peat. Soil. Sci. Soc. Am. J. 1996, 60, 991–1000. [Google Scholar] [CrossRef]
- Huat, B.B.; Gue, S.S.; Ali, F.H. Tropical Residual Soils Engineering; CRC Press: London, UK, 2004. [Google Scholar]
- Keshawarz, M.S.; Dutta, U. Stabilization of South Texas Soils with Fly Ash; Fly Ash for Soil Improvement ASCE Geotechnical Special Publication No. 36; American Society of Civil Engineers: Reston, VA, USA, 1993. [Google Scholar]
- Sridharan, A.; Prashanth, J.P.; Sivapullaiah, P.V. Effect of Fly Ash On The Unconfined Compressive Strength of Black Cotton Soil. Proc. Inst. Civ. Eng.-Ground Improv. 1997, 1, 169–175. [Google Scholar] [CrossRef]
- Kaniraj, S.R.; Havanagi, V.G. Compressive strength of cement stabilized fly ash-soil mixtures. Cem. Concr. Res. 1999, 29, 673–677. [Google Scholar] [CrossRef]
- Basha, E.A.; Hashim, R.; Mahmud, H.B.; Muntohar, A.S. Stabilization of residual soil with rice husk ash and cement. Constr. Build. Mater. 2005, 19, 448–453. [Google Scholar] [CrossRef]
- Parsons, R.L.; Kneebone, E. Field performance of fly ash stabilised subgrades. Proc. Inst. Civil. Eng.-Ground Improv. 2005, 9, 33–38. [Google Scholar] [CrossRef]
- Vishwanath, G.; Pramod, K.; Ramesh, V. Peat soil stabilization with rice husk ash and lime powder. Int. J. Innov. Res. Sci. Eng. Technol. 2014, 9, 225–227. [Google Scholar]
- Arulrajah, A.; Yaghoubi, M.; Disfani, M.M.; Horpibulsuk, S.; Bo, M.W.; Leong, M. Evaluation of fly ash- and slag-based geopolymers for the improvement of a soft marine clay by deep soil mixing. Soils Found. 2018, 58, 1358–1370. [Google Scholar] [CrossRef]
- Zambri, N.M.; Ghazaly, Z.M. Peat soil stabilization using lime and cement. E3S Web Conf. EDP Sci. 2018, 34, 01034. [Google Scholar] [CrossRef]
- Mishra, M.C.; Babu, K.S.; Reddy, N.G.; Dey, P.P.; Rao, B.H. Performance of lime stabilization on extremely alkaline red mud waste under acidic environment. J. Hazard. Toxic. Radioact. Waste 2019, 23, 04019012. [Google Scholar] [CrossRef]
- Pongsivasathit, S.; Horpibulsuk, S.; Piyaphipat, S. Assessment of mechanical properties of cement stabilized soils. Case Stud. Constr. Mater. 2019, 11, e00301. [Google Scholar] [CrossRef]
- Paul, A.; Hussain, M. Cement stabilization of indian peat: An experimental investigation. J. Mater. Civ. Eng. 2020, 32, 04020350. [Google Scholar] [CrossRef]
- Anburuvel, A. The engineering behind soil stabilization with additives: A state-of-the-art review. Geotech. Geol. Eng. 2024, 42, 1–42. [Google Scholar] [CrossRef]
- Hampton, M.B.; Edil, T.B. Strength gain of organic ground with cement-type binders. Soil Improv. Big Digs ASCE 1998, 135–148. [Google Scholar]
- Janz, M.; Johansson, S.E. The Function of Different Binding Agents in Deep Stabilization; Report 9; Swedish Deep Stabilization Research Centre: Linköping, Sweden, 2002. [Google Scholar]
- Kalantari, B. Strength evaluation of air cured, cement treated peat with blast furnace slag. Geomech. Eng. 2011, 3, 207–218. [Google Scholar] [CrossRef]
- Dehghanbanadaki, A.; Ahmad, K.; Ali, N. Influence of natural fillers on shear strength of cement treated peat. Građevinar 2013, 65, 633–640. [Google Scholar] [CrossRef]
- Ahmad, A.; Sutanto, M.H.; Harahap, I.S.H.; Al-Bared, M.A.M.; Khan, M.A. Feasibility of demolished concrete and scraped tires in peat stabilization–a review on the sustainable approach in stabilization. In Proceedings of the 2020 Second International Sustainability and Resilience Conference: Technology and Innovation in Building Designs, Sakheer, Bahrain, 11–12 November 2020. [Google Scholar]
- Paul, A.; Hussain, M. Sustainable use of ggbs and rha as a partial replacement of cement in the stabilization of indian peat. Int. J. Geosynth. Ground Eng. 2020, 6, 4. [Google Scholar] [CrossRef]
- Wahab, A.; Embong, Z.; Hasan, M.; Musa, H.; Zaman, Q.U.; Ullah, H. Peat soil engineering and mechanical properties improvement under the effect of eks technique at Parit Kuari, Batu Pahat, Johor, West Malaysia. Bull. Geol. Soc. Malays. 2020, 70, 133–138. [Google Scholar] [CrossRef]
- Al-Hokabi, A.; Hasan, M.; Amran, M.; Fediuk, R.; Vatin, N.I.; Klyuev, S. Improving the early properties of treated soft kaolin clay with palm oil fuel ash and gypsum. Sustainability 2021, 13, 10910. [Google Scholar] [CrossRef]
- Hashim, R.; Isla, M.S. A model study to determine engineering properties of peat soil and effect on strength after stabilization. Eur. J. Sci. Res. 2008, 22, 205–215. [Google Scholar]
- Deboucha, S.; Hashim, R.; Alwi, A. Engineering properties of stabilized tropical peat soils. Electron. J. Geotech. Eng. 2008, 13, 1–9. [Google Scholar]
- Kalantari, B.; Huat, B.K. Load-bearing capacity improvement for peat soil. Eur. J. Sci. Res. 2009, 32, 252–259. [Google Scholar]
- Tastan, E.O.; Edil, T.B.; Benson, C.H.; Aydilek, A.H. Stabilization of organic soils with fly ash. J. Geotech. Geoenviron. Eng. 2011, 137, 819–833. [Google Scholar] [CrossRef]
- Kalantari, B.; Prasad, A. A study of the effect of various curing techniques on the strength of stabilized peat. Transp. Geotech. 2014, 1, 119–128. [Google Scholar] [CrossRef]
- Ahmad, A.; Sutanto, M.H.; Al-Bared, M.A.M.; Harahap, I.S.H.; Abad, S.V.A.N.K.; Khan, M.A. Physio-chemical properties, consolidation, and stabilization of tropical peat soil using traditional soil additives—A state of the art literature review. KSCE J. Civ. Eng. 2021, 25, 3662–3678. [Google Scholar] [CrossRef]
- ASTM D6913M-17; Standard Test Method for Particle-Size Distribution (Gradation) of Soils Using Sieve Analysis-D6913. ASTM International: West Conshohocken, PA, USA, 2017. [CrossRef]
- ASTM D7928-21E01; Standard Test Method for Particle-Size Distribution (Gradation) of Fine-Grained Soils Using the Sedimentation (Hydrometer) Analysis-D7928. ASTM International: West Conshohocken, PA, USA, 2021. [CrossRef]
- ASTM D2974-20E0; Standard Test Methods for Determining the Water (Moisture) Content, Ash Content, and Organic Material of Peat and Other Organic Soils—D 2974. ASTM International: West Conshohocken, PA, USA, 2020. [CrossRef]
- ASTM D0854-23; Standard Test Method for Specific Gravity of Soil Solids by Water Displacement Method-d854. ASTM International: West Conshohocken, PA, USA, 2023. [CrossRef]
- Bell, F. Engineering Geology and Construction; CRC Press: London, UK, 2004. [Google Scholar]
- Das, B.M.; Sivakugan, N. Foundation of Geotechnical Engineering; CRC Press: Boston, USA, 2017. [Google Scholar]
- Nicholson, P.G. Soil Improvement and Ground Modification Methods; Butterworth-Heinemann: Oxford, UK, 2014. [Google Scholar]
- ASTM D4318-17E01; Standard Test Methods for Liquid Limit, Plastic Limit, and Plasticity Index of Soils-D4318. ASTM International: West Conshohocken, PA, USA, 2017. [CrossRef]
- ASTM D0698-12R21; Standard Test Methods for Laboratory Compaction Characteristics of Soil Using Standard Effort (12,400 ft-lbf/ft3 (600 kn-m/m3))-D698. ASTM International: West Conshohocken, PA, USA, 2021. [CrossRef]
- ASTM D2166M-16; Standard Test Method for Unconfined Compressive Strength of Cohesive Soil-D2166. ASTM International: West Conshohocken, PA, USA, 2016. [CrossRef]
- ASTM D2850-23; Standard Test Method for Unconsolidated-Undrained Triaxial Compression Test on Cohesive Soils-D2850. ASTM International: West Conshohocken, PA, USA, 2023. [CrossRef]
- ASTM D2850-23; Standard Test Methods for One-Dimensional Swell or Collapse of Soils-D4546. ASTM International: West Conshohocken, PA, USA, 2021. [CrossRef]
- Taylor, H.F. Cement Chemistry; Thomas Telford: London, UK, 1997. [Google Scholar]


| Chemical properties | SiO2 | 21.6 |
| Al2O3 | 4.05 | |
| Fe2O3 | 0.26 | |
| CaO | 65.7 | |
| MgO | 1.30 | |
| SO3 | 3.50 | |
| Na2O | 0.30 | |
| K2O | 0.35 | |
| Ignition loss | 3.50 | |
| Physical properties | Specific gravity | 3.06 |
| Fineness (cm2/g) | 4600 | |
| Neat UCS | 2-day strength (MPa) | 37.0 |
| 7-day strength (MPa) | 50.0 | |
| 28-day strength (MPa) | 60.0 | |
| 90-day strength (MPa) | 66.0 |
Disclaimer/Publisher’s Note: The statements, opinions and data contained in all publications are solely those of the individual author(s) and contributor(s) and not of MDPI and/or the editor(s). MDPI and/or the editor(s) disclaim responsibility for any injury to people or property resulting from any ideas, methods, instructions or products referred to in the content. |
© 2025 by the authors. Licensee MDPI, Basel, Switzerland. This article is an open access article distributed under the terms and conditions of the Creative Commons Attribution (CC BY) license (https://creativecommons.org/licenses/by/4.0/).
Share and Cite
Avci, E.; Balci, M.C.; Toprak, M.A.; Uysal, M.; Deveci, E.; Karataş, G.A.; Dönertaş, Y.E. An Investigation of the Effectiveness of Super White Cement in Improving the Engineering Properties of Organic Soils by Laboratory Tests. Buildings 2025, 15, 2730. https://doi.org/10.3390/buildings15152730
Avci E, Balci MC, Toprak MA, Uysal M, Deveci E, Karataş GA, Dönertaş YE. An Investigation of the Effectiveness of Super White Cement in Improving the Engineering Properties of Organic Soils by Laboratory Tests. Buildings. 2025; 15(15):2730. https://doi.org/10.3390/buildings15152730
Chicago/Turabian StyleAvci, Eyubhan, Mehmet C. Balci, Muhammed A. Toprak, Melih Uysal, Emre Deveci, Gözde Algun Karataş, and Yunus E. Dönertaş. 2025. "An Investigation of the Effectiveness of Super White Cement in Improving the Engineering Properties of Organic Soils by Laboratory Tests" Buildings 15, no. 15: 2730. https://doi.org/10.3390/buildings15152730
APA StyleAvci, E., Balci, M. C., Toprak, M. A., Uysal, M., Deveci, E., Karataş, G. A., & Dönertaş, Y. E. (2025). An Investigation of the Effectiveness of Super White Cement in Improving the Engineering Properties of Organic Soils by Laboratory Tests. Buildings, 15(15), 2730. https://doi.org/10.3390/buildings15152730