
Triaxial Response and Elastoplastic Constitutive Model for Artificially Cemented Granular Materials


Abstract
1. Introduction
2. Macro–Microscopic Analysis Results
2.1. Experimental Materials
2.1.1. Design of Materials and Mixture Proportions
2.1.2. Specimen Production
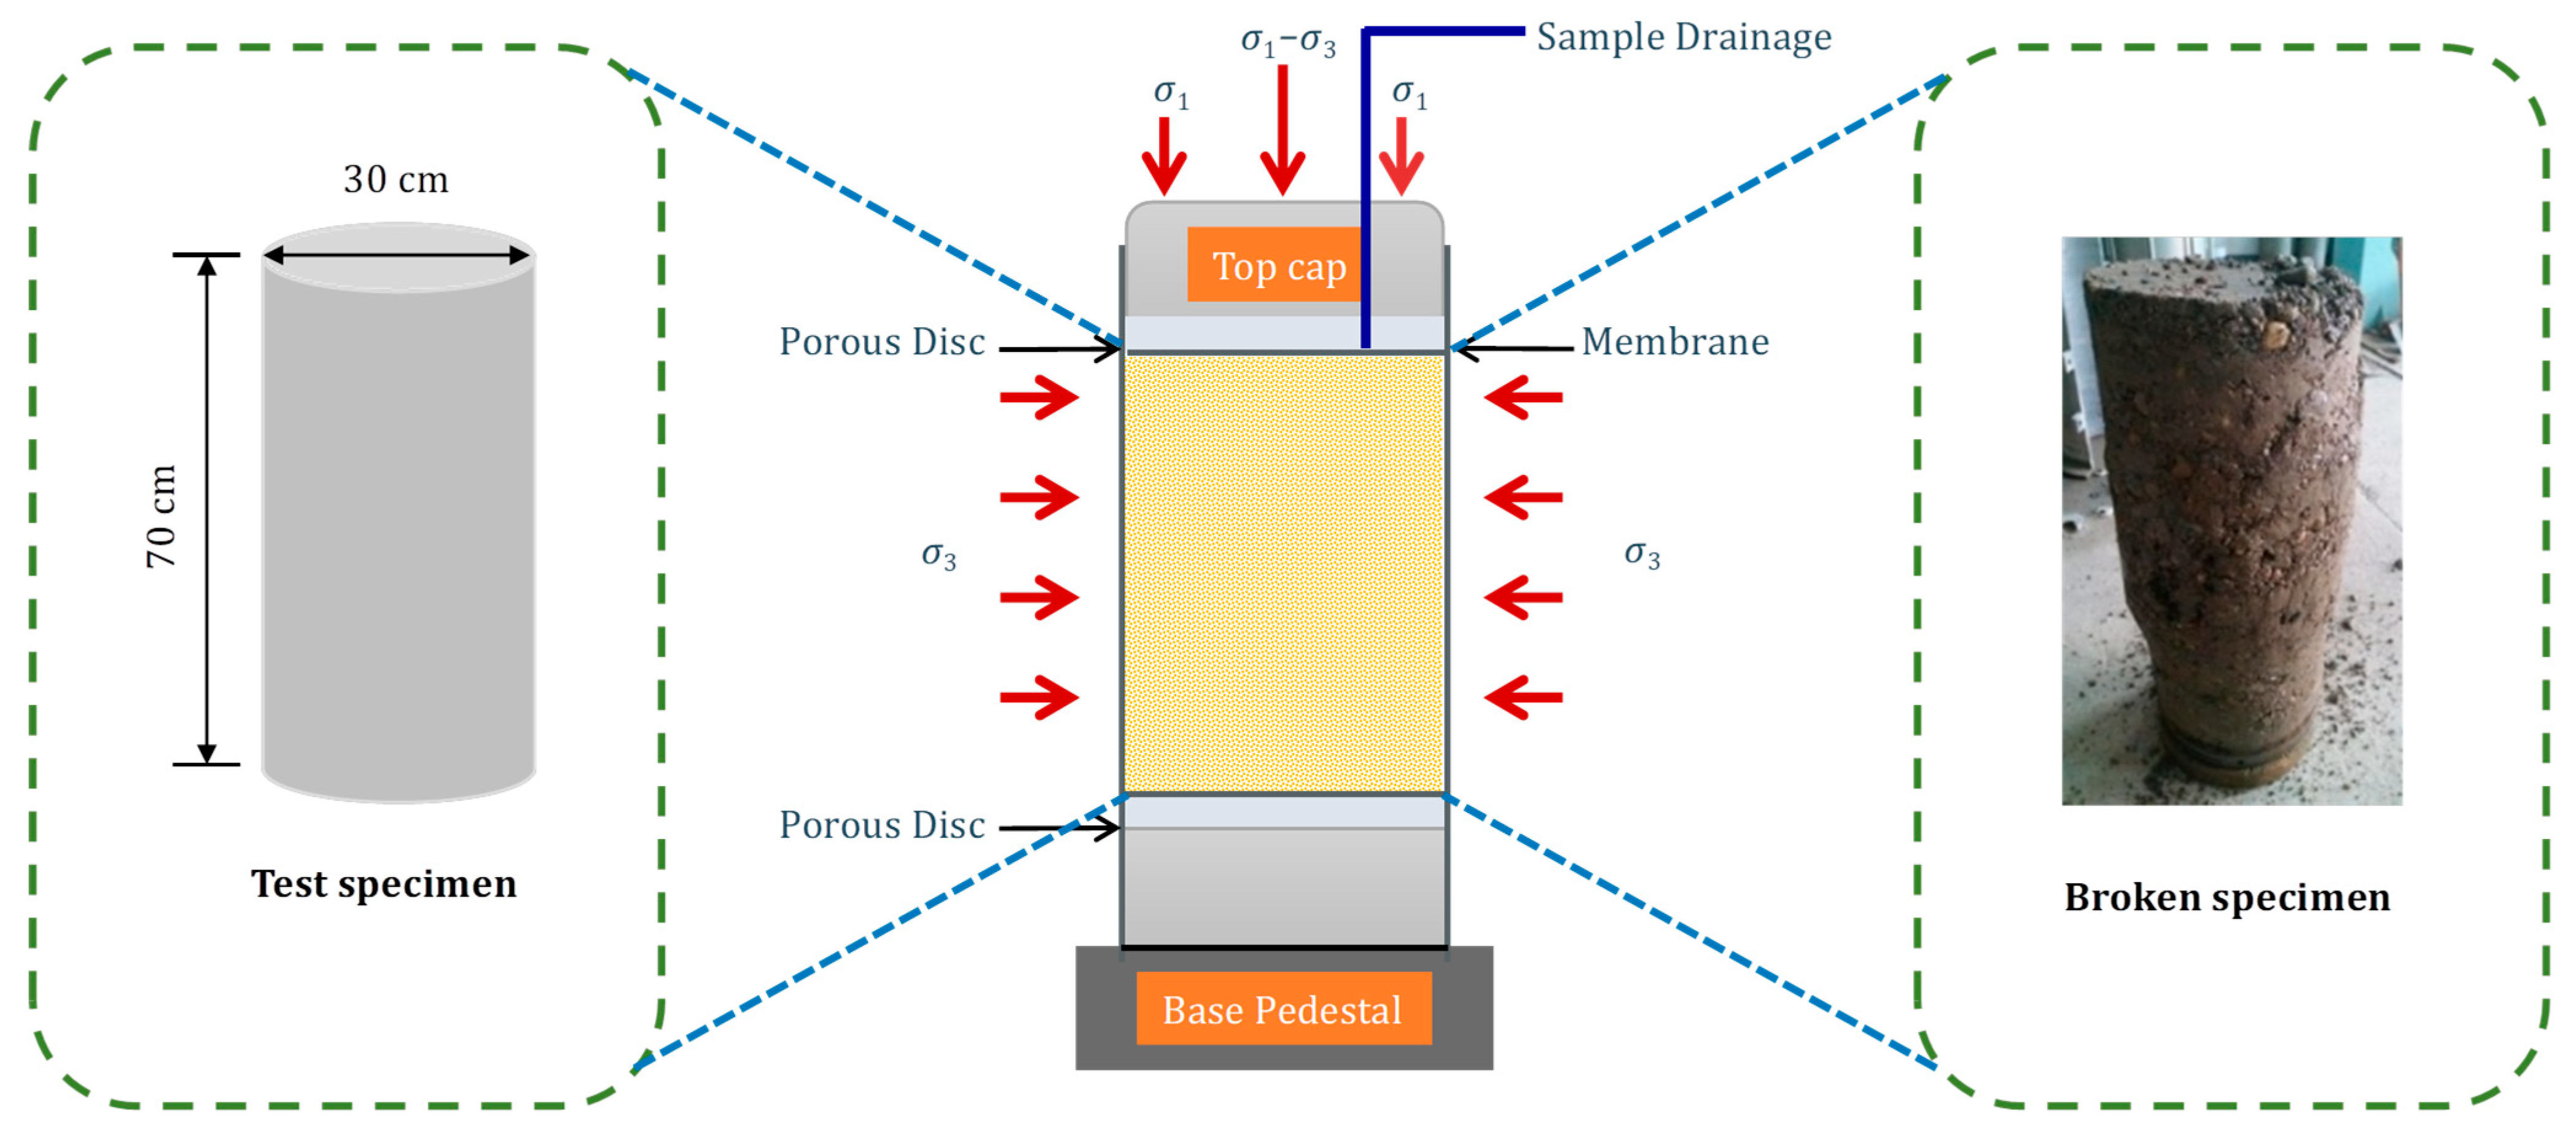
2.2. Experimental Apparatus and Procedure
Testing Protocol for LCSG Device (Highly Permeable ACG Materials)
2.3. Quantitative Description of Stress–Strain Relationship
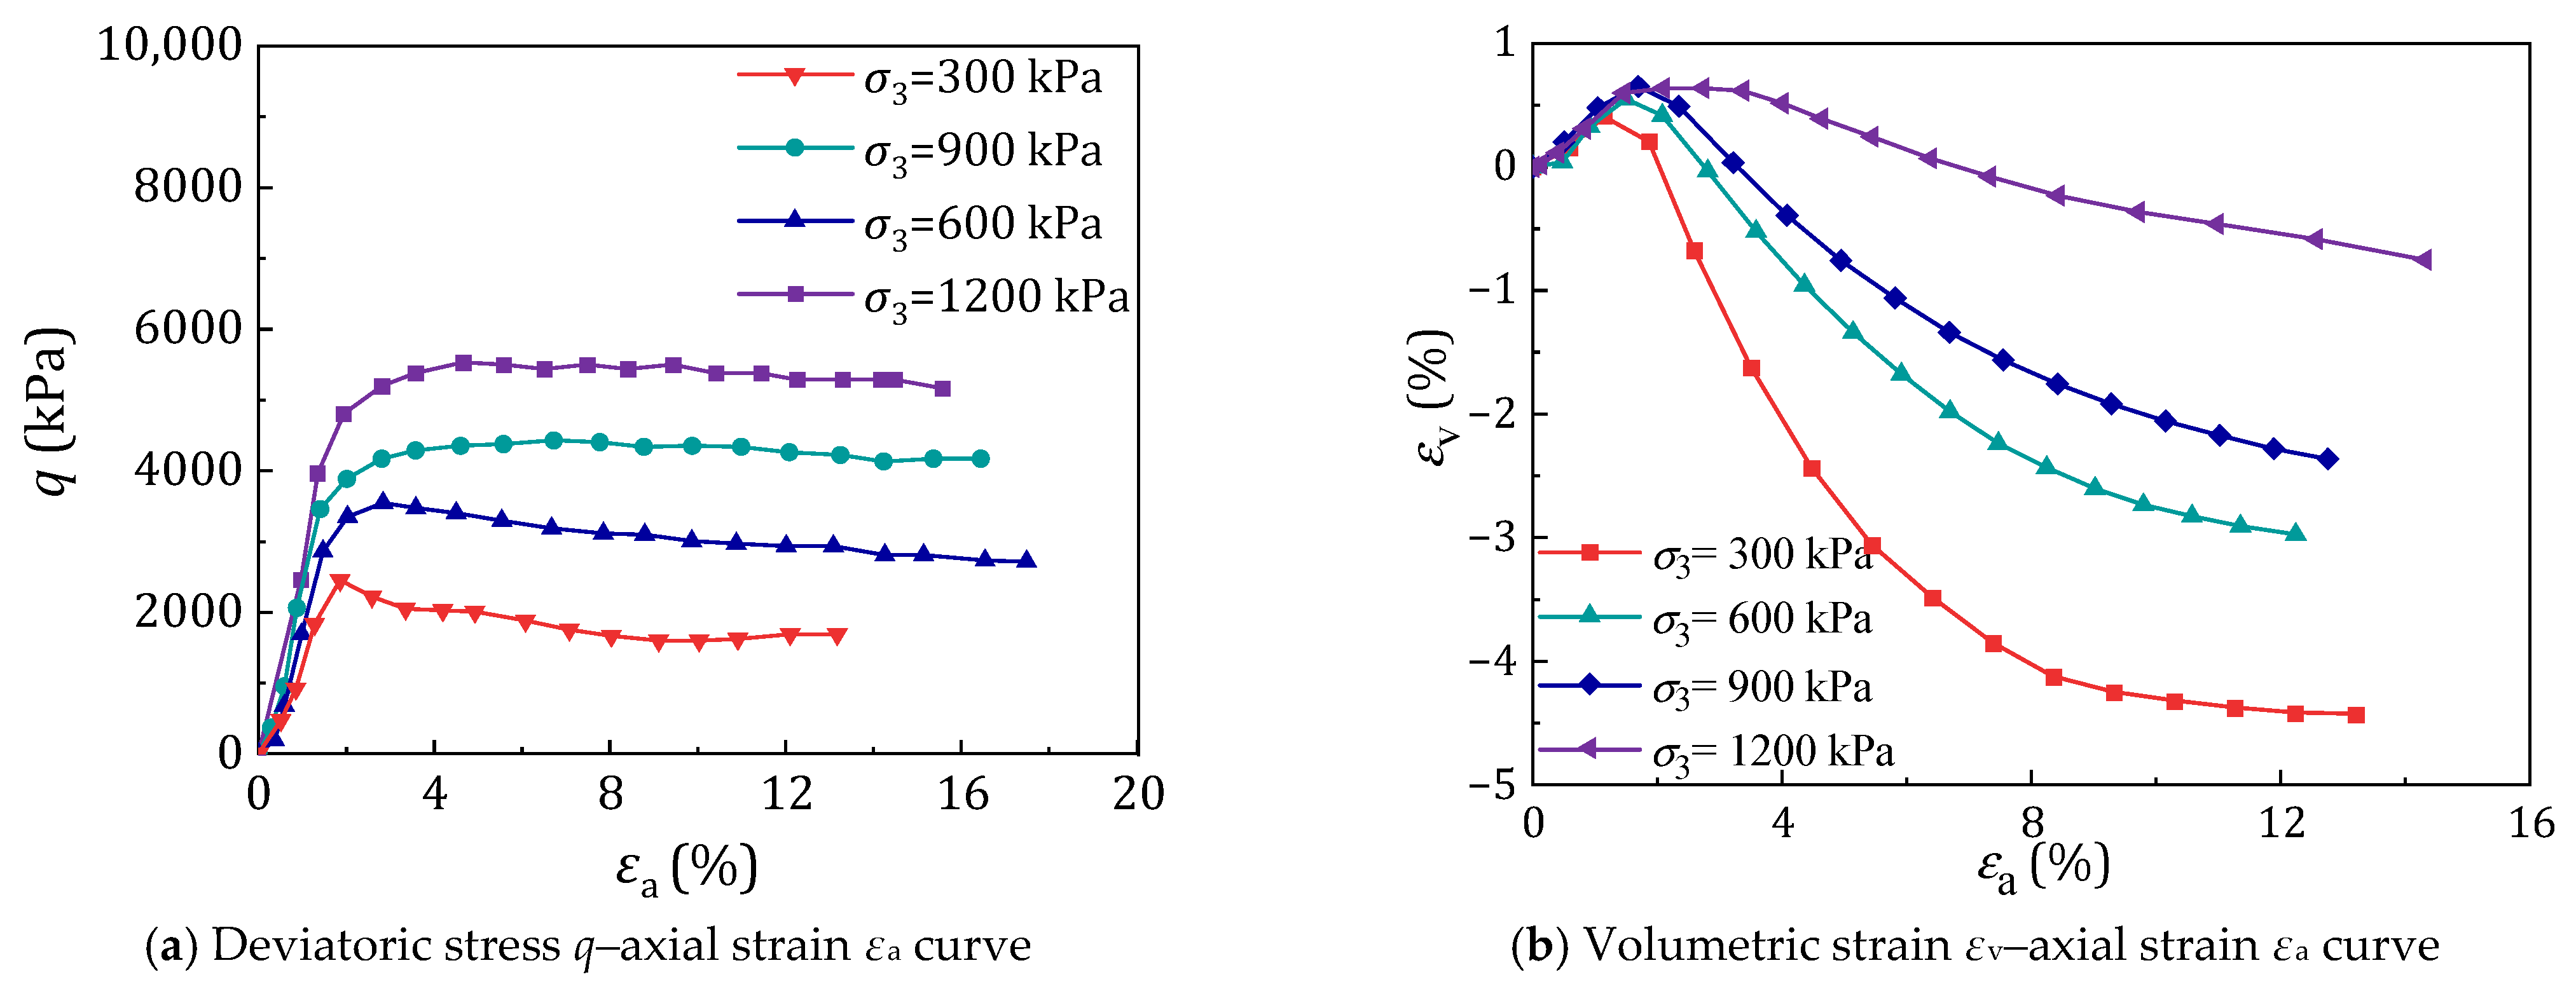
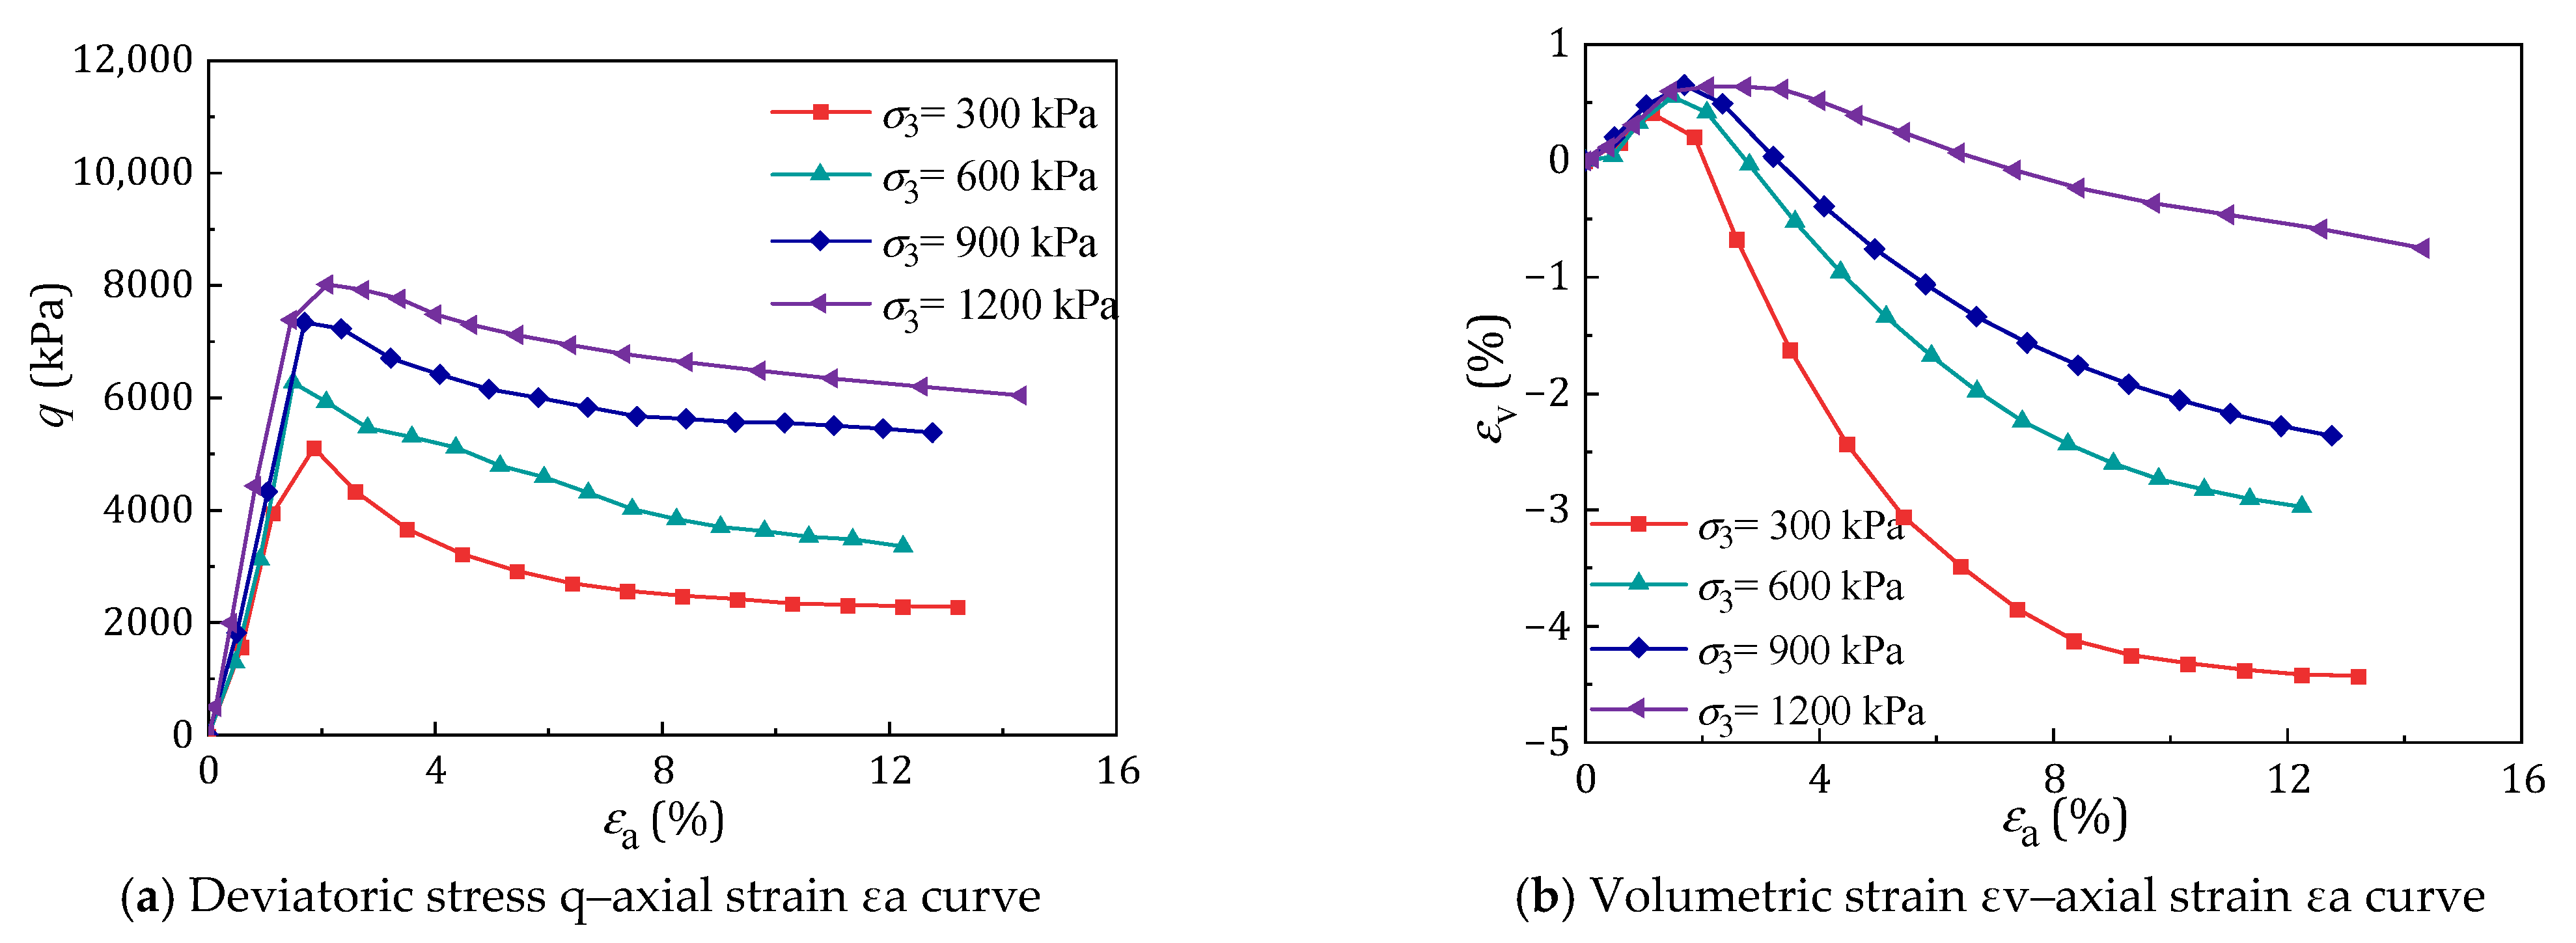
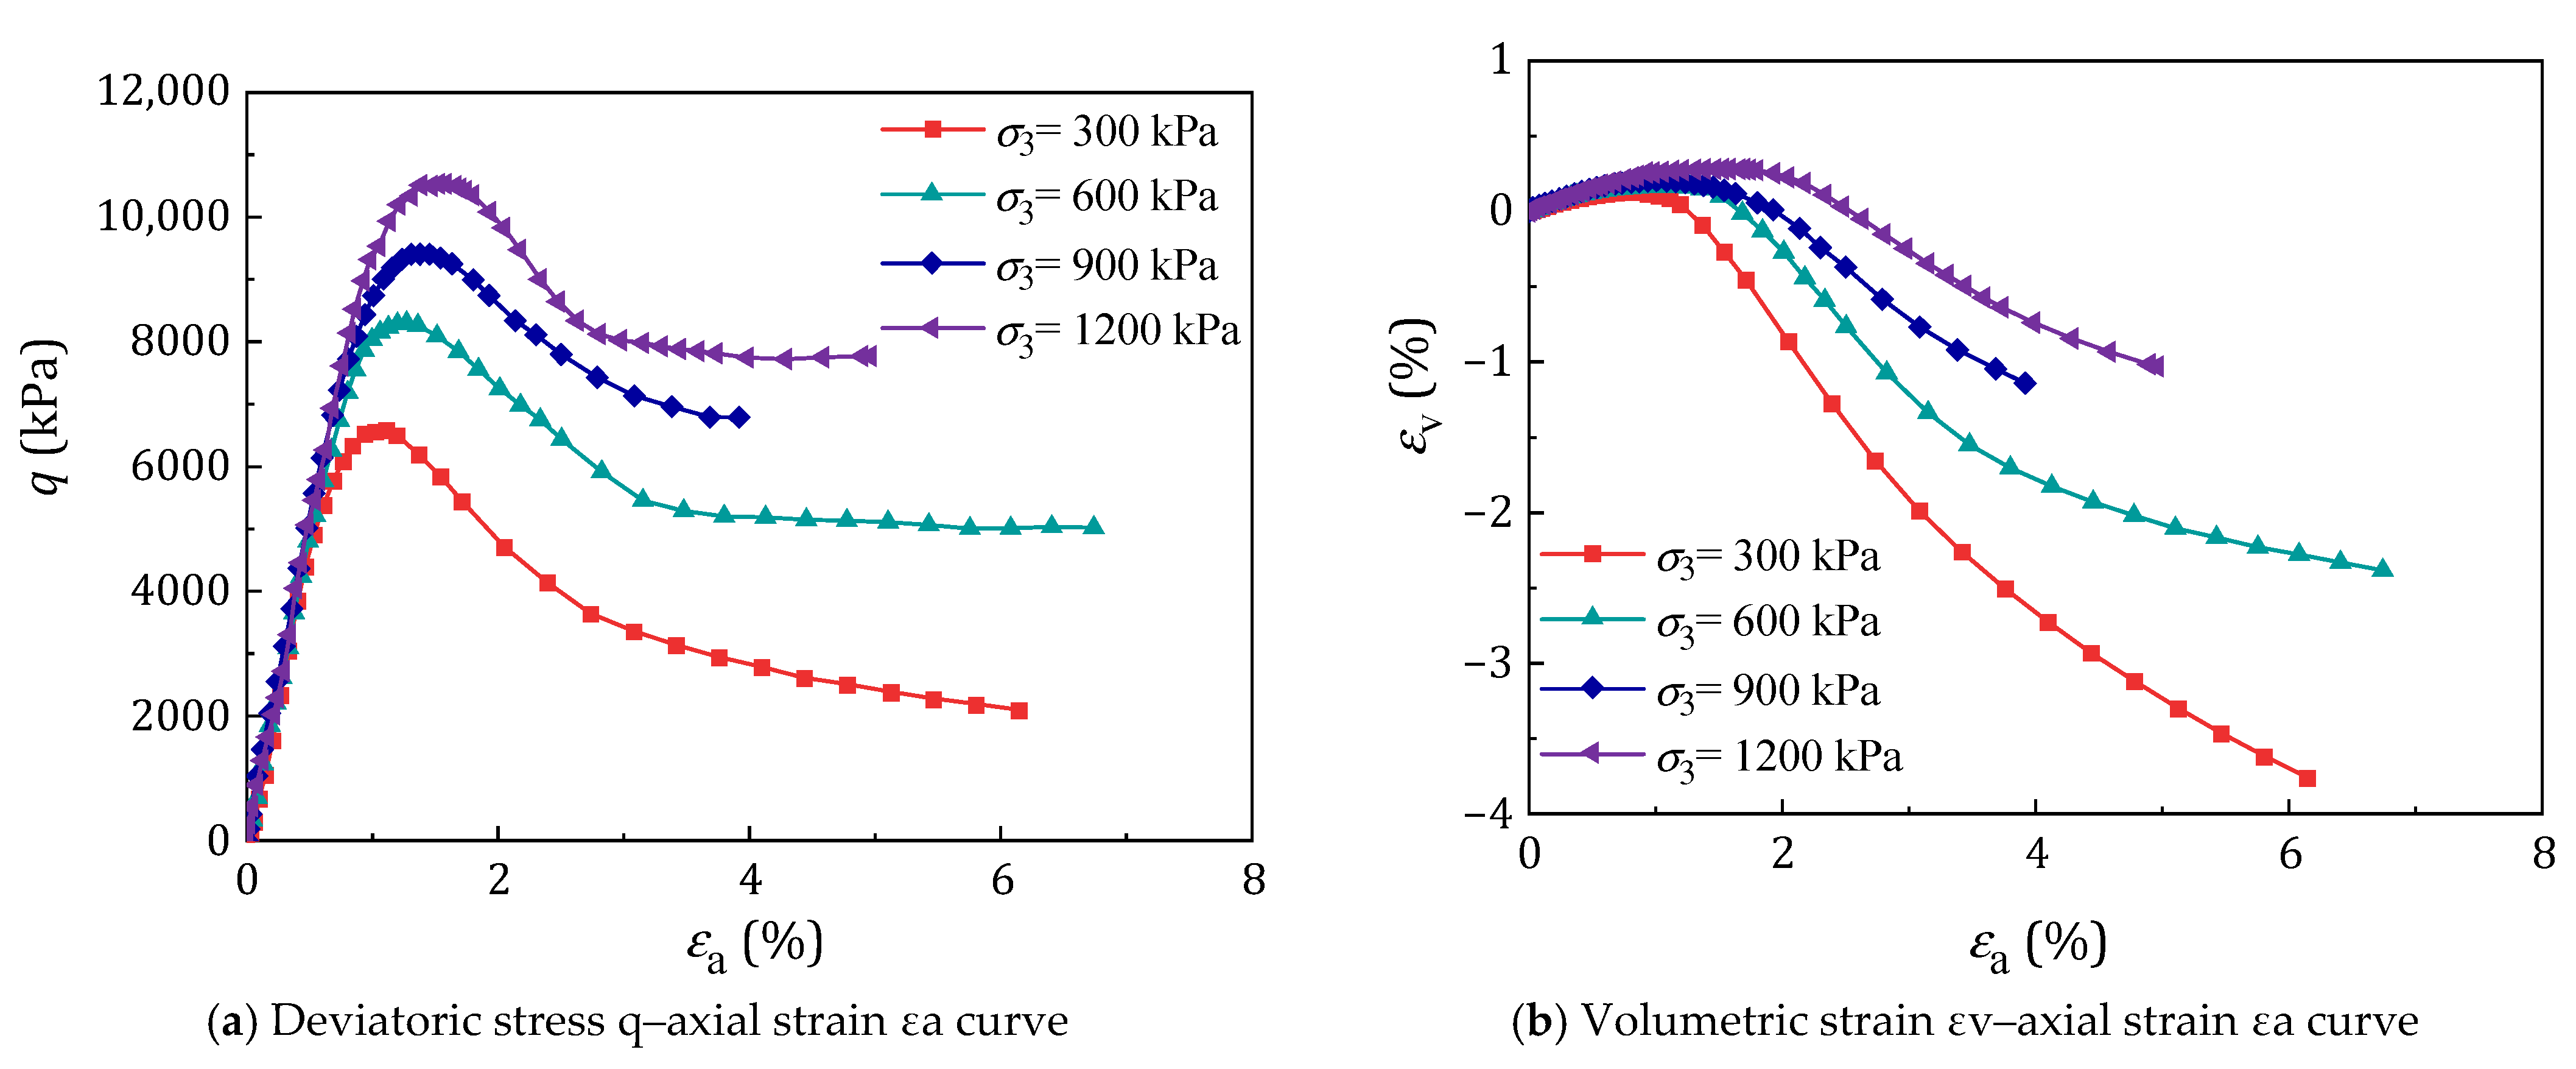
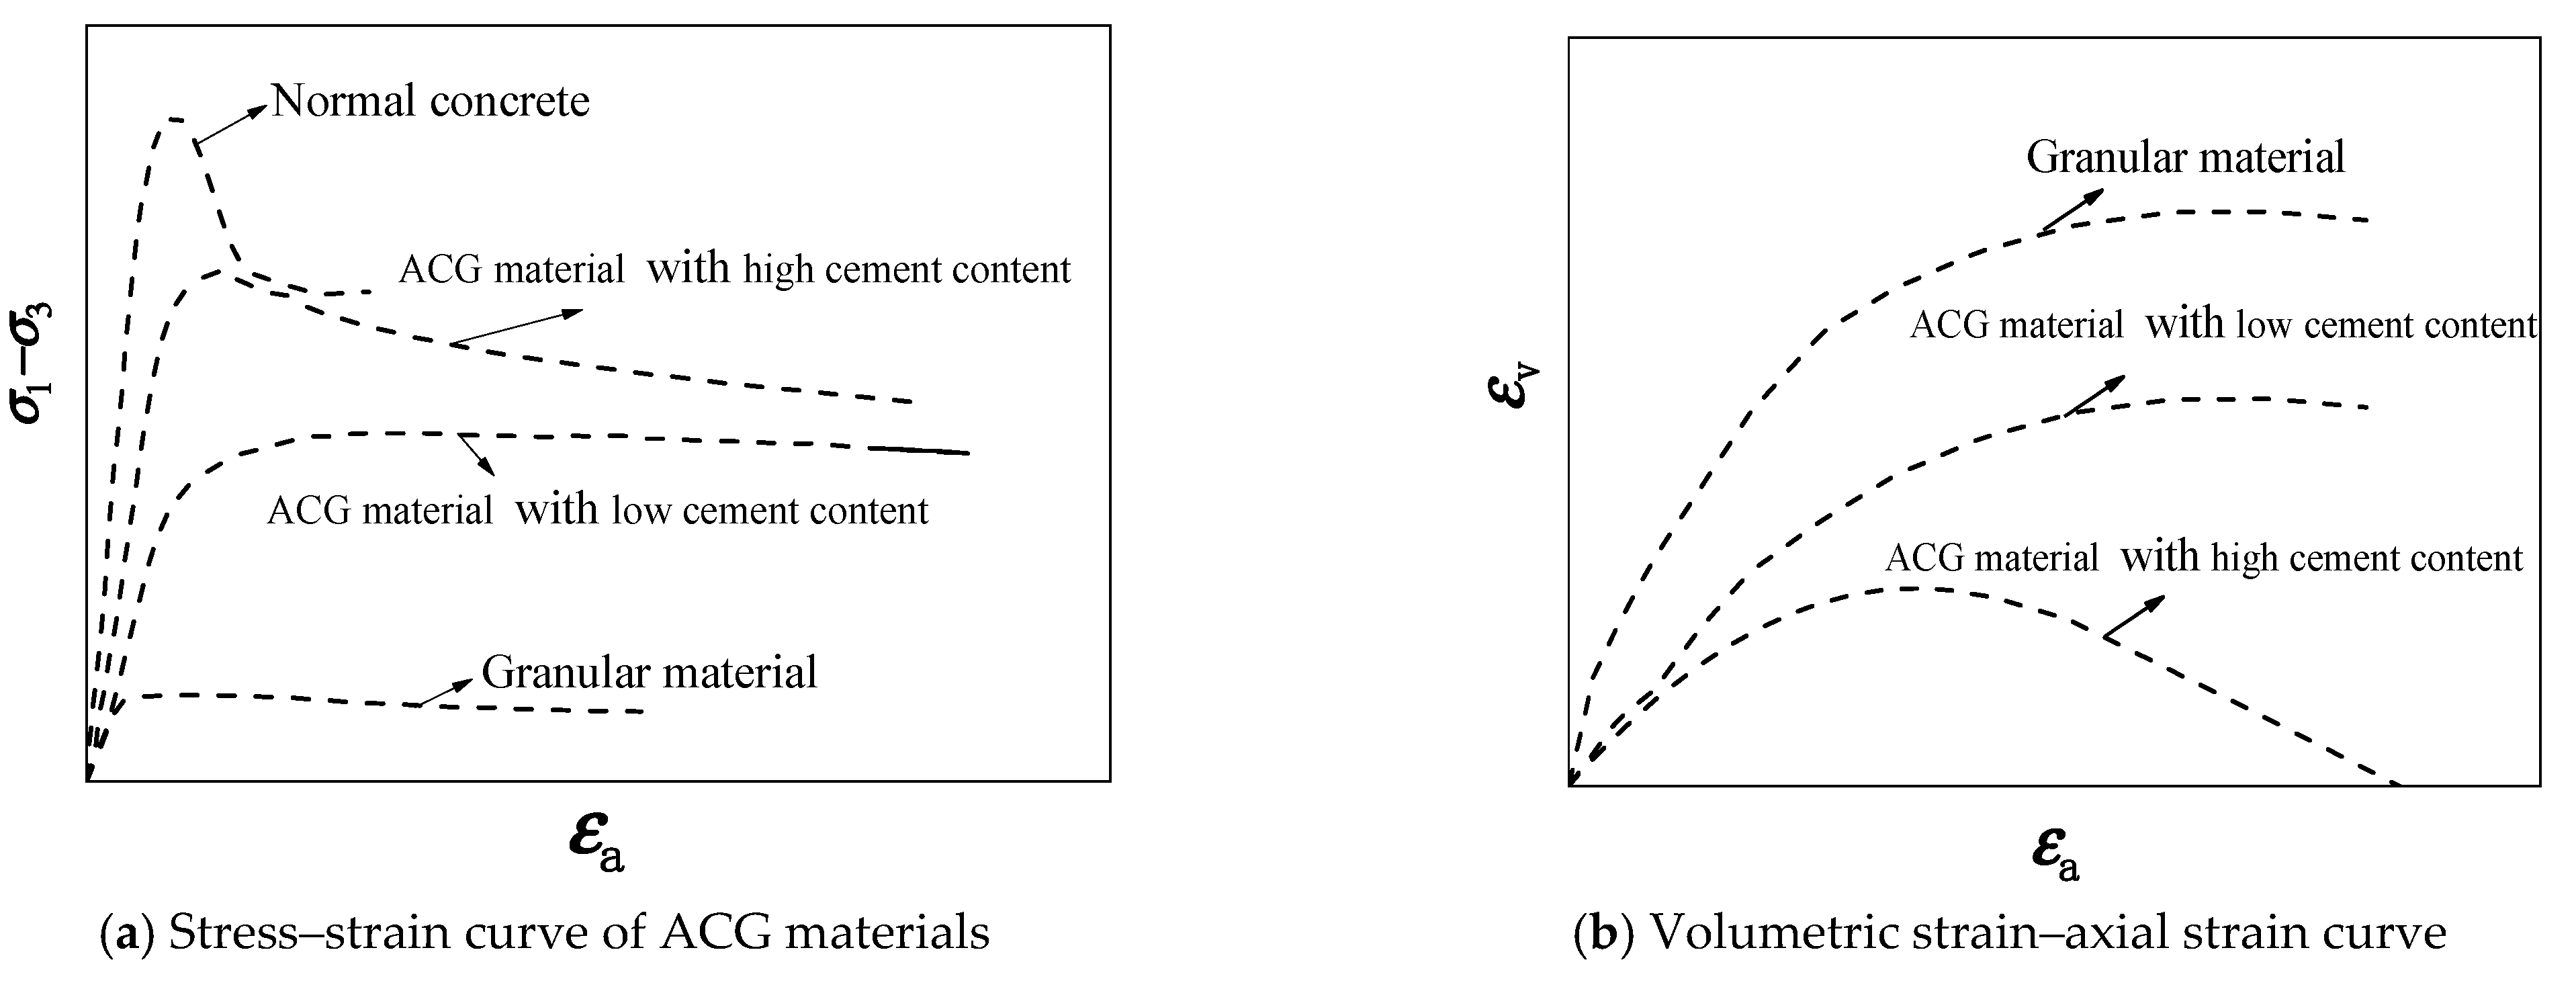
2.3.1. Analysis of Experimental Curves and Their Inherent Mechanisms
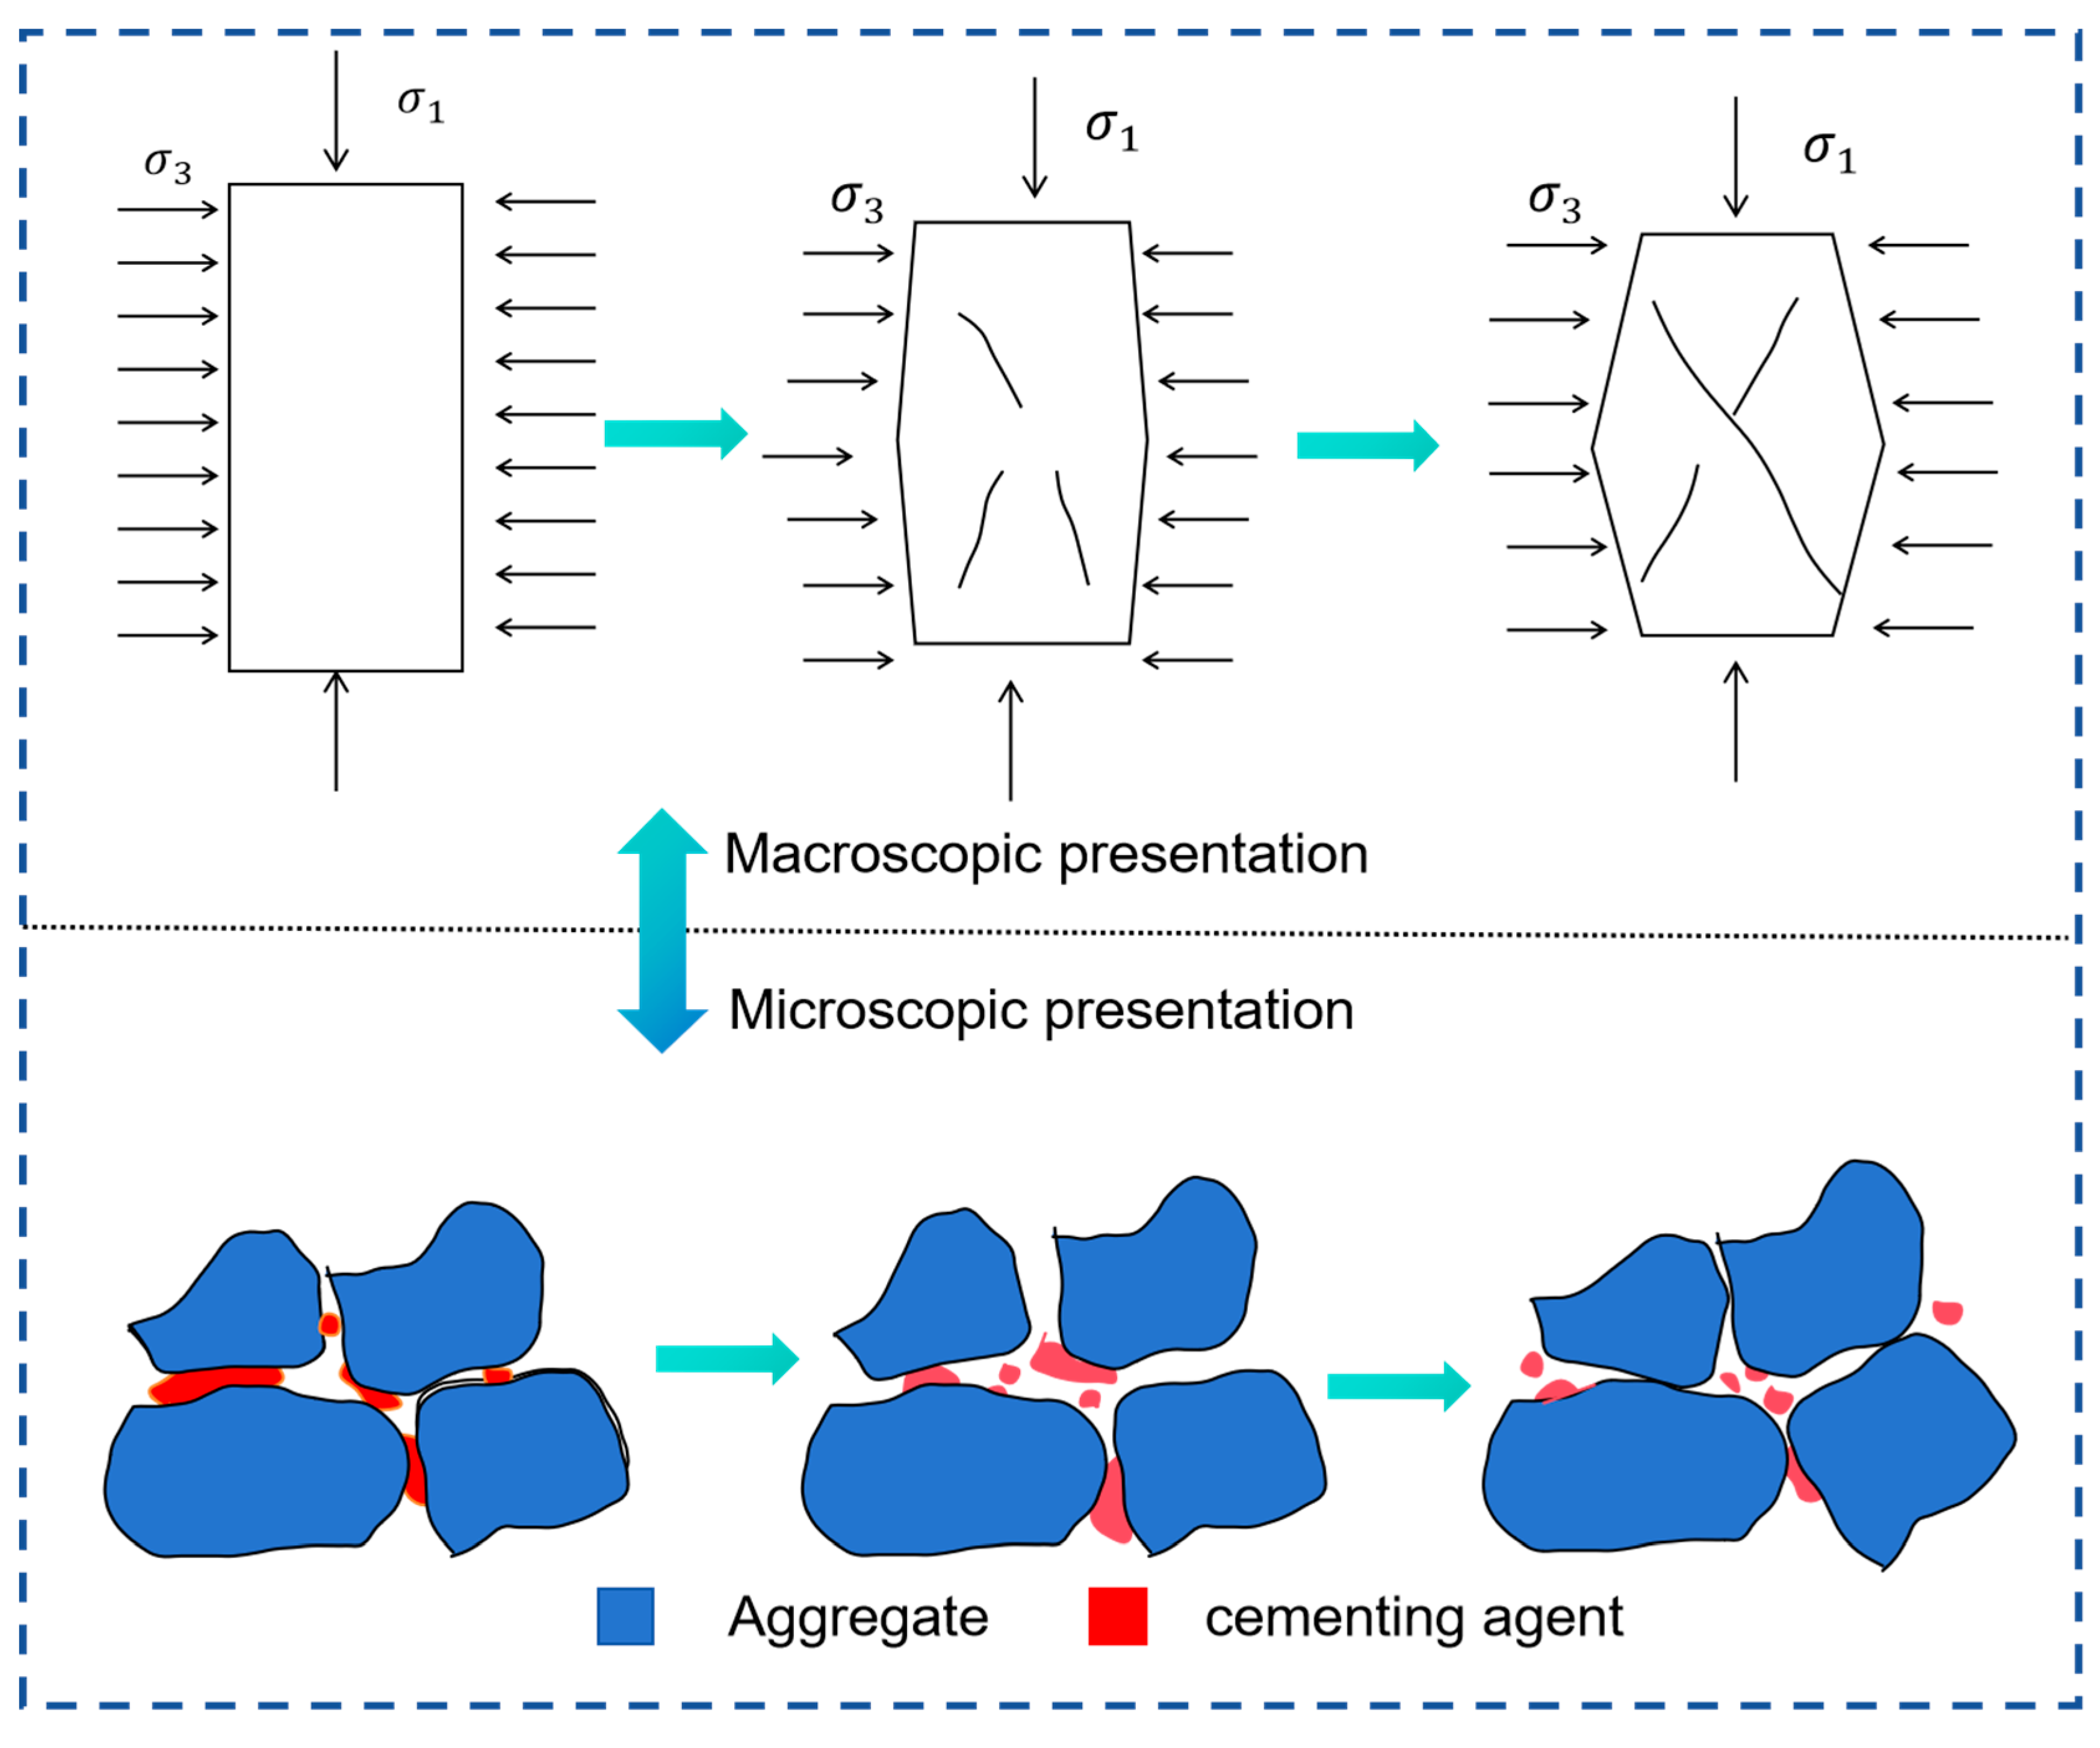
2.3.2. Micromechanical Interpretation
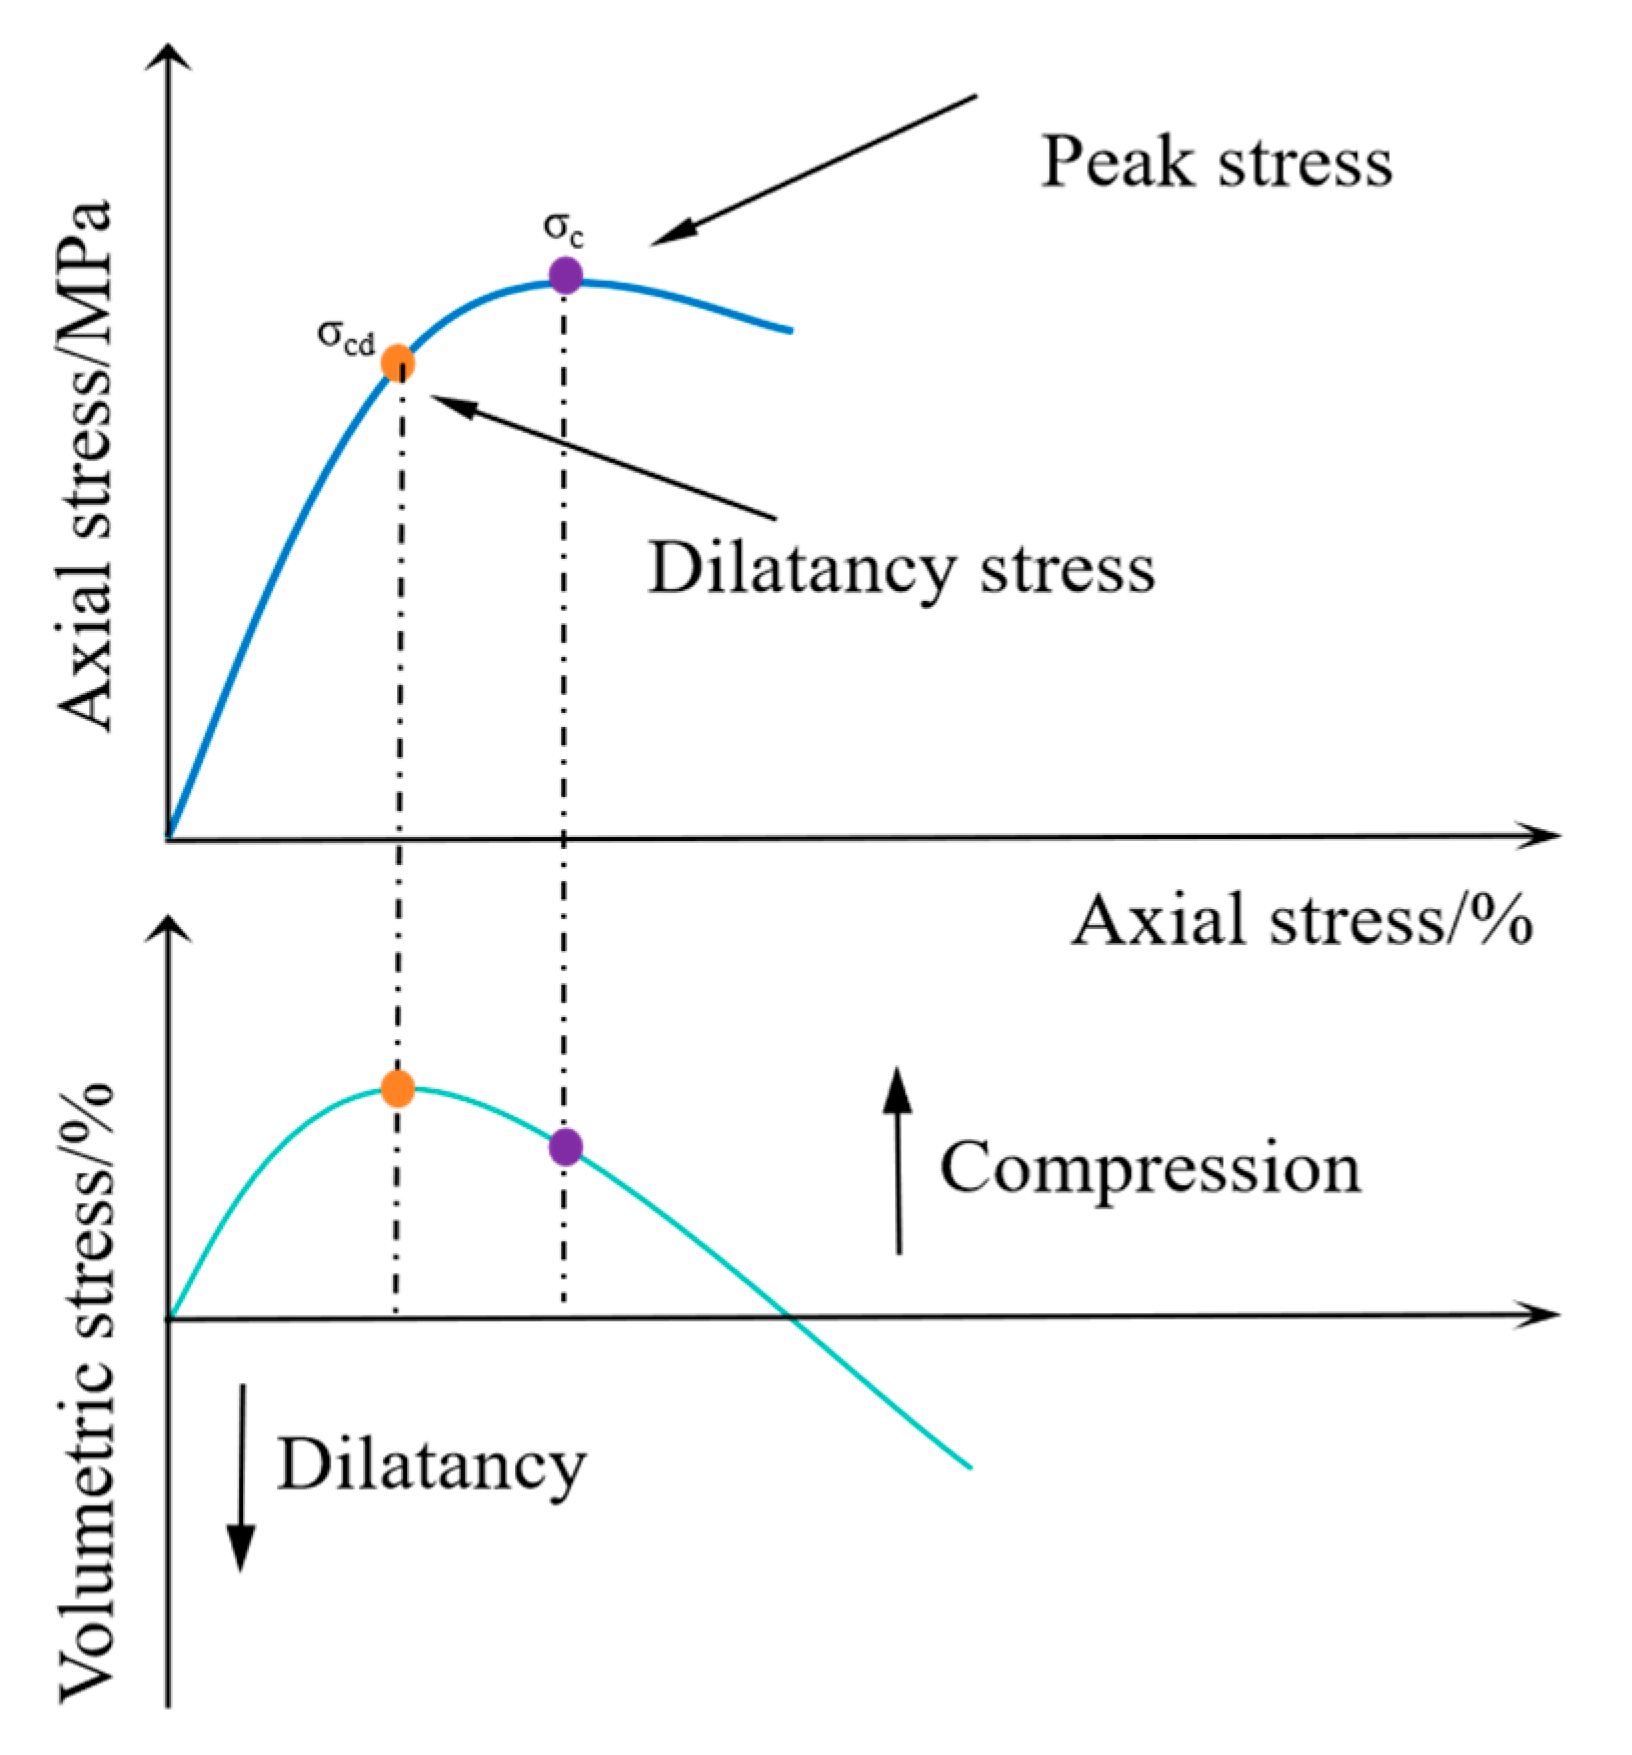
2.3.3. Evolution of Volumetric Strain Behavior
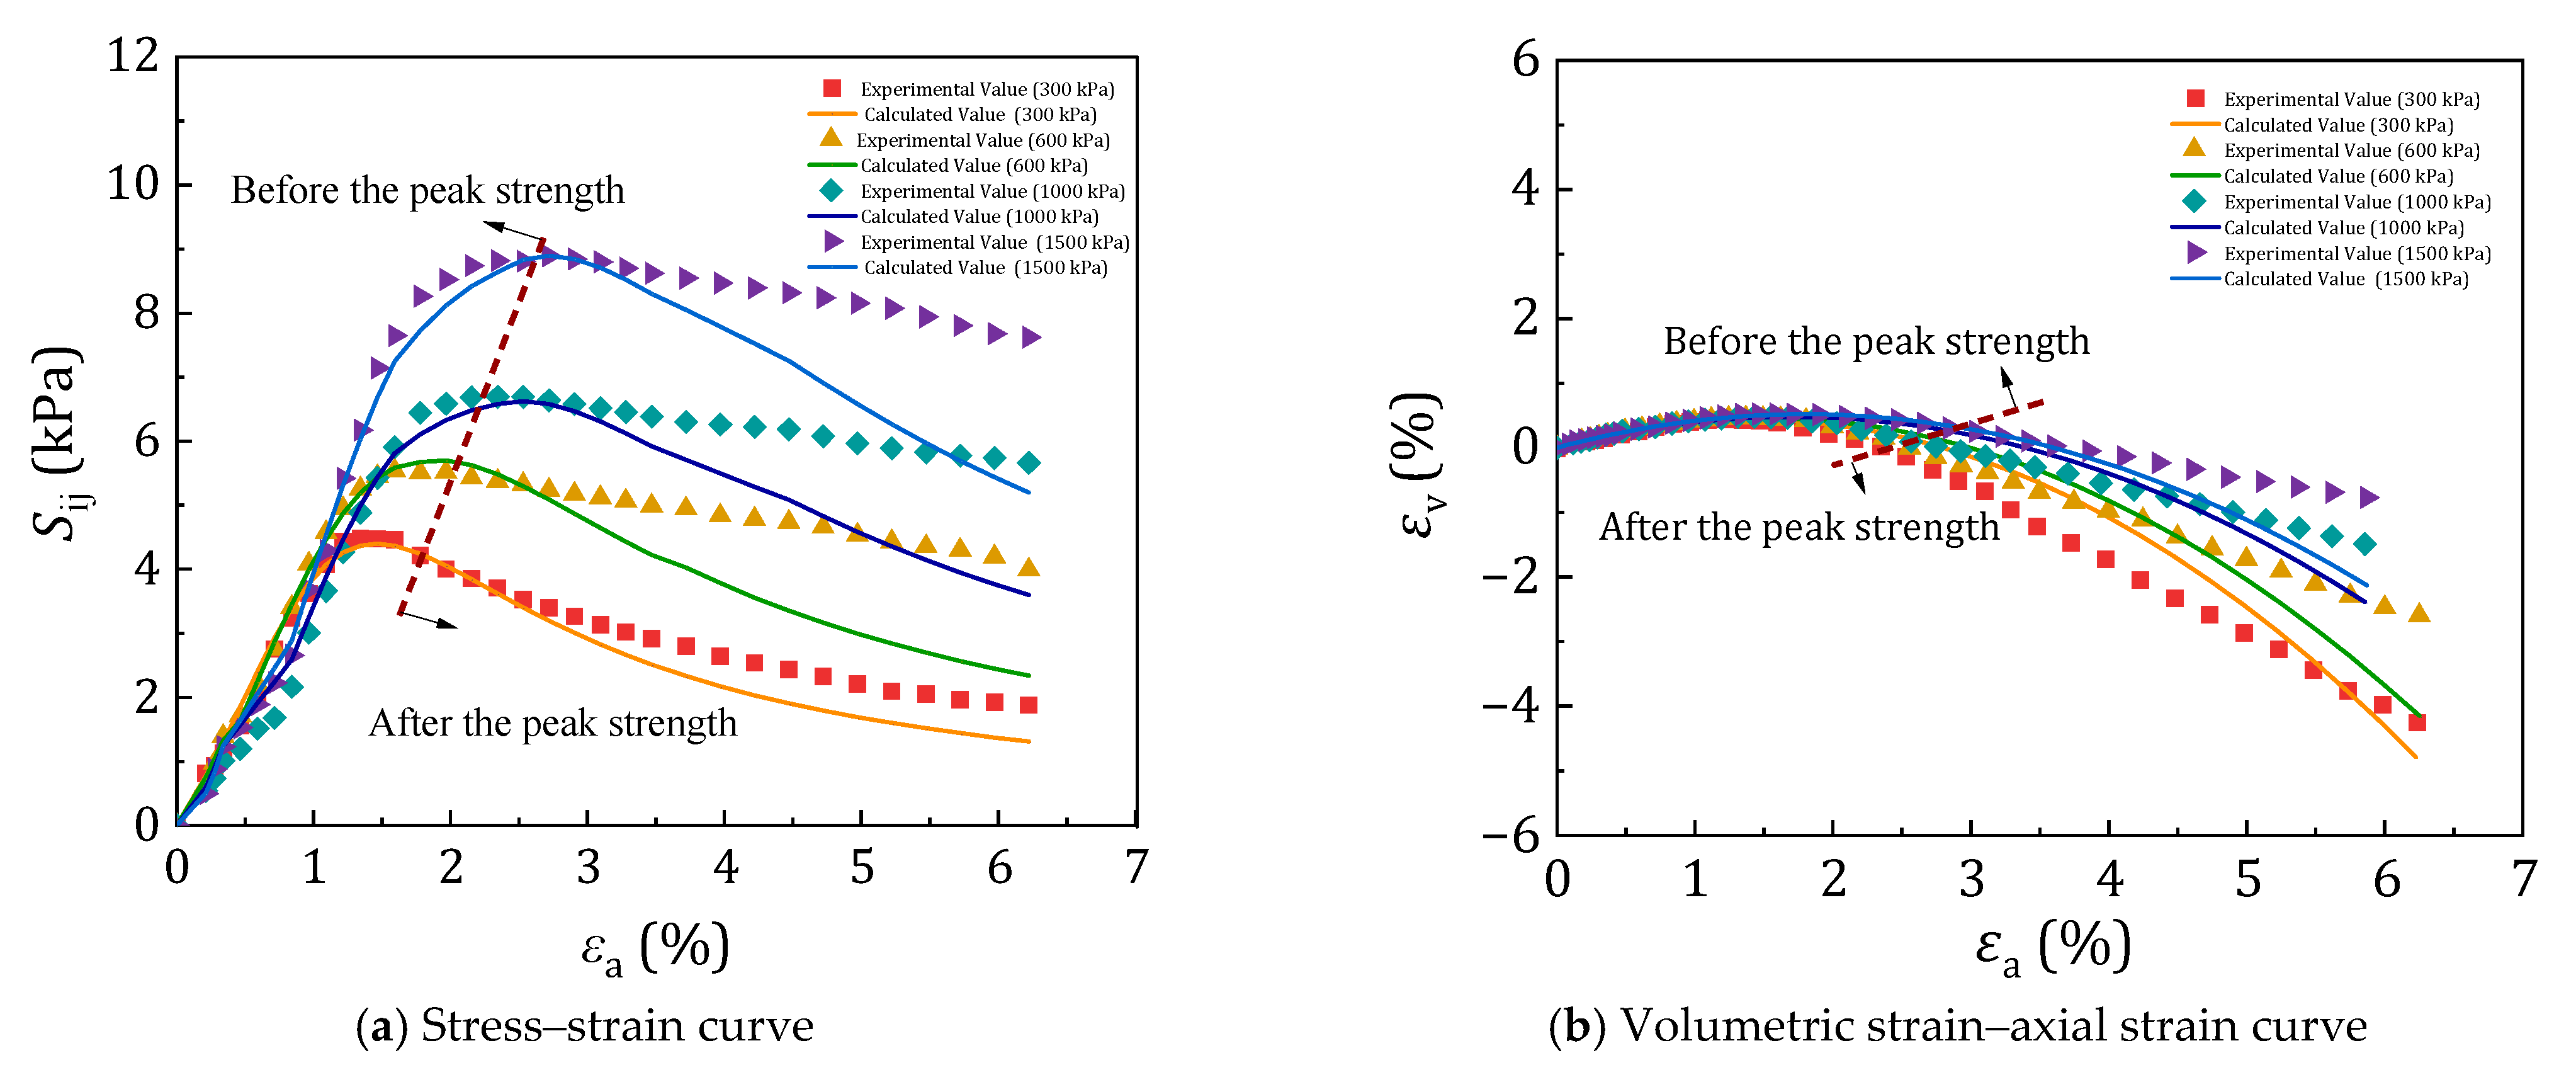
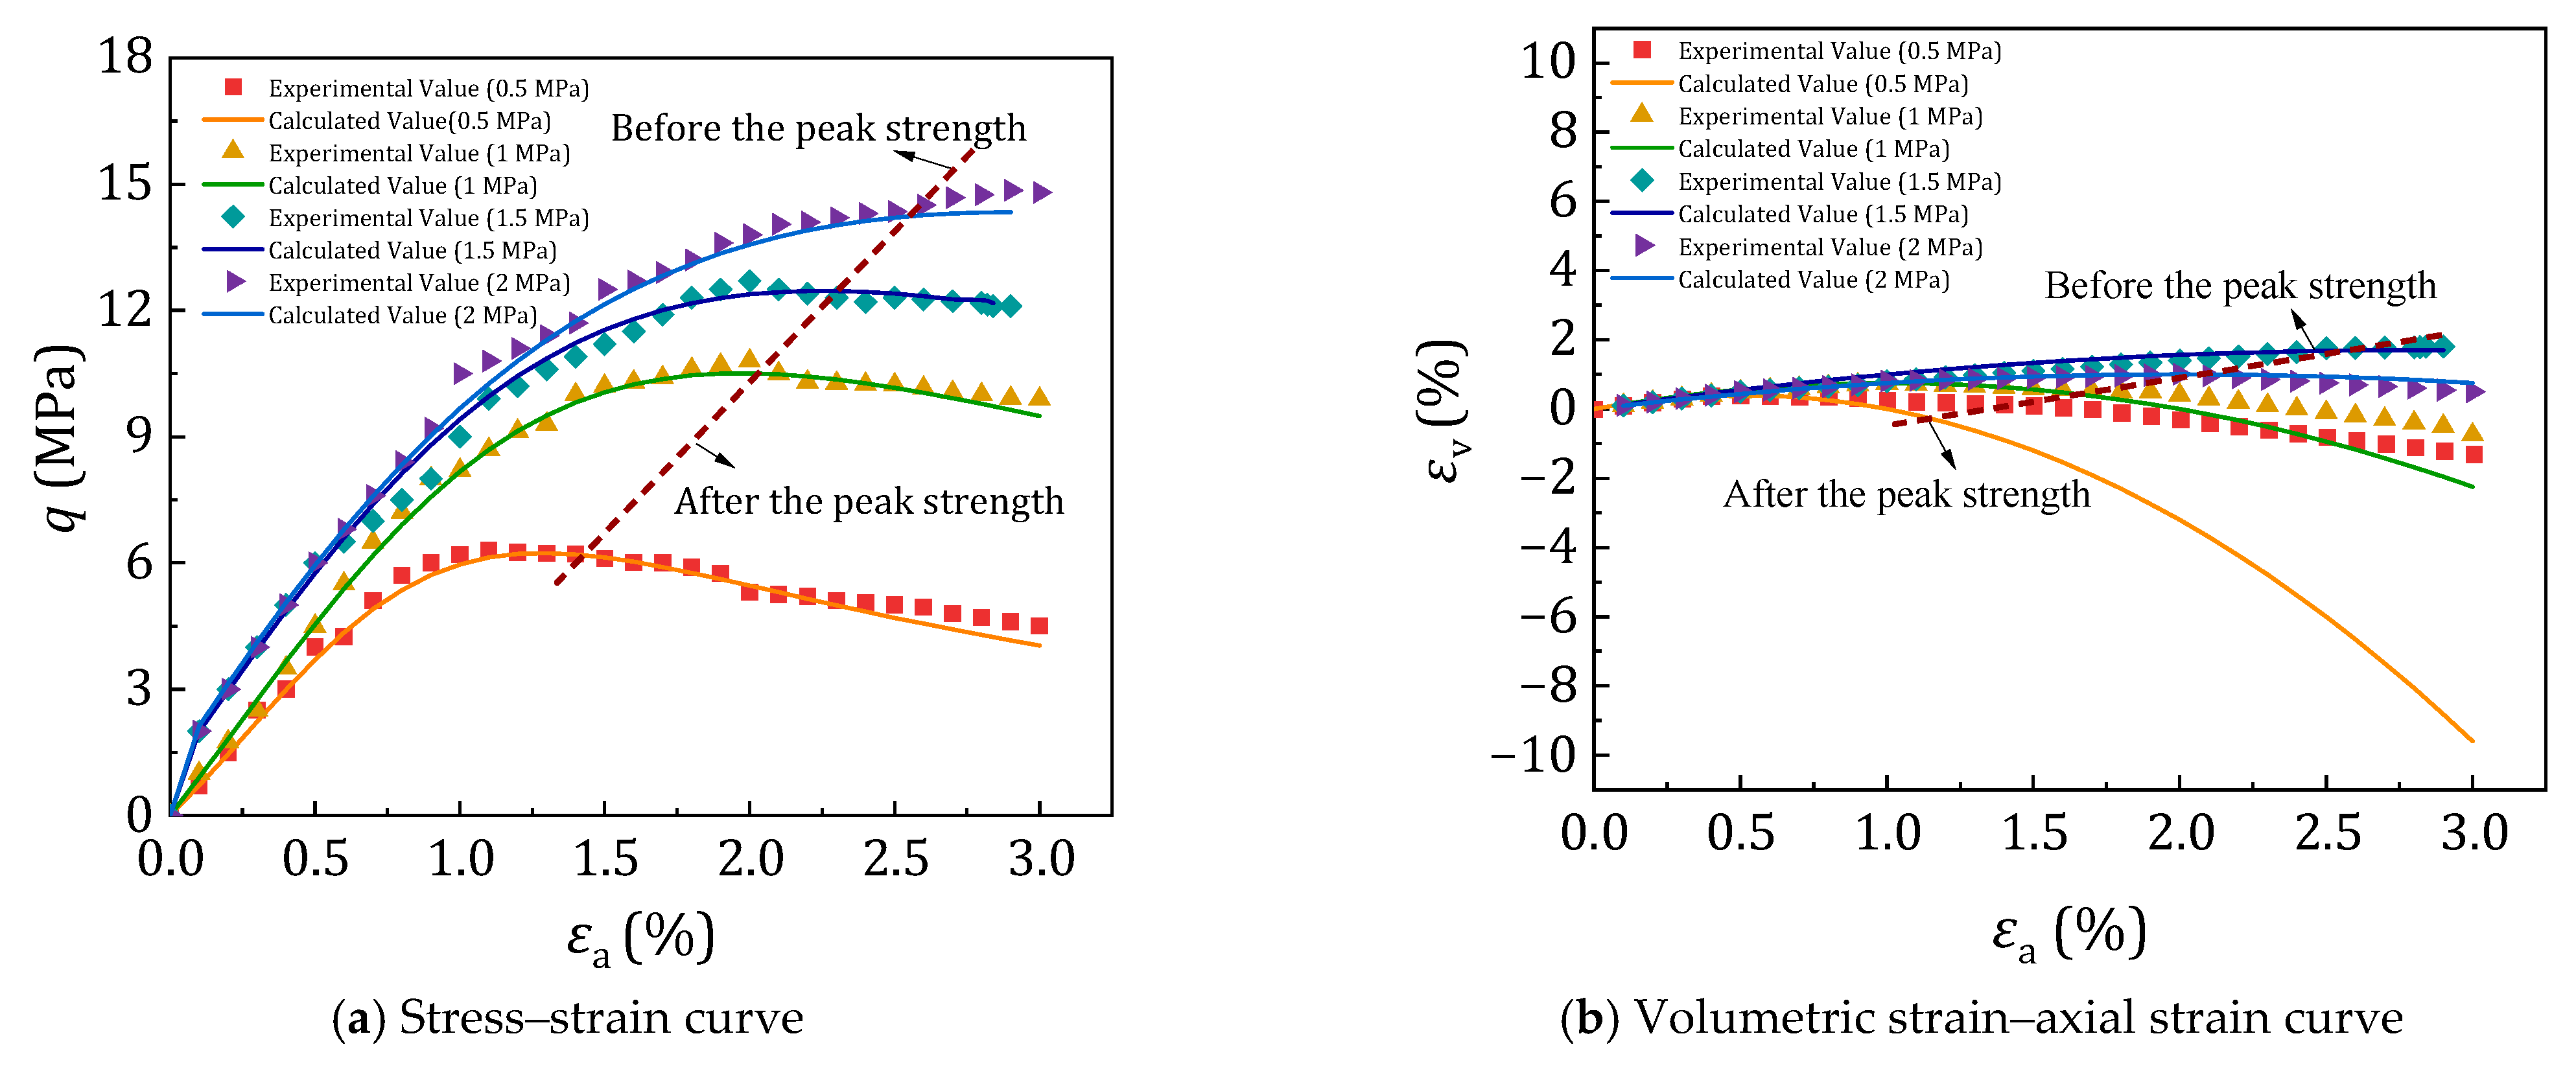
2.3.4. Numerical Simulation Validation and Failure Mode Observation
2.3.5. Influence of Cementitious Content on Failure Mode
2.4. Stress–Strain Equation
2.5. Study on Strength Characteristics
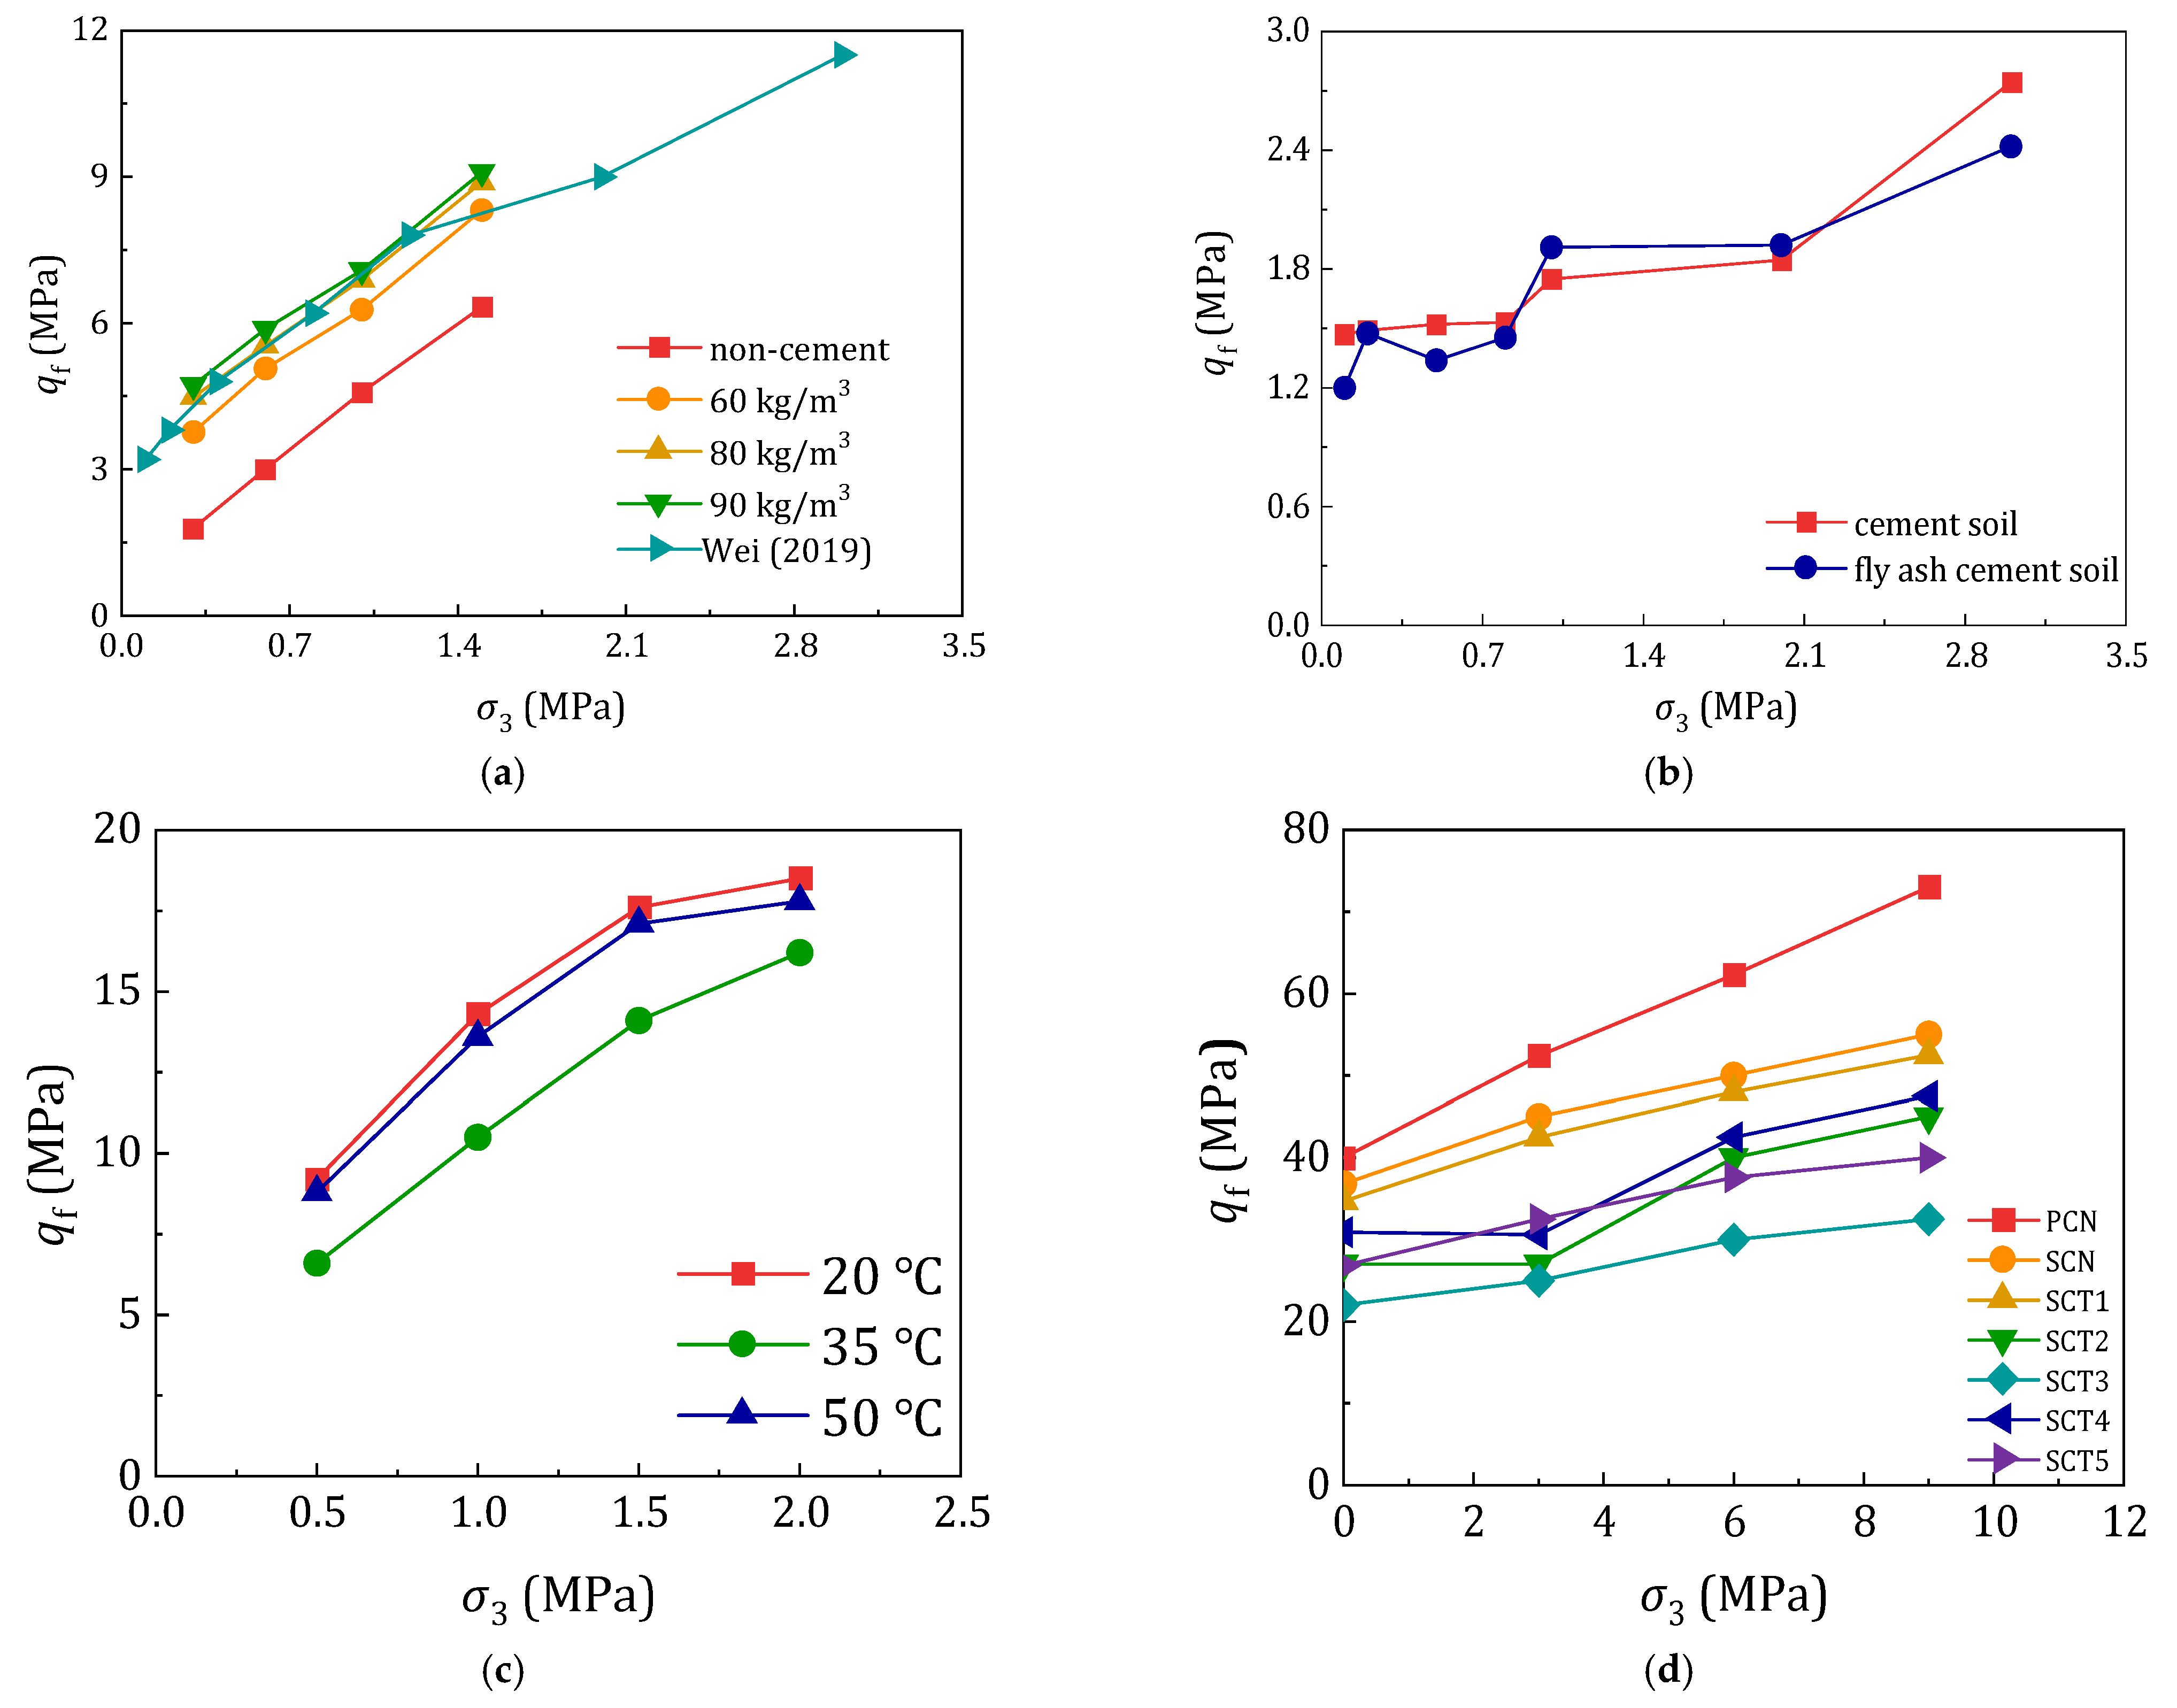
2.5.1. Analysis of the Relationship Between Peak Strength and Confining Pressure
2.5.2. Discussion on Applicability of Strength Criteria
2.5.3. Development and Validation of the Fitting Model
2.6. Deformation Parameters
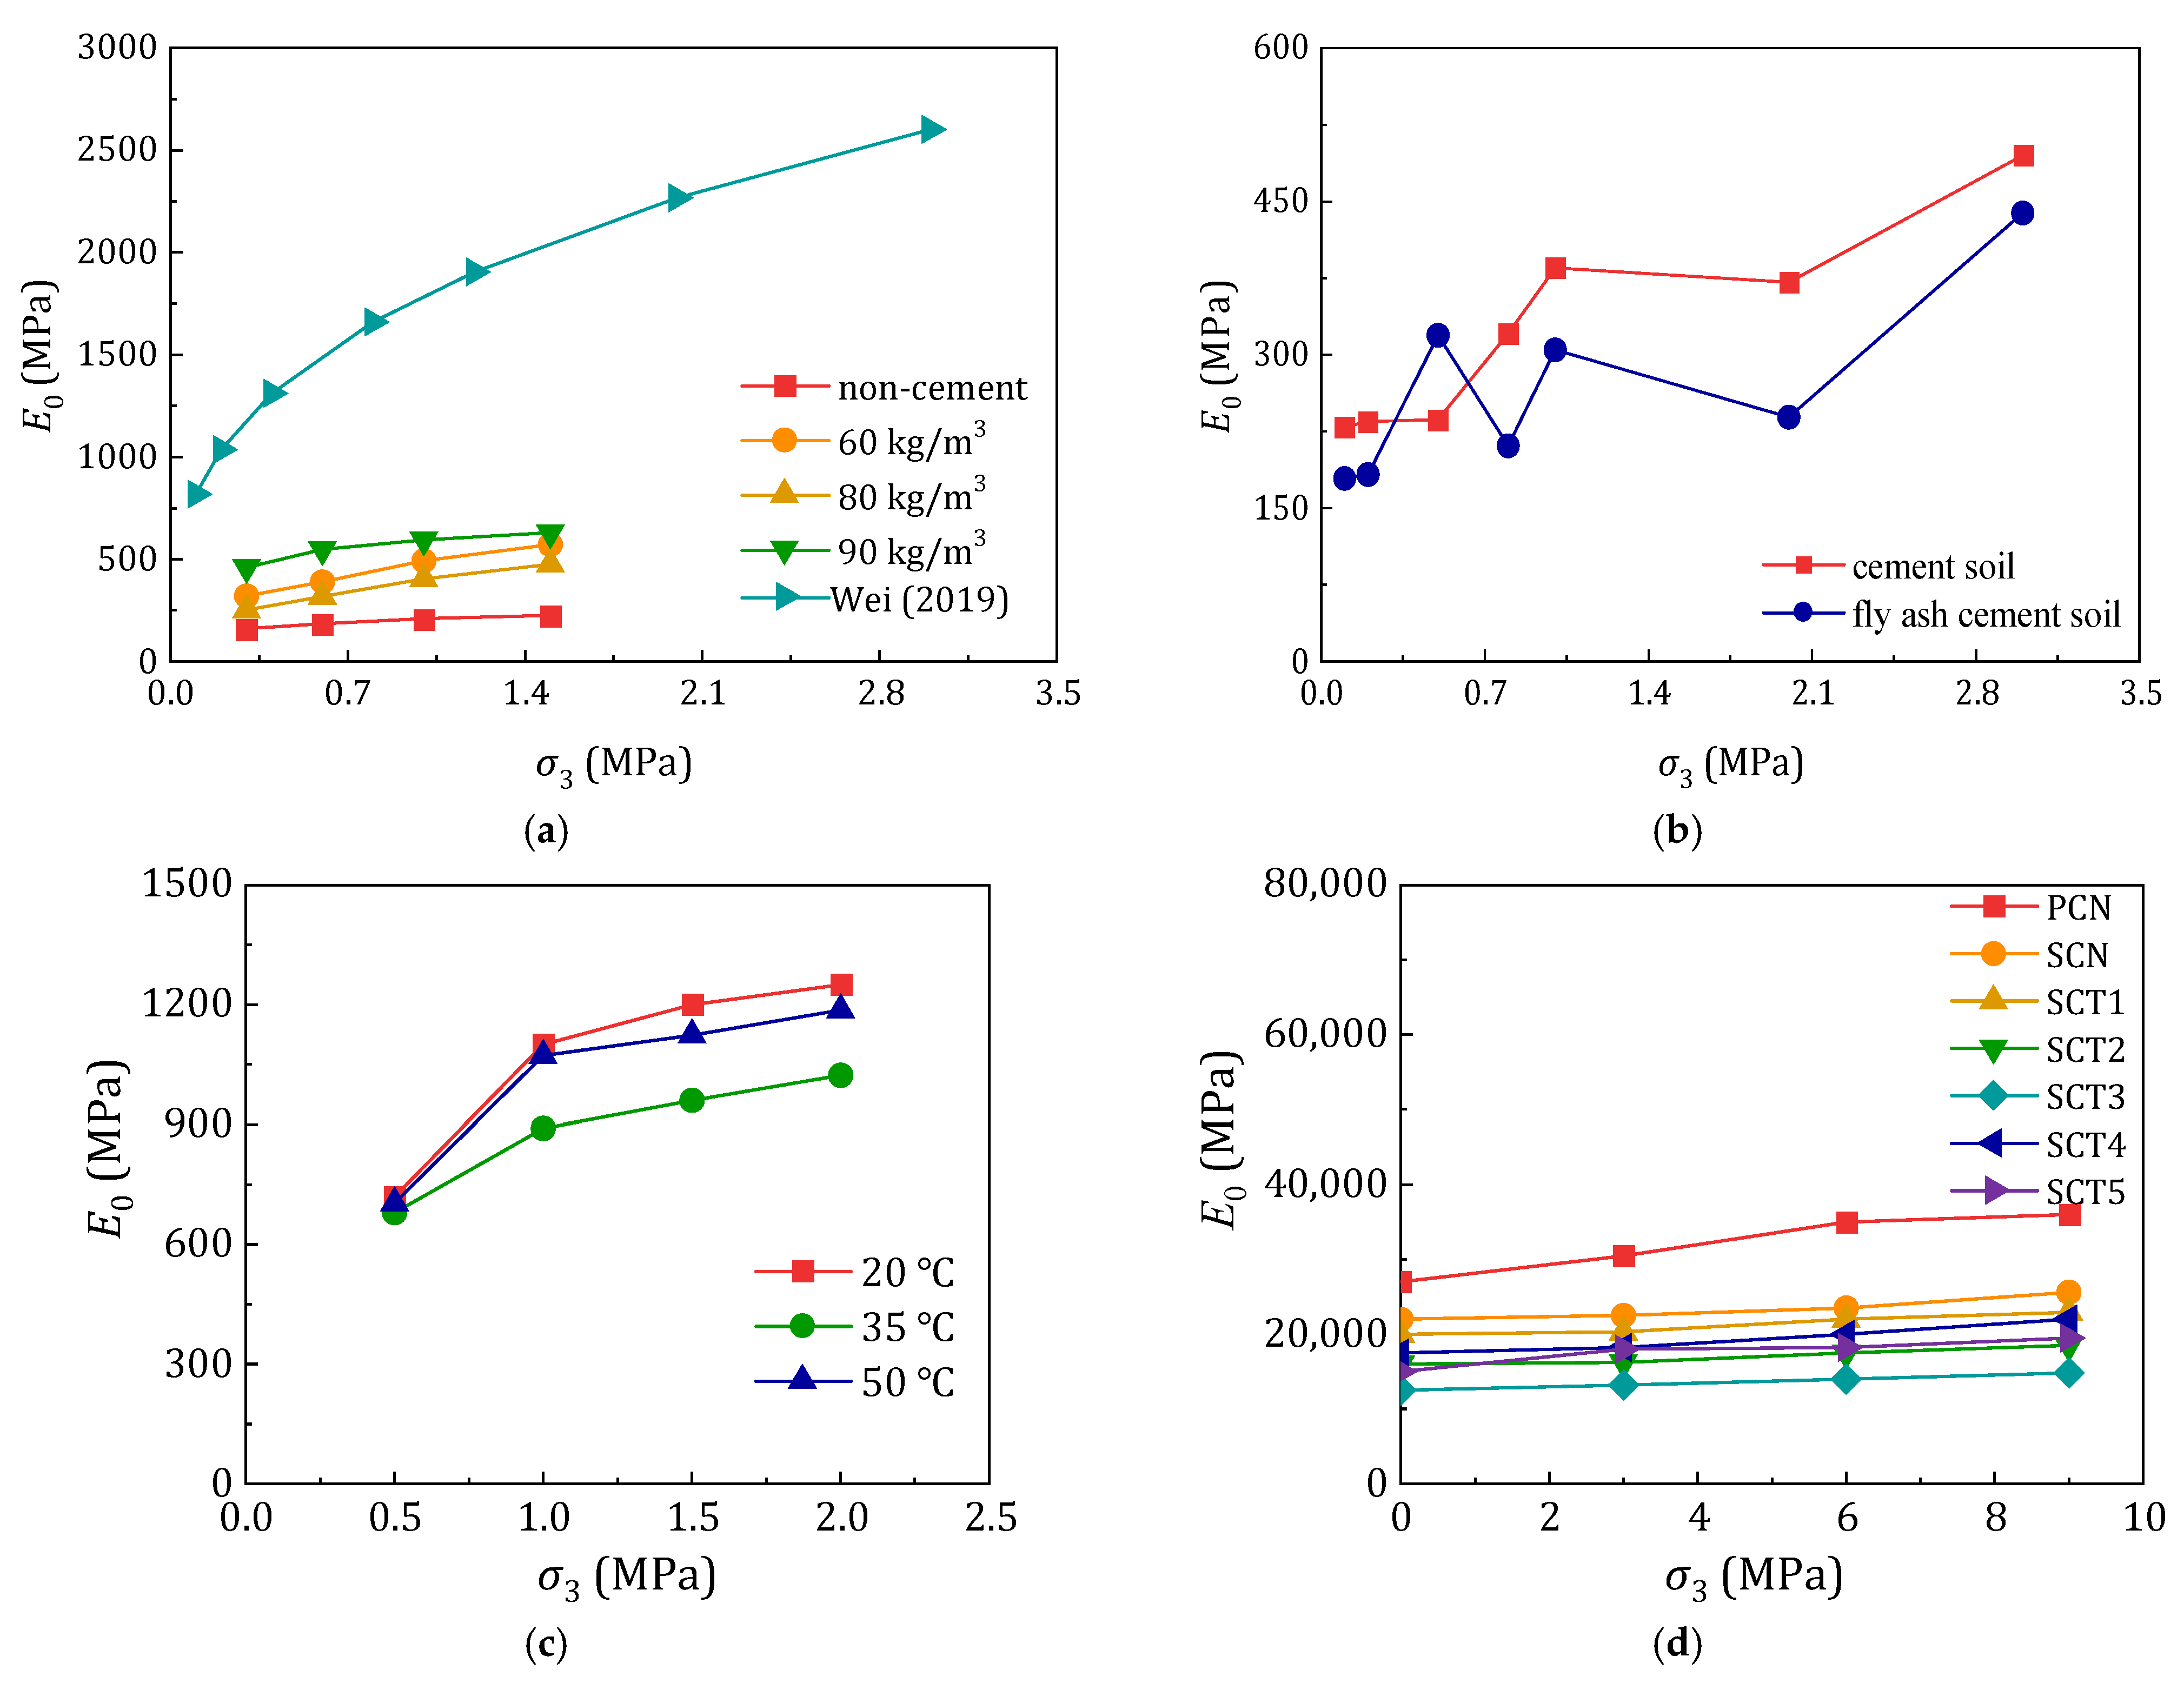
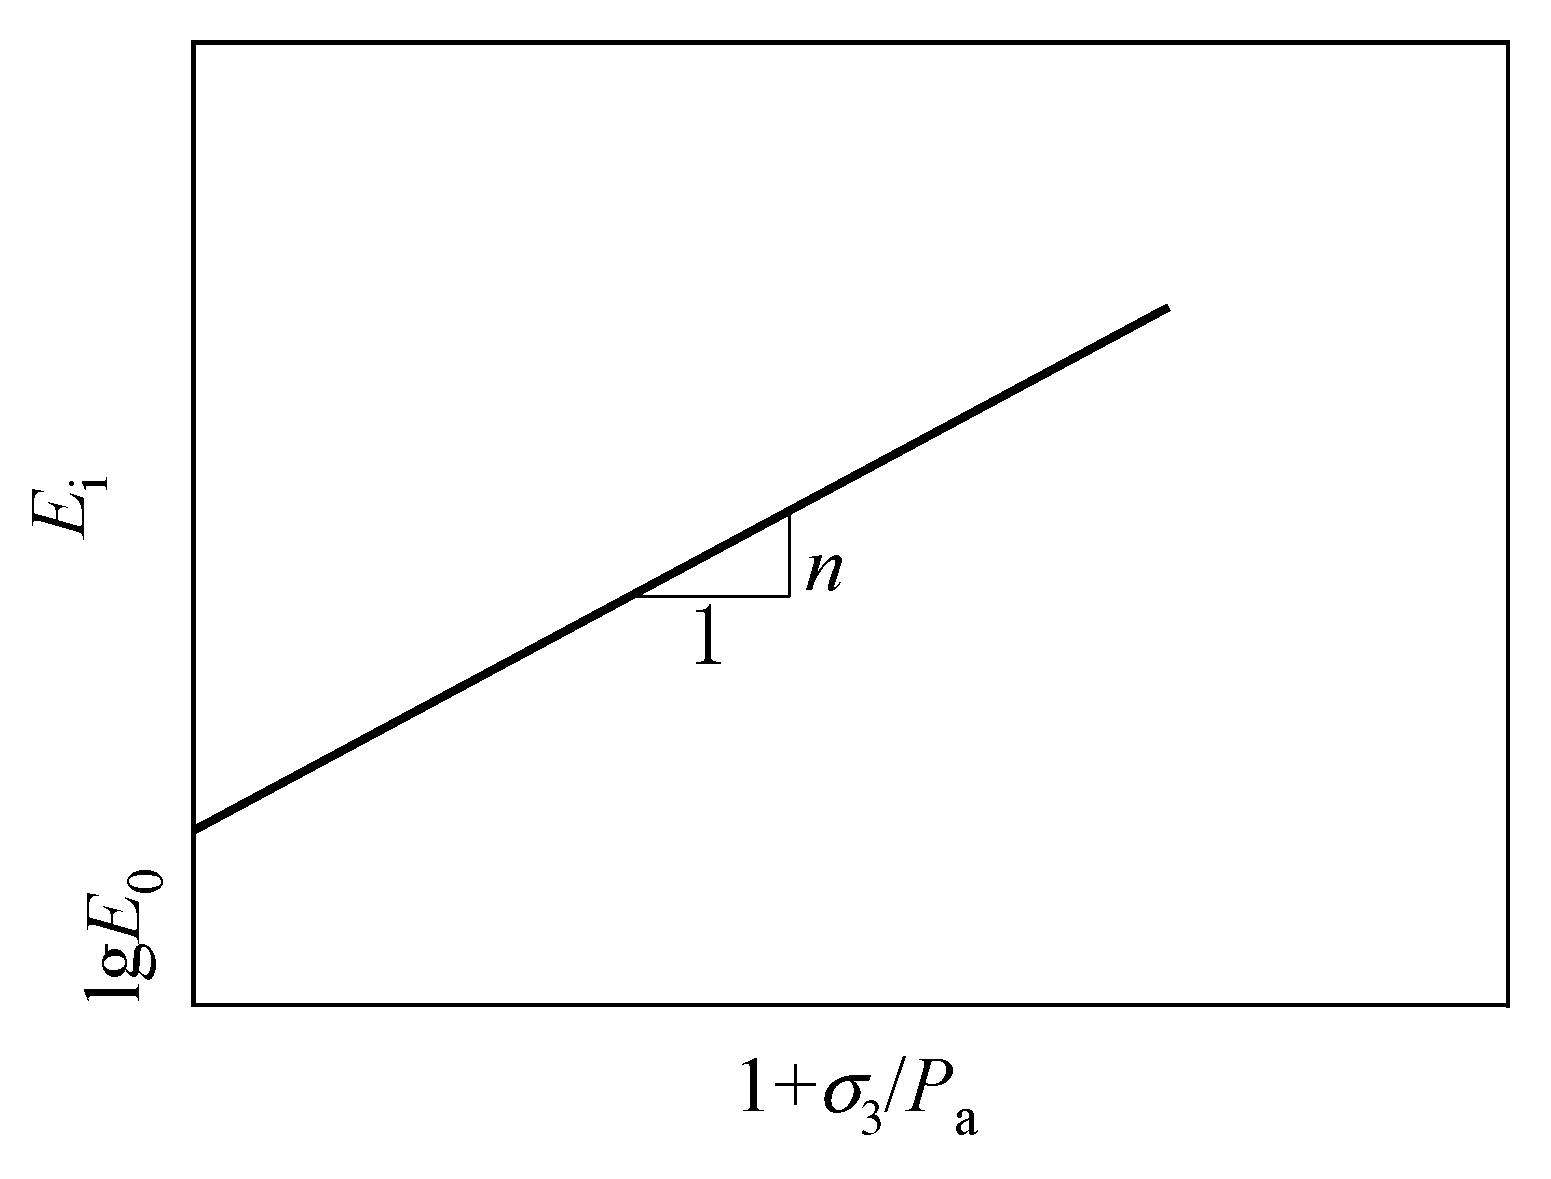
2.6.1. Tangent Modulus
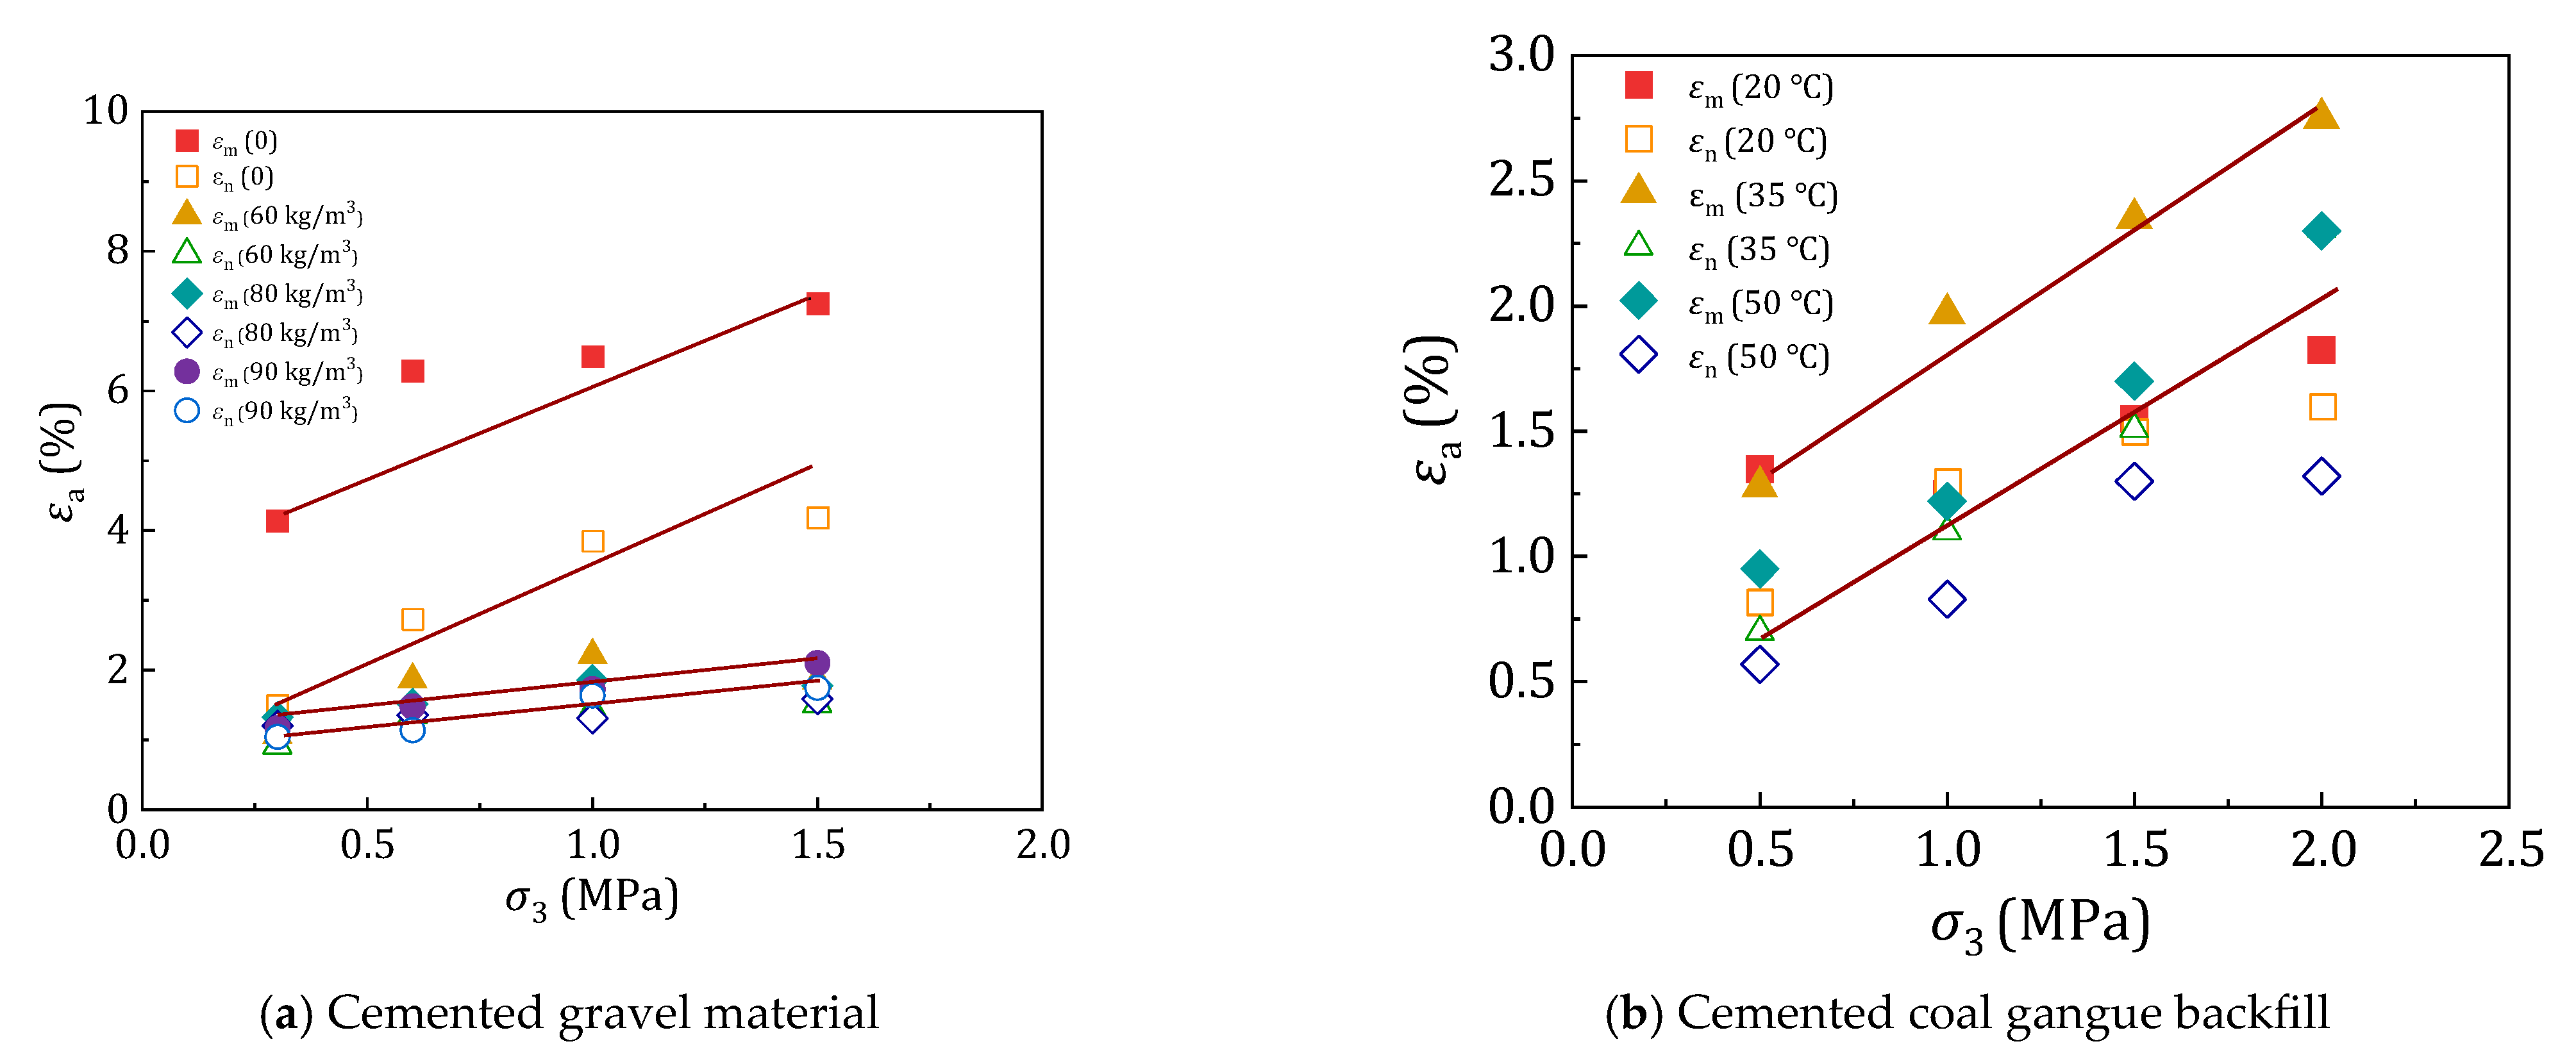
2.6.2. Dilation Characteristics
3. Constitutive Model Construction and Application
3.1. Constitutive Model Framework
3.2. The Direction of Plastic Flow and the Loading Direction
3.3. Plastic Modulus
3.4. Determination of Parameters
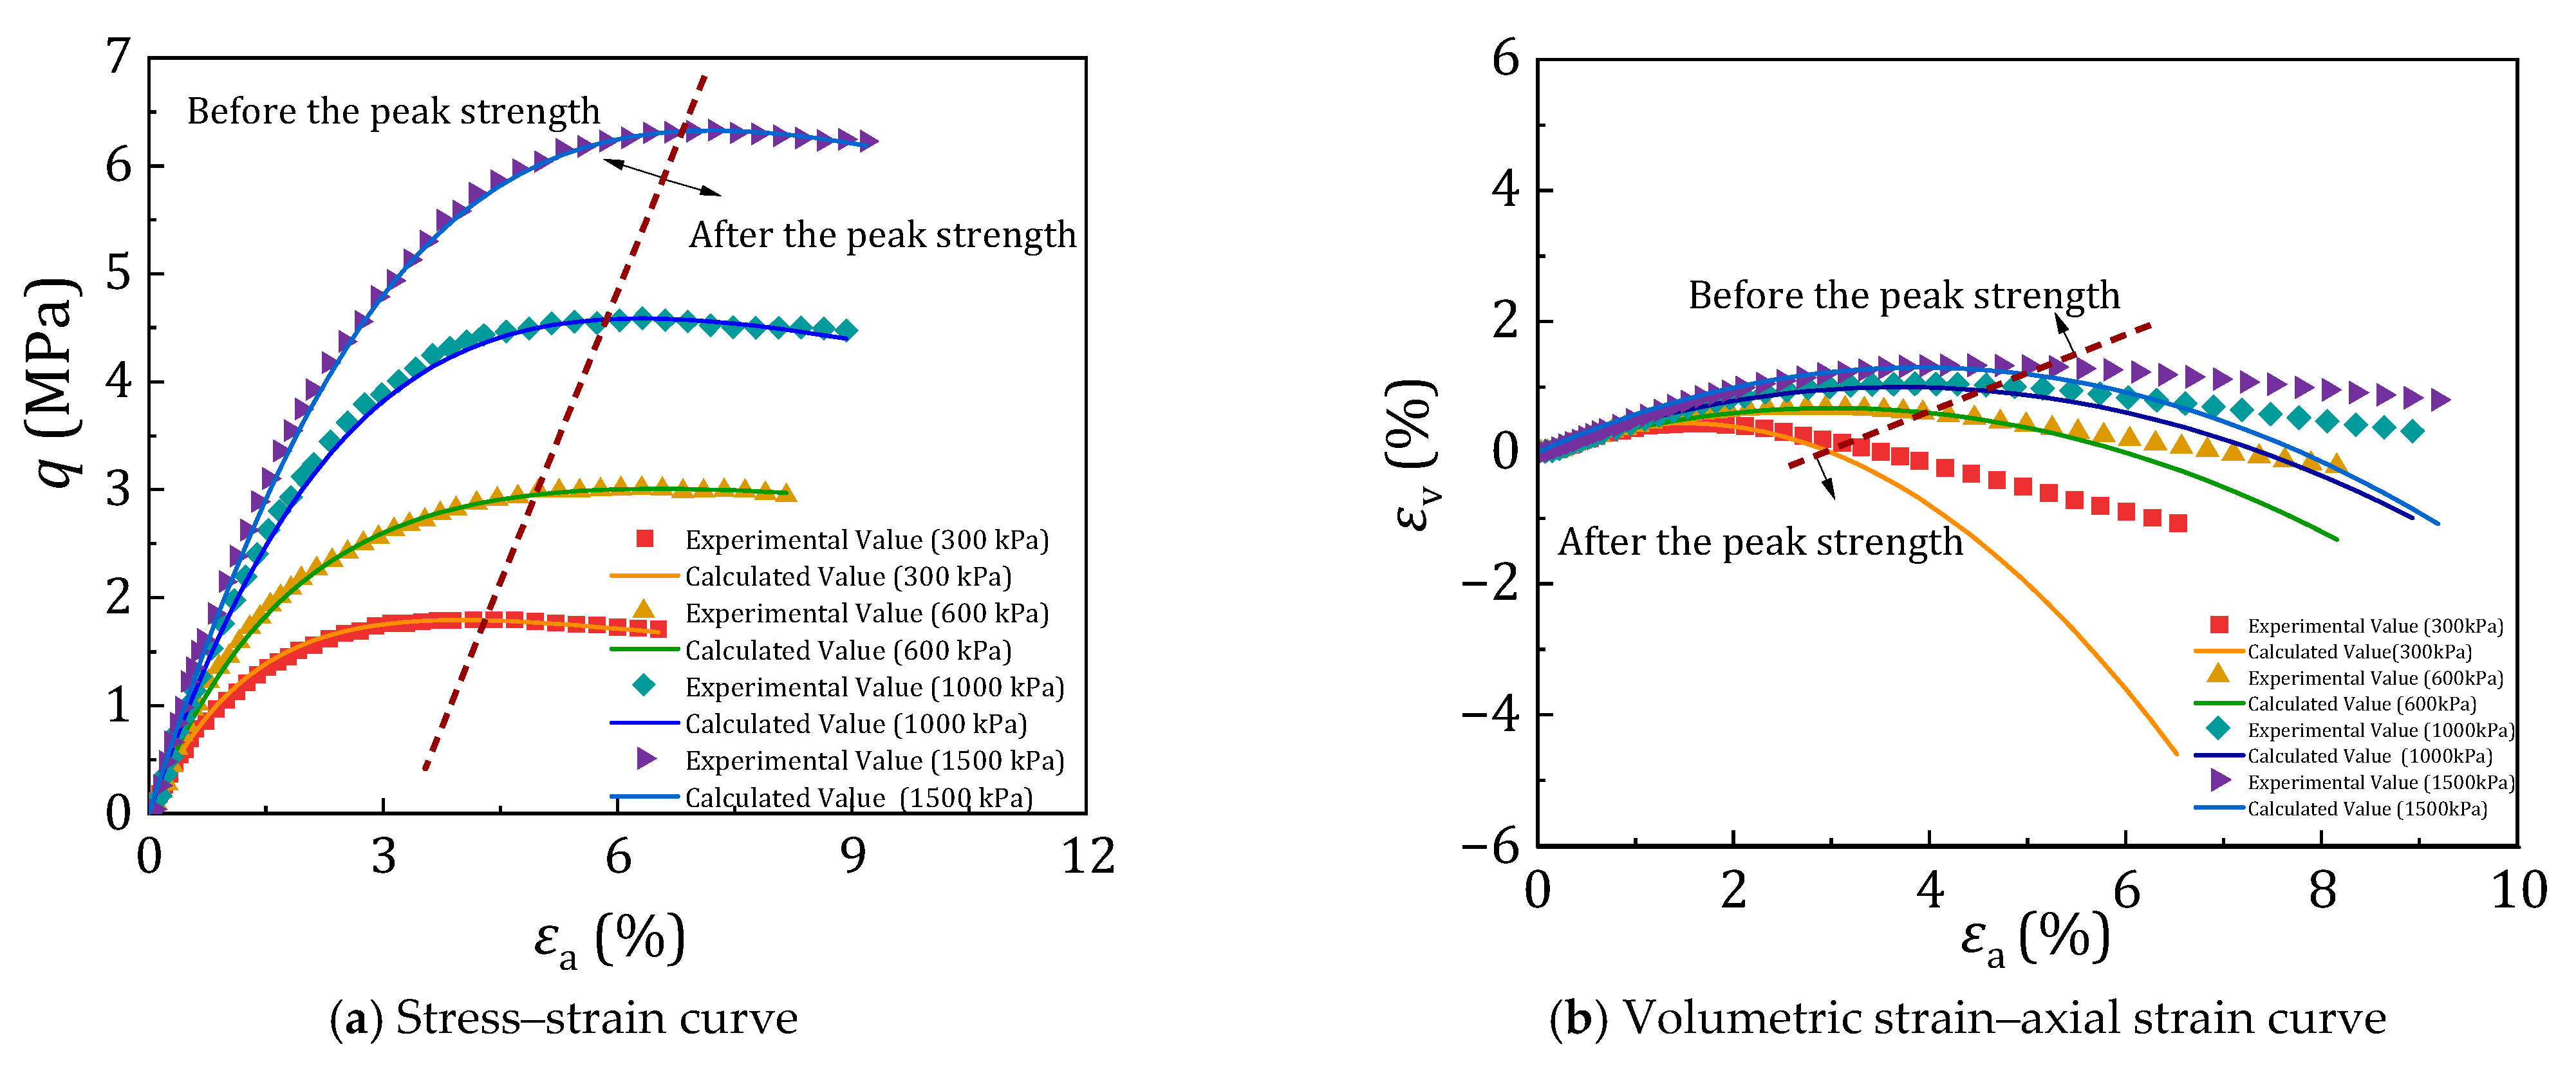
3.5. Model Validation
4. Conclusions
Author Contributions
Funding
Data Availability Statement
Conflicts of Interest
Abbreviations
| Nomenclature | εn | Axial strain corresponding to the peak volumetric strain | |
| μt | Tangent volumetric ratio | ||
| ε1 | Axial strain | Axial strain corresponding to the peak strength | |
| ε3 | Lateral strain | Dep | Elastoplastic matrix |
| εv | Volumetric strain | a, b, c, d | Fitting coefficient. |
| Ee | Elastic modulus (MPa) | εvd | Peak volumetric strain |
| Ei | Initial modulus (MPa) | D | Shear dilation rate |
| σ1 | Axial stress (MPa) | Mz | Material parameter |
| σ3 | Confining stress (MPa) | η | Ratio of shear stress q to mean stress p |
| Pa | Standard atmospheric pressure. | E0, n | Parameters of elastic element |
| H | Plastic modulus | A, B, m, λ0, d0, λ1, d1, λ2, d2 | Parameters of plastic element |
| ng | Plastic flow direction | Plastic volumetric constraint | |
| Plastic axial strain | RZ | Shear dilation transition position | |
| R | Ratio of the major principal stress to the minor principal stress | Et | Tangent modulus |
| De | Elastic matrix | Kronecker delta | |
| nf | Loading direction | q | Shear stress; q = σ1 − σ3, Under triaxial test conditions |
| Ce | Flexibility matrix | a0, b0, a1, b1, c1 | Fitting coefficient |
| dg | Shear dilation ratio | qf | Peak strength |
| sij | Deviatoric stress, | p | mean stress; p = (σ1 + 2σ3)/3, Under triaxial test conditions. |
References
- Al-Kheetan, M.J.; Rahman, M.M.; Chamberlain, D.A. Remediation and protection of masonry structures with crystallising moisture blocking treatment. Int. J. Build. Pathol. Adapt. 2018, 36, 77–92. [Google Scholar] [CrossRef]
- Liu, Y.; Chen, J.; Zhu, Z. Static mechanical properties of argillaceous slate coarse-grained soil improved by cement. J. Cent. South Univ. 2019, 50, 139–145. [Google Scholar] [CrossRef]
- Lei, J.; Zeng, Y.W.; Zhang, S. Large scale triaxial tests on effects of rock block proportion and shape on mechanical properties of cemented soil-rock mixture. Rock Soil Mech. 2017, 38, 141–149. [Google Scholar] [CrossRef]
- Lepakshi, R.B.V.; Venkatarama, R. Shear strength parameters and Mohr-Coulomb failure envelopes for cement stabilised rammed earth. Constr. Build. Mater. 2020, 249, 118708. [Google Scholar] [CrossRef]
- Kong, Y.X.; Sheng, F.F.; Wang, H.J. Stress-dilatancy properties for fiber-reinforced sand. Chin. J. Geotech. Eng. 2018, 40, 2249–2256. [Google Scholar] [CrossRef]
- Rabbi, A.T.M.Z.; Kuwano, J.; Deng, J.L.; Boon, T.W. Effect of Curing Stress and Period on the Mechanical Properties of Cement-Mixed Sand. Soils Found. 2011, 51, 651–661. [Google Scholar] [CrossRef]
- Wu, M.X.; Du, B.; Yao, Y.C.; He, X.F. An Experimental Study on Stress-strain Behavior and Constitutive Model of Hardfill Materials. Sci. China Phys. Mech. 2011, 54, 2015–2024. [Google Scholar] [CrossRef]
- Fu, H.; Chen, S.S.; Han, H.Q.; Ling, H.; Cai, X. Experimental study on static and dynamic properties of cemented sand and gravel. Chin. J. Geotech. Eng. 2015, 37, 357–362. [Google Scholar] [CrossRef]
- Zhang, X.C.; Huang, H. Experimental and Theoretical Investigation on Dynamic Performance of Cemented Sand and Gravel Material. Sci. Adv. Mater. 2018, 10, 979–988. [Google Scholar] [CrossRef]
- Cai, X.; Guo, X.W.; Yang, J.; Wu, Y.L. Cemented Sand Gravel Dam: Material Mechanical Properties and Structural Design; Science Press: Beijing, China, 2021. [Google Scholar]
- Yang, G.; Sun, X.; Wang, Y.Y. Tests on resilient behaviour of polymer rockfill materials. Rock Soil Mech. 2018, 39, 1669–1674. [Google Scholar] [CrossRef]
- Xu, W.B.; Liu, B.; Wu, W.L. Strength and deformation behaviors of cemented tailings backfill under triaxial compression. J. Cent. South Univ. 2020, 27, 3531–3543. [Google Scholar] [CrossRef]
- Ding, L.; Wei, K.M. Constitutive Model of Cemented Coarse-Grained Soil and Its Application in High Concrete Face Rockfill Dam. Int. J. Geomech. 2024, 24, 04023290. [Google Scholar] [CrossRef]
- Amini, Y.; Hamidi, A. Triaxial shear behavior of a cement-treated sand-gravel mixture. J. Rock Mech. Geotech. Eng. JRMGE 2014, 6, 455–465. [Google Scholar] [CrossRef]
- Liu, W.Z.; Hu, Z.J.; Liu, C.; Huang, X.P. Mechanical properties under triaxial compression of coal gangue-fly ash cemented backfill after cured at different temperatures. Constr. Build. Mater. 2024, 411, 134268. [Google Scholar] [CrossRef]
- Lohani, T.N.; Kongsukprasert, L.; Watanabe, K.; Tatsuoka, F. Strength and Deformation Properties of Compacted Cement-Mixed Gravel Evaluated by Triaxial Compression Tests. Soils Found. 2004, 44, 95–108. [Google Scholar] [CrossRef]
- Chen, Y.L.; Li, P.Z.; Ye, P.H.; Li, H.; Liang, X. Experimental investigation on the mechanical behavior of polyvinyl alcohol fiber recycled aggregate concrete under triaxial compression. Constr. Build. Mater. 2022, 350, 128825. [Google Scholar] [CrossRef]
- Chen, Y.L.; Li, P.Z.; Zhang, S.S. Experimental investigation on triaxial mechanical properties of coral coarse aggregate-sea sand seawater concrete. Constr. Build. Mater. 2023, 409, 134213. [Google Scholar] [CrossRef]
- Vu, X.H.; Daudeville, L.; Malecot, Y. Effect of coarse aggregate size and cement paste volume on concrete behavior under high triaxial compression loading. Constr. Build. Mater. 2011, 25, 3941–3949. [Google Scholar] [CrossRef]
- Dong, X.X.; Bao, X.H.; Cui, H.Z.; Xu, C.J.; Chen, X.S. Isotropic compression and triaxial shear behaviors of cement- and cement-gravel-treated granite residual soil for use as subgrade filling. Constr. Build. Mater. 2023, 390, 131780. [Google Scholar] [CrossRef]
- Luan, J.J.; Chen, X.D.; Ning, Y.J.; Zhang, W. Mechanical characteristics and energy dissipation characteristics of dredged sand concrete during triaxial loading. J. Build. Eng. 2022, 55, 104700. [Google Scholar] [CrossRef]
- Bai, Y.Y.; Guo, W.C.; Zhao, Q.X.; Qiu, Y.X.; Wang, S. Triaxial compression failure criterion and constitutive relation of concrete containing multiple solid wastes. Constr. Build. Mater. 2023, 386, 131573. [Google Scholar] [CrossRef]
- Luo, Z.B.; Airey, D.; Fu, Y. A constitutive model for cemented granular materials capturing bond degradation. Comput. Geotech. 2024, 176, 106716. [Google Scholar] [CrossRef]
- Rossi, C.; Tengattini, A.; Viggiani, G. A constitutive model for lightly cemented granular materials. Comput. Geotech. 2024, 172, 106550. [Google Scholar] [CrossRef]
- Liu, Y. Multiscale investigation of bonded granular materials: The H-bond model. Comput. Geotech. 2024, 172, 106481. [Google Scholar] [CrossRef]
- Wu, Y.L.; Ren, H.L.; Li, W.; Jing, P.R.; Guo, W.L. A constitutive model for cemented-sand-gravel (CSG) materials based on strength characteristics. Mech. Mater. 2025, 205, 105313. [Google Scholar] [CrossRef]
- Yang, J.G.; Ren, H.L.; Li, Q.; Cai, S.L. Statistical damage constitutive model of cemented sand and gravel based on a modified spatially mobilized plane yield criterion. Case Stud. Constr. Mater. 2025, 22, e04611. [Google Scholar] [CrossRef]
- Qian, H.Y.; Wu, W.; Du, X.Y.; Xu, C. Hypoplastic constitutive model for granular materials with particle breakage. Int. J. Geomech. 2023, 23, 04023065. [Google Scholar] [CrossRef]
- Pirmoradi, P.; Suiker, A.S.J.; Poorsolhjouy, P. Multi-scale constitutive model for fiber-reinforced concrete with FEM analyses of structural failure. Eng. Fract. Mech. 2025, 323, 111166. [Google Scholar] [CrossRef]
- SL237-1999; Specification for Soil Test. China Water & Power Press: Beijing, China, 1999.
- Hao, Y.Z.; Wang, T.H.; Jin, X.; Cheng, L.; Li, J.L. Experimental study on the saturated compacted loess permeability under K0 consolidation. Adv. Civ. Eng. 2020, 2020, 1426485. [Google Scholar] [CrossRef]
- Wroth, C.P. The interpretation of in situ soil tests. Géotechnique 1984, 34, 449–489. [Google Scholar] [CrossRef]
- ASTM D4767-11; Standard Test Method for Consolidated Undrained Triaxial Compression Test for Cohesive Soils. ASTM International: West Conshohocken, PA, USA, 2020.
- BS 1377-8:1990; Methods of Test for Soils for Civil Engineering Purposes—Part 8: Shear Strength Tests (Effective Stress). British Standards Institution: London, UK, 1990.
- Tang, X.Y.; Feng, C.Z.; Ren, B.; Zhou, C.H.; Peng, C. Experimental study on the triaxial compressive properties of UHPC with coarse-aggregate steel-slag micro-powder under different confining pressures. Sci. Rep. 2025, 15, 12343. [Google Scholar] [CrossRef]
- Moaf, F.O.; Rajabi, A.M.; Abdelgader, H.S.; Kurpińska, M.; Murali, G.; Miśkiewicz, M. Triaxial compression and shear strength characteristics of two-stage concrete: An experimental study. Sci. Rep. 2024, 14, 29396. [Google Scholar] [CrossRef] [PubMed]
- Wang, Y.H.; Wang, M.J.; Tang, C.R.; Yu, Y.; Chen, S. Study on the triaxial compressive properties of alkali-activated concrete after freeze–thaw cycles. Sci. Rep. 2025, 15, 20517. [Google Scholar] [CrossRef]
- Ren, H.L.; Cai, X.; Jing, P.; Li, W.; Wu, Y.L. Study on the dynamic characteristics and damage constitutive model of cemented sand–grave. Int. J. Geomech. 2025, 25, 04025118. [Google Scholar] [CrossRef]
- He, X.; Wei, L.Q.; Yang, K.; Wen, Z.Q. Effects of curing temperature and age on the mechanical properties and damage law of coal-based solid waste cemented backfill. Case Stud. Constr. Mater. 2025, 23, e04937. [Google Scholar] [CrossRef]
- Yamaguchi, Y.; Biswas, S.; Hatano, T.L. Failure processes of cemented granular materials. Phys. Rev. E 2020, 102, 052903. [Google Scholar] [CrossRef]
- Cai, X.; Yang, J.; Guo, X.W.; Wu, Y.L. Large-scale triaxial tests on dilatancy characteristics of lean cemented sand and gravel. Front. Earth Sci. 2021, 9, 799215. [Google Scholar] [CrossRef]
- Wei, K.M.; Chen, S.S.; Li, G.Y.; Mi, Z.K.; Lin, H. Elastoplastic model for cemented coarse-grained materials and its application. Chin. J. Geotech. Eng. 2019, 41, 797–805. [Google Scholar] [CrossRef]
- Chai, Q.H.; Yang, S.F.; Sun, M.Q. Study on the influence factors of compressive strength of cemented sand and gravel materials. Yellow River 2016, 38, 68–78. [Google Scholar]
- Chen, J.J. Meso-Mechanical Characteristics Study and Multi Scale Analysis of Cemented Sand and Gravel Material. Ph.D. Thesis, Hohai University, Nanjing, China, 2020. [Google Scholar]
- He, Y.L.; Liu, J.L.; Li, J.C. Study on the Stress-strain Property and Constitutive Model of Hardfill Material. J. Sichuan Univ. Eng. Sci. Ed. JSUMS 2011, 43, 40–47. [Google Scholar] [CrossRef]
- Shen, Z.J. A New Model for Stress-Strain Analysis of Soil. In Proceedings of the Fifth National Conference on Soil Mechanics and Foundation Engineering, Beijing, China, 1–4 August 1989. [Google Scholar]
- Rowe, P.W. The stress–dilatancy relation for static equilibrium of an assembly of particles in contact. Proc. R. Soc. Lond. A 1962, 269, 500–548. [Google Scholar] [CrossRef]
- Bolton, M.D. The strength and dilatancy of sands. Géotechnique 1986, 36, 65–78. [Google Scholar] [CrossRef]
- Oda, M.; Nakayama, H. Yield function for soil with anisotropic fabric. J. Eng. Mech. 1989, 115, 89–104. [Google Scholar] [CrossRef]
- Zhang, J.; Salgado, R. Stress–dilatancy relation for Mohr–Coulomb soils following a non-associated flow rule. Géotechnique 2010, 60, 223–226. [Google Scholar] [CrossRef]


| Number of Category | Material Name | Cementing Content | Loose Granular Material |
|---|---|---|---|
| 1 | Cemented soil, cemented sand | - |  Soil |
 Sand | |||
| 2 | Cemented sand and gravel | 20 kg/m3–120 kg/m3 |  Sand and gravel  Coal gangue |
| 3 | Concrete or roller-compacted concrete | >120~140 kg/m3 | 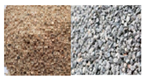 Sand and gravel |
| Aggregate Type | Specific Gravity | Bulk Density (kg/m3) | Water Content | Clay Content |
|---|---|---|---|---|
| Crushed stone | 2.71 | 1650 | 0.01% | 0.01% |
| Sand | 2.62 | 1450 | 0.01% | 0.01% |
| The Fineness | The Content of SO3 | The Content of MgO |
|---|---|---|
| 2.26% | 2.56% | 1.78% |
| Group ID | Cement (kg/m3) | Sand (kg/m3) | Gravel (kg/m3) | ||
|---|---|---|---|---|---|
| 5–10 mm | 10–20 mm | 20–40 mm | |||
| 1 | 0 | 477 | 340.8 | 596.4 | 715.7 |
| 2 | 40 | 477 | 340.8 | 596.4 | 715.7 |
| 3 | 80 | 477 | 340.8 | 596.4 | 715.7 |
| 4 | 100 | 477 | 340.8 | 596.4 | 715.7 |
| Serial Number | Category | E0 (MPa) | n | A (MPa) | B | m | λ0 (%) | d0 (%) | d1 (%) | λ2 (%) | d2 (%) |
|---|---|---|---|---|---|---|---|---|---|---|---|
| 1 | Rockfill | 113 | 0.25 | 0 | 5.1 | 0.91 | 0.19 | 1.27 | 4.14 | 0.072 | 0.25 |
| 2 | Cemented sand and gravel | 174 | 0.43 | 1.93 | 5.1 | 0.91 | 0.031 | 1.03 | 1.04 | 0.06 | 0.43 |
| 3 | Cemented coal gangue backfill | 389 | 0.33 | 2.53 | 7.2 | 0.99 | 0.1 | 0.1 | 0.78 | 0.038 | 0.25 |
Disclaimer/Publisher’s Note: The statements, opinions and data contained in all publications are solely those of the individual author(s) and contributor(s) and not of MDPI and/or the editor(s). MDPI and/or the editor(s) disclaim responsibility for any injury to people or property resulting from any ideas, methods, instructions or products referred to in the content. |
© 2025 by the authors. Licensee MDPI, Basel, Switzerland. This article is an open access article distributed under the terms and conditions of the Creative Commons Attribution (CC BY) license (https://creativecommons.org/licenses/by/4.0/).
Share and Cite
Yu, X.; Ye, Y.; Yang, A.; Yang, J. Triaxial Response and Elastoplastic Constitutive Model for Artificially Cemented Granular Materials. Buildings 2025, 15, 2721. https://doi.org/10.3390/buildings15152721
Yu X, Ye Y, Yang A, Yang J. Triaxial Response and Elastoplastic Constitutive Model for Artificially Cemented Granular Materials. Buildings. 2025; 15(15):2721. https://doi.org/10.3390/buildings15152721
Chicago/Turabian StyleYu, Xiaochun, Yuchen Ye, Anyu Yang, and Jie Yang. 2025. "Triaxial Response and Elastoplastic Constitutive Model for Artificially Cemented Granular Materials" Buildings 15, no. 15: 2721. https://doi.org/10.3390/buildings15152721
APA StyleYu, X., Ye, Y., Yang, A., & Yang, J. (2025). Triaxial Response and Elastoplastic Constitutive Model for Artificially Cemented Granular Materials. Buildings, 15(15), 2721. https://doi.org/10.3390/buildings15152721