Article

Flexural Behavior of Lap Splice Connection Between Steel-Plate Composite Wall and Reinforced Concrete Foundation Subjected to Impact Loading

1
School of Civil Engineering, Chongqing University, Chongqing 400045, China
2
School of Management Science and Real Estate, Chongqing University, Chongqing 400045, China
3
Department of Civil Engineering, The University of Hong Kong, Pokfulam Road, Hong Kong, China
*
Author to whom correspondence should be addressed.
Buildings 2025, 15(15), 2707; https://doi.org/10.3390/buildings15152707 (registering DOI)
Submission received: 10 July 2025 / Revised: 25 July 2025 / Accepted: 30 July 2025 / Published: 31 July 2025
(This article belongs to the Section Building Structures)

Abstract

The superb dynamic performance of steel-plate composite (SC) structures under unexpected impact loading depends on the good design of the connection between the SC wall and foundation. This study investigated the flexural behavior and dynamic responses of SC wall-to-foundation connections subjected to low-velocity impact. Impact tests were performed on three SC connection specimens to evaluate failure mode, impact force, deflection, and strain responses. The effects of concrete strength grade and impact energy were analyzed in detail. All specimens exhibited flexural failure, with three distinct stages observed during impact. The experimental results demonstrated that compared to the specimen with C30 concrete, the specimen with C50 concrete significantly reduced wall damage, decreased deflections, and enhanced deflection recovery ability. It can be concluded that increasing the concrete strength grade effectively improves the impact resistance of SC wall-to-foundation connections. In addition, peak impact force, global deflection response, residual strains, and interface crack length were highly sensitive to changes in impact energy, whereas deflection recovery exhibited lower sensitivity. Furthermore, a finite element model was developed and validated against experimental results. Parametric studies explored the influence of key parameters with expanded ranges on the impact responses of SC wall-to-foundation connections.

1. Introduction

Steel-concrete composite (SC) walls mainly comprise two steel plates and infilled plain concrete. To ensure the collaborative work between concrete and steel plates, shear connectors such as J-hooks, Bi-steel, tie-bars, and channel-steel connectors are usually installed on the inner side of the steel plates [1,2,3]. SC structures have been widely applied in nuclear power plants, high-rise buildings, protective structures, and other engineering projects due to the high load-bearing capacity, high ductility, high integrity performance, and convenience of modular construction [4,5]. The typical applications in civil and offshore engineering of SC structures are shown in Figure 1.
The incidence of constructions subjected to unexpected impact loading such as terrorist attacks, projectile strikes, and vehicle impact has demonstrated a rising trend in recent years [6,7,8,9]. Numerous studies have been conducted in the past because of the growing interest in improving the impact performance of SC structures. Mizuno et al. [10] carried out scaled tests of aircraft impact on SC walls. Compared with reinforced concrete (RC) walls, the required thickness for SC walls can be reduced by 30%, and the residual velocity after the same aircraft model penetrates the wall is significantly reduced. Then, Mizuno et al. [11] analyzed it through using the discrete element modeling (DEM), and the results showed that the DEM can effectively simulate the penetration failure and debris dispersion process of SC walls. Sohel et al. [12,13] carried out the impact test on SC beam and slabs with J-hook connectors, and the influence of the specimen thickness, connector diameter, steel thickness, concrete type, and fiber content was studied. The results showed that J-hook connectors can improve the impact resistance of SC structures. Remennikov et al. [14] experimentally and numerically studied the responses of the axially restrained SC panels under impact loading. The proposed SCS panel exhibited a highly ductile response and could against large impact energy. Zhao et al. [15] carried out impact experiments on the SC panels, and the corresponding FE models were also established. In addition, a method was presented by Guo and Zhao [16] to analyze the deflection response of SC panels under impact load, which uses the equivalent single-degree-of-freedom (SDOF) model.
The effective connection is important for the safe service of SC structure under impact load, but limited studies have been conducted so far on the SC wall-to-foundation connections, especially for dynamic response. For the connections of SC walls and RC foundation, three typical connection types were provided in JEAG 4618-2005, namely embedding, anchor, and dowel methods [17]. Among these methods, the dowel method, also called lap splice connection [18], is commonly used in practical engineering construction due to its construction convenience. This method uses dowel rebars to extend into the foundation and insert upwards into the SC wall to transfer the force. Kurt et al. [19] performed experimental and numerical investigations on the structural performance of SC wall-to-foundation connections subjected to the in-plane cyclic lateral force. The results showed that the deformation capacity and ductility of the specimens with dowel connection were better than the SC wall specimen. Wang et al. [20] carried out experimental investigation on SC wall-to-foundation connection specimens under axial compression and cyclic lateral force. The height-to-thickness ratio of the SC wall was critical in determining the failure modes of the test specimens under out-of-plane loading. The test specimens with height-to-thickness ratios of 1.33 and 2.5 showed the shear and flexure-splitting failure modes, respectively.
In this paper, impact tests were conducted on the SC wall-to-foundation connection specimens by dropping the hammer with different weights and heights. The experimental results, including the damage analysis, failure modes, and comprehensive dynamic response, were presented. The effects on concrete strength and impact energy on the impact performances of SC wall-to-foundation connection specimens were discussed in detail. The corresponding finite element (FE) model was set up and compared with the test results. Parametric studies were carried out to investigate the influences of concrete compressive strength, impact velocity, and impact mass on the dynamic responses.
Figure 1. Applications of SC structures: (a) shear walls in buildings [21]; (b) shielding walls in nuclear facility [21]; (c) artic offshores [22]; (d) protective structures [23].
Buildings 15 02707 g001

2. Experimental Study

2.1. Test Specimens and Materials

Three test specimens were fabricated for the impact tests, each consisting of the SC wall and the RC foundation, with the layouts depicted in Figure 2. The dimensions of all the fabricated specimens were identical. The SC wall dimensions were 300 mm in thickness (D), 500 mm in width (L), and 800 mm in height (H). It is worth noting that the out-of-plane performance of the SC wall is independent of its length and mainly depends on the height-to-thickness ratio [24,25]. Additionally, the length of the SC wall used in this paper was conducive to applying more uniform out-of-plane impact loads to obtain more accurate test results. The SC wall specimens with a similar height-to-thickness ratio have also been investigated in previous studies [20,26]. The investigated parameters included the impact energy and the concrete strength grades of the SC wall. For the SC wall, two steel plates with 6 mm thickness (ts) were welded by stiffening angles and tie channels. The stiffening angle is specified as the hot-rolled unequal-leg angle ∟50 × 32 × 4. The long legs of these angles were welded to the inner face of the steel plates, with a length of 800 mm, consistent with the height of the SC wall. Tie channels, designated as hot-rolled light channel C5, were welded at both ends to the stiffening angles with approximately 200 mm spacing. Headed studs, 10 mm in diameter and 100 mm in length, were welded onto the inner face of the steel plates, spaced at intervals of 100 mm along the wall height and 200 mm along the width. For connecting the RC foundation and the SC wall, eight dowel rebars with a diameter of 20 mm were utilized. The selection of the number and diameter of dowels was based on Ref. [20] and reinforcement ratio demand. The RC foundation measured 800 mm in length, 800 mm in width, and 700 mm in height, reinforced with HRB400 rebars of 20 mm diameter. Furthermore, as presented in Table 1, according to the GB/T228.1-2010 [27] and GB50081-2002 [28], the material properties of each steel component and concrete were determined through standard tensile coupon tests and uniaxial compressive loading tests, respectively. The stress–strain curves of different steel components were shown in Figure 3.

2.2. Test Set-Up and Data Measurements

The impact experiments were carried out using an instrumented drop weight impact machine, as illustrated in Figure 4. The cylindrical rigid hammer diameter was 256 mm, and the mass of the hammer was 235 kg with 12 alterable additional weights (each 65 kg). A computer system was used to raise the hammer to the required impact height (Hh), and the maximum value can be set to 16 m. In order to fix the RC foundation on the laboratory floor, square steel pipes and threaded rods were used.
The summary of test specimens was presented in Table 2. For this experiment, the impact position of the hammer was 600 mm away from the interface, namely the effective impact height (H0). The test specimens H2-C30-L1 and H2-C50-L1 were subjected to the same impact energy (14.7 kJ) by the 500 kg hammer dropped from 3 m, while the impact energy of specimen H2-C50-L2 was 9.8 kJ, the impact mass (m) and the impact height of the hammer were set to 300 kg and 3.33 m, respectively. Moreover, a high-speed camera was used to record the dynamic response of the interface at a speed of 12,500 fps during the impact process.
As illustrated in Figure 5, seven deflection transducers (D1–D7) were employed to measure the deflection histories of the bottom steel plate, while fifteen strain gauges were used to capture the strain histories of the steel plates and dowel rebars. The measuring instruments used in the experiment had high accuracy, ensuring the reliability of the experimental data. Deflection transduces D1 and D2 represented the deflection at the interface, while D3 and D7 represented deflection at the middle and top of the specimens, respectively. The deflection near the impact position was recorded by the deflection transducers D4–D6, especially D5, which was used to record the center deflection of the projection of the impact area on the bottom steel plate (db).
The acceleration obtained from the impact force and hammer mass was used to calculate the velocity (v) and deflection (Dh) of the hammer, ignoring the influence of gravitational acceleration. Equations (1) and (2) defined these calculations [15].
v h t = 0 t F t m d t v
D h t = 0 t v t d t

3. Test Results and Discussion

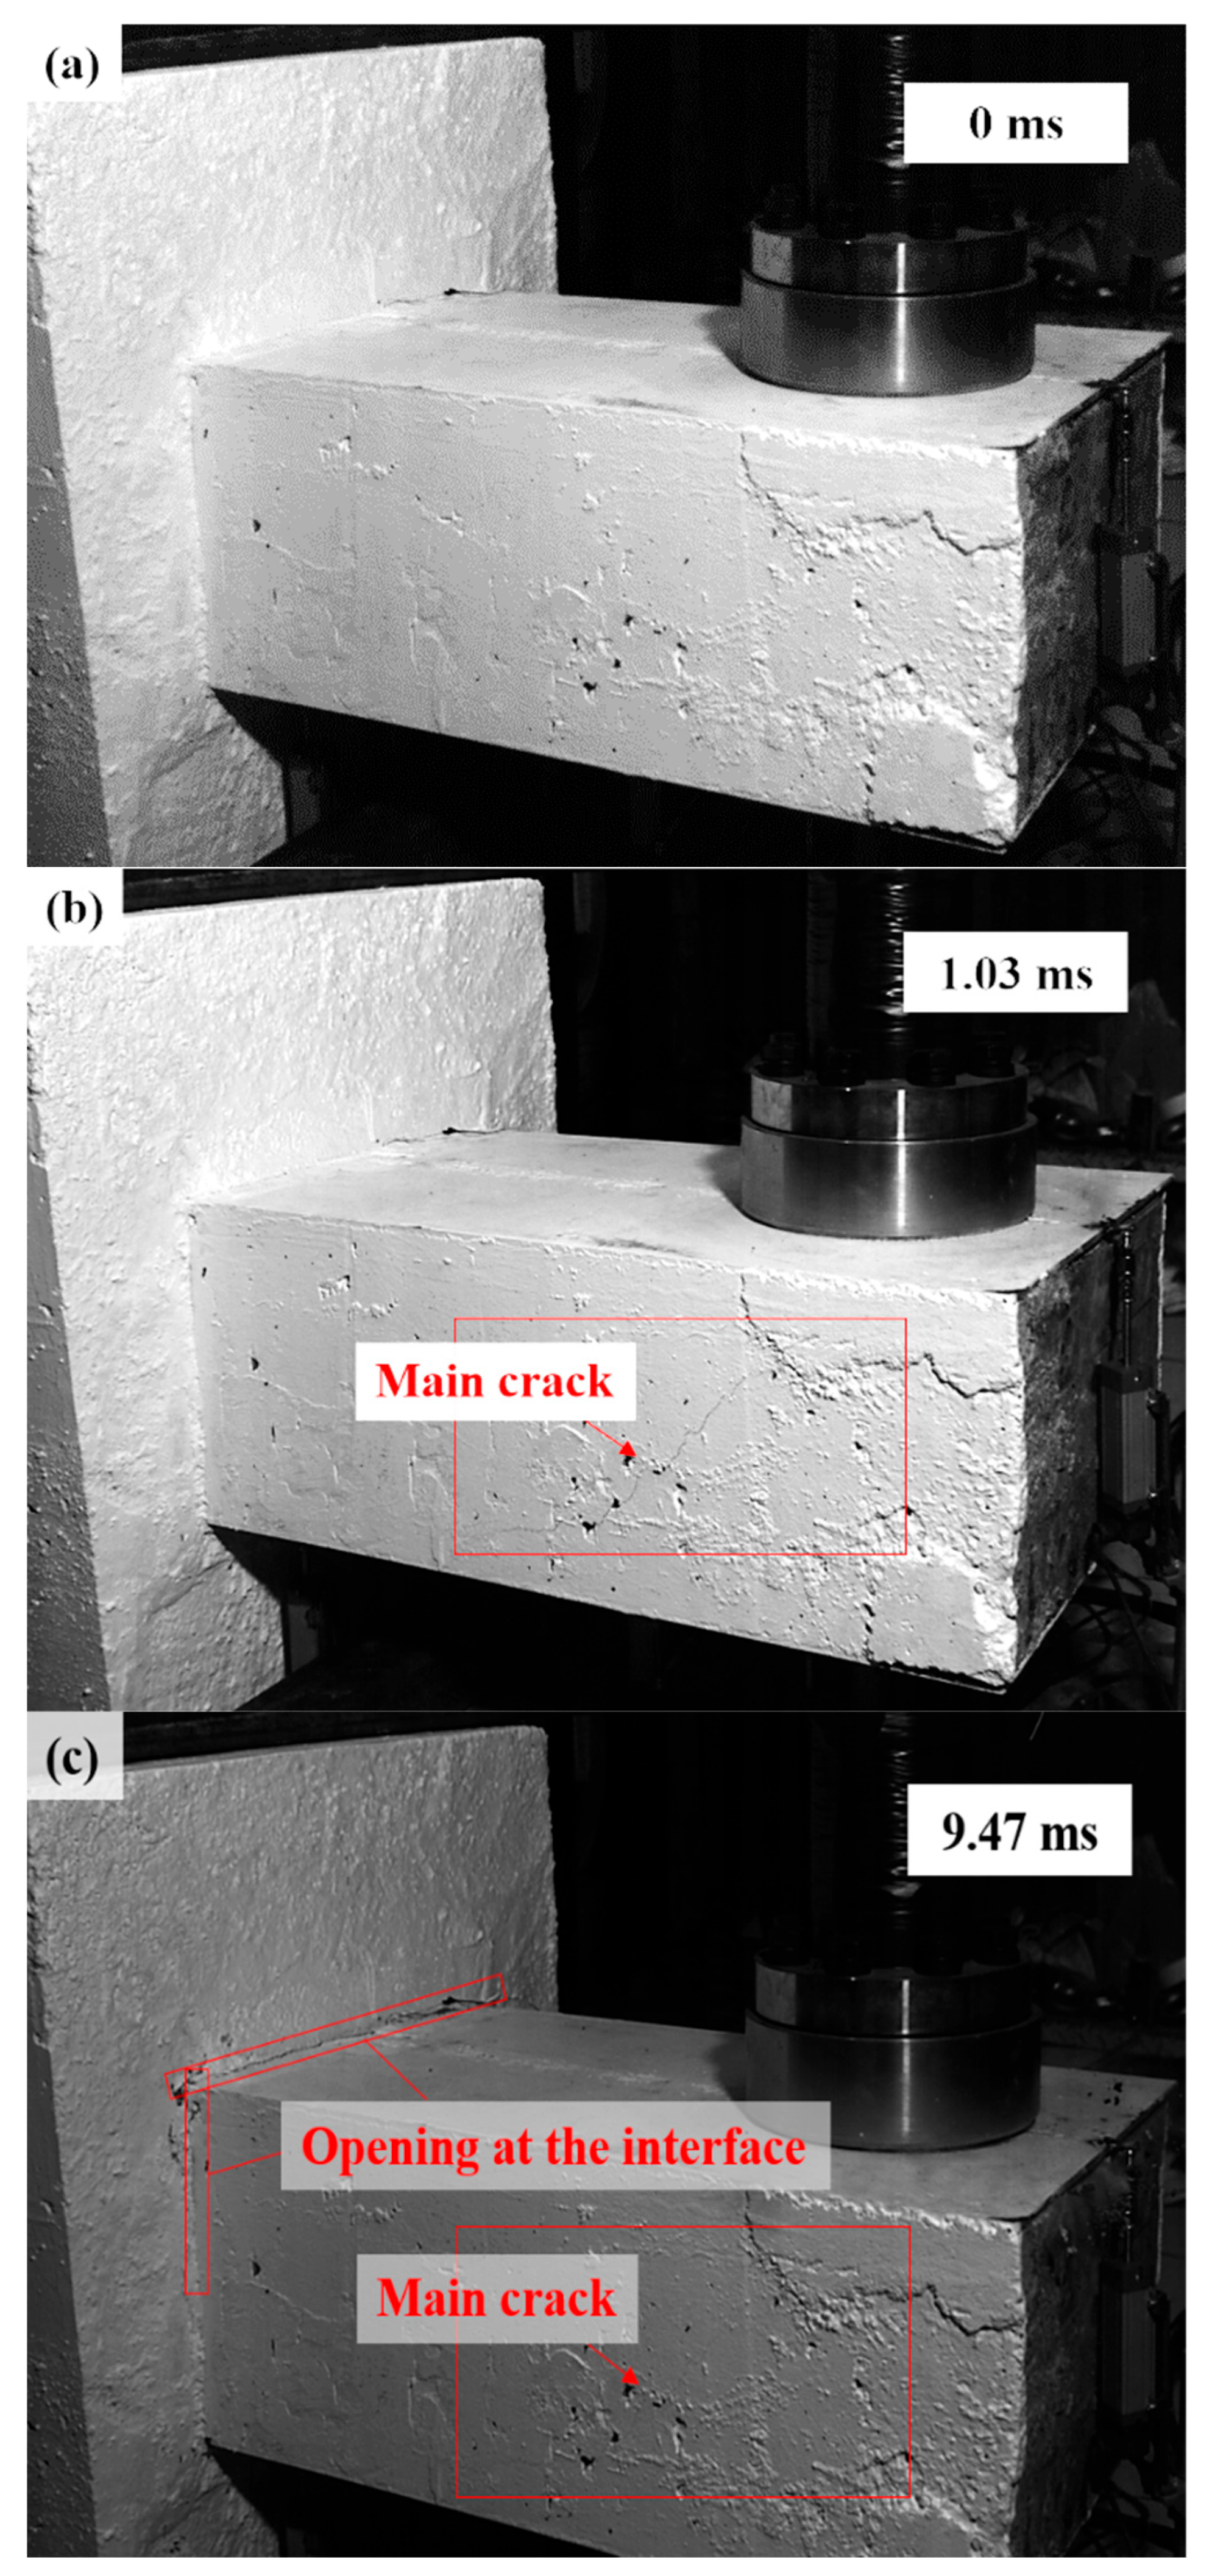
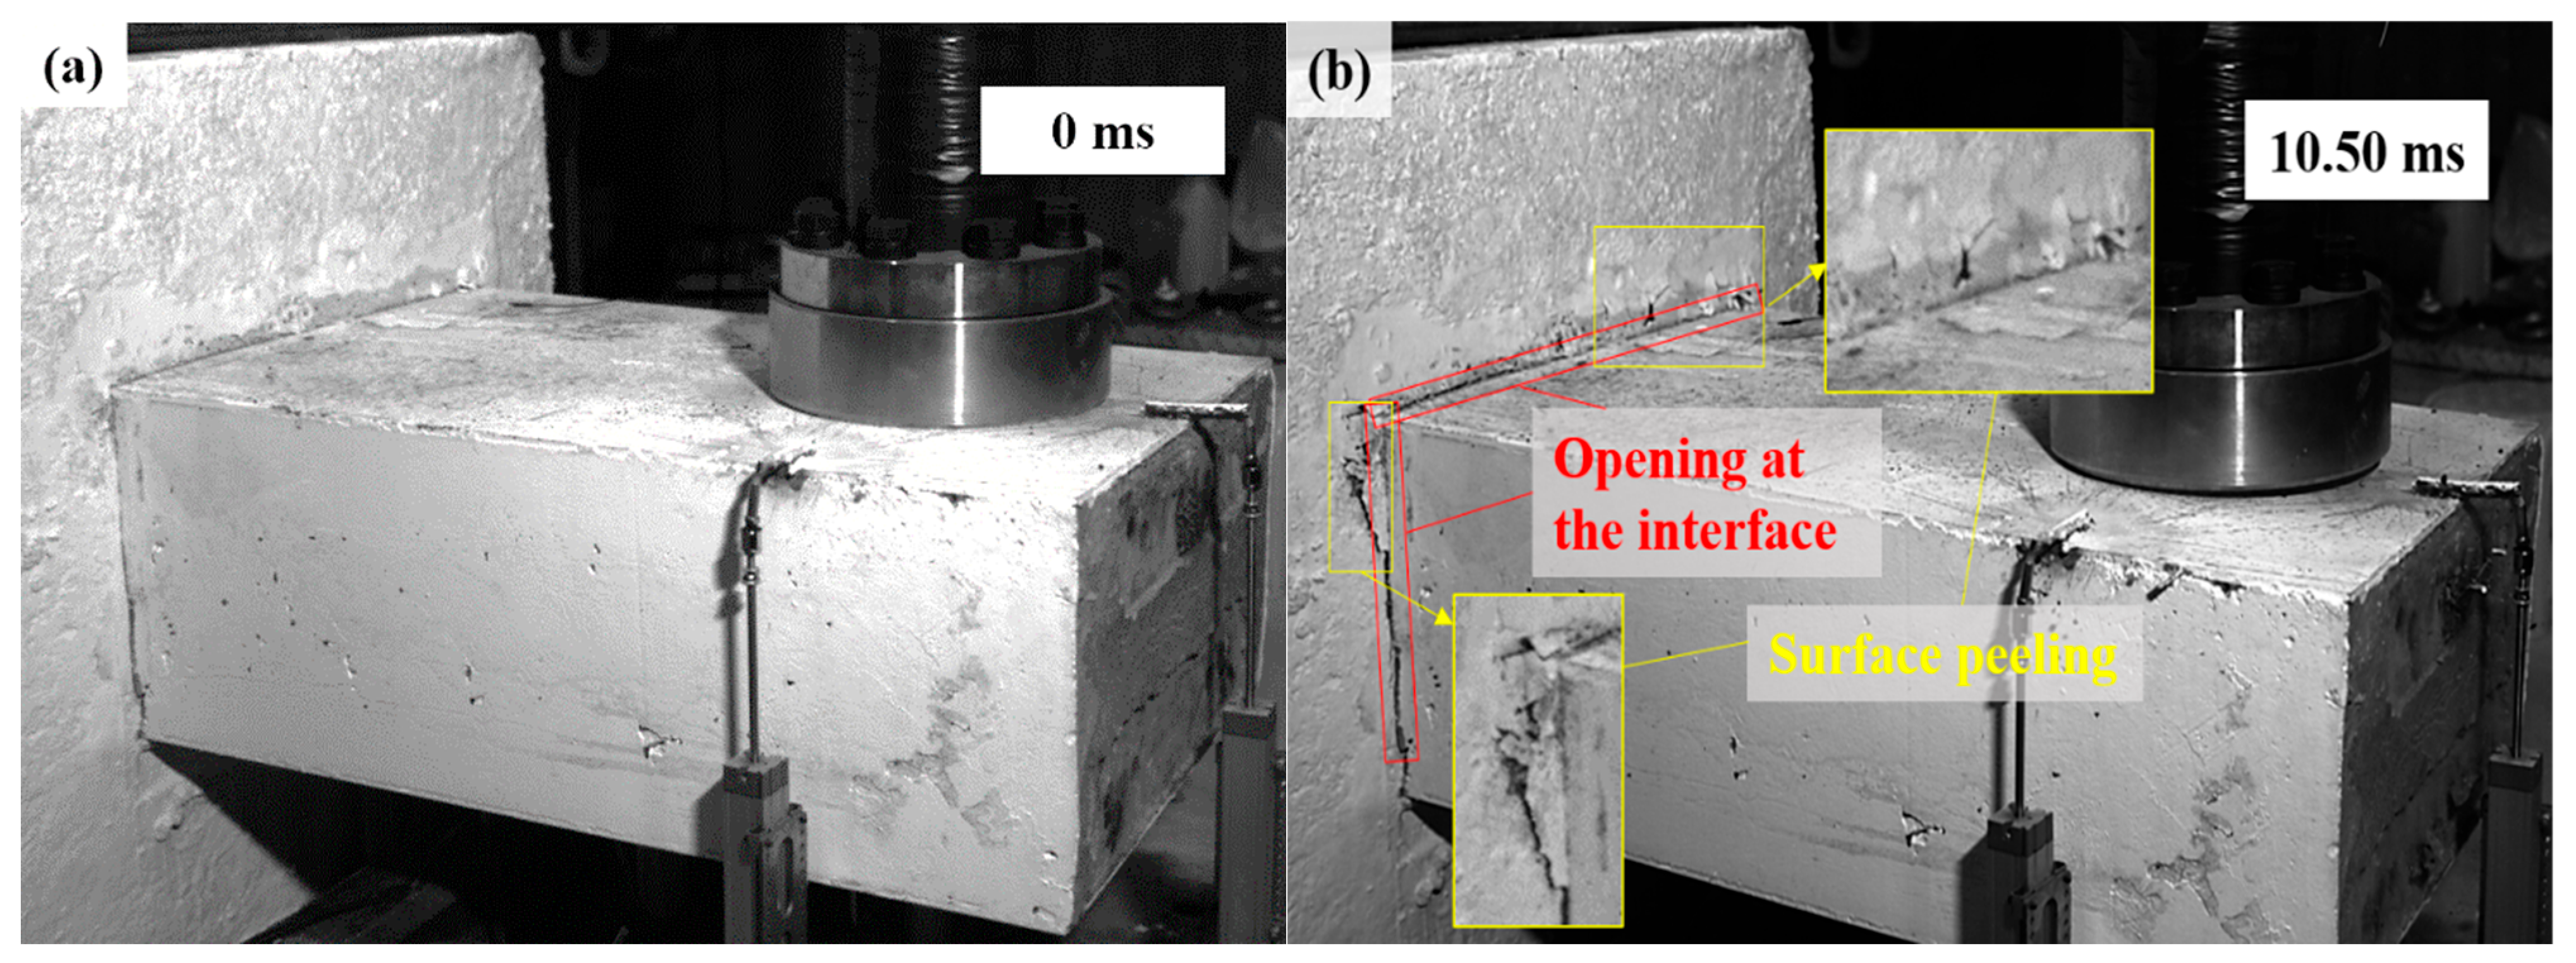
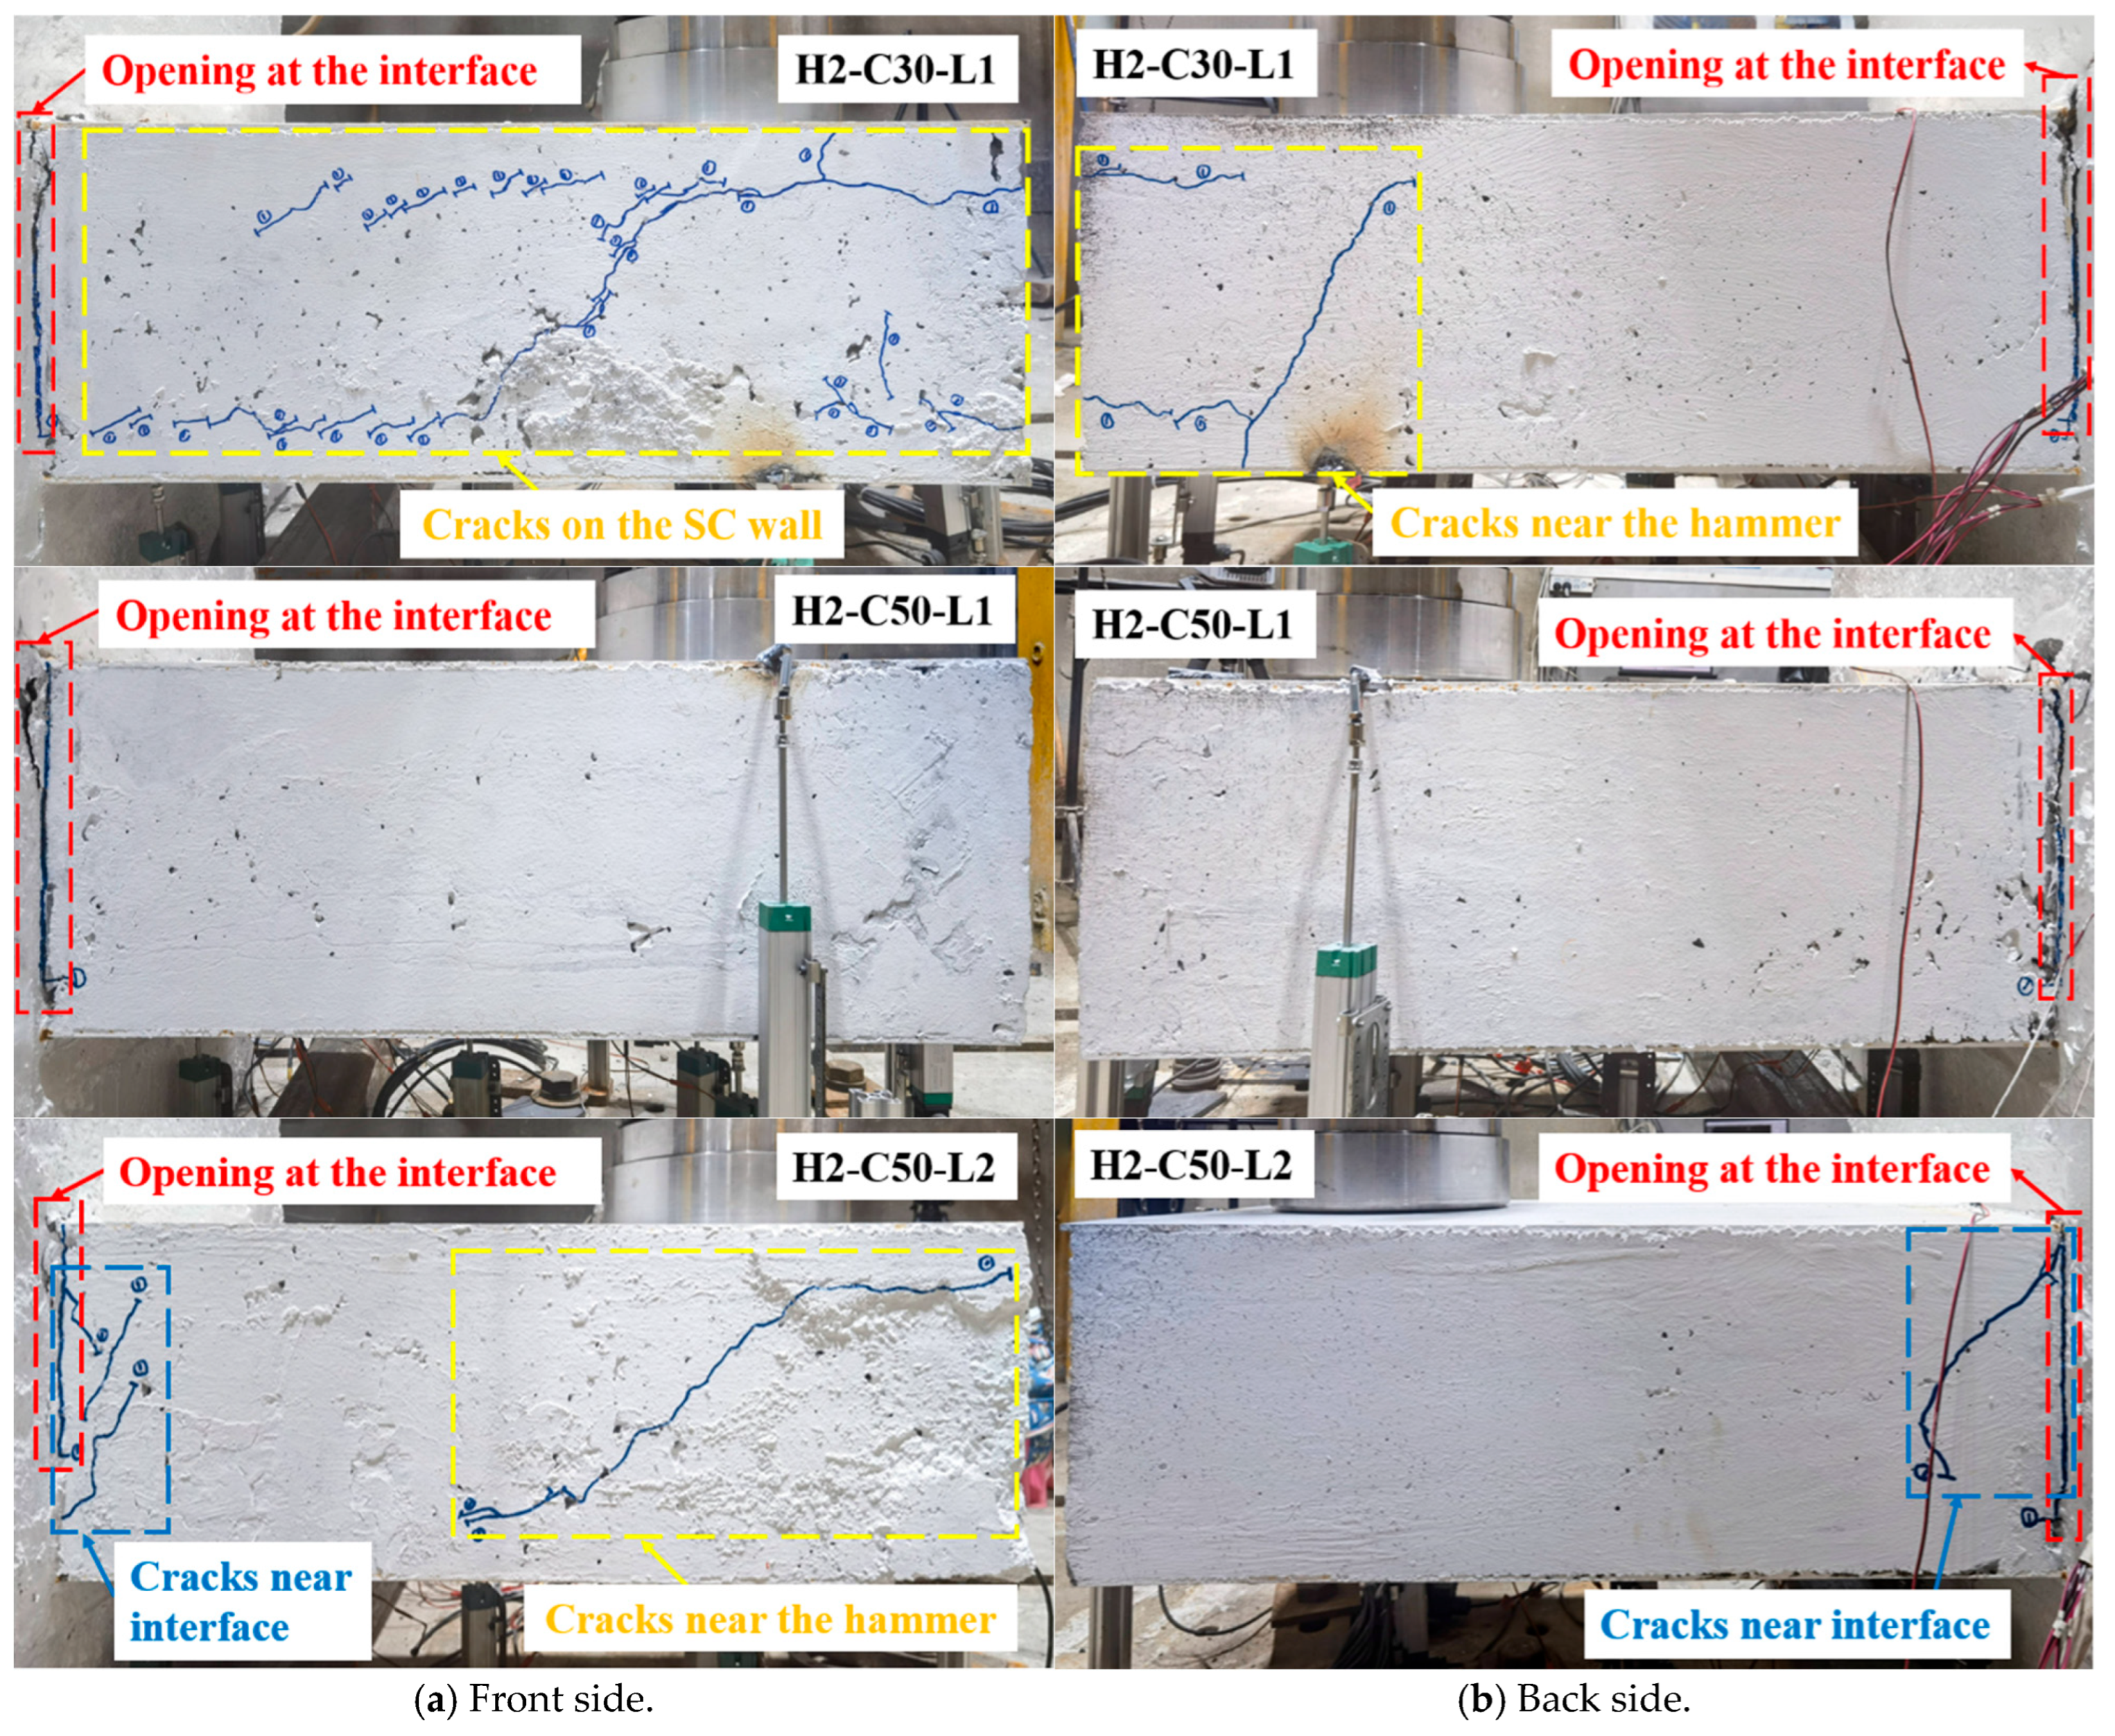
3.1. Damage Analysis and Failure Modes

As shown in Figure 6 and Figure 7, the damage evolution process of two specimens, H2-C30-L1 and H2-C50-L2, showed a similar trend. The main crack was observed near the hammer on the SC wall within 1.1 ms of contact between the hammer and the SC wall (see Figure 6b and Figure 7b). Subsequently, the upper steel plate and the RC foundation separated, resulting in the interface opening, and it was obvious that the opening in specimen H2-C50-L2 was more pronounced than that in specimen H2-C30-L2 (see Figure 6c and Figure 7c). However, it was noteworthy that the main crack did not demonstrate significant expansion during the impact process. For specimen H2-C50-L1, as seen in Figure 8, a similar interface opening was also observed, but there was no evident damage (e.g., concrete cracks or concrete spalling) on the SC wall. It was also important to note that, in contrast to specimens H2-C30-L1 and H2-C50-L2, apparent surface peeling was observed on the concrete of specimen H2-C50-L1 at the upper and left edges of the interface (see Figure 8b). This might be attributed to the brittleness of C50 concrete being more pronounced than that of C30 concrete as the impact energy increased.
In this study, within the limits of the tested parameters considered, the bending moment appeared to control the failure modes for test specimens under impact loading, irrespective of the concrete strength grade and impact energy. According to the general observations and strain development results, the opening at the interface and the local buckling of dowel rebars were observed in all test specimens, which can be concluded as flexural failure of the SC wall-to-foundation connection. It is different from the characteristics of interface slip of shear failure. In addition, no obvious slip phenomenon was observed between the steel plates and the concrete during the tests in this study. The specific strain response of test specimens will be discussed in the following section.
On the front side, the interfacial cracking length of specimens H2-C30-L1 and H2-C50-L1 was approximately 9/10 of the wall height, while the interfacial cracking length of H2-C50-L2 was around 2/3 of that (see Figure 9a). As for the back side, the interfacial cracking length of all test specimens was about 9/10 of the wall height (see Figure 9b). The measured maximum crack widths on the left, upper, and right sides of the interface are presented in Table 3. The maximum crack widths on three sides of specimen H2-C30-L1 were the largest among the three specimens; the Cl, Cu, and Cr of H2-C30-L1 were 2.90 mm, 4.46 mm, and 8.75 mm, respectively. Additionally, there were two horizontal splitting cracks that connected the headed studs observed on the front side of the SC wall concrete of specimen H2-C30-L1 (see Figure 9a) and characterized by the flexural failure. In previous studies, similar splitting cracks were also reported [20,29].
By comparing specimens H2-C30-L1 and H2-C50-L1, the specimen with a higher concrete strength grade (C50) of the SC wall exhibited an improved performance in stiffness and structural integrity after impact (i.e., smaller damage degree to the SC wall concrete as well as shorter crack length and smaller crack width at the interface) under the same impact energy. By comparing specimens H2-C50-L1 and H2-C50-L2, as the impact energy decreased from 14.7 kJ to 9.8 kJ, Cl, Cu, and Cr decreased from 2.12 mm, 4.33 mm, and 2.43 mm to 1.60 mm, 2.25 mm, and 1.89 mm, respectively. However, there were some cracks that appeared on the wall of specimen H2-C50-L2. This could be attributed to the impact velocity of specimen H2-C50-L2 was 7.90 m/s, which was greater than that of specimen H2-C50-L1 (7.45 m/s).

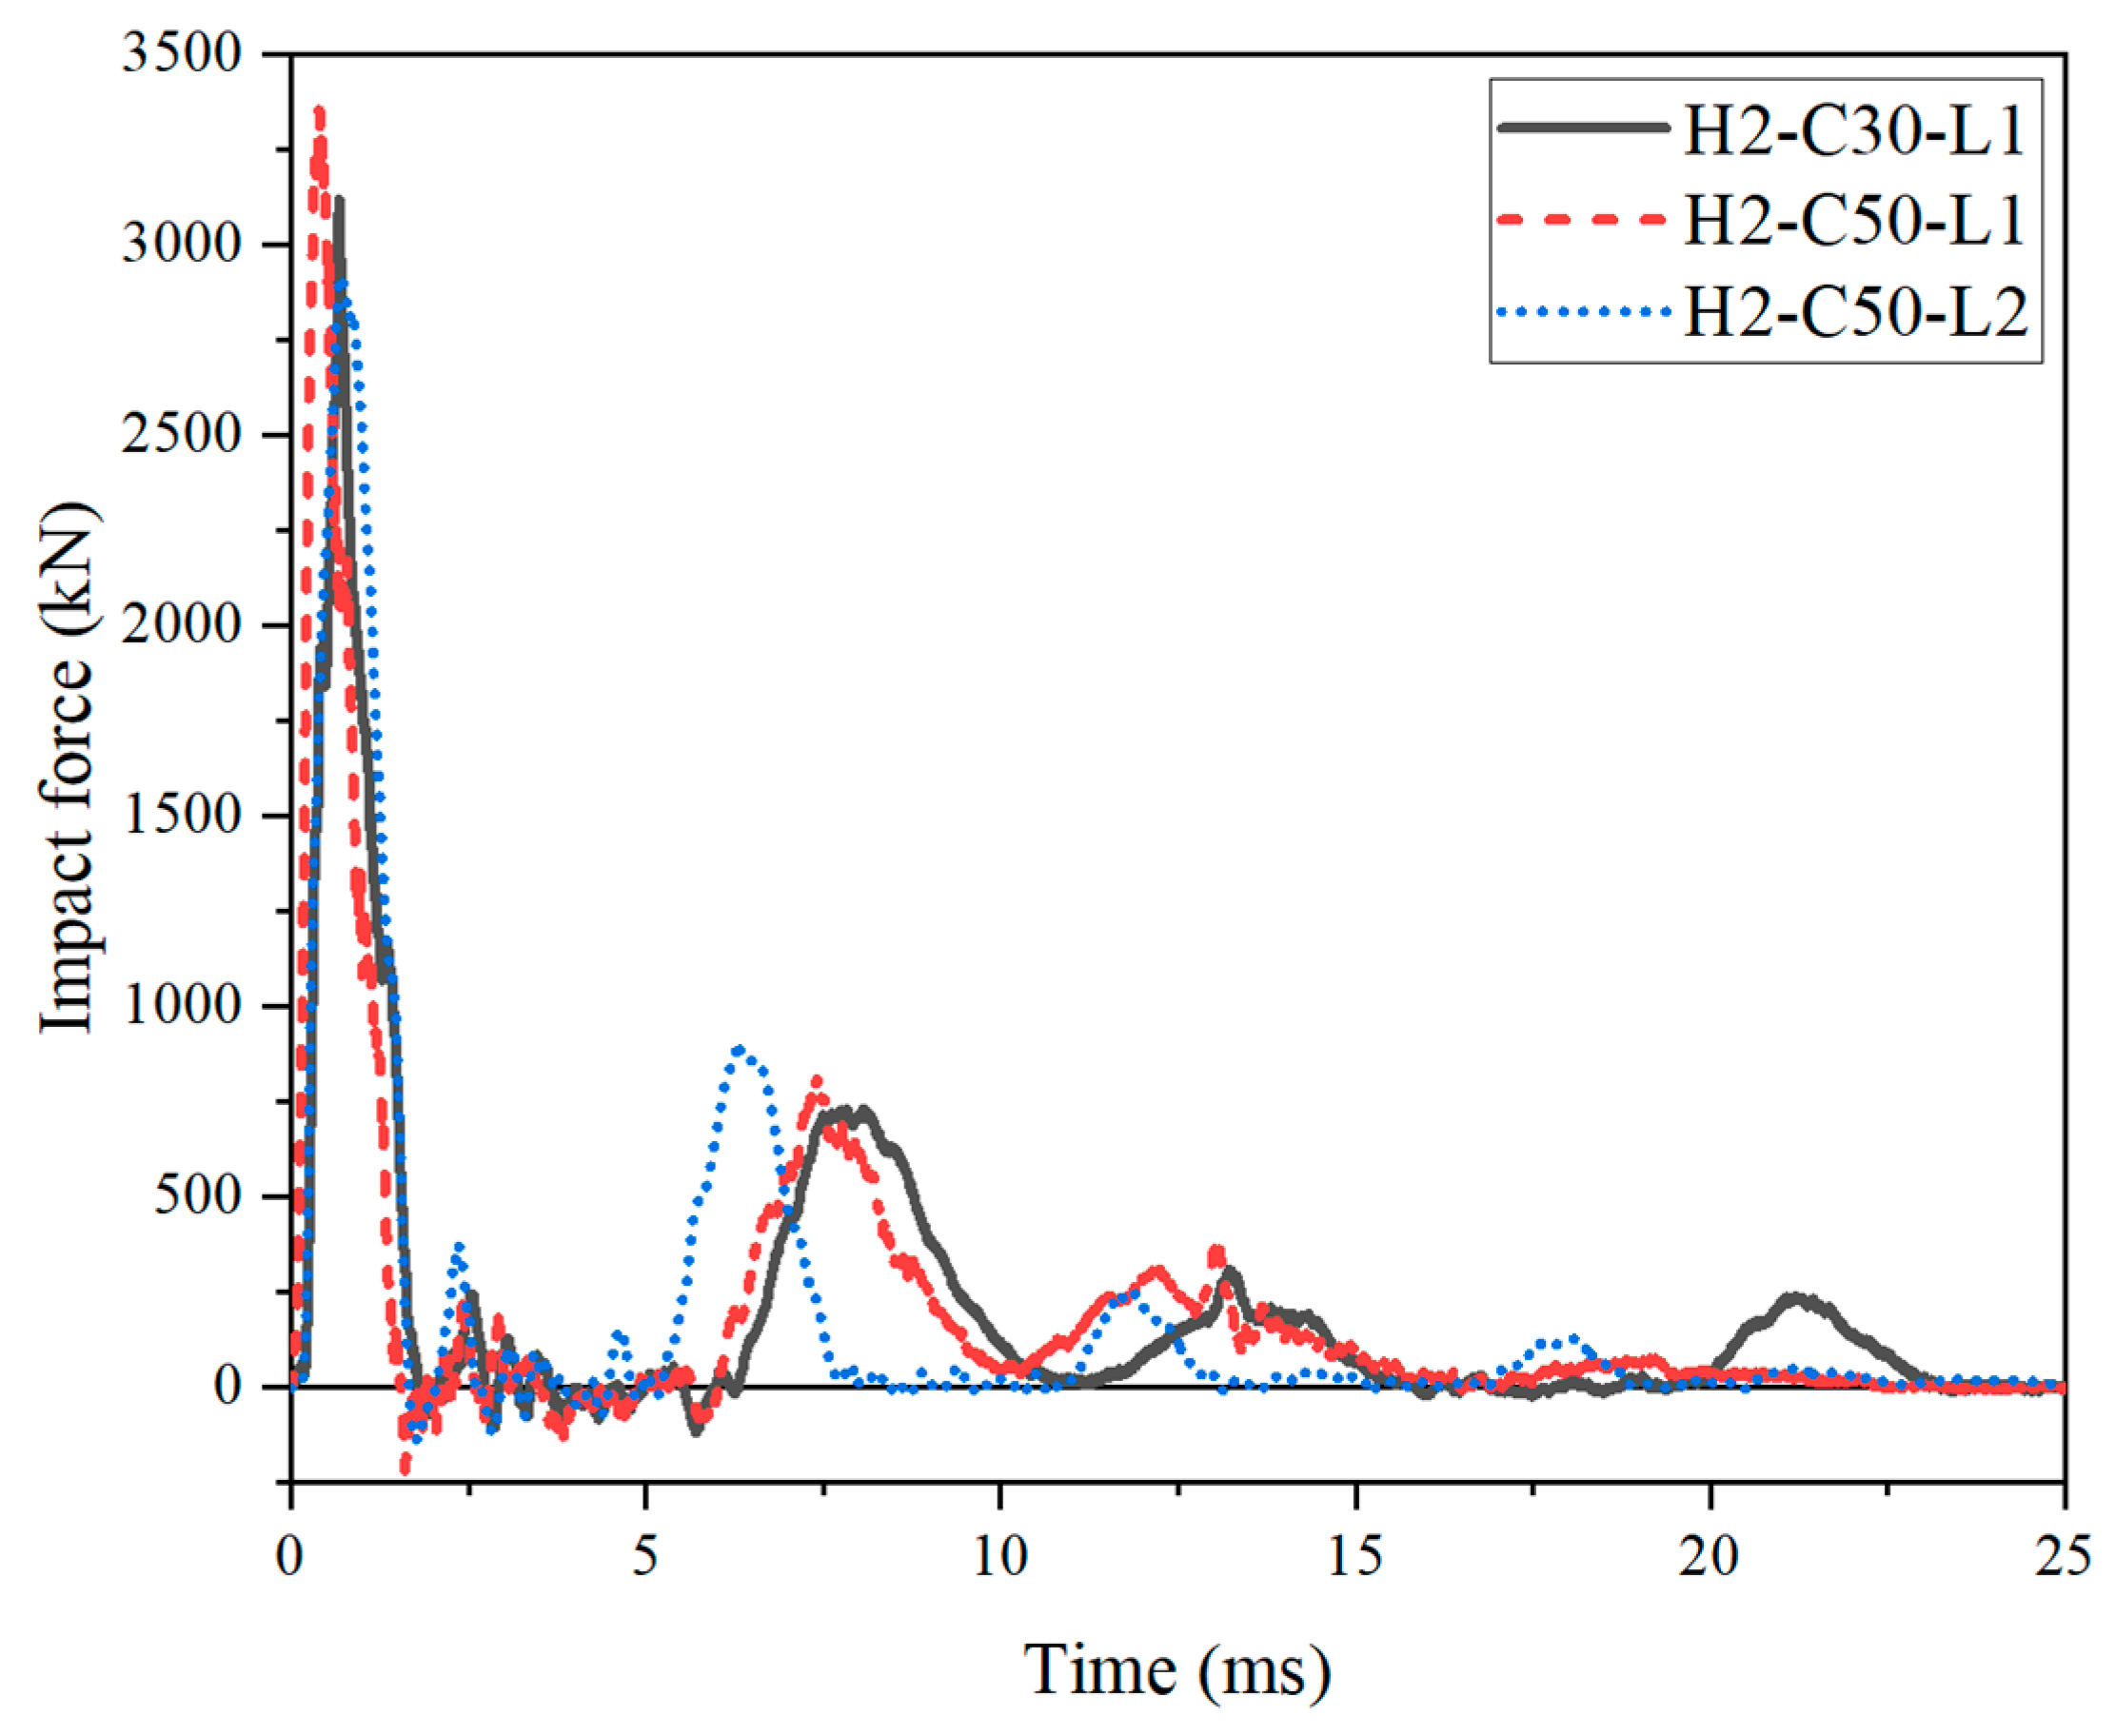
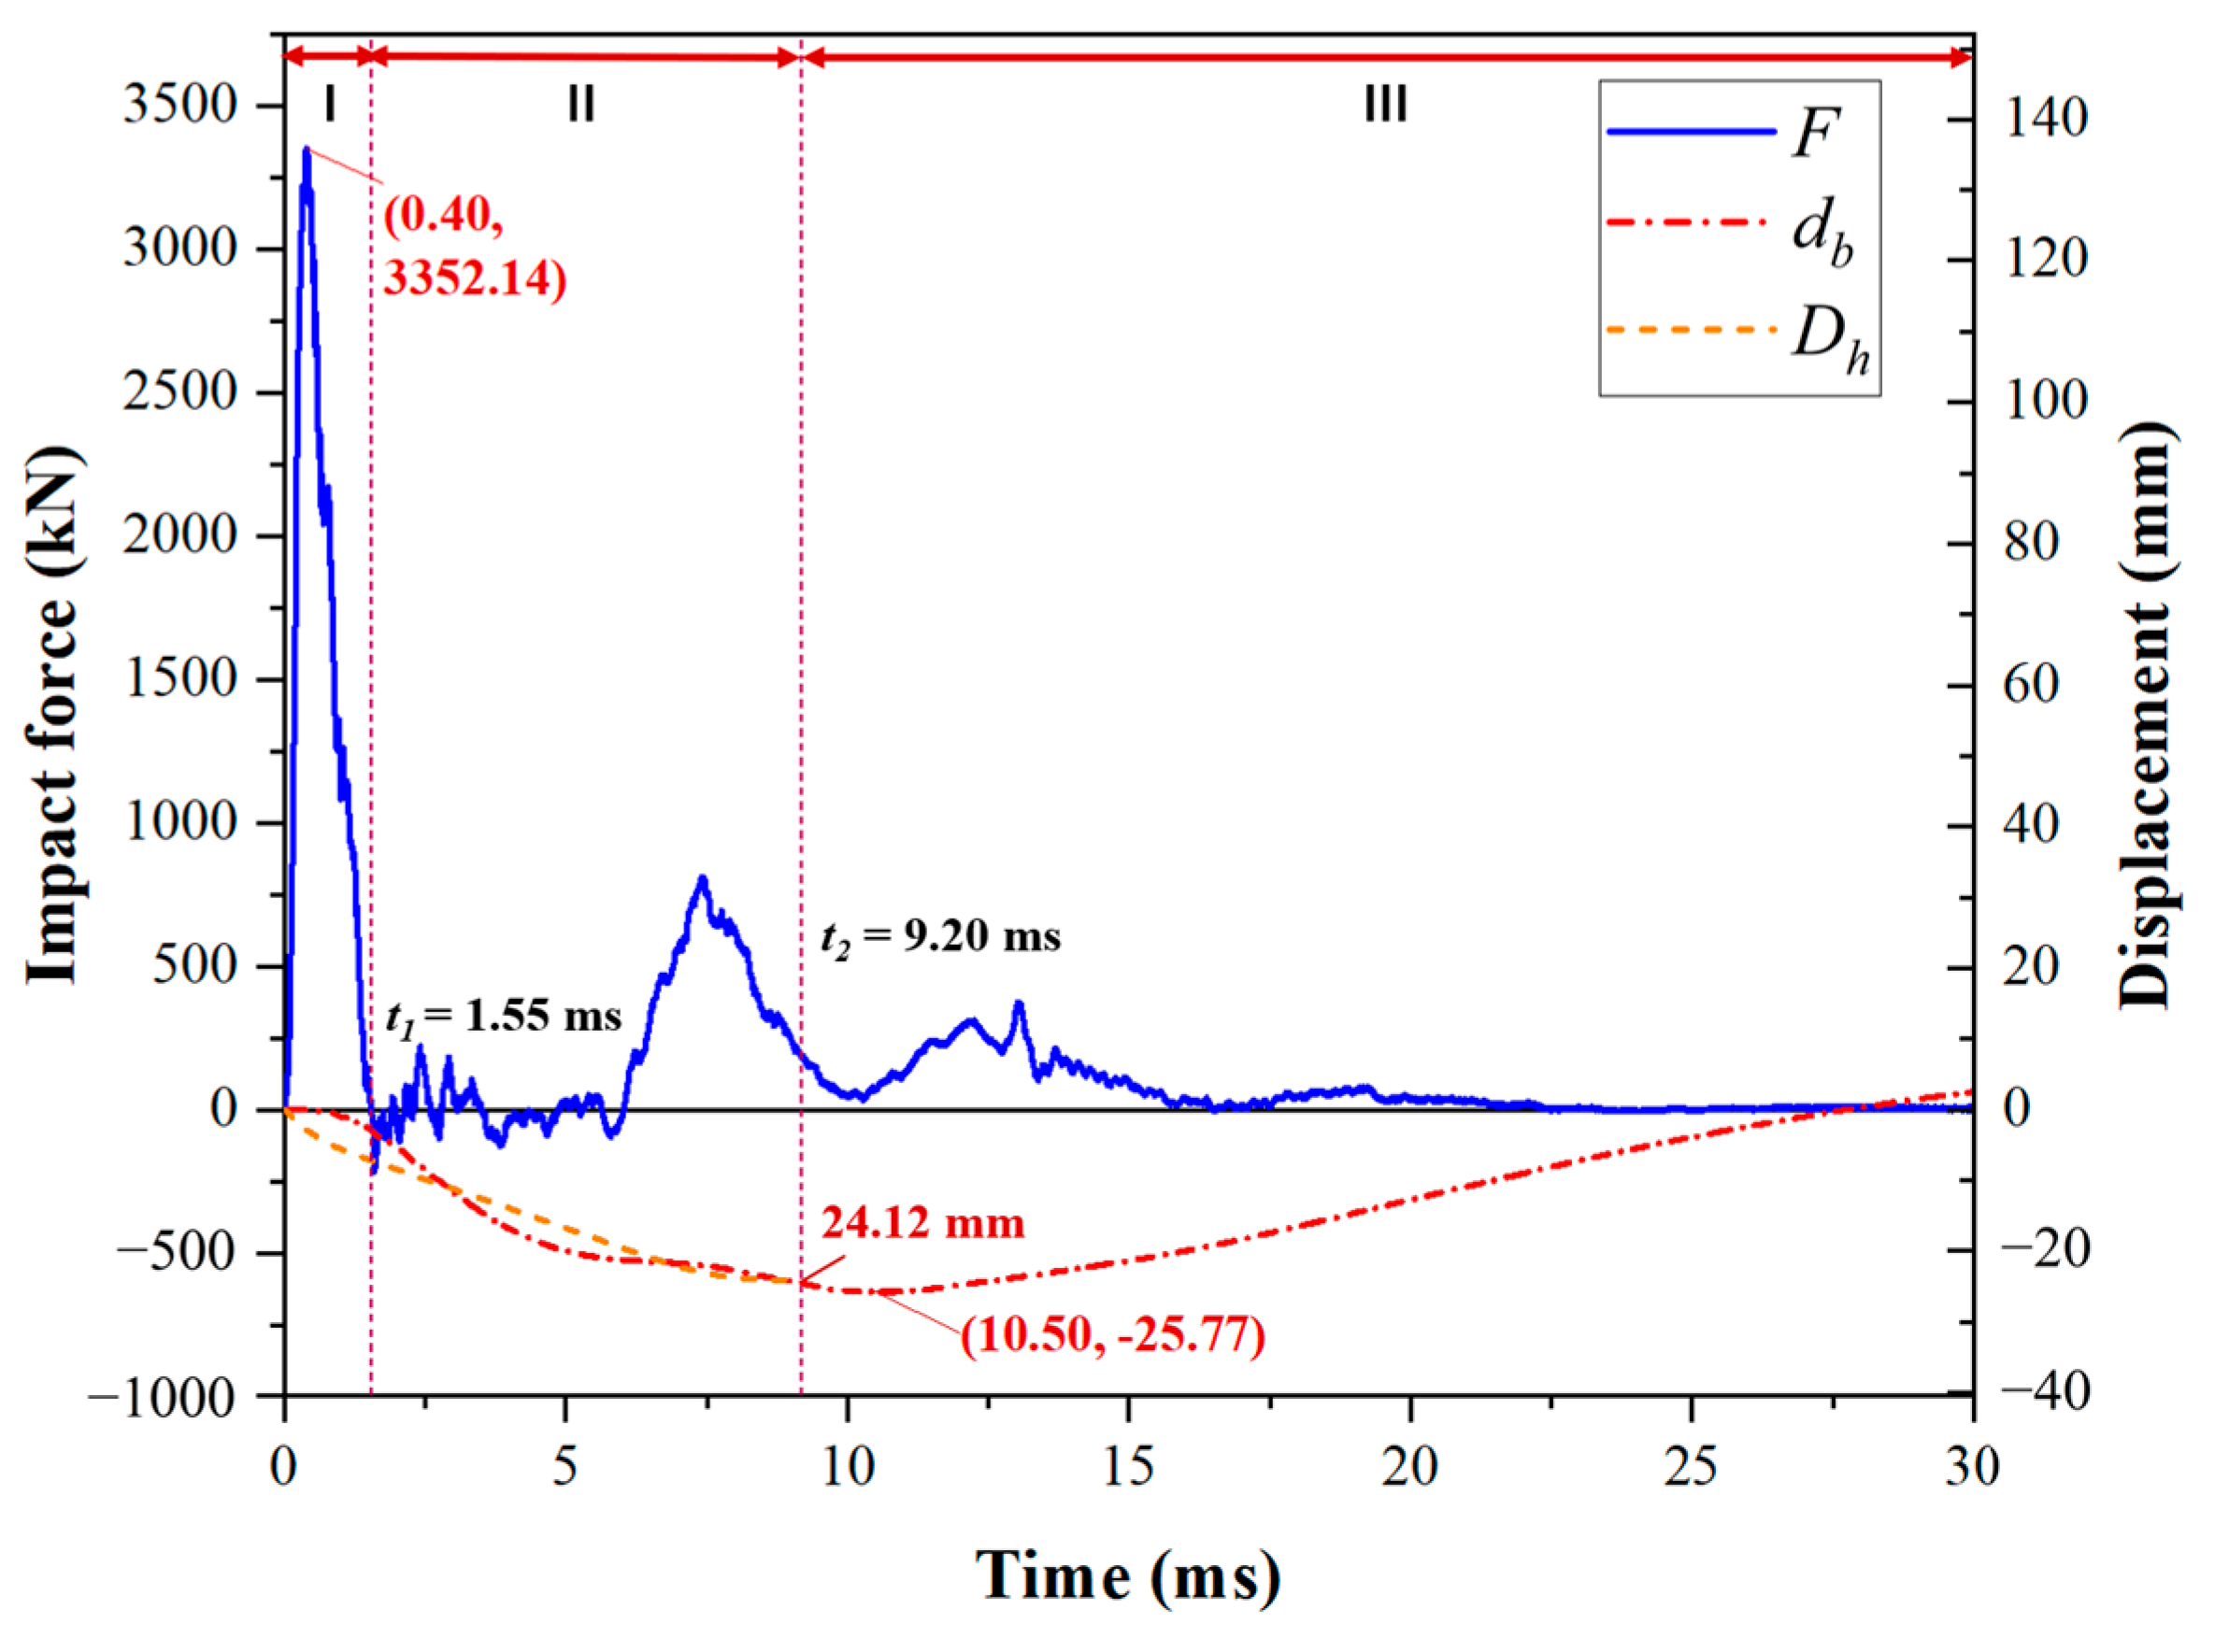
3.2. Impact Force and Deflection Responses

The impact force–time histories of the SC wall-to-foundation connections were compared in Figure 10. All curves were similar, showed a sharp rise to their peak then rapidly dropped to zero at first, which looked like a slim triangle, followed by a series of intense and dense fluctuation. Then, a squat triangle was observed, and after that, there were some slight fluctuations.
As presented in Table 4, the peak impact force (Fp) was increased by 7.5% by increasing the cubic compressive strength of concrete (fcu) from 27.5 MPa to 54.8 MPa, owing to the increased elastic modulus of concrete and local contact stiffness. Moreover, decreasing the impact energy from 14.7 kJ to 9.8 kJ, the Fp decreased from 3352 kN to 2919 kN, which decreased by 12.92%. It could be concluded that the peak impact force was positively correlated with the compressive strength of concrete and impact energy. The impact energy has a more significant influence on the peak impact force.
The deflection–time histories of D5 (location see Figure 5b) of test specimens were presented in Figure 11. All test specimens exhibited comparable deflection responses under impact loading. The db rose to a peak value and subsequently multiple waves with steadily decreasing amplitudes were recorded, since the test specimen began to free vibration after the impact process ended because of its own inertia effect. It is noteworthy that the residual deflection after impact is a critical index to reflect the irreversible damage of the structure. The residual deflection significantly influences long-term serviceability of structures. Consequently, residual deflection is significant in post-impact assessment and repair strategy formulation, as well as a selection of techniques. As given in Table 4, the db,max of specimens H2-C30-L1, H2-C50-L1, and H2-C50-L2 were 28.94 mm, 25.77 mm, and 20.01 mm, respectively. And the corresponding dbr of those specimens were 10.56 mm, 8.36 mm, and 6.40 mm, respectively. As expected, the db,max and dbr notably increased with decreasing compressive strength of concrete (fc) and rising impact energy.
As shown in Figure 11, compared to specimens with a concrete strength grade of C50, the specimen with a concrete strength grade of C30 had a longer free vibration period and larger amplitude. However, the db,max and dbrof H2-C30-L1 were larger than those of H2-C50-L1: 12.3% and 26.3%, respectively. With the same concrete strength grade of C50, compared to specimen H2-C30-L1, specimen H2-C50-L2, which was subjected to lower impact energy, exhibited a shorter free vibration period as well as smaller amplitude, and faster reached the stable value (6.40 mm), named residual deflection. In addition, the db,max and dbr, respectively, decreased by 28.8% and 30.6% as the impact energy decreased from 14.7 kJ to 9.8 kJ.
In addition, an expression Q   =   1     r m a x for evaluating the deflection recovery ability of test specimens after impact was employed in this study [30], where Δr and Δmax are the residual and maximum values of deflection, respectively. The greater deflection recovery capacity was represented by the larger Q value. The calculated Q values of the various locations following impact were presented in Figure 12.
Q values of di,max, dm,max, db,max, and dt,max of H2-C30-L1 were 87.8%, 62.2%, 63.5%, and 60.5%, respectively, whereas those of H2-C50-L1 were 93.4%, 77.6%, 67.6%, and 75.5%, respectively. For specimen H2-C50-L2, Q values of di,max, dm,max, and db,max were 83.5%, 74.0%, and 68.0%, respectively.
As shown in Figure 12, the deflection recovery ability of all specimens was greater than 60% due to the flexural failure mode. Overall, the Q values of specimen H2-C30-L1 were lower than those of specimen H2-C50-L1, while the difference in Q values between specimens H2-C50-L1 and H2-C50-L2 was relatively small (less than 10%). Therefore, it can be concluded that as the concrete strength of the SC wall increased, the deflection recovery ability of the specimen also increased, but reducing the impact energy had little effect on the recovery ability of the test specimens.
The distribution of permanent deflection on the bottom steel plate is shown in Figure 13. The deformed shapes of all test specimens presented an approximately linear shape along the x direction of the SC wall (800 mm), indicating the flexural failure mode. Generally, the permanent deflection values of H2-C30-L1 were larger than those of H2-C50-L1, while those of specimens H2-C50-L1 and H2-C50-L2 were relatively close. This indicated that the influence of concrete strength on permanent deflection was more significant than that of impact energy.

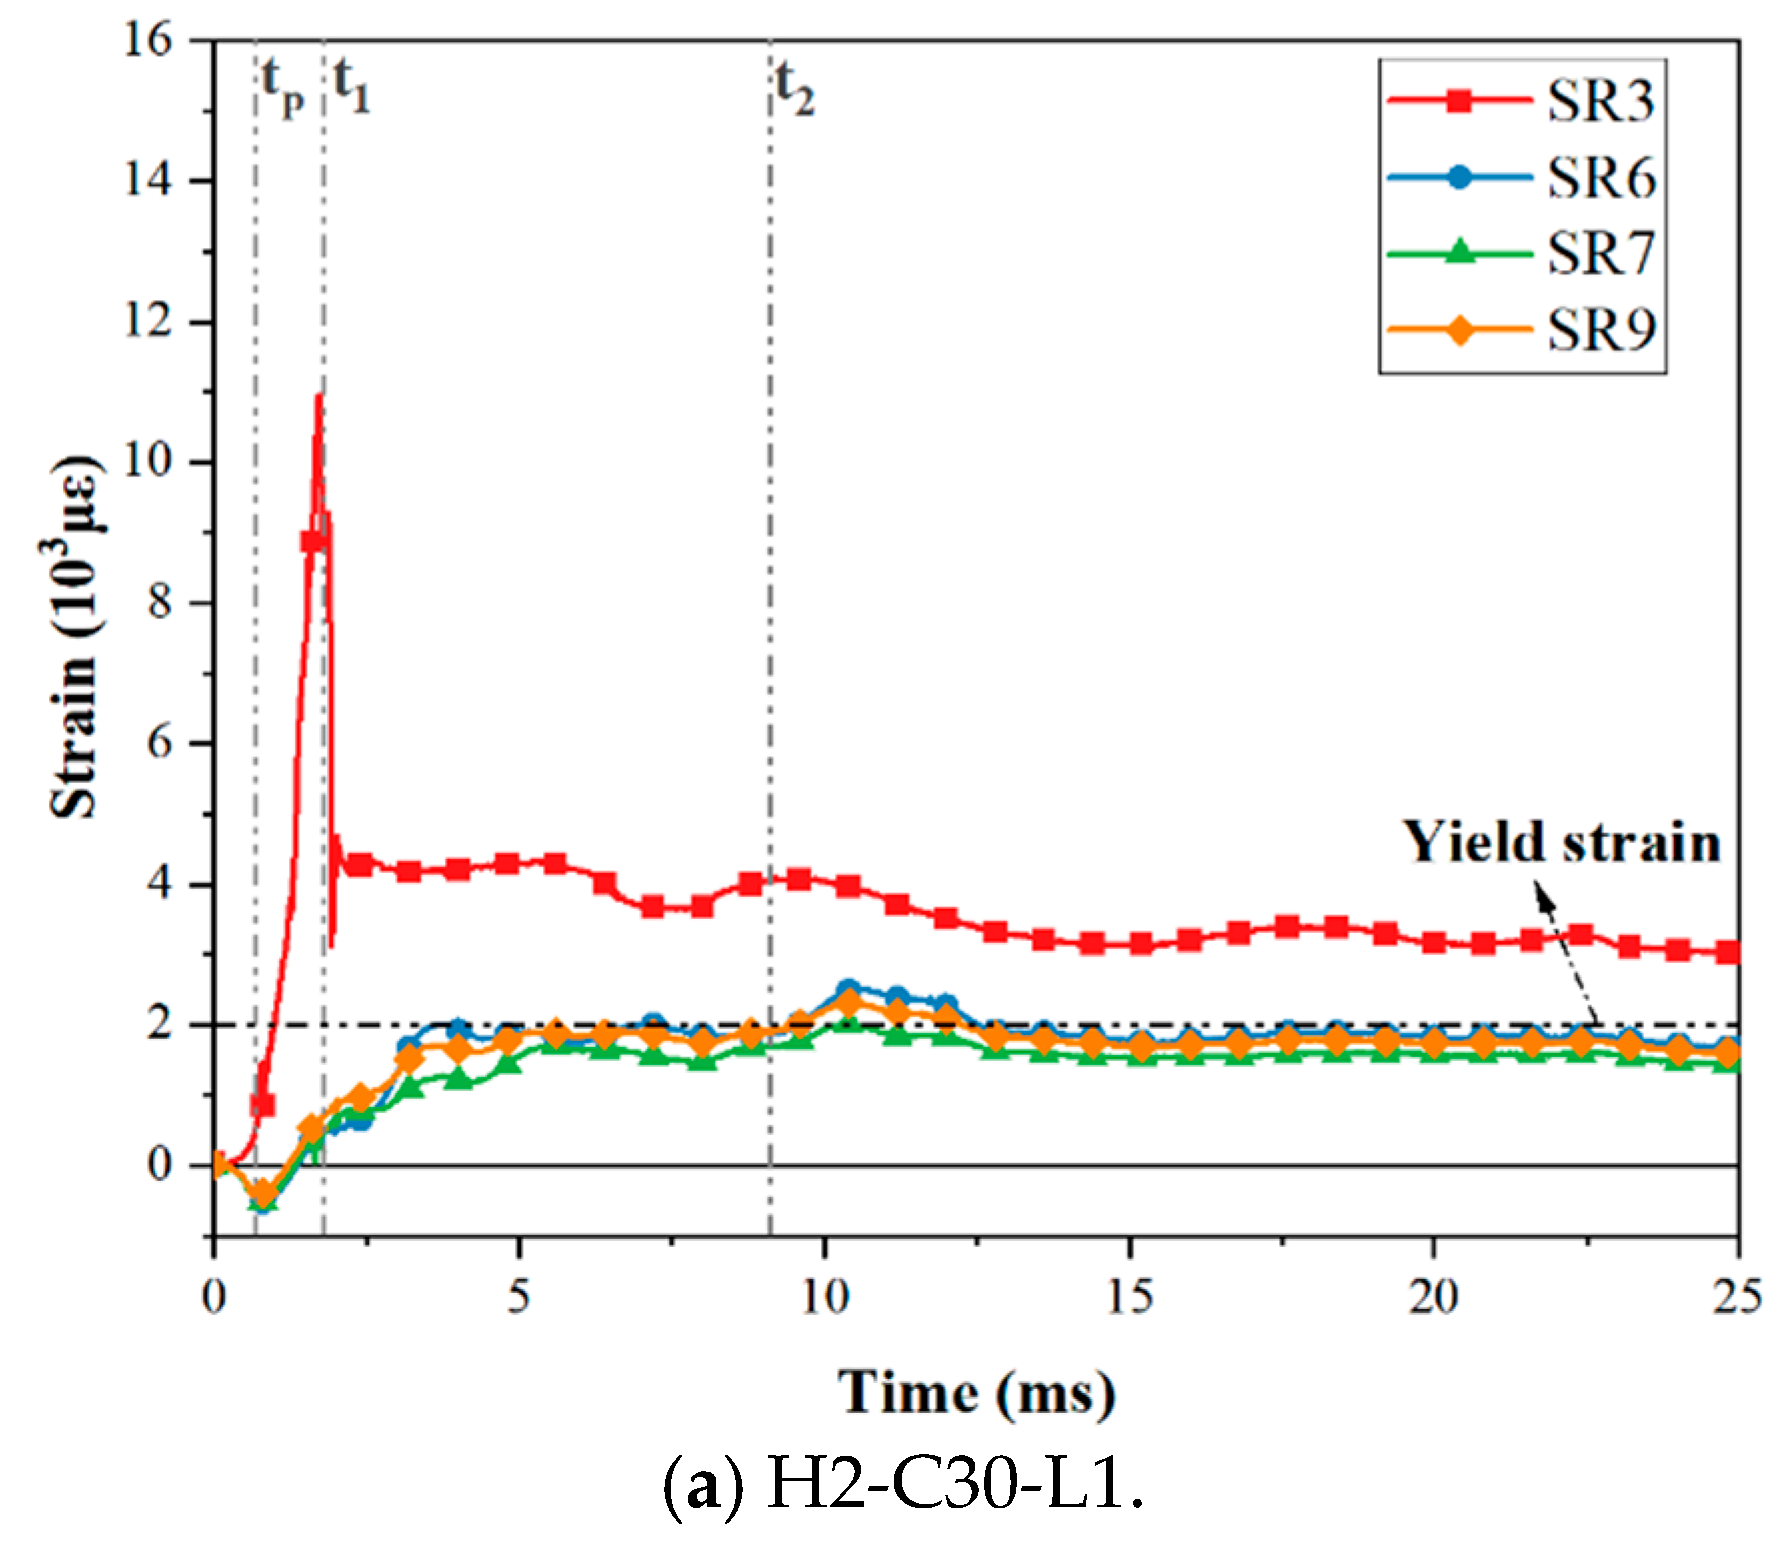
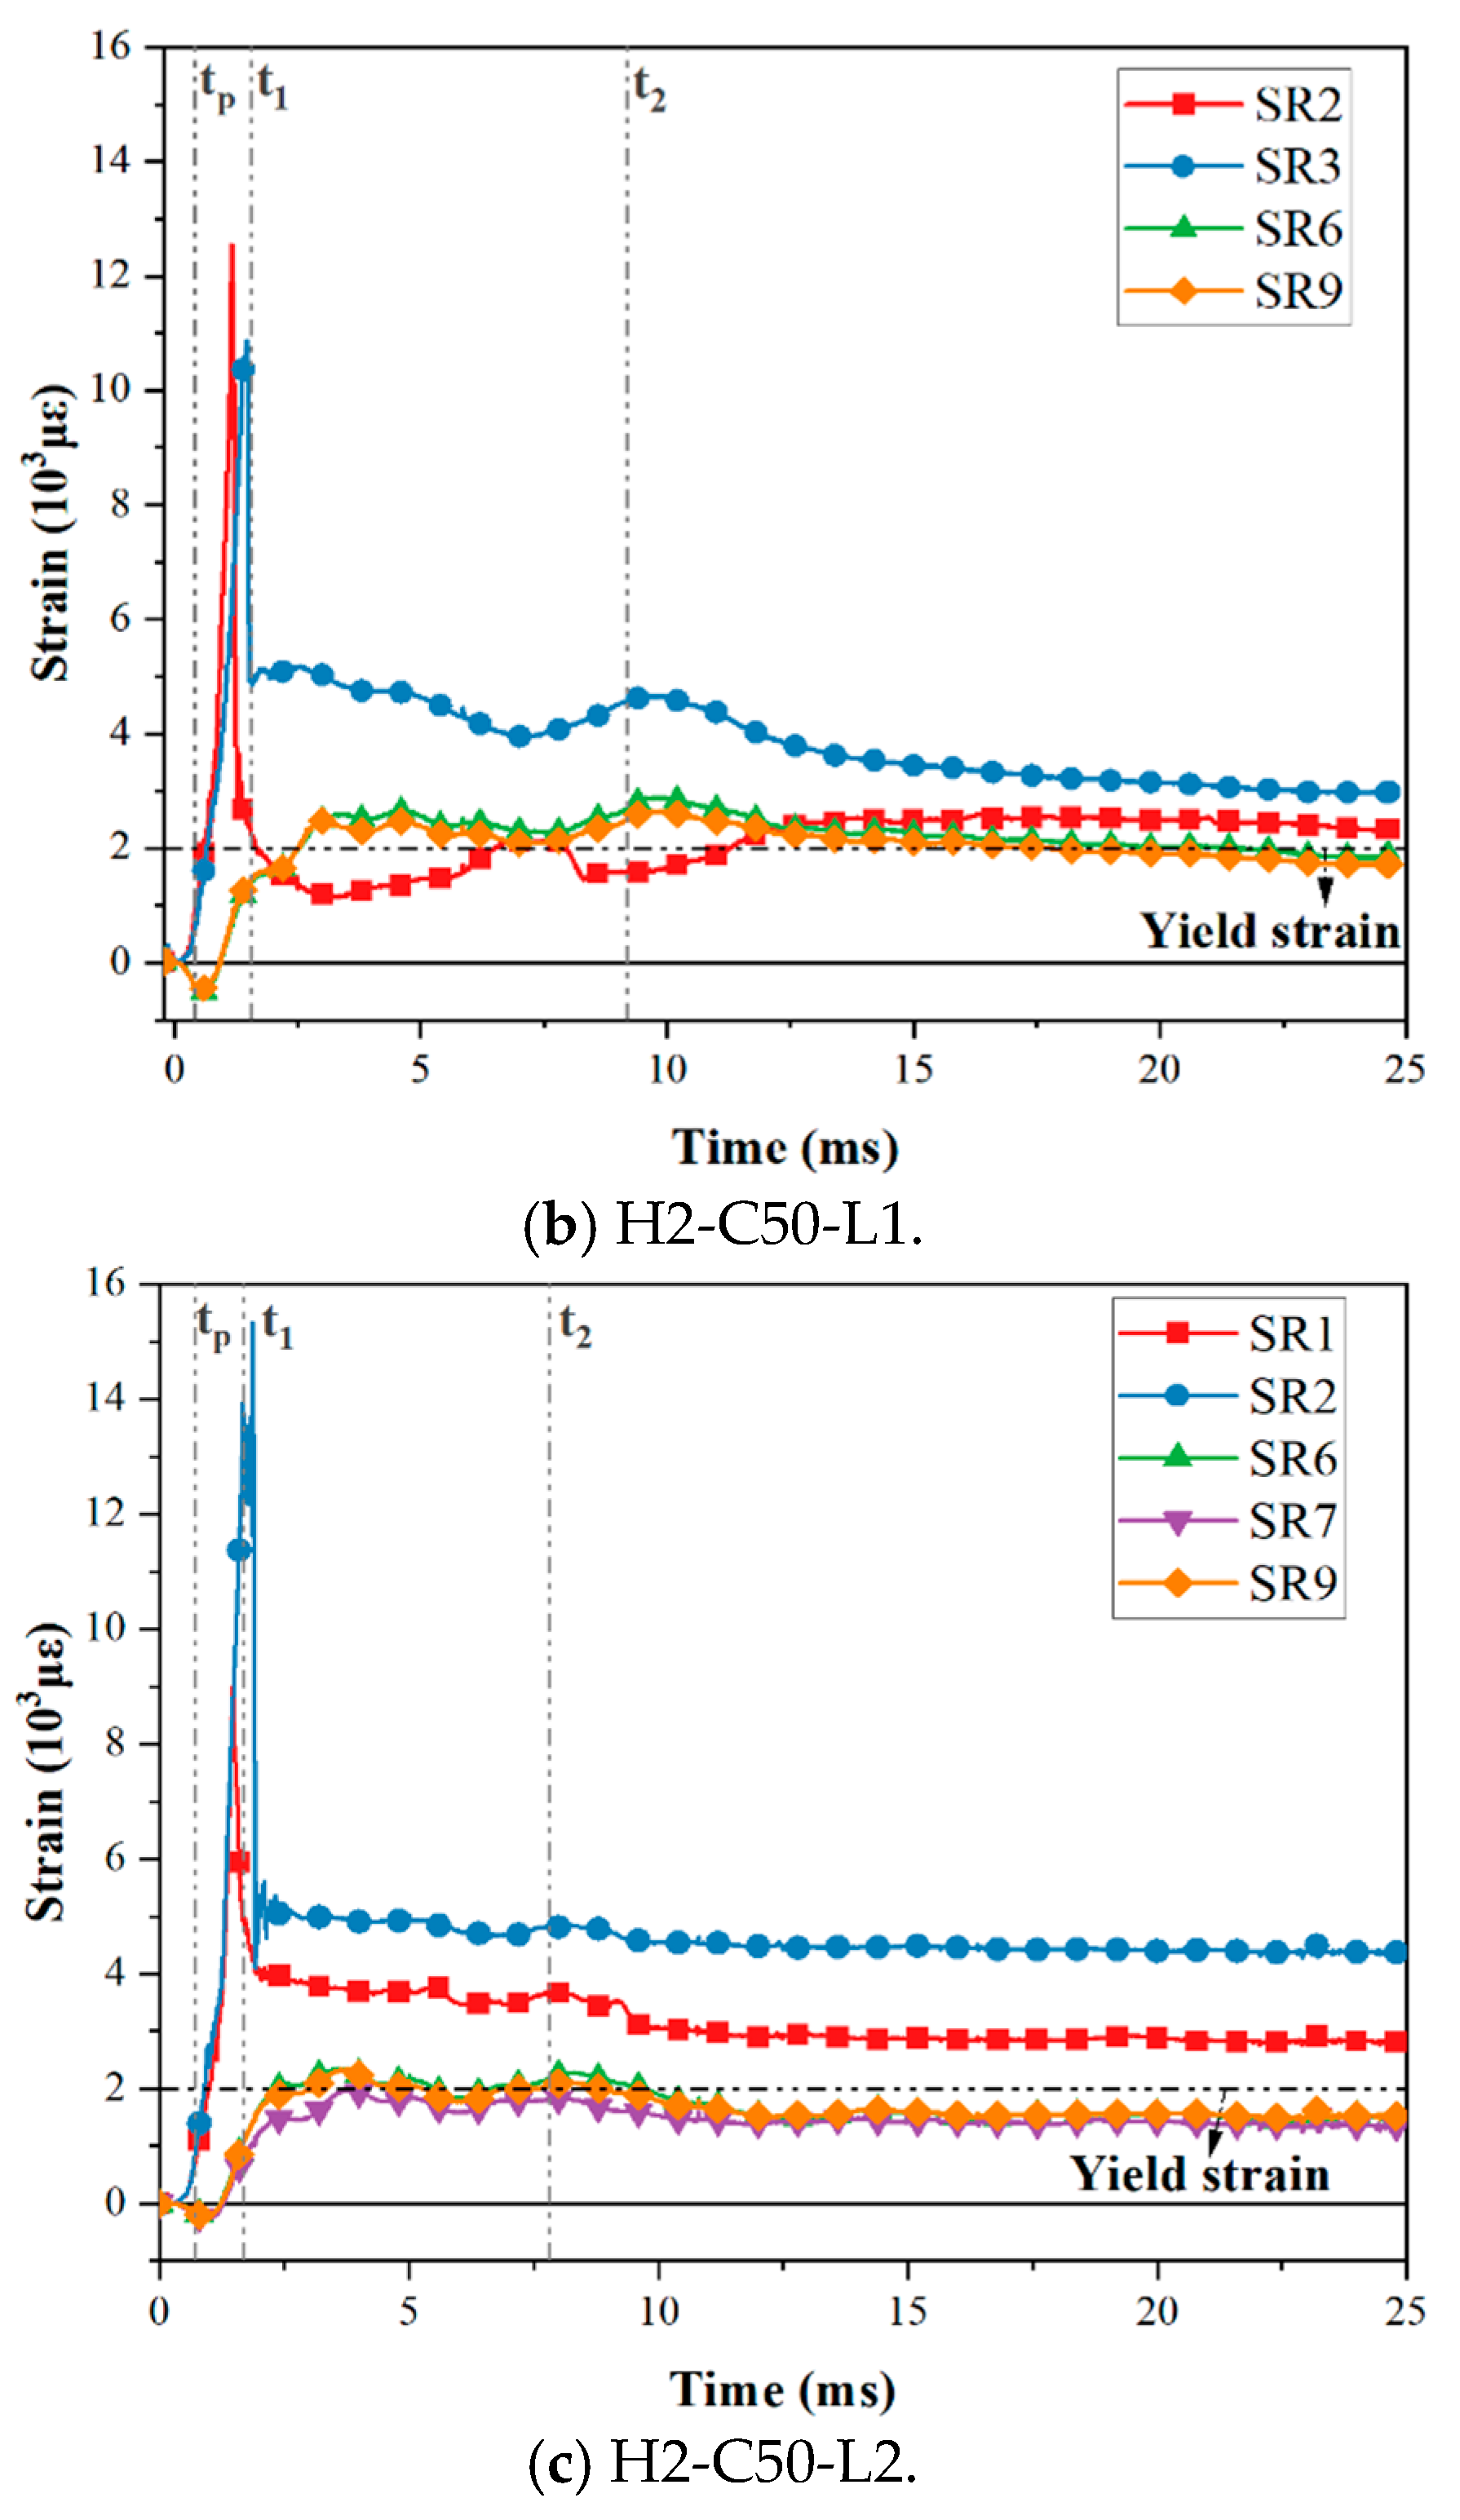
3.3. Strain Response

Under the impact load, the bending moment on the interface made the interface open, the upper steel plate and the RC foundation separated, and the axial tension on the steel plate was gradually transferred to the tensile dowels. The force transfer process was accomplished via concrete compression struts formed by the dowels, headed studs, angles, tie channels, and the steel plate [18,20]. The stress was subsequently transmitted through the dowels. The strain distribution of dowel rebars and steel plates was measured in this experiment; the arrangement of the measuring points is shown in Figure 4. According to the data obtained from the strain gauges, the strain gauges near the interface (SR1–3 and SR6–8) of the three specimens yielded. As for the remaining three strain gauges, only SR9, which was located in the impact area on the back impact side of the specimens, also yielded. Figure 14 presents the strain–time history curves of yielding strain gauges on three test specimens. Partial strain gauge failure occurred during impact tests, so those curves were not plotted. Specifically, gauges SR1 and SR2 in Specimen H2-C30-L1, SR1 in Specimen H2-C50-L1, and SR3 in Specimen H2-C50-L2 were damaged. This indicated that the upper dowel rebars at the interface were more seriously affected by the impact. Three key time points (tp, t1, t2) were defined, where tp was the time at which the impact force reached its peak; t1 was the time at which the hammer contacted the SC wall again; t2 was the time at which the hammer reached its maximum deflection.
As shown in Figure 14, the trend of the strain–time history curves of the three test specimens is consistent. The upper dowel rebars (SR1–3) subjected to tensile force rapidly yielded and reached the maximum strain. The bottom dowel rebars (SR6–9) were under compression at the beginning of the impact process, then became subject to tension since the interface opening, reaching the yield strain. Therefore, it can be seen that the curves of upper dowel rebars (SR1–3) exhibited relatively large discreteness due to being closer to the impact position, while those of the bottom dowel rebars (SR6–9) were basically consistent. The residual strain can relatively reflect the degree of damage to the specimen after impact, and the larger the residual strain, the higher the degree of damage. As seen in Figure 14, the maximum and residual strains of bottom dowel rebars in specimen H2-C50-L2 were smaller than those in specimen H2-C50-L1, while that in specimens H2-C30-L1 and H2-C50-L1 were similar. In addition, it was noticed that the dowel rebars of H2-C50-L1 yielded earlier than those of H2-C30-L1. The reason might be that the C50 concrete transmitted impact energy faster than C30 concrete.
Six strain gauges (SS1–6) were placed on the bottom steel plate of the test specimens, and the test results showed that most of the strain gauges on the steel plate did not yield. Figure 15 showed the strain time history curves of strain gauges SS2 and SS3 at the interface of the bottom steel plate. As seen in Figure 15, during the impact process, the bottom steel plates of all specimens remained in a compressed state. As expected, the maximum strains and residual strains of the bottom steel plate in specimen H2-C50-L1 were obviously larger than those in specimen H2-C50-L2, which was consistent with the trend seen in the bottom dowel rebars. The steel plate of specimen H2-C50-L1 yielded, probably because the peak impact force of this specimen was the highest among all specimens.

3.4. Impact Dynamic Response Mechanism

All test specimens presented similar behavior in terms of impact force, deflection, and strain over time responses. The typical impact force as well as the deflection versus time curves of the test specimens are shown in Figure 16. Three impact response stages can be distinguished, named inertial, loading, and unloading stages, as defined in previous studies [31,32]. Three key time points (tp, t1, t2) were defined in Section 3.3.
The first stage was the inertial stage. The hammer and the top surface of the SC wall first contacted at this stage. The impact load does not fully affect the entire specimen, but only acts on the local impact area, resulting in the impact area of the SC wall moving downwards together with the hammer at the same speed, while the bottom steel plate remains stationary. Thus, the impact force rapidly increased to the peak value (Fp) within 1 ms, whereas the deflection of the hammer (Dh) rose linearly, and the interface began to open. After tp, the upper dowel rebars yielded in tension and reached the maximum strain value, while the bottom dowel rebars transitioned from a compressed state to a tensile state, indicating that the opening at the interface led to a smaller compression zone (the region primarily subjected to compressive stresses due to the impact load in the cross-section of interface). Afterwards, the pressure was only supported by a small portion of the concrete and bottom steel plates in the compression zone. Therefore, the pressure on the lower steel plates gradually increased in this stage. Meanwhile, the impact force dropped quickly and eventually vanished since the hammer tended to separate from the SC wall, as the hammer’s velocity decreased and the SC wall’s velocity increased.
The second stage was the loading stage. In this stage, as stress waves propagated, the disturbed zone gradually developed from the local impact area to the undisturbed zone, and the wall began to accelerate downward movement since the kinetic energy obtained by the impact load. Initially, the velocity of the SC wall was greater than that of the hammer. However, due to the resistance of the connection, the velocity of the SC wall decreased, as the tangent slope of the db-t curve dropped, and the velocity of the hammer was greater than that of the SC wall. Therefore, the SC wall and the hammer continuously contacted and separated between t1 and t2, resulting in multiple oscillations in the impact force time–history curve. Meanwhile, the strain value of upper dowel rebars decreased, whereas the bottom dowel rebars yielded in tension. After the second stable contact between the SC wall and the hammer, their velocities tended to be consistent, and the impact force reached the second peak. At t2, the deflection of the hammer reached its maximum value. Under the impact loading, the bending deformation of the specimen and the opening of the interface provided the main bearing capacity during this stage. In addition, as the concrete of the SC wall gradually absorbed impact energy, some cracks were observed.
The third stage was the unloading stage. The hammer started to move upward at the beginning of this stage. The strain value of the dowel rebars gradually stabilized at the residual strain, while that of the bottom steel plate tended to decrease to a stable value. As the specimen slowly reached its maximum deflection, the SC wall began to rebound, owing to the stored elastic potential energy of the specimen being converted into kinetic energy. Subsequently, a rebound peak force was observed, probably because the upward movement velocity of the SC wall gradually increased from zero to the maximum value, resulting in the contact force between the hammer and the SC wall briefly increasing. Finally, when the impact force stayed zero, indicating the hammer was completely separated from the SC wall, the impact process was ended.

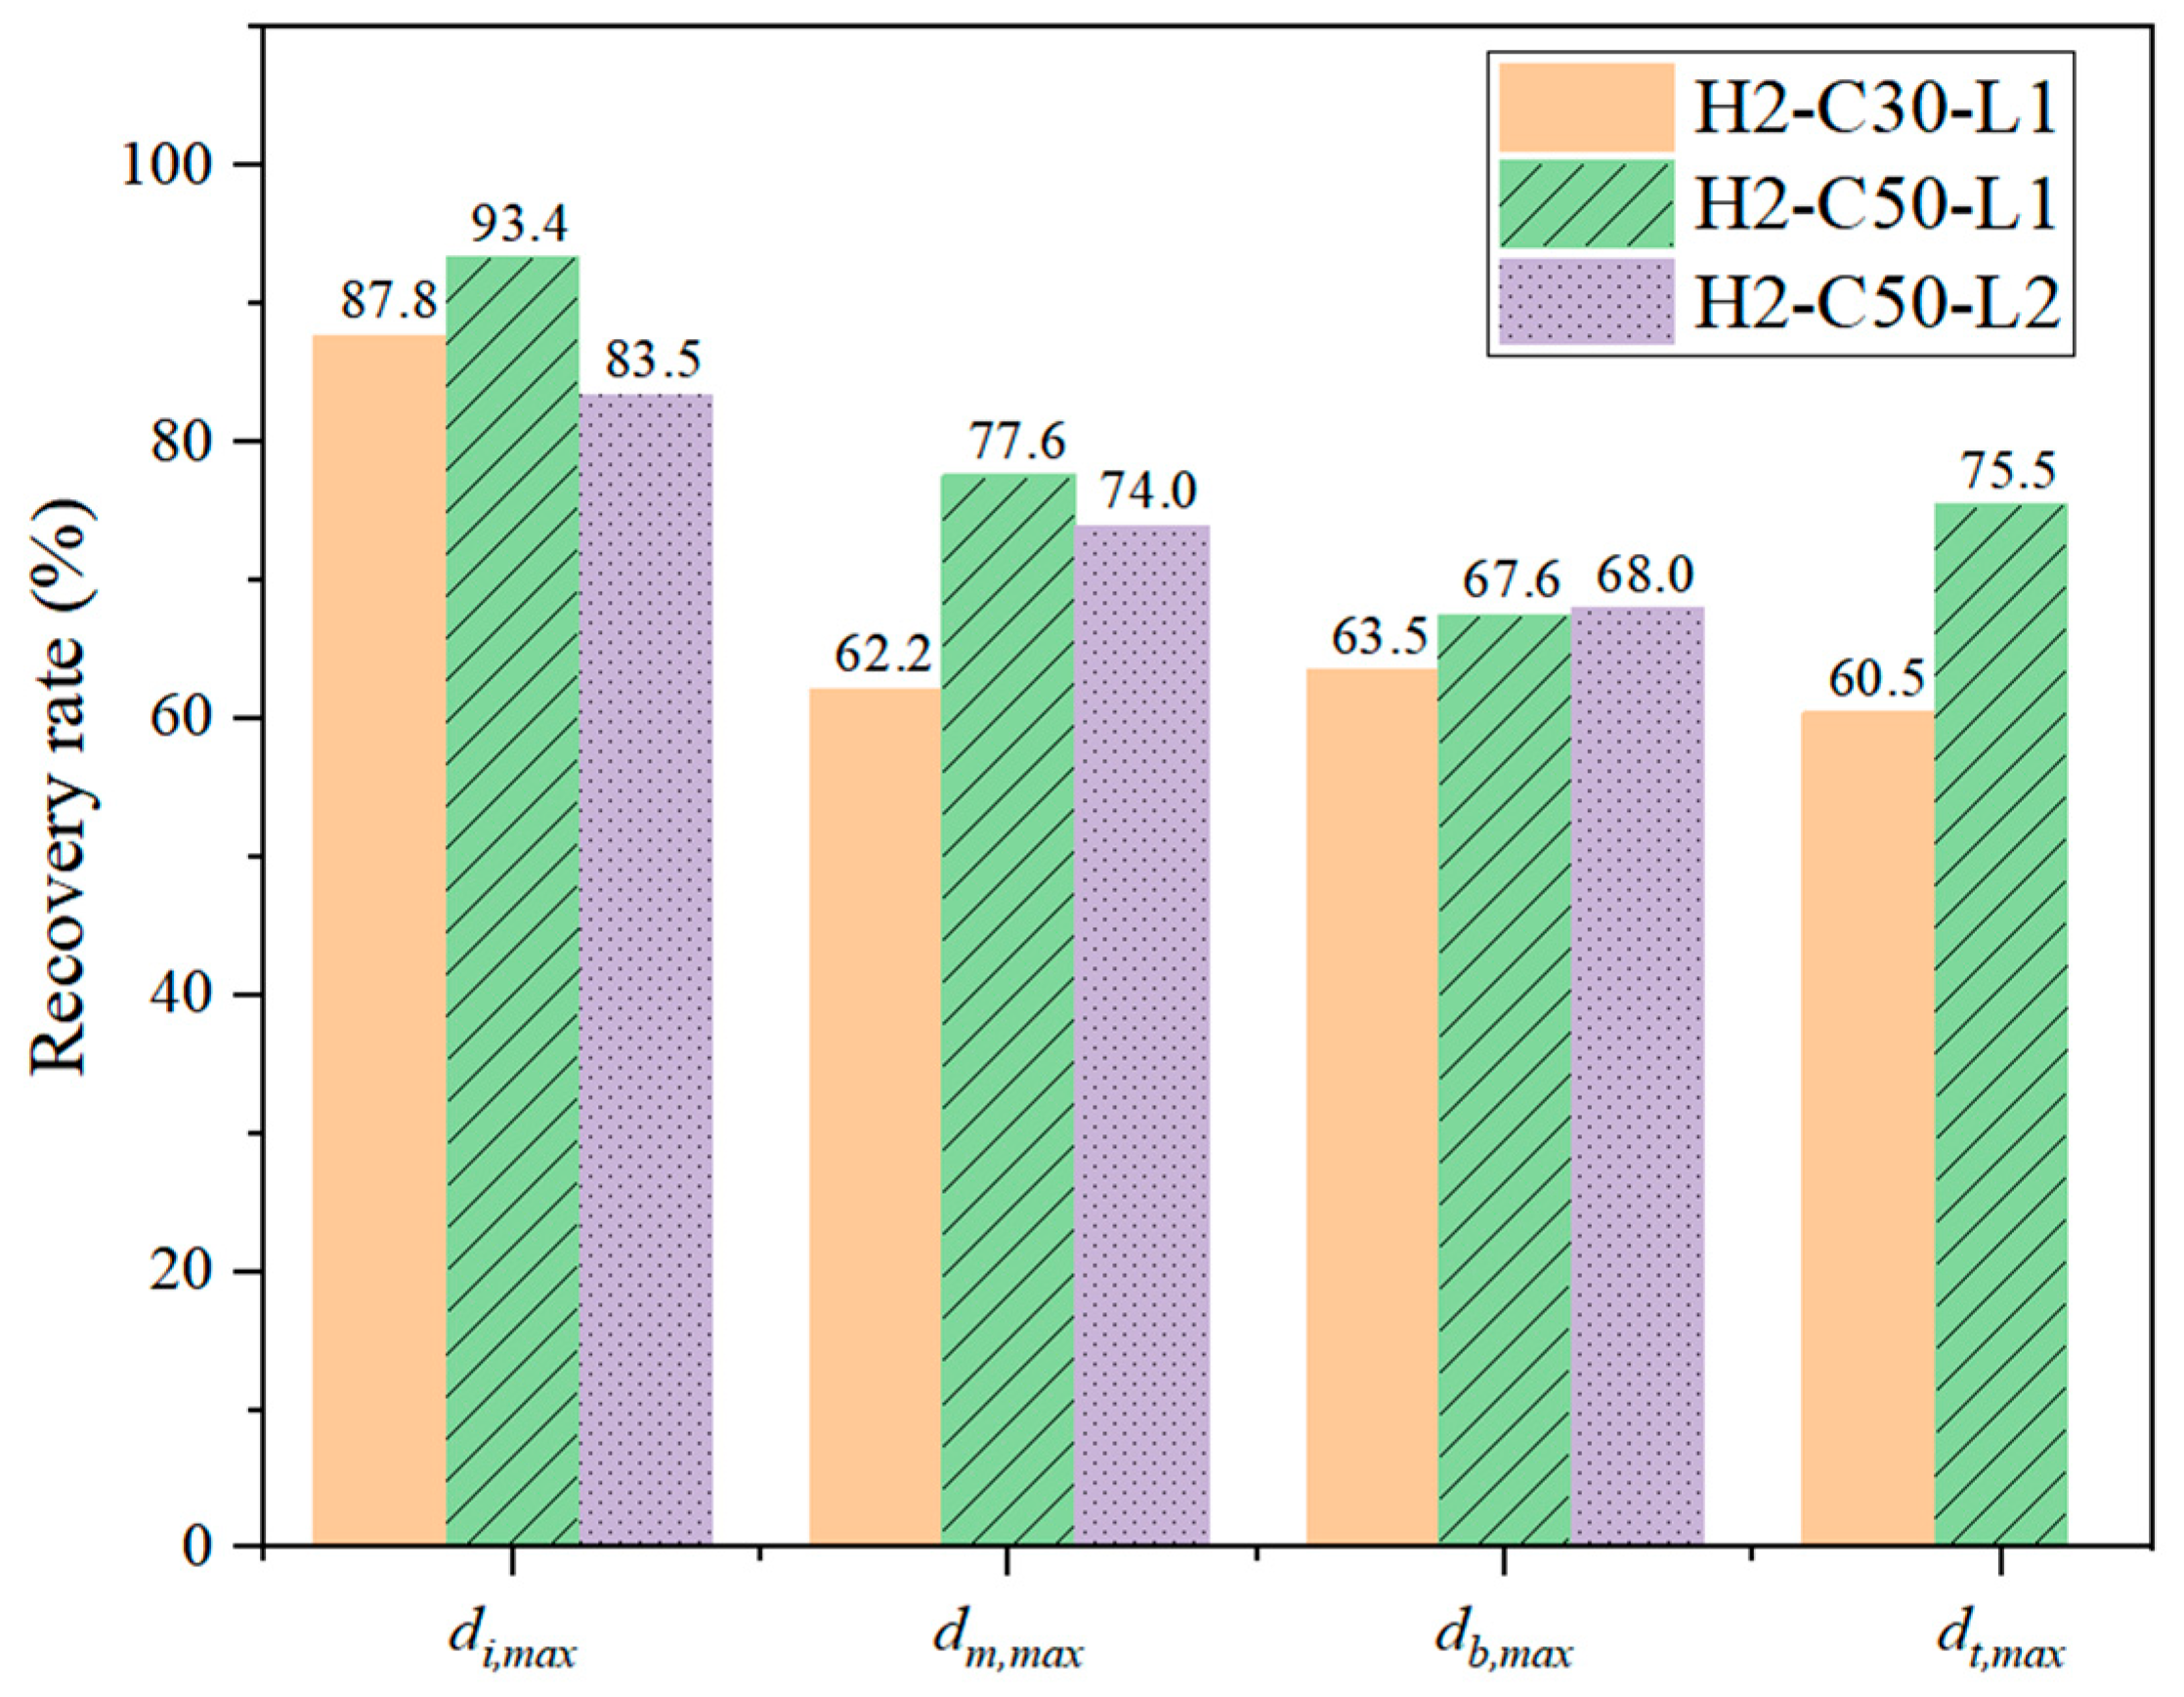
3.5. Influence of Design Parameters

3.5.1. Influence of Concrete Strength Grade

Comparisons of the experimental results for specimens H2-C30-L1 and H2-C50-L1 were presented in Section 3.1, Section 3.2, Section 3.3 and Section 3.4, which indicated the effect of concrete strength. In general, the damage degree of the SC wall, structural integrity, and deflection recovery ability after impact were greatly affected by the strength grade of concrete. When the concrete strength grade of the SC wall increased from C30 to C50, the damage degree of SC wall concrete and interface (i.e., number of cracks in SC wall, crack length, and width of the interface) decreased. The Fp showed the same trend, but only increased by 6.97%. Therefore, the db,max and dbr of specimen H2-C50-L1 were smaller than those of specimen H2-C30-L1: 12.3% and 26.3%, respectively. As for the residual deflections of the bottom steel plate, the values along the x direction (see Figure 13) of H2-C50-L1 were smaller than those of H2-C30-L1. The values of deflection recovery rate (Q) of di,max, dm,max, db,max, and dt,max of specimen H2-C50-L1 were larger than those of specimen H2-C30-L1: 5.6%, 15.4%, 4.1%, and 15.0%, respectively. This was explained by the fact that the increase in concrete strength grade can improve the contact stiffness, structural integrity, and global resistance of the test specimens.

3.5.2. Influence of Impact Energy

According to the test results for specimens H2-C50-L1 and H2-C50-L2, discussed in Section 3.1, Section 3.2, Section 3.3 and Section 3.4, as the impact energy (E) decreased from 14.7 kJ to 9.8 kJ, the average interfacial cracking length decreased from approximately 9/10 of the wall height to around 8/10 of that, while Fp decreased by 12.92%. In addition, the db,max and dbr decreased by 28.8% and 30.6%, respectively. The specimen with lower impact energy had shorter vibration and smaller amplitude. Nevertheless, as illustrated in Figure 12 and Figure 13, the deflection recovery ability was not significantly affected by the change in impact energy. Overall, the impact energy has a significant influence on the cracking length of the interface, peak impact force, as well as overall deflection and strain responses. Zhao et al. [15] also demonstrated that the impact energy influenced the impact behavior of the SC panels.

4. Numerical Study

4.1. FE Model Establishment

In this study, the ANSYS/LS-DYNA 14.0 software was used to perform the FE model of the test specimens subjected to impact loading [33]. As illustrated in Figure 17, the FE model was developed according to the settings of the impact test. Solid element (Solid 164) was used for the concrete, hammer, and floor. The steel plates, stiffening angles, tie channels, and square steel pipes were modeled using the Belytschko–Tsay shell element (Shell 163) [31,32]. Headed studs, dowel rebars, RC foundation rebars, and threaded rods were simulated using the Hughes–Liu with cross-section integration beam element (Beam 161) [15,34]. To balance accuracy and computation time, the mesh size of steel plates, concrete of SC wall, headed studs, stiffening angles, tie channels, and dowel rebars was determined to be 10 mm, a rough size of 50 mm was used for the rebars, square steel pipes, and threaded rods, while the mesh size of 20 mm was chosen for other components.
The Continuous Surface Cap Model (CSCM) was employed to simulate the behavior of concrete [14,31,32,35]. This model assumes that the concrete in the elastic stage exhibits isotropic behavior before cracking, while the behavior of concrete after the elastic stage is plastic. The failure surface and the hardening cap of this model have a smooth intersection [32]. Steel components were modeled using the Piecewise Linear Plasticity material model. The stress–strain relationship for each component was derived from the results of coupon tests [31,32]. Additionally, the Cowper and Symonds model was utilized to consider the strain rate effect by increasing the flow stress of steel with the strain rate parameters C and P. For this study, the parameters were chosen as C = 40.4 and P = 5 [36]. A Rigid Material Model was implemented to simulate the behavior of the hammer.
The interaction between different parts in the model was defined by Automatic-Surface-to-Surface contact algorithm. The contact pairs include the following: (1) the hammer and the steel plates; (2) the steel plates and the concrete of SC wall; (3) the steel plates and concrete of foundation wall; (4) the concrete of SC wall and the concrete of foundation; (5) the SC wall and the hammer. In this study, the friction applied to the interfaces between the hammer and the steel plates, as well as the SC wall, was 0.2. The friction between the concrete of the SC wall and the concrete of the foundation was 0.9. For the steel plates and the concrete, the static and dynamic coefficients of friction were 0.45 and 0.57, respectively. The contact algorithm *Tied_Shell_Edge_To_Surface was utilized to simulate the welds between steel plates and stiffening angles, as well as those between the tie channel and stiffening angles. Additionally, the merge nodes method was applied between steel plates and headed studs. To simulate the bonding effect between steel components and concrete, the keyword *Constrained_Lagrange_In_Solid was used. Furthermore, the management of hourglass energy employed the Flanagan–Belytschko method with exact volume integration (type 3). An hourglass coefficient of 0.14 was employed as the default value. As shown in Figure 17, the fixed boundary can be accomplished by constraining the deflection and rotations of nodes on the bottom of the floor and threaded rods in the FE model. In addition, the actual initial velocity from the tests was applied to the hammer as impact velocity using the *Initial_Velocity_Generation keyword.

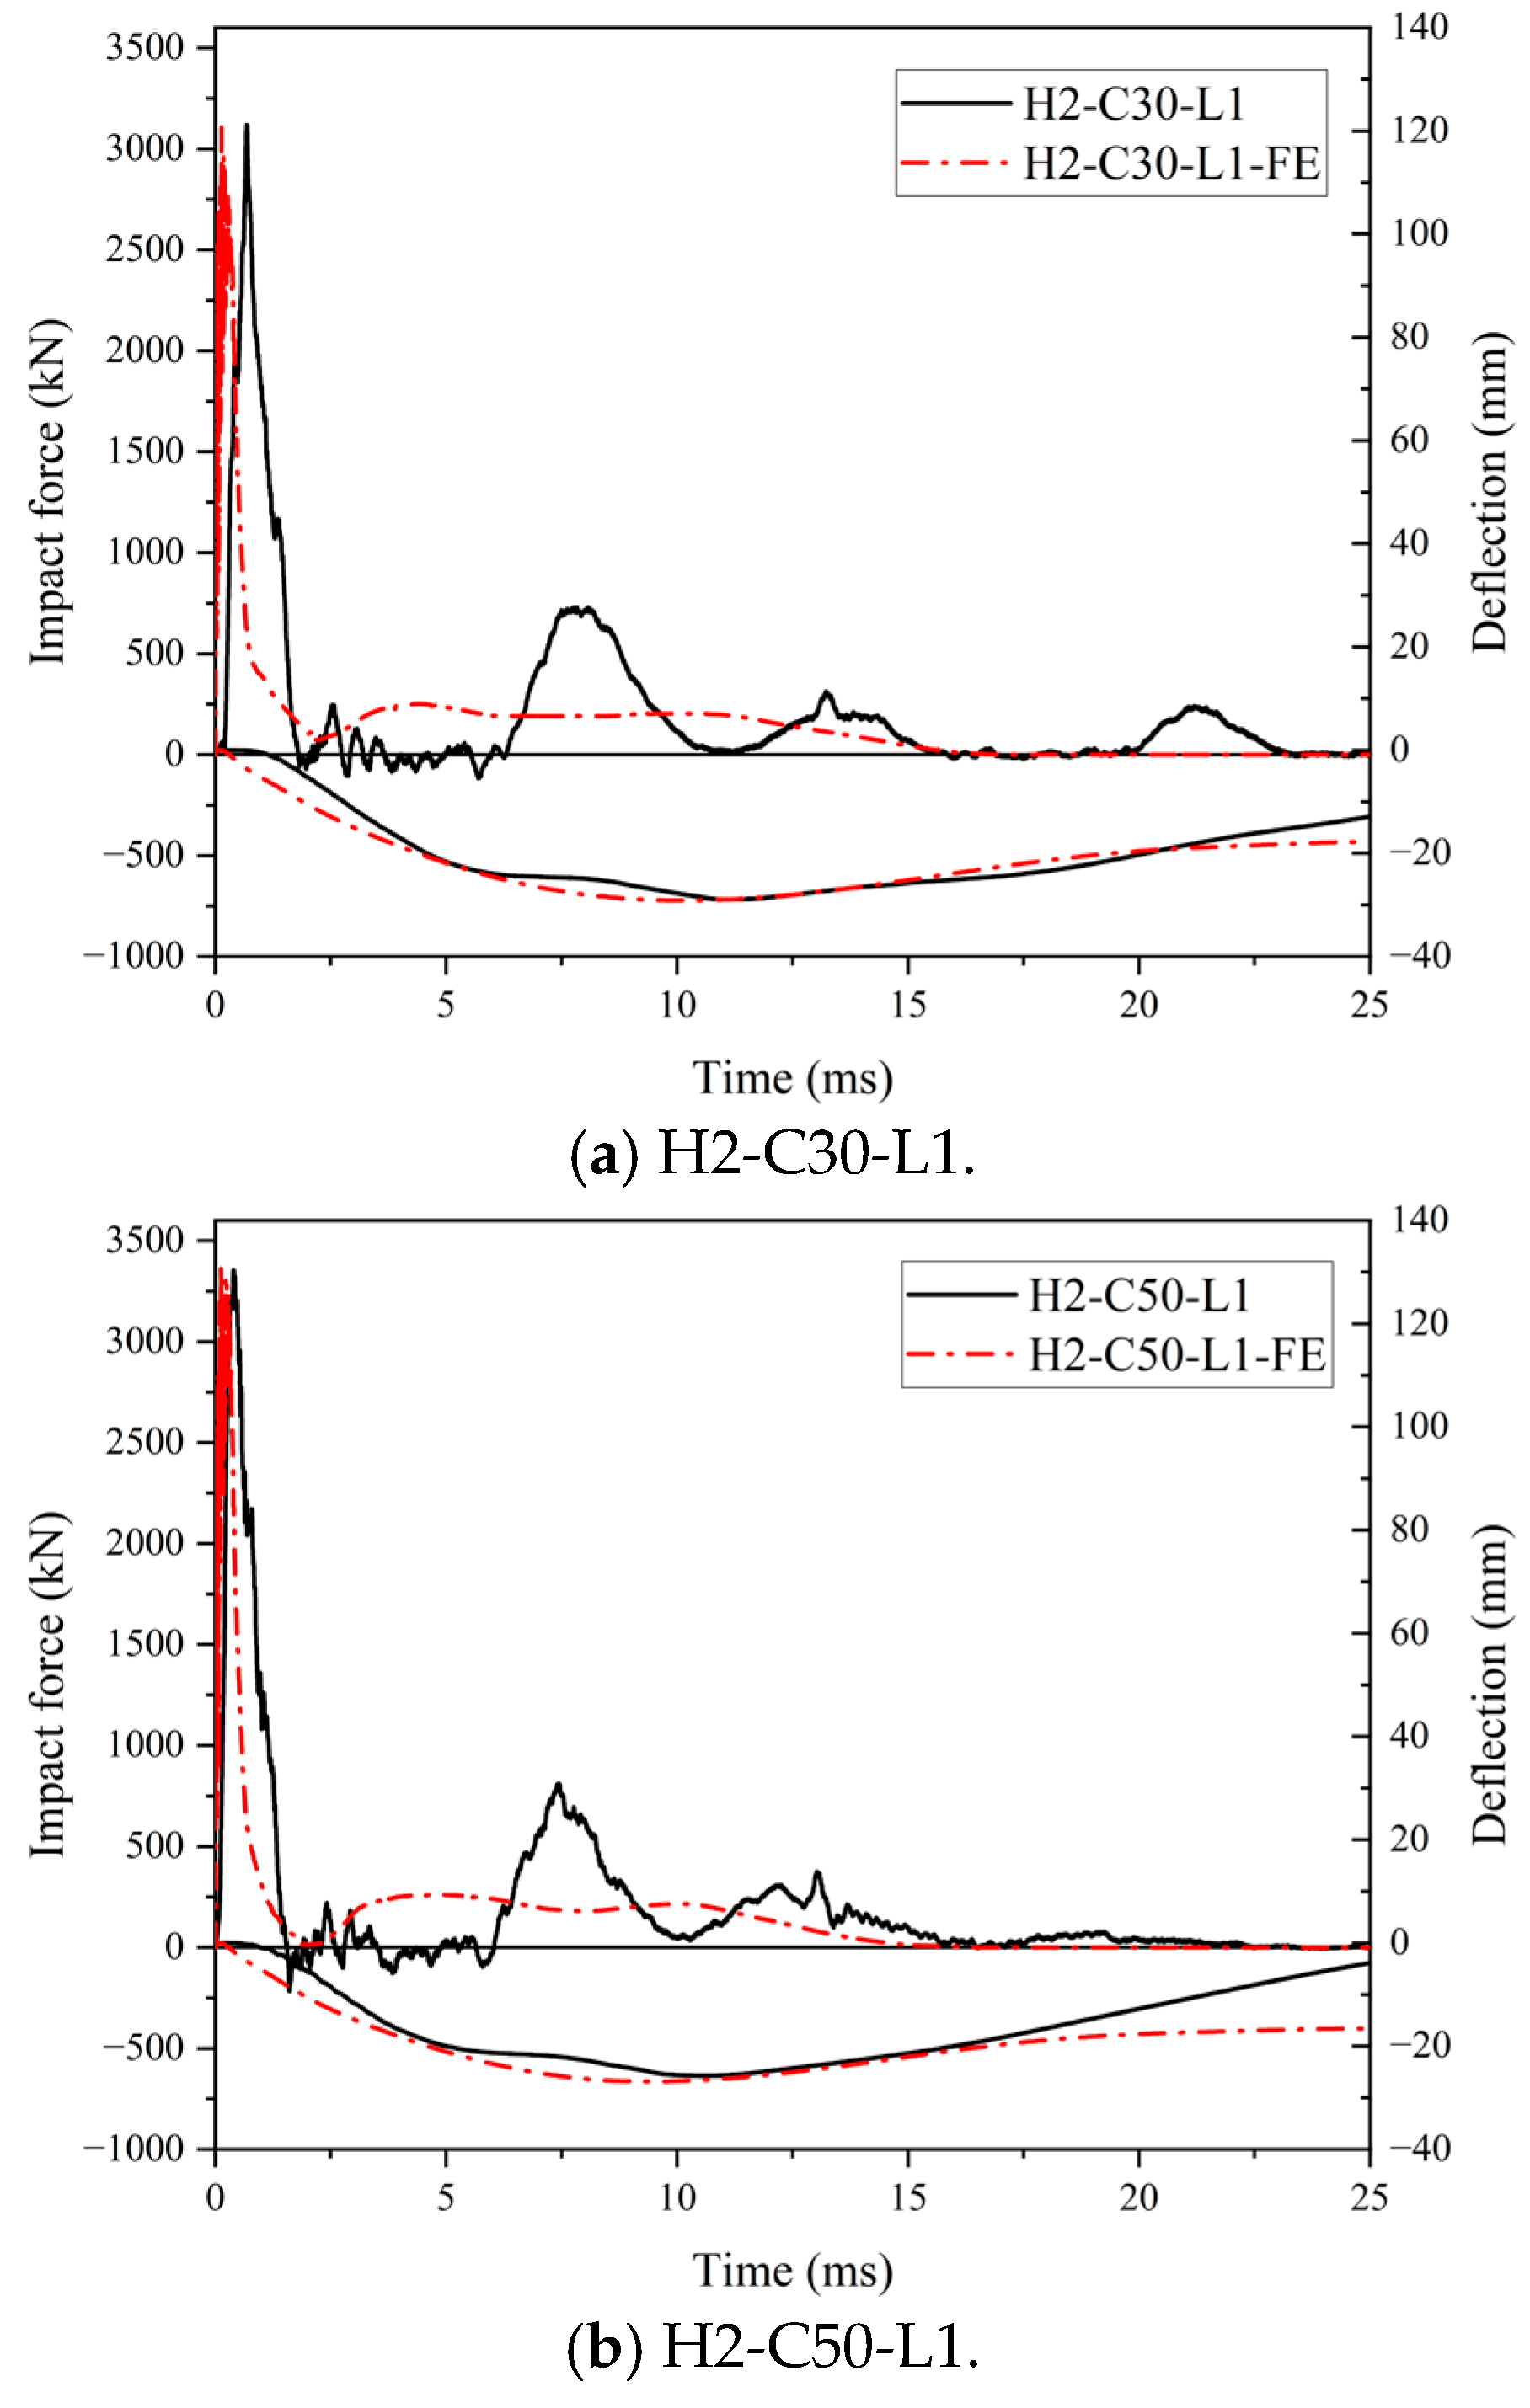
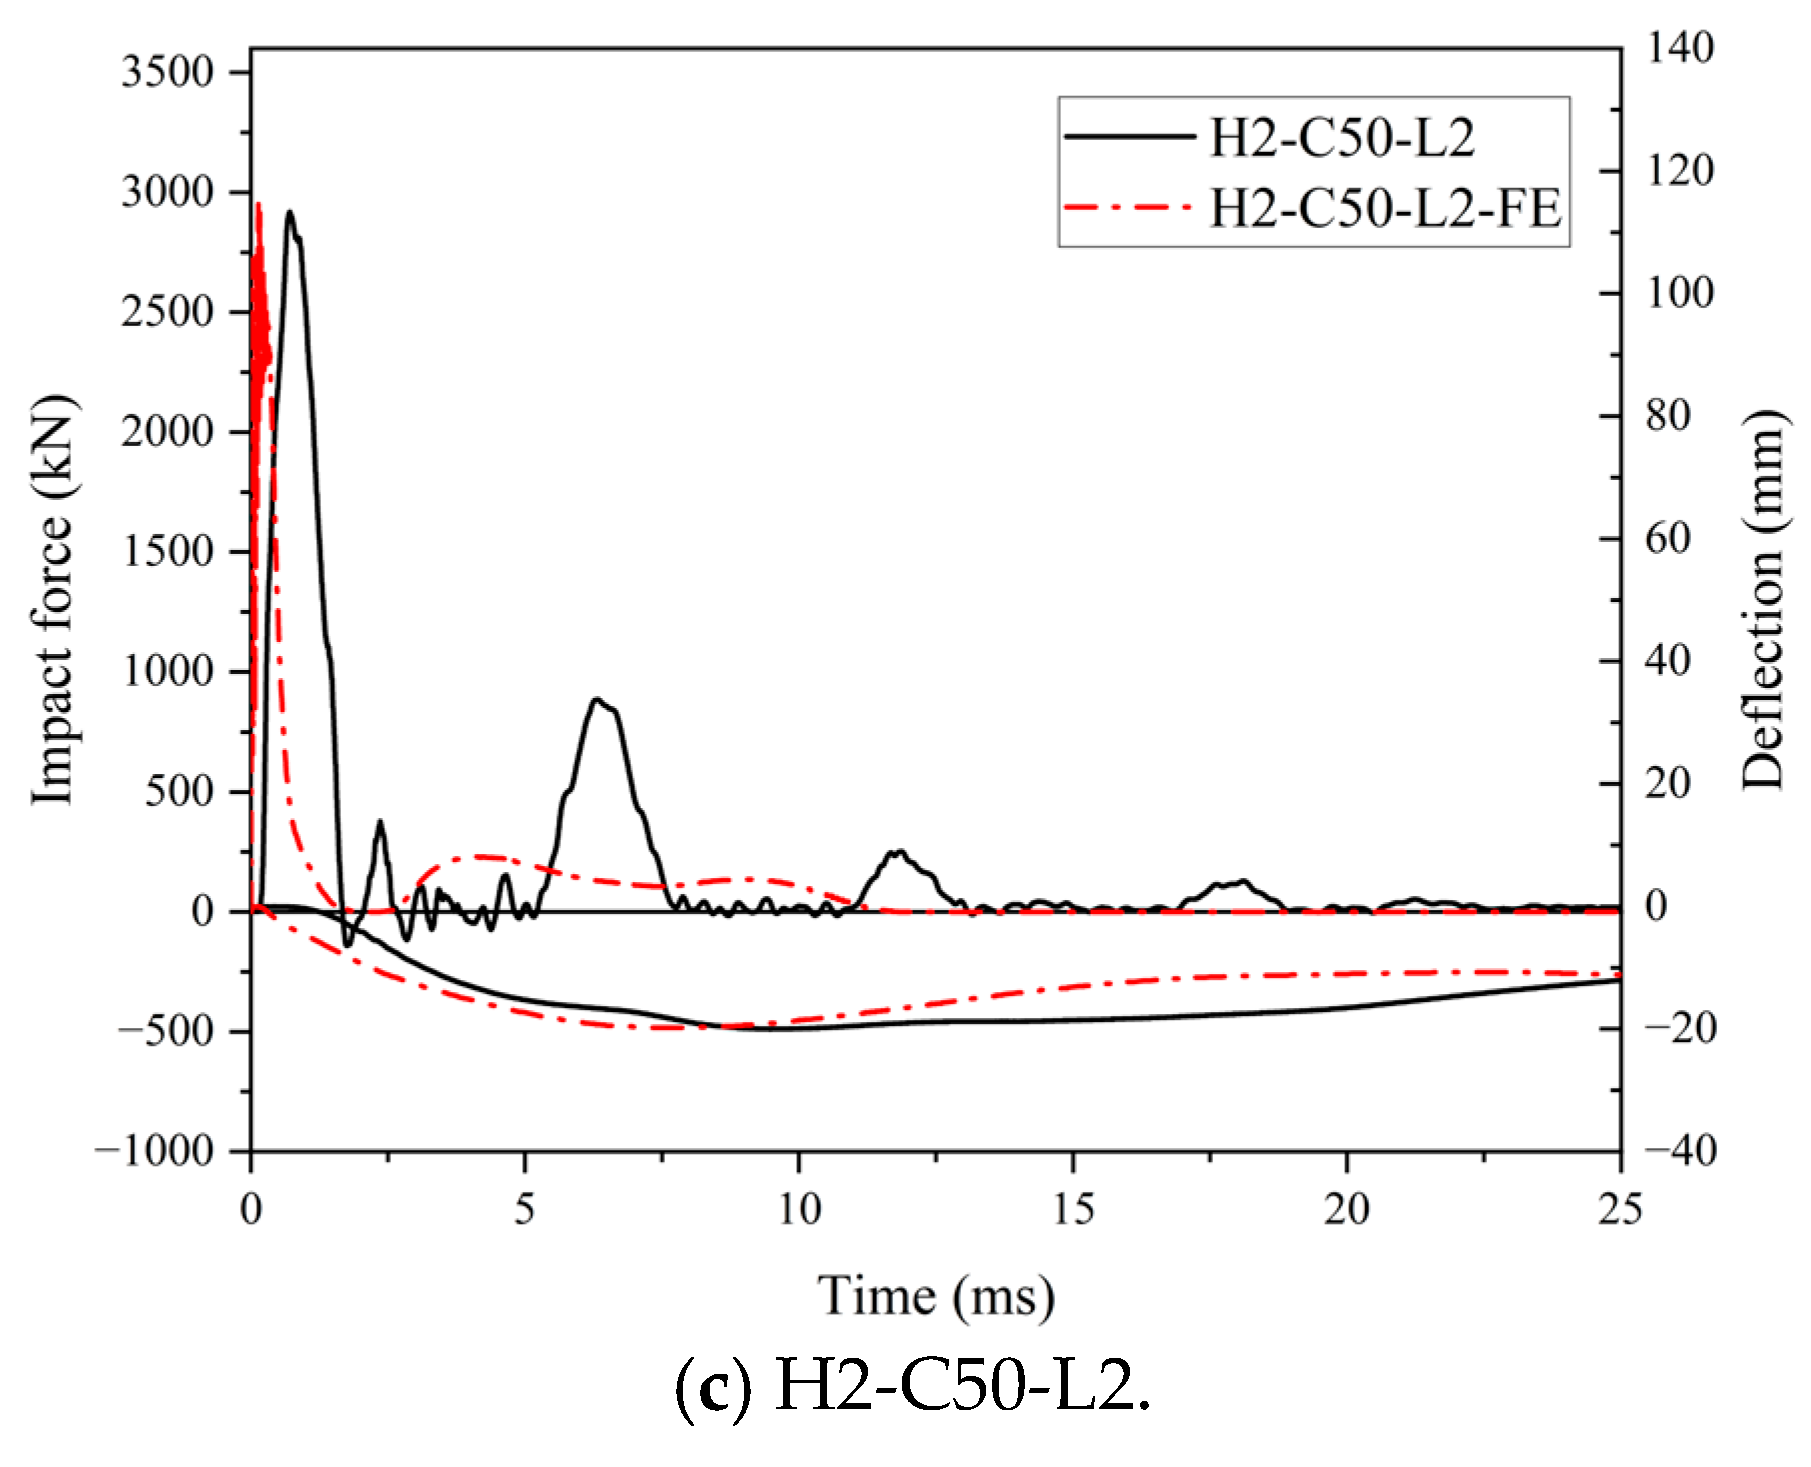
4.2. FE Results and Discussions

Based on the test results, there was no obvious damage in the RC foundation. The comparison of damage evolution was focused on the SC wall. Figure 18, Figure 19 and Figure 20 showed the effective plastic strain distribution of the SC walls of three test specimens. The concrete of SC wall was extensively damaged at the impact location area and area near the interface. The numerical model of C30 concrete performed the greater damage degree compared with that of C50 concrete. The failure modes of these numerical models were similar to the test results in Figure 8.
The comparison of force and deflection–time histories of the SC wall-to-foundation connections obtained from the numerical studies and impact test was presented in Figure 21. On the whole, the predicted force and deflection–time histories showed a similar trend to the test results. As shown in Figure 21, both impact force curves originated as triangular shapes. However, it is noted that the triangle in FE results appeared sharper than in the test results, and subsequent multiple oscillations near zero were not observed in the curves of FE results. This discrepancy may be attributed to the idealized boundary conditions and material models employed in the FE model, as well as the geometric imperfection of the test specimens, resulting in the FE model showing higher stiffness than the real specimen. In future research, the method of considering the bond slip of dowel rebars at the interface and introducing initial defects in the structure should be considered to address this problem.
The peak impact forces and maximum central deflection of the projection of the impact area on the bottom steel plate of the test specimens obtained from the impact tests were compared with those from the numerical studies, and the comparison is presented in Table 5. The maximum difference of Fp between the test results and FE results was 1%, and that of db,max was 4%. The average ratio of FE to experimental for Fp and db,max was 1.01.

4.3. Parametric Studies

With the verified FE models, parametric studies were conducted to investigate the influences of different parameters on the flexural behaviors of the SC wall-to-foundation connection. As shown in Table 6, these three experimental parameters, including the concrete compressive strength (fcu), impact velocity (v0), and impact mass (m), were still considered, and the parameter range was expanded. This parameter analysis method was inspired by Refs. [31,37]. The dimensions of the SC wall-to-foundation connection were consistent with those of the test specimens. After the parametric study, the peak impact force (Fp) and maximum deflections and the corresponding residual deflections at the bottom steel plate in the central impact area (db,max) were selected to study the influences of different parameters on the flexural behaviors of the SC wall-to-foundation connection.

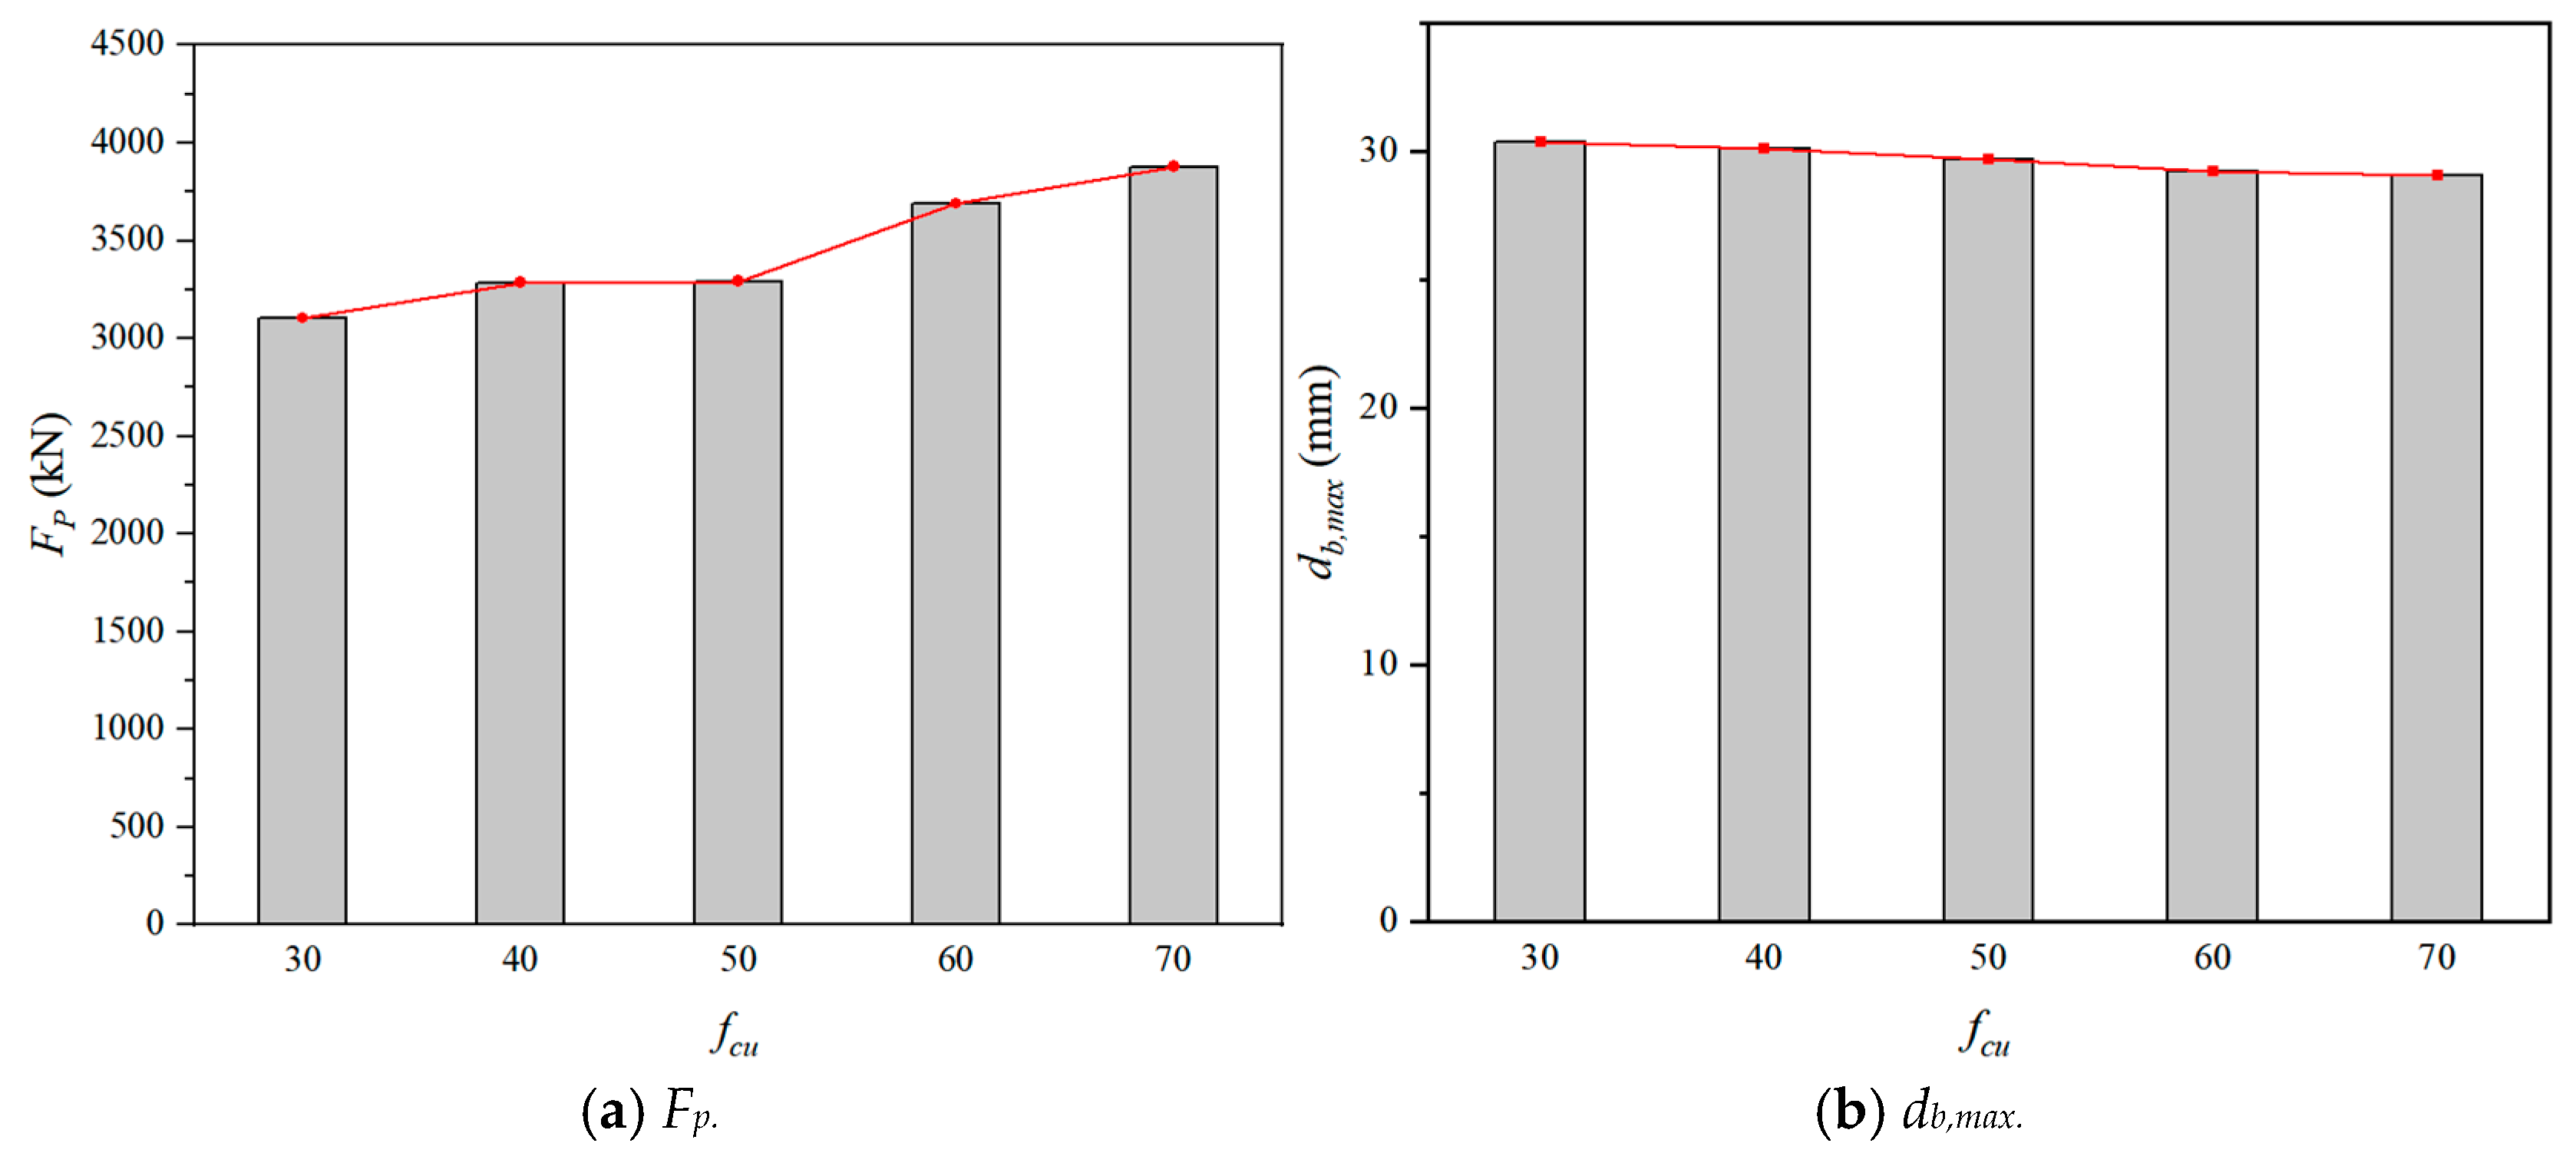
4.3.1. Effect of Concrete Compressive Strength

Figure 22 showed the influence of concrete compressive strength (fcu) on the Fp and db,max. In general, as the fcu increased, the Fp increased and the db,max slightly decreased. The reason was that the flexural resistance of SC wall-to-foundation connections was enhanced with the increase of fcu. For the numerical models with the impact energy of 14.7 kJ, the Fp increased by 24.94% and the db,max decreased by 4.18%, when the fcu rose from 30 MPa to 70 MPa. It was found that the impact resistance of SC wall-to-foundation connections was improved by enhancing the compressive strength of concrete.

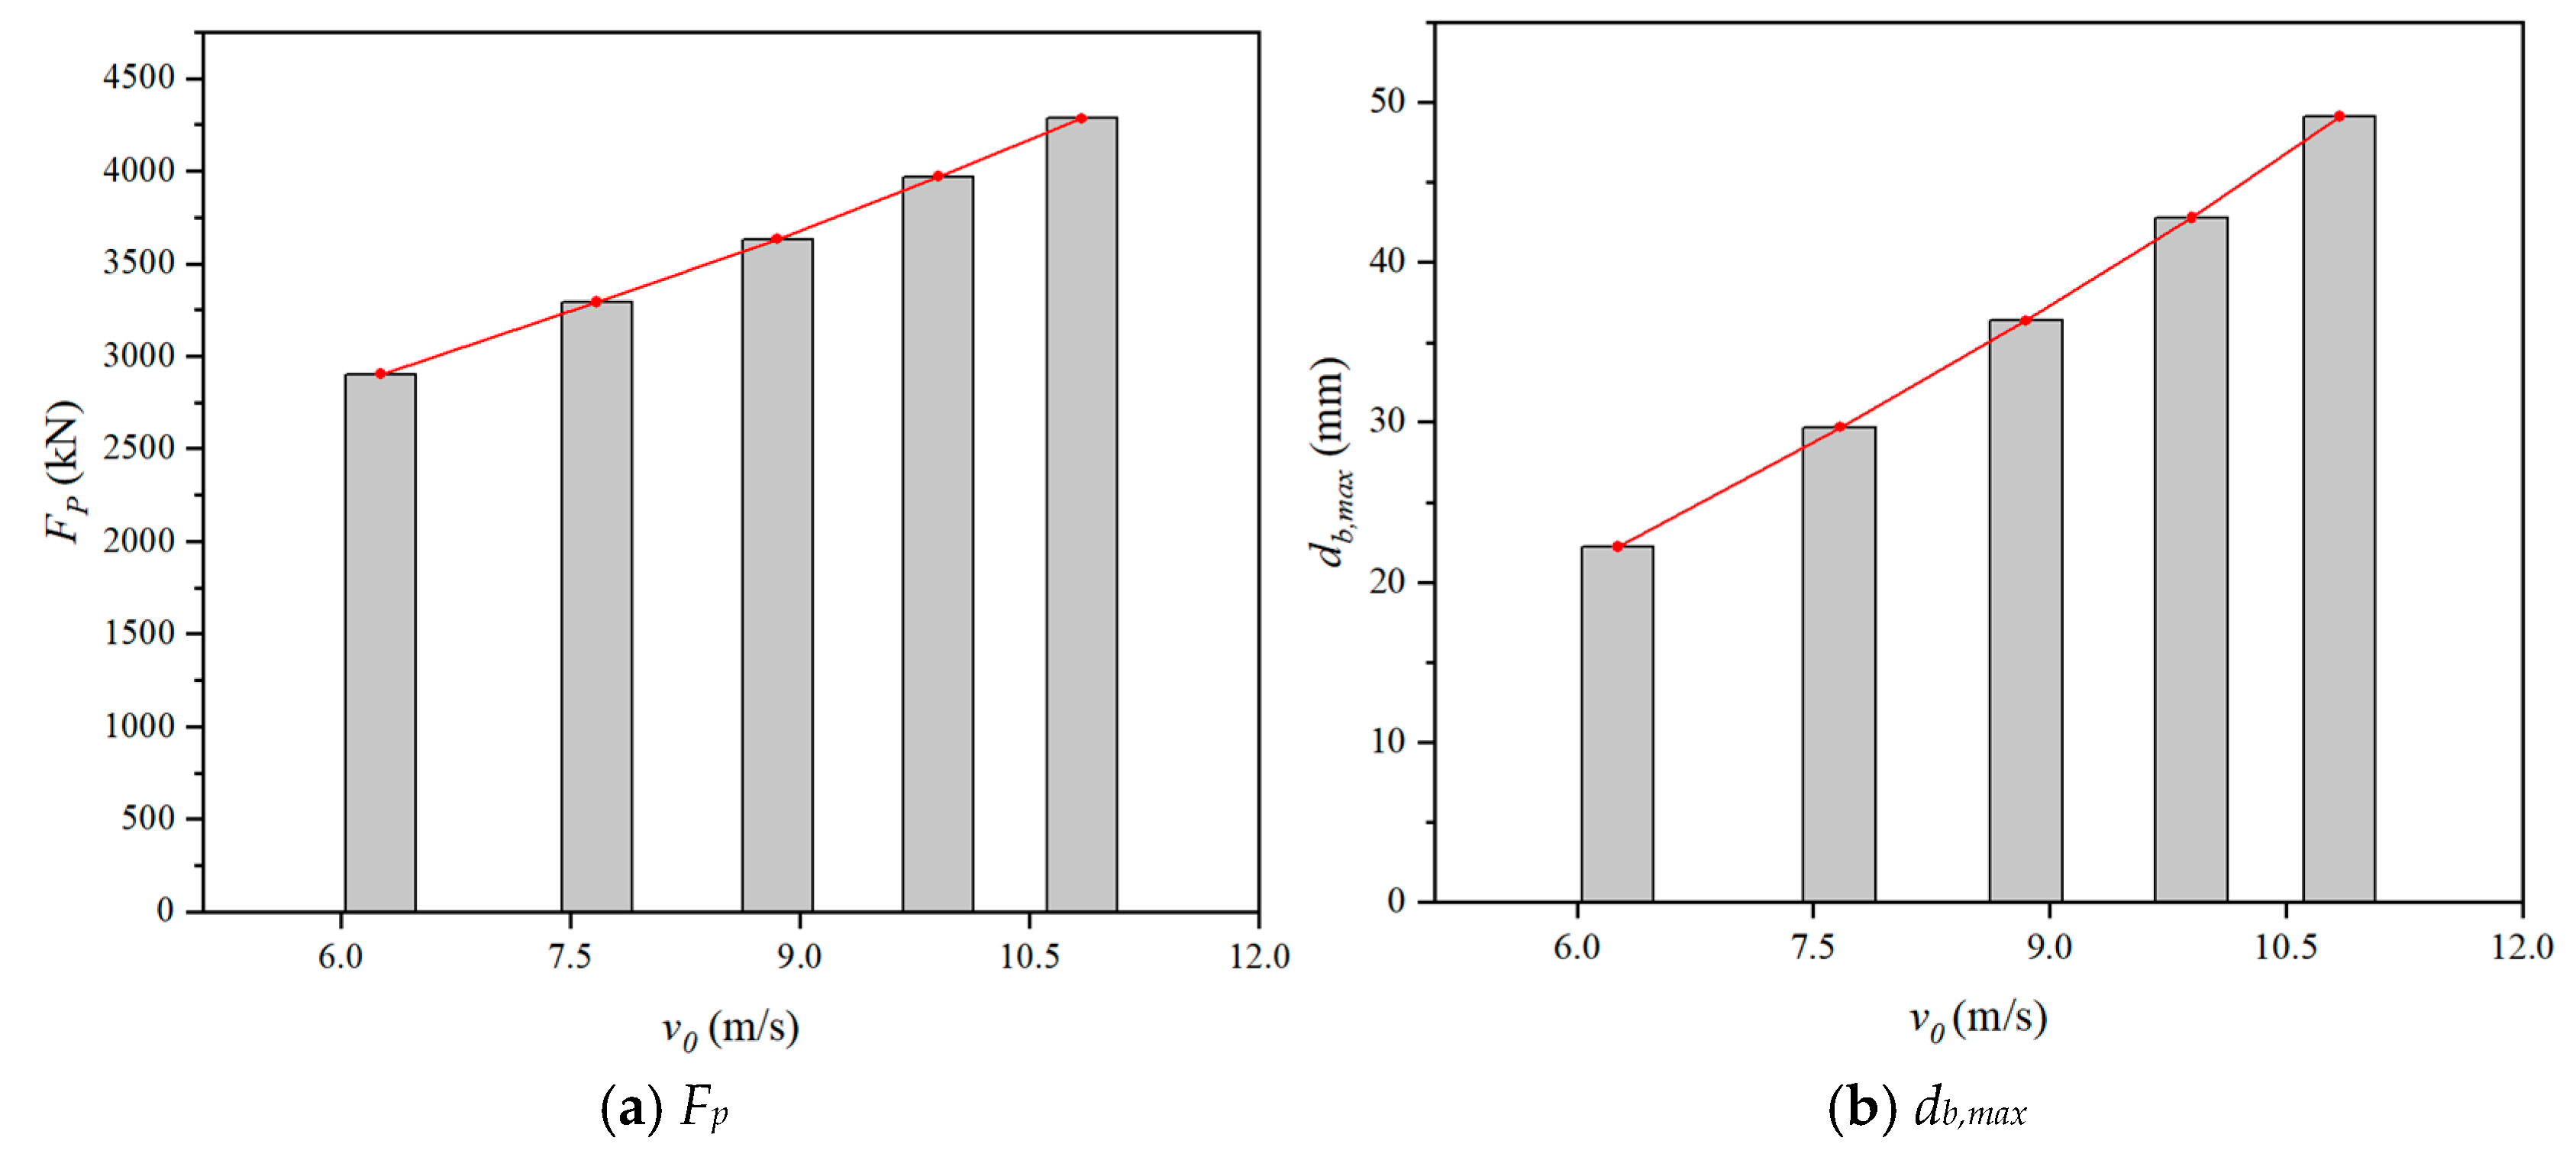
4.3.2. Effect of Impact Velocity

By changing the impact velocity (v0), the impact responses of numerical models were shown in Figure 23. As shown, both the Fp and the db,max increased with the increasing v0. Furthermore, when the v0 varied from 6.26 m/s to 10.84 m/s, the Fp increased by 47.61% and the db,max increased by 120.97%, indicating that the Fp and db,max increased significantly with the increase of v0. This was because the higher impact velocity applied to the SC wall-to-foundation connection increased impact energy and amplified strain-rate effects in concrete. A similar phenomenon was also found in Ref. [31].

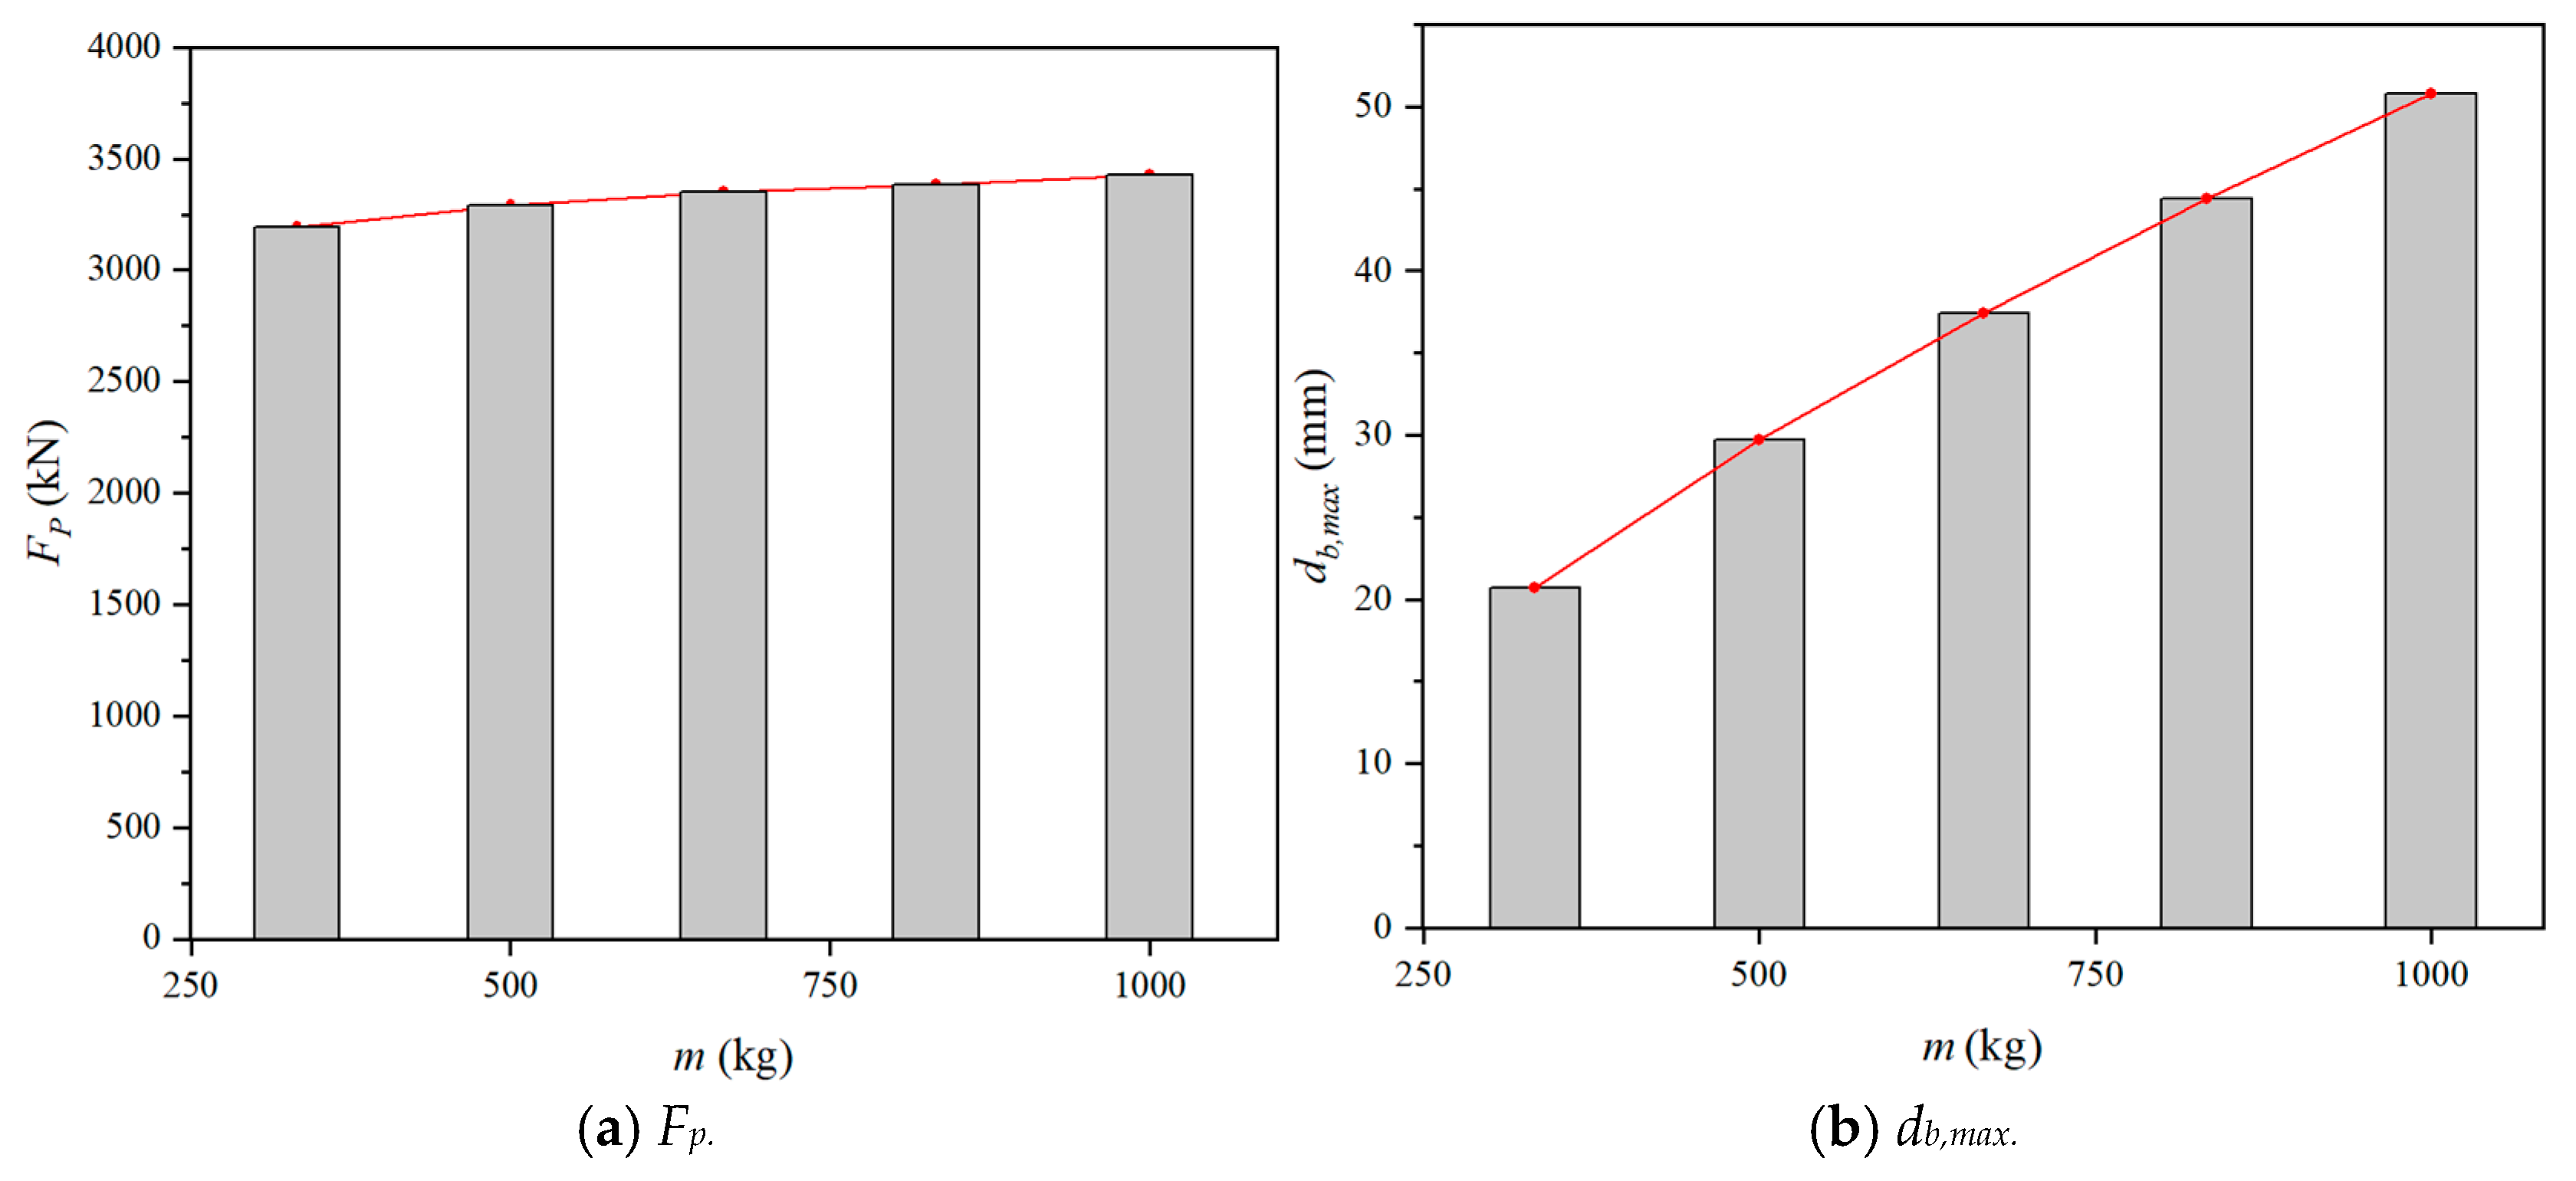
4.3.3. Effect of Impact Mass

The results of Fp and db,max with different impact mass (m) were depicted in Figure 24. Both Fp and the db,max increased with the increase of m. For the numerical models under the impact velocity of 7.67 m/s, changing the m from 333 kg to 1000 kg, the Fp and the db,max increased by 7.33% and 145.43%, respectively. It was found that changing the impact mass has little effect on Fp, but has a great influence on db,max. A similar conclusion was also reported by An et al. [37].

5. Conclusions

This study examined the dynamic response and flexural behavior of SC wall-to-foundation connections using hammer impact tests. The experimental program evaluated the influence of concrete strength grade and impact energy. Key findings were summarized as follows:
(1) All specimens exhibited flexural failure, characterized by interface opening and dowel rebar yielding. SC wall damage was highly sensitive to concrete strength grade, while interface damage was primarily governed by impact energy.
(2) At the initiation of the impact process, the impact force peaked rapidly. Upper dowel rebars yielded under tension, reaching maximum strain, while bottom rebars transitioned from compression to tension. This transition resulted from interface opening, which reduced the compression zone (comprising a small portion of wall concrete and the lower steel plate).
(3) Compared to H2-C30-L1, H2-C50-L1 (C50 concrete) demonstrated enhanced impact resistance, achieving a 7.5% higher peak impact force alongside 12.3% and 26.3% reductions in maximum and corresponding residual deflections, respectively.
(4) Reducing impact energy could decrease interfacial crack length, peak impact force, deflections, and residual strains, indicating its dominant influence on the dynamic response.
(5) The dynamic response of SC wall-to-foundation connections can be divided into three stages: inertial, loading, and unloading.
(6) Within the studied parameter ranges, parametric studies indicated that impact velocity most significantly influenced peak impact force. Maximum deflection increased substantially with higher impact velocity or mass.
(7) Future research should focus on three key areas: the post-impact residual strength of the specimens, the assessment of damage accumulation through multiple impacts, and the impact behavior of alternative connection methods (e.g., embedding, anchors).

Author Contributions

Conceptualization, N.W. and X.X.; Methodology, J.H., N.W., Y.C. and X.X.; Validation, S.L. and F.W.; Formal analysis, W.D.; Investigation, J.H.; Resources, W.D., S.L. and Y.C.; Data curation, S.L.; Writing—original draft, W.D.; Writing—review & editing, W.D., J.H., N.W. and X.X.; Visualization, F.W.; Supervision, J.H.; Project administration, X.X.; Funding acquisition, N.W. All authors have read and agreed to the published version of the manuscript.

Funding

The research was funded by the National Natural Science Foundation of China (Grant Nos. 52478133 and 52308143) and Chongqing Talents (CSTB2024YCJH-KYXM0125). The authors gratefully acknowledge for the supports.

Data Availability Statement

The original contributions presented in the study are included in the article, further inquiries can be directed to the corresponding author.

Conflicts of Interest

The authors declare no conflict of interest.

References

  1. Wang, N.; Zhou, F.; Qu, Y.; Xu, Z.; Li, Z.; Wang, F. Flexural behavior of curved steel-plate composite (SC) walls under combined axial compression and cyclic lateral force. Eng. Struct. 2021, 245, 112919. [Google Scholar] [CrossRef]
  2. Xie, M.; Chapman, J.C. Static and fatigue tensile strength of friction-welded bar-plate connections embedded in concrete. J. Constr. Steel Res. 2005, 61, 651–673. [Google Scholar] [CrossRef]
  3. Huang, Z.; Liew, J.Y.R. Compressive resistance of steel-concrete-steel sandwich composite walls with J-hook connectors. J. Constr. Steel Res. 2016, 124, 142–162. [Google Scholar] [CrossRef]
  4. Wang, Y.; Ma, X.; Chen, J.; Zhai, X.; Zhi, X.; Zhou, H.; Zhong, J. Experimental and analytical studies on impact behaviours of a steel–concrete–steel sandwich beam with novel interlocked angle connectors. Thin-Walled Struct. 2022, 181, 110089. [Google Scholar] [CrossRef]
  5. Mo, J.; Uy, B.; Li, D.; Thai, H.T.; Tran, H. A review of the behaviour and design of steel–concrete composite shear walls. Structures 2021, 31, 1230–1253. [Google Scholar] [CrossRef]
  6. Do, T.V.; Pham, T.M.; Hao, H. Impact force profile and failure classification of reinforced concrete bridge columns against vehicle impact. Eng. Struct. 2019, 183, 443–458. [Google Scholar] [CrossRef]
  7. Meng, L.; Wang, Y.; Zhai, X. Modeling and Dynamic Response of Curved Steel–Concrete–Steel Sandwich Shells Under Blast Loading. Int. J. Steel Struct. 2020, 20, 1663–1681. [Google Scholar] [CrossRef]
  8. Zhao, H.; Yang, Y.; Wang, R.; Chen, W.; Wang, Y.; Lam, D. Performance of steel–concrete composite walls with recycled aggregate concrete under low-velocity lateral impact loading. Eng. Struct. 2023, 296, 116899. [Google Scholar] [CrossRef]
  9. Huang, Z.; So, C.S.; Chen, W.; Htet, P.M.; Li, D.; Hao, H. Impact performance of fibre reinforced geopolymer concrete beams with steel-FRP composite bars. Eng. Struct. 2025, 329, 119880. [Google Scholar] [CrossRef]
  10. Mizuno, J.; Koshika, N.; Sawamoto, Y.; Niwa, N.; Yamashita, T.; Suzuki, A. Investigation on impact resistance of steel plate reinforced concrete barriers against aircraft impact. Part 1: Test program and results. In Proceedings of the 8th International Conference on Structural Mechanics in Reactor Technology (SMiRT 18), Beijing, China, 7–12 August 2005; pp. 2566–2579. [Google Scholar]
  11. Mizuno, J.; Koshika, N.; Mrikawa, H.; Wakimoto, K.; Kobayashi, K.; Fukuda, R. Investigation on impact resistance of steel plate reinforced concrete barriers against aircraft impact. Part 2: Simulation analyses of scale model impact tests. In Proceedings of the 8th International Conference on Structural Mechanics in Reactor Technology (SMiRT 18), Beijing, China, 7–12 August 2005; pp. 2566–2579. [Google Scholar]
  12. Sohel, K.M.A.; Liew, J.Y.R. Behavior of steel-concrete-steel sandwich slabs subject to impact load. J. Constr. Steel Res. 2014, 100, 163–175. [Google Scholar] [CrossRef]
  13. Liew, J.Y.R.; Sohel, K.M.A.; Koh, C.G. Impact tests on steel–concrete–steel sandwich beams with lightweight concrete core. Eng. Struct. 2009, 31, 2045–2059. [Google Scholar] [CrossRef]
  14. Remennikov, A.M.; Kong, S.Y.; Uy, B. The response of axially restrained non-composite steel-concrete-steel sandwich panels due to large impact loading. Eng. Struct. 2013, 49, 806–818. [Google Scholar] [CrossRef]
  15. Zhao, W.; Guo, Q.; Dou, X.; Zhou, Y.; Ye, Y. Impact response of steel-concrete composite panels: Experiments and FE analyses. Steel Compos. Struct. 2018, 26, 255–263. [Google Scholar] [CrossRef]
  16. Guo, Q.; Zhao, W. Displacement response analysis of steel-concrete composite panels subjected to impact loadings. Int. J. Impact Eng. 2019, 131, 272–281. [Google Scholar] [CrossRef]
  17. JEAG 4618-2005; Technical Guidelines for Seismic Design of Steel Plate Concrete Structures: For Buildings and Structures. Architectural Institute of Japan: Tokyo, Japan, 2005.
  18. Seo, J.; Varma, A.H. Experimental Behavior and Design of Steel Plate Composite-to-Reinforced Concrete Lap Splice Connections. J. Struct. Eng. 2017, 143, 04017011. [Google Scholar] [CrossRef]
  19. Kurt, E.G. Steel-Plate Composite (SC) Walls and Their Basemat Connections: Seismic Behavior, Analysis and Design. Ph.D. Thesis, Purdue University, West Lafayette, IN, USA, 2015. [Google Scholar]
  20. Wang, N.; Zhou, F.; Xu, H.; Xu, Z. Experimental study on steel-plate composite wall-to-foundation connections subjected to combined axial compression and cyclic lateral-force. Eng. Struct. 2020, 207, 110205. [Google Scholar] [CrossRef]
  21. Wang, T.; Yan, J.B. Developments of steel-concrete-steel sandwich composite structures with novel EC connectors: Members. J. Constr. Steel Res. 2020, 175, 106335. [Google Scholar] [CrossRef]
  22. Lin, Y.; Yan, J.; Cao, Z.; Zeng, X.; Fan, F.; Zou, C. Ultimate strength behaviour of S-UHPC-S and SCS sandwich beams under shear loads. J. Constr. Steel Res. 2018, 149, 195–206. [Google Scholar] [CrossRef]
  23. Huang, Z.; Liew, J.Y.R.; Xiong, M.; Wang, J. Structural behaviour of double skin composite system using ultra-lightweight cement composite. Constr. Build. Mater. 2015, 86, 51–63. [Google Scholar] [CrossRef]
  24. Sener, K.C.; Varma, A.H. Steel-plate composite walls: Experimental database and design for out-of-plane shear. J. Constr. Steel Res. 2014, 100, 197–210. [Google Scholar] [CrossRef]
  25. Kim, M.; Park, H.; Han, M.; Choi, B.J. Experimental evaluation of bending-moment performance about steel plate-concrete structures with mechanical splice. J. Constr. Steel Res. 2017, 128, 362–370. [Google Scholar] [CrossRef]
  26. Sener, K.C.; Varma, A.H.; Ayhan, D. Steel-plate composite (SC) walls: Out-of-plane flexural behavior, database, and design. J. Constr. Steel Res. 2015, 108, 46–59. [Google Scholar] [CrossRef]
  27. GB/T 228.1-2010; Metallic Materials Tensile Testing—Part 1 Method of Test at Room Temperature. Ministry of Communications of the Peoples Republic of China: Beijing, China, 2010.
  28. GB/T 50081-2002; Standard for Test Method of Mechanical Properties on Ordinary Concrete. Ministry of Housing and Urban-Rural Construction of the People’s Republic of China: Beijing, China, 2003.
  29. Sener, K.C.; Varma, A.H.; Seo, J. Experimental and numerical investigation of the shear behavior of steel-plate composite (SC) beams without shear reinforcement. Eng. Struct. 2016, 127, 495–509. [Google Scholar] [CrossRef]
  30. He, Q.; Yue, L.; Mao, J. An experimental study on dynamic performance of CFRP-repaired RC composite beams under impact. J. Vib. Shock 2021, 40, 171–178. [Google Scholar]
  31. Wang, Y.; Sah, T.P.; Liu, S.; Zhai, X. Experimental and numerical studies on novel stiffener-enhanced steel-concrete-steel sandwich panels subjected to impact loading. J. Build. Eng. 2022, 45, 103479. [Google Scholar] [CrossRef]
  32. Yan, C.; Wang, Y.; Zhai, X. Low velocity impact performance of curved steel-concrete-steel sandwich shells with bolt connectors. Thin-Walled Struct. 2020, 150, 106672. [Google Scholar] [CrossRef]
  33. Livermore Technology Software Corporation. LS-DYNA Keyword User’s Manual Version 971; Livermore Technology Software Corporation: Livermore, CA, USA, 2012. [Google Scholar]
  34. Remennikov, A.M.; Kong, S.Y. Numerical simulation and validation of impact response of axially-restrained steel–concrete–steel sandwich panels. Compos. Struct. 2012, 94, 3546–3555. [Google Scholar] [CrossRef]
  35. Yan, C.; Wang, Y.; Zhai, X.; Meng, L.; Zhou, H. Experimental study on curved steel-concrete-steel sandwich shells under concentrated load by a hemi-spherical head. Thin-Walled Struct. 2019, 137, 117–128. [Google Scholar] [CrossRef]
  36. Jones, N. Structural Impact; Cambridge University Press: Cambridge, UK, 1989. [Google Scholar] [CrossRef]
  37. An, G.; Wang, R.; Zhao, H.; Chen, W.; Li, T.; Liu, Y. Response of axial-loaded steel-concrete composite walls under low-velocity impact. J. Constr. Steel Res. 2023, 203, 107829. [Google Scholar] [CrossRef]
Figure 2. Layouts of the test specimens (size in mm).
Buildings 15 02707 g002
Figure 3. Monotonic stress–strain curves obtained from tensile coupon test.
Buildings 15 02707 g003
Figure 4. Test set-up and instrumentation.
Buildings 15 02707 g004
Figure 5. Instrumentation layouts of the specimens: (a) measuring points of top steel plate and dowel rebars; (b) measuring points of bottom steel plate and dowel rebars.
Buildings 15 02707 g005
Figure 6. Damage evolution of H2-C30-L1: (a) 0 ms; (b) 0.81 ms; (c) 11.13 ms.
Buildings 15 02707 g006
Figure 7. Damage evolution of H2-C50-L2: (a) 0 ms; (b) 1.03 ms; (c) 9.47 ms.
Buildings 15 02707 g007
Figure 8. Damage evolution of H2-C50-L1: (a) 0 ms; (b) 10.50 ms.
Buildings 15 02707 g008
Figure 9. Failure mode of test specimens.
Buildings 15 02707 g009
Figure 10. Impact force history curves of test specimens.
Buildings 15 02707 g010
Figure 11. The db-t curves of test specimens.
Buildings 15 02707 g011
Figure 12. Deflection recovery rate (Q) in different location after impact.
Buildings 15 02707 g012
Figure 13. Permanent deflection (y direction) of bottom plate along x direction.
Buildings 15 02707 g013
Figure 14. Strain–time history curves of dowel rebars.
Buildings 15 02707 g014aBuildings 15 02707 g014b
Figure 15. Strain–time history curves of steel plates.
Buildings 15 02707 g015
Figure 16. Typical impact force and deflection–time histories of the test specimens.
Buildings 15 02707 g016
Figure 17. FE model of the SC wall-to-foundation connection.
Buildings 15 02707 g017
Figure 18. Numerical results on damage evolution of H2-C30-L1.
Buildings 15 02707 g018aBuildings 15 02707 g018b
Figure 19. Numerical results on damage evolution of H2-C50-L2.
Buildings 15 02707 g019
Figure 20. Numerical results on damaged evolution of H2-C50-L1.
Buildings 15 02707 g020
Figure 21. Comparison of force and deflection–time histories.
Buildings 15 02707 g021aBuildings 15 02707 g021b
Figure 22. Effect of concrete compressive strength.
Buildings 15 02707 g022
Figure 23. Effect of impact velocity.
Buildings 15 02707 g023
Figure 24. Effect of impact mass.
Buildings 15 02707 g024
Table 1. Material properties.
ComponentsMaterial GradeEfyfufcu
(GPa)(MPa)(MPa)(MPa)
Concrete of SC wallsC50---54.8
C30---27.5
Steel plates of SC wallsQ235B197287572-
Stiffening anglesQ235B190308546-
Tie channelsQ235B197395667-
Dowel rebarsHRB400203409773-
Note: E, fy, fu—Young’s modulus, yield stress, and ultimate stress of steel components, respectively; fcu—cubic compressive strength of concrete.
Table 2. Summary of test specimens.
SpecimenConcrete Strength Grade of SC WallH0tsmHhvdPE
(mm)(mm)(kg)(m)(m/s)(kg·m/s)(kJ)
H2-C30-L1C3060065003.007.67383514.7
H2-C50-L1C5060065003.007.67383514.7
H2-C50-L2C5060063003.338.0824249.8
Note: H0—effective impact height; ts—thickness of steel plate; m, Hh, vd—impact mass, impact height, and design velocity of the hammer, respectively; P, E—momentum and kinetic energy of the hammer, respectively.
Table 3. Test parameters and values of crack widths.
SpecimenvPClCuCrFailure Mode
(m/s)(kg·m/s)(mm)(mm)(mm)
H2-C30-L17.4137052.904.468.75Flexure failure
H2-C50-L17.4537252.124.332.43Flexure failure
H2-C50-L27.9023701.602.251.89Flexure failure
Note: v, P—actual velocity and momentum of the hammer, respectively; Cl, Cu, Cr—maximum crack widths on the left, upper, and right sides of the interface, respectively.
Table 4. Values of peak impact force and deflections.
SpecimenFpdb,maxdbrdi,maxdirdm,maxdmrdt,maxdtr
(kN)(mm)(mm)(mm)(mm)(mm)(mm)(mm)(mm)
H2-C30-L1311828.9410.566.380.7818.737.0938.0115.02
H2-C50-L1335225.778.363.940.2617.433.9051.7112.68
H2-C50-L2291920.016.405.860.9713.413.4926.83-
Note: Fp—peak impact force; db,max, dbr—maximum deflections and the corresponding residual deflections at the bottom steel plate in central impact area, respectively; di,max and dir are the maximum deflection and corresponding residual deflection at the interface of the SC wall, respectively; dm,max and dmr are the maximum deflection and corresponding residual deflection at the middle of the SC wall, respectively; dt,max and dtr are the maximum deflection and corresponding residual deflection at the top of the SC wall, respectively.
Table 5. Comparison of test and FE results.
SpecimenFpFp,FEFp,FE/Fpdb,maxdb,maxFEdb,maxFE/db,max
(kN)(kN)(mm)(mm)
H2-C30-L1311831041.0028.9429.121.01
H2-C50-L1335233951.0125.7726.831.04
H2-C50-L2291929481.0120.0119.810.99
Average 1.01 1.01
Table 6. Summary of numerical results.
fcuHhv0mEFpdb,max
(MPa)(m)(m/s)(kg)(kJ)(kN)(mm)
5037.6750014.7329229.70
3037.6750014.7310430.35
4037.6750014.7328630.12
6037.6750014.7368929.20
7037.6750014.7387829.08
5026.265009.8290322.22
5048.8550019.6363236.35
5059.9050024.5397142.80
50610.8450029.4428549.10
5037.673339.8319220.69
5037.6766719.6335137.44
5037.6783324.5338544.43
5037.67100029.4342650.78
Note: fcu—concrete compressive strength; Hh, v0, m, E—impact height, impact velocity, impact mass, and impact energy, respectively; Fp—peak impact force; db,max—maximum deflections at the bottom steel plate in the central impact area.
Disclaimer/Publisher’s Note: The statements, opinions and data contained in all publications are solely those of the individual author(s) and contributor(s) and not of MDPI and/or the editor(s). MDPI and/or the editor(s) disclaim responsibility for any injury to people or property resulting from any ideas, methods, instructions or products referred to in the content.

