_Su.png)
Shear Mechanism of Precast Segmental Concrete Beam Prestressed with Unbonded Tendons

Abstract
1. Introduction
2. Experimental Project
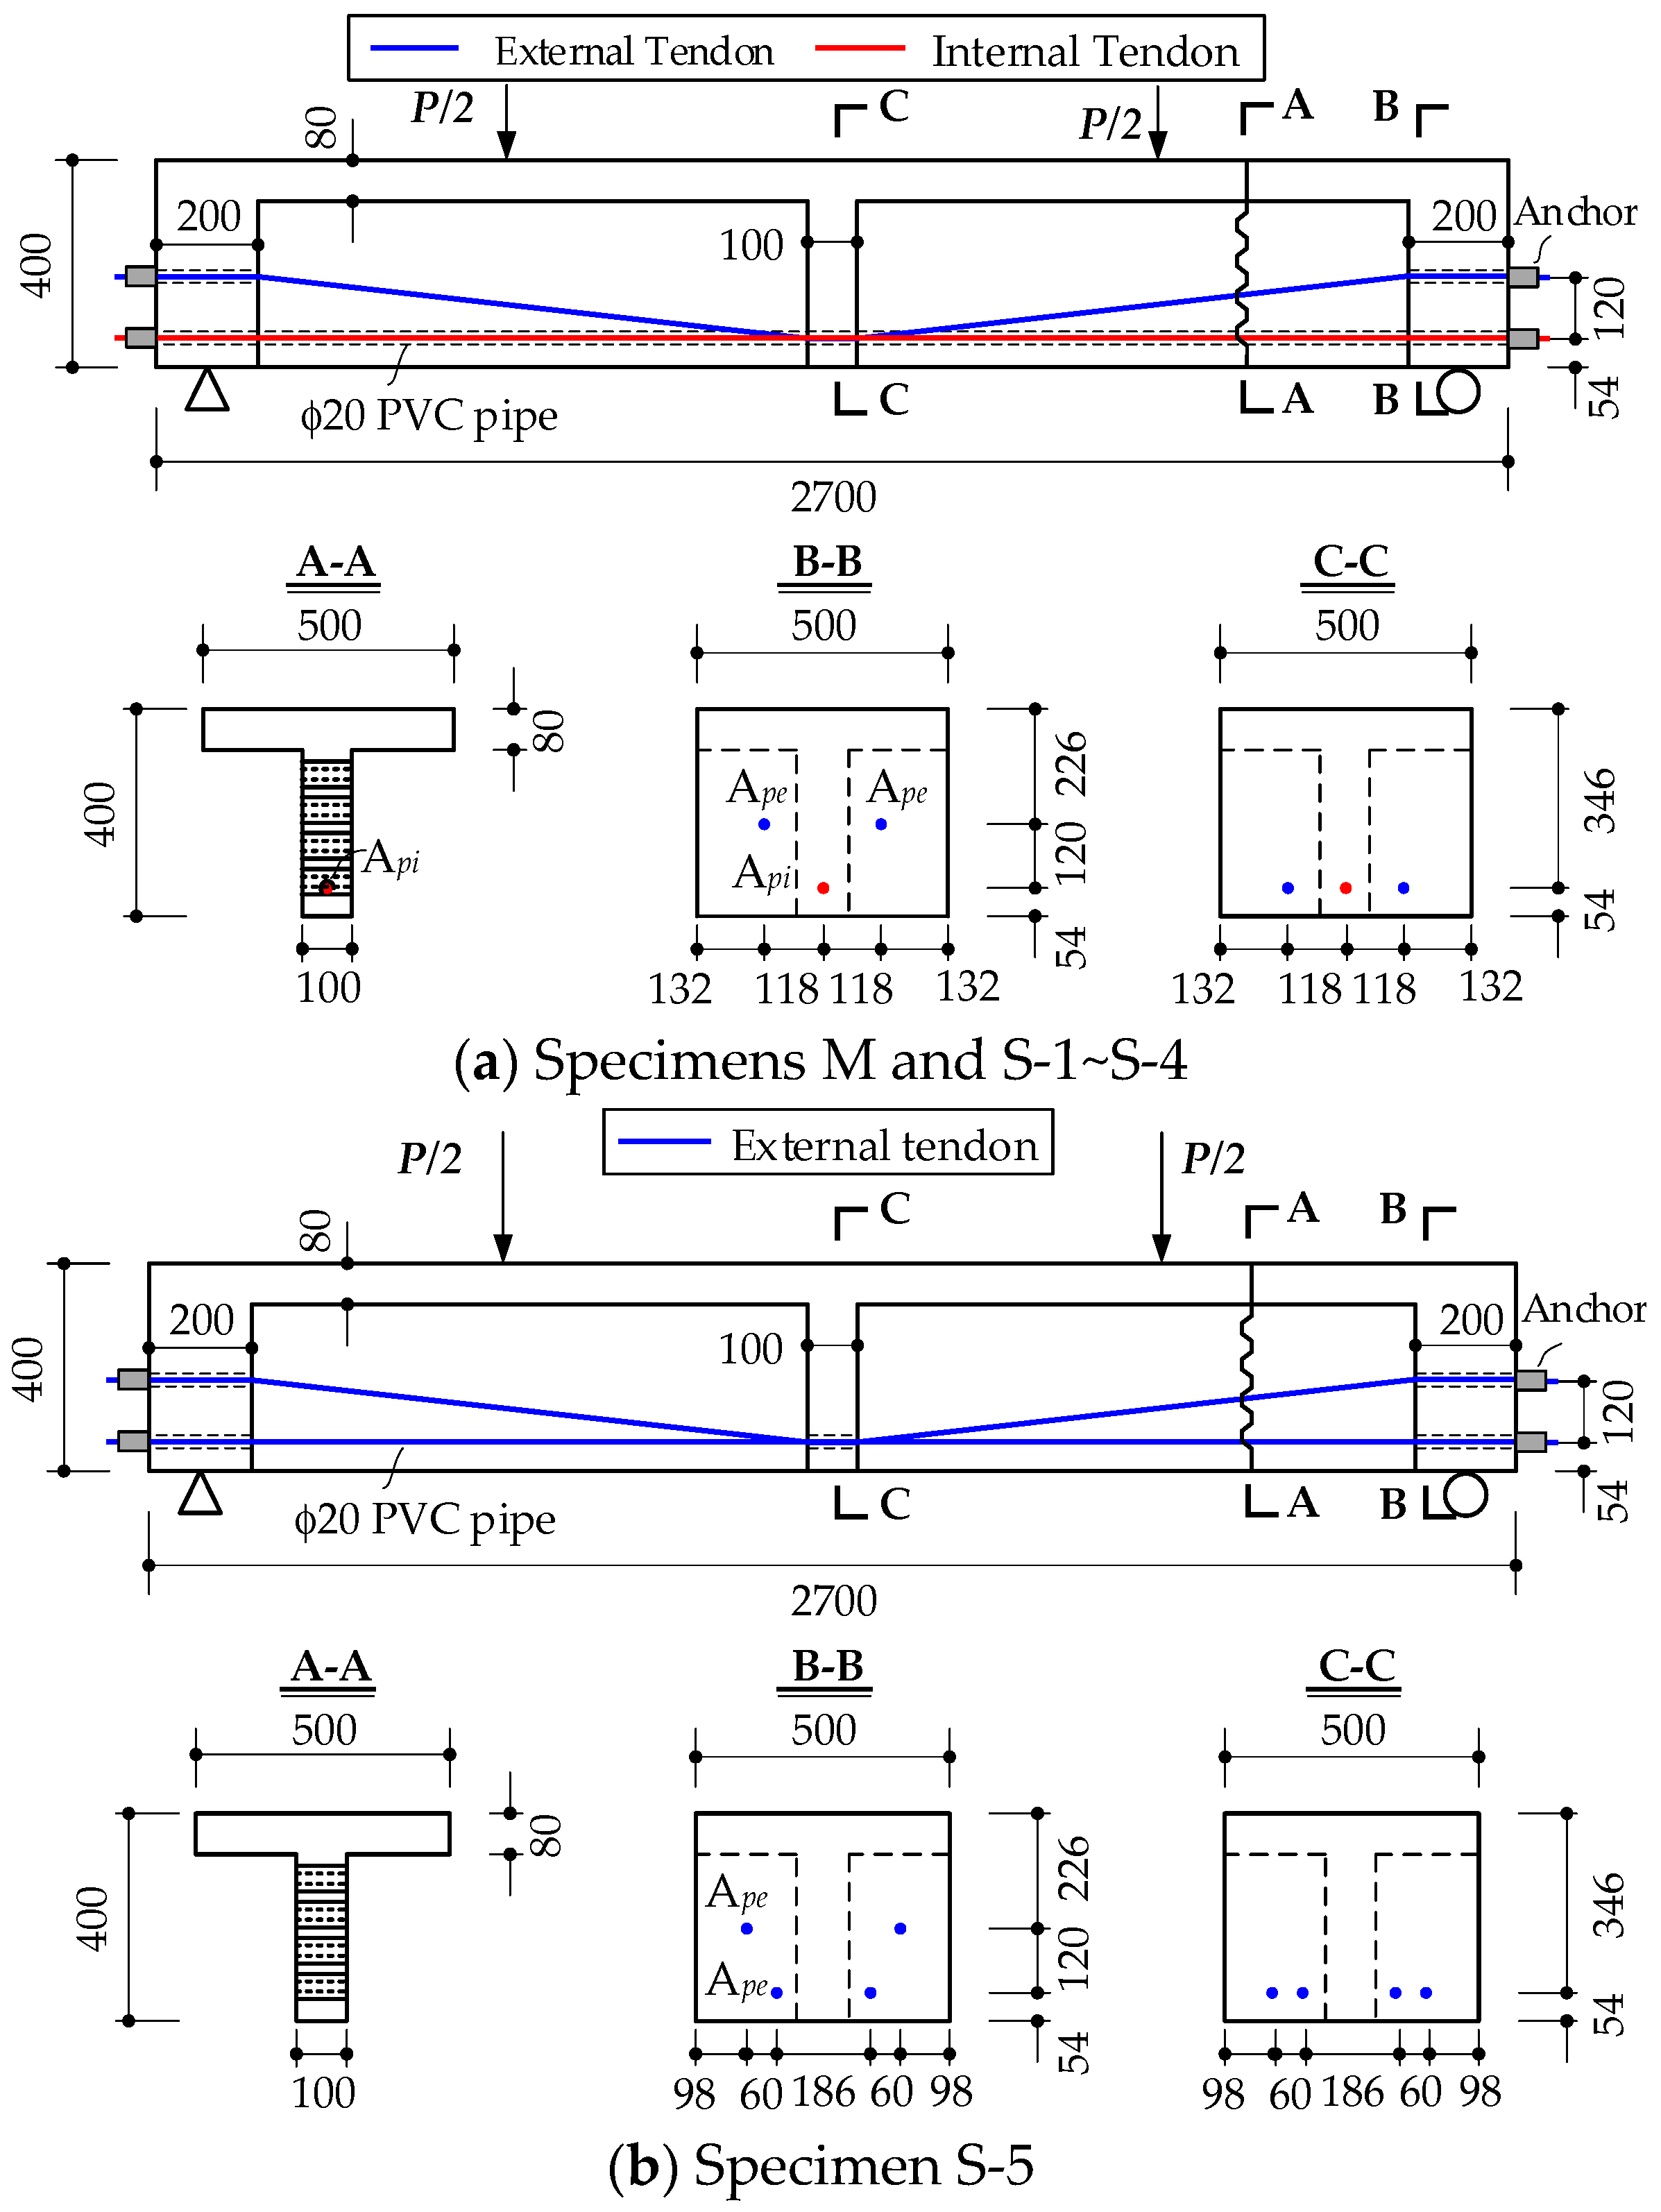
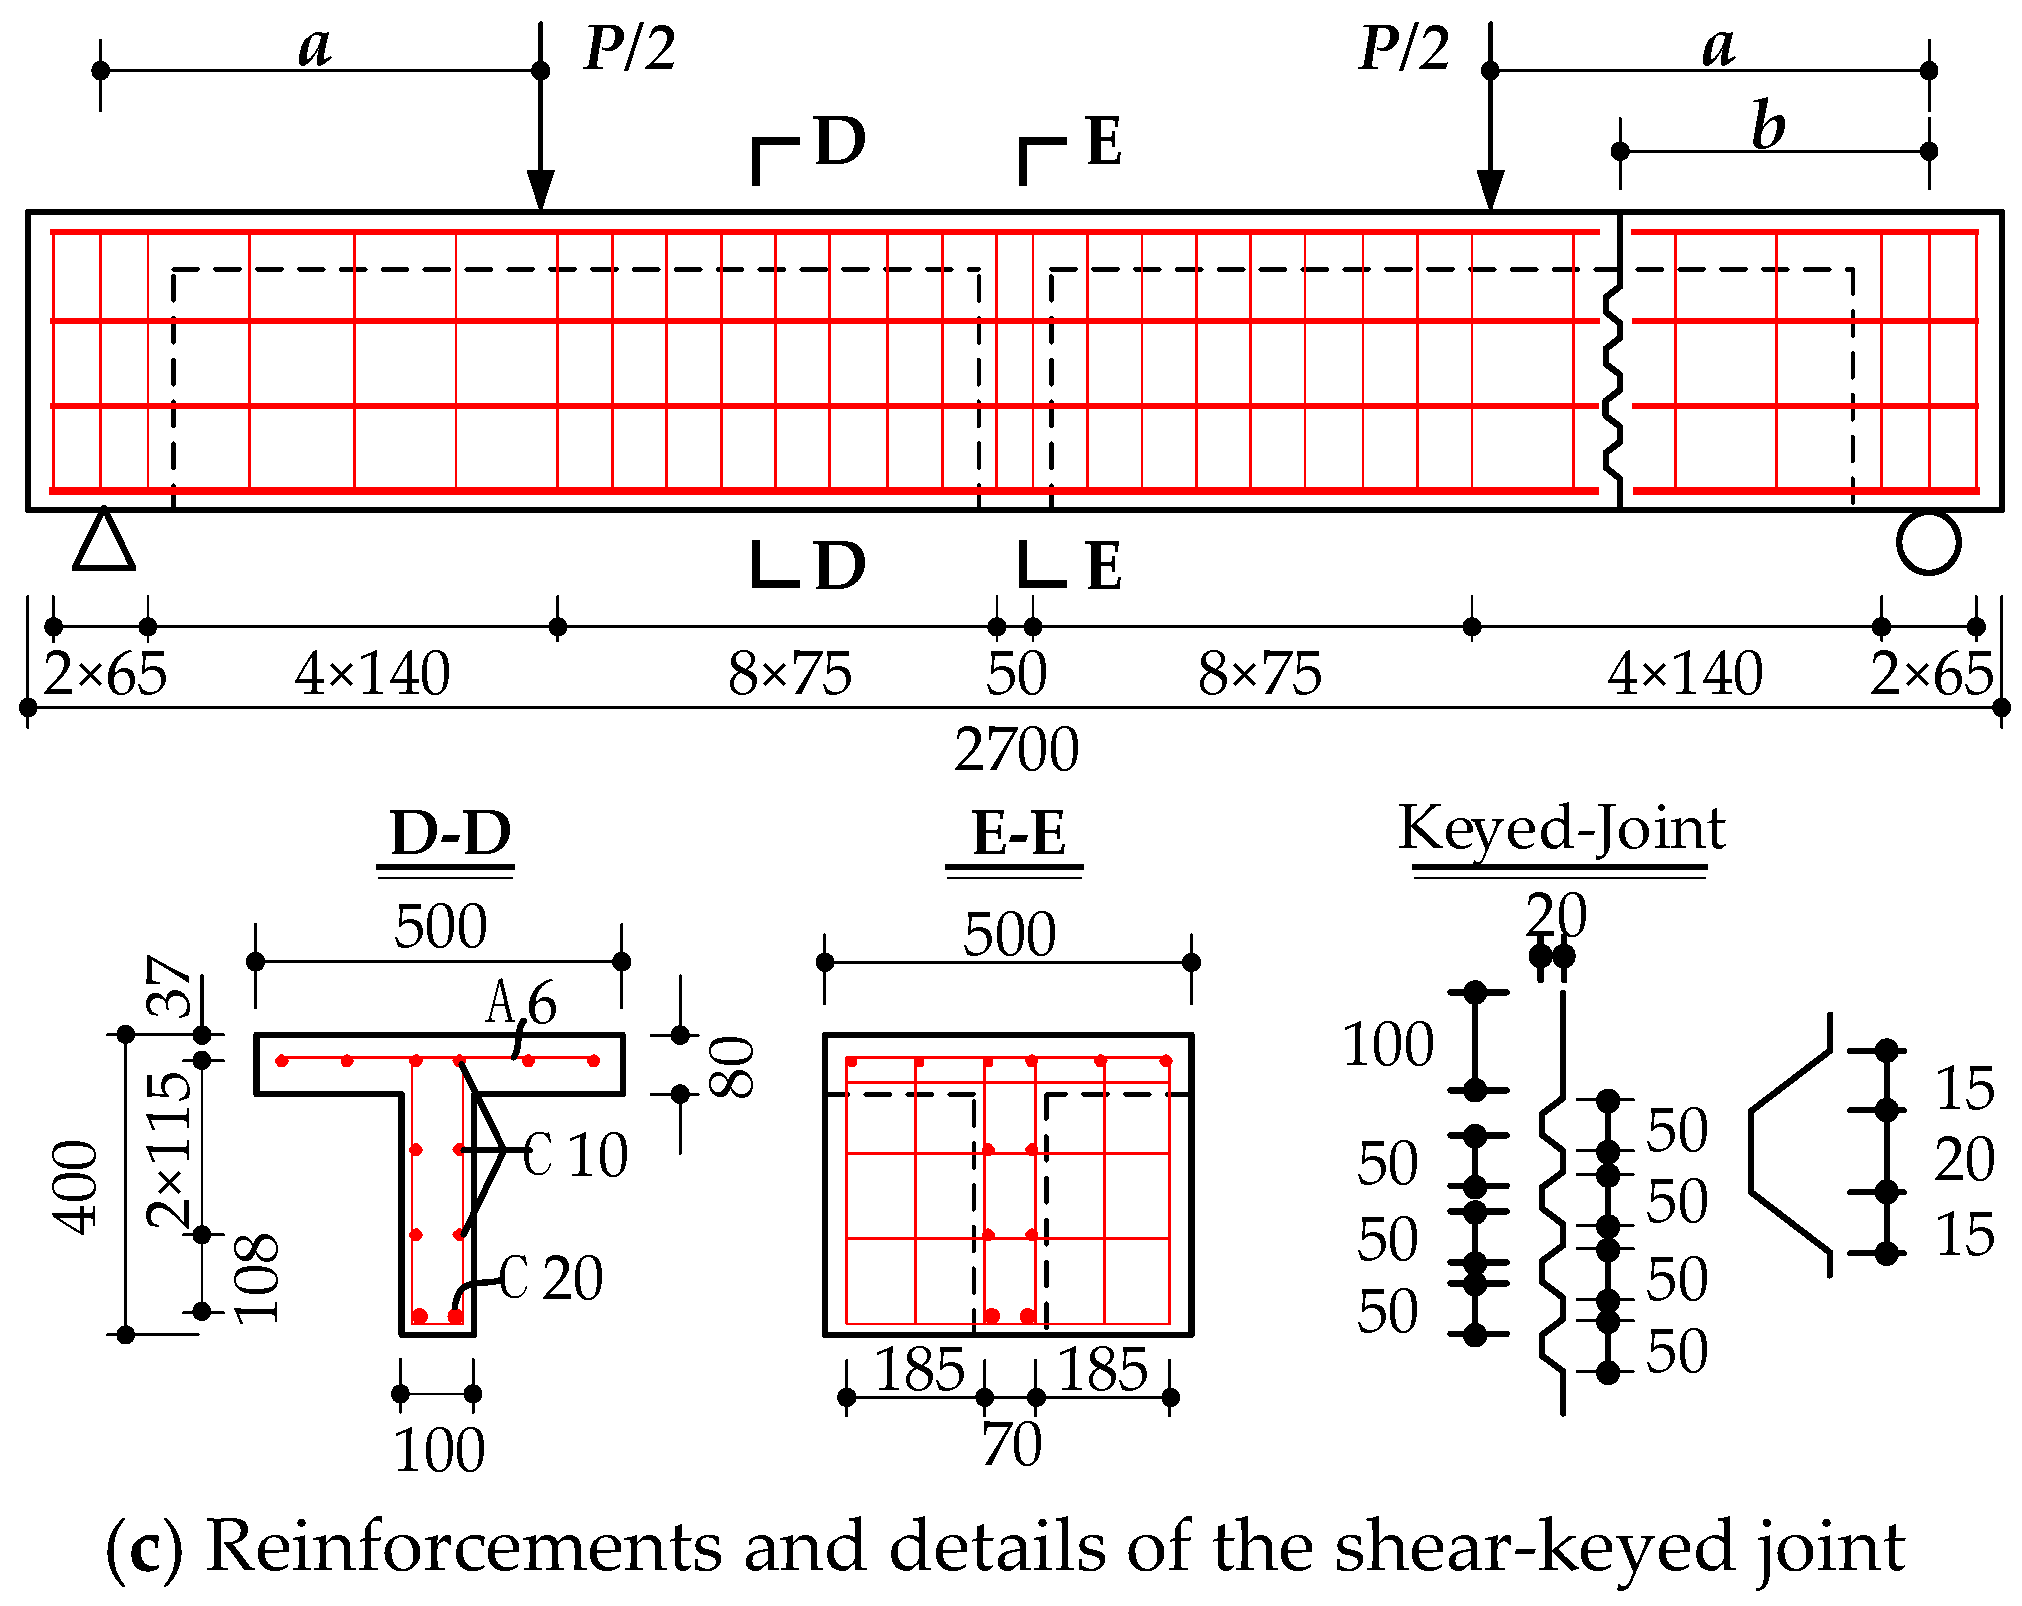
2.1. Design of Specimens
- (1)
- The comparisons between specimens M and S-1 are employed to study the effects of joints on the shear performance.
- (2)
- The comparisons among specimens S-1, S-2, S-3, and S-4 will show the influences of the relative position between loading points and joints on the structural shear behaviors.
- (3)
- The experimental control group of specimens S-1 and S-3 is set to compare the shear span ratio on the shear resistance capacity.
- (4)
- Specimens S-1 and S-5 are compared to study the hybrid tendon ratio (area ratio of internal tendons to external tendons) on the shear behaviors.
- (5)
- In addition, for each segmental beam, the behaviors of the left and right shear spans are compared to show the effects of segmental joints on the shearing capacity.
2.2. Fabrication of Specimens
2.3. Material Properties
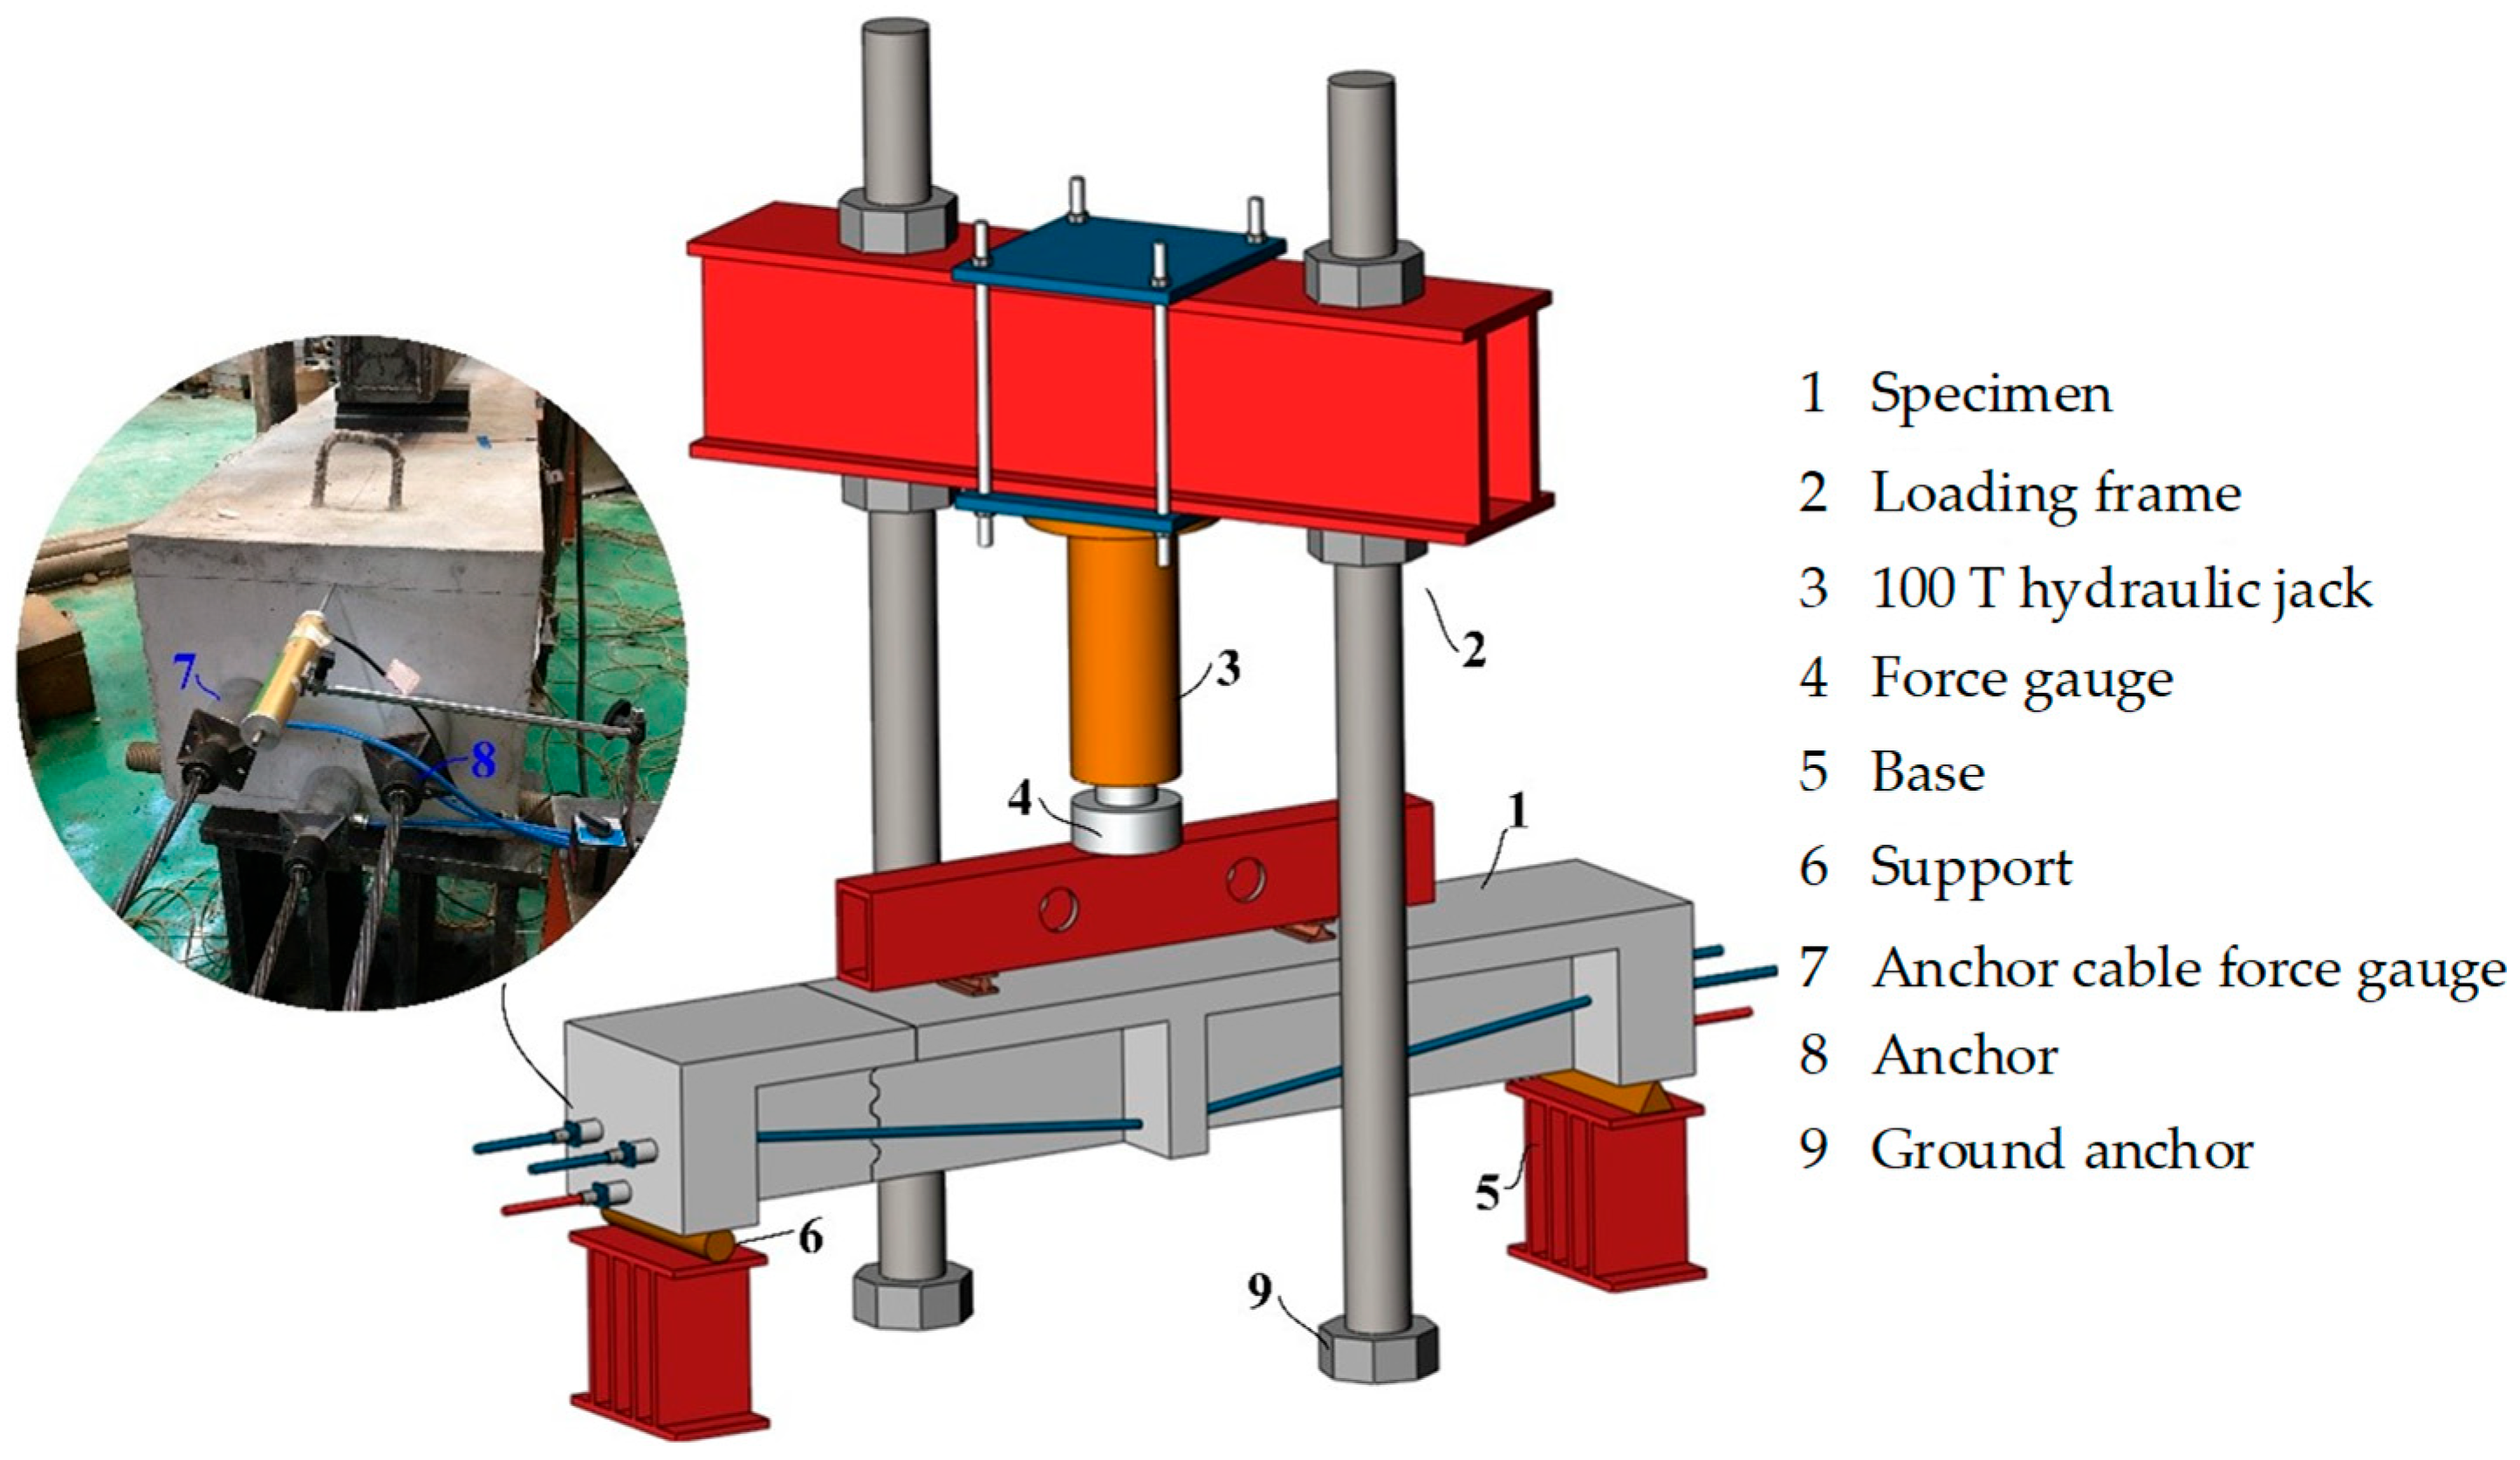
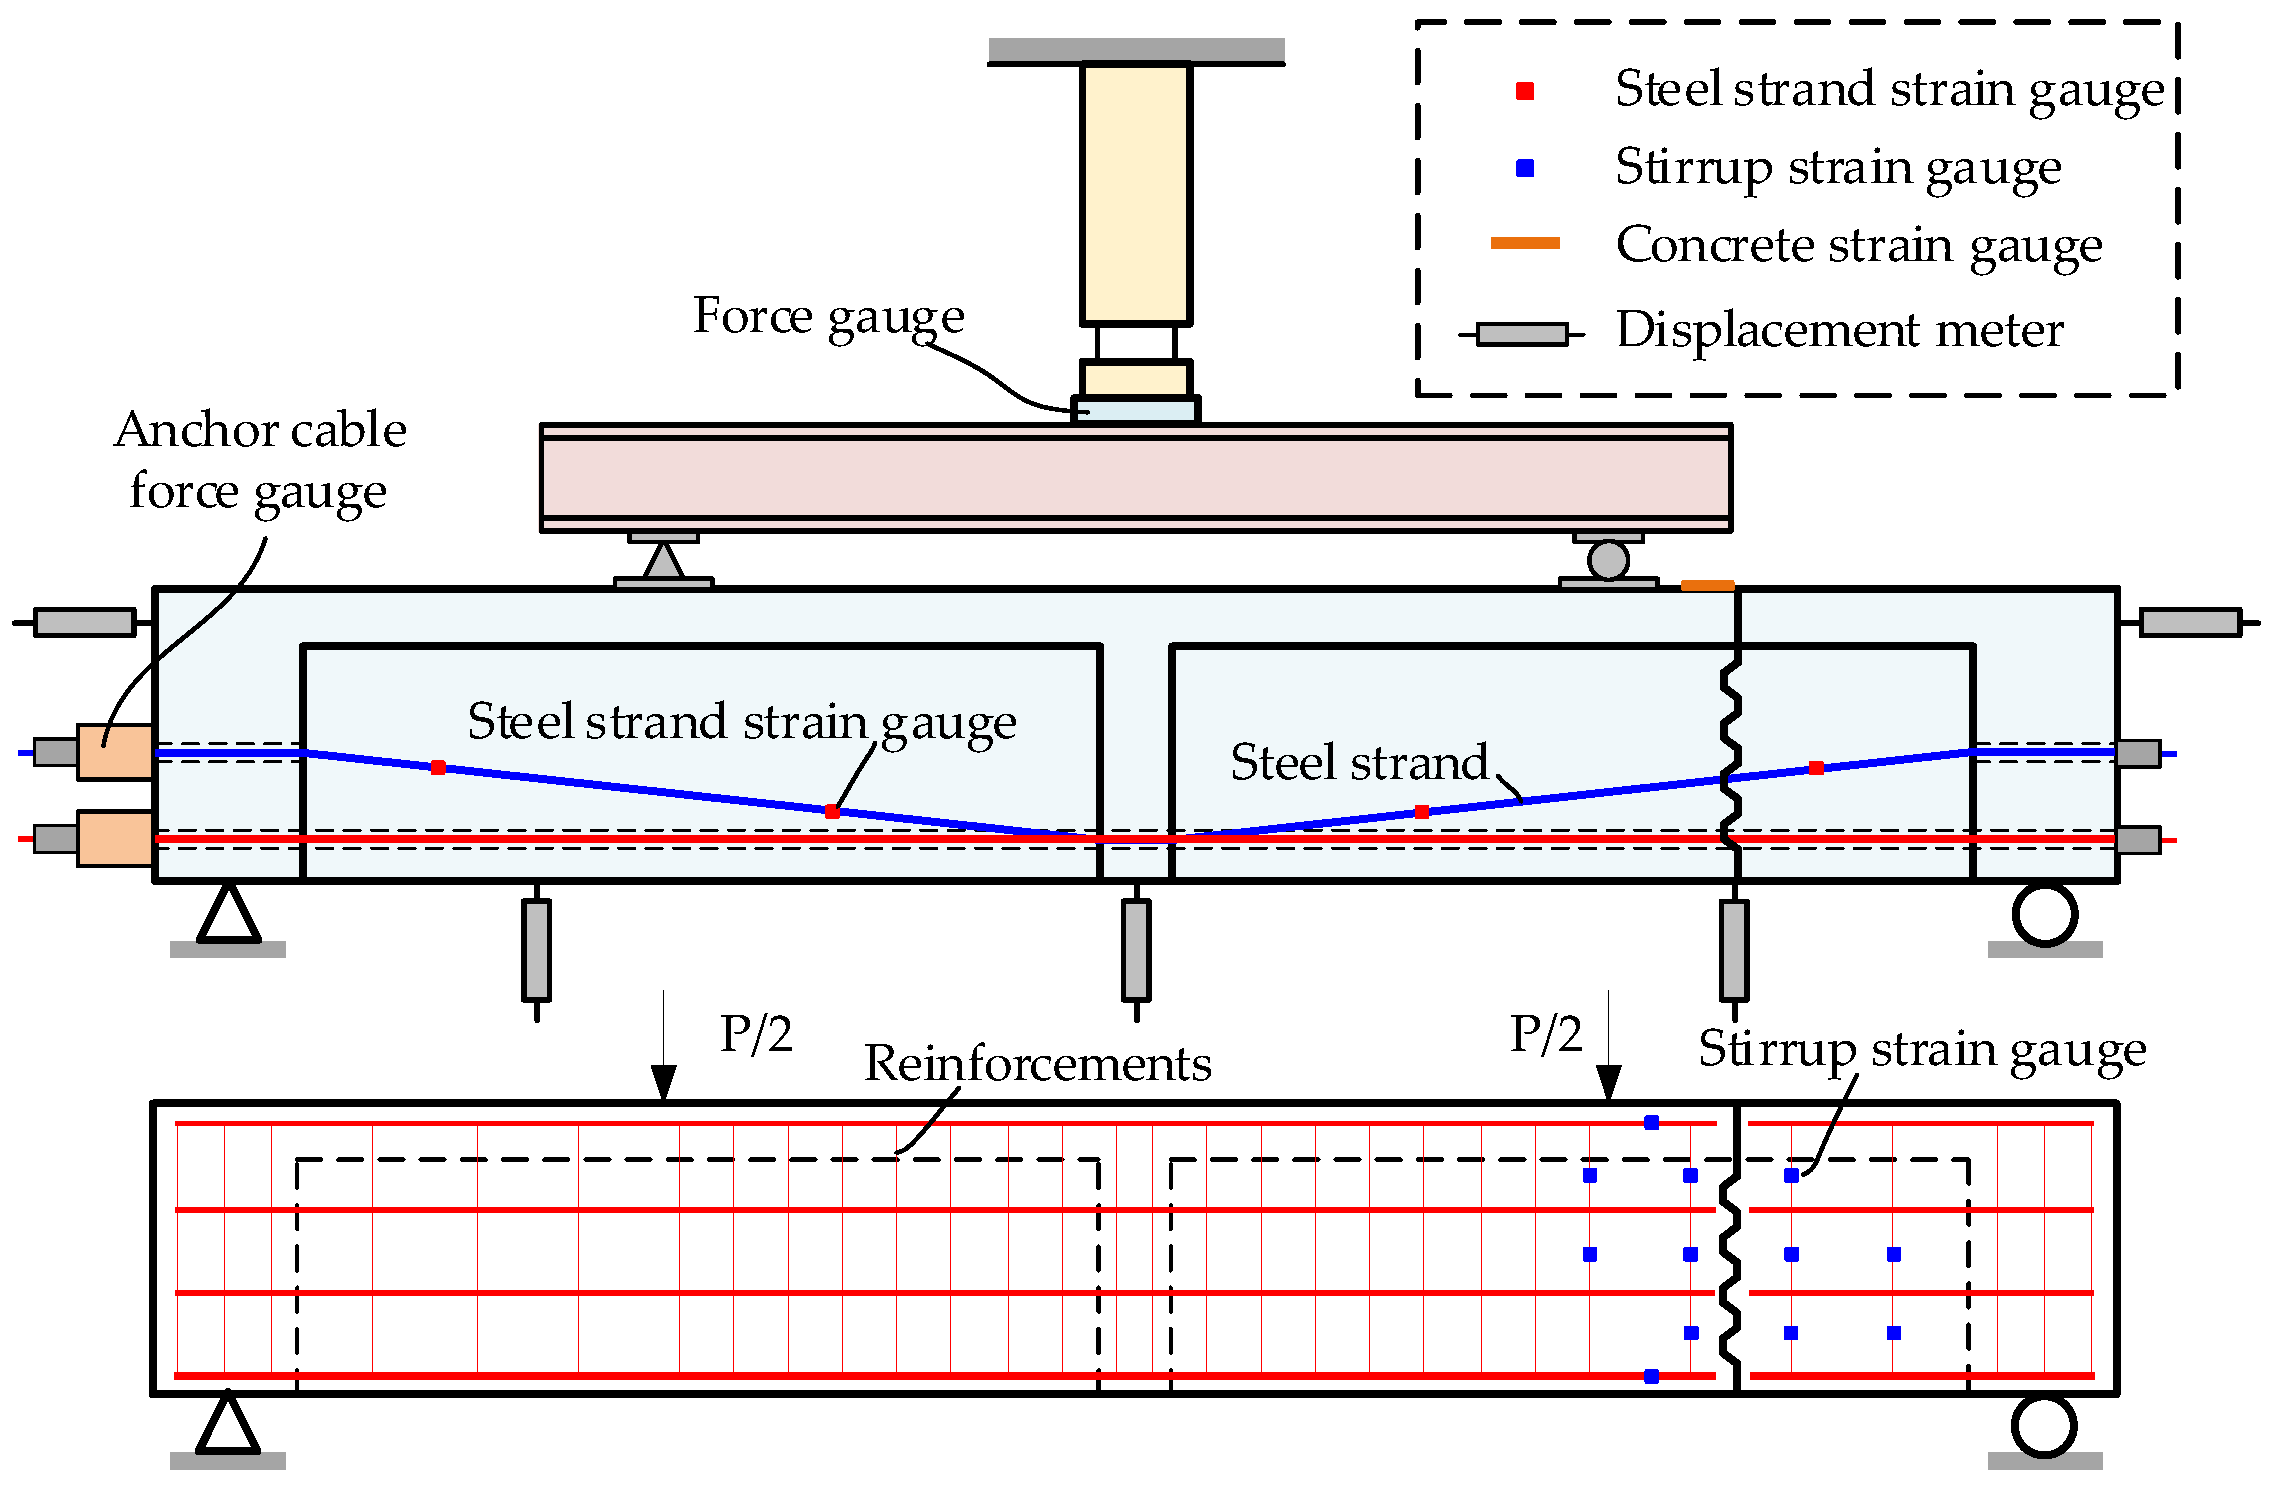
2.4. Loading and Measurement Scheme
- (1)
- Segment assembly
- (2)
- Loading scheme
- (3)
- Measurement scheme
3. Test Results
3.1. The Main Test Results
- (1)
- Effects of the segmental joints
- (2)
- Effects of the shear span ratio
- (3)
- Effects of the tendon arrangement
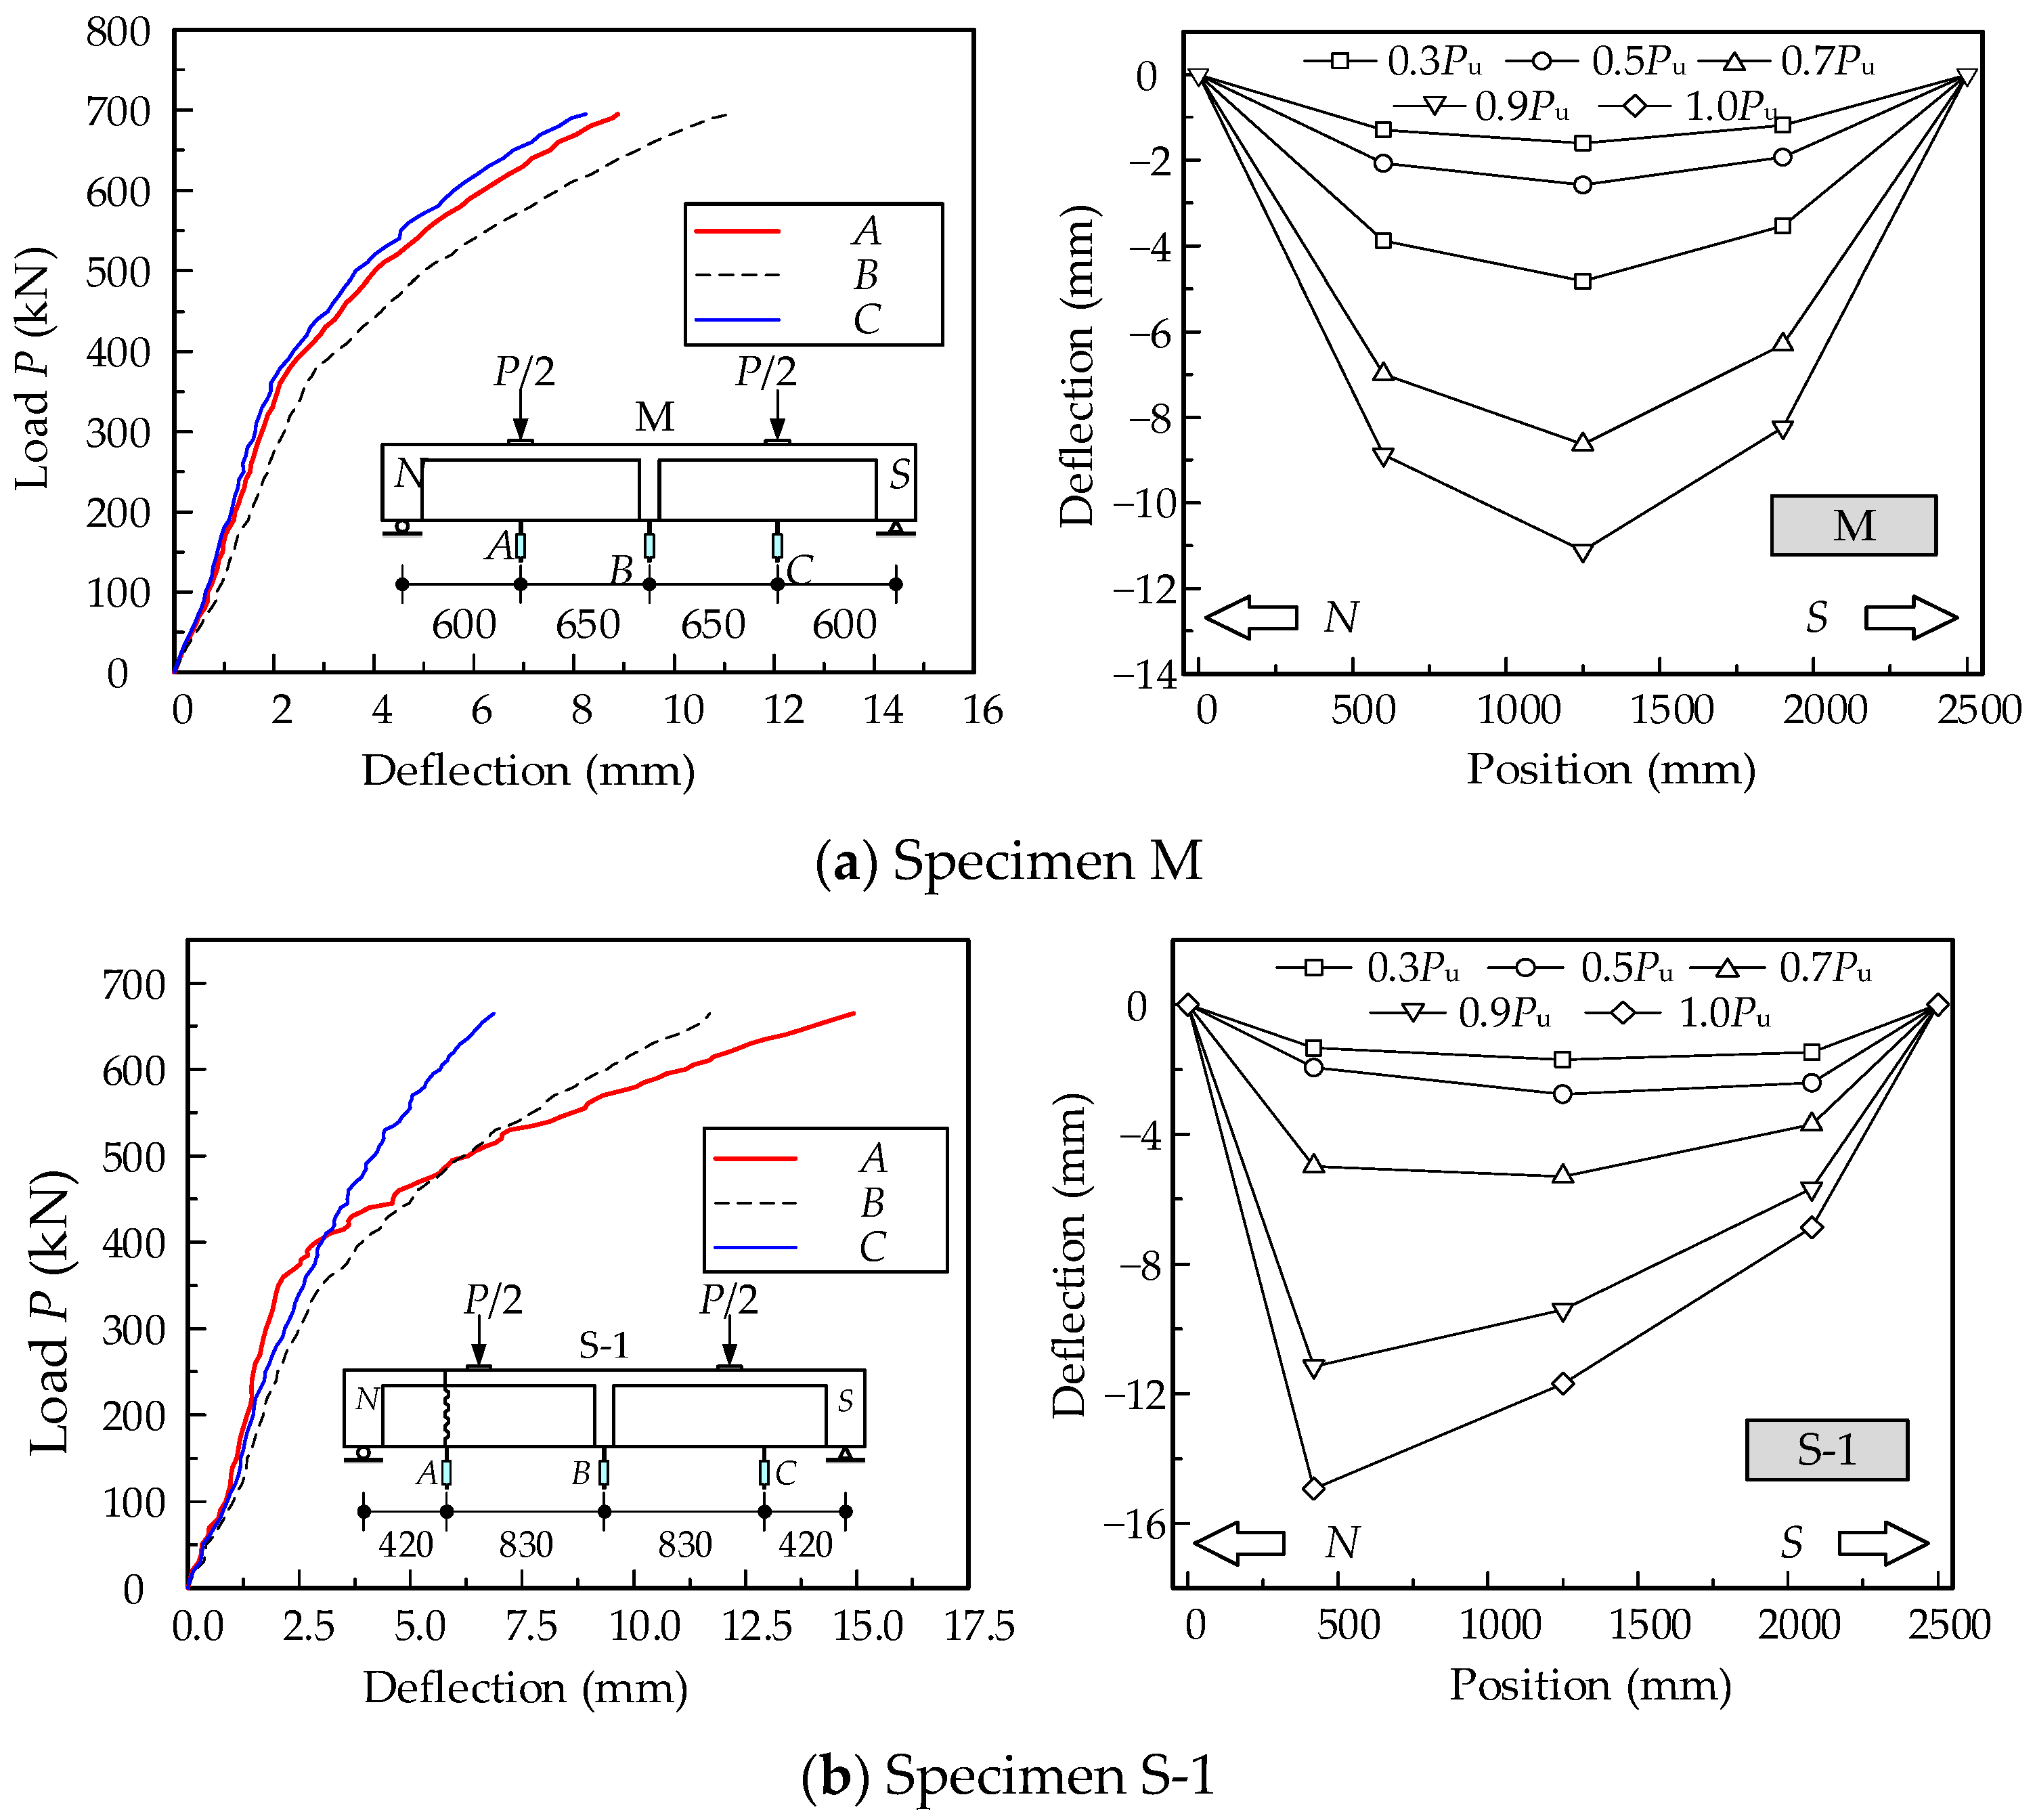
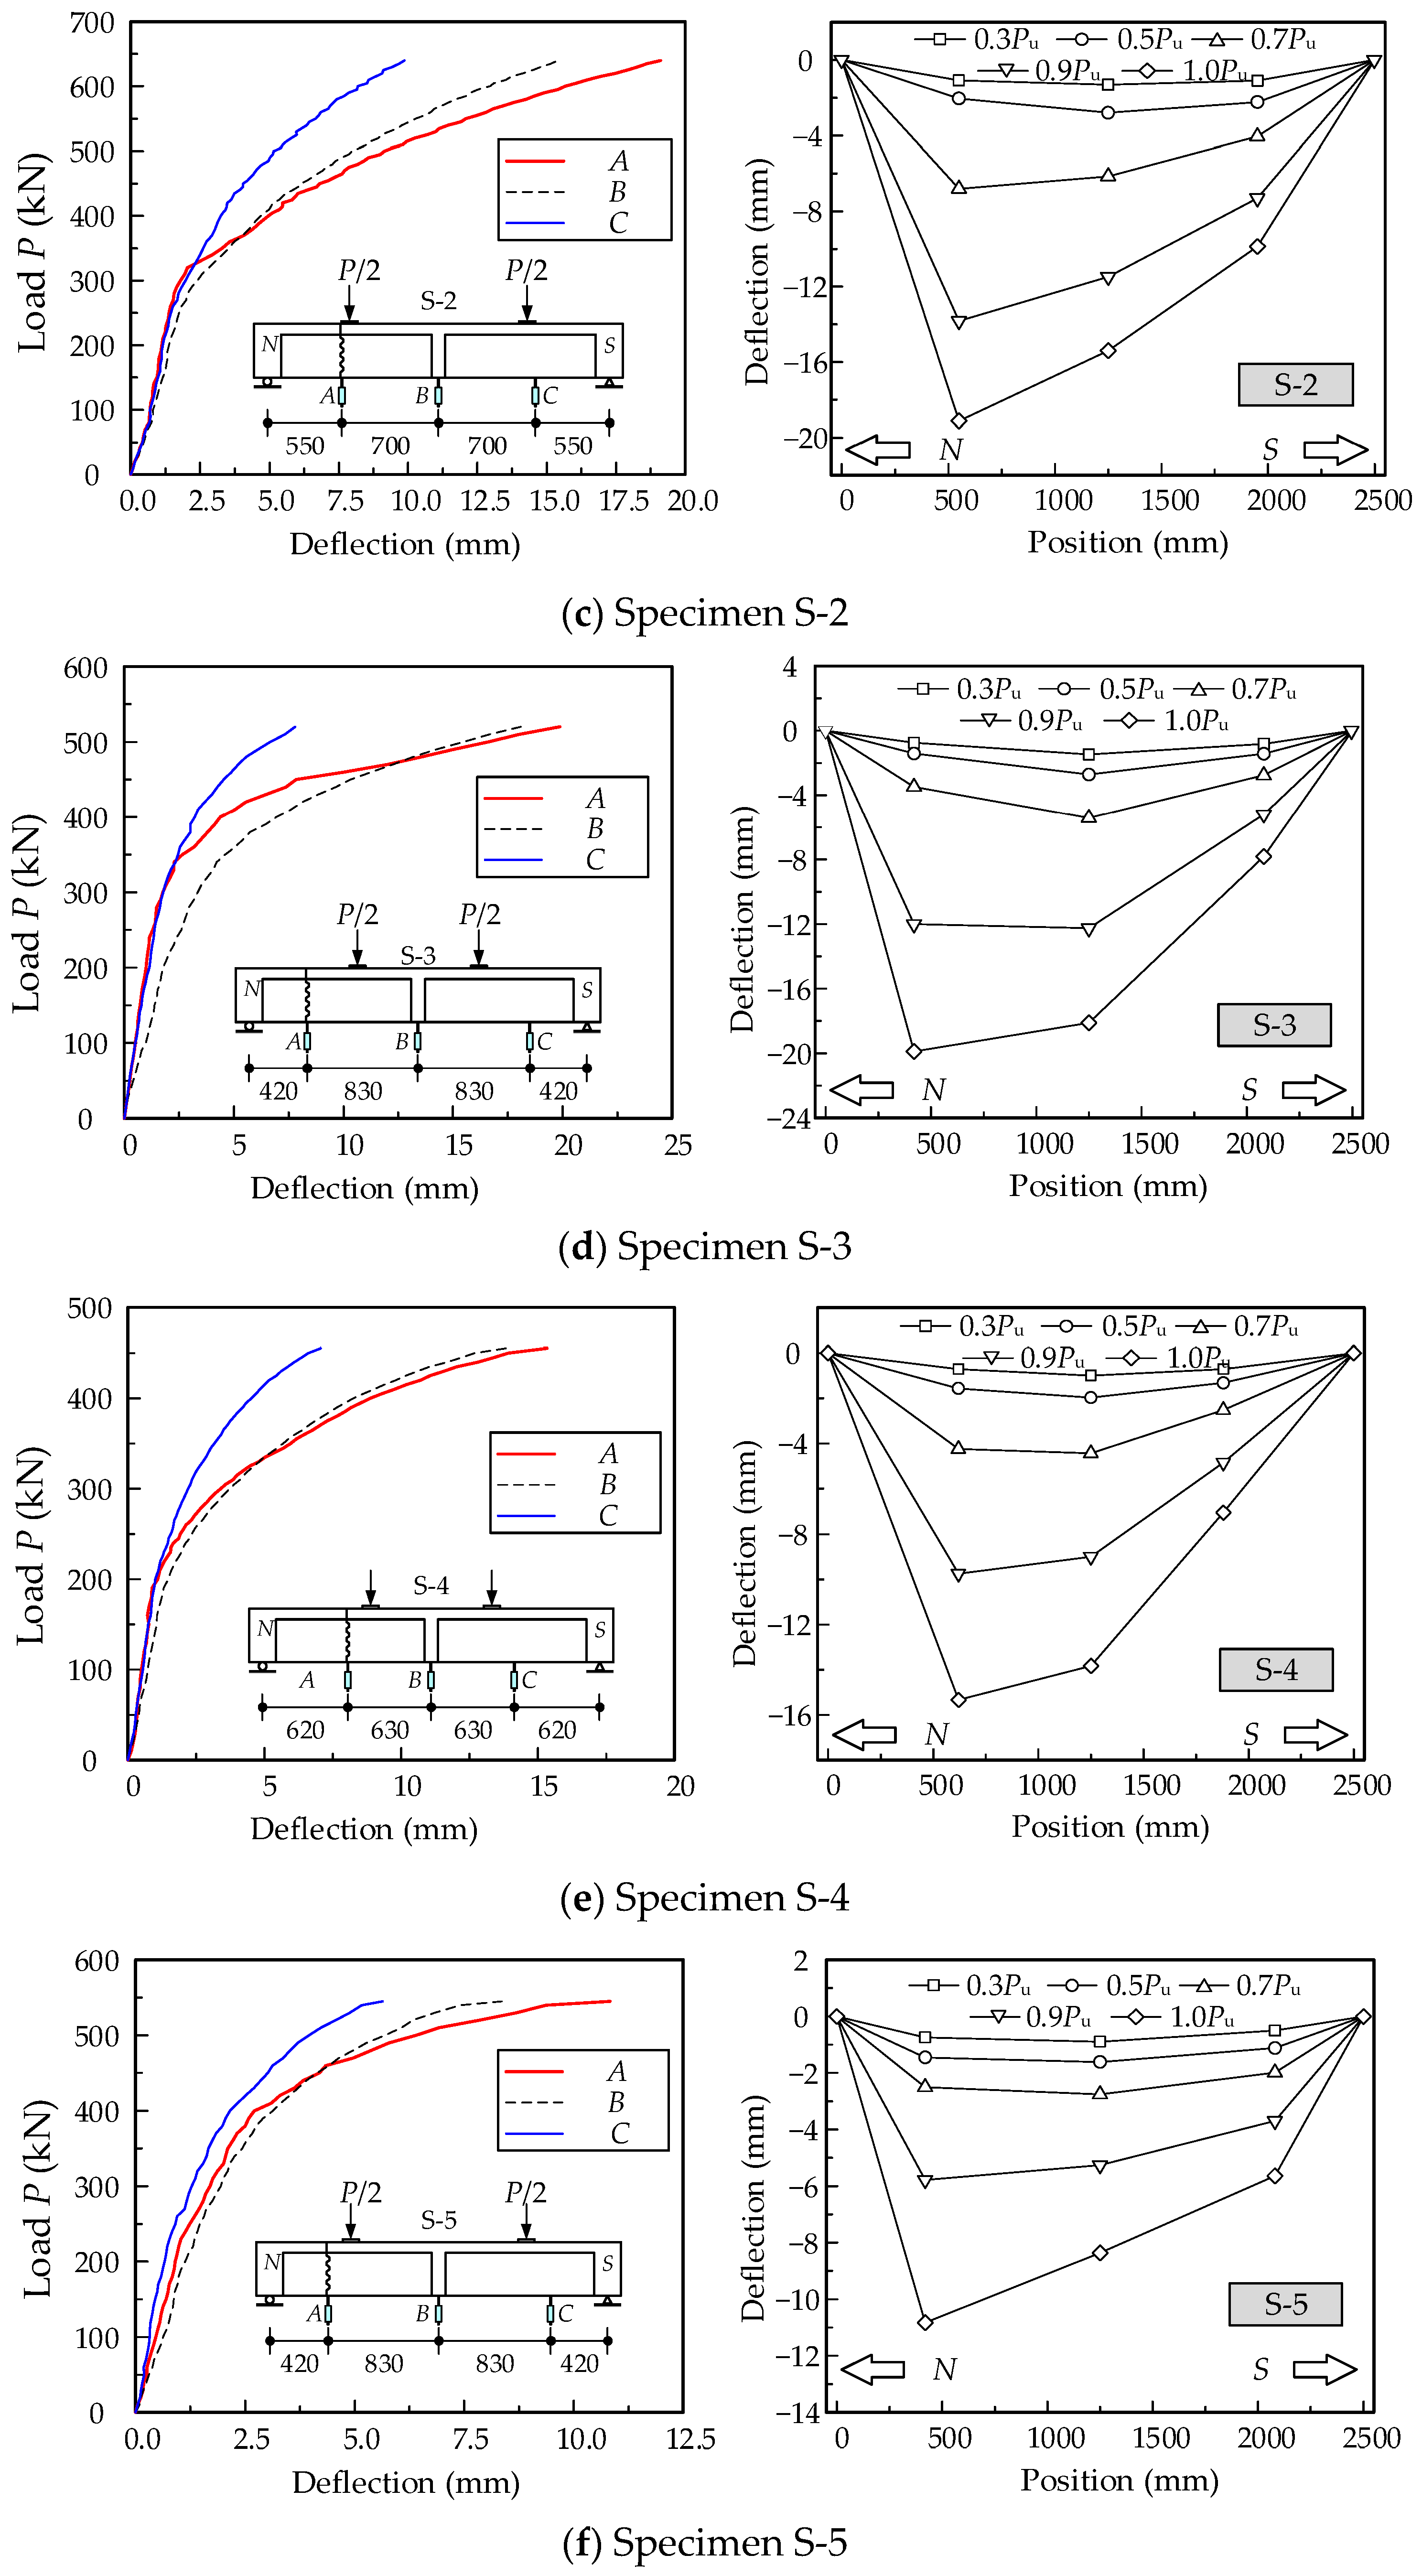
3.2. Load–Deflection Curves
- (1)
- Load–displacement curves
- (2)
- Structural deformation characteristics
- (3)
- Maximum deformation
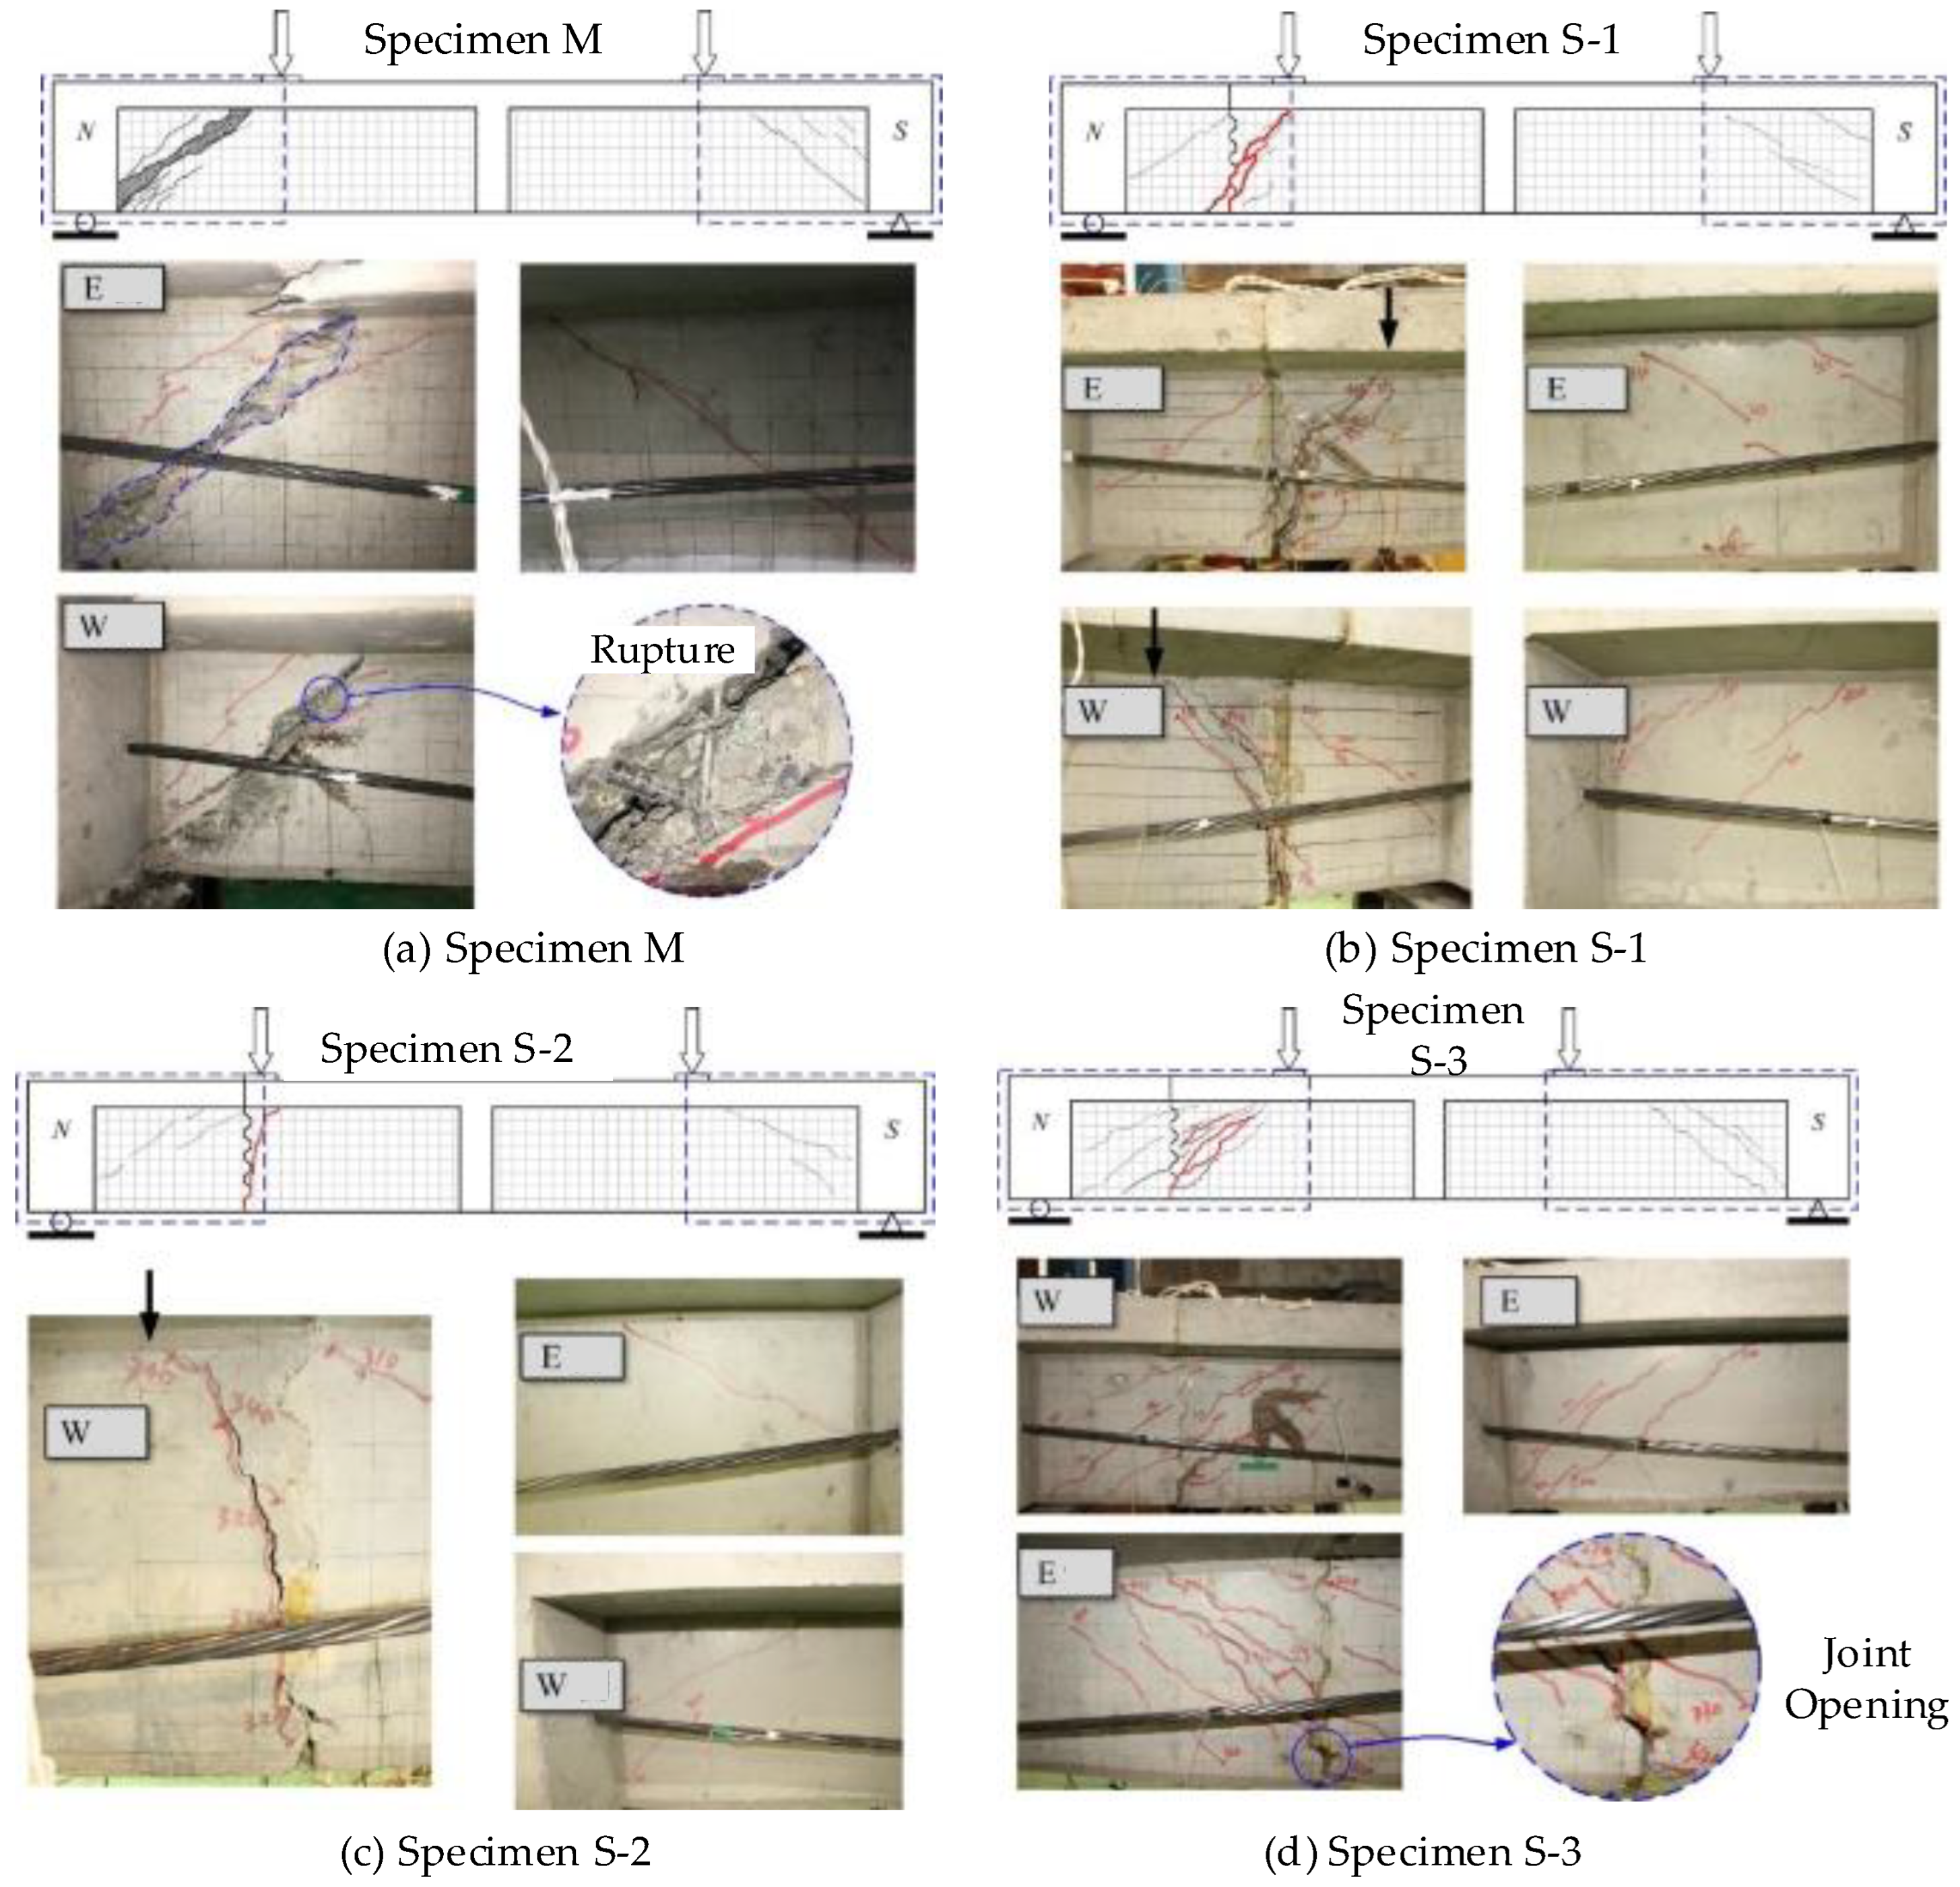
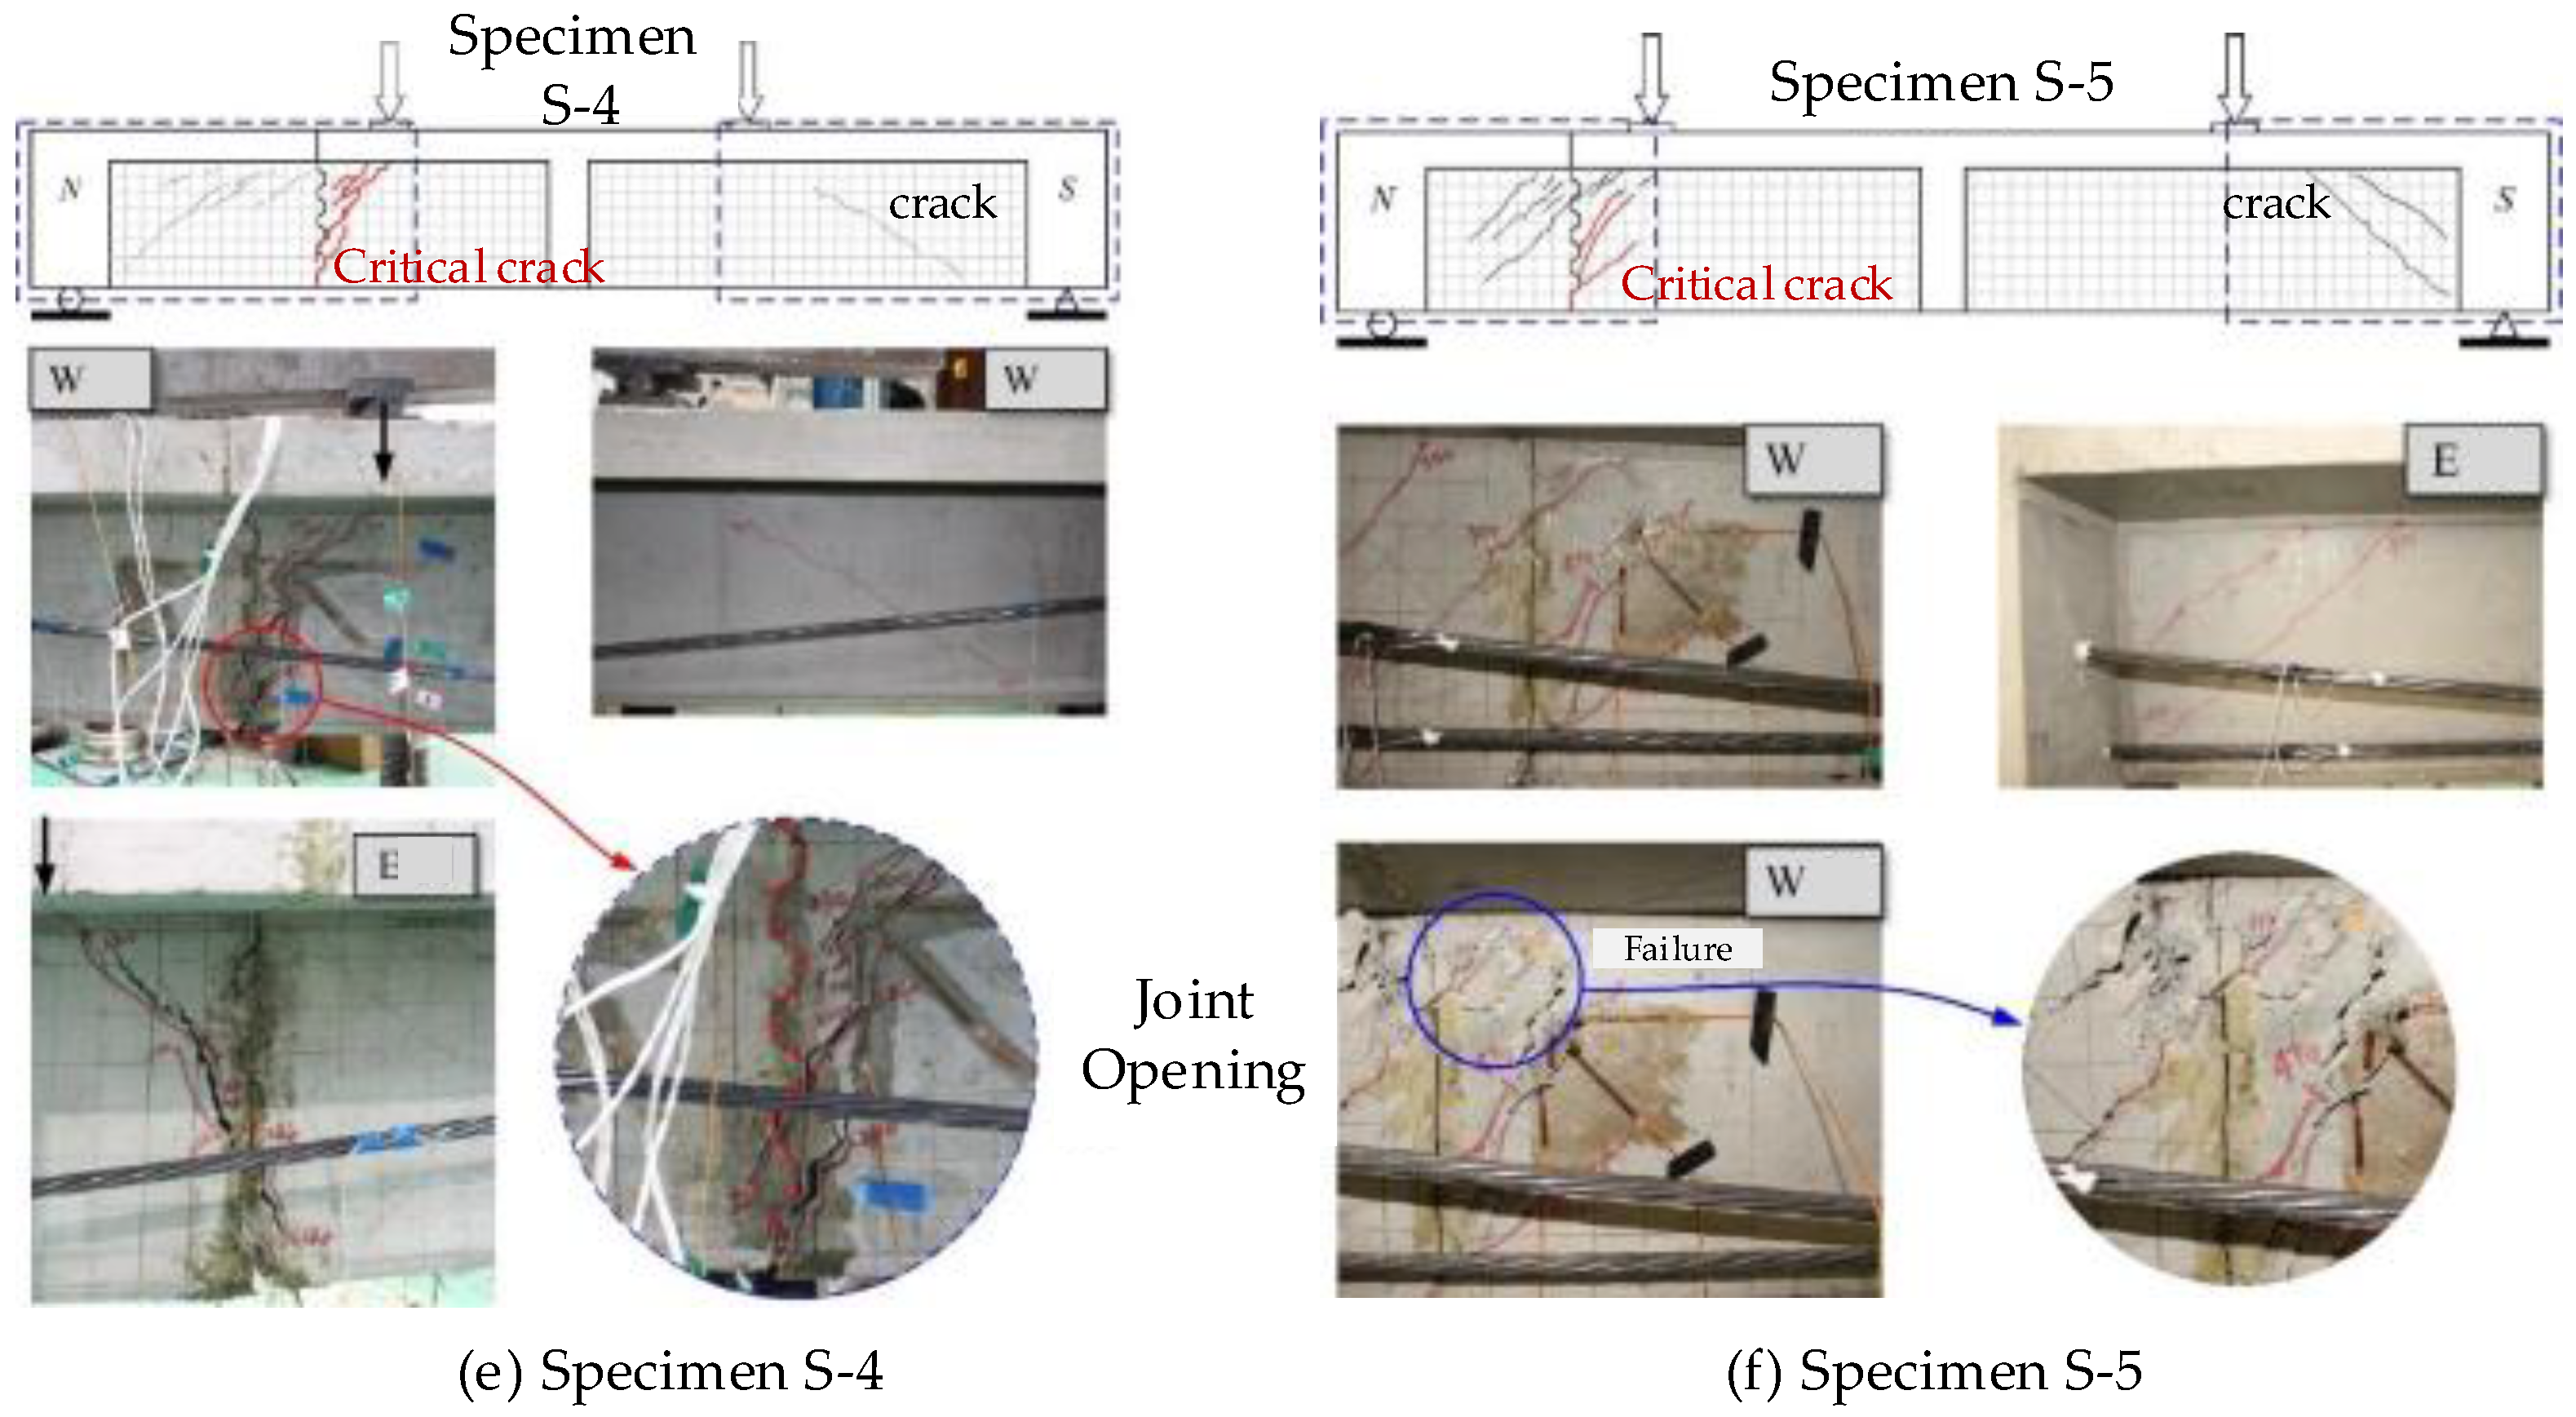
3.3. Failure Modes
- (1)
- Specimen M
- (2)
- Segmental beams
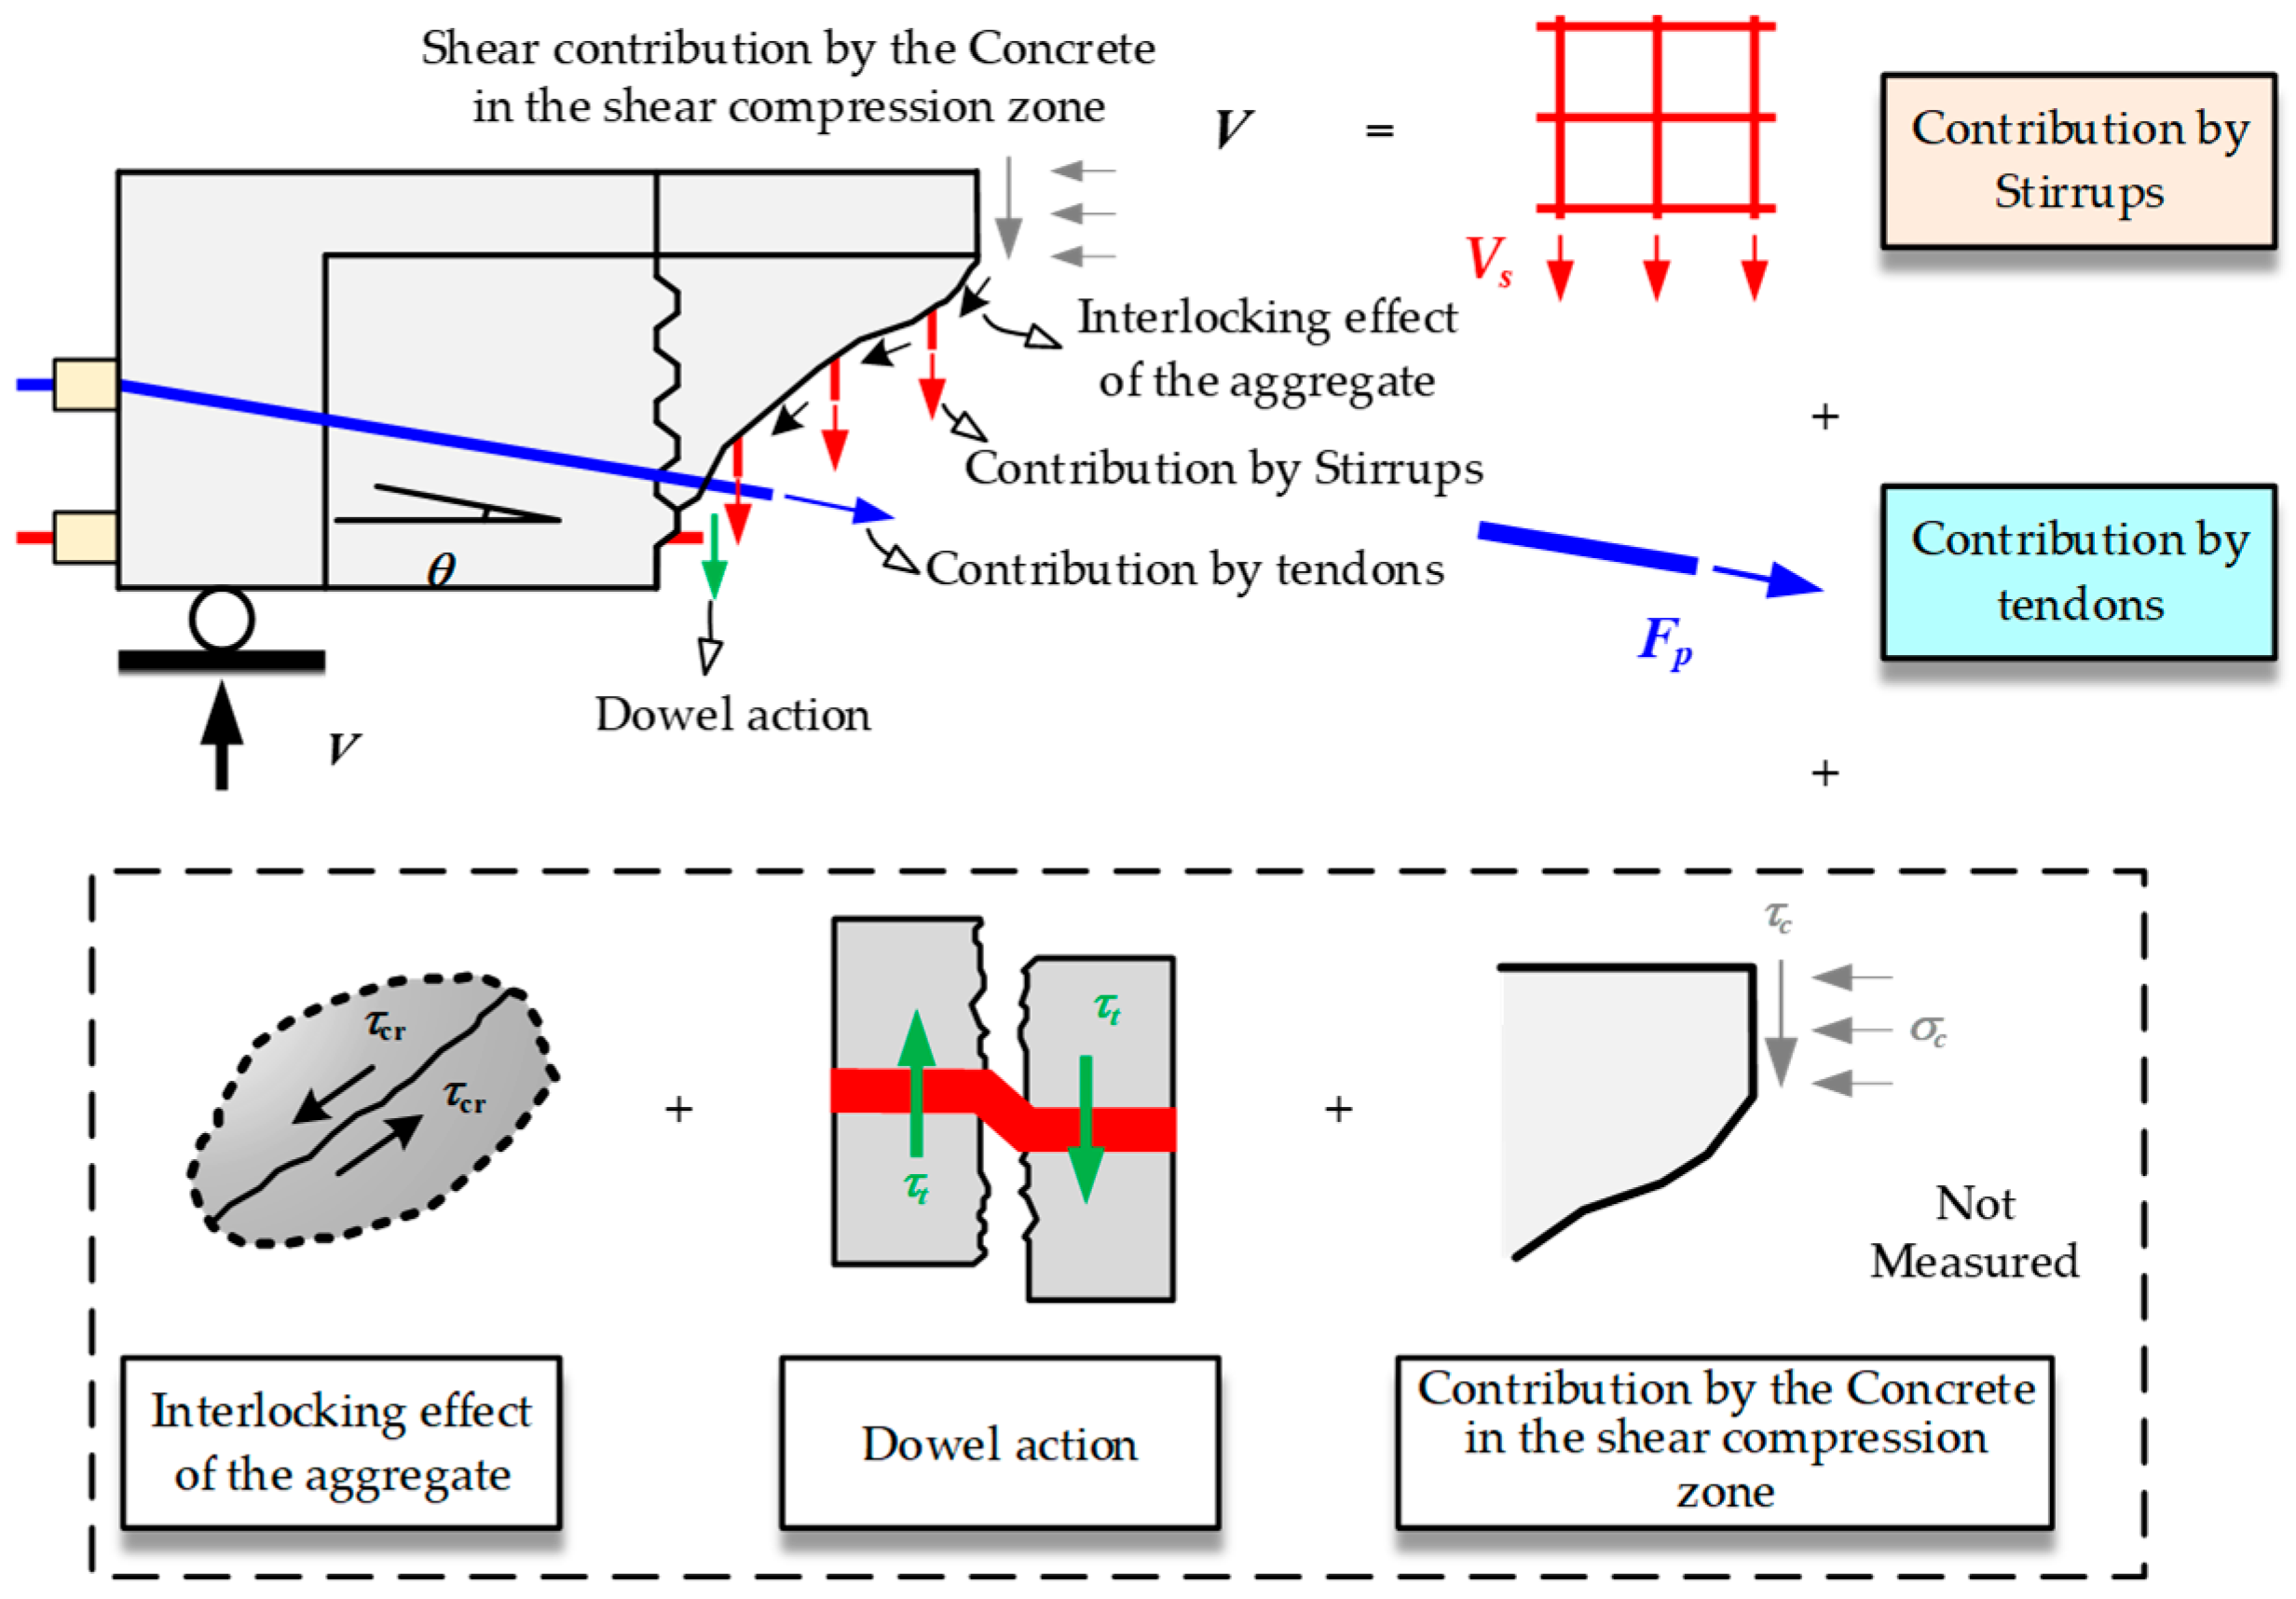
3.4. Analysis of Shear-Bearing Contribution
- (1)
- Throughout the entire loading process until failure, the shear resistance (Vc + Vd) contributed by concrete and the dowel action plays the most significant role in the structural shear capacity.
- (2)
- During the initial loading phase (before the appearance of noticeable flexural and shear cracks), the shear force is predominantly borne by Vc. After the formation of diagonal cracks, the proportion of shear force carried by stirrups crossing these cracks increases significantly. Once the stirrups at the diagonal cracks yield, they can no longer bear additional shear force, and the subsequent increase in shear force is distributed among other components.
- (3)
- The shear force contribution of internal straight tendons is lower than that of draped external strands. Notably, their contribution ratios increase substantially after joint opening.
- (4)
- At the ultimate state, the contribution ratio of Vc + Vd ranges from 48.3% to 78.3%, the contribution ratio of Vs ranges from 18.4% to 31.6%, and the contribution ratio of Vp ranges from 3.3% to 20.1%.
- (5)
- The contribution ratio of shear resistance for each component at the ultimate loading state correlates with the shear span ratio. In test beams with a shear span ratio of 2.0 (S-4 and S-5), the contribution ratios of Vs and Vp are higher than those in beams with a shear span ratio of 1.5. Conversely, the contribution ratio of Vc + Vd is lower in beams with a shear span ratio of 2.0 compared to those with a shear span ratio of 1.5.
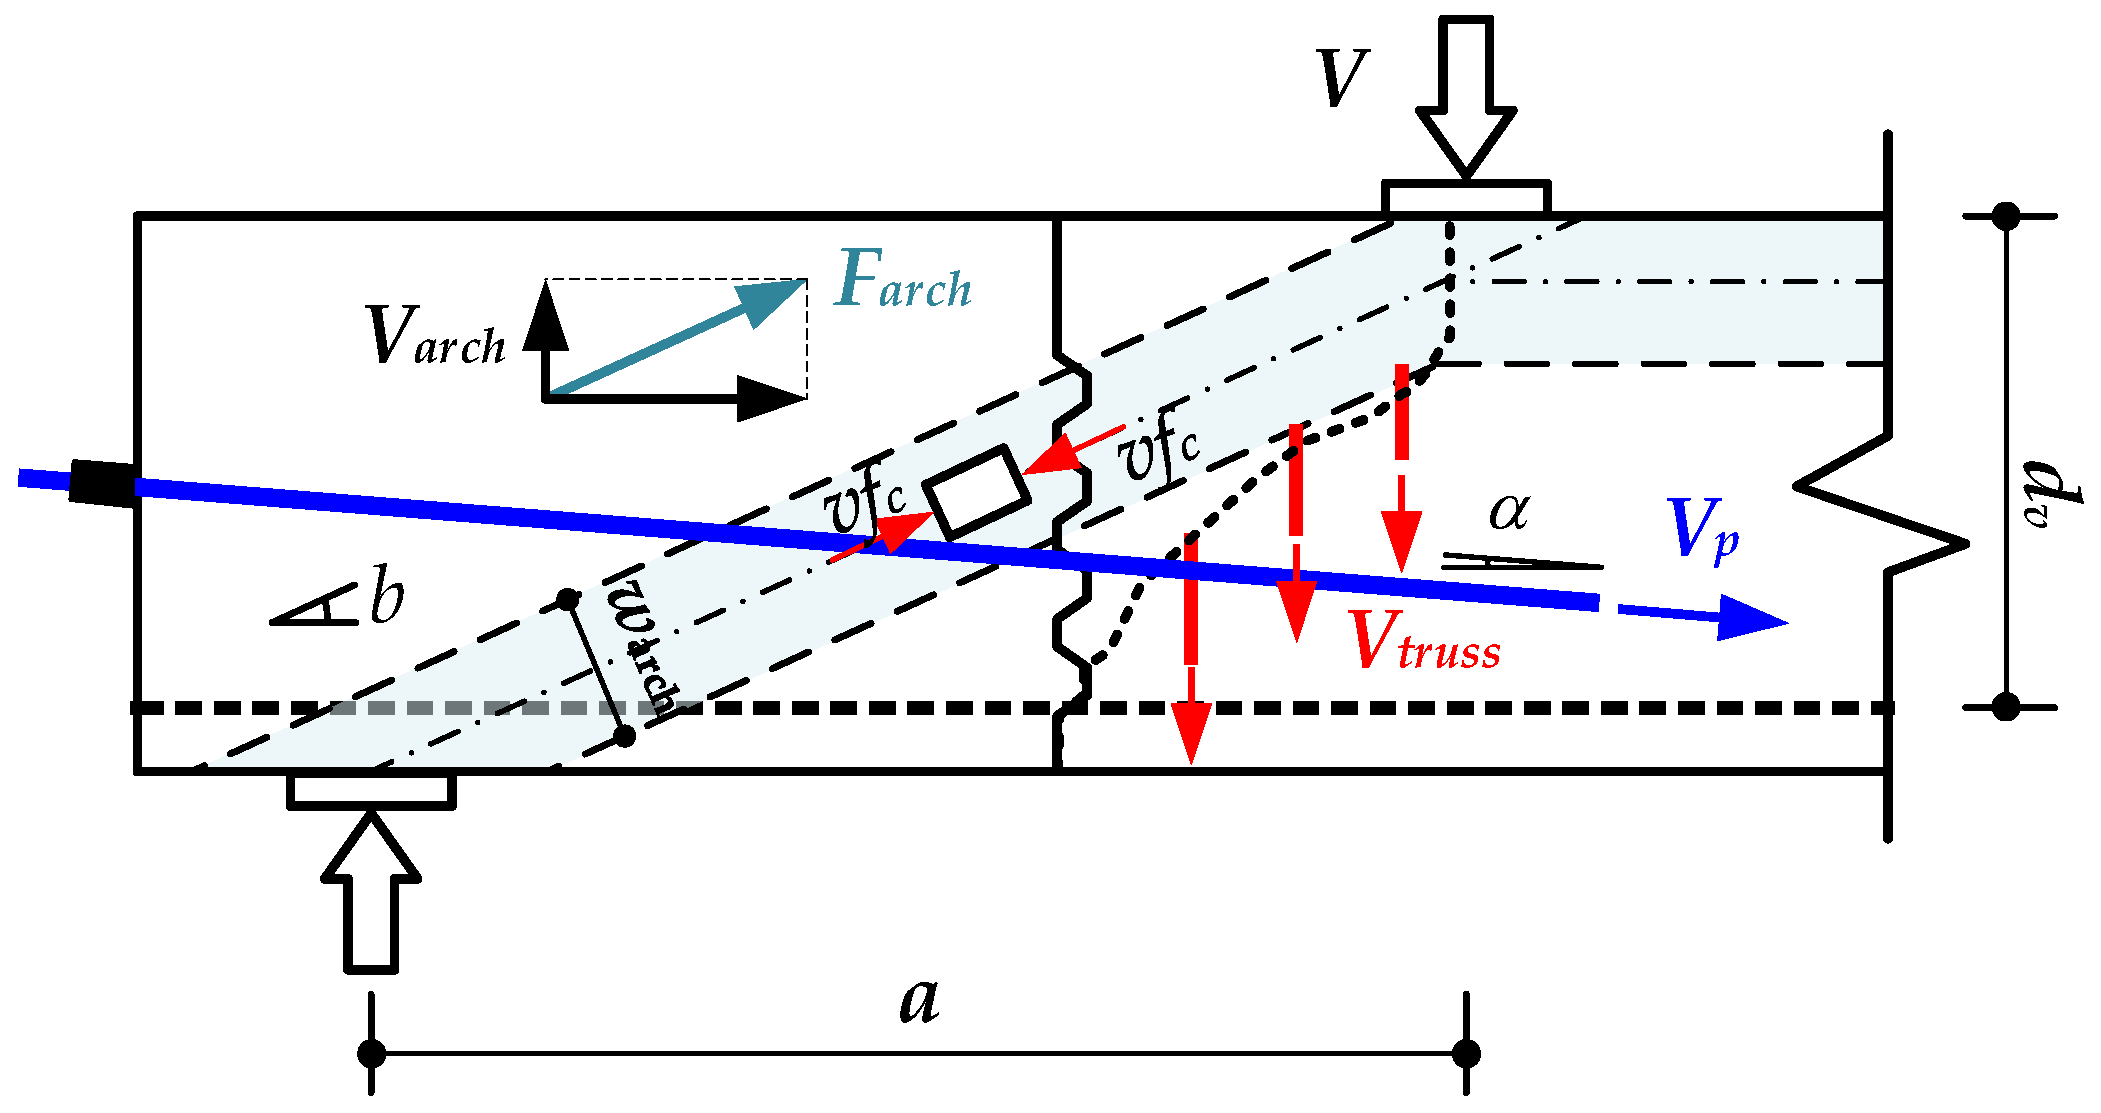
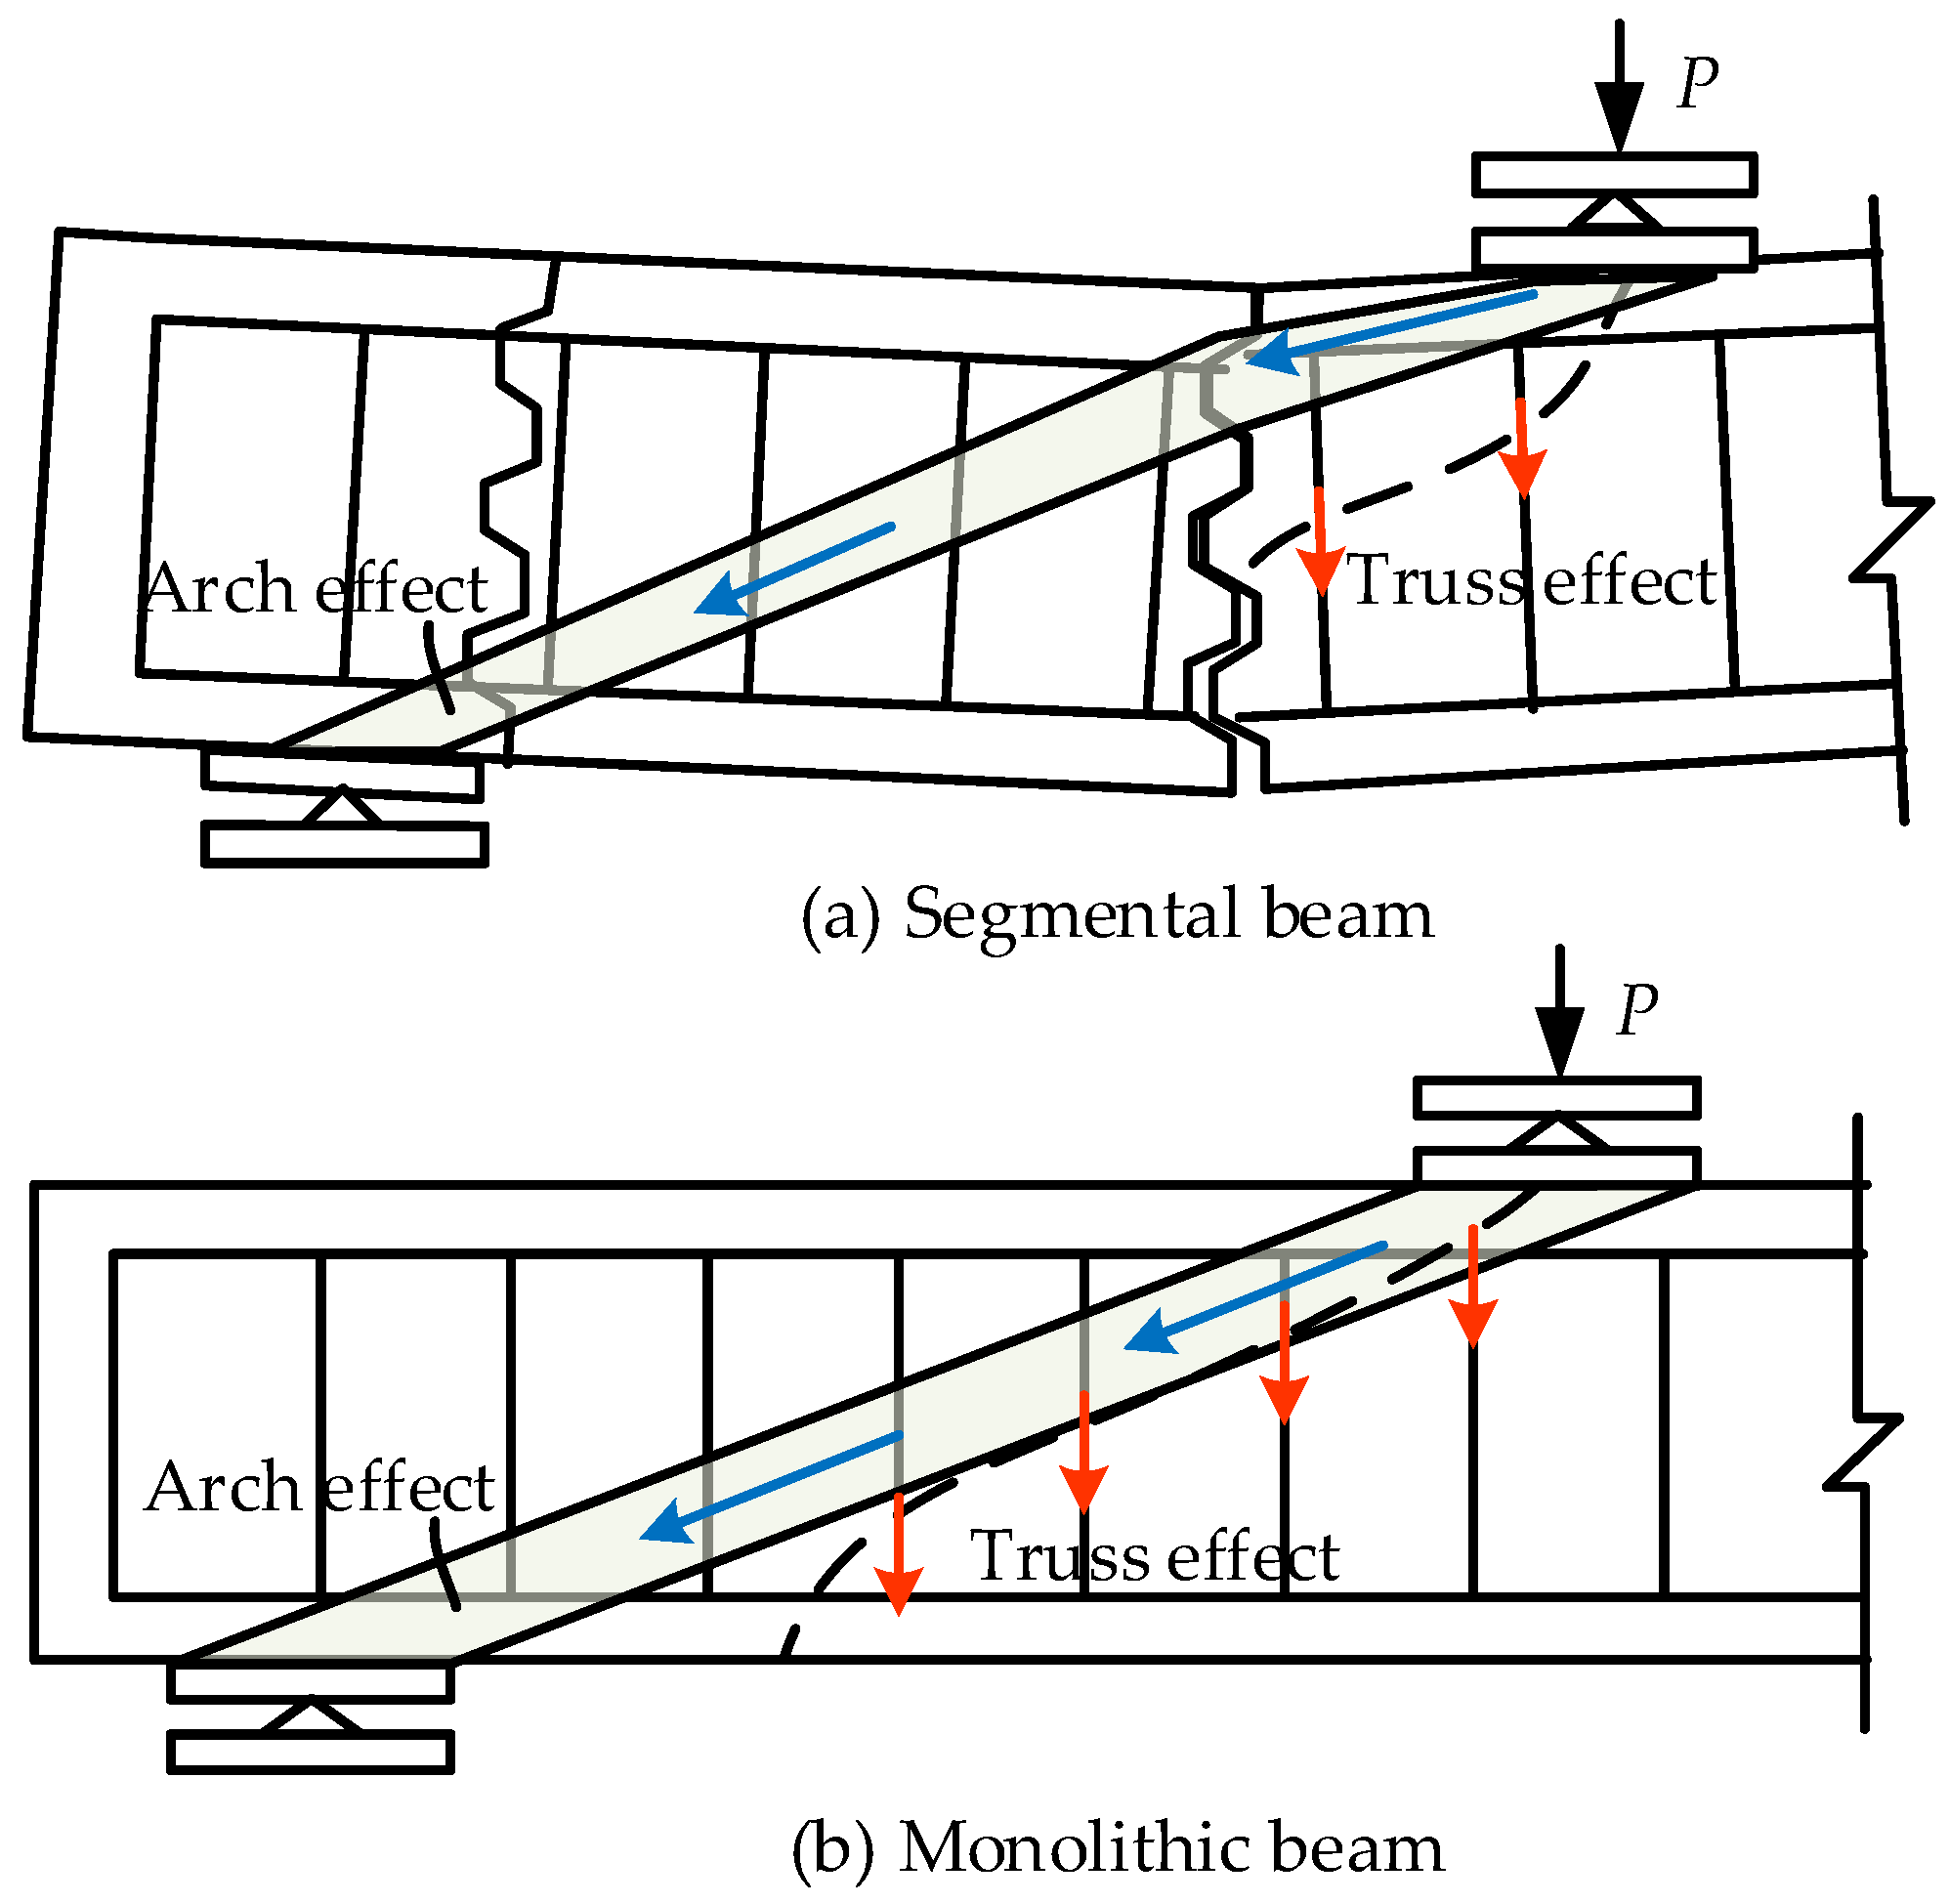
4. Shear Mechanism Analysis Based on the Combined Truss and Arch Model
- (1)
- Shear strength prediction based on combined truss and arch models
- (1)
- (2)
- The rise of the arch rib in the arch effect is defined as the distance from the centroid of the prestressed tendon to the top of the beam.
- (3)
- In the truss effect, diagonal cracks are assumed to develop between the loading point and the adjacent joint within the shear span region. The shear resistance contribution of the truss effect considers only the contribution of stirrups, excluding the shear resistance provided by concrete.
- (4)
- The shear resistance contribution of the prestressed tendon is determined by the vertical component of the effective prestress within the tendon.
- (1)
- Influence mechanism of factors
- (2)
- Influence of shear span ratio
- (3)
- Influence of segmental joints
- (4)
- Influences of tendon stress
- (5)
- Influence of internal/external prestressing type
- (6)
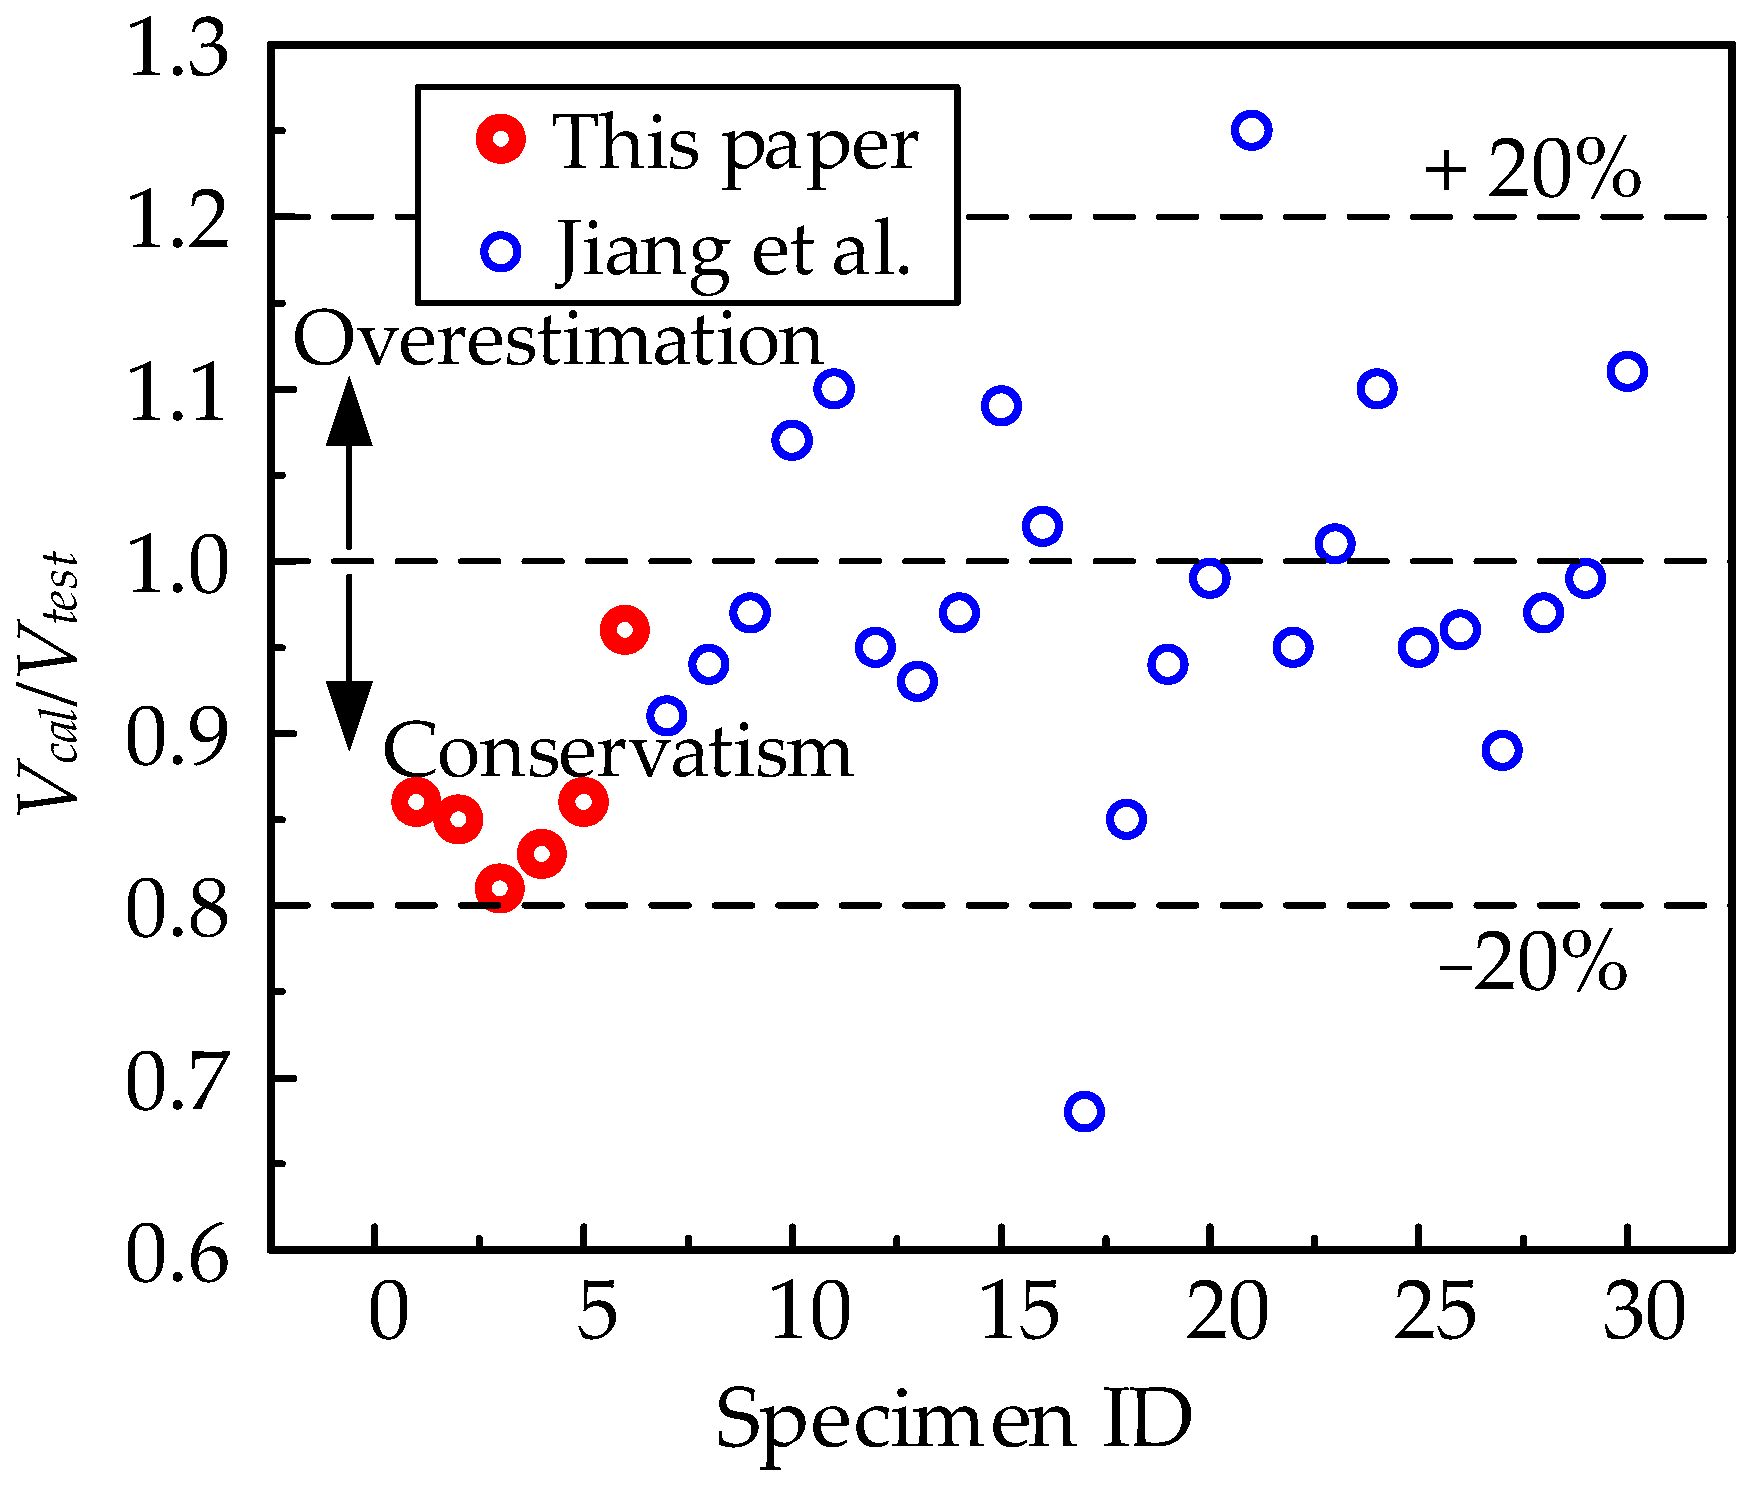
- Discussion of the proposed equations
5. Conclusions
- (1)
- The discontinuity of the open segmental joints alters the failure modes of PSCBs, differing from the monolithic beam, and the maximum reduction of shear-carrying capacity is 7.6% in the tests. The closer the distance between the loading point and the joint, the more significant the adverse effect of the joint.
- (2)
- Under extreme test conditions, the proportion of shear resistance contributed by concrete segments is the highest, ranging from 48.3% to 78.3%; the contribution from stirrups ranges between 18.4% and 31.6%, while that from prestressed tendons falls within 3.3% to 20.1%. The contribution ratio of each component is found to be correlated with the shear span ratio, with an increasing shear span ratio leading to a decrease in the contribution from concrete segments.
- (3)
- The truss–arch model can reasonably explain the shear-bearing mechanism of PSCBs and the action mechanism of each influencing factor. The proposed simplified calculation formula reasonably estimates the shear capacity of thirty segmental beams, with a mean ratio of calculated-to-test values of 0.96 and a standard deviation of 0.11.
- (4)
- This research focuses on the shear behavior of PSCBs constructed with ordinary concrete and steel strand prestressed tendons. For PSCBs incorporating new materials such as CFRP tendons and UHPC segments, further studies are still needed.
Author Contributions
Funding
Data Availability Statement
Acknowledgments
Conflicts of Interest
Appendix A

| Source | ID | fc | dv | bv | a | fy | As | fpe | Ap | Vcal | Vtest | Vcal/Vtest |
|---|---|---|---|---|---|---|---|---|---|---|---|---|
| This paper | M | 43 | 346 | 100 | 600 | 356 | 28.3 | 631.1 | 278 | 602 | 696.1 | 0.86 |
| S-1 | 43 | 346 | 100 | 600 | 356 | 28.3 | 675.9 | 278 | 564 | 666.7 | 0.85 | |
| S-2 | 43 | 346 | 100 | 600 | 356 | 28.3 | 608.3 | 278 | 520 | 643.2 | 0.81 | |
| S-3 | 43 | 346 | 100 | 800 | 356 | 28.3 | 659.4 | 278 | 431 | 522.6 | 0.83 | |
| S-4 | 43 | 346 | 100 | 800 | 356 | 28.3 | 669.4 | 278 | 391 | 457.1 | 0.86 | |
| S-5 | 43 | 346 | 100 | 600 | 356 | 28.3 | 654.9 | 278 | 523 | 546.3 | 0.96 | |
| Jiang et al. [33,34] | FM1.6-N-N-e | 45 | 270 | 70 | 450 | 345 | 28.3 | 983 | 109.6 | 354 | 389 | 0.91 |
| FD1.6-40-N-e | 45 | 270 | 70 | 450 | 345 | 28.3 | 937 | 109.6 | 316 | 335 | 0.94 | |
| FM2.2-N-N-e | 47 | 270 | 70 | 600 | 345 | 28.3 | 851.3 | 109.6 | 311 | 320 | 0.97 | |
| FD2.2-40-N-e | 45 | 270 | 70 | 600 | 345 | 28.3 | 1016 | 109.6 | 304 | 285 | 1.07 | |
| FE2.2-40-N-e | 45 | 270 | 70 | 600 | 345 | 28.3 | 988 | 109.6 | 304 | 275 | 1.10 | |
| FD2.2-20-50-e | 50 | 270 | 70 | 600 | 345 | 28.3 | 815.3 | 109.6 | 323 | 340.2 | 0.95 | |
| FE2.2-20-50-e | 50 | 270 | 70 | 600 | 345 | 28.3 | 731.3 | 109.6 | 322 | 345 | 0.93 | |
| FM2.7-N-N-e | 48 | 270 | 70 | 750 | 345 | 28.3 | 799 | 109.6 | 274 | 284.1 | 0.97 | |
| FD2.7-40-N-e | 54 | 270 | 70 | 750 | 345 | 28.3 | 778.5 | 109.6 | 336 | 307.4 | 1.09 | |
| FE2.7-40-N-e | 54 | 270 | 70 | 750 | 345 | 28.3 | 739.8 | 109.6 | 336 | 330.2 | 1.02 | |
| FD2.7-70-N-e | 37 | 270 | 70 | 750 | 345 | 28.3 | 592 | 109.6 | 190 | 280 | 0.68 | |
| FD2.7-40-70-e | 54 | 270 | 70 | 750 | 345 | 28.3 | 719 | 109.6 | 257 | 304.1 | 0.85 | |
| FE2.7-40-70-e | 54 | 270 | 70 | 750 | 345 | 28.3 | 753.3 | 109.6 | 258 | 275.2 | 0.94 | |
| FD2.7-20-50-e | 51 | 270 | 70 | 750 | 345 | 28.3 | 761.3 | 109.6 | 326 | 329 | 0.99 | |
| FE2.7-20-50-e | 51 | 270 | 70 | 750 | 345 | 28.3 | 732.8 | 109.6 | 325 | 259.7 | 1.25 | |
| SM1.6-N-N-h | 35 | 270 | 110 | 450 | 345 | 28.3 | 651.7 | 109.6 | 405 | 425.2 | 0.95 | |
| SD1.6-20-50-h | 35 | 270 | 110 | 450 | 345 | 28.3 | 655 | 109.6 | 405 | 399.5 | 1.01 | |
| SD1.6-20-50-e | 35 | 270 | 110 | 450 | 345 | 28.3 | 630.8 | 109.6 | 404 | 366.7 | 1.10 | |
| SM2.2-N-N-h | 35 | 270 | 110 | 600 | 345 | 28.3 | 649.3 | 109.6 | 340 | 359.5 | 0.95 | |
| SD2.2-20-50-h | 35 | 270 | 110 | 600 | 345 | 28.3 | 622.3 | 109.6 | 301 | 315 | 0.96 | |
| SD2.2-20-50-e | 35 | 270 | 110 | 600 | 345 | 28.3 | 608 | 109.6 | 300.7 | 338.6 | 0.89 | |
| SM2.7-N-N-h | 35 | 270 | 110 | 750 | 345 | 28.3 | 645.3 | 109.6 | 296.3 | 305.4 | 0.97 | |
| SD2.7-20-50-h | 35 | 270 | 110 | 750 | 345 | 28.3 | 643 | 109.6 | 296.3 | 298.8 | 0.99 | |
| SD2.7-20-50-e | 35 | 270 | 110 | 750 | 345 | 28.3 | 625.8 | 109.6 | 296.0 | 267.7 | 1.11 |
References
- Ye, M.; Li, L.; Pei, B.; Yoo, D.-Y.; Li, H.; Zhou, C. A critical review on shear performance of joints in precast Ultra-High-Performance Concrete (UHPC) segmental bridges. Eng. Struct. 2024, 301, 117224. [Google Scholar] [CrossRef]
- Zheng, H.; Chen, D.; Ou, M.; Liang, X.; Luo, Y. Flexural Behavior of Precast UHPC Segmental Beams with Unbonded Tendons and Epoxy Resin Joints. Buildings 2023, 13, 1643. [Google Scholar] [CrossRef]
- Sabit, H.A.; Aziz, A.H. Structural Performance of Deteriorated and Strengthened Precast Concrete Segmental Beams with Epoxy Joints under Concentric and Eccentric Loads. Int. J. Eng. 2025, 38, 609–618. [Google Scholar] [CrossRef]
- Tran, D.T.; Pham, T.M.; Hao, H.; Do, T.V.; Tran, T.T. Blast Behaviour of Precast Segmental vs Monolithic Concrete Beams Prestressed with Unbonded Tendons: A Numerical Investigation. Int. J. Impact Eng. 2023, 173, 104434. [Google Scholar] [CrossRef]
- Zou, Y.; Xu, D. Improving Shear Performance of Precast Concrete Segmental Beams Through Continuous Longitudinal Reinforcements Across Joints. Materials 2025, 18, 1410. [Google Scholar] [CrossRef] [PubMed]
- Hu, H.; Zhou, P.; Yang, C.; Li, X. Shear Behavior of Externally Prestressed Precast Concrete Segmental Beams with Both Positive and Negative Moment Regions. Eng. Struct. 2024, 316, 118544. [Google Scholar] [CrossRef]
- Yuan, A.; Dai, H.; Sun, D.; Cai, J. Behaviors of segmental concrete box beams with internal tendons and external tendons under bending. Eng. Struct. 2013, 48, 623–634. [Google Scholar] [CrossRef]
- Jiang, H.; Cao, Q.; Liu, A.; Wang, T.; Qiu, Y. Flexural behavior of precast concrete segmental beams with hybrid tendons and dry joints. Constr. Build. Mater. 2016, 110, 1–7. [Google Scholar] [CrossRef]
- Yang, X.; Zohrevand, P.; Mirmiran, A.; Arockiasamy, M.; Potter, W. Effect of Elastic Modulus of Carbon Fiber-Reinforced Polymer Strands on the Behavior of Posttensioned Segmental Bridges. J. Compos. Constr. 2016, 20, 04016030. [Google Scholar] [CrossRef]
- Le, T.D.; Pham, T.M.; Hao, H.; Haoc, Y. Flexural behaviour of precast segmental concrete beams internally prestressed with unbonded CFRP tendons under four-point loading. Eng. Struct. 2018, 168, 371–383. [Google Scholar] [CrossRef]
- Zhu, Y.; Zhang, Y.; Shi, J. Finite element analysis of flexural behavior of precast segmental UHPC beams with prestressed bolted hybrid joints. Eng. Struct. 2021, 238, 111492. [Google Scholar] [CrossRef]
- Le, T.D.; Pham, T.M.; Hao, H. Numerical study on the flexural performance of precast segmental concrete beams with unbonded internal steel tendons. Constr. Build. Mater. 2020, 248, 118362. [Google Scholar] [CrossRef]
- Tran, D.T.; Pham, T.M.; Hao, H.; Chen, W. Numerical Investigation of Flexural Behaviours of Precast Segmental Concrete Beams Internally Post-Tensioned with Unbonded FRP Tendons under Monotonic Loading. Eng. Struct. 2021, 249, 113341. [Google Scholar] [CrossRef]
- Yan, W.-T.; Han, B.; Xie, H.-B.; Li, P.-F.; Zhu, L. Research on Numerical Model for Flexural Behaviors Analysis of Precast Concrete Segmental Box Girders. Eng. Struct. 2020, 219, 110733. [Google Scholar] [CrossRef]
- Yan, W.; Chen, L.; Han, B.; Xie, H.; Sun, Y. Numerical Model for Flexural Analysis of Precast Segmental Concrete Beam with Internal Unbonded CFRP Tendons. Materials 2022, 15, 4105. [Google Scholar] [CrossRef]
- Yan, W.-T.; Chen, L.-J.; Han, B.; Wei, F.; Xie, H.-B.; Yu, J.-P. Proposals for Flexural Capacity Prediction Method of Externally Prestressed Concrete Beam. Struct. Eng. Mech. 2022, 83, 363–375. [Google Scholar]
- Yan, W.; Jiang, F.; Chen, L.; Sun, Y. Proposals for Flexural Capacity Prediction of Precast Segmental Concrete Beam Prestressed with Internal Un-Bonded CFRP Tendons. Appl. Sci. 2023, 13, 6652. [Google Scholar] [CrossRef]
- Zhou, X.; Mickleborough, N.; Li, Z. Shear Strength of Joints in Precast Concrete Segmental Bridges. ACI Struct. J. 2005, 105, 3–11. [Google Scholar]
- Turmo, J.; Ramos, G.; Aparicio, A.C. Shear Strength of Dry Joints of Concrete Panels with and without Steel Fibres: Application to Precast Segmental Bridges. Eng. Struct. 2006, 28, 23–33. [Google Scholar] [CrossRef]
- Jiang, H.; Chen, L.; Ma, Z.J.; Feng, W. Shear Behavior of Dry Joints with Castellated Keys in Precast Concrete Segmental Bridges. J. Bridge Eng. 2015, 20, 04014062. [Google Scholar] [CrossRef]
- Jiang, H.; Wei, R.; Ma, Z.J.; Li, Y.; Jing, Y. Shear Strength of Steel Fiber-Reinforced Concrete Dry Joints in Precast Segmental Bridges. J. Bridge Eng. 2016, 21, 04016085. [Google Scholar] [CrossRef]
- Jiang, H.; Huang, C.; Feng, J.; Gao, X.; Wang, T.; Zhong, Z. Direct Shear Behavior of Castellated Dry RPC Joints in Precast Concrete Segmental Bridges. Structures 2021, 33, 4579–4595. [Google Scholar] [CrossRef]
- AASHTO. AASHTO LRFD Bridge Design Specifications; American Association of State Highway and Transportation Officials: Washington, DC, USA, 2017. [Google Scholar]
- Ahmed, G.H.; Aziz, O.Q. Influence of Intensity & Eccentricity of Posttensioning Force and Concrete Strength on Shear Behavior of Epoxied Joints in Segmental Box Girder Bridges. Constr. Build. Mater. 2019, 197, 117–129. [Google Scholar] [CrossRef]
- Ahmed, G.H.; Aziz, O.Q. Shear Behavior of Dry and Epoxied Joints in Precast Concrete Segmental Box Girder Bridges under Direct Shear Loading. Eng. Struct. 2019, 182, 89–100. [Google Scholar] [CrossRef]
- Pan, R.; Cheng, L.; He, W.; Zhou, X.; Shen, X. Direct Shear Performance of UHPC Multi-Keyed Epoxy Joint. Structures 2022, 44, 1898–1909. [Google Scholar] [CrossRef]
- Pan, R.; He, W.; Cheng, L.; Li, C. Direct Shear Strength of UHPC Large-Keyed Epoxy Joint: Theoretical Model and Experimental Verification. J. Bridge Eng. 2022, 27, 04022083. [Google Scholar] [CrossRef]
- Al-Rousan, R.Z.; Qudaisat, M.S. Single Keyed Joints Behaviour and Capacity Formulation under Direct Shear using Non-Linear Finite-Element Analysis. Structures 2023, 47, 911–924. [Google Scholar] [CrossRef]
- Zou, Y.; Xu, D.; Duanmu, X. Tests and calculation methods for the shear performance of steel shear keyed joint segment beams. Arch. Civ. Mech. Eng. 2024, 24, 128. [Google Scholar] [CrossRef]
- Turmo, J.; Ramos, G.; Aparicio, A.C. Shear Behavior of Unbonded Post-Tensioned Segmental Beams with Dry Joints. ACI Struct. J. 2006, 103, 409–417. [Google Scholar] [CrossRef]
- Li, G.; Yang, D.; Lei, Y. Combined Shear and Bending Behavior of Joints in Precast Concrete Segmental Beams with External Tendons. J. Bridge Eng. 2013, 18, 1042–1052. [Google Scholar] [CrossRef]
- Yuan, A.; He, Y.; Dai, H.; Cheng, L. Experimental Study of Precast Segmental Bridge Box Girders with External Unbonded and Internal Bonded Posttensioning under Monotonic Vertical Loading. J. Bridge Eng. 2015, 20, 04014075. [Google Scholar] [CrossRef]
- Jiang, H.; Li, Y.; Liu, A.; Ma, Z.J.; Chen, L.; Chen, Y. Shear Behavior of Precast Concrete Segmental Beams with External Tendons. J. Bridge Eng. 2018, 23, 04018049. [Google Scholar] [CrossRef]
- Jiang, H.; Li, Y.; Liu, A.; Chen, L.; Chen, Y.; Xiao, J. Experimental Study on Shear Behavior of Precast Concrete Segmental Beams with Hybrid Tendons and Dry Joints. KSCE J. Civ. Eng. 2019, 23, 4354–4367. [Google Scholar] [CrossRef]
- Hu, Z.; Xu, Z.; Zhang, S.; Jiang, H.; Chen, Y.; Xiao, J. Experimental Study on Shear Behavior of Precast High-Strength Concrete Segmental Beams with External Tendons and Dry Joints. Buildings 2022, 12, 134. [Google Scholar] [CrossRef]
- Jiang, H.; Hu, Z.; Cao, Z.; Gao, X.; Tian, Y.; Sun, X. Experimental and Numerical Study on Shear Performance of Externally Prestressed Precast UHPC Segmental Beams without Stirrups. Structures 2022, 46, 1134–1153. [Google Scholar] [CrossRef]
- Freyermuth, C.L. AASHTO-PCI-ASBI Segmental Box Girder Standards: A new Product for Grade Separations and Interchange Bridges. PCI J. 1997, 42, 32–42. [Google Scholar] [CrossRef]
- DB/T 50081-2002; Standard for Test Method of Mechanical Properties on Ordinary Concrete. Standards Press of China: Beijing, China, 2002.
- GB/T 228.1-2010; Metallic Materials-Tensile Testing-Part 1: Method of Test at Room Temperature. Standards Press of China: Beijing, China, 2010.
- GB/T 21839-2008; Steel for Prestressed Concrete-Test Methods. Standards Press of China: Beijing, China, 2008.
- GB/T 50152-2012; Standard for Test Method of Concrete Structures. China Building Industry Press: Beijing, China, 2012.
- He, Z.; Liu, Z.; Zhang, Y. A Method Based on Truss-Arch Model for Calculating the Shear Strength of Externally Prestressed Concrete Beams. China Civ. Eng. J. 2010, 43, 56–63. (In Chinese) [Google Scholar]
- Qi, J.-N.; Wang, J.-Q.; Ma, Z.J.; Tong, T. Shear Behavior of Externally Prestressed Concrete Beams with Draped Tendons. ACI Struct. J. 2016, 113, 677–688. [Google Scholar] [CrossRef]
- Vecchio, F.J.; Collins, M.P. The Modified Compression-Field Theory for Reinforced Concrete Elements Subjected to Shear. ACI J. 1986, 83, 219–231. [Google Scholar]
- Maekawa, K.; Pimanmas, A.; Okamura, H. Non-Linear Mechanics of Reinforced Concrete; Spon Press: London, UK, 2003. [Google Scholar]


| ID | Prestressed Tendons | b (mm) | a (mm) | Shear Span Ratio a/h | Effective Prestress (MPa) | ||
|---|---|---|---|---|---|---|---|
| Internal | External | Internal | External | ||||
| M | 1 | 2 | — | 600 | 1.5 | 641.1 | 631.1 |
| S-1 | 1 | 2 | 420 | 600 | 1.5 | 618.9 | 675.9 |
| S-2 | 1 | 2 | 550 | 600 | 1.5 | 602.6 | 608.3 |
| S-3 | 1 | 2 | 420 | 800 | 2.0 | 678.9 | 659.4 |
| S-4 | 1 | 2 | 620 | 800 | 2.0 | 663.7 | 669.4 |
| S-5 | 0 | 4 | 420 | 600 | 1.5 | — | 351.8 (Straight) 654.9 (Draped) |
| Cement (kg/m3) | Water (kg/m3) | Sand (kg/m3) | Coarse Aggregate (kg/m3) | Sand Percentage | Fly Ash (kg/m3) |
|---|---|---|---|---|---|
| 326 | 163 | 713 | 1025 | 41% | 86 |
| Batch | fcu (MPa) | fc (MPa) | ftr (MPa) | Ec (MPa) |
|---|---|---|---|---|
| Left segment | 52.0 | 42.7 | 3.63 | 32,600 |
| Right segment | 48.5 | 41.4 | 3.58 | 32,500 |
| Bar Size | Diameter (mm) | Area (mm2) | Yield Strength fy (MPa) | Ultimate Strength fu (MPa) | Elastic Modulus Es (GPa) |
|---|---|---|---|---|---|
| A6 | 6.0 | 28.3 | 356.2 | 636.6 | 206 |
| C10 | 10.0 | 78.5 | 435.5 | 674.8 | 208 |
| C20 | 20.0 | 314.2 | 450.6 | 587.8 | 208 |
| As15.2 | 15.2 | 139.0 | 1754.6 | 1955.4 | 195 |
| ID | Cracking Load (kN) | Ultimate Load (kN) | Tendon Stress Increment (MPa) | Calculated Flexural Strength P (kN) | Maximum Deflection (mm) | Failure Mode | |
|---|---|---|---|---|---|---|---|
| Internal | External | ||||||
| M | 360 | 696.1 | 487.8 | 430.7 | 1112.6 | 11.79 | DC |
| S-1 | 350 | 666.7 | 787.1 | 643.5 | 895.1 | 14.94 | SC |
| S-2 | 310 | 643.2 | 890.6 | 730.5 | 725.6 | 19.11 | SC |
| S-3 | 340 | 522.6 | 627.8 | 544.0 | 897.2 | 19.88 | SC |
| S-4 | 240 | 457.1 | 905.5 | 675.8 | 665.2 | 15.34 | SC |
| S-5 | 400 | 546.3 | - | 323.4 (S) 298.1 (D) | 942.3 | 10.83 | SC |
Disclaimer/Publisher’s Note: The statements, opinions and data contained in all publications are solely those of the individual author(s) and contributor(s) and not of MDPI and/or the editor(s). MDPI and/or the editor(s) disclaim responsibility for any injury to people or property resulting from any ideas, methods, instructions or products referred to in the content. |
© 2025 by the authors. Licensee MDPI, Basel, Switzerland. This article is an open access article distributed under the terms and conditions of the Creative Commons Attribution (CC BY) license (https://creativecommons.org/licenses/by/4.0/).
Share and Cite
Yan, W.-T.; Yuan, L.; Su, Y.-H.; Song, Z.-W. Shear Mechanism of Precast Segmental Concrete Beam Prestressed with Unbonded Tendons. Buildings 2025, 15, 2668. https://doi.org/10.3390/buildings15152668
Yan W-T, Yuan L, Su Y-H, Song Z-W. Shear Mechanism of Precast Segmental Concrete Beam Prestressed with Unbonded Tendons. Buildings. 2025; 15(15):2668. https://doi.org/10.3390/buildings15152668
Chicago/Turabian StyleYan, Wu-Tong, Lei Yuan, Yong-Hua Su, and Zi-Wei Song. 2025. "Shear Mechanism of Precast Segmental Concrete Beam Prestressed with Unbonded Tendons" Buildings 15, no. 15: 2668. https://doi.org/10.3390/buildings15152668
APA StyleYan, W.-T., Yuan, L., Su, Y.-H., & Song, Z.-W. (2025). Shear Mechanism of Precast Segmental Concrete Beam Prestressed with Unbonded Tendons. Buildings, 15(15), 2668. https://doi.org/10.3390/buildings15152668