Article

Experimental Investigation of the Seismic Behavior of a Multi-Story Steel Modular Building Using Shaking Table Tests

1
Shenzhen International Graduate School, Tsinghua University, Shenzhen 518055, China
2
China Construction Science and Industry Corporation Ltd., Shenzhen 518118, China
3
Guangzhou Insitute of Building Science Co., Ltd., Guangzhou 510440, China
*
Authors to whom correspondence should be addressed.
These authors contributed equally to this work.
Buildings 2025, 15(15), 2661; https://doi.org/10.3390/buildings15152661
Submission received: 6 July 2025 / Revised: 23 July 2025 / Accepted: 25 July 2025 / Published: 28 July 2025

Abstract

A steel modular building is a highly prefabricated form of steel construction. It offers rapid assembly, a high degree of industrialization, and an environmentally friendly construction site. To promote the application of multi-story steel modular buildings in earthquake fortification zones, it is imperative to conduct in-depth research on their seismic behavior. In this study, a seven-story modular steel building is investigated using shaking table tests. Three seismic waves (artificial ground motion, Tohoku wave, and Tianjin wave) are selected and scaled to four intensity levels (PGA = 0.035 g, 0.1 g, 0.22 g, 0.31 g). It is found that no residual deformation of the structure is observed after tests, and its stiffness degradation ratio is 7.65%. The largest strains observed during the tests are 540 × 10−6 in beams, 1538 × 10−6 in columns, and 669 × 10−6 in joint regions, all remaining below a threshold value of 1690 × 10−6. Amplitudes and frequency characteristics of the acceleration responses are significantly affected by the characteristics of the seismic waves. However, the acceleration responses at higher floors are predominantly governed by the structure’s low-order modes (first-mode and second-mode), with the corresponding spectra containing only a single peak. When the predominant frequency of the input ground motion is close to the fundamental natural frequency of the modular steel structure, the acceleration responses will be significantly amplified. Overall, the structure demonstrates favorable seismic resistance.

1. Introduction

Initiated by the policies of a number of governments and the growing interest in global environmental protection, prefabricated steel structures have experienced rapid development [1]. The use of prefabricated steel structures in public infrastructure projects such as schools and hospitals has become increasingly common in China. As a highly prefabricated form of steel construction, modular steel buildings have played an irreplaceable role in various applications, including emergency medical facilities, temporary disaster relief shelters, and residential buildings. Their rapid construction speed, high degree of prefabrication, and environmentally friendly construction sites have significantly contributed to the advancement of the construction industry [2].
The unique stacked-box system and multi-column multi-beam configurations inherent in modular steel buildings result in complex connection details, leading to seismic behaviors that differ significantly from those of conventional steel structures [3]. Under seismic excitations, these structural features may cause potential damage. In earthquake fortification zones, earthquakes have become the primary factor contributing to failure in modular steel buildings. As modular steel buildings expand from low-rise to multi-story applications, their seismic performance has emerged as a critical factor influencing both structural safety and economic viability. Given that current research and engineering practice on multi-story modular steel buildings remains at the development stage, there is limited experience and research available for reference. The seismic performance of modular steel buildings has become a key factor restricting their application in high-rise buildings. Meanwhile, the lack of understanding of the transfer paths between adjacent modules makes it difficult to quantify the design safety redundancy. This often results in substantially increased construction costs for modular steel buildings.
Kirkayak et al. [4,5] conducted shaking table tests on two-story and seven-story containerized stacked systems. Their study demonstrated that reducing the connection gaps, incorporating damping devices, and optimizing the load distribution helped to effectively mitigate the dynamic response of the structure. Srisangeerthanan et al. [6] focused on the influence of floor systems on the seismic performance of modular steel structures. Using numerical simulation, they investigated the effects of floor stiffness and boundary conditions through an improved equivalent static analysis method. The results indicated that increased floor flexibility led to larger inter-story drift angles due to greater participation of higher-order modes, highlighting the need for the careful selection of modification factors in current design codes. Wang and Pan [7], using a 40-story modular building project in Hong Kong as a case study, introduced a novel hybrid wall connection system. Finite element analyses were conducted to compare the structural performance under different wall configurations. The results showed no substantial damage under strong ground motion, confirming excellent seismic performance that met the design code requirements. Shi et al. [8] investigated a 20-story high-rise modular steel structure by developing five distinct layout models based on different module arrangement strategies. Both response spectrum and nonlinear time history analyses were performed. Their findings indicated that the layout variations had a small impact on the first three natural periods. However, symmetric layouts facilitated favorable overall stiffness and mass distribution, while staggered layouts effectively alleviated stiffness irregularities along the primary axis and enhanced both the seismic performance and bidirectional deformation compatibility. Sanches et al. [9] conducted numerical simulations to evaluate the seismic design and response characteristics of 6-story, 12-story, and 32-story modular buildings. Static pushover analysis revealed that directly applying the Canadian building design code for seismic design may lead to unsafe results, as it overestimated the ductility capacity of modular buildings. Further comparison of failure modes across different building heights showed that high-rise structures predominantly exhibited column base failures with potential collapse risk, whereas mid- and low-rise buildings mainly experienced brace failures characterized by localized damage.
For the seismic behavior of modular buildings, experimental studies have primarily focused on low-rise structures. Multi-story structures have relied on numerical simulations but have lacked experimental studies. This study therefore conducts an experimental investigation on a multi-story modular building. It provides valuable engineering insights for practical application. Current design codes will also benefit from these tests.
In this study, a 1:9 scaled test model is fabricated based on similarity laws. Three seismic waves (artificial ground motion, Tohoku wave, and Tianjin wave) are selected and scaled to four intensity levels (PGA = 0.035 g, 0.1 g, 0.22 g, 0.31 g). A comprehensive investigation of structural responses under varying levels of seismic intensity is carried out.

2. Experimental Design and Preparation

2.1. Prototype Description

A seven-story modular steel building is the prototype structure. Its design complies with the relevant design codes and standards of China [10,11,12,13,14]. Each story consists of two modular units. The height of every story is 3.90 m, and the height of the total building is 27.30 m. The length in the longitudinal direction (Y-direction) is 8.65 m, while the length in the transverse direction (X-direction) is 7.22 m. The total mass of the prototype structure is 221 tons. A schematic diagram of the prototype design is shown in Figure 1. Beams and columns of modular units adopt box-shaped cross sections [10,13], fabricated from Q355B steel, its yield strength is 355 MPa, and the modulus of elasticity is 210 GPa. Their dimensions are listed in Table 1.
A numerical analysis model of the prototype structure is developed using the finite element software YJK 7.0. The calculated natural frequencies are summarized in Table 2. The first-mode shape corresponds to the longitudinal translational motion along the Y-direction. The second-mode shape is characterized by the transverse translational motion along the X-direction. The third-mode shape involves the torsional vibration around the Z-axis, resulting in noticeable rotational deformation of the floors. The fourth-mode corresponds to higher-order translational motion along the X-direction, with significant bending deformation observed in the mode shape. The fifth-mode represents higher-order translational motion along the Y-direction, also exhibiting pronounced bending deformation in the mode shape. The mode shape diagram is shown in Figure 2.

2.2. Similitude Relationship

To ensure that the scaled model structure could realistically simulate the seismic response of the prototype structure, a model is designed based on the elastic–gravity similarity law [15]. Considering the capacity of the shaking table and overall dimensions of the prototype structure, the geometric scale factor for the test model is set to 1/9 [16]. The material used for the physical model is the same as the prototype, i.e., Q355B. Similarity relationships for the key design parameters are presented in Table 3.

2.3. Design and Fabrication of the Physical Model

2.3.1. Structural Component Design

Directly scaling the structural components according to the geometric scale factor poses challenges in meeting similarity requirements in the thickness direction, leading to difficulties in accurately replicating the stress distribution and load-bearing behavior of the prototype structure. Therefore, in this study, the scaled components are designed based on stiffness equivalence principle for steel structures [17]. For the beam members, similarity in flexural stiffness is maintained, while for columns, both flexural and axial compressive stiffness similarities are ensured. Table 1 presents the dimensions of the scaled components and the corresponding prototype components, which are designed to satisfy the stiffness equivalence principle within an acceptable error range. In addition, 5 mm-thick Q355B steel plates are used in the test model to substitute the reinforced concrete floor slabs of the prototype structure [18].

2.3.2. Major Frame Design

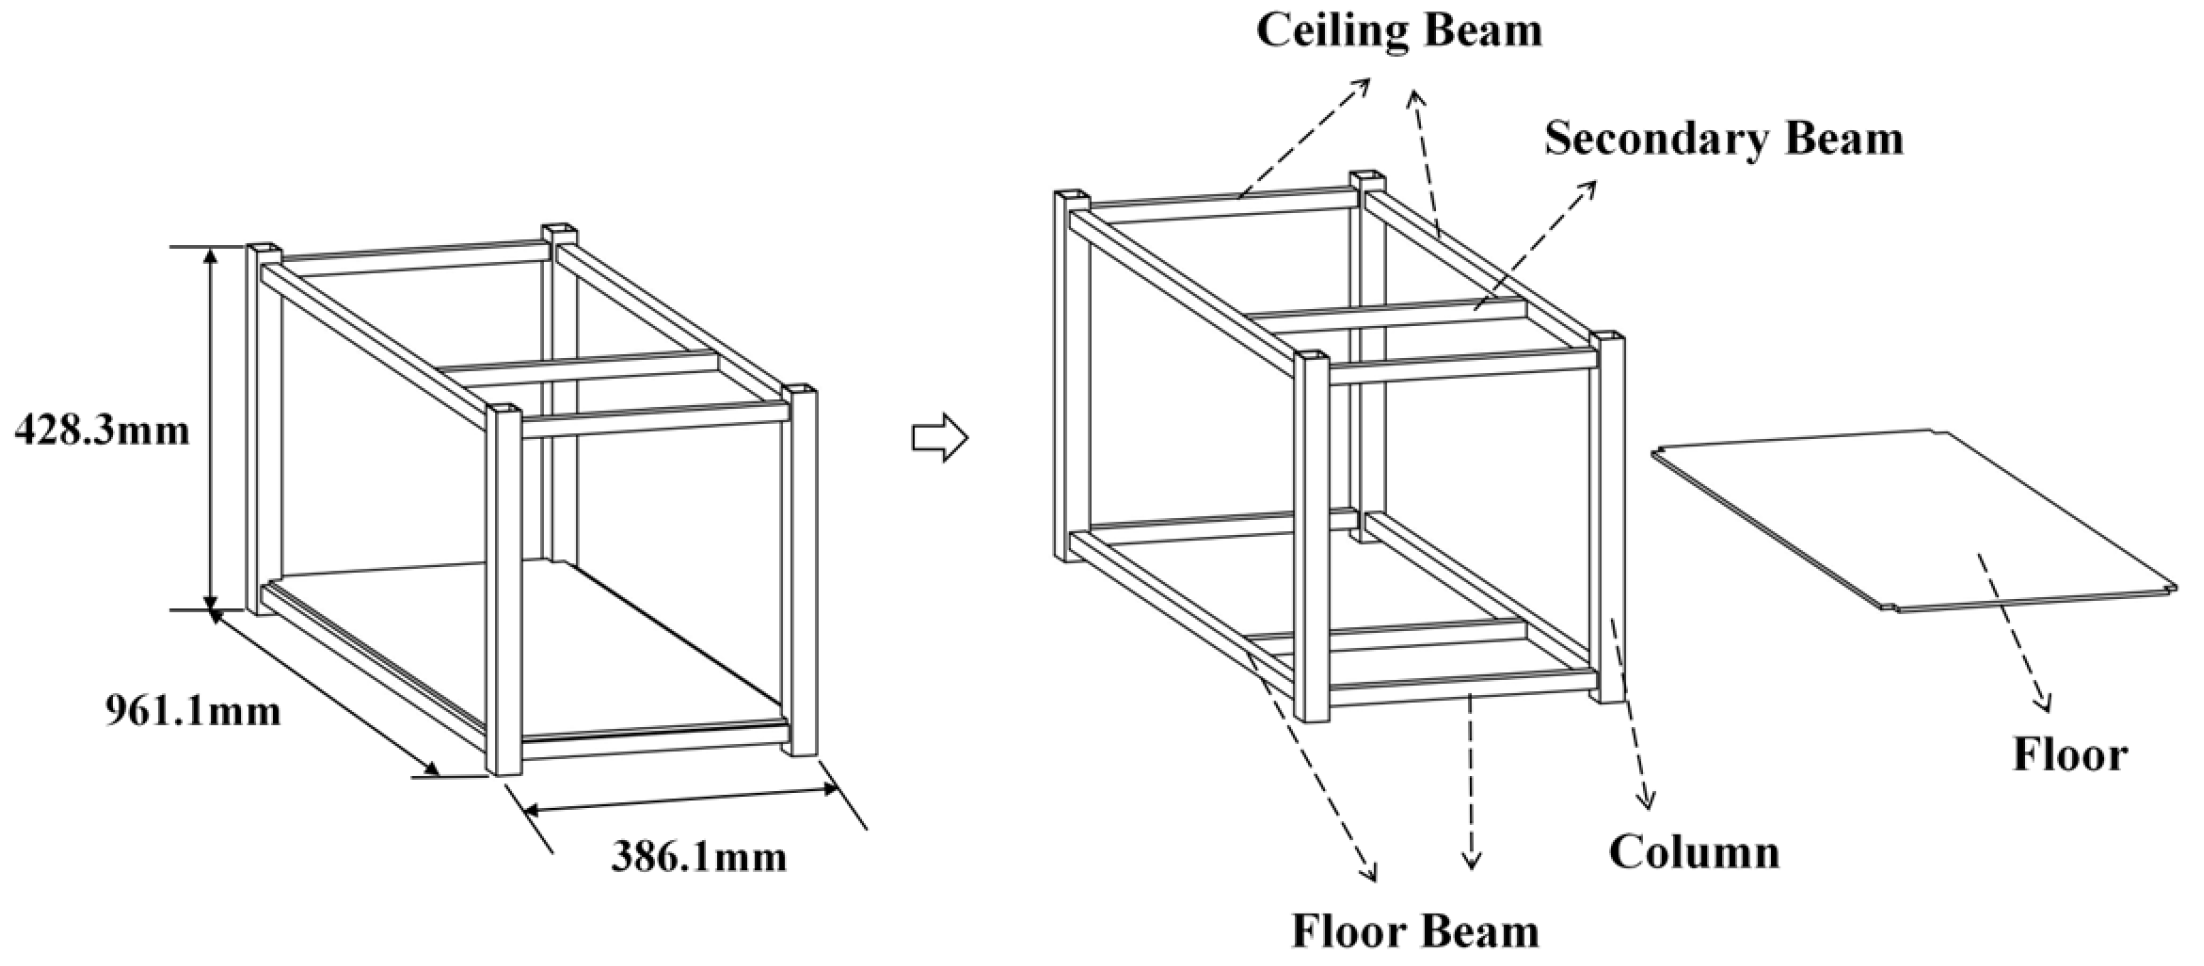
The total height of the physical model is 3033.1 mm. The lengths in the longitudinal and transverse directions (Y and X) are respectively 961.1 mm and 802.2 mm. A schematic diagram of the major structural frame is shown in Figure 1. Each modular unit has dimensions of 428.3 mm in height, 961.1 mm in length, and 386.1 mm in width. A unit is composed of columns, ceiling beams, floor beams, secondary beams, and floor slabs. A schematic diagram of the modular unit frame is provided in Figure 3.
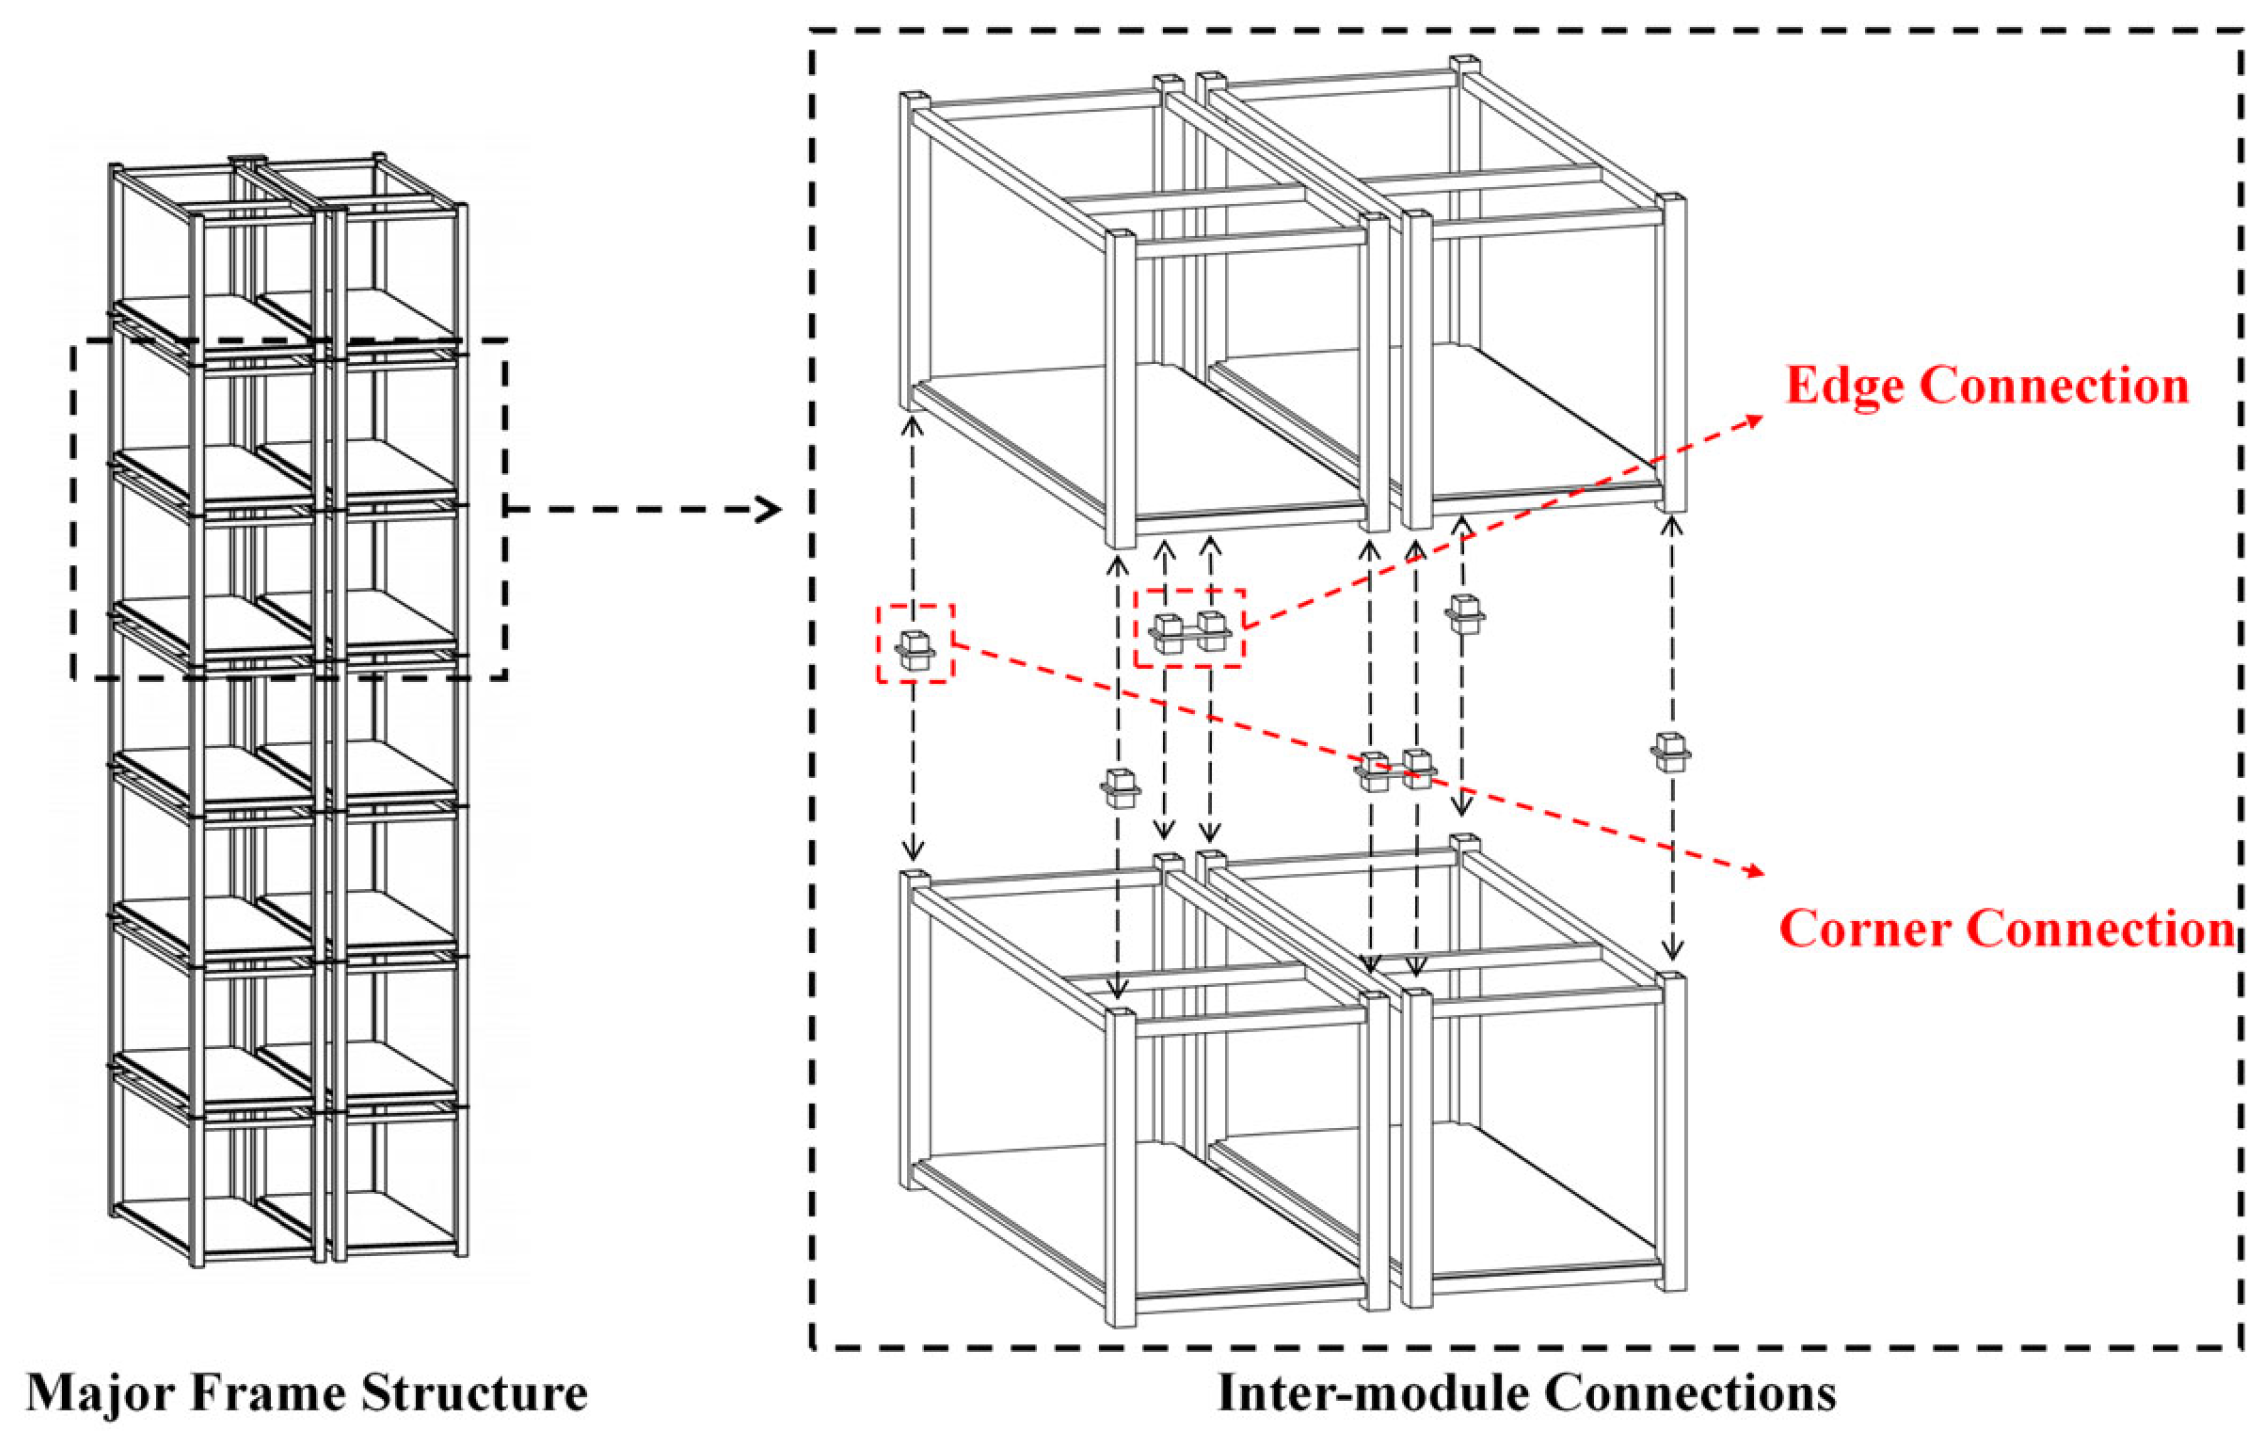
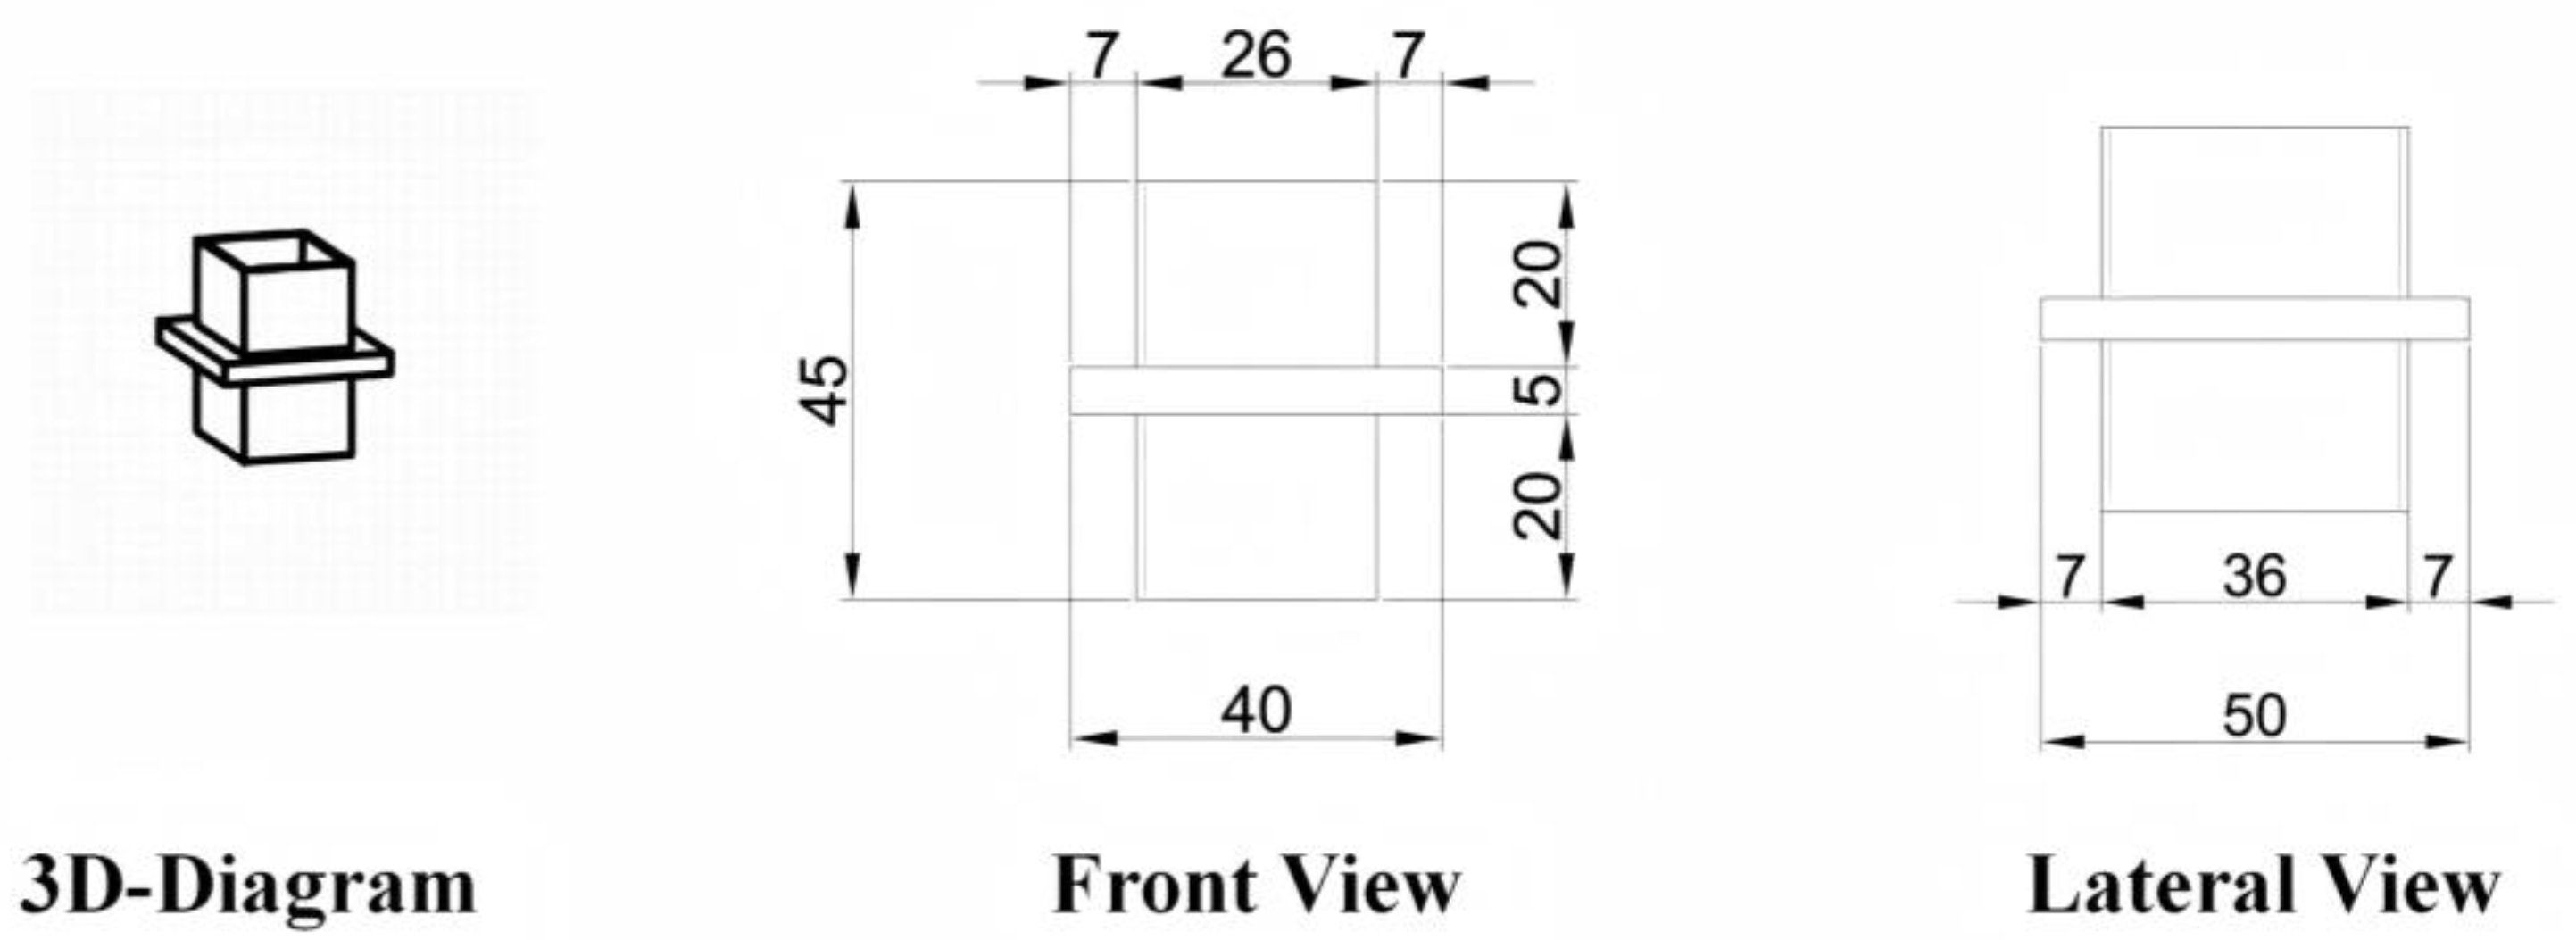
The connection details between modules are illustrated in Figure 4. The vertical connections between modular units are achieved through edge connection joints and corner connection joints, while the connections between two spans of the modular structure are realized via edge joints. At each interface between two adjacent floors, four corner connection joints are installed at corner positions, and two edge connection joints are placed at the midpoints of edges. Each connection joint consists of 2 or 4 solid square cast iron components and a joint plate through fine welding. The solid cast iron piece is designed to be inserted into the hollow end of columns. After insertion into the column ends, the connectors are welded to column ends to form rigid connection zones. The diagrams of connections are shown in Figure 5 and Figure 6. Their design is based on the drawings of joints from a true industrial building project in Shenzhen, China, constructed by China Construction Science and Industry Corporation Ltd. The joints in this true building are similarly constructed by inserting the rigid square into the column, then welded along the edges at column ends.
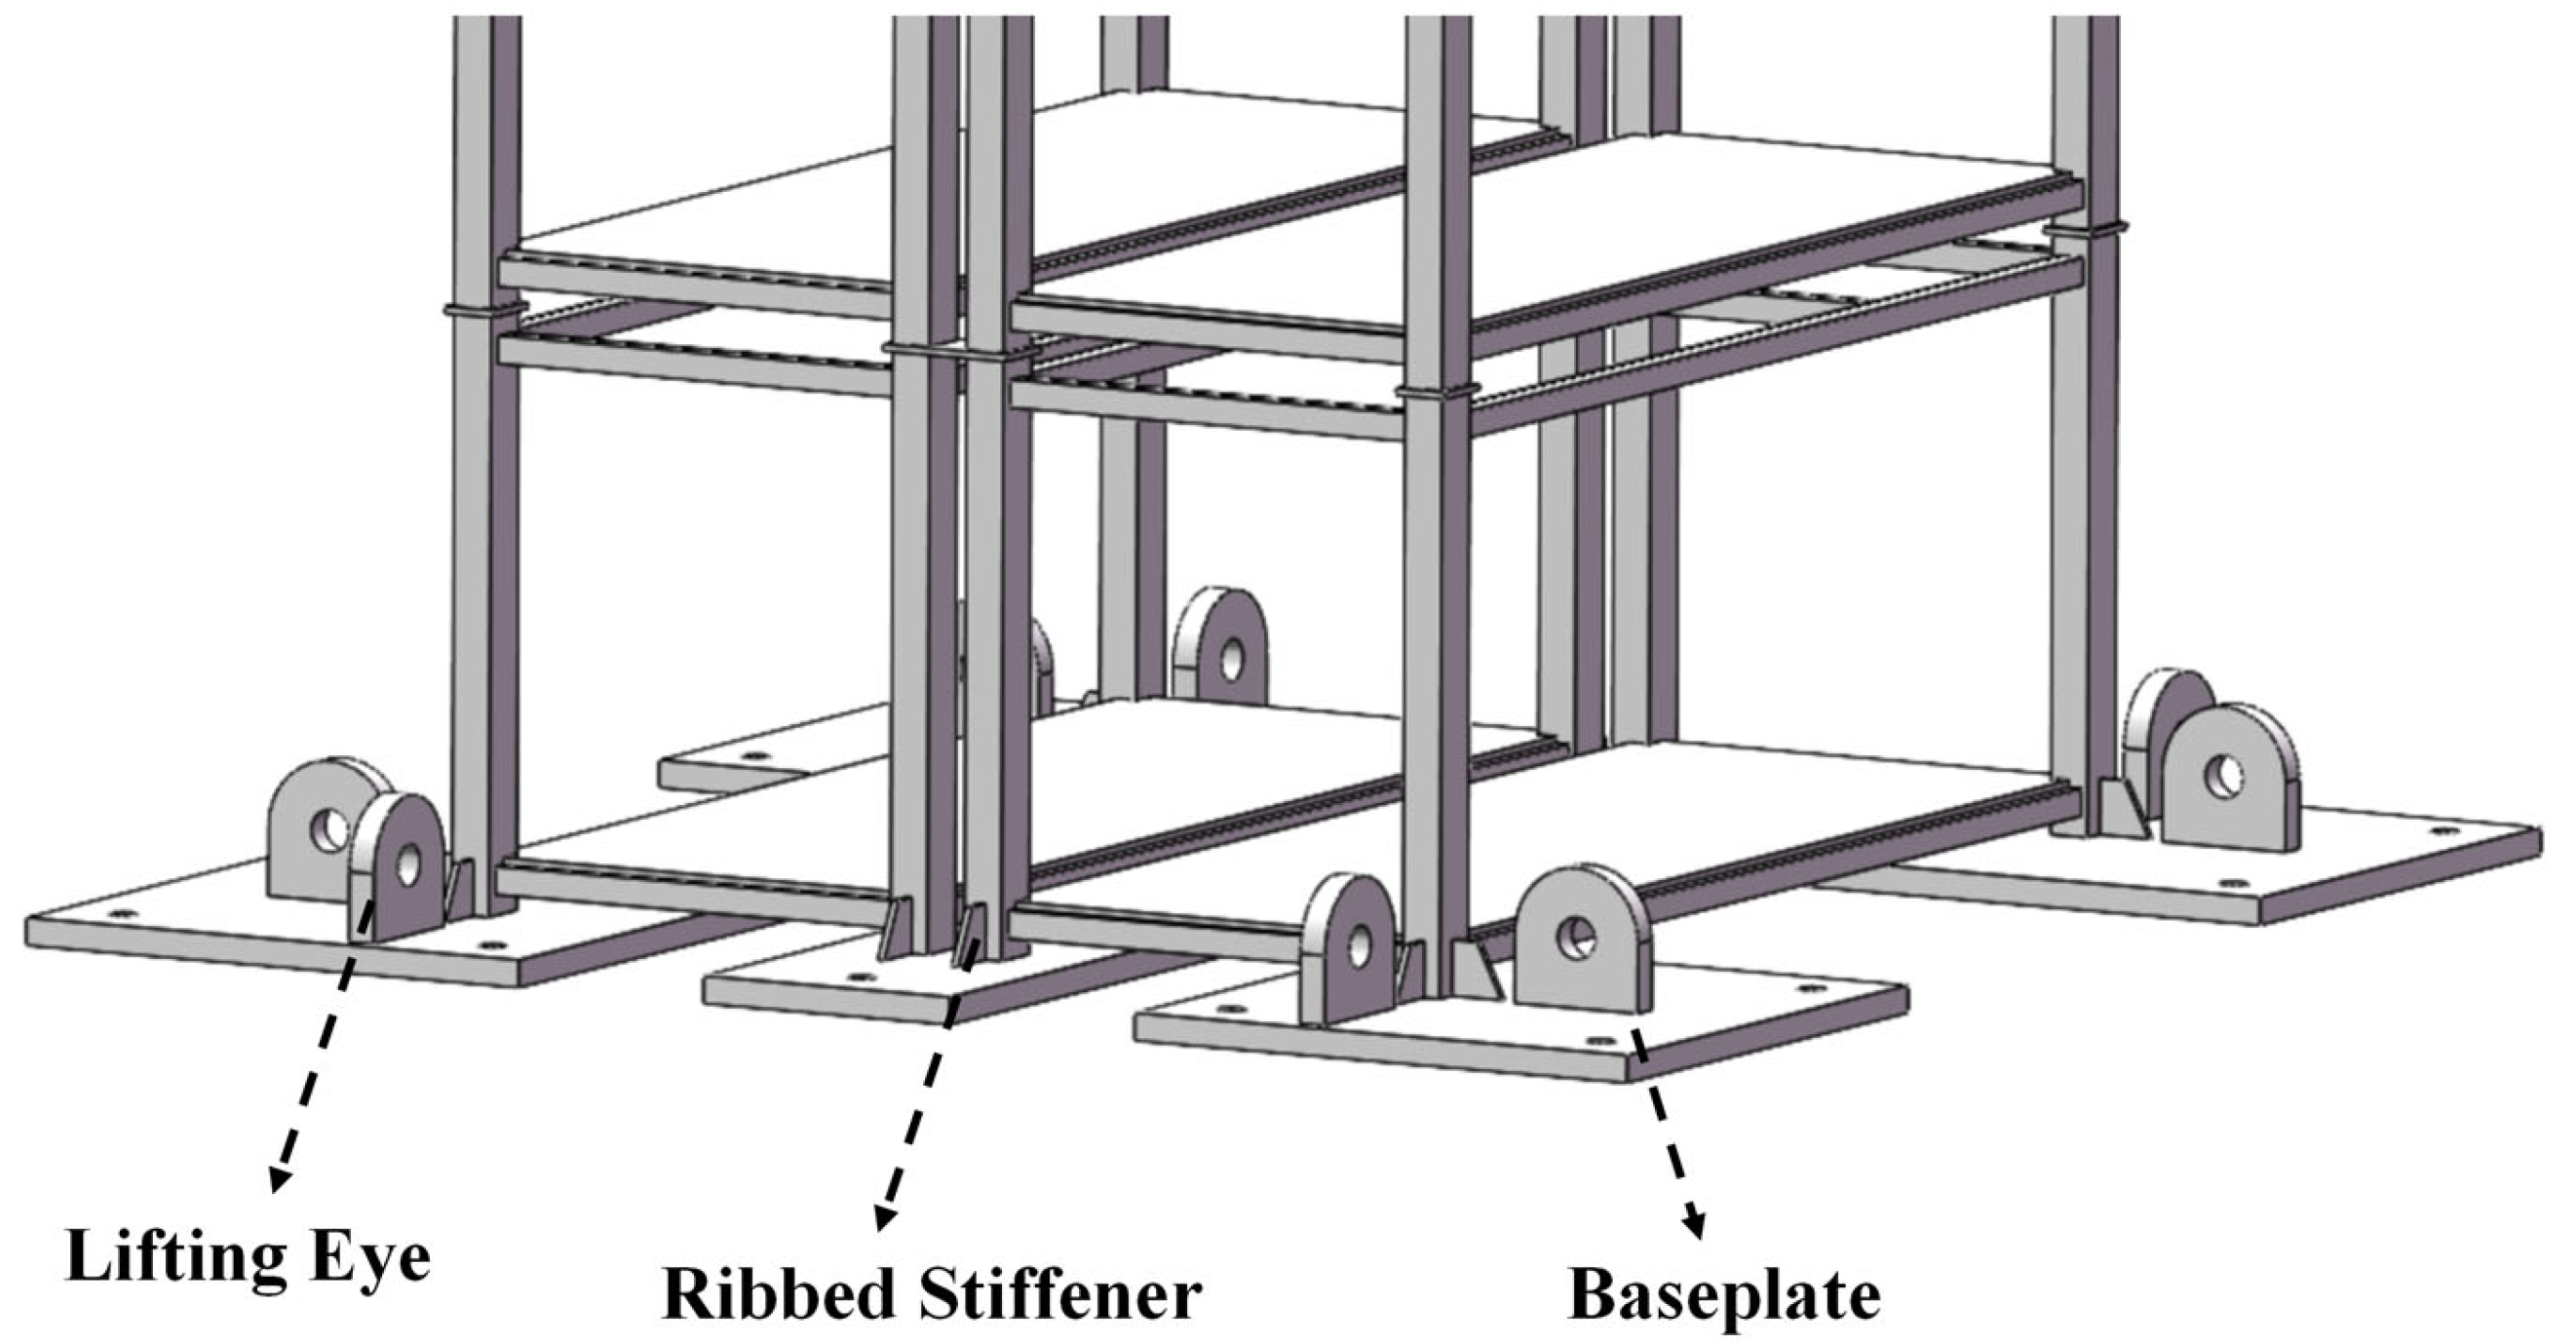
To facilitate the secure anchorage of the model frame to the shaking table, six perforated base plates are installed at the bottom of the model. These base plates are connected to the shaking table using high-strength bolts. To prevent brittle failure at column roots, ribbed stiffeners are employed. For ease of lifting and transportation, lifting eyes are welded onto the base plates, allowing connection with the slings of an overhead crane. The above structural details are illustrated in Figure 7.

2.3.3. Fabrication

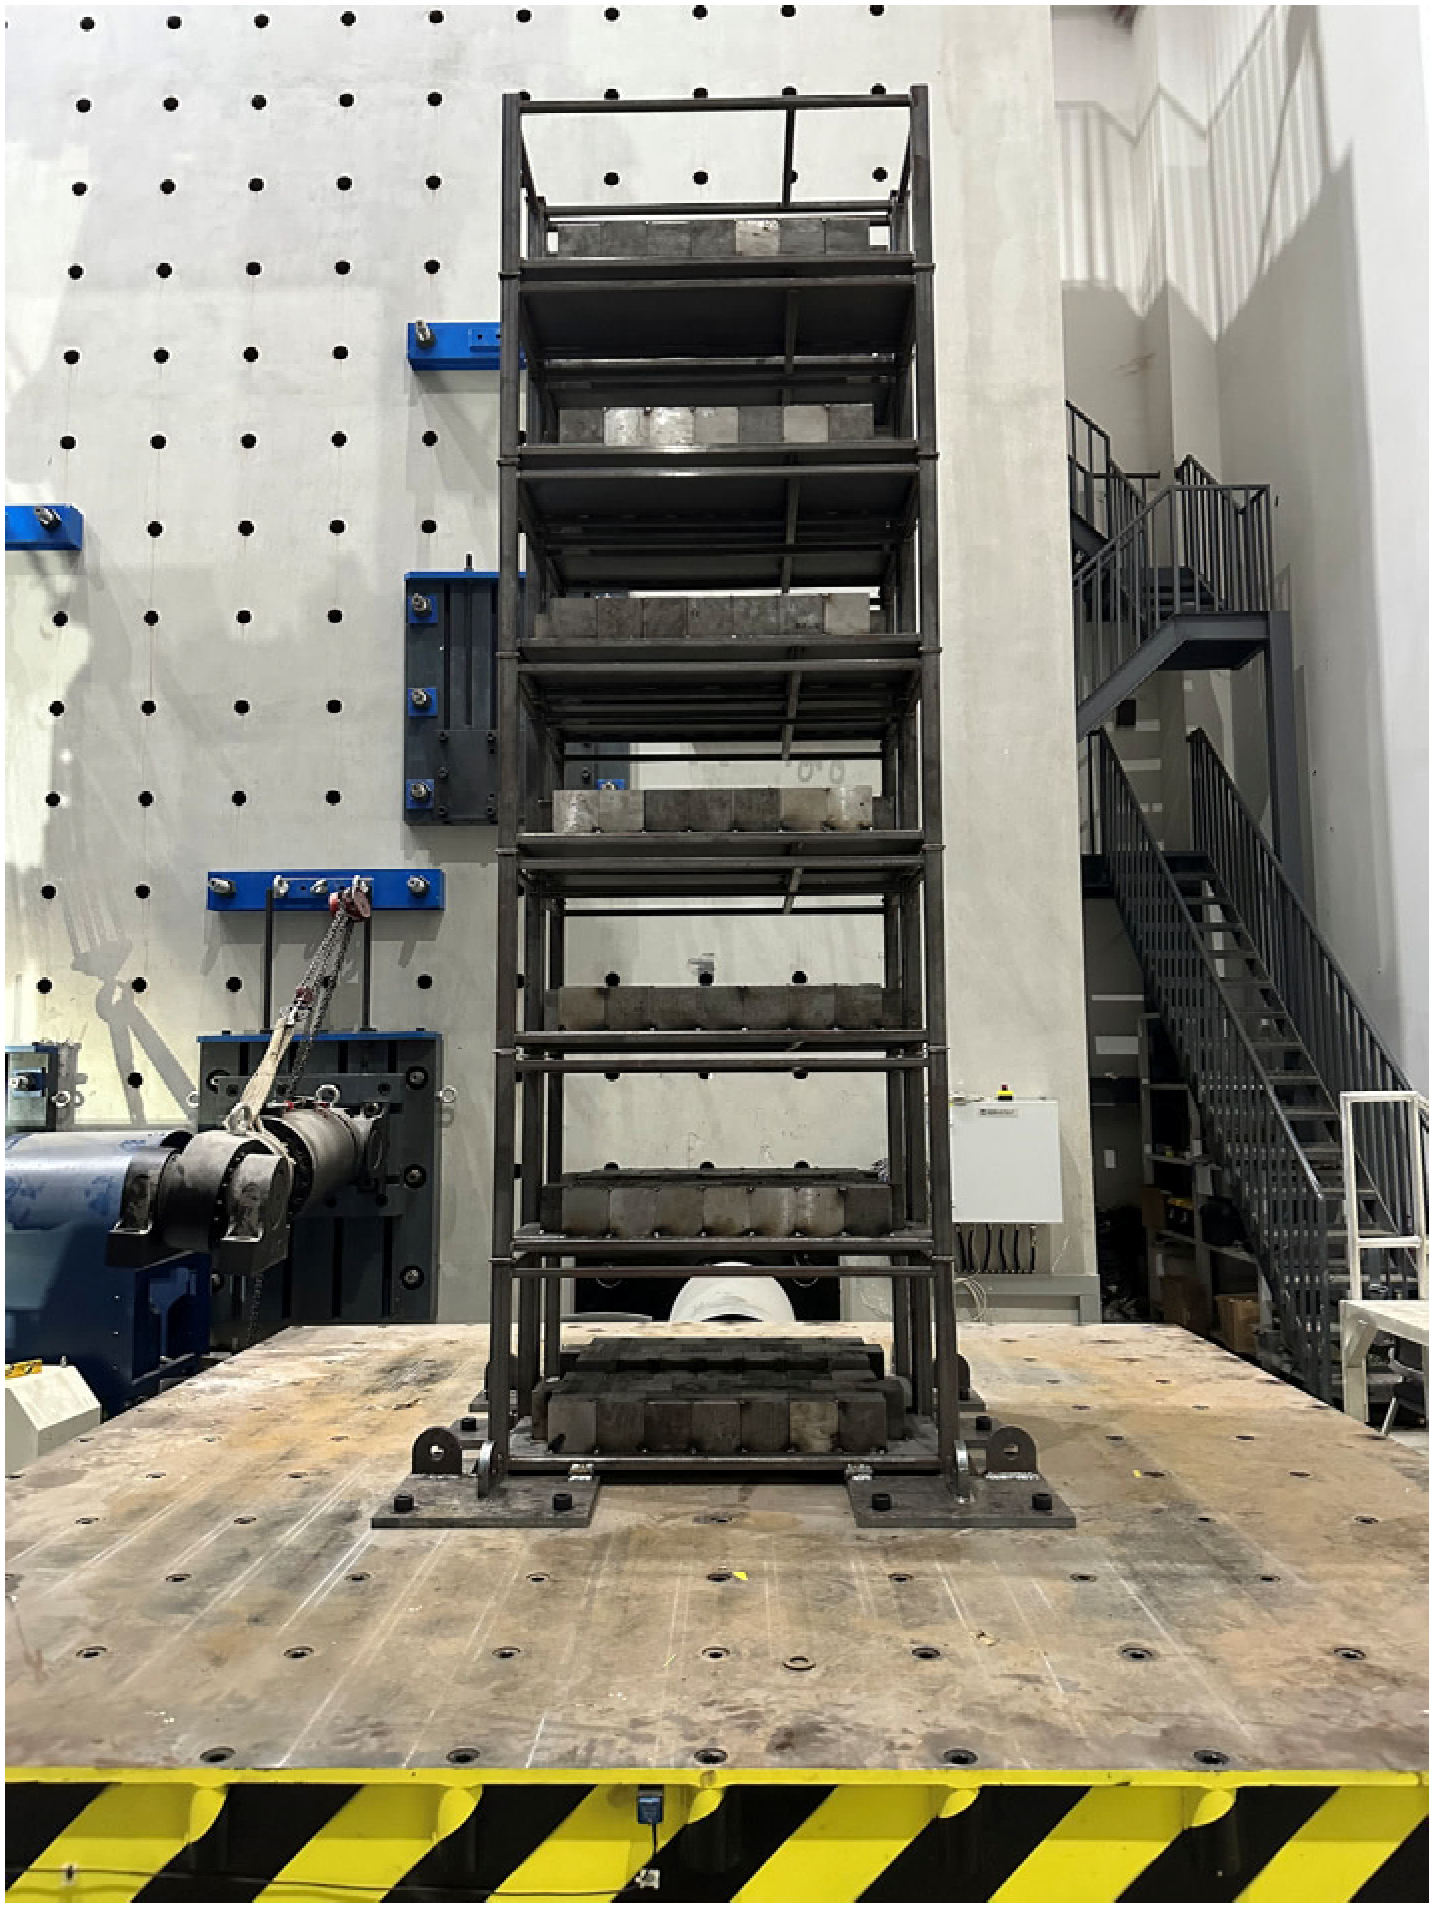
The unloaded structural model is prefabricated at a manufacturing facility and then transported to the laboratory. Additional artificial mass is required to achieve the target mass of the scaled model [19]. In this study, 308 steel cube blocks measuring 100 mm × 100 mm × 100 mm are used, each weighing 7.8 kg. A total of 44 blocks are uniformly welded on each floor level (Figure 8).

2.4. Measurement Scheme

2.4.1. Sensors

In this study, to capture the seismic response, accelerometers and strain gauges are employed. Their specifications are listed in Table 4 and Table 5.

2.4.2. Sensor Arrangement

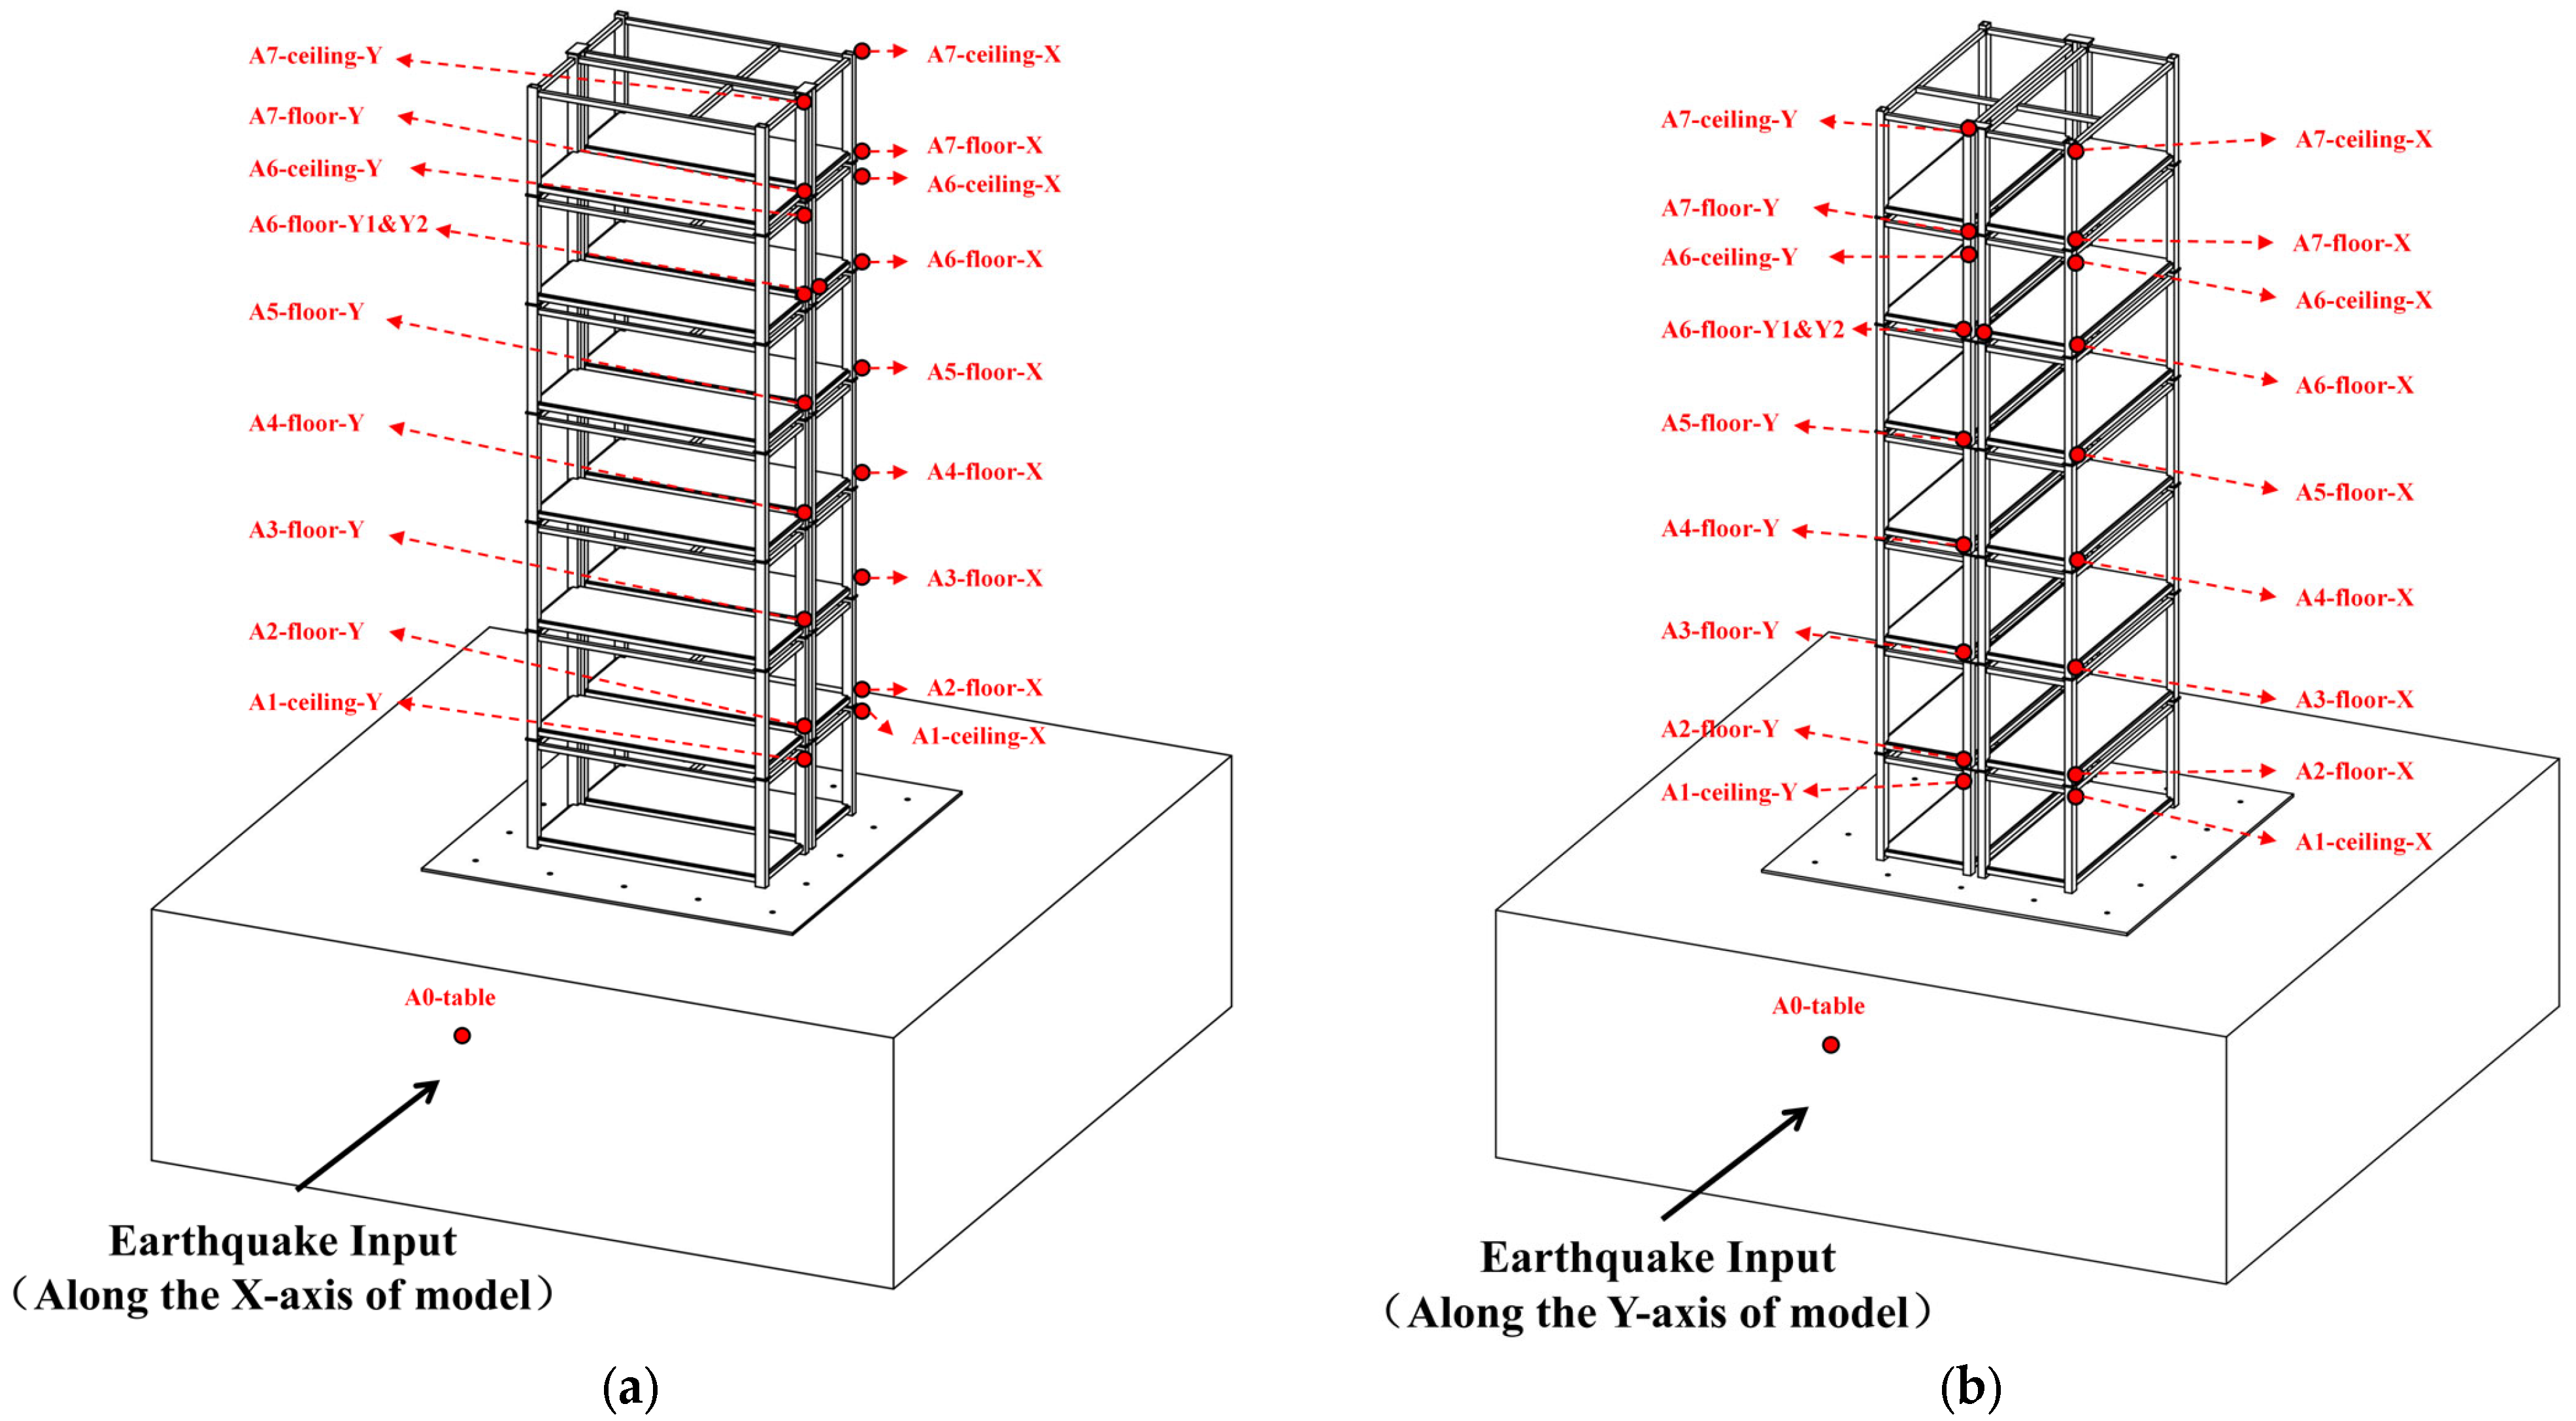
The arrangement of accelerometers is shown in Figure 9, where red solid dots indicate their exact locations. The accelerometers are labeled using the format “Ax-xxx-X/Y”. For example, A6-floor-X is the accelerometer for measuring acceleration in the X direction at the floor of the 6th story, while A6-ceiling-Y is for measuring acceleration in the Y direction at the ceiling of the 6th story.
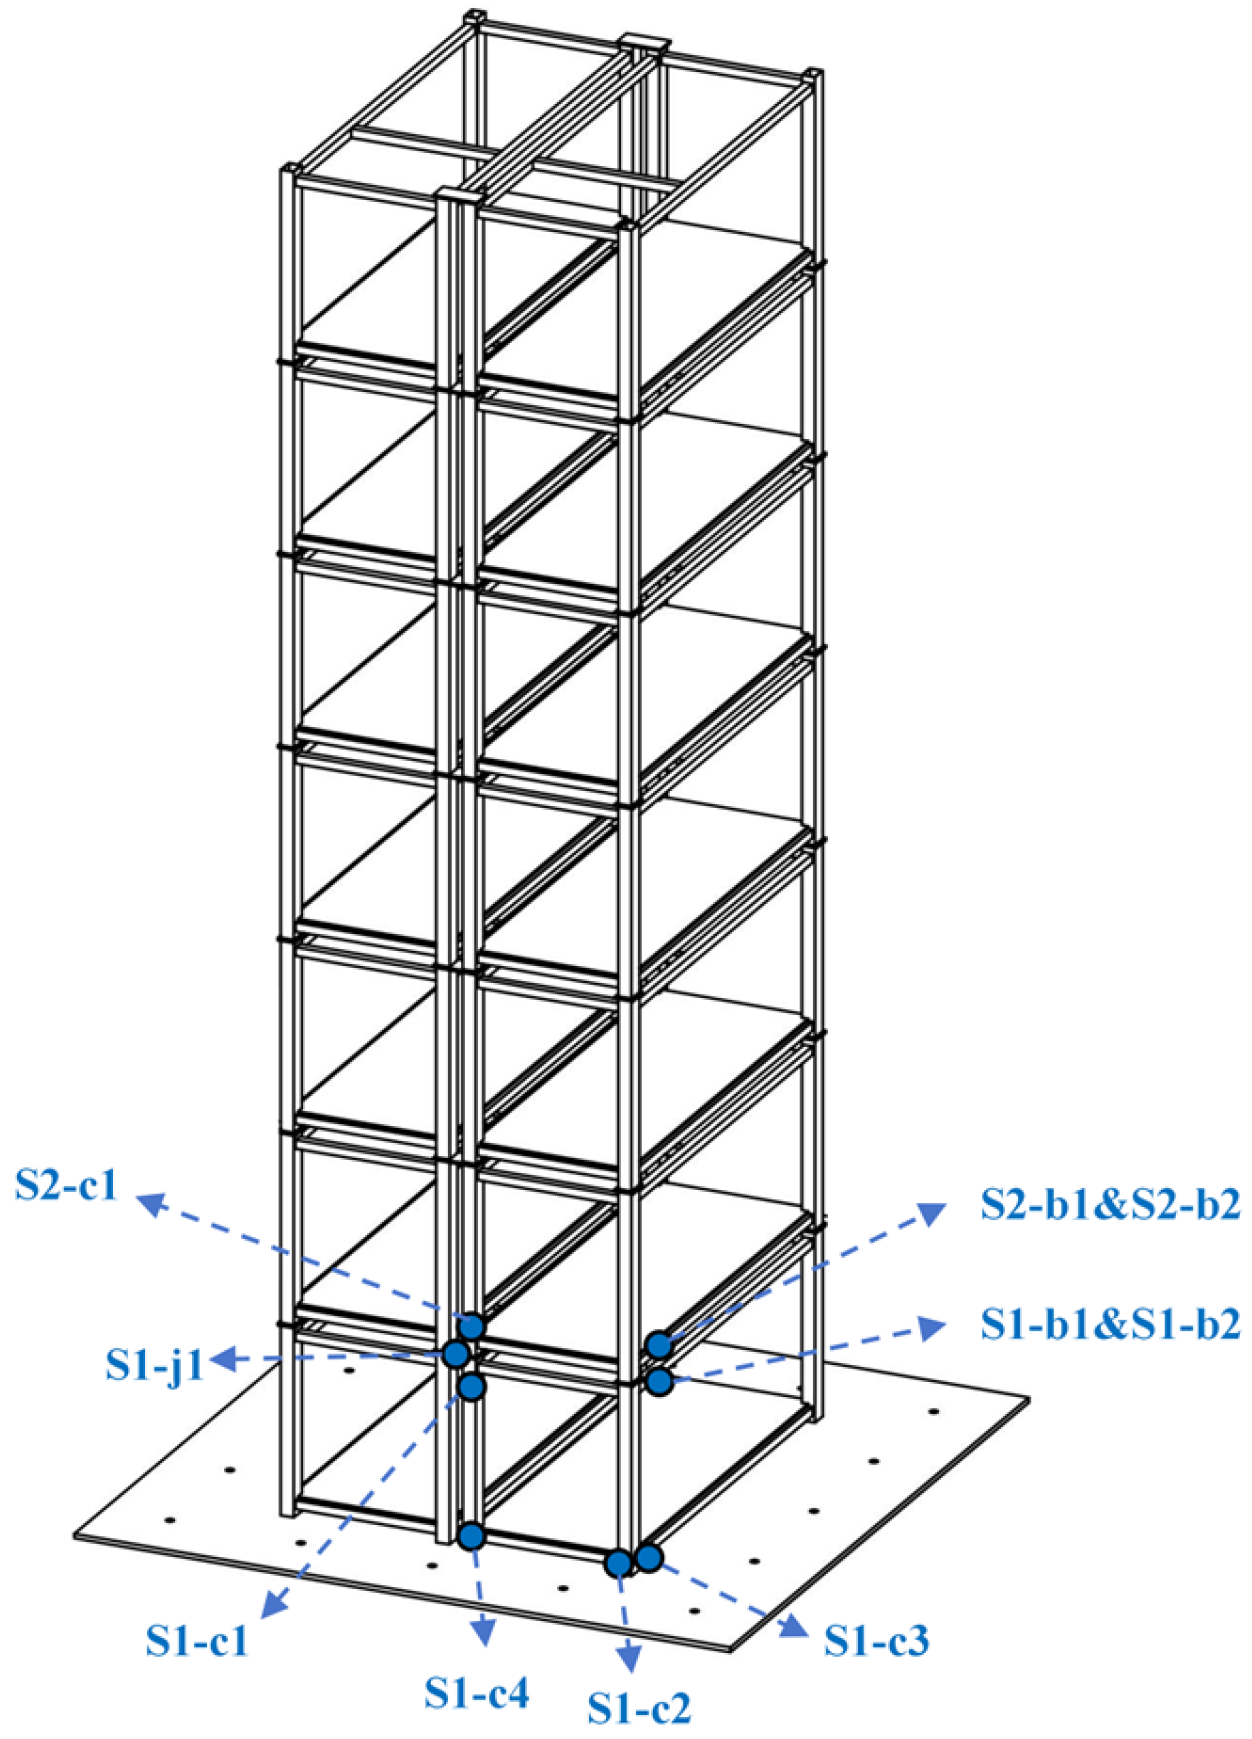
The arrangement of strain gauges is shown in Figure 10, where blue solid dots indicate their exact locations. The strain gauges are labeled using the format “Sx-c/b/jx”. For example, S1-c2 is the strain gauge measuring strain at column of the 1st story and number as 2, S2-b1 is the strain gauge measuring strain at beam of the 2nd story and number as 1, while S1-j1 is the strain rosette measuring strain at the joint connecting the 1st story and the 2nd story.

2.5. Load Scheme

2.5.1. Shaking Table

The seismic simulation equipment used in this study is a unidirectional horizontal shaking table at the Harbin Institute of Technology, Shenzhen. Detailed specifications of the shaking table are listed in Table 6.

2.5.2. Selection of Seismic Waves

Two recorded natural earthquake ground motions (Tianjin, China, 1976, and Tohoku, Japan, 2011) and one artificial ground motion are selected as input acceleration time histories for the shaking table tests.
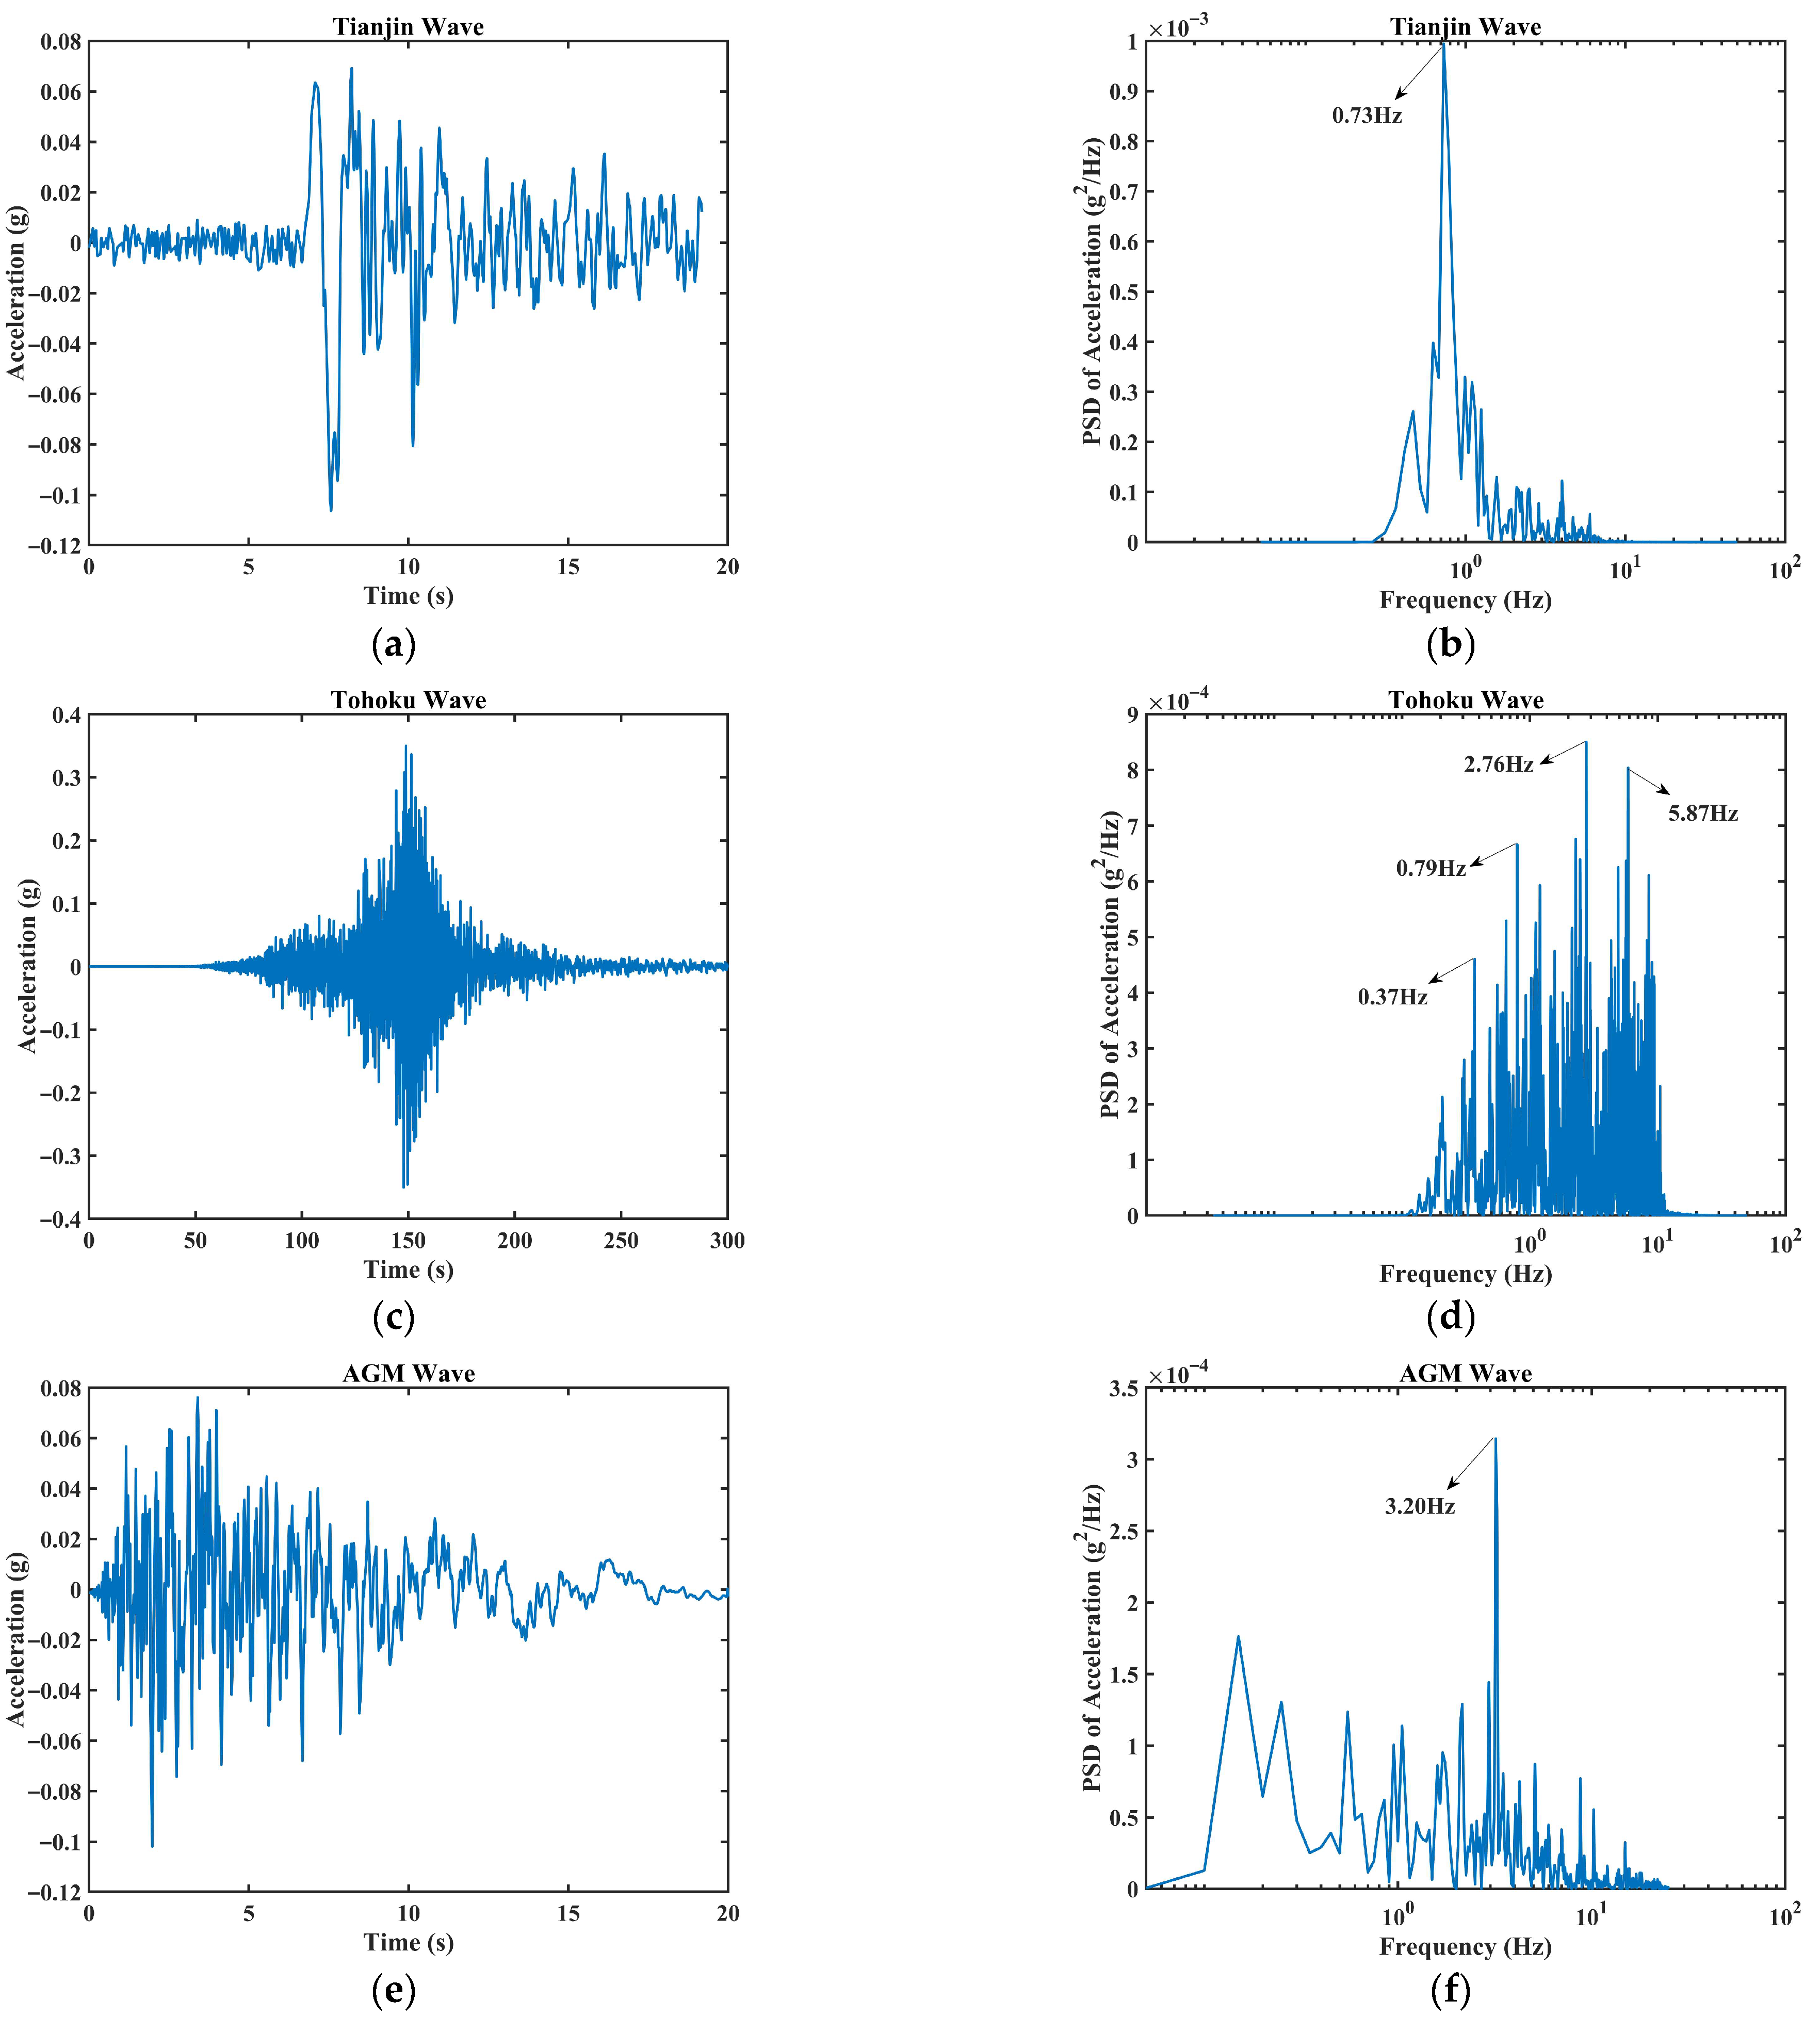
The artificial ground motion (abbreviated as AGM) is generated based on the design response spectrum specified in the Chinese code for seismic design of buildings [11]. Detailed information of the selected ground motions is provided in Table 7. Their acceleration time histories and corresponding power spectral density (PSD) comparisons are shown in Figure 11.

2.5.3. Test Loading Scheme

Table 3 illustrates that the time scale ratio of a seismic input is 1/3. All input motions are resampled at a rate of 1000 Hz. Details of the input table motions used in the model tests are summarized in Table 8.
Additionally, for every seismic wave in Table 7, its whole profile needs to be scaled in terms of its peak ground acceleration (PGA) to represent four typical intensity levels as specified in the seismic code [11]: frequently occurred earthquake at 7-degree intensity (PGA 0.035 g, in short FOE7), design basis earthquake at 7-degree intensity (PGA 0.1 g, DBE7), maximum considered earthquake at 7-degree intensity (PGA 0.22 g, MCE7), and maximum considered earthquake at 7.5-degree intensity (PGA 0.31 g, MCE7.5). Table 9 gives the sequence of all 23 loading cases, of which the first one and the last one are both white noise excitation tests. They are conducted to identify the pre- and post-testing natural frequencies of the model structure.

3. Results and Discussion

3.1. Dynamic Characteristics

According to structural dynamics theory, for a linear time-invariant system, the frequency domain relationship between the input signal X and the output signal Y can be expressed by Equation (1). In this equation, S y y ( f ) represents the power spectral density (PSD) of the input signal, S x x ( f ) is the PSD of the output signal, and H x y ( f ) denotes the transfer function of the system.
S y y ( f ) = S x x ( f ) H x y ( f ) 2
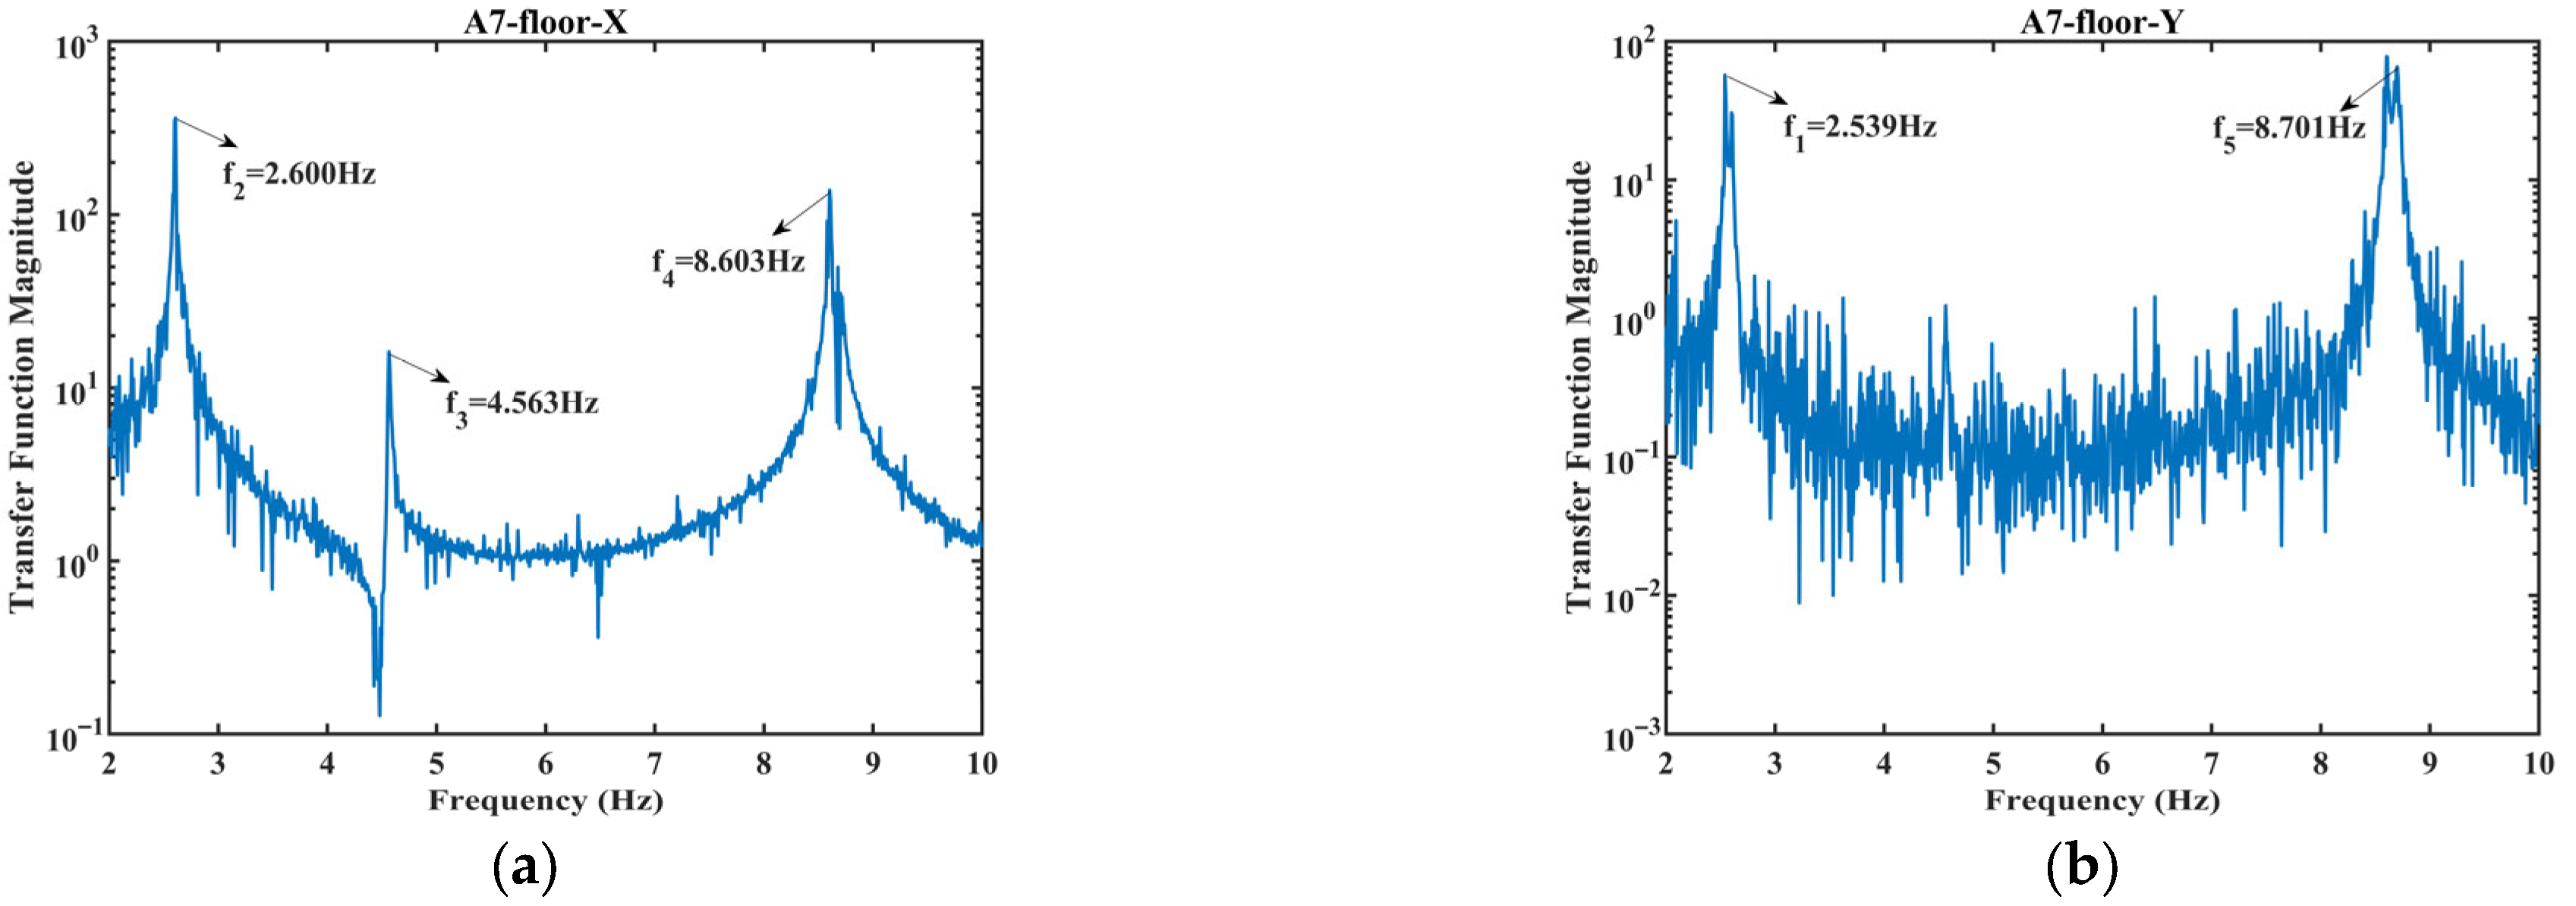
Figure 12 presents six acceleration transfer functions derived from the loading scenario #1 (WN-X1). They correspond to three representative heights, lower, middle, and upper stories, in both X and Y directions. It follows that the intact (pre-seismic) natural frequencies of the model structure can be identified [20]. As shown in Figure 12, three distinct peaks are observed in the X-direction response, while two prominent peaks are identified in the Y-direction. These peak frequencies correspond to the five natural frequencies (f1, f2, f3, f4, f5). The peak at 4.563 Hz observed in the X-direction response corresponds to the torsional mode (f3). Since the torsional deformation is most pronounced at corners, the X-direction sensors placed there do capture significant torsional components. In contrast, the Y-direction sensors are positioned closer to the structural stiffness axis, so they are less sensitive to the torsional effect.
The identified natural frequencies and mode shapes of the steel structure model are summarized in Table 10 and compared with the results from the numerical modal analysis. The comparison shows that, for all translational modes (f1, f2, f4, f5), the measured values closely match the finite element (FE) numerical outcome. This indicates that not only are the stiffness and mass distribution in both the X and Y directions of the tested structure uniform, but the model fabrication is also of high quality. It is noteworthy that the measured torsional frequency (f3) shows a significant deviation from the scaled design value. This discrepancy is primarily attributed to the artificial steel mass, which is welded onto the floor slabs (Figure 8) and therefore increases the torsional stiffness. However, considering that the shaking table employed in this study is a unidirectional input system, and the test model is a rectangular structure with symmetric geometry and uniform mass distribution, there is little eccentricity to trigger torsional vibration. Therefore, the discrepancy in the torsional frequency hardly affects the validity of the measured translational response.
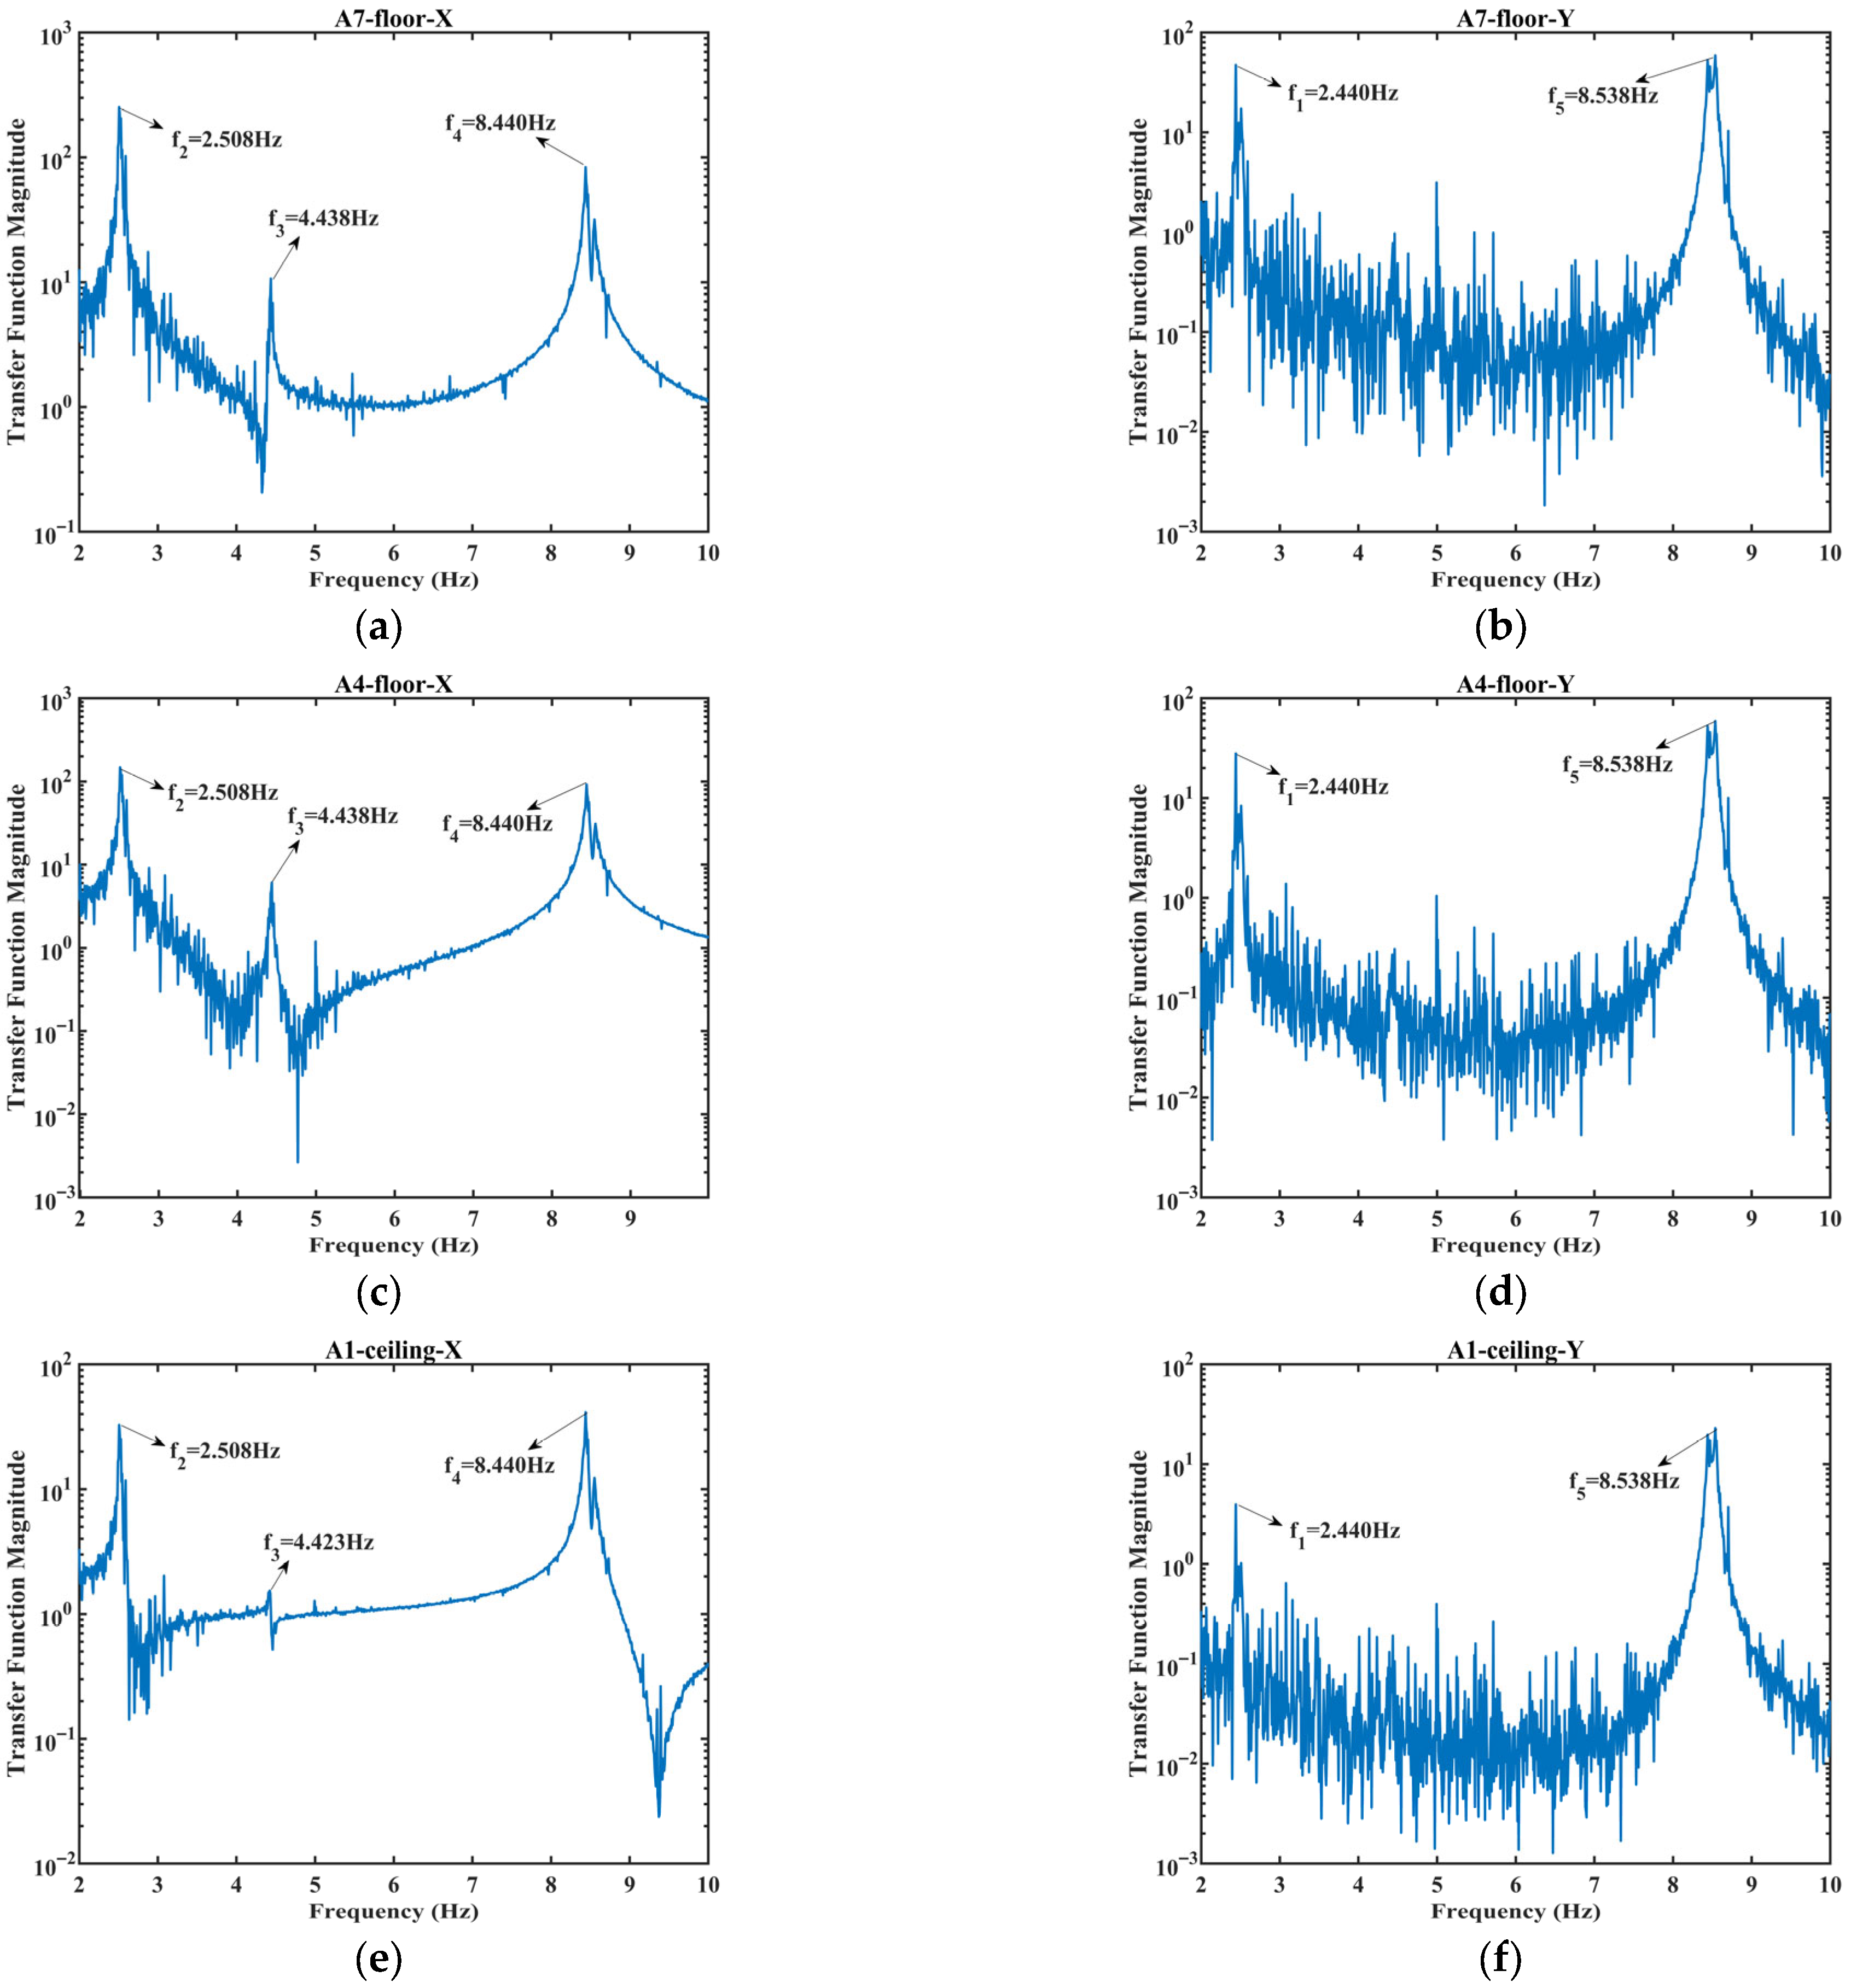
The post-testing transfer functions and natural frequencies (f1, f2, f3, f4, f5) derived from load case #23 (WN-X2) are presented in Figure 13 and Table 11. It is revealed that all five modes exhibit reductions in their natural frequencies. This indicates minor looseness or stiffness degradation at structural connections (e.g., joints, welds, bolts), or development of small cracks or early-stage plasticity in certain members. Nonetheless, the magnitude of reductions is small, indicating only minor stiffness degradation as the structure remains within the elastic state after experiencing the preceding seismic waves. In addition, it can be seen that the reduction in natural frequencies for the lower-order modes (f1, f2, f3) is notably greater than that of the higher-order modes (f4, f5), about 3.5% vs. 1.9%. This suggests that the lower modes, which carry more energy and exhibit stronger responses, are more sensitive to changes in overall structural performance. Therefore, the reduction in lower-order frequencies can serve as a sensitive indicator of structural damage.
In addition, the stiffness degradation ratio λ S D R can be defined as shown in Equation (2) [20], where k b and f b   represent the initial stiffness and natural frequency of the structure before testing, and k a and f a represent the stiffness and natural frequency of the structure after each seismic excitation during the test. The calculated λ S D R using test data is 7.65%, indicating that the stiffness degradation of the model structure is slight.
λ S D R = k a k b k b = f a 2 f b 2 f b 2

3.2. Acceleration Amplification Coefficient

In dynamics, another criterion to assess the response characteristics is via acceleration amplification coefficient/factor β [21]. As defined in Equation (3), β   is the ratio of peak structural acceleration (PSA) to PGA.
β = P S A P G A
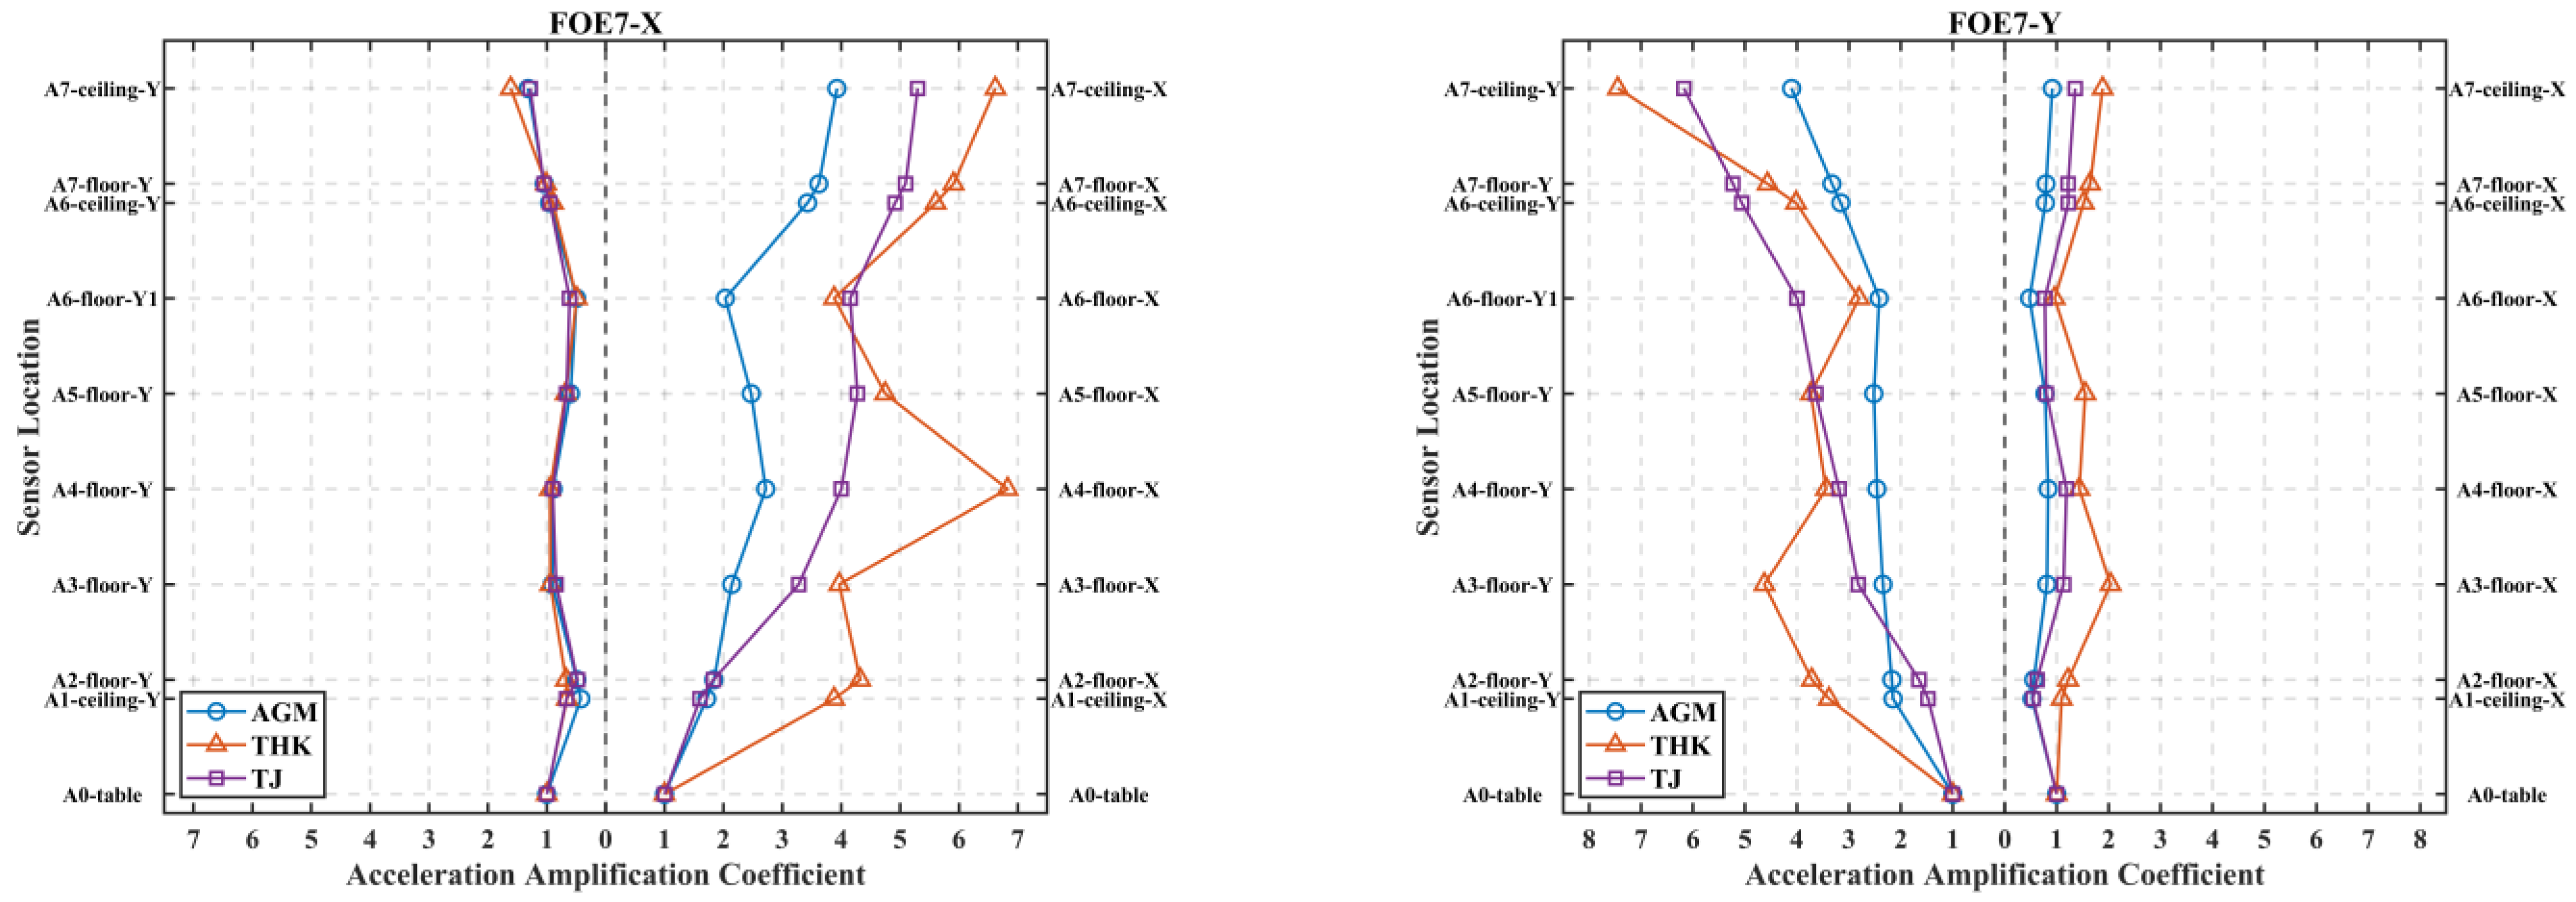
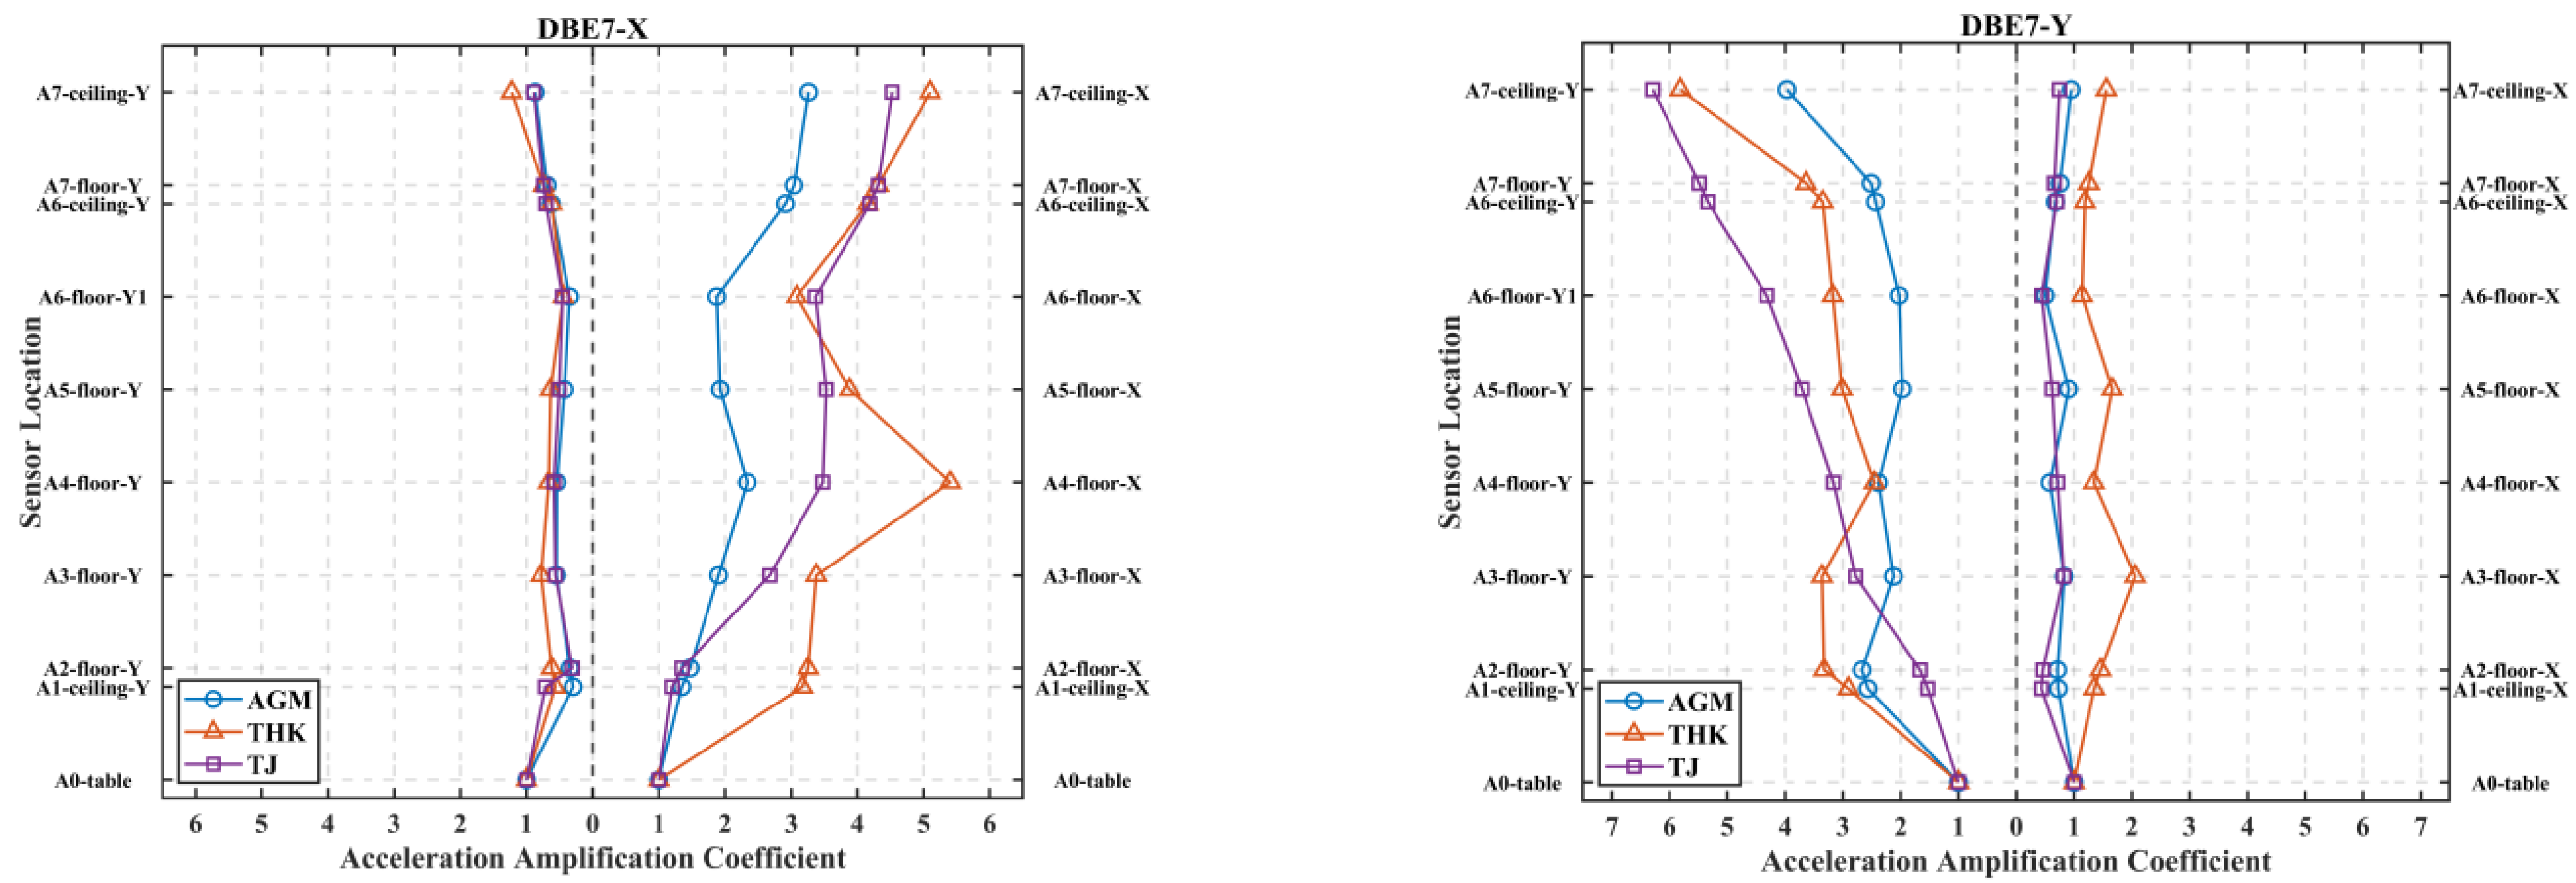
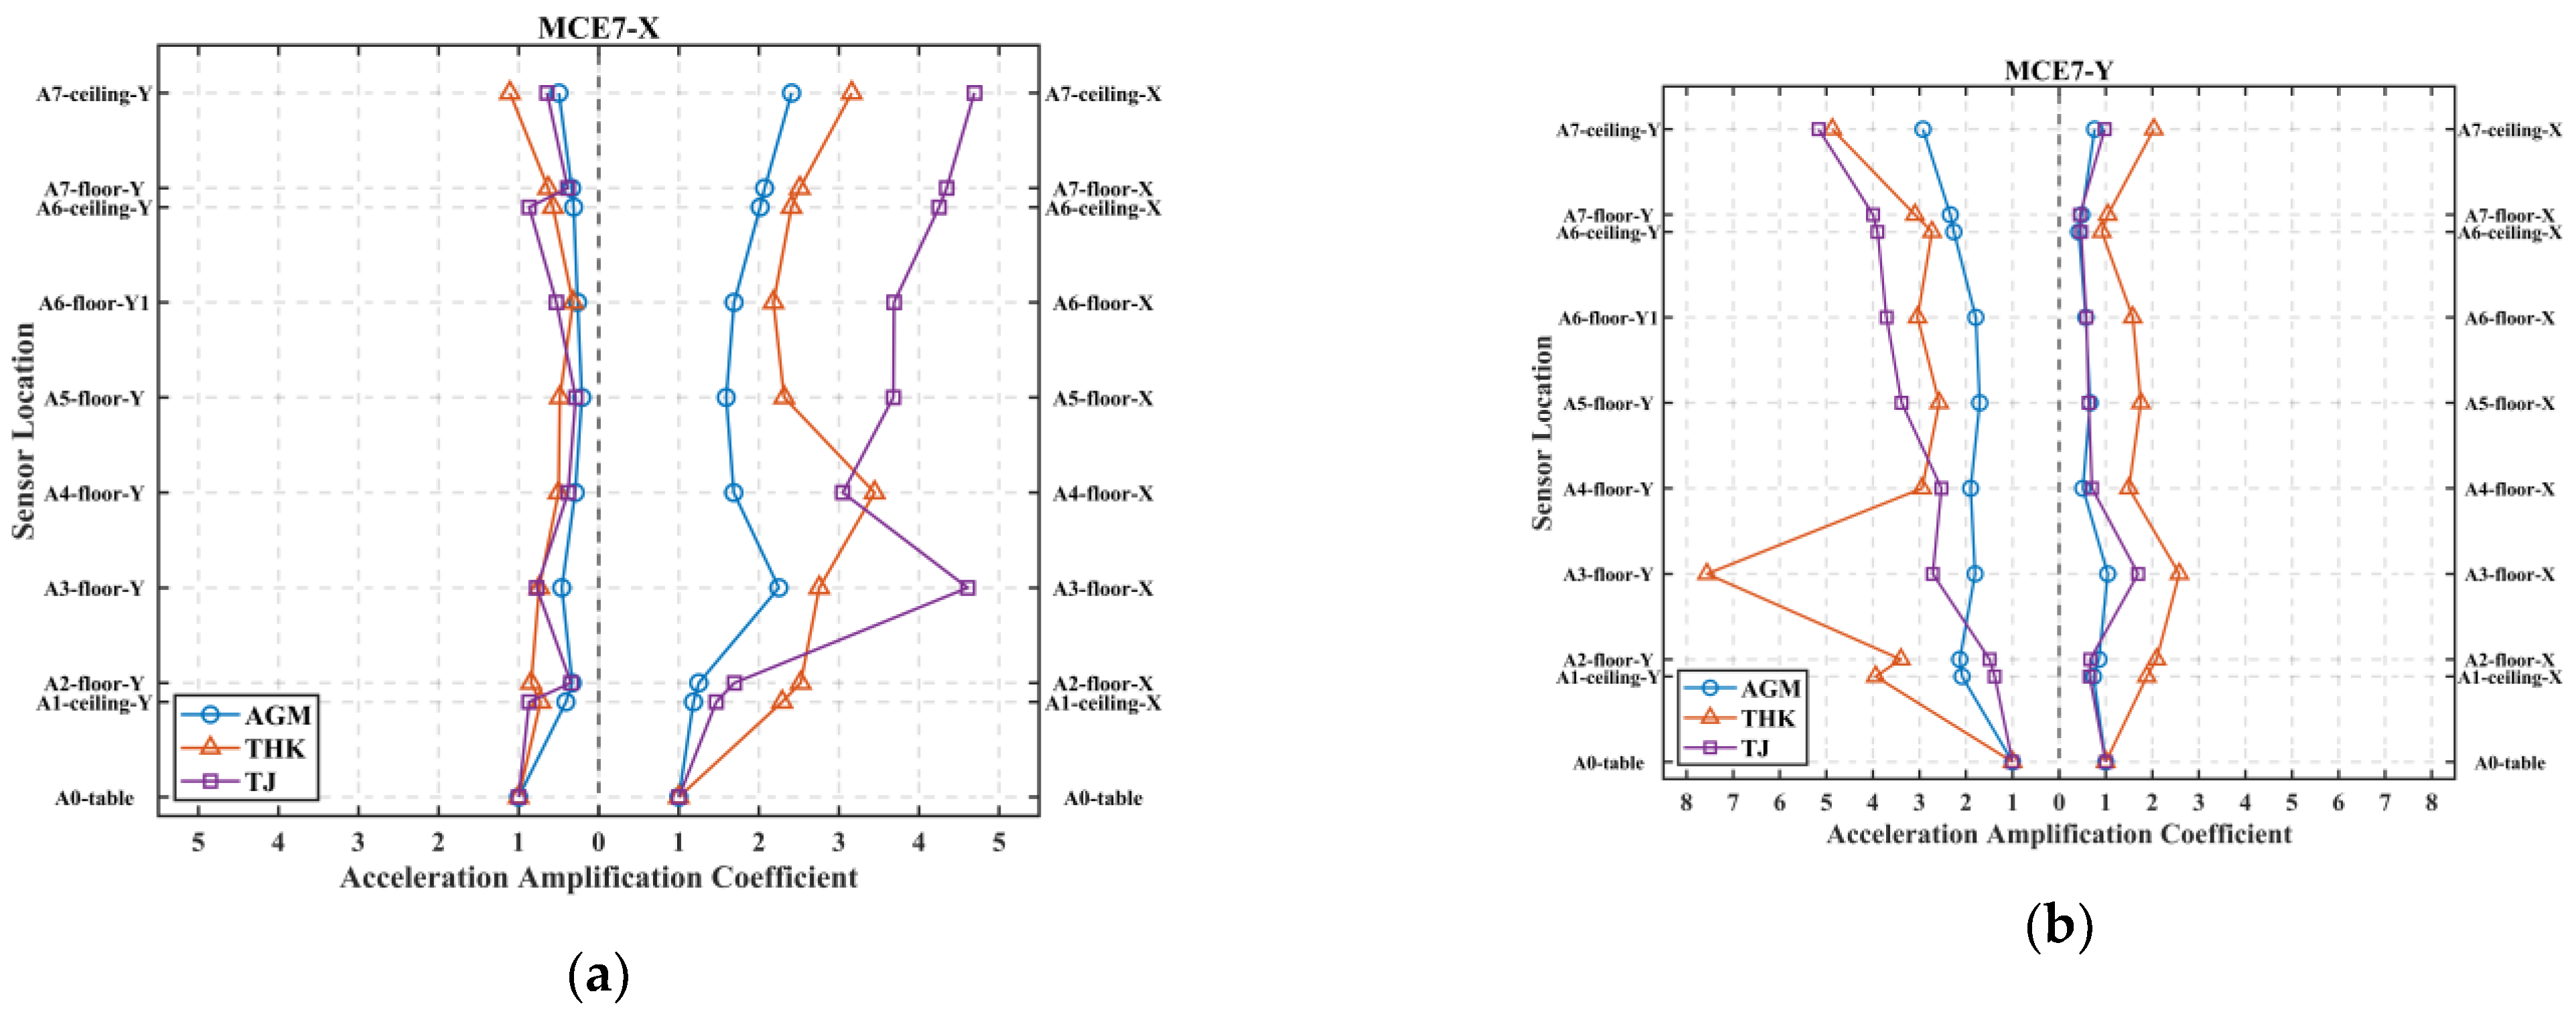
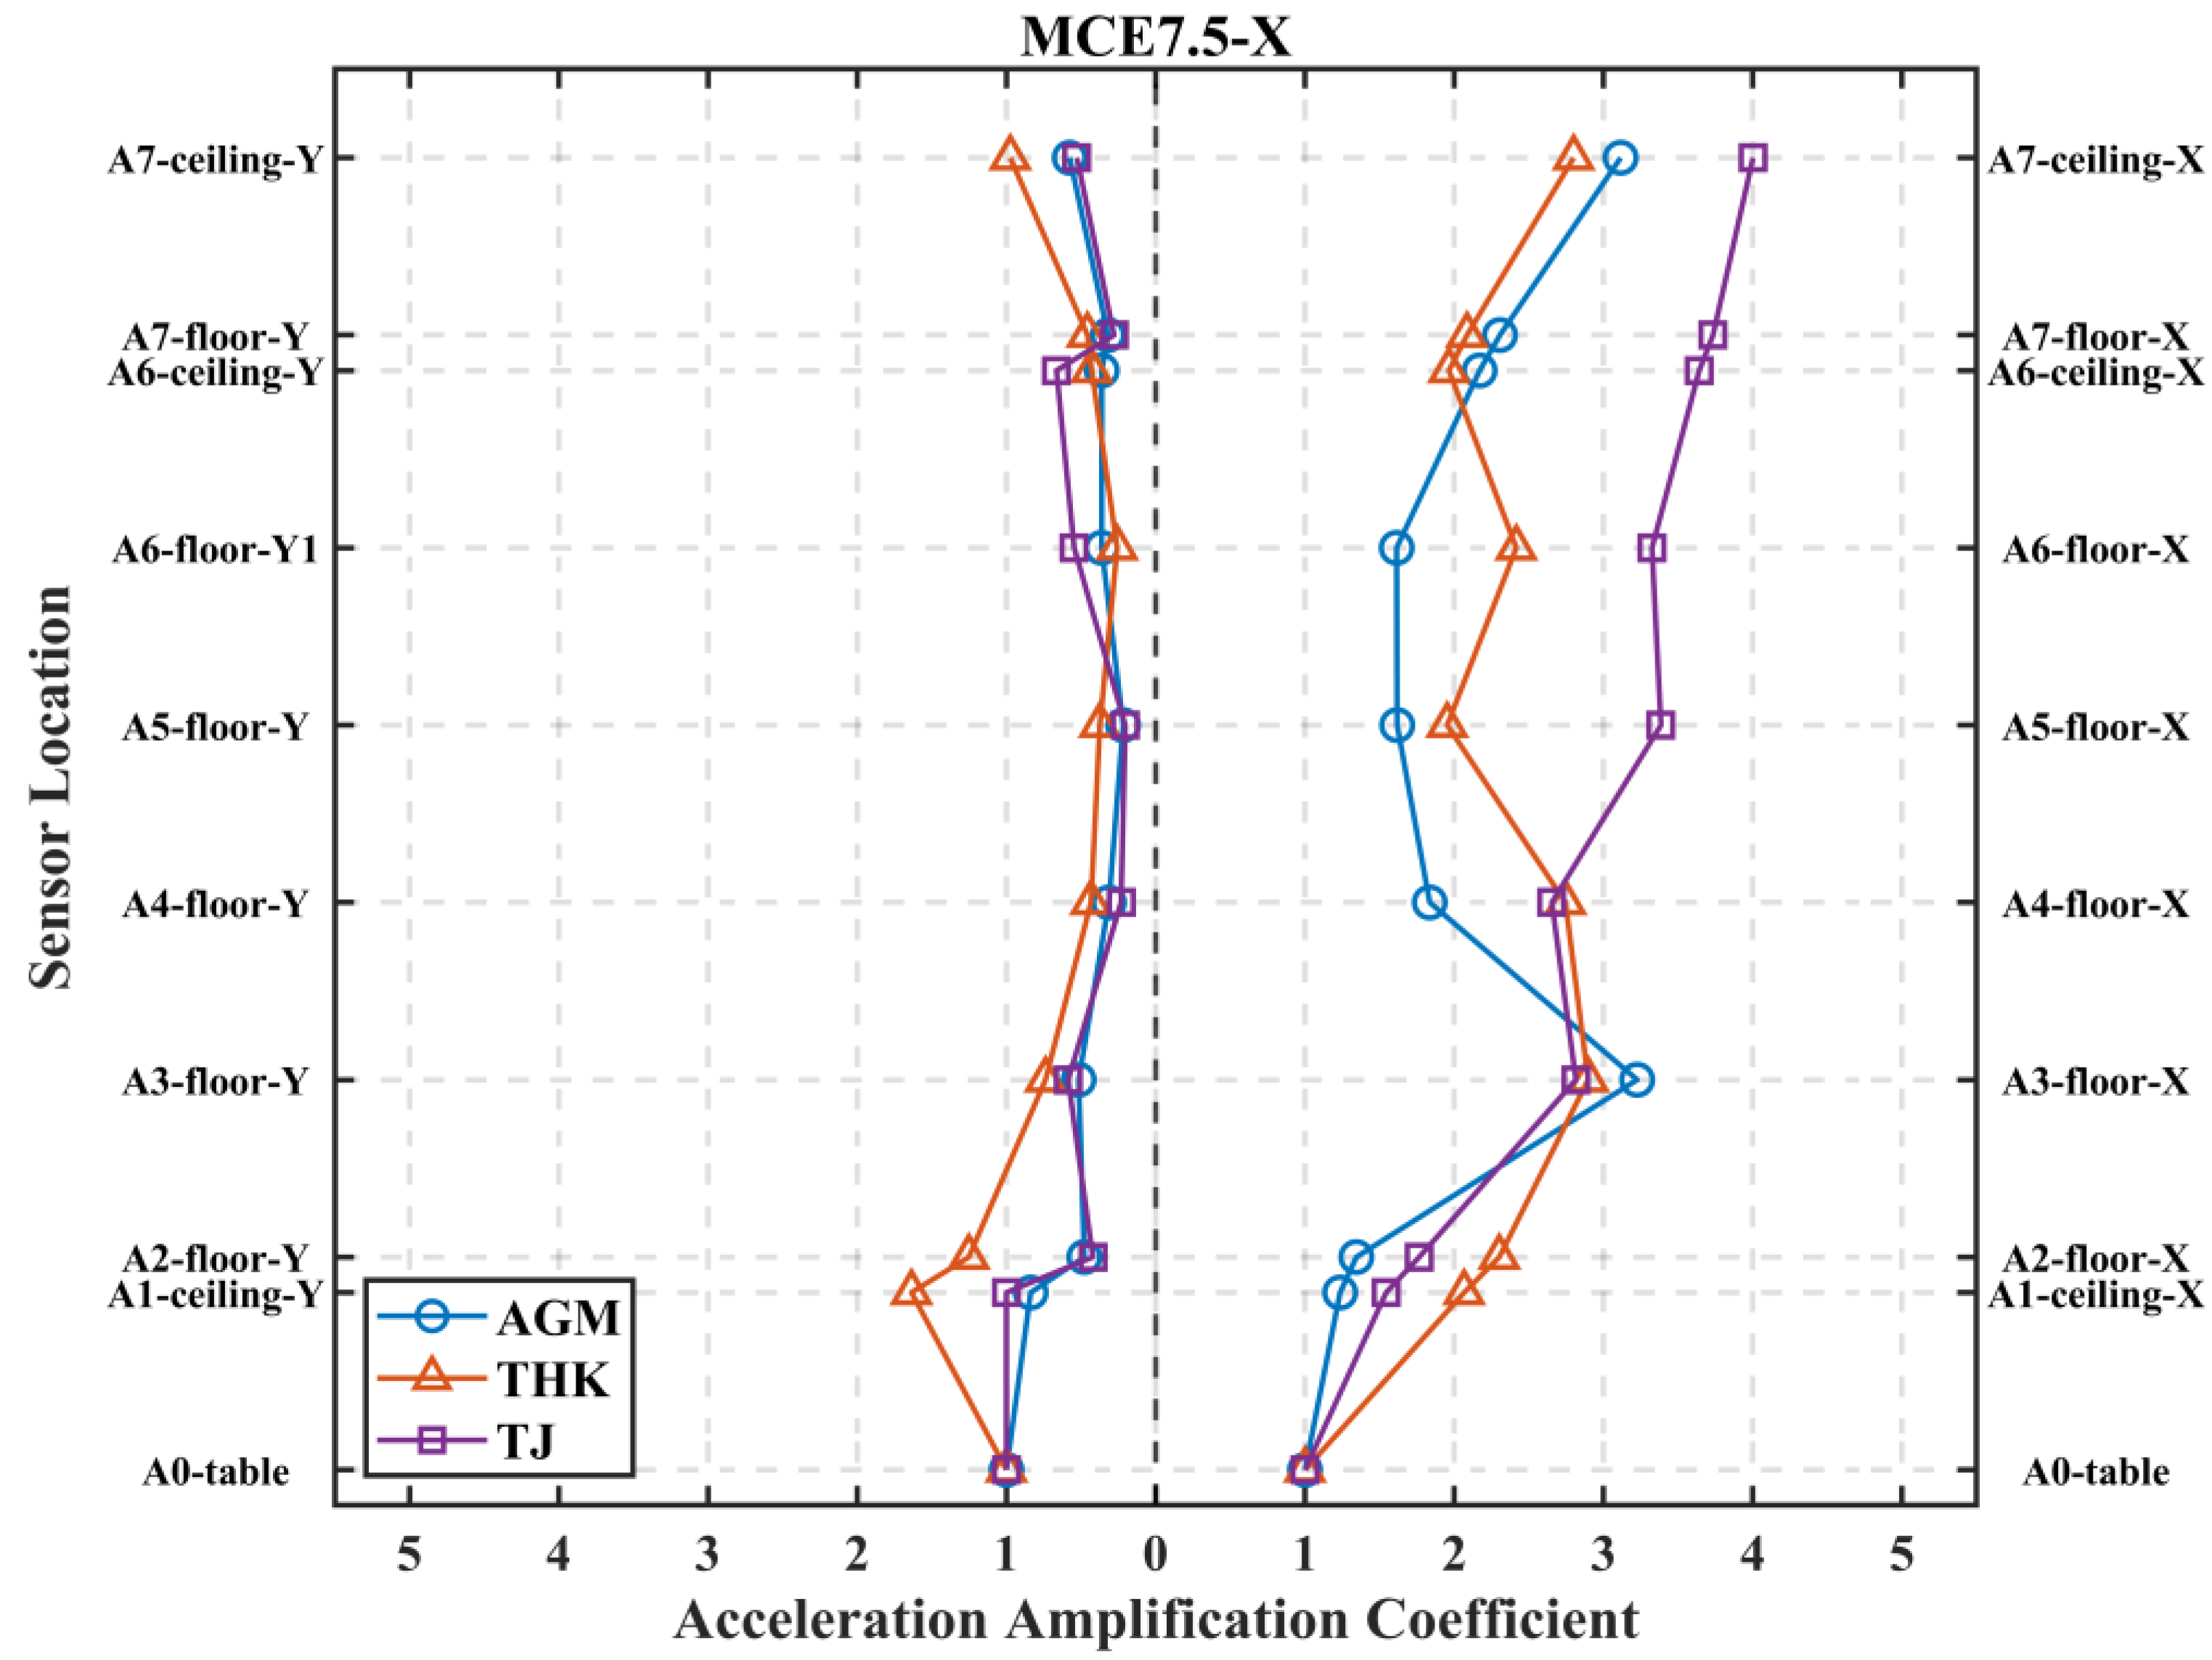
As shown in Figure 14, Figure 15, Figure 16 and Figure 17, the vertical axis on both sides of each plot lists the labels of the sensors distributed along the transverse (X) and longitudinal (Y) directions of the structure. The analysis yields the following observations.
Overall, the acceleration amplification coefficient β tends to increase with floor height, reaching its maximum at the top of the structure. This trend indicates a clear height dependency in the amplification behavior across different sensors. However, this pattern is not strictly monotonic. For example, between the third-floor slab and the sixth-floor ceiling, the acceleration amplification curves exhibit a pronounced S-shaped curve along the building height. The S-shaped curve is characterized by larger acceleration amplification effects occurring at lower story levels, which is also observed in reference [17]. This phenomenon can be attributed, on one hand, to the spatial distribution characteristics of the structural mode shapes. When multiple modes are involved in the acceleration responses, β across floors does not strictly increase with height, because intermediate floors located near a mode shape inflection may exhibit relatively weaker acceleration responses. On the other hand, varying levels of seismic intensity and differential stiffness degradation among floors also contribute to such S-shaped amplification. Additionally, a noticeable bulge in the β curves is observed at the third-floor slab across several scenarios. In particular, under the Tohoku wave input, the peak accelerations at the third and fourth floors approach or even exceed those at the roof level. In particular, the scaled Tohoku wave has a peak frequency at 8.28 Hz, which is close to the natural frequency of higher-order translational modes (f4 and f5) of the model. This frequency proximity leads to the excitation of higher modes, whose modal shapes exhibit peak amplitudes at the intermediate floors, especially the third and fourth stories. This highlights the need for careful control of lower-story vibration amplitudes in the seismic design of modular steel structures.
A comparison of β at the top ceiling under the same earthquake wave but different input directions revealed that the Y-direction response is stronger than that in the X-direction. This is primarily because the first-mode shape happens in the Y-direction, and it is the most dominant mode. Furthermore, the input along with the X-direction also induces the Y-direction response to occur, or vice versa. However, such transverse influence is minor because transverse β generally remained below 2.0 and never exceeded 3.0.
Under the MCE7 and MCE7.5 load scenarios, the Tianjin wave consistently produces the most significant β at the top of the structure. However, it is noteworthy that, unlike the case of the Tohoku wave, the shapes of the β curves excited by the Tianjin wave are as monotonic as the first mode and second mode in Figure 2, which can be explained by the shorter duration of input and its simpler frequency content (Figure 11b) to trigger only low-mode (f1 and f2) response.
To discuss the acceleration amplification effect quantitatively, all data related to the acceleration amplification factor are summarized in Table 12 and Table 13. Additionally, these two tables present the relevant formula of the acceleration amplification factor in current codes [11,22,23,24], where Z is the height of floor-to-ground and h is a total height of the model. The measured results of this study are then compared with the formula.
As shown in Table 12 and Table 13, when the measurement direction of the accelerometer is aligned with the input, the calculated values from the formula in current code fail to represent the actual factor’s distribution profiles. The formula tends to underestimate the amplification factors, which may pose significant risks to structural safety evaluations. Furthermore, the formula assumes a monotonically linear increase in acceleration amplification factors with building height, which fails to explain the S-shaped curve observed in the experiment. This indicates that current codes tend to underestimate PSA values and inaccurately describe the amplification profile. Such discrepancies call for revisions to the current codes, especially when applied to modular steel buildings.
Under similar seismic intensity level (PGA = 0.1 g), a comparison between the modular steel structure and the conventional steel structure in reference [25] is shown in Table 14. Both cases are based on the scenarios with highest acceleration amplification factors (AAF). The comparison results indicate that AAF in modular steel structures is more pronounced than in conventional steel structures. Therefore, it is recommended that seismic isolation or energy dissipation measures be considered in the design to limit floor acceleration responses of modular buildings.

3.3. Acceleration Response Spectrum Analysis

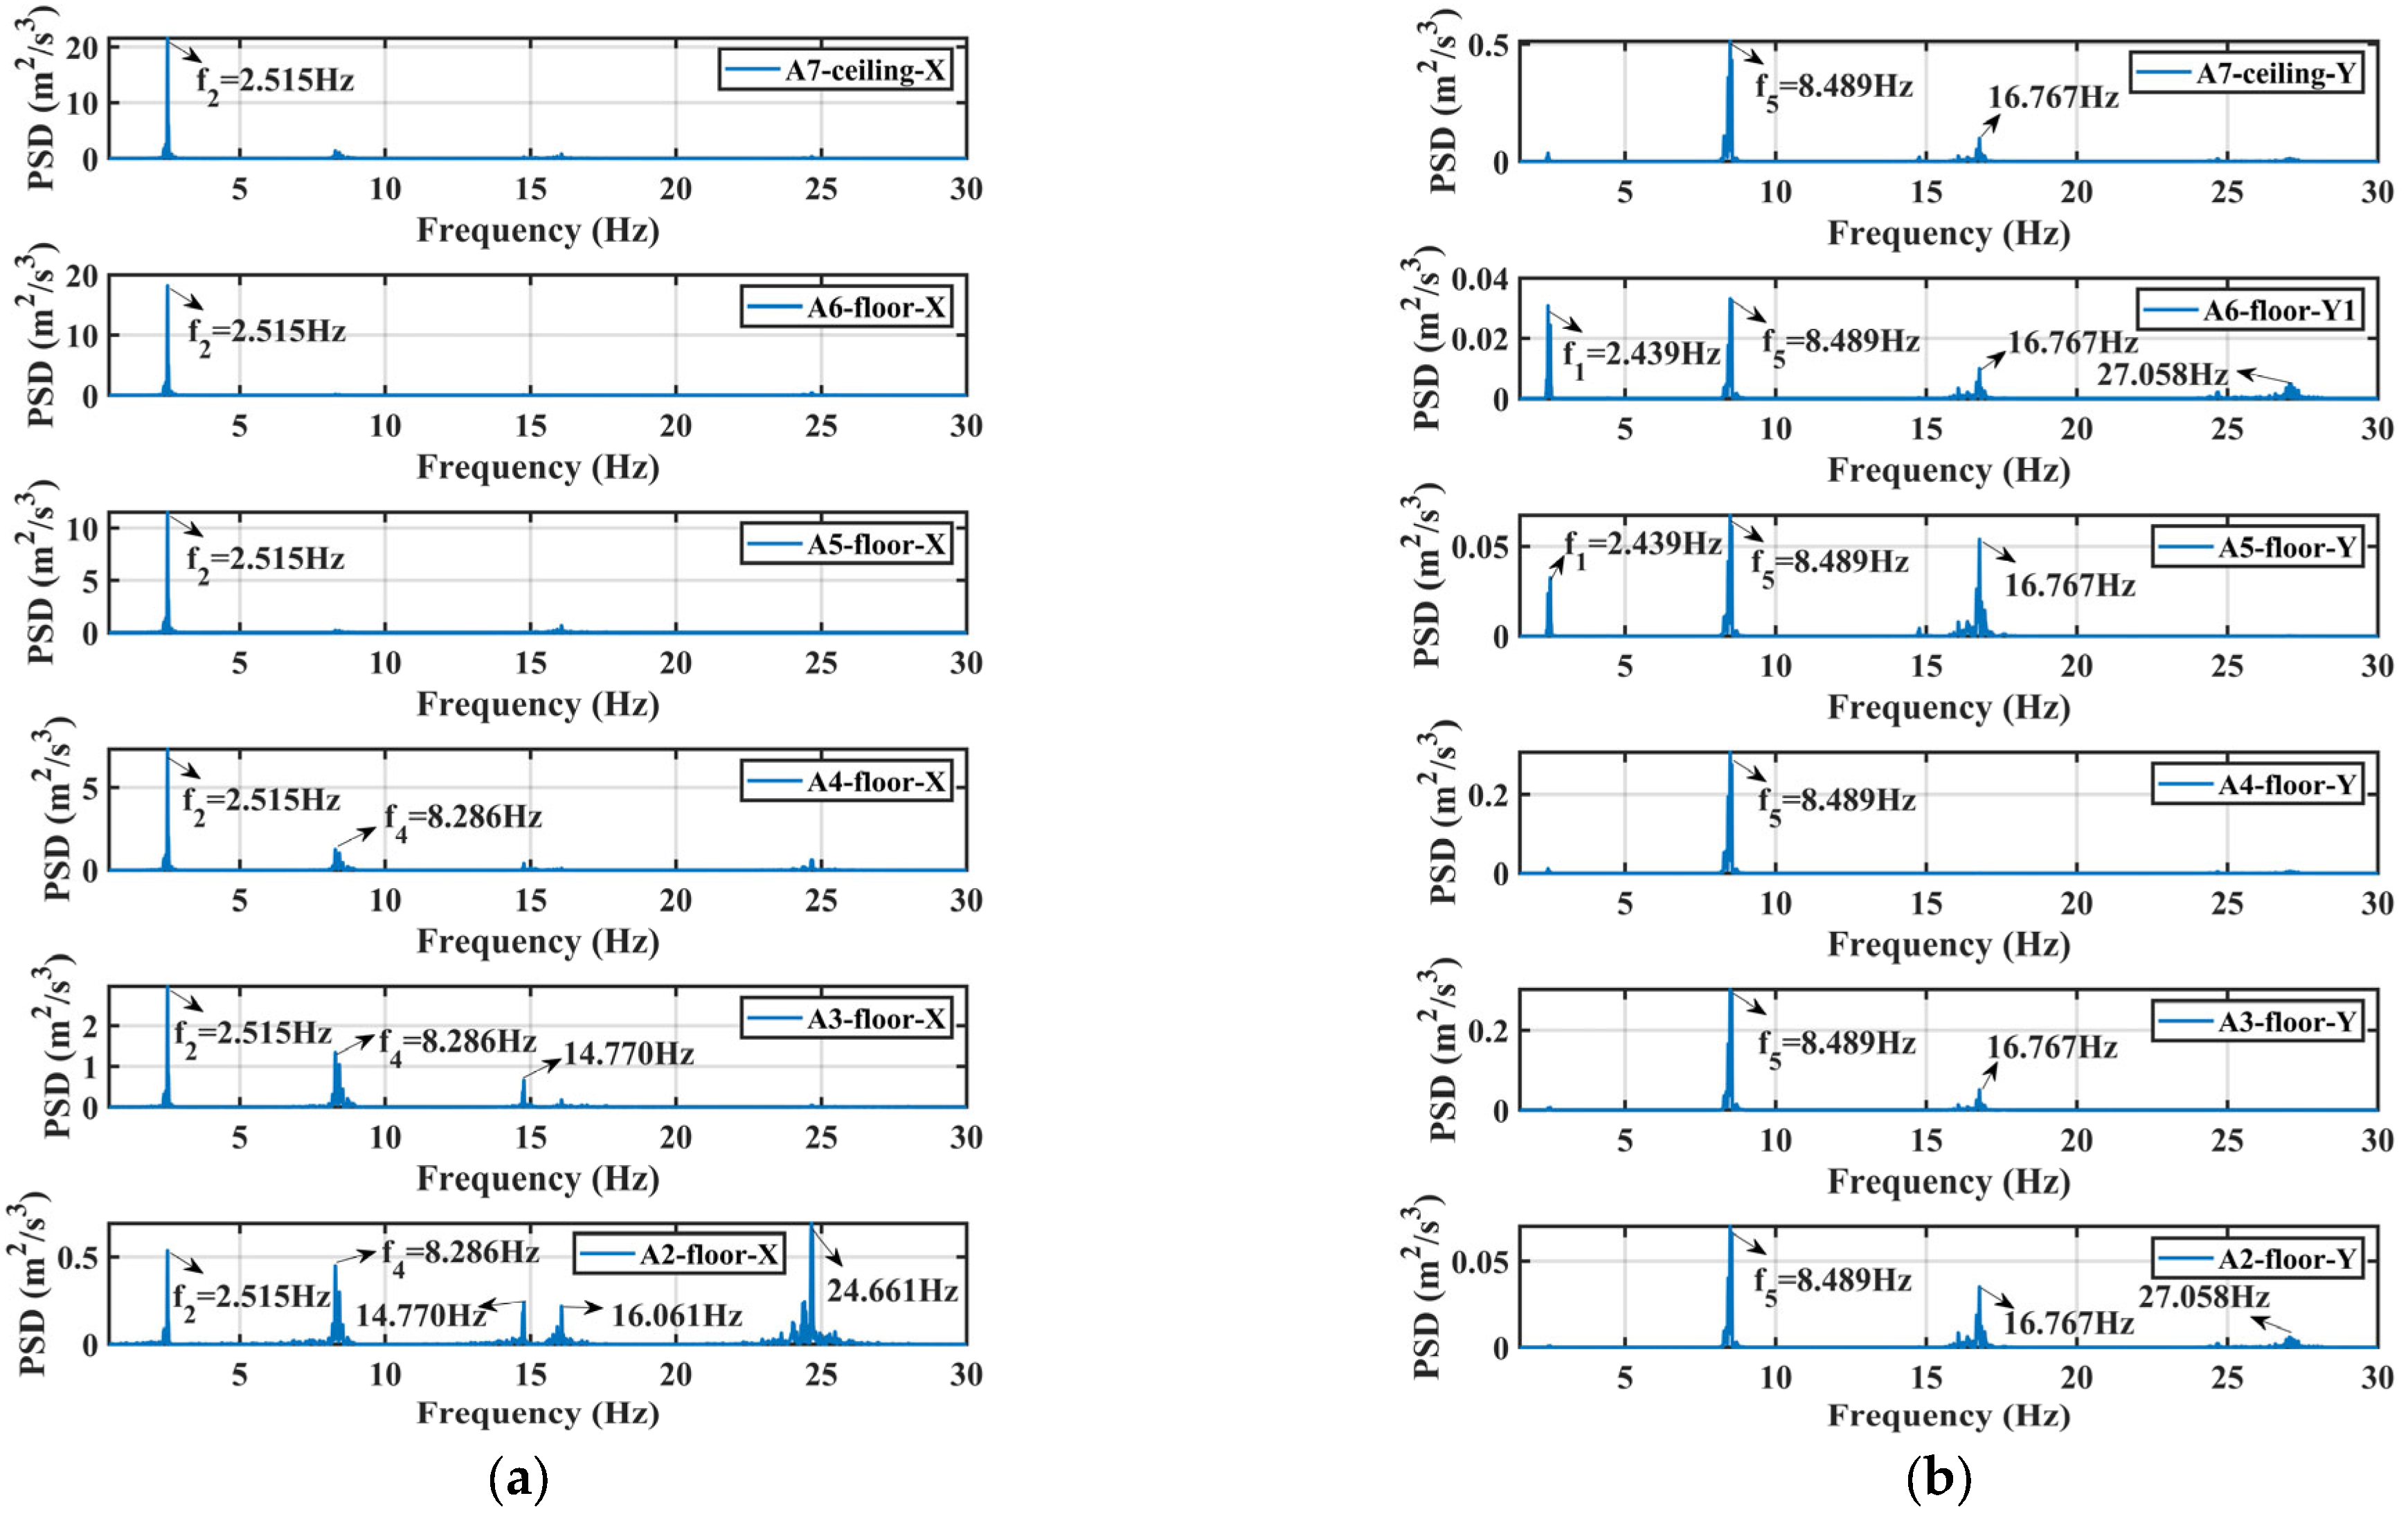
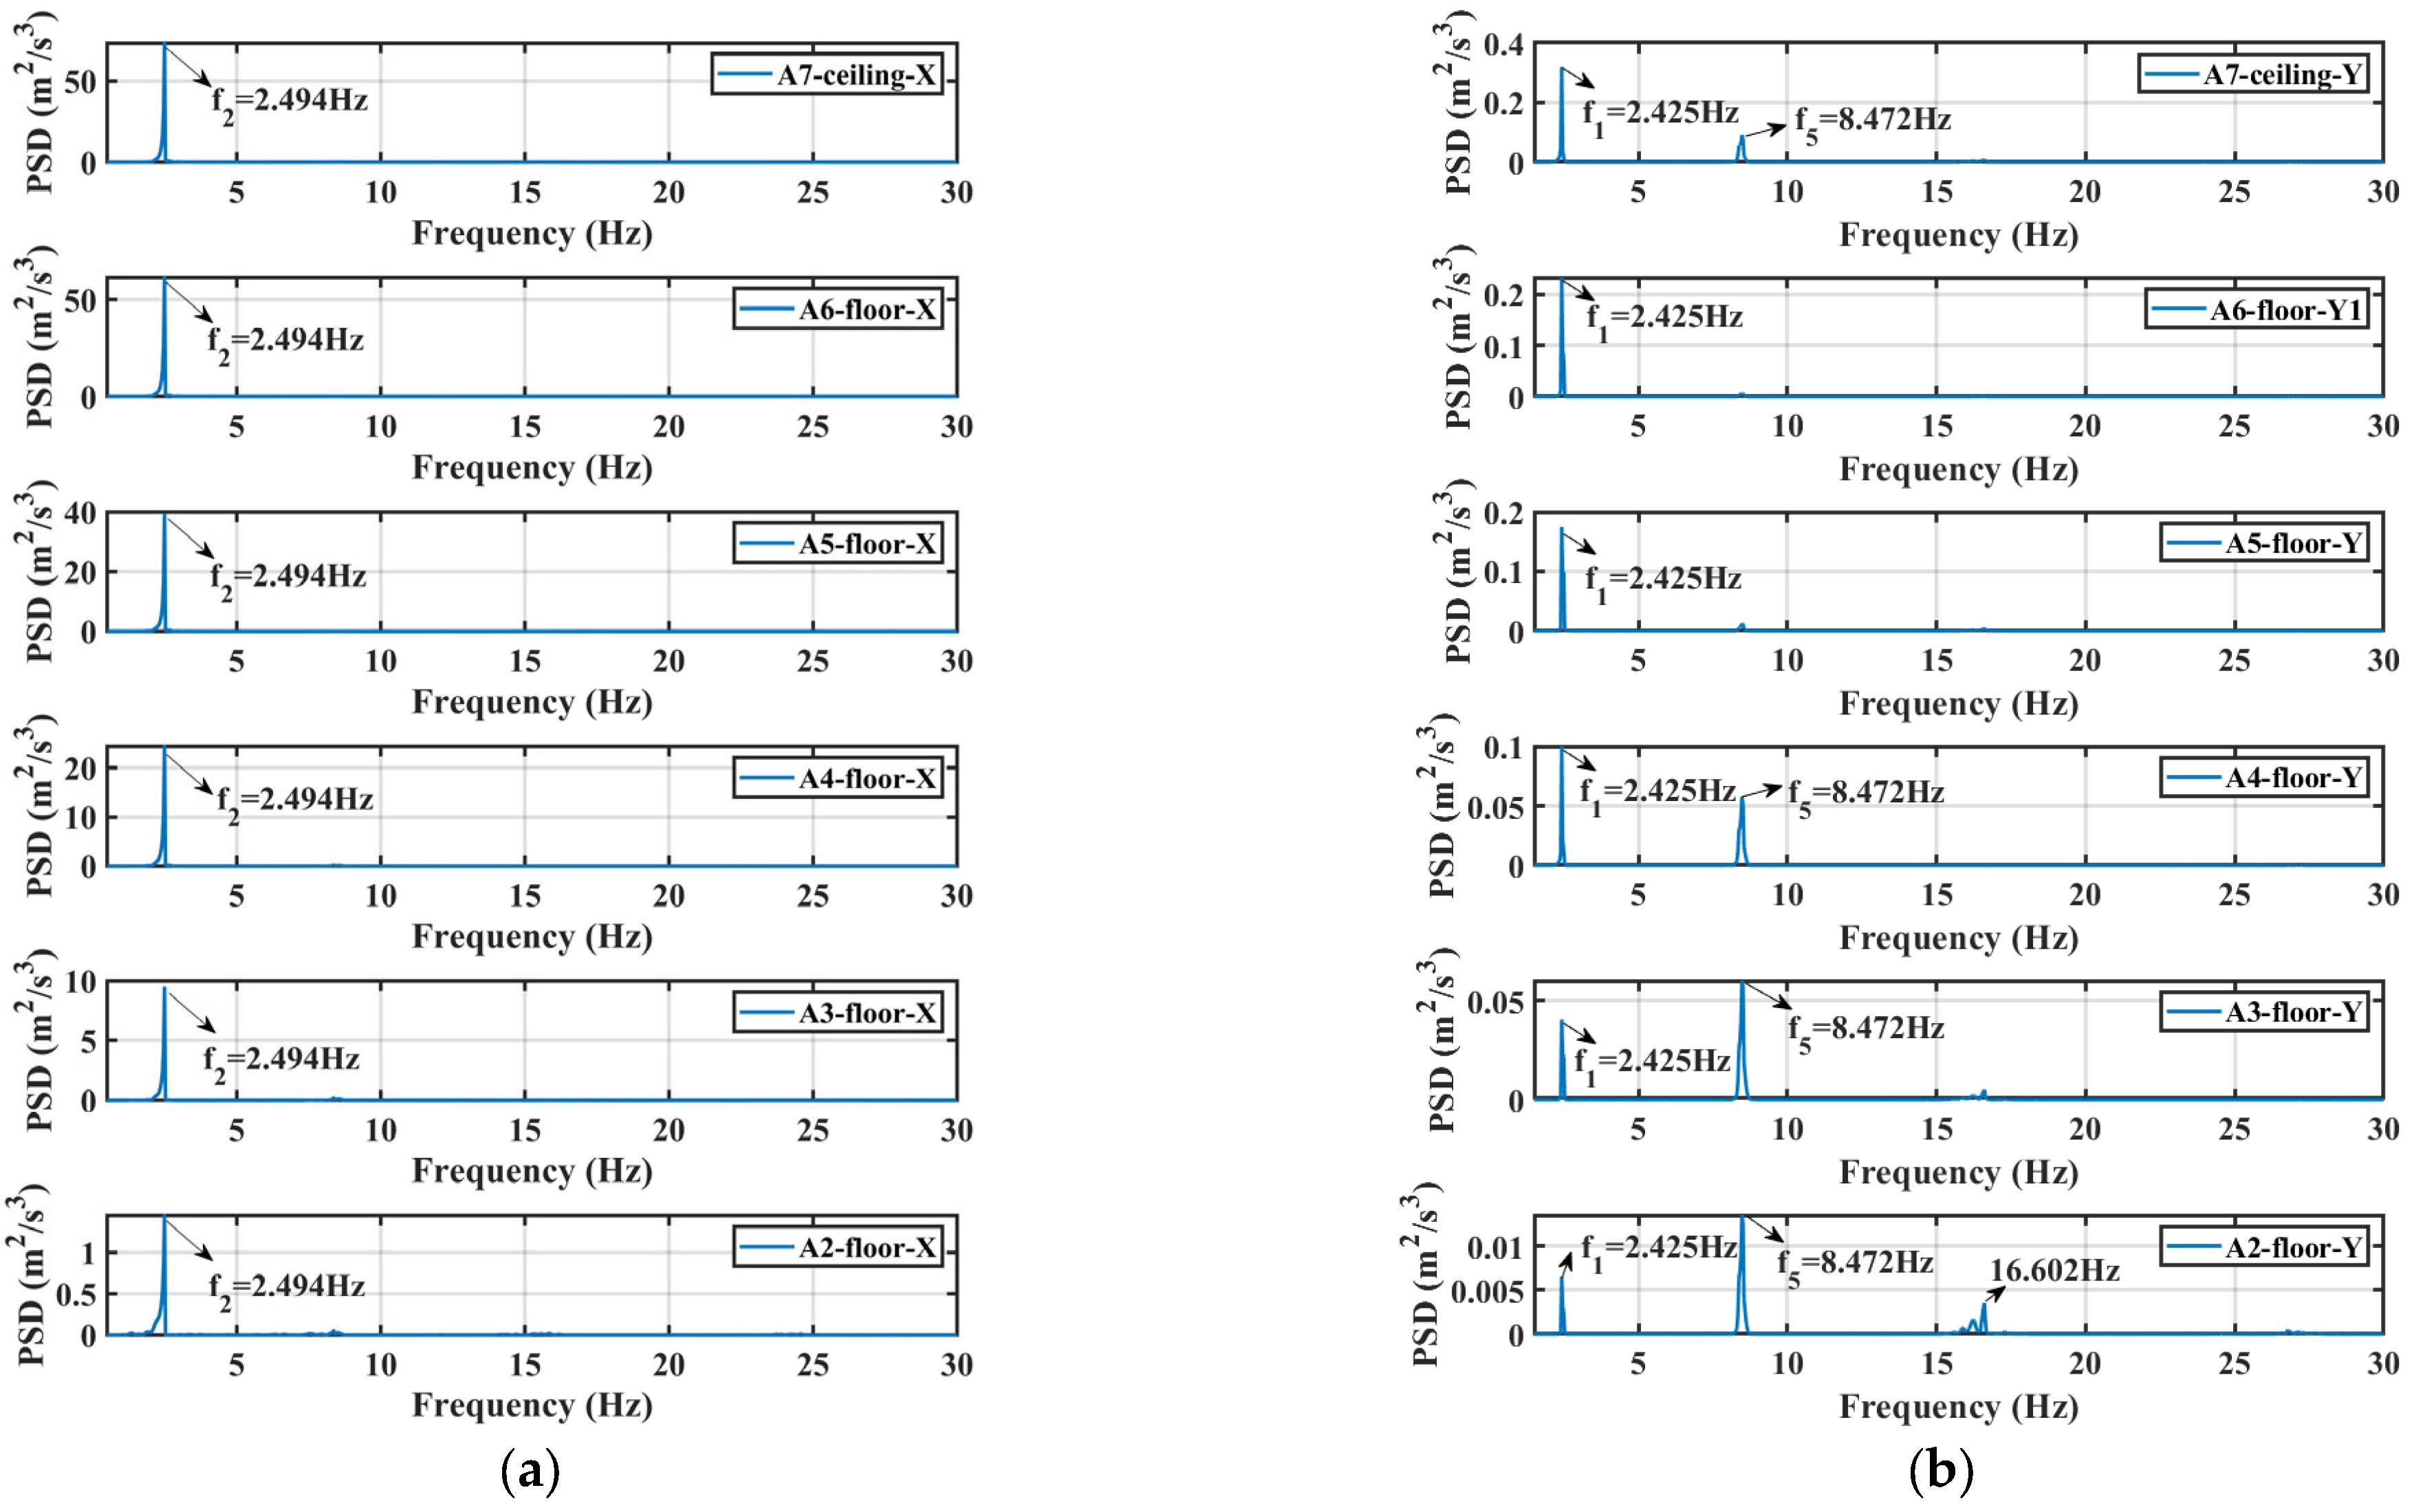
Considering that the MCE7.5 earthquake represents the most severe intensity level in this study and that the two natural ground motions (Tohoku wave and Tianjin wave in Table 7) produce greater responses than the AGM does, in this section, only the loading cases #21 and #22 in Table 9 are discussed. Furthermore, given the large number of accelerometers, only selected representative accelerometers at key measurement points are chosen for spectral analysis. Figure 18 presents their acceleration response spectra.
It can be noticed from Figure 18a that under the Tohoku Wave, as the placement of accelerometers rises, the spectral characteristics of the structural dynamic response change significantly. The number of spectral peaks decreases with elevation, particularly in the high-frequency range (higher than f2), where the amplitude of peaks diminishes more rapidly. High-frequency mode components (higher than f2) effectively vanish above the fifth-floor slab, leaving a primary peak (f2) associated with the fundamental translational mode of the structure. This behavior reflects a filtering effect inherent in the acceleration response: high-frequency components are significantly attenuated, while low-frequency components near the natural frequencies of the structure are noticeably amplified, i.e., comparing the response at 2.515 Hz between A2-floor-X and A7-ceiling-X. The underlying reason is that in Figure 11, the energy content in the Tohoku Wave at around 0.79 Hz (scaled to 2.37 Hz) is able to readily trigger the structural response at f2 (Figure 12a). In contrast, high-frequency components are effectively suppressed by the high floors as their responses are mainly controlled by the low-mode (f2). Therefore, at the topmost level of the structure, only a single spectral peak at f2 is observed.
Judging from the spectra of all 19 accelerometers on the model (Figure 9), f3 is not observed. This absence indicates that the modular steel structure, due to its standardized unit design and symmetric layout, possesses even distributions of stiffness and mass that effectively reduce the role of torsion. Further analysis of accelerometers along the Y-direction in Figure 18b reveals that seismic energy transmission in this direction is weaker. As a result, the number of excited modes captured in the spectra of lower-story Y-direction points is fewer. Moreover, it is shown that the dynamic responses at Y-direction sensors are predominantly governed by f5. The reason behind this phenomenon is that the predominant frequency of the Tohoku Wave is 2.76 Hz (Figure 11). When scaled, it coincides with f5. The spectral contents at 16.767 Hz correspond to higher-modes (higher than the 5th-mode), albeit their amplitudes are much lower than those at f5.
Figure 19 illustrates the acceleration response spectra under the Tianjin wave. In the X-direction (Figure 19a), obviously, the Tianjin wave exclusively excites the second-mode response, because its spectrum (Figure 11) only contains a rich component near 0.73 Hz, which is close to f2/ λ f . This differs from the response due to the Tohoku wave in Figure 18a, in that the latter is much more wide-banded and of a much longer duration. Likewise, in the Y-direction, the first-mode response is also triggered (Figure 19b). Meanwhile, the response at f5 does exist in the low-floor Y response, which is similar to that under the Tohoku wave, as the low-floor response is controlled by high modes.

3.4. Strain Response

Based on theoretical calculations [26], the fabrication material Q355B steel enters the yielding phase when the strain (ε) exceeds 1690 × 10−6. To investigate the strain responses and stress distribution characteristics of the model structure under seismic excitations of varying intensity levels, strain gauges are placed not only at conventional locations such as the column roots but also within the typical multi-beam zones of the modular steel structure system. The strain rosette (S1-j1) in Figure 10 is used to calculate the principal strain on the joint plate. The calculation is shown in Equation (4) [17]:
ε = ε x + ε y 2 + 2 2 ( ε x ε x y ) 2 + ( ε y ε x y ) 2 ,
where ε represents the principal strain, while ε x , ε y , and ε x y correspond to the measured strains obtained from the three individual strain gauges oriented at different angles.
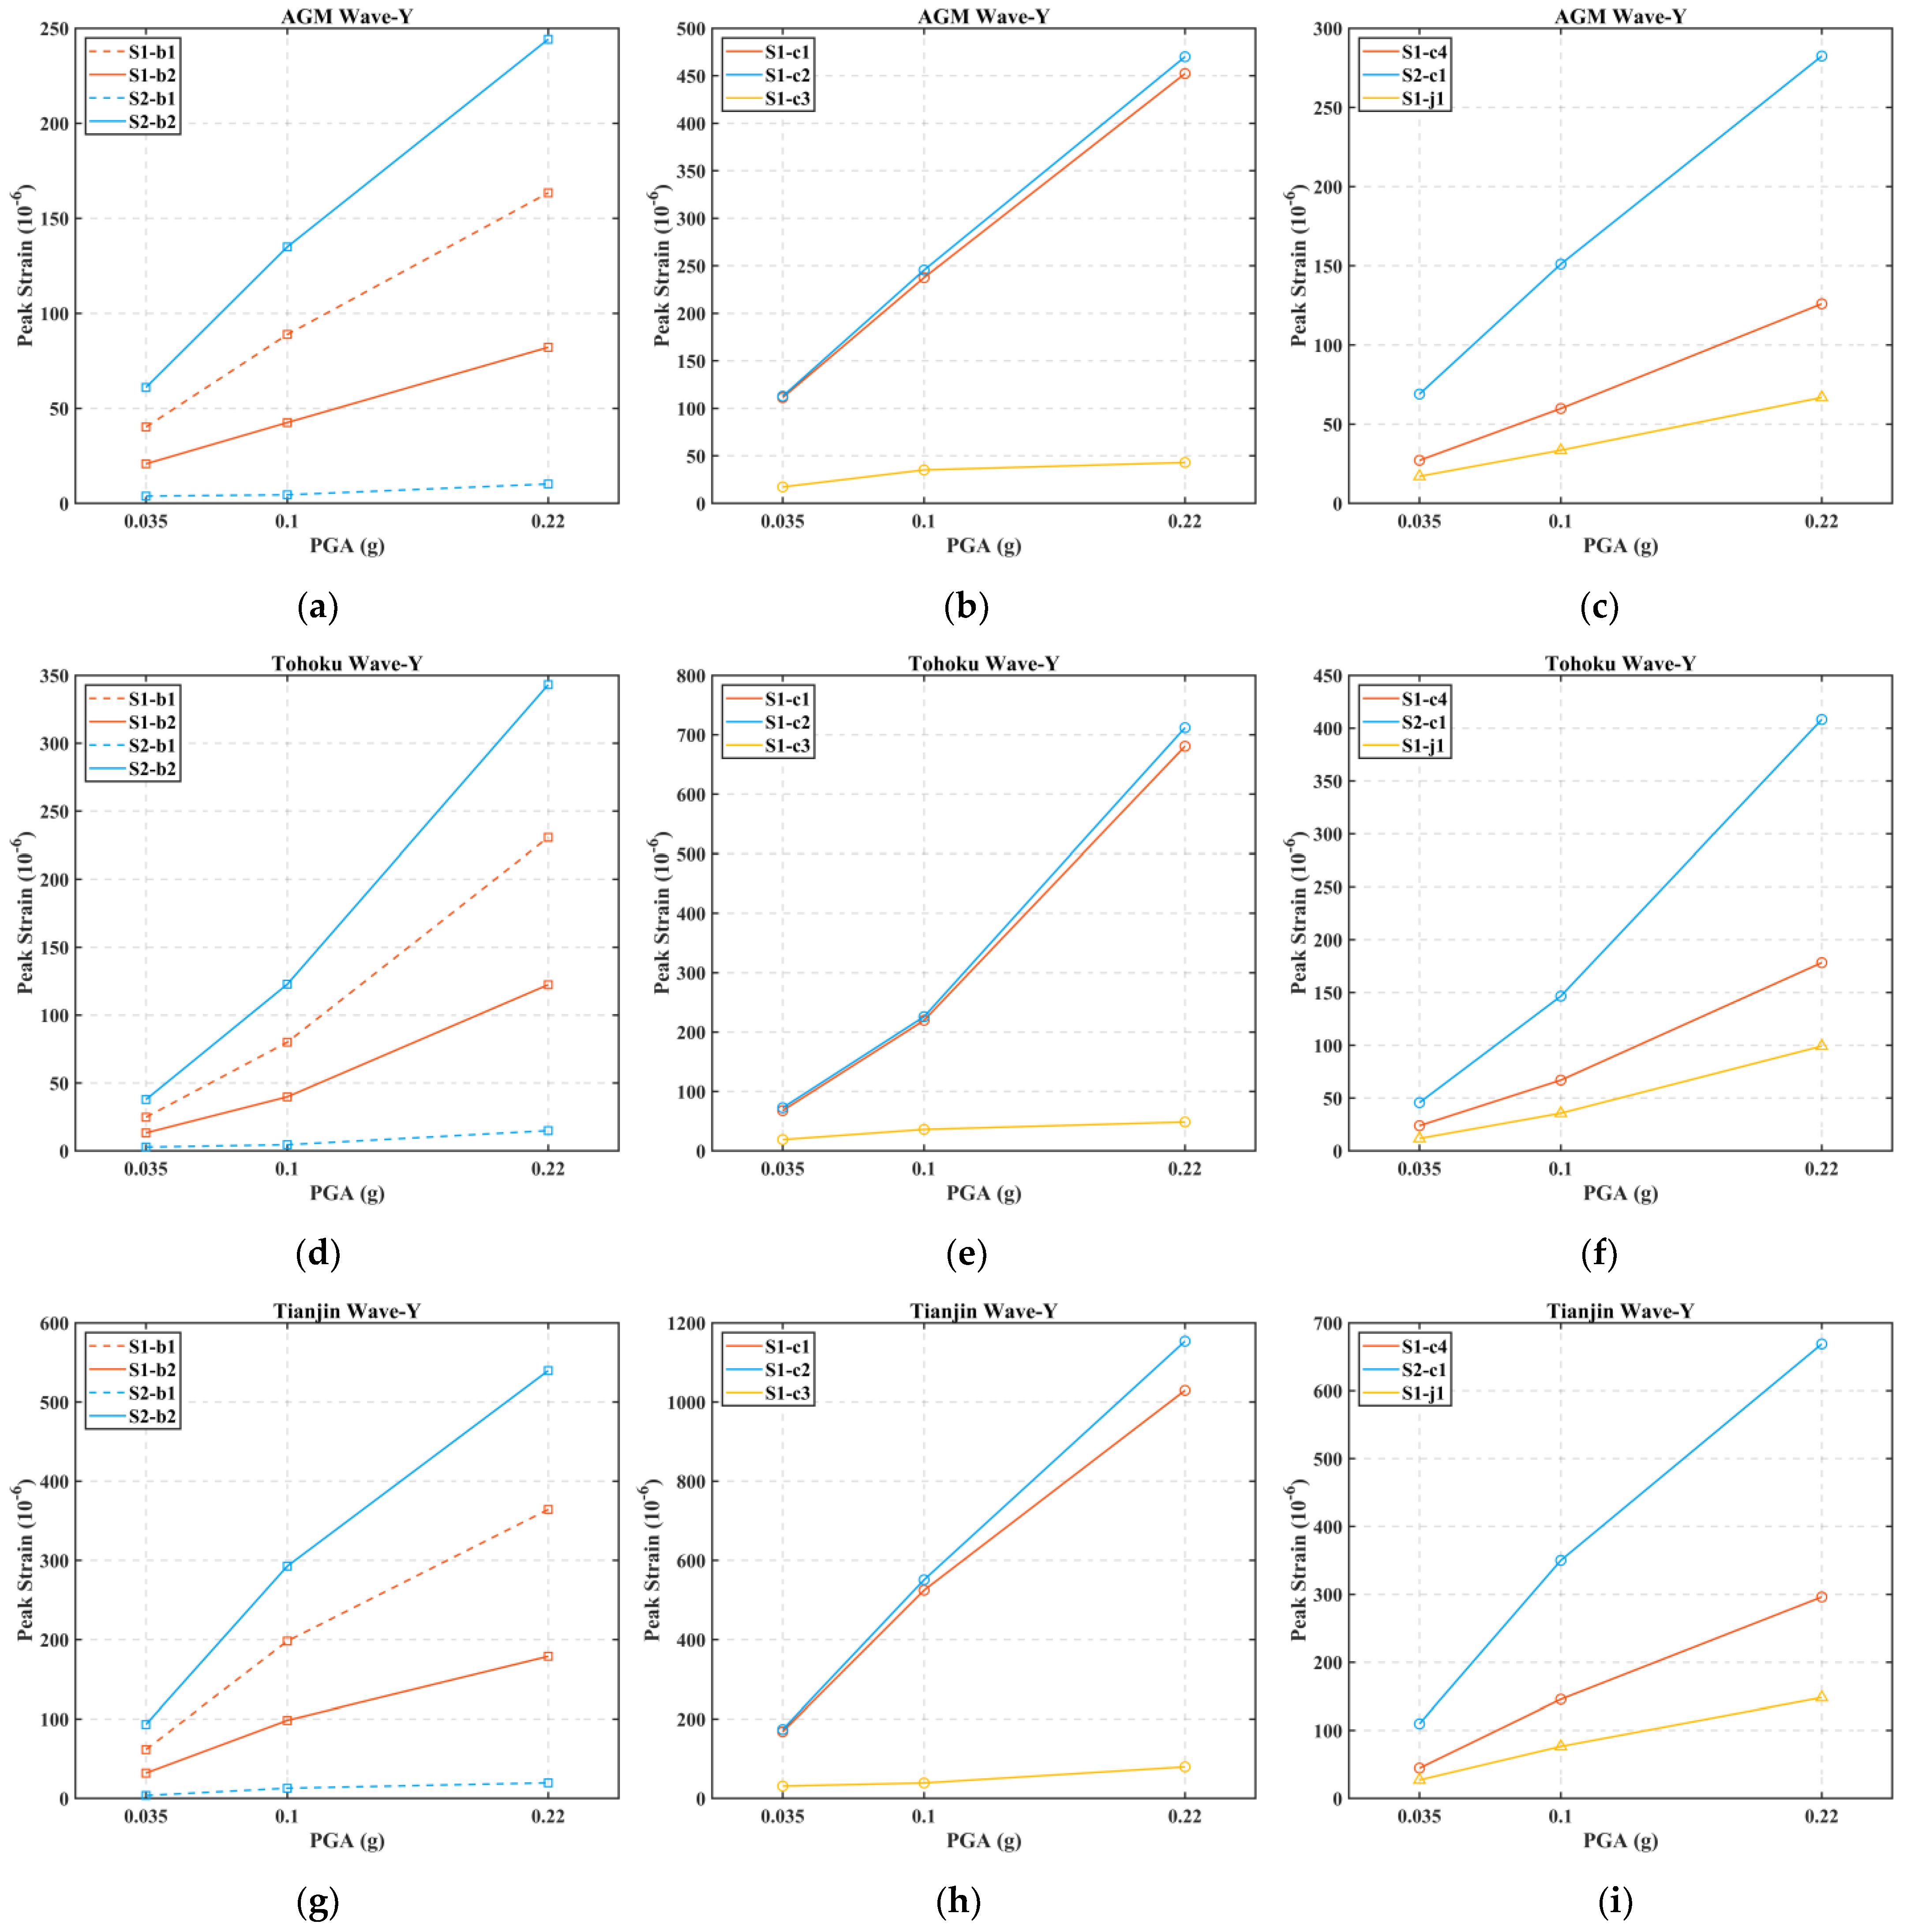
Figure 20 shows the peak strain responses at various locations of the model structure under all intensity levels of Y-directional input. The analysis yields the following observations.
For modular beams, the measured strains corresponding to AGM, Tohoku, and Tianjin waves are illustrated in Figure 20a,d,g. From each subplot, it can be observed that bottom of the floor beam in the upper module unit (S2-b2) > top of the ceiling beam in the lower module unit (S1-b1) > bottom of the ceiling beam in the lower module unit (S1-b2) > top of the floor beam in the upper module unit (S2-b1); the diagram of their arrangement is illustrated in Figure 10. Under the three different types of seismic waves, the peak strain values in the floor beams are 53%, 45%, and 47% higher, respectively. Such a difference indicates that, under seismic excitations, the floor beam in a double-beam system experiences significantly higher strain response than the ceiling beam below it. This phenomenon also reflects the internal force transfer path from the floor beam in the upper module unit to the ceiling beam in the lower module unit. Moreover, the smallest strain observed at the top of the floor beam (S2-b1 in Figure 20a,d,g) can be attributed to its welding connections with the floor slab, which provide additional stiffness and help to distribute the seismic loads.
Figure 20b,e,h compares the strain responses of the bottom edge column (S1-c1) and the bottom corner column (S1-c2) in the modular steel structure; the diagram of their arrangement is illustrated in Figure 10. It is revealed that the peak strain values of both columns are highly consistent with each other across different seismic scenarios, indicating their good collaborative load-sharing behavior. Even though this edge column has a neighboring edge column to share the load, its peak strain value does not significantly fall below that of the corner column. S1-c3 is placed in the other direction of the bottom corner column, and its strain response is significantly smaller, because it is orthogonal to the direction of the seismic waves.
As shown in Figure 20c,f,i, the strains (S1-j1) measured on the joint plate in the connection region are significantly lower than those at other locations (S1-c4 and S2-c1), demonstrating compliance with the seismic design principle of “strong joints and weak members”. The diagram of its arrangement on the joint is also illustrated in Figure 10.
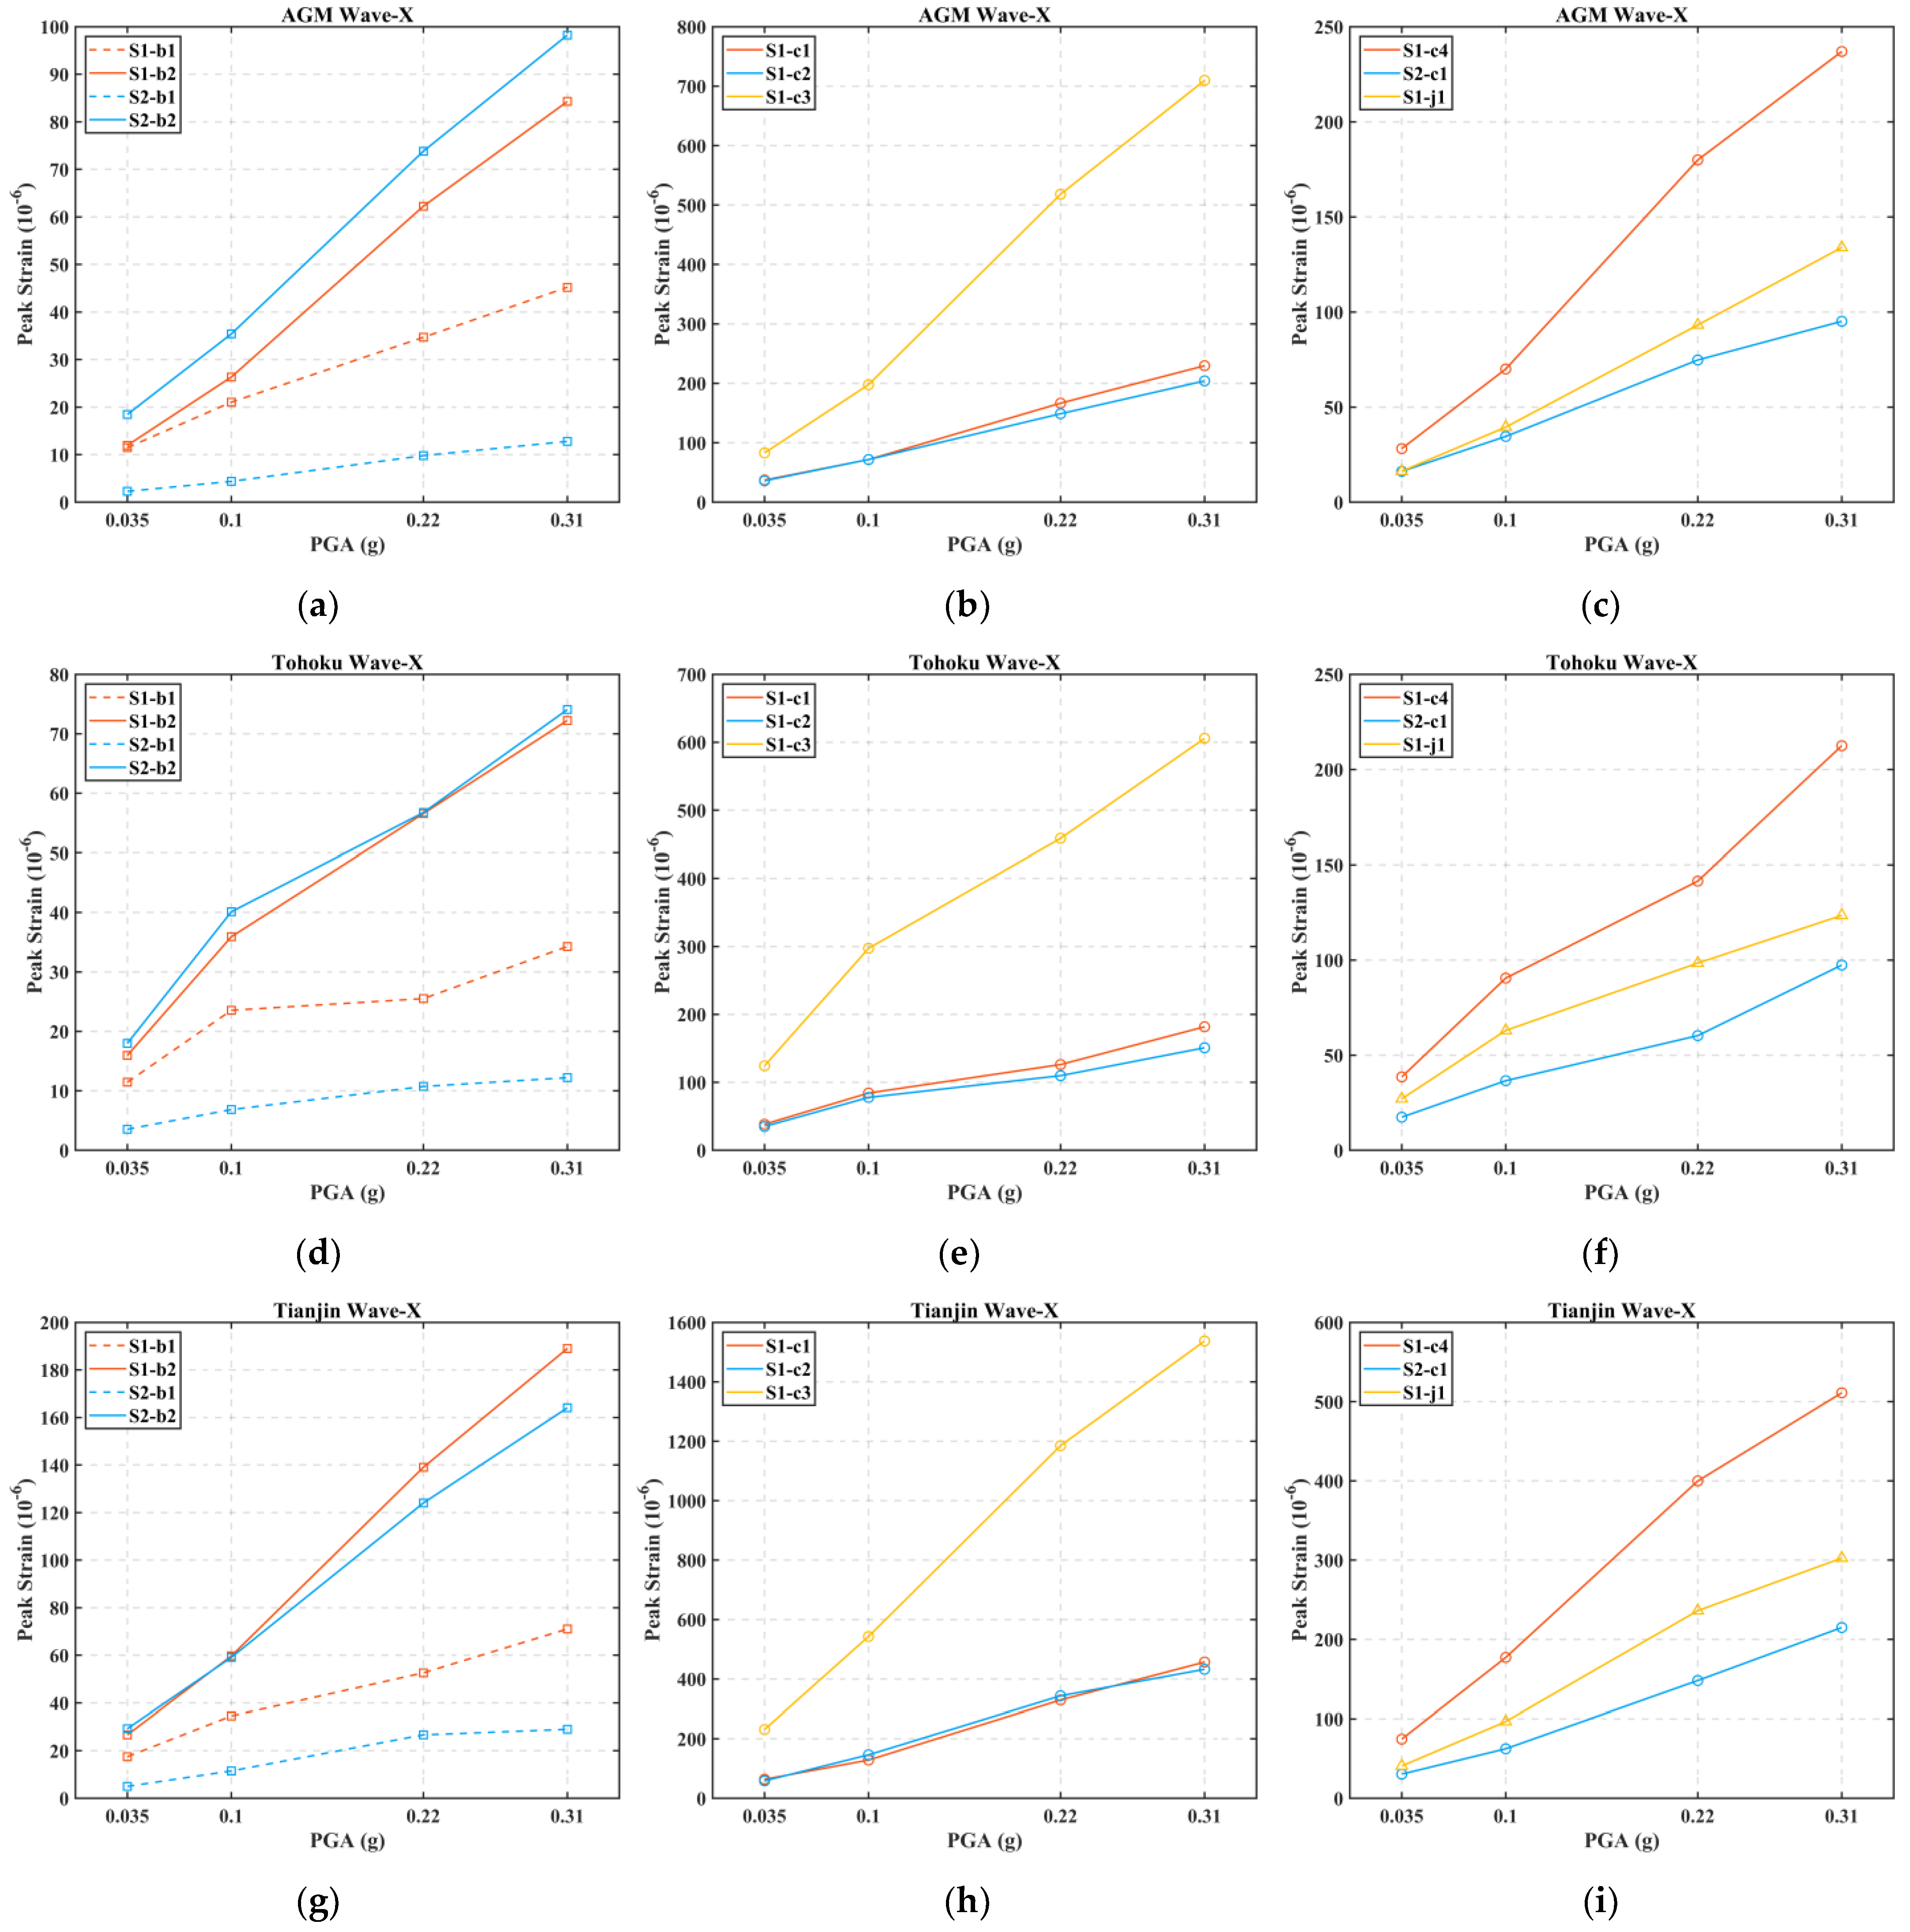
As shown in Figure 21, the peak strain responses at various locations of the model structure under different X-directional seismic inputs are presented. Analysis of the strain responses at the column roots (Figure 21b,e,h) indicates that the directions of seismic waves significantly affect the strain extrema at the structural base. This finding also confirms the rationality of selecting box-shaped sections for the components for the engineering practice, as such sections ensure comparable stiffness along both principal axes to effectively minimize the risk of premature failure along the weak axis due to significant uneven stiffness. A combined analysis of Figure 20 and Figure 21 reveals that the structural strain increases with the escalation of seismic intensity.
Among all test cases throughout the experimental process, the largest strain observed in the double-beam region is 540 × 10−6 (i.e., 113 MPa), occurring at the bottom of the upper module floor beam (S2-b2). The largest strain at the column base reaches 1538 × 10−6 (i.e., 320 MPa), recorded at the base of the bottom corner column (S1-c3). In the connection joint region, the largest strain is 669 × 10−6 (i.e., 140 MPa). All these measured strain values are below the yield strain threshold of 1690 × 10−6. Furthermore, after each test, the model structure is carefully inspected, and no residual deformation is observed, indicating that the structure remains within the elastic stage even after experiencing three MCE7.5 scenarios. Thus, a favorable seismic performance of the structure is affirmed.
Deduced from Figure 20 and Figure 21, under the same seismic intensity level, three seismic waves have distinct influences on the structural strain responses, i.e., Tianjin wave > Tohoku wave > artificial wave. The Tianjin wave poses the greatest threat of structural damage due to its peak frequency being close to the fundamental translational natural frequency (f1 and f2) of the structure. This is of particular interest to the seismic design of modular steel buildings in China.

4. Conclusions

In this study, a series of shaking table tests are conducted to investigate the seismic performance of a seven-story modular steel building. The research primarily focuses on evaluating acceleration amplification effects, the stiffness degradation, and elastic–plastic behavior of the modular steel structure during seismic excitations. The main findings are summarized as follows:
The natural frequencies of the structure exhibit a slight reduction after seismic loading, indicating a minor degree of stiffness degradation. This result confirms that the structure stays within the elastic stage after experiencing three MCE7.5 scenarios.
The acceleration amplification factor increases with floor height. However, this trend is not strictly monotonic. For example, an S-shaped variation is observed in the amplification factor curves between the middle floors. This phenomenon is mainly attributed to the spatial distribution of structural modal shapes and the varying levels of stiffness degradation across different floors, which collectively result in an S-shaped dynamic amplification pattern. Notably, the peak acceleration values at the third and fourth floor slabs are observed comparable to, or even exceed, those at the roof. This observation highlights the importance of carefully controlling the seismic response of mid- and low-rise floors during the seismic design of modular steel buildings.
Under long-duration and high-peak ground excitation, the inter-story deformation and acceleration responses of the lower and middle floors are jointly governed by both low-order and high-order structural modes. In contrast, the acceleration responses at the upper floors are primarily dominated by the structure’s fundamental mode (f1 and f2), as evidenced by a single-peak distribution in Figure 18a. When the predominant frequency of the input ground motion closely matches the fundamental mode natural frequency of the modular building (f1 and f2), the acceleration responses will be significantly amplified.
The structural strain responses increase with rising seismic intensity. The floor beam experiences around 50% higher seismic loads than the ceiling beam below it. The modular columns demonstrate favorable seismic cooperation, with uniform strain distribution. The largest measured strain at the base column footings reaches 1538 × 10−6 throughout the entire test series (i.e., 320 MPa), which remains below the yield strain. The strain levels at the connection joint remain relatively low throughout all loading cases.
The following engineering recommendations for modular steel buildings can be tentatively drawn.
First, the pure modular structure has a more pronounced acceleration response amplification effect than the conventional steel structure does. Therefore, it is recommended that seismic isolation or energy dissipation measures be considered in the design to mitigate the floor acceleration responses of modular buildings.
Second, considering that the seven-story modular steel structure already exhibits significant floor acceleration responses, taller stories may have potential safety risks. It is therefore recommended that mid- to high-rise modular buildings incorporate additional bracing systems or lateral-force-resisting systems to effectively reduce floor acceleration responses.
Third, the current codes tend to underestimate PSA values and inaccurately describe the amplification profile. It is necessary for the pertinent countries to revise the formula in the current codes.
Fourth, it is advised that the columns on the first story and the floor beams on each story be designed with larger sectional stiffness, given that these components are more likely to experience higher seismic loading, but higher construction cost would be incurred.

Author Contributions

Conceptualization, X.Z., X.Y.Z. and Y.N.; methodology, X.Y.Z. and Y.N.; software, Y.N. and X.Y.Z.; validation, X.Z., X.Y.Z. and Y.N.; formal analysis, X.Z. and Y.N.; investigation, K.Q., X.X., M.Z. and Z.Z.; resources, X.Y.Z., X.Z. and Z.Z.; data curation, Y.N.; writing—original draft preparation, X.Z. and Y.N.; writing—review and editing, X.Y.Z. and Y.N.; supervision, X.Y.Z. and Y.N.; project administration, Y.N.; funding acquisition, X.Y.Z., X.Z. and Z.Z. All authors have read and agreed to the published version of the manuscript. X.Z. and Y.N. contributed equally to this paper.

Funding

This research was funded by China Construction Science and Industry Corporation Ltd., and Guangzhou Science and Technology Program (Grant No. 2024B03J1389).

Data Availability Statement

The original contributions presented in this study are included in the article. Further inquiries can be directed to the corresponding author.

Acknowledgments

The authors gratefully acknowledge the Engineering Structure Laboratory at Harbin Institute of Technology, Shenzhen, for providing the experimental site and equipment.

Conflicts of Interest

Author Xinxin Zhang was employed by the Construction Science and Industry Corporation Ltd. The remaining authors declare that the research was conducted in the absence of any commercial or financial relationships that could be construed as a potential conflict of interest.

References

  1. Deng, E.F. Seismic Behavior of Corrugated Steel Plate Shear Wall and Innovative Connection in Integrated Modular Steel Construction. Ph.D. Thesis, Tianjin University, Tianjin, China, 8 June 2018. [Google Scholar]
  2. Deng, E.F.; Wang, Y.H.; Gao, J.D. Numerical study on seismic performance of modular steel structures with FPLC. Structures 2025, 71, 108076. [Google Scholar] [CrossRef]
  3. Qin, J.J.; Tan, P.; Cai, G.J.; Zhou, C.H.; Mi, P.; Tang, M.X.; Zhou, F.L. Seismic performance investigation on simplified modular loading-bearing and energy-dissipating joints for modular steel buildings. Structures 2025, 79, 109409. [Google Scholar] [CrossRef]
  4. Kirkayak, L.; De Souza, V.A.; Suzuki, K.; Ando, H.; Sueoka, H. On the vibrational characteristics of a two-tier scaled container stack. J. Mar. Sci. Technol. 2011, 16, 354–365. [Google Scholar] [CrossRef]
  5. De Souza, V.A.; Kirkayak, L.; Suzuki, K.; Ando, H.; Sueoka, H. Experimental and numerical analysis of container stack dynamics using a scaled model test. Ocean Eng. 2012, 39, 24–42. [Google Scholar] [CrossRef]
  6. Srisangeerthanan, S.; Hashemi, M.J.; Rajeev, P.; Gad, E.; Fernando, S. Numerical study on the effects of diaphragm stiffness and strength on the seismic response of multi-story modular buildings. Eng. Struct. 2018, 163, 25–37. [Google Scholar] [CrossRef]
  7. Wang, Z.; Pan, W. A hybrid coupled wall system with replaceable steel coupling beams for high-rise modular buildings. J. Build. Eng. 2020, 31, 101355. [Google Scholar] [CrossRef]
  8. Shi, F.; Wang, H.; Zong, L.; Ding, Y.; Su, J. Seismic behavior of high-rise modular steel constructions with various module layouts. J. Build. Eng. 2020, 31, 101396. [Google Scholar] [CrossRef]
  9. Sanches, R.; Tao, J.; Fathieh, A.; Mercan, O. Investigation of the seismic performance of braced low-, mid- and high-rise modular steel building prototypes. Eng. Struct. 2021, 234, 111986. [Google Scholar] [CrossRef]
  10. GB 50017-2017; Standard for design of steel structures. Ministry of Housing and Urban-Rural Development of the People’s Republic of China: Beijing, China, 2017.
  11. GB 50017-2010; Code for Seismic Design of Buildings. Ministry of Housing and Urban-Rural Development of the People’s Republic of China: Beijing, China, 2016.
  12. GB 50009-2012; Load Code for the Design of Building Structures. Ministry of Housing and Urban-Rural Development of the People’s Republic of China: Beijing, China, 2012.
  13. GB/T 50018-2025; Technical Standard of Cold-Formed Steel Structures. Ministry of Housing and Urban-Rural Development of the People’s Republic of China: Beijing, China, 2025.
  14. SJG 129-2023; Technical Specification for Steel Modular Buildings. Housing and Construction Bureau of Shenzhen Municipality: Shenzhen, China, 2023.
  15. Zheng, X.Y.; Li, H.; Rong, W.; Li, W. Joint earthquake and wave action on the monopile wind turbine foundation: An experimental study. Mar. Struct. 2015, 44, 125–141. [Google Scholar] [CrossRef]
  16. Chi, S.C.; Lin, S.S. Validation of similitude laws for dynamic structural model test. World Earthq. Eng. 2004, 20, 10. [Google Scholar]
  17. Feng, L.Q.; Li, F.; Niu, C.L.; Wei, H.L.; Ji, S.Y.; Yang, P.; Wang, G.J. Design and shaking table test of a ten-storey building with steel plate shear walls partially connected to columns. J. Build. Eng. 2022, 49, 103982. [Google Scholar] [CrossRef]
  18. Li, Z.Y. Shaking Table Test and Finite Element Optimization of Steel Frame Bent Structure with Buckling Restrained Brace. Master’s Thesis, Beijing University of Technology, Beijing, China, 22 June 2022. [Google Scholar]
  19. Zhang, A.L.; Xie, Z.Q.; Zhang, Y.X.; Lin, H.P. Shaking table test of a prefabricated steel frame structure with all-bolted connections. Eng. Struct. 2021, 248, 113273. [Google Scholar] [CrossRef]
  20. Wu, F.W.; Li, Y.Q. Large-scale shaking table tests of a six-story floor-by-floor assembled CFS frame-framing shear wall structure. Eng. Struct. 2023, 293, 116608. [Google Scholar] [CrossRef]
  21. Zhou, X.; Yao, X.; Xu, L.; Shi, Y.; Ke, K.; Liu, L. Shake table tests on a full-scale six-storey cold-formed thin-walled steel-steel plate shear wall structure. Thin-Walled Struct. 2022, 181, 110009. [Google Scholar] [CrossRef]
  22. Shang, Q.X.; Zheng, J.Y.; Li, J.C.; Wang, T. Comparative study of relevant specifications on peak floor acceleration in current codes of different countries. Eng. Mech. 2020, 37, 91–96. [Google Scholar]
  23. Huang, B.; Hua, X.; Lu, W.; Zhang, Q. Floor acceleration amplification factor in the instrumented buildings under historical earth-quake excitations. China Civ. Eng. J. 2020, 53, 16–27. [Google Scholar]
  24. JGJ 339-2015; Code for Seismic Design of Non-Structural Components. Ministry of Housing and Urban-Rural Development of the People’s Republic of China: Beijing, China, 2015.
  25. Yu, H.; Zhang, W.; Zhang, Y.; Sun, Y. Shaking table test and numerical analysis of a 1:12 scale model of a special concentrically braced steel frame with pinned connections. Earthq. Eng. Eng. Vib. 2010, 9, 51–63. [Google Scholar] [CrossRef]
  26. Zhang, Y.X.; Wu, B.L.; Zhang, A.L.; Li, Y.L.; Zhang, H.; Xiao, C.Y. Shaking table test and structural dynamic analysis for resilient steel frames with seismically isolated floor under bi-directional seismic action. J. Build. Struct. 2025, 46, 30–50. [Google Scholar]
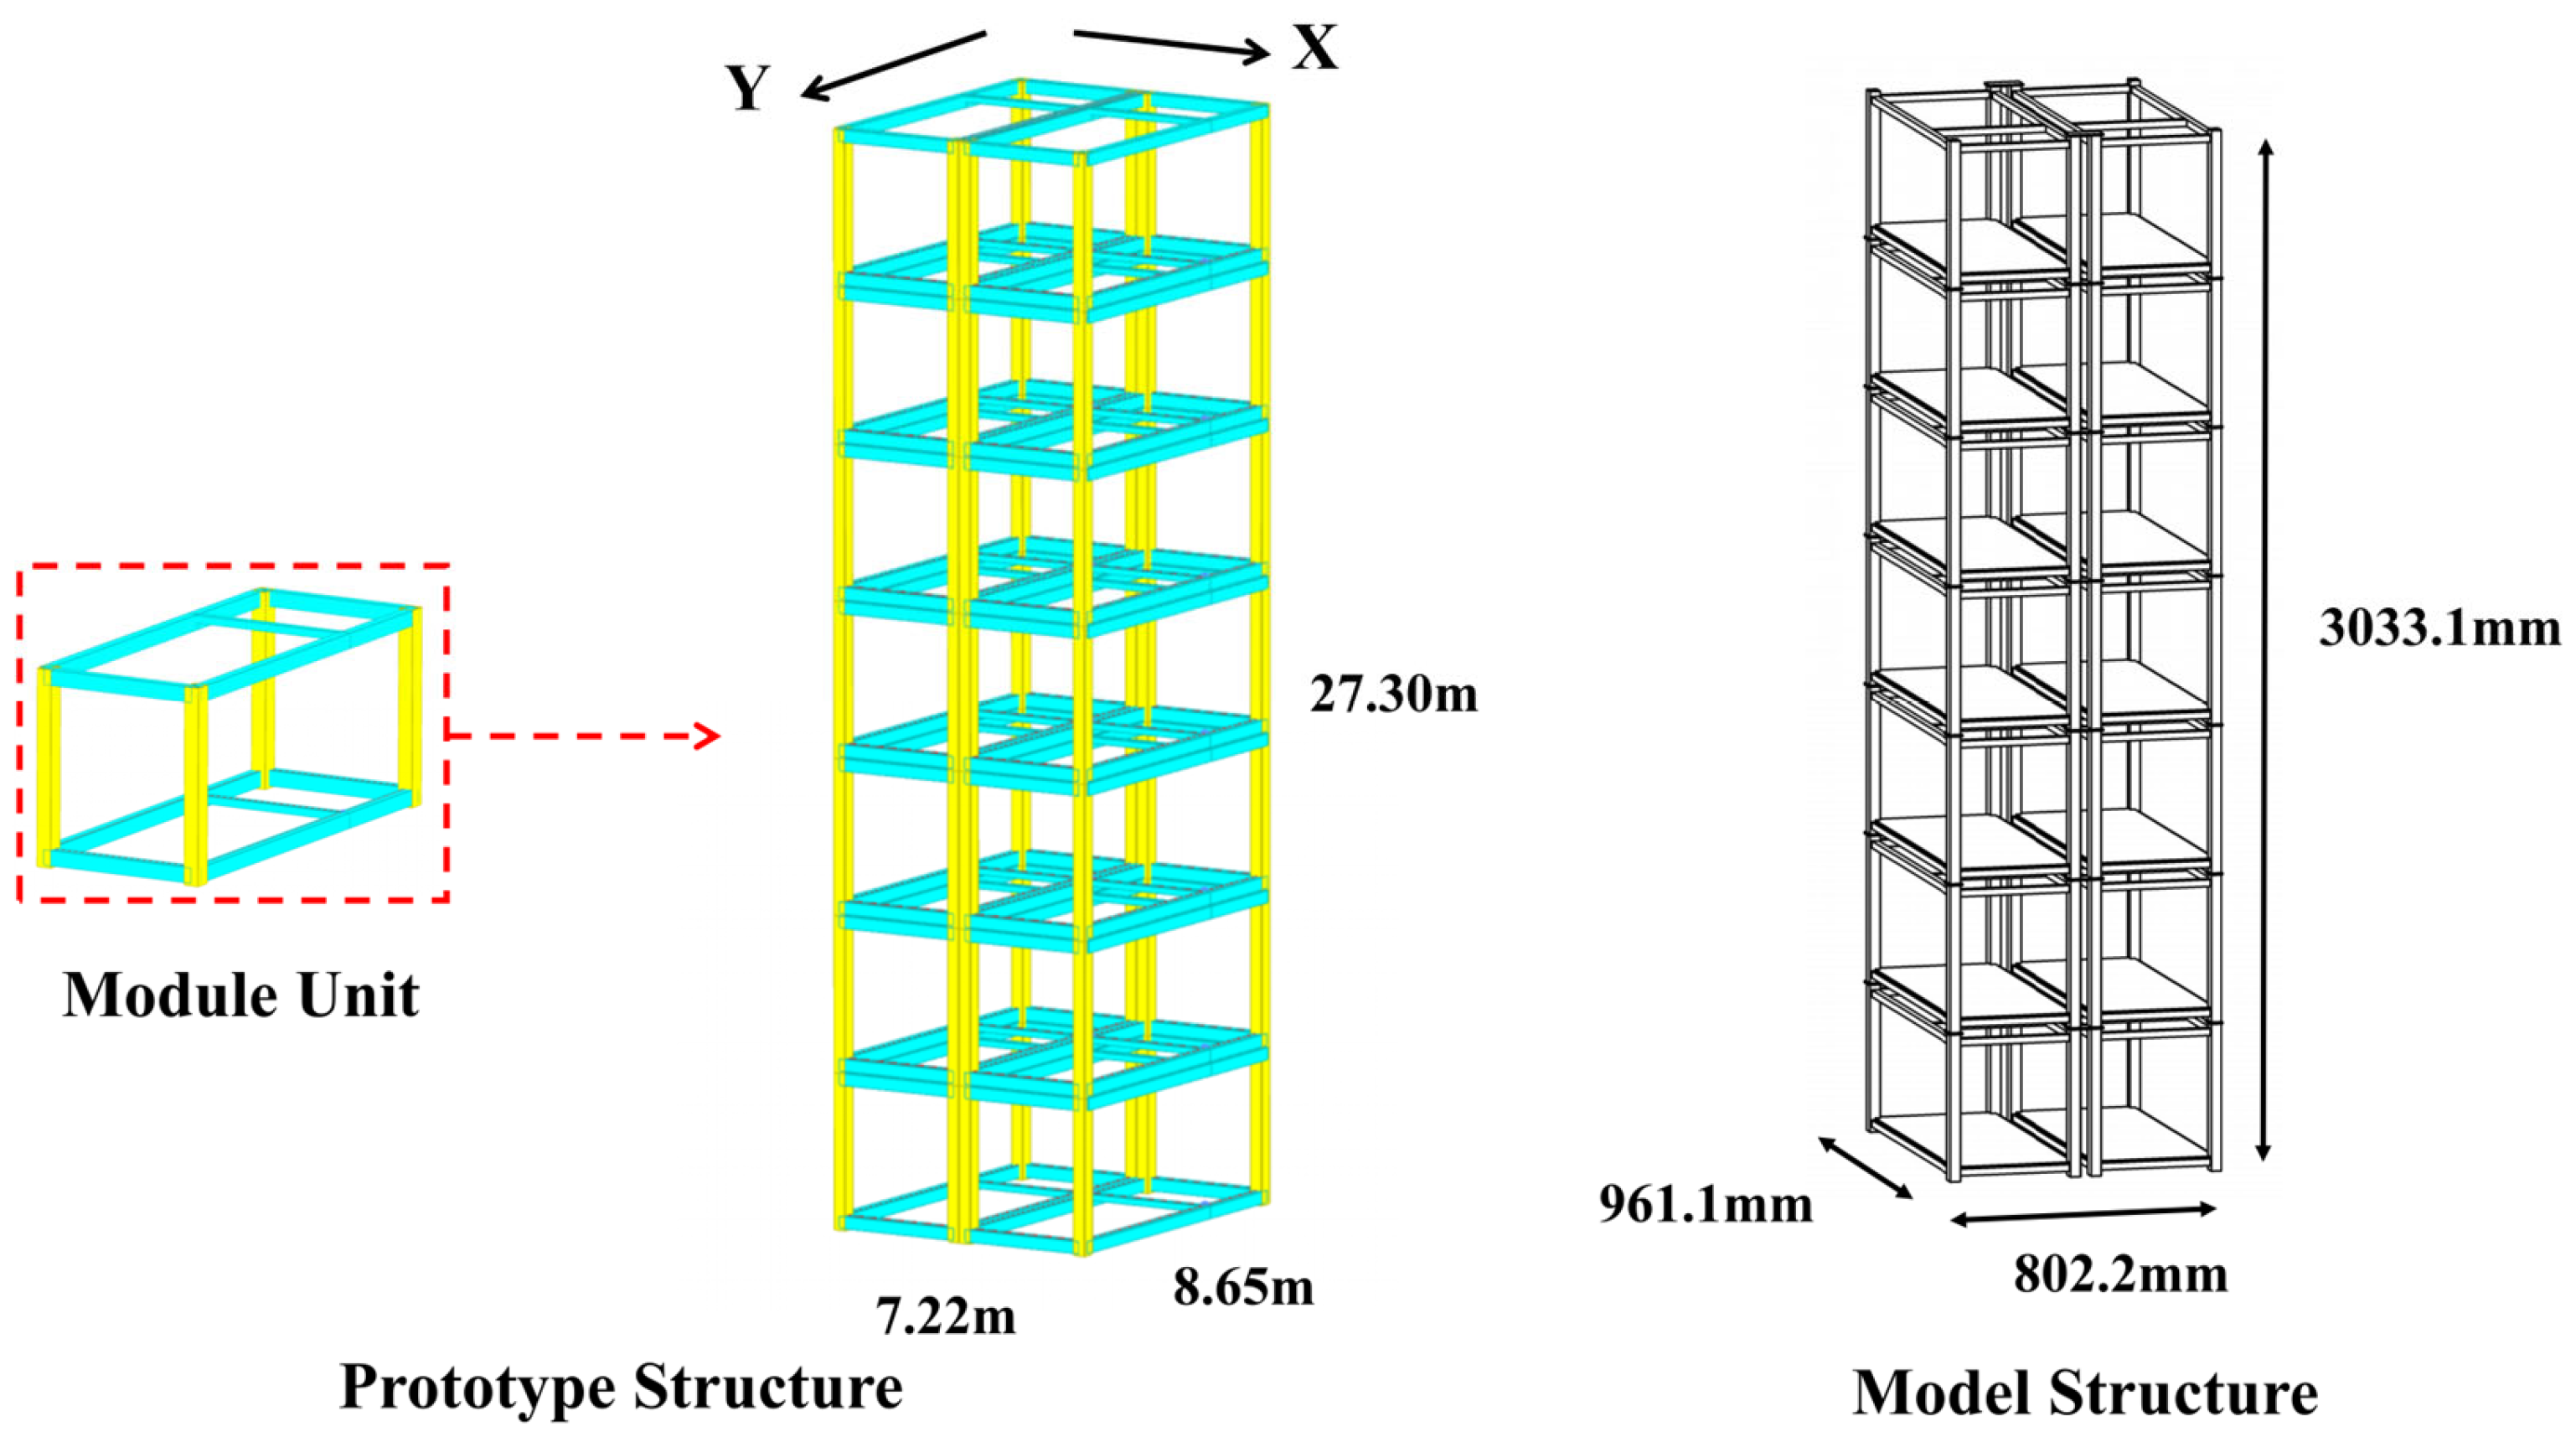
Figure 1. Illustration of the prototype and model.
Buildings 15 02661 g001
Figure 2. Diagram of the mode shapes.
Buildings 15 02661 g002
Figure 3. Diagram of a module unit.
Buildings 15 02661 g003
Figure 4. Diagram of the inter-module connections.
Buildings 15 02661 g004
Figure 5. Diagram of a corner connection (unit: mm).
Buildings 15 02661 g005
Figure 6. Diagram of an edge connection (unit: mm).
Buildings 15 02661 g006
Figure 7. Diagram of the model base.
Buildings 15 02661 g007
Figure 8. The model on the shaking table.
Buildings 15 02661 g008
Figure 9. Accelerometer arrangement diagram: (a) layout of the sensor arrangement for seismic waves along the X-axis; (b) layout of the sensor arrangement for seismic waves along the Y-axis.
Buildings 15 02661 g009
Figure 10. Strain gauges arrangement diagram.
Buildings 15 02661 g010
Figure 11. The time histories and power spectra of the original seismic waves: (a) Tianjin wave time history; (b) Tianjin wave power spectrum; (c) Tohoku wave time history; (d) Tohoku wave power spectrum; (e) AGM wave time history; (f) AGM wave power spectrum.
Buildings 15 02661 g011
Figure 12. Transfer functions derived from the modal analysis of white noise (WN-X1): (a) A7-floor-X; (b) A7-floor-Y; (c) A4-floor-X; (d) A4-floor-Y; (e) A1-ceiling-X; (f) A1-ceiling-Y.
Buildings 15 02661 g012aBuildings 15 02661 g012b
Figure 13. Transfer functions derived from the modal analysis of white noise (WN-X2): (a) A7-floor-X; (b) A7-floor-Y; (c) A4-floor-X; (d) A4-floor-Y; (e) A1-ceiling-X; (f) A1-ceiling-Y.
Buildings 15 02661 g013
Figure 14. The acceleration amplification factor under FOE7: (a) input along the X-axis; (b) input along the Y-axis.
Buildings 15 02661 g014
Figure 15. The acceleration amplification factor under DBE7: (a) input along the X-axis; (b) input along the Y-axis.
Buildings 15 02661 g015
Figure 16. The acceleration amplification factor under MCE7: (a) input along the X-axis; (b) input along the Y-axis.
Buildings 15 02661 g016
Figure 17. The acceleration amplification factor under MCE7.5.
Buildings 15 02661 g017
Figure 18. Spectra of acceleration response under X-directional input of the MCE7.5 Tohoku Wave: (a) sensors positioned along the X-direction; (b) sensors positioned along the Y-direction.
Buildings 15 02661 g018
Figure 19. Spectra of acceleration response under X-directional input of the MCE7.5 Tianjin Wave: (a) sensors positioned along the X-direction; (b) sensors positioned along the Y-direction.
Buildings 15 02661 g019
Figure 20. Strain responses of the structure under Y-directional seismic inputs: (a) beam region under AGM wave; (b) column region under AGM wave; (c) joint region under AGM wave; (d) beam region under Tohoku wave; (e) column region under Tohoku wave; (f) joint region under Tohoku wave; (g) beam region under Tianjin wave; (h) column region under Tianjin wave; (i) joint region under Tianjin wave.
Buildings 15 02661 g020
Figure 21. Strain responses of the structure under X-directional seismic inputs: (a) beam region under AGM wave; (b) column region under AGM wave; (c) joint region under AGM wave; (d) beam region under Tohoku wave; (e) column region under Tohoku wave; (f) joint region under Tohoku wave; (g) beam region under Tianjin wave; (h) column region under Tianjin wave; (i) joint region under Tianjin wave.
Buildings 15 02661 g021
Table 1. Prototype and model cross-sectional dimensions (unit: mm).
Component TypePrototype SectionModel Section
ColumnBox-shaped 250 × 450 × 16Box-shaped 30 × 40 × 2.0
Main beam-YBox-shaped 200 × 250 × 10Box-shaped 20 × 20 × 2.0
Main beam-XBox-shaped 200 × 200 × 10Box-shaped 20 × 20 × 2.0
Secondary beamBox-shaped 150 × 200 × 10Box-shaped 20 × 20 × 1.2
Table 2. Analysis of the natural frequencies of the prototype structure.
ModeNatural Frequency (Hz)Mode Shape
Mode 10.848Translation along the Y-axis
Mode 20.873Translation along the X-axis
Mode 31.117Torsion around the Z-axis
Mode 42.691Translation along the X-axis
Mode 52.833Translation along the Y-axis
Table 3. Similitude relationships and scale factors.
Physical ParameterRelationshipScale Factor
Length λ L 1/9
Mass density λ ρ = λ σ / ( λ a λ L ) 9
Elastic modulus λ E = λ σ 1
Poisson’s ratio λ ς 1
Stress λ σ 1
Mass λ m = λ σ λ L 2 1/81
Time λ t = λ L 0.5 1/3
Frequency λ f = λ L 0.5 3
Displacement λ x = λ L 1/9
Velocity λ v = λ L 0.5 1/3
Acceleration λ a 1
Table 4. IEPE accelerometer specifications.
TypeSensitivity
(mv/g)
Amplitude Range
(g)
Frequency Range
(Hz)
AI-050500100.2–2500
AI-100100050.2–2000
AI-500500010.2–2000
CA-YD-188T500100.6–5000
Table 5. Strain gauge and strain rosettes specifications.
TypeResistance
(Ω)
Coefficient of SensitivityLimiting Strain
(μm/m)
BMB120-5AA120 ± 0.52.11 ± 1%20,000
BMB120-3CA120 ± 0.52.11 ± 1%20,000
Table 6. Specifications of the shaking table.
TypeSpecificationTypeSpecification
Shaking directionUnidirectional horizontalOperating frequency0.1–50 Hz
Table size3 m × 3 mDriving methodElectro-hydraulic
Load-bearing capacity15 tMax displacement150 mm
Overturning moment45 t × mFull load acceleration1.5 g
Table 7. The selected original seismic waves.
NameNationMagnitudeDurationTime
Interval
Peak
Frequency
PGA
TianjinChina6.919.19 s0.01 s0.73 Hz0.106 g
TohokuJapan9.0300.00 s0.01 s2.76 Hz0.352 g
AGM--20.00 s0.02 s3.20 Hz0.102 g
Table 8. Seismic waves in the model test.
NameEffective DurationEntire
Duration
Time
Interval
Peak
Frequency
Tianjin6.40 s10.0 s0.001 s2.19 Hz
Tohoku100.00 s100.0 s0.001 s8.28 Hz
AGM6.67 s10.0 s0.001 s9.60 Hz
Table 9. Loading scheme of the shaking table test.
SequenceLoading
Label
Seismic
Wave
Input
Direction
IntensityPGA (g)
1WN-X1White NoiseX--
2AGM-FOE7-XAGMXFOE70.035
3THK-FOE7-XTohokuXFOE70.035
4TJ-FOE7-XTianjinXFOE70.035
5AGM-DBE7-XAGMXDBE70.1
6THK-DBE7-XTohokuXDBE70.1
7TJ-DBE7-XTianjinXDBE70.1
8AGM-FOE7-YAGMYFOE70.035
9THK-FOE7-YTohokuYFOE70.035
10TJ-FOE7-YTianjinYFOE70.035
11AGM-DBE7-YAGMYDBE70.1
12THK-DBE7-YTohokuYDBE70.1
13TJ-DBE7-YTianjinYDBE70.1
14AGM-MCE7-YAGMYMCE70.22
15THK-MCE7-YTohokuYMCE70.22
16TJ-MCE7-YTianjinYMCE70.22
17AGM-MCE7-XAGMXMCE70.22
18THK-MCE7-XTohokuXMCE70.22
19TJ-MCE7-XTianjinXMCE70.22
20AGM-MCE7.5-XAGMXMCE7.50.31
21THK-MCE7.5-XTohokuXMCE7.50.31
22TJ-MCE7.5-XTianjinXMCE7.50.31
23WN-X2White NoiseX--
Table 10. Intact mode shapes and corresponding natural frequencies of the test model.
Natural
Frequency
Mode ShapeDesign ValueMeasured ValueError
Mode 1: f1Translation along the Y-axis2.544 Hz2.539 Hz0.20%
Mode 2: f2Translation along the X-axis2.619 Hz2.600 Hz0.73%
Mode 3: f3Torsion around the Z-axis3.351 Hz4.563 Hz26.56%
Mode 4: f4Translation along the X-axis8.073 Hz8.603 Hz6.16%
Mode 5: f5Translation along the Y-axis8.499 Hz8.701 Hz2.32%
Table 11. Comparison of natural frequencies before and after the tests.
Natural
Frequency
Mode ShapeBefore the TestsAfter the TestsReduction
Mode 1: f1Translation along the Y-axis2.539 Hz2.440 Hz3.90%
Mode 2: f2Translation along the X-axis2.600 Hz2.508 Hz3.54%
Mode 3: f3Torsion around the Z-axis4.563 Hz4.423 Hz3.07%
Mode 4: f4Translation along the X-axis8.603 Hz8.440 Hz1.89%
Mode 5: f5Translation along the Y-axis8.701 Hz8.538 Hz1.87%
Table 12. The acceleration amplification factor of the X-direction accelerometers.
Seismic WaveA1-CeilingA2-FloorA3-FloorA4-FloorA5-FloorA6-FloorA6-CeilingA7-FloorA7-Ceiling
Formula of code:
β = 1 + Z/h
1.141.161.301.441.581.731.851.872.00
FOE7-XAGM1.711.842.142.722.472.033.433.623.93
THK3.884.323.976.834.753.885.615.916.62
TJ1.601.833.284.004.284.154.925.095.30
FOE7-YAGM0.53 0.56 0.81 0.83 0.78 0.48 0.78 0.80 0.92
THK1.10 1.22 2.04 1.44 1.55 0.96 1.52 1.64 1.89
TJ0.54 0.62 1.13 1.19 0.80 0.77 1.23 1.22 1.36
DBE7-XAGM1.35 1.47 1.90 2.34 1.93 1.88 2.91 3.04 3.26
THK3.17 3.26 3.38 5.40 3.88 3.08 4.16 4.31 5.10
TJ1.20 1.35 2.68 3.47 3.53 3.37 4.19 4.31 4.52
DBE7-YAGM0.73 0.71 0.83 0.58 0.90 0.50 0.68 0.75 0.95
THK1.35 1.46 2.06 1.34 1.66 1.14 1.19 1.26 1.56
TJ0.44 0.46 0.82 0.71 0.62 0.44 0.70 0.66 0.75
MCE7-XAGM1.18 1.25 2.25 1.69 1.59 1.69 2.02 2.07 2.41
THK2.29 2.52 2.75 3.44 2.32 2.18 2.41 2.51 3.16
TJ1.47 1.69 4.61 3.05 3.68 3.69 4.25 4.34 4.69
MCE7-YAGM0.74 0.85 1.04 0.51 0.66 0.57 0.42 0.49 0.76
THK1.88 2.09 2.58 1.50 1.75 1.58 0.92 1.05 2.03
TJ0.65 0.67 1.70 0.71 0.63 0.58 0.47 0.44 0.98
MCE7.5-XAGM1.24 1.34 3.23 1.84 1.62 1.61 2.17 2.31 3.11
THK2.07 2.30 2.90 2.75 1.95 2.42 1.96 2.09 2.80
TJ1.54 1.77 2.82 2.65 3.38 3.32 3.64 3.73 4.00
Table 13. The acceleration amplification factor of the Y-direction accelerometers.
Seismic WaveA1-CeilingA2-FloorA3-FloorA4-FloorA5-FloorA6-FloorA6-CeilingA7-FloorA7-Ceiling
Formula of code:
β = 1 + Z/h
1.141.161.301.441.581.731.851.872.00
FOE7-XAGM0.420.490.910.890.600.490.951.041.32
THK0.660.670.940.950.680.490.901.011.61
TJ0.670.480.840.900.670.610.951.051.28
FOE7-YAGM2.152.172.342.462.522.423.163.334.10
THK3.38 3.71 4.63 3.44 3.73 2.80 4.02 4.56 7.45
TJ1.48 1.65 2.82 3.19 3.64 4.00 5.06 5.23 6.18
DBE7-XAGM0.30 0.34 0.55 0.54 0.43 0.35 0.63 0.69 0.87
THK0.57 0.62 0.78 0.66 0.64 0.45 0.62 0.74 1.23
TJ0.71 0.31 0.56 0.59 0.51 0.46 0.71 0.74 0.89
DBE7-YAGM2.57 2.67 2.13 2.39 1.97 2.03 2.44 2.51 3.97
THK2.91 3.32 3.36 2.45 3.02 3.18 3.35 3.64 5.81
TJ1.53 1.67 2.78 3.17 3.71 4.32 5.34 5.49 6.29
MCE7-XAGM0.41 0.33 0.46 0.29 0.21 0.26 0.31 0.34 0.50
THK0.73 0.84 0.74 0.50 0.49 0.32 0.57 0.63 1.11
TJ0.87 0.35 0.77 0.38 0.29 0.53 0.87 0.39 0.65
MCE7-YAGM2.08 2.13 1.81 1.90 1.70 1.79 2.26 2.34 2.92
THK3.94 3.40 7.56 2.94 2.58 3.04 2.73 3.10 4.87
TJ1.38 1.50 2.71 2.53 3.38 3.71 3.90 4.00 5.17
MCE7.5-XAGM0.84 0.48 0.52 0.31 0.22 0.36 0.36 0.32 0.58
THK1.64 1.25 0.74 0.43 0.37 0.26 0.43 0.46 0.97
TJ1.00 0.42 0.59 0.23 0.20 0.55 0.66 0.28 0.53
Table 14. Comparison of the modular steel structure and the conventional steel structure.
AAFModular Steel
Structure
Conventional Steel StructureDifference
Second floor1.671.4019.3%
Third floor2.781.24124.2%
Fourth floor3.171.30143.8%
Fifth floor3.711.9095.3%
Sixth floor4.322.3782.2%
Seventh floor5.493.4260.5%
Disclaimer/Publisher’s Note: The statements, opinions and data contained in all publications are solely those of the individual author(s) and contributor(s) and not of MDPI and/or the editor(s). MDPI and/or the editor(s) disclaim responsibility for any injury to people or property resulting from any ideas, methods, instructions or products referred to in the content.