Article

Crack Development in Compacted Loess Subjected to Wet–Dry Cycles: Experimental Observations and Numerical Modeling

1
Shaanxi Key Laboratory of Safety and Durability of Concrete Structures, Xijing University, Xi’an 710123, China
2
State Key Laboratory of Coastal and Offshore Engineering, Dalian University of Technology, Dalian 116024, China
*
Author to whom correspondence should be addressed.
Buildings 2025, 15(15), 2625; https://doi.org/10.3390/buildings15152625
Submission received: 30 June 2025 / Revised: 19 July 2025 / Accepted: 21 July 2025 / Published: 24 July 2025
(This article belongs to the Special Issue Research on Building Foundations and Underground Engineering)

Abstract

Loess, a typical soil widely distributed in China, exhibits engineering properties that are highly sensitive to environmental changes, leading to increased erosion and the development of surface cracks. This article examines the influence of initial moisture content, dry density, and thickness on crack formation in compacted loess subjected to wet–dry cycles, using both laboratory experiments and numerical simulation analysis. It quantitatively analyzes the process of crack evolution using digital image processing technology. The experimental results indicate that wet–dry cycles can cause cumulative damage to the soil, significantly encouraging the initiation and expansion of secondary cracks. New cracks often branch out and extend along the existing crack network, demonstrating that the initial crack morphology has a controlling effect over the final crack distribution pattern. Numerical simulations based on MultiFracS software further revealed that soil samples with a thickness of 0.5 cm exhibited more pronounced surface cracking characteristics than those with a thickness of 2 cm, with thinner layers of soil tending to form a more complex network of cracks. The simulation results align closely with the indoor test data, confirming the reliability of the established model in predicting fracture dynamics. The study provides theoretical underpinnings and practical guidance for evaluating the stability of engineering slopes and for managing and mitigating fissure hazards in loess.

1. Introduction

Shrinkage and cracking behavior have been observed in soil during dehydration, and drying is a common occurrence in nature [1], which has significant impacts on fields such as geological engineering, agricultural ecology, and environmental science. As water evaporates, the water pressure within pores between soil particles reduces and the matric suction increases, leading to an increase in effective stress between particles and causing volume shrinkage [2,3]. When the contraction stress is unevenly distributed in space, stress concentration will form within the soil, ultimately resulting in a multi-scale crack network on the surface. The formation of such cracks not only significantly changes the seepage characteristics of the soil, such as permeability and water-holding capacity, but also hurts the soil’s mechanical strength, thereby affecting slope stability, pollutant migration, and crop root development [4,5]. Based on this phenomenon, researchers both domestically and internationally have conducted numerous studies on the mechanism of soil cracking and its suppression technologies. Through digital image technology and microstructure, they aim to reveal the formation laws of cracks and explore effective prevention and control strategies [6,7,8,9,10,11].
Yue et al. [12] investigated the effects of initial water content and soil thickness on crack development through dry shrinkage and freeze–thaw coupling experiments, which were combined with digital image processing and microstructure analysis. Research has found that volume shrinkage caused by water evaporation is the dominant factor in crack formation. At the same time, thinner soil layers are more prone to significant surface cracking due to their lower strength. Tang et al. [13] conducted a systematic observation of the initiation and propagation process of soil cracks through indoor drying shrinkage tests and digital image analysis methods. Research has shown that initial cracks typically occur at the bottom or edge of the specimen, gradually extending and intersecting with one another, ultimately forming an approximately square mesh crack pattern. Zhou et al. [14] demonstrated that the crack development in expansive soil undergoes two stages, rapid expansion and stability, during seven wet–dry cycles. As the fracture ratio rises, the cohesive force of the soil continues to decrease, and a linear correlation exists between the crack rate and the angle of shear resistance. The formation of crack networks significantly weakens the structural strength of soil. Xie et al. [15] studied the effect of changes in water content on the evolution characteristics of cracks in red clay through experiments. They analyzed the intrinsic correlation of soil cracking behavior, shrinkage characteristics, and strength parameters. The research results indicate that as the fracture network develops, the total volume shrinkage rate exhibited by the soil shows a declining tendency. Additionally, the study developed a quantitative model based on the crack rate, which effectively characterizes the changes in the shear resistance angle and soil binding strength. Zhao et al. [16] investigated the impact of freeze–thaw cycles on the physical and mechanical properties of red sandstone using uniaxial compression and cyclic loading tests. The results show that with an increase in freeze–thaw cycles, microcracks inside the rock continue to expand and penetrate, leading to a gradual loosening of its internal structure and exhibiting brittle deterioration characteristics, which are manifested macroscopically as a significant decrease in mechanical parameters, such as compressive strength and elastic modulus [16].
Some researchers have employed numerical simulation methods to simulate and analyze the process of soil cracking, establishing a two-dimensional moisture migration continuum model to replicate the behavior of soil drying and cracking. These studies used the FEM approach or the finite DEM technique coupling method to systematically investigate the shrinkage deformation and cracking mechanism of soil under dry conditions. The computational modeling outcomes have good consistency with existing test results, effectively verifying the reliability of the established model [17,18,19]. Yu et al. [20,21,22] established a discrete element model for rock freeze–thaw damage based on the results of freeze–thaw damage tests on water-saturated rocks. This model can effectively simulate the initiation and propagation characteristics of frost heave cracks. Based on the results of scanning electron microscopy (SEM), the mechanism of frost heave damage was explored, and the correlation between cracks generated by freeze–thaw cycles and subsequent loading behavior was analyzed. This study presents a novel analytical method for investigating the issue of soil frost heave and cracking in high-altitude regions [20,21,22]. Zheng et al. proposed a new freeze–thaw damage model to characterize the evolution of damage in rock materials under various freeze–thaw cycles. The reliability of the model was verified by comparing the predicted results with experimental data. Research has shown that this model can accurately describe the mechanical property degradation behavior of rocks during freeze–thaw cycles [23].
The existing literature mainly focuses on the evolution of soil fractures under the action of wet–dry and freeze–thaw cycles, without considering the influence of other factors. Therefore, this article conducted experiments on compacted loess under different initial moisture contents, dry densities, and thicknesses under wet–dry conditions. Based on image processing technology, the crack rate and crack development pattern were quantitatively analyzed. The cracking effect of compacted loess under different thicknesses was analyzed through MultiFracS numerical simulation experiments. The simulation results in a strong correlation with the indoor test data, validating the dependability of the developed model in predicting. The research results can inform the assessment of cracking risk in geotechnical structures, like embankments and subgrades.

2. Materials and Methods

2.1. Test Materials

The experimental loess samples were obtained from an excavation site located in Xi’an’s Chang’an District. After sampling, it was immediately sealed and preserved to maintain consistent water content and environmental disturbance. The sampling image is presented in Figure 1, and its fundamental properties are listed in Table 1.
The Bettersize2000 granulometry laser instrument (Bettersize Instruments Ltd., Dandong, China) was used to analyze the sample. The granular dimension distribution curve in Figure 2 shows that the Cu is 27.33 and the Cc is 3.92, indicating poor grading and uneven particle distribution in the soil sample.

2.2. Sample Preparation

Firstly, a 25 cm × 25 cm × 5 cm PC model box was customized. In compliance with geotechnical testing standards [24] and the test plan, the predetermined mass of dried soil sample that passes through a 2 mm sieve was first weighed and placed in a soil mixing vessel. A water sprayer was used to spray distilled water evenly, according to the target moisture content. Then, mixing tools were used to mix and ensure even moisture distribution throughout the soil thoroughly. After mixing was completed, the soil sample was layered and loaded into the sampling mold. Each layer was leveled with a scraper and compacted layer by layer with an iron plate and a small hammer until the specified sample height was reached. The specimen preparation procedure diagram is depicted in Figure 3 below.

2.3. Test Method

To investigate the evolution of compacted loess cracks under different factors, a GT-TH-S-225Z constant temperature and humidity chamber (Guangdong Hongcheng Technology Co., Ltd., Dongguan, China) was used for evaporation and water loss tests. Based on previous research findings, the amplitude of the wet–dry cycle is set at 25% to 5% [4,25]. The initial moisture content was 12%, 14%, 16%, 18%, and 20%, the dry density was 1.40, 1.45, 1.50, 1.55, and 1.60 g/m3, and the thickness was 0.5, 1, 1.5, 2, and 2.5 cm [1,18,26]. According to the local climate conditions in Xi’an and research by other scholars, the temperature was determined to be 45 °C, the humidity was 0%, and the evaporation time was 10 h [27]. Based on previous research results, the number of wet–dry cycles was determined to be five [11,15,26]. The sample mass was weighed after evaporation to obtain the lost moisture content, and the remaining moisture content in the soil was calculated. The test scheme is presented in Table 2.

2.4. Crack Treatment Methods

Quantitative analysis of the crack evolution properties of compressed loess under wet–dry cycles was conducted using digital image processing techniques, ImageJ (2024, v1.50), and PCAS software (2013, v2.325). Binary images were obtained through image preprocessing, grayscale conversion, and threshold segmentation steps.
The specific process is shown in Figure 4. ImageJ software was used for quantitative analysis of fracture images. Firstly, a pixel size conversion relationship is established using a ruler as a reference. After screening qualified images with clarity greater than 90%, threshold segmentation is used to complete binary processing, and finally, parameters such as crack rate are extracted.

3. Results

3.1. Evaluation of the Impact of Initial Moisture Content on the Cracking of Compacted Loess

Figure 5 illustrates the variation in the crack rate of compressed loess at varying initial water contents over time, subjected to drying–wetting cycles. The graph shows that the crack rate in the soil exhibits a significant and marked upward trend as the drying–wetting cycle counts increase. However, after the second dry–wet cycle, the increment rate of the crack slows significantly and enters a state of slow growth, indicating that the crack has stabilized in its initial shape at this time. According to Figure 5c, when w equals 12, 16, and 18%, the crack rates after 10 h of evaporation are 2.22%, 5.04%, and 7.62%, respectively. This demonstrates that the greater the initial water content of the soil, the greater the crack rate. This is mainly because soil with a high initial water content loses more water during the drying process, resulting in more significant shrinkage stress, which makes it more prone to crack formation. This agrees with the findings of [26]. Additionally, the interparticle binding force of high-moisture-content soil is weak, making it more susceptible to structural damage under cyclic drying and wetting conditions, which further promotes the development of cracks. As the wet–dry cycle count increases, the variation in fracture rate between soils with different initial moisture contents gradually decreases. This agrees with the findings of [25]. This phenomenon occurs because soil with a low initial moisture content gradually accumulates damage during the dry-wet cycle, and the cracks continue to expand and connect, resulting in its crack rate progressively approaching the level of high initial moisture content soil.
Figure 6a displays the binary processed images of compacted loess with varying moisture contents at the 10th hour of the second cycle, clearly illustrating the progressive evolution of fracture networks in the compacted loess. Over time, soil fissures gradually evolve from a single form into multiple branches, which then expand further and interweave, ultimately creating a typical grid-like structure. Figure 6b presents the binary processed images of compacted loess with different moisture contents at the 10th hour of the fourth cycle. Through comparative analysis, it is evident that as moisture content increases, the initial formation time of cracks advances, and the speed of expansion accelerates. Additionally, under high moisture conditions, the branching of cracks becomes denser, and the grid structure more intricate, as seen in compacted loess with initial moisture contents of 18% and 20%. Under low water content scenarios, the development of fractures is relatively slow, and their morphology is simpler. These observations further validate the significant influence of moisture content on the development of loess fissures and reveal the dynamic evolution of loess fissures from a single form to a branching one and from simple to complex.

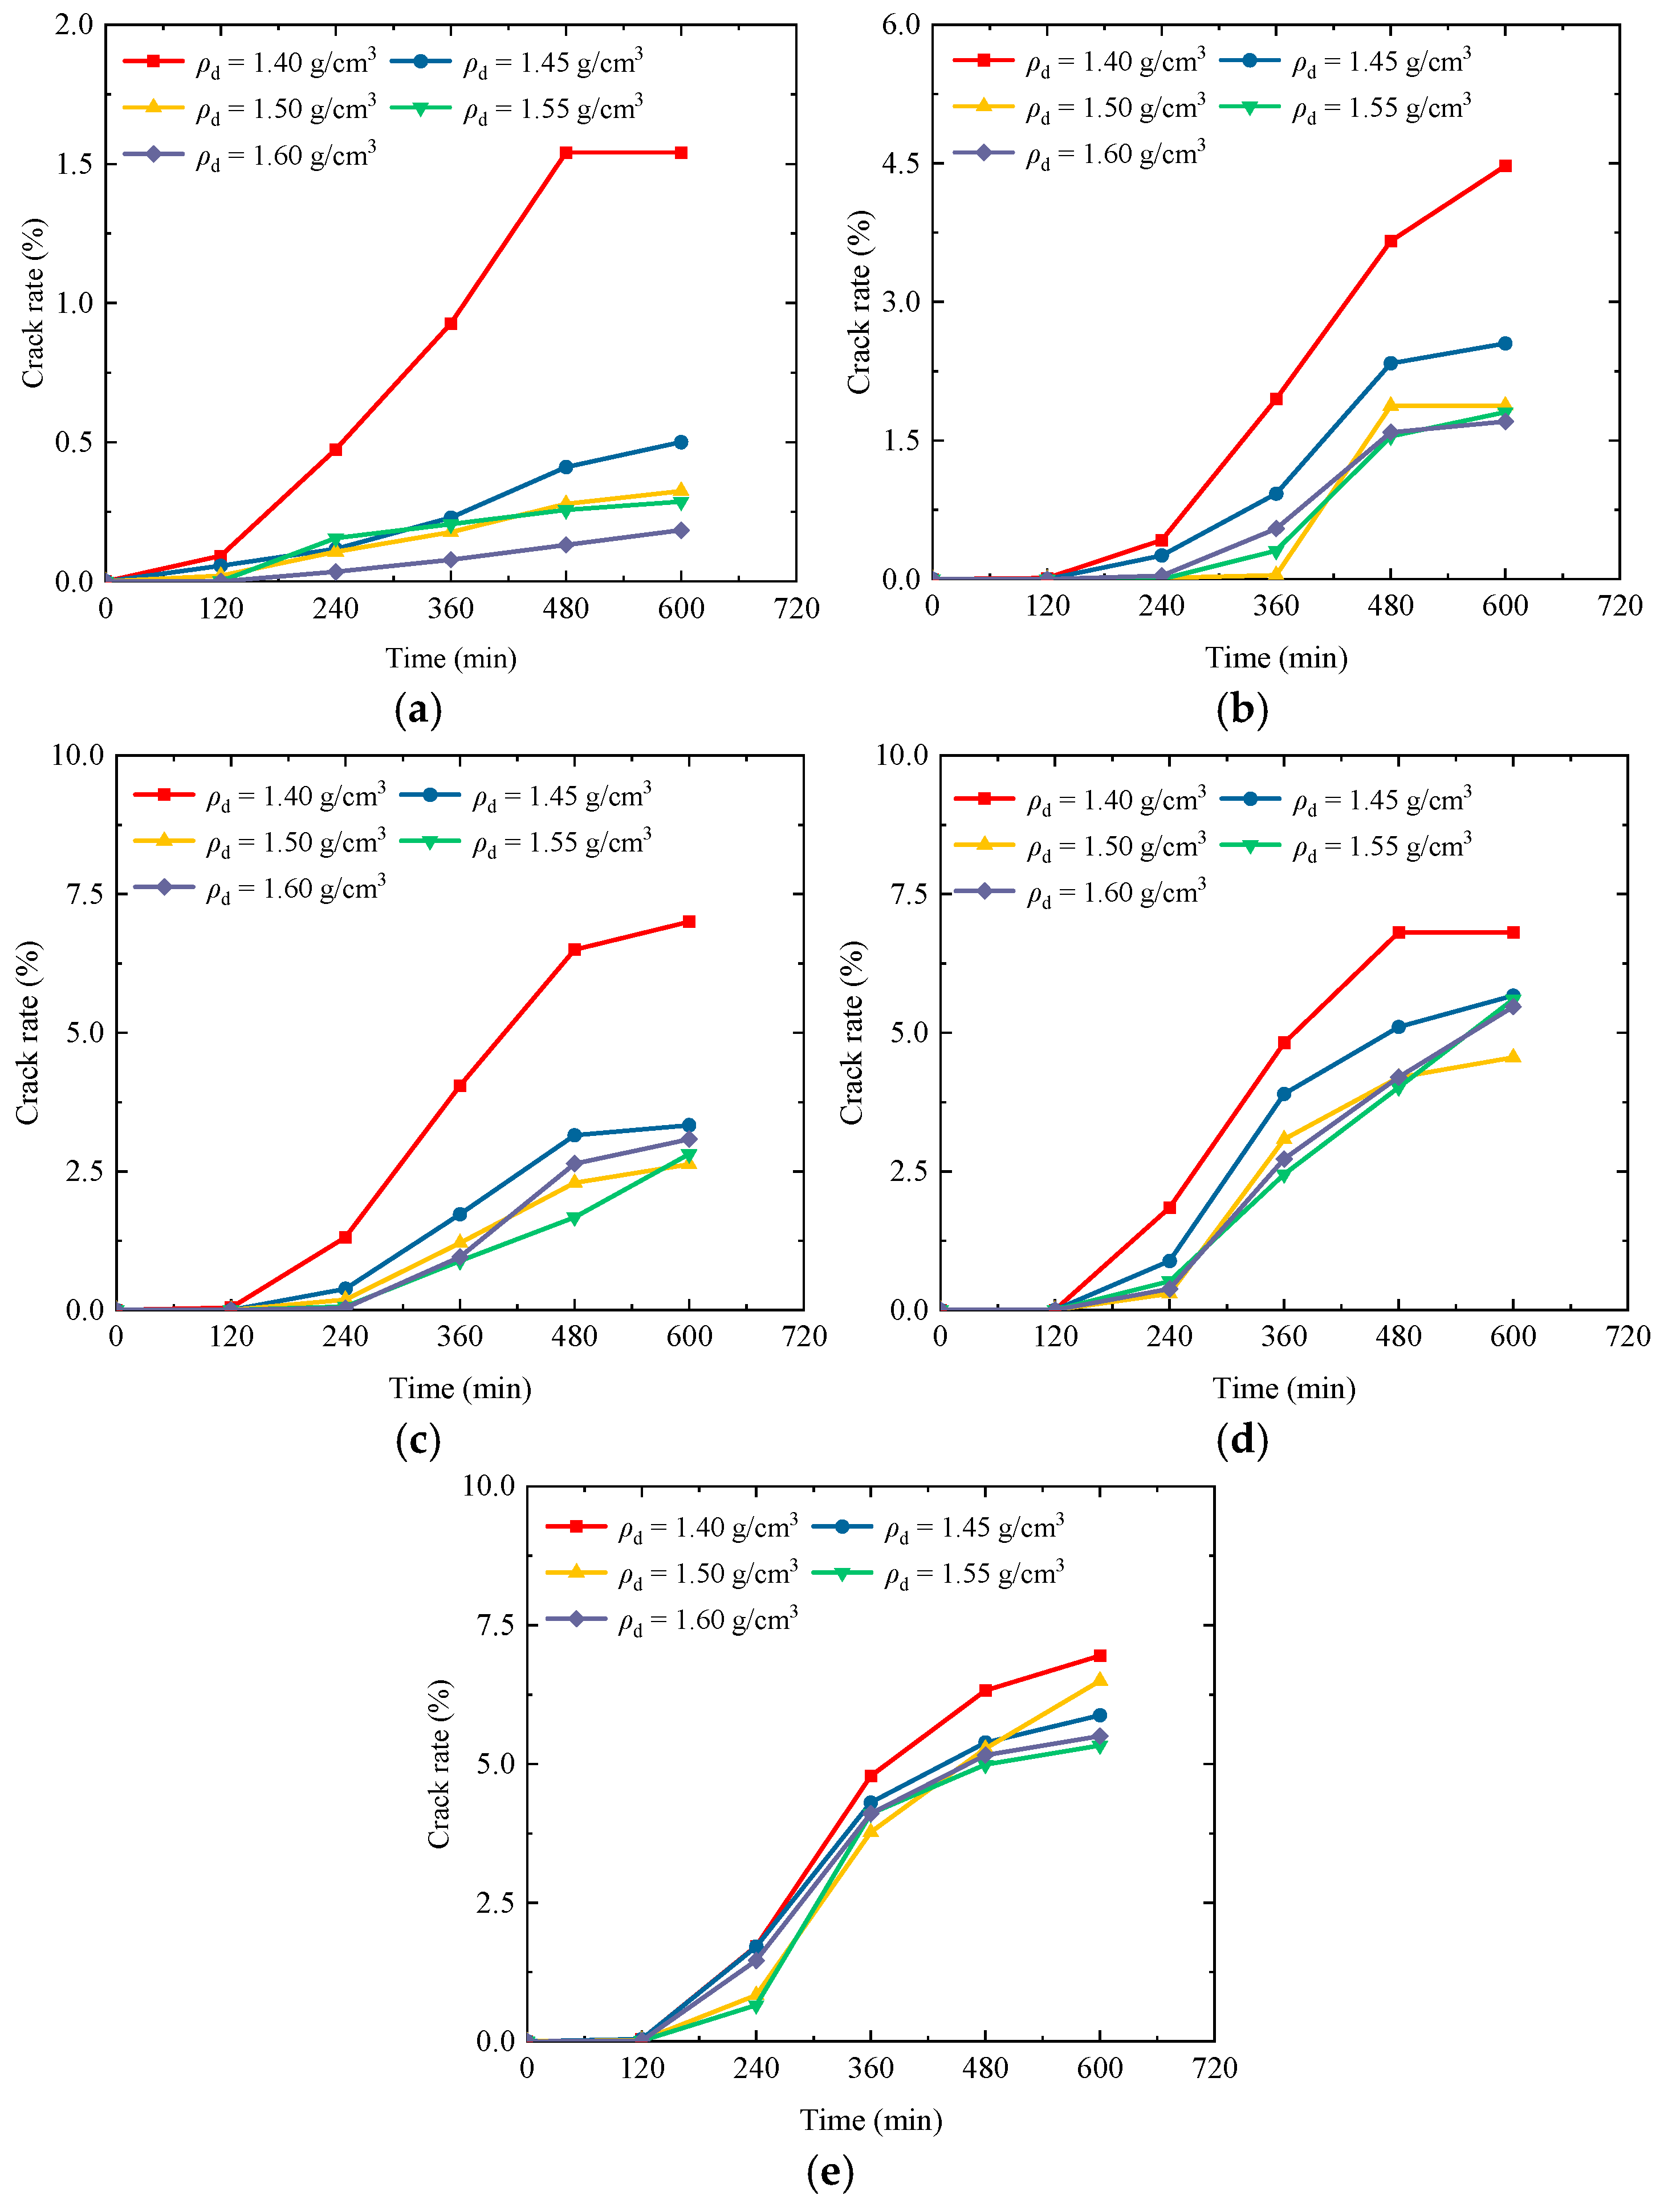
3.2. Analysis of the Influence of Dry Density on the Cracking of Compacted Loess

Figure 7 illustrates the evolution of the crack rate in compacted loess with varying dry densities under drying–wetting cycles. The experimental results indicate that the development speed of the crack rate is directly linked to the soil’s dry density: the lower the dry density, the faster the crack propagation. Specifically, the sample with a dry density of 1.40 g/cm3 exhibited the fastest increase in crack rate, followed by samples with densities of 1.45, 1.50, 1.55, and 1.60 g/cm3, respectively. This phenomenon may relate to the looser structure and weaker interparticle bonding of low-density soil, which facilitates crack formation during the drying shrinkage process. As the number of wet–dry cycles increases, the crack rate of all samples shows an upward trend, consistent with the conclusion of reference [28]. However, significant differences exist in the crack evolution properties of specimens at varying dry densities. Among them, the crack rates of samples with dry densities of 1.40 and 1.45 g/cm3 tend to stabilize earlier, while the crack rates of samples with dry densities of 1.55 and 1.60 g/cm3 experience a longer duration of growth. This may be due to the denser initial structure of high dry density soil, which is less affected by short-term dry-wet cycles. However, as cycling progresses, the internal microcracks gradually expand and penetrate. The crack rates of soil with dry densities of 1.40, 1.45, 1.50, 1.55, and 1.60 g/cm3 in the fifth cycle were 6.95%, 5.88%, 6.50%, 5.33%, and 5.50%, respectively.
Figure 8 shows the binarization results of compacted loess with different dry densities under the second and fourth wet–dry cycles. From the perspective of dry density, the development of cracks exhibits noticeable regular changes: when the dry density ranges from 1.40 to 1.50 g/cm3, the development of cracks presents a complex network characteristic, characterized by fine branches, irregular directions, and interlocking with each other. As the dry density increases, the soil structure becomes denser, and the bonding between particles strengthens. The cracks gradually evolve into a block distribution pattern dominated by the main cracks, characterized by an increase in their opening and a flatter extension path. This indicates that increasing the dry density of the soil can reduce the occurrence of cracks.

3.3. Evaluation of the Impact of Thickness on Cracking of Compacted Loess

Figure 9 illustrates the evolution of crack rates over time in compacted loess of varying thicknesses under wet–dry cycles. From Figure 9a, it can be observed that the soil specimen with a thickness of 0.5 cm exhibits the most significant crack development characteristics, with its crack rate showing a continuous increase as the evaporation time progresses. In contrast, the crack rate growth of the other four thickness samples is relatively slow. This observation aligns with the conclusion of reference [9]. After the second wet–dry cycle, the crack development of all samples displayed a rising trend. After 10 h of drying conditions, the crack rates for the 0.5, 1, 1.5, 2, and 2.5 cm samples reached 2.66%, 2.51%, 2.32%, 2.89%, and 2.64%, respectively. Following the fourth cycle, the crack development in the thinner samples at 0.5 cm and 1 cm tended to stabilize, showing no significant changes in crack rate. However, the thicker samples, at 2 cm and 2.5 cm, continued to exhibit a rapid upward trend. This indicates that cracks in thin specimens develop quickly and reach a stable state, while thick specimens require more cycles to complete the formation process of the crack network. This is consistent with the conclusion of reference [29].
Figure 10 presents the crack development characteristics of compacted loess with different thicknesses under wet–dry cycles. In the third wet–dry cycle, as illustrated in Figure 10a, the loess sample with a thickness of 0.5 cm had the most densely distributed cracks, splitting into 15 independent regions and exhibiting highly fragmented characteristics. As the thickness increases, the crack rate decreases significantly. The 1.0 cm thick sample forms six regions, the 1.5 cm thick sample splits into two larger areas, while the 2.0 cm and 2.5 cm thick samples form five and four regions, respectively. This thickness effect may be related to the fact that thin soil layers are more susceptible to surface evaporation. Figure 10b shows the image of soil cracks after the fifth cycle, indicating that the number of cracks in all soils gradually increases. This suggests that continuous wet–dry cycles can cause cumulative damage effects, leading to the gradual deterioration of soil structure.

4. Analysis of Numerical Simulation Results

4.1. Model Establishment

The model calculation utilizes MultiFracS (2025, 5.3.169 Research Professional Edition) finite discrete element software, an advanced numerical simulation tool that combines the finite element method (FEM) and the discrete element method (DEM). It is specifically designed to simulate the fracture and failure processes of quasi-brittle materials, such as rocks and concrete. It is suitable for simulating the entire process of crack initiation, propagation, intersection, and macroscopic failure. The model used Gmsh (2022, v4.10.5) software to establish two rectangular plate-like structure models with different thicknesses. The geometric modeling process is as follows: first, start the Gmsh software and enter the Geometry module. In the Elementary entities submodule, use the Add function to create the geometric feature points of the model sequentially. Both models use the same plane size (length 25 cm × width 25 cm), but have two thicknesses of 0.5 cm and 2 cm, respectively. According to the shape of the test chamber, fixed boundary conditions are applied to the bottom and surrounding areas. In contrast, dynamic moisture content variation conditions are applied to the upper part. Define the whole as soil, with the upper surface as ‘up’, the lower surface as ‘down’, and the surrounding surfaces as ‘out’. The model is established as shown in Figure 11a–c is the material definition, the inp file generated by the Gmsh software is imported into the MultiFracS software for calculation, as shown in Figure 11d.

4.2. Result Analysis

Figure 12 shows the simulated data of the cracking of 0.5 cm and 2 cm soil after two cycles of dry shrinkage. The fracture energy range of the soil after wet–dry cycling has shifted upward as a whole, and the fracture energy level has increased significantly compared to the initial dry shrinkage. This phenomenon reveals the cumulative damage effect of wet–dry cycles on soil structure: repeated changes in moisture content weaken the connections between soil particles and promote the convergence of microcracks, making the soil more prone to damage during subsequent drying processes, resulting in greater fracture energy. From Figure 12a,c, it can be seen that during the first drying shrinkage, the cracking of the 0.5 cm soil was more severe than that of the 2 cm soil. After the second drying shrinkage, the two soil samples further cracked, indicating that the wet–dry cycles caused significant cracking damage to the soil, in agreement with controlled experimental findings.

4.3. Model Verification

Figure 13 shows the actual cracking morphology and numerical simulation results of soil samples with different thicknesses under the second wet–dry cycle. Among them, Figure 13a,b shows the cracking characteristics of soil samples with an initial water content of 16%, a thickness of 0.5 cm, and a dry density of 1.50 g/cm3. The results show that the crack network of thin soil exhibits a typical “four corner priority cracking centripetal expansion” pattern: cracks first initiate at the four corners of the specimen and then gradually extend to the central region, connecting. As the number of progressive wet–dry cycles increases, the number of cracks also increases significantly, and the newly formed cracks (numbered 1–4) align with the position of the cracks generated during the first drying shrinkage. This phenomenon indicates that during repeated wet–dry cycles, the development of new cracks strictly follows the existing crack path without changing the spatial distribution pattern of the original cracks, which is highly consistent with the reproducibility characteristics observed in indoor experiments. Figure 13c,d shows the cracking behavior of a soil sample with an initial water content of 16%, a thickness of 2 cm, and a dry density of 1.50 g/cm3. Unlike thin soil, thick soil forms only a small number of initial cracks during the first drying shrinkage. However, after experiencing wet–dry cycles, the number of cracks increases significantly, and the development pattern, dominated by main cracks, becomes more pronounced. It is worth noting that the cracks (numbered 3 and 4) formed during the initial shrinkage stage remain stable in subsequent cycles and have not shifted or developed into new cracks. This result not only verifies the accuracy of numerical simulation but also further confirms that soil cracking has a significant “memory effect”—that is, the subsequent expansion of cracks strongly depends on the crack structure formed in the early stage.

5. Conclusions

In this paper, we investigated the influence of multiple parameters on deformation and cracking properties of compacted loess using wet–dry cycle experiments. By combining computerized image analysis techniques, the quantitative characterization of the crack development process was achieved. Based on the MultiFracS numerical simulation platform, the regulatory effect of soil layer thickness on the crack propagation law was analyzed. The key conclusions emerge as follows:
(1)
With increasing wet–dry cycle count, the number of cracks gradually increases. Under the first wet–dry cycle, the lower the initial water content, the fewer cracks are generated. Conversely, the higher the initial moisture content, the more cracks there are. This suggests that the initial moisture content has a significant impact on the development of fractures.
(2)
The lower the dry density of compacted loess, the easier it is to crack, and the earlier the cracking time, the faster the stability. With progressive wet–dry cycling, the crack rate of all samples exhibits an upward trend, and the growth duration of the crack rate and the crack development cycle of high dry density samples are longer.
(3)
Under the first wet–dry cycle, the soil sample with a thickness of 0.5 cm showed the fastest cracking response. In comparison, the crack rate of the 1.0 cm and 1.5 cm samples showed a gradient decrease with increasing thickness, indicating that thickness has a resistance to crack formation during the initial phases. After the second wet–dry cycle, the crack development of all samples showed an accelerated trend, indicating that the wet–dry cycling substantially influences the formation of soil cracks.
(4)
Using simulation-based analysis, it was found that the thin soil cracked earlier than the thick soil, and the fracture network presented a typical pattern of “priority cracking at the four corners and central expansion”. Once soil cracks form, they will continue to expand along the original crack shape during the subsequent drying process.
(5)
In future research, the influence of multiple factor coupling mechanisms on the cracking of compacted loess can be studied, such as the coupling effect of dry-wet freeze–thaw cycles or the impact of different temperature wet coupling effects on crack initiation and propagation, to enrich the research on soil cracking.

Author Contributions

Conceptualization, Y.X. and G.L.; Methodology, G.L.; Writing—original draft, M.S.; Validation, M.S. and J.Z.; Writing—review and editing, G.L.; Funding acquisition, Y.X. All authors have read and agreed to the published version of the manuscript.

Funding

This study was supported by the Natural Science Basic Research Program of Shaanxi Province (2023-JC-QN-0322), Shaanxi Provincial Department of Education Service Local Special Research Program Project (23JE018).

Data Availability Statement

Data are contained within the article.

Conflicts of Interest

The authors declare no conflicts of interest.

References

  1. Chertkov, V.Y. Modelling cracking stages of saturated soils as they dry and shrink. Eur. J. Soil Sci. 2002, 53, 105–118. [Google Scholar] [CrossRef]
  2. Li, J.; Chen, H.; Gao, X.; Ding, Q.; Shan, W.; Guo, H.; Zhuo, J. Cracks evolution and micro mechanism of compacted clay under wet-dry cycles and wet-dry-freeze-thaw cycles. Cold Reg. Sci. Technol. 2023, 214, 103944. [Google Scholar] [CrossRef]
  3. Amagu, A.C.; Eze, S.N.; Jun-Ichi, K.; Nweke, M.O. Geological and geotechnical evaluation of gully erosion at Nguzu Edda, Afikpo Sub-basin, southeastern Nigeria. J. Environ. Earth Sci. 2018, 8, 148–158. [Google Scholar]
  4. Gao, Q.F.; Yu, H.C.; Zeng, L.; Huang, Y.X. Characterization of water retention behavior of cracked compacted lateritic soil exposed to wet-dry cycles. Bull. Eng. Geol. Environ. 2023, 82, 61. [Google Scholar] [CrossRef]
  5. Amagu, C.A.; Enya, B.O.; Kodama, J.I.; Sharifzadeh, M. Impacts of Addition of Palm Kernel Shells Content on Mechanical Properties of Compacted Shale Used as an Alternative Landfill Liners. Adv. Civ. Eng. 2022, 2022, 9772816. [Google Scholar] [CrossRef]
  6. Tang, C.S.; Zhu, C.; Cheng, Q.; Zeng, H.; Xu, J.J.; Tian, B.G.; Shi, B. Desiccation cracking of soils: A review of investigation approaches, underlying mechanisms, and influencing factors. Earth Sci. Rev. 2021, 216, 103586. [Google Scholar] [CrossRef]
  7. Chen, Y.; Zhang, R.; Zi, J.; Han, J.; Liu, K. Evaluation of the treatment variables on the shear strength of loess treated by microbial induced carbonate precipitation. J. Mountain Sci. 2025, 22, 1075–1086. [Google Scholar] [CrossRef]
  8. Chompoorat, T.; Thepumong, T.; Khamplod, A.; Likitlersuang, S. Improving mechanical properties and shrinkage cracking characteristics of soft clay in deep soil mixing. Constr. Build. Mater. 2022, 316, 125858. [Google Scholar] [CrossRef]
  9. El Hajjar, A.; Ouahbi, T.; Eid, J.; Hattab, M.; Taibi, S. Shrinkage cracking of unsaturated fine soils: New experimental device and measurement techniques. Strain 2020, 56, e12352. [Google Scholar] [CrossRef]
  10. Chen, Y.; Dong, M.; Cheng, C.; Han, J.; Zhao, Y.; Jia, P. Experimental and analytical study on the bearing capacity of caisson foundation subjected to V-H combined load. Mar. Georesour. Geotechnol. 2025, 1–14. [Google Scholar] [CrossRef]
  11. Guo, H.; Li, W.; Dang, F.; Wang, Y.; Fu, J.; Tao, M. The shrinkage crack characteristics of jute fiber-modified clay under wet-dry cycle conditions. Constr. Build. Mater. 2025, 472, 140840. [Google Scholar] [CrossRef]
  12. Yue, J.; Huang, X.; Zhao, L.; Wang, Z. Study on the factors affecting cracking of earthen soil under dry shrinkage and freeze–thaw conditions. Sci. Rep. 2022, 12, 1816. [Google Scholar] [CrossRef] [PubMed]
  13. Tang, C.S.; Shi, B.; Liu, C.; Gao, L.; Inyang, H.I. Experimental investigation of the desiccation cracking behavior of soil layers during drying. J. Mater. Civ. Eng. 2011, 23, 873–878. [Google Scholar] [CrossRef]
  14. Zhou, R.; Wang, B.T.; Han, S.Y.; Wang, D.Y.; Zhang, F.H. Mechanisms of crack development and strength deterioration in compacted expansive soils under controlled wetting-drying conditions. Eng. Fail. Anal. 2024, 159, 108133. [Google Scholar] [CrossRef]
  15. Xie, Y.; Zhang, B.; Liu, B.; Zeng, Z.; Zhang, Y.; Zheng, Y. Shrinkage cracking and strength deterioration of red clay under cyclic drying and wetting. Alex. Eng. J. 2022, 61, 2574–2588. [Google Scholar] [CrossRef]
  16. Zhao, C.; Lei, M.; Jia, C.; Liang, G.; Shi, Y. Mechanical characteristics of red sandstone subjected to freeze–thaw cycles and increasing amplitude cyclic load. Rock Mech. Rock Eng. 2024, 57, 3237–3256. [Google Scholar] [CrossRef]
  17. Yan, C.; Ma, H.; Tang, Z.; Ke, W. A two-dimensional moisture diffusion continuous model for simulating dry shrinkage and cracking of soil. Int. J. Geomech. 2022, 22, 04022172. [Google Scholar] [CrossRef]
  18. Zhang, S.; Yue, J.; Huang, X.; Zhao, L.; Wang, Z. Study on Cracking Law of Earthen Soil under Dry Shrinkage Condition. Materials 2022, 15, 8281. [Google Scholar] [CrossRef] [PubMed]
  19. Cheng, W.; Bian, H.; Hattab, M.; Yang, Z. Numerical modelling of desiccation shrinkage and cracking of soils. Eur. J. Environ. Civ. Eng. 2023, 27, 3525–3545. [Google Scholar] [CrossRef]
  20. Yu, J.; Zhang, B.; Zhao, J.; Wang, Y.; Jia, C.; Zhang, Q. An improved model for discrete element method simulation of spatial gradient distributions of freeze-thaw-induced damage to sandstone. Comput. Geotech. 2024, 171, 106412. [Google Scholar] [CrossRef]
  21. Yu, S.; Ren, X.; Zhang, J. Modeling the rock frost cracking processes using an improved ice–Stress–Damage coupling method. Theor. Appl. Fract. Mech. 2024, 131, 104421. [Google Scholar] [CrossRef]
  22. Yu, J.; Zhang, Q.; Jia, C.; Lei, M.; Zhao, C.; Pang, R.; Li, Z.; Zang, T. Experimental and DEM simulations of the mechanical properties of rock under freeze–thaw cycles. Cold Reg. Sci. Technol. 2023, 211, 103866. [Google Scholar] [CrossRef]
  23. Zheng, Y.; Jia, C.; Lei, M.; Huang, J.; Shi, C. Investigation of the constitutive damage model of rock under the coupled effect of freeze–thaw cycles and loading. Rock Mech. Rock Eng. 2024, 57, 1861–1879. [Google Scholar] [CrossRef]
  24. G/BT 50123-2019; Standard for Geotechnical Testing Method. Construction Ministry of PRC: Beijing, China, 2019.
  25. Dong, M.; Deng, Y.; Fu, Y. Cracking behavior and deterioration of strength characteristics of silty clay under drying-wetting cycles. Bull. Eng. Geol. Environ. 2025, 84, 205. [Google Scholar] [CrossRef]
  26. Zhao, Y.; Zhang, H.; Wang, G.; Yang, Y.; Ouyang, M. Development Characteristics and Mechanism of Crack in Expansive Soil under Wet–Dry Cycling. Appl. Sci. 2024, 14, 6499. [Google Scholar] [CrossRef]
  27. Yu, H.C.; Zeng, L.; Wu, X.Y.; Gao, Q.F.; Bian, H.B.; Luo, J.T.; Zhang, H.R. Classification of cracking potential for clayey soils based on cyclic wet-dry tests. Environ. Earth Sci. 2025, 84, 198. [Google Scholar] [CrossRef]
  28. Li, T.; He, Y.; Liu, G.; Li, B.; Hou, R. Experimental study on cracking behaviour and strength properties of an expansive soil under cyclic wetting and drying. Shock Vib. 2021, 2021, 1170770. [Google Scholar] [CrossRef]
  29. Gao, Y.; Hao, D.; Zhu, Y.; Chen, R.; Liu, X.; Guo, R. Experimental Investigation of Desiccation Cracking of Jilin Ball Clay Under Wet–Dry Cycles. Geotech. Geol. Eng. 2024, 42, 2767–2782. [Google Scholar] [CrossRef]
Figure 1. Sampling.
Figure 1. Sampling.
Buildings 15 02625 g001
Figure 2. Granulometric distribution of Xi’an loess.
Buildings 15 02625 g002
Figure 3. Sample preparation workflow chart.
Buildings 15 02625 g003
Figure 4. Crack treatment process.
Buildings 15 02625 g004
Figure 5. The impact of initial moisture content on cracking of compacted loess: (a) N = 1; (b) N = 2; (c) N = 3; (d) N = 4; (e) N = 5.
Buildings 15 02625 g005
Figure 6. Binarization treatment of compacted loess with diverse initial water contents under dry-wet cycle conditions: (a) evaporated for 10 h during the second wet–dry cycle; (b) evaporated for 10 h during the fourth wet–dry cycle.
Buildings 15 02625 g006
Figure 7. The impact of diverse dry densities on the cracking of compacted loess: (a) N = 1; (b) N = 2; (c) N = 3; (d) N = 4; (e) N = 5.
Buildings 15 02625 g007
Figure 8. Binarization treatment of compacted loess samples with varying dry densities under the action of dry-wet cycles: (a) evaporated for 10 h during the second wet–dry cycle; (b) evaporated for 10 h during the fourth wet–dry cycle.
Buildings 15 02625 g008
Figure 9. The influence of different thicknesses on the cracking of compacted loess: (a) N = 1; (b) N = 2; (c) N = 3; (d) N = 4; (e) N = 5.
Buildings 15 02625 g009
Figure 10. Binarization treatment of compacted loess of different thicknesses under the action of dry-wet cycles: (a) evaporated for 10 h during the second wet–dry cycle; (b) evaporated for 10 h during the fourth wet–dry cycle.
Buildings 15 02625 g010
Figure 11. The 2 cm model establishment and grid division: (a) front view; (b) side view; (c) material definition; (d) model operation.
Buildings 15 02625 g011
Figure 12. Fracture energy of soil with different thicknesses under wet–dry cycles: (a) first drying shrinkage with H = 0.5 cm; (b) second drying shrinkage with H = 0.5 cm; (c) first drying shrinkage with H = 2 cm; (d) second drying shrinkage with H = 2 cm.
Buildings 15 02625 g012
Figure 13. Comparison between indoor experiments and numerical simulation experiments: (a) development process of cracks in 0.5 cm soil after 6 h of evaporation; (b) development process of cracks in 0.5 cm soil after 10 h of evaporation; (c) evolution of cracks in 2 cm soil after 6 h of evaporation; (d) evolution of cracks in 2 cm soil after 10 h of evaporation.
Buildings 15 02625 g013
Table 1. Basic physical properties of loess.
Specific
Gravity
(Gs)
Water Content
(%)
Dry Density
(g/cm3)
Initial Porosity RatioPlasticity Limit
(%)
Liquid Limit
(%)
Plasticity Index
2.7115.71.450.9720.5435.7815.24
Table 2. Test scheme.
Number of Wet–Dry Cycles
N/(Times)
Dry Density
ρd (g/cm3)
Initial Water Content
w/(%)
Thickness
H/(cm)
5121.502
141.502
161.502
181.502
201.502
161.402
161.452
161.502
161.552
161.602
161.500.5
161.501
161.501.5
161.502
161.502.5
Disclaimer/Publisher’s Note: The statements, opinions and data contained in all publications are solely those of the individual author(s) and contributor(s) and not of MDPI and/or the editor(s). MDPI and/or the editor(s) disclaim responsibility for any injury to people or property resulting from any ideas, methods, instructions or products referred to in the content.

