
Analytical Derivation of the q-Factor for Slender Masonry Structures Under Out-of-Plane Seismic Action


Abstract
1. Introduction
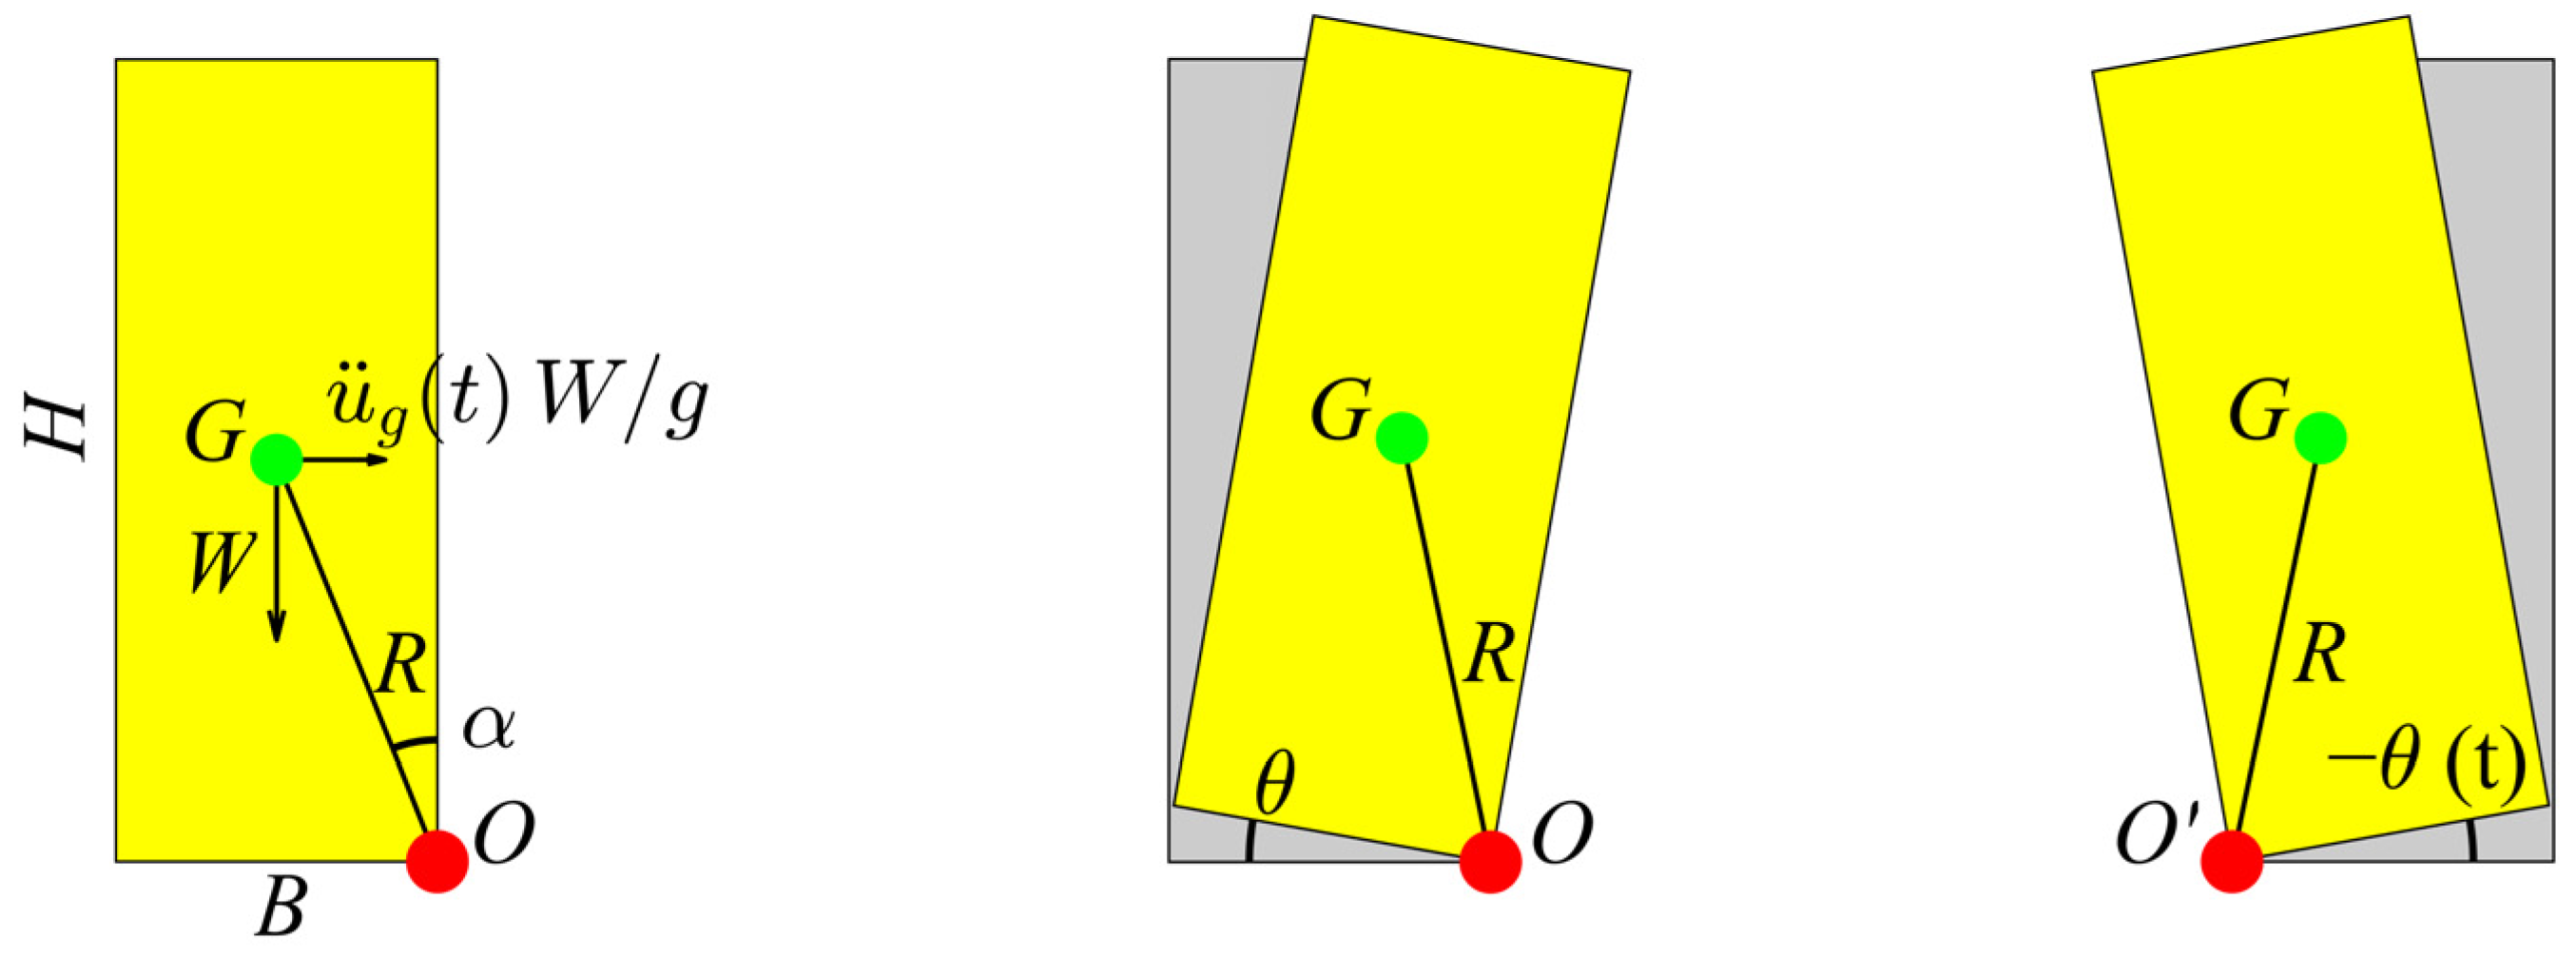
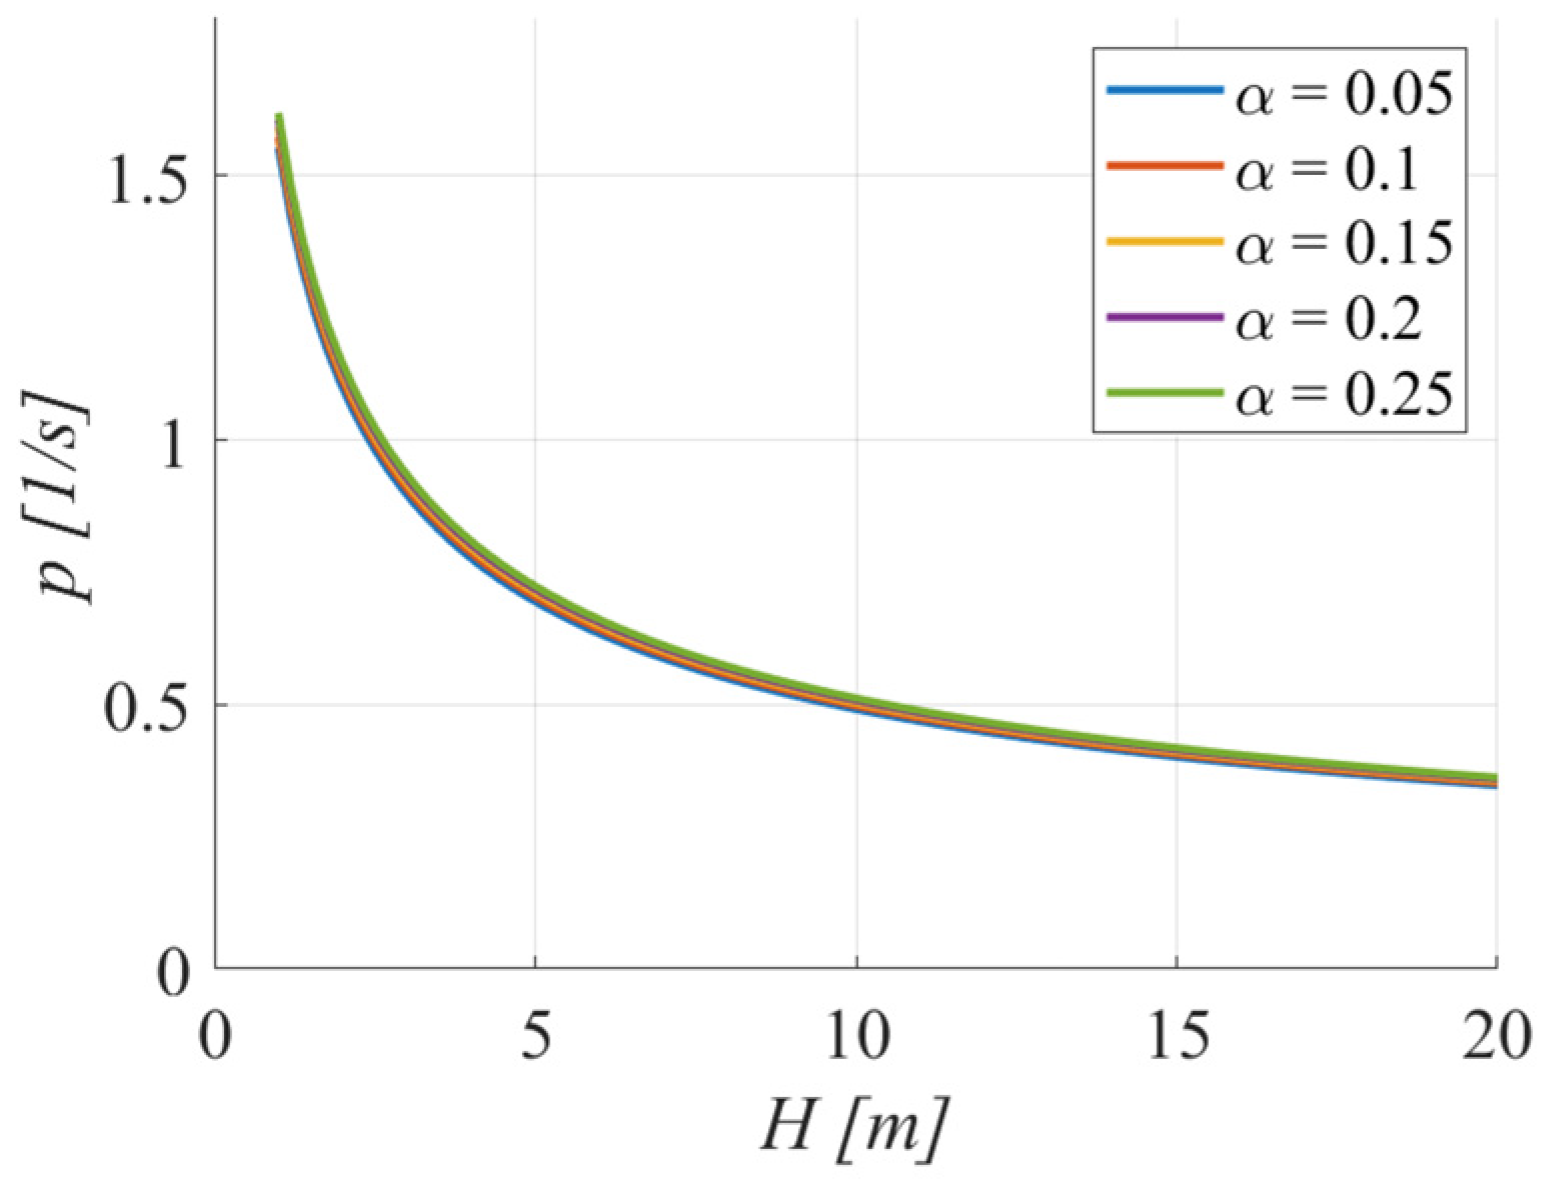
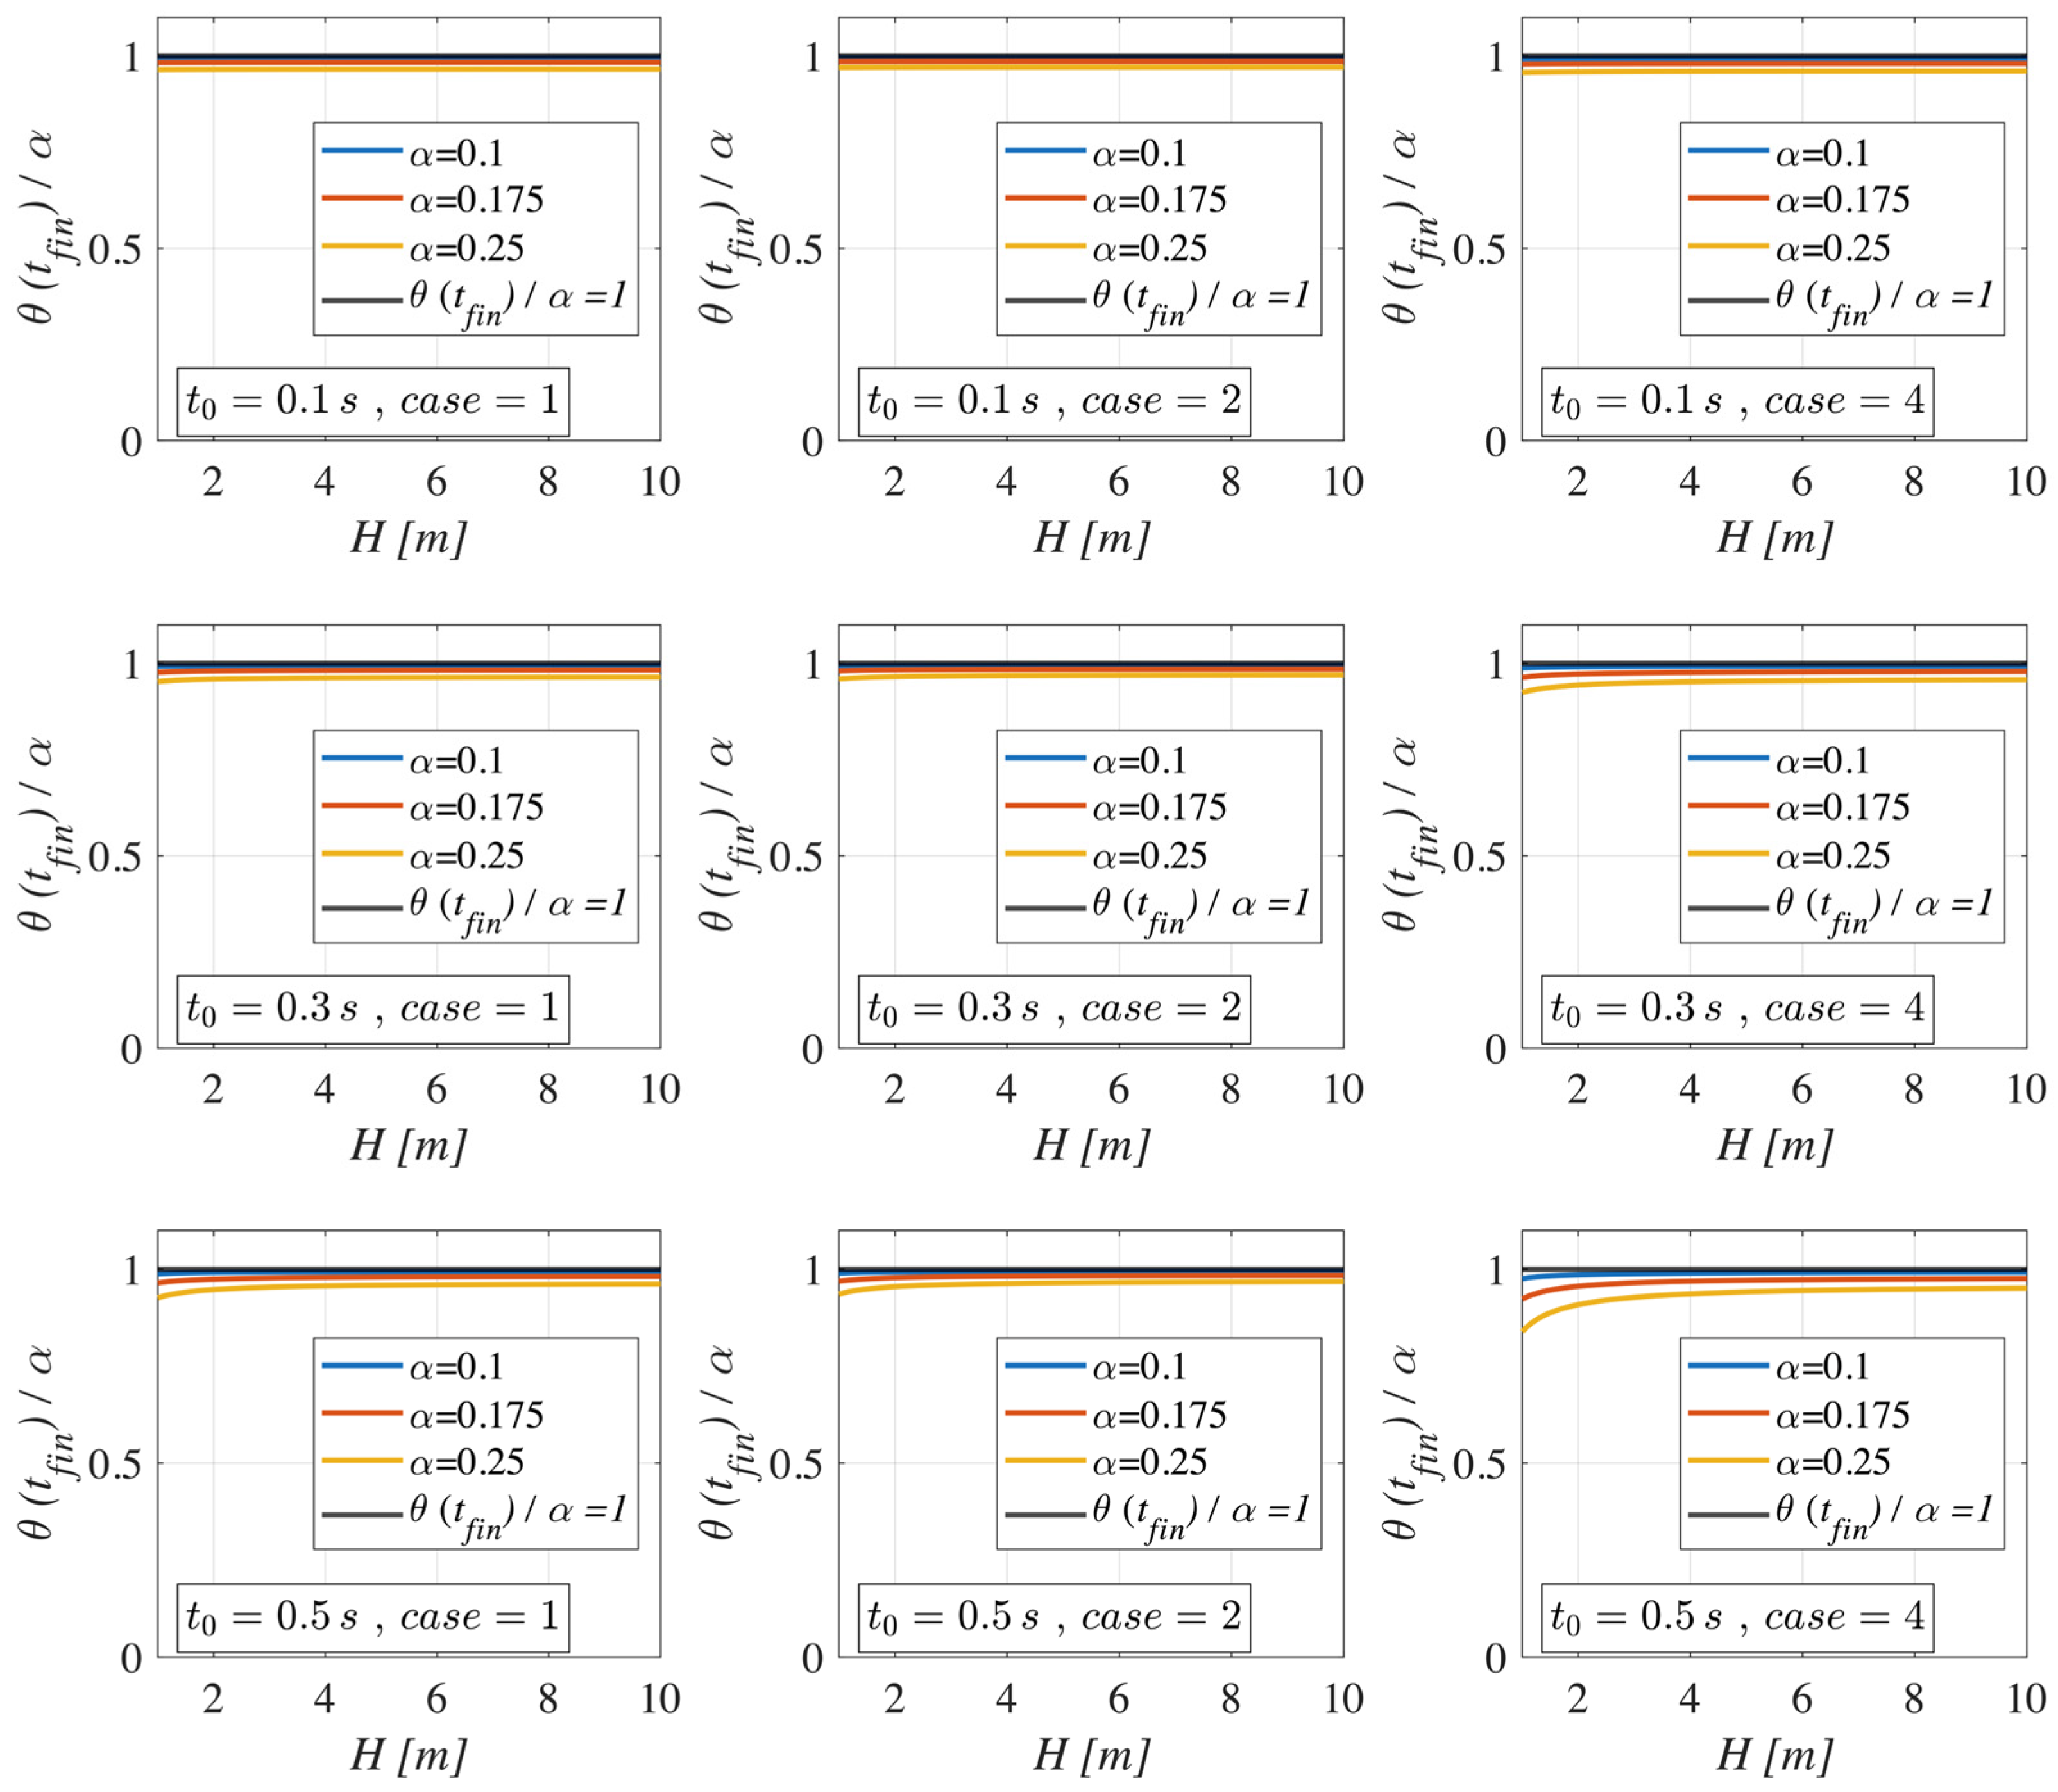
2. Analytical Model
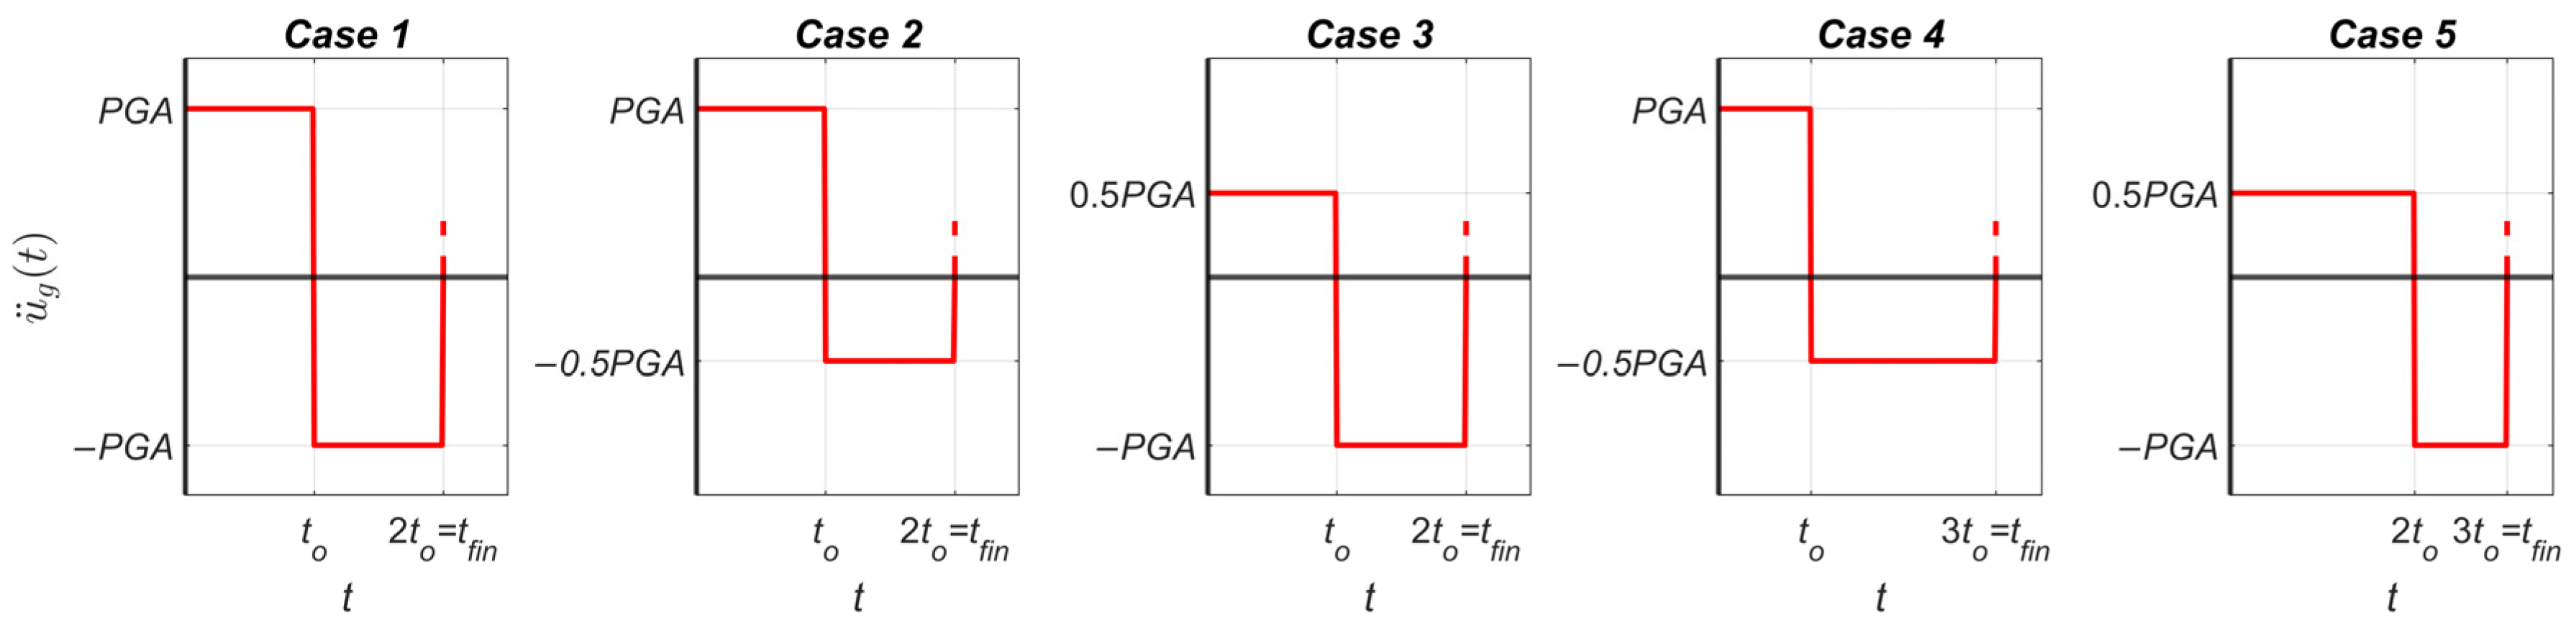
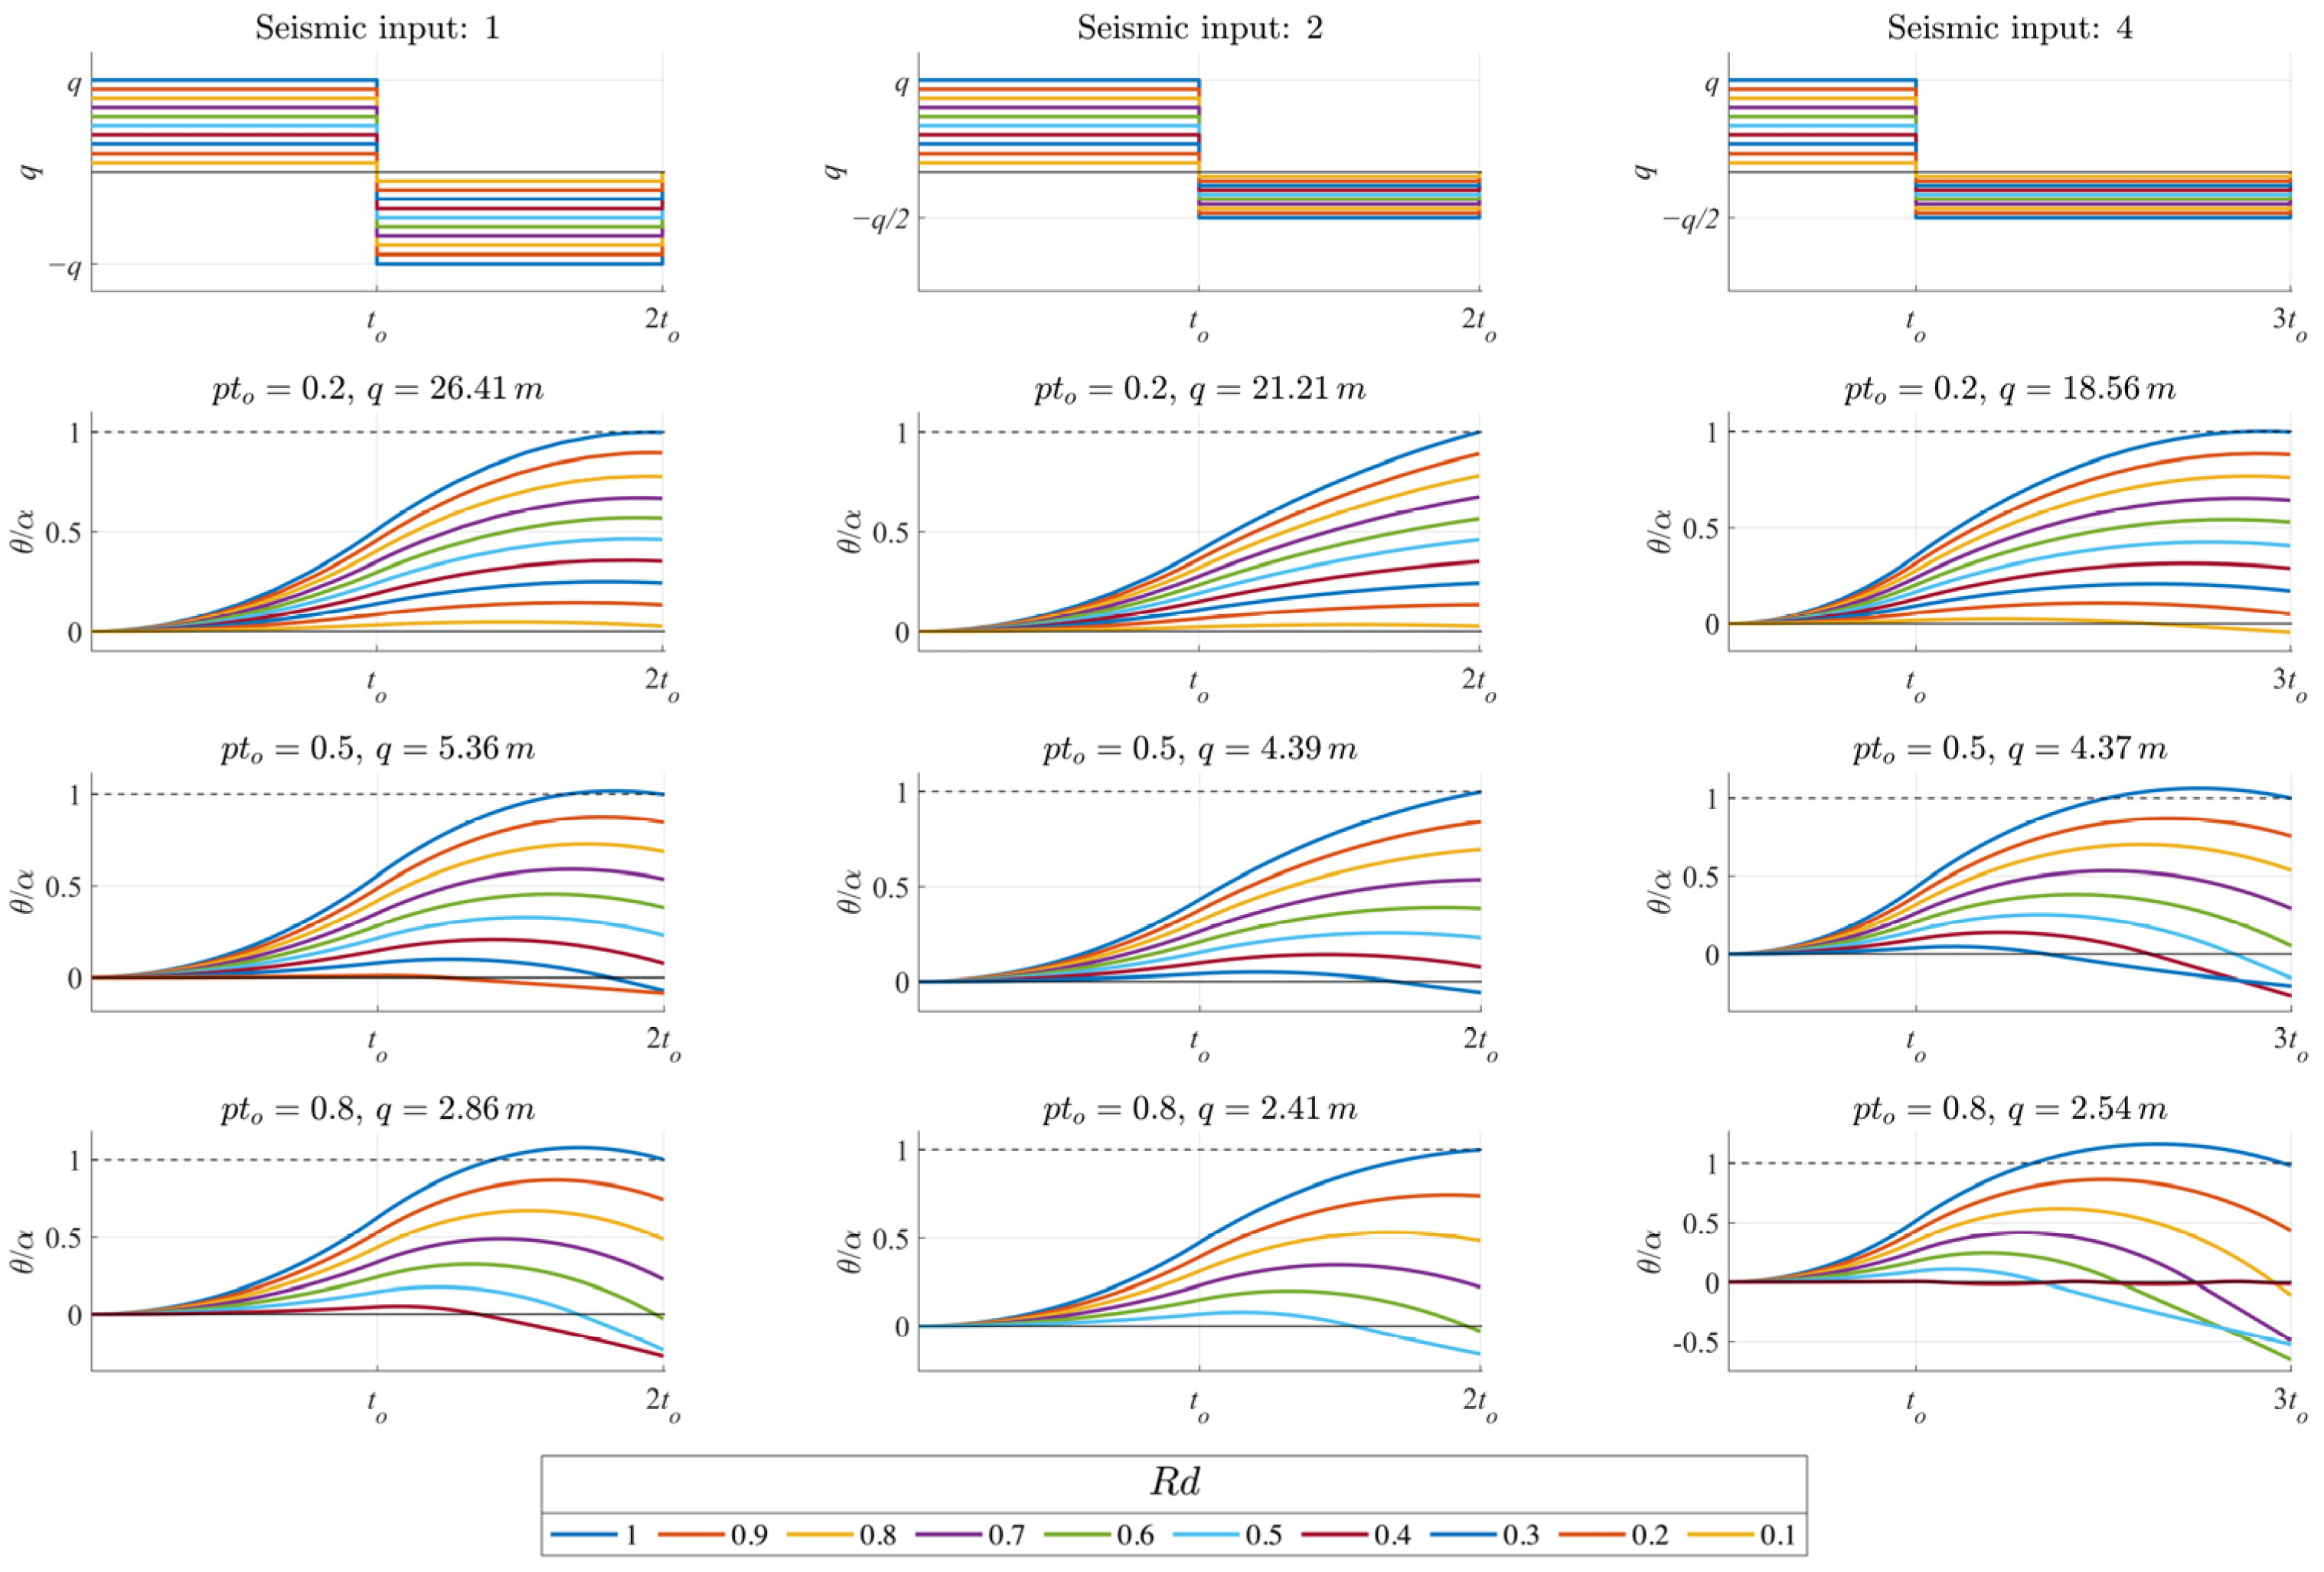
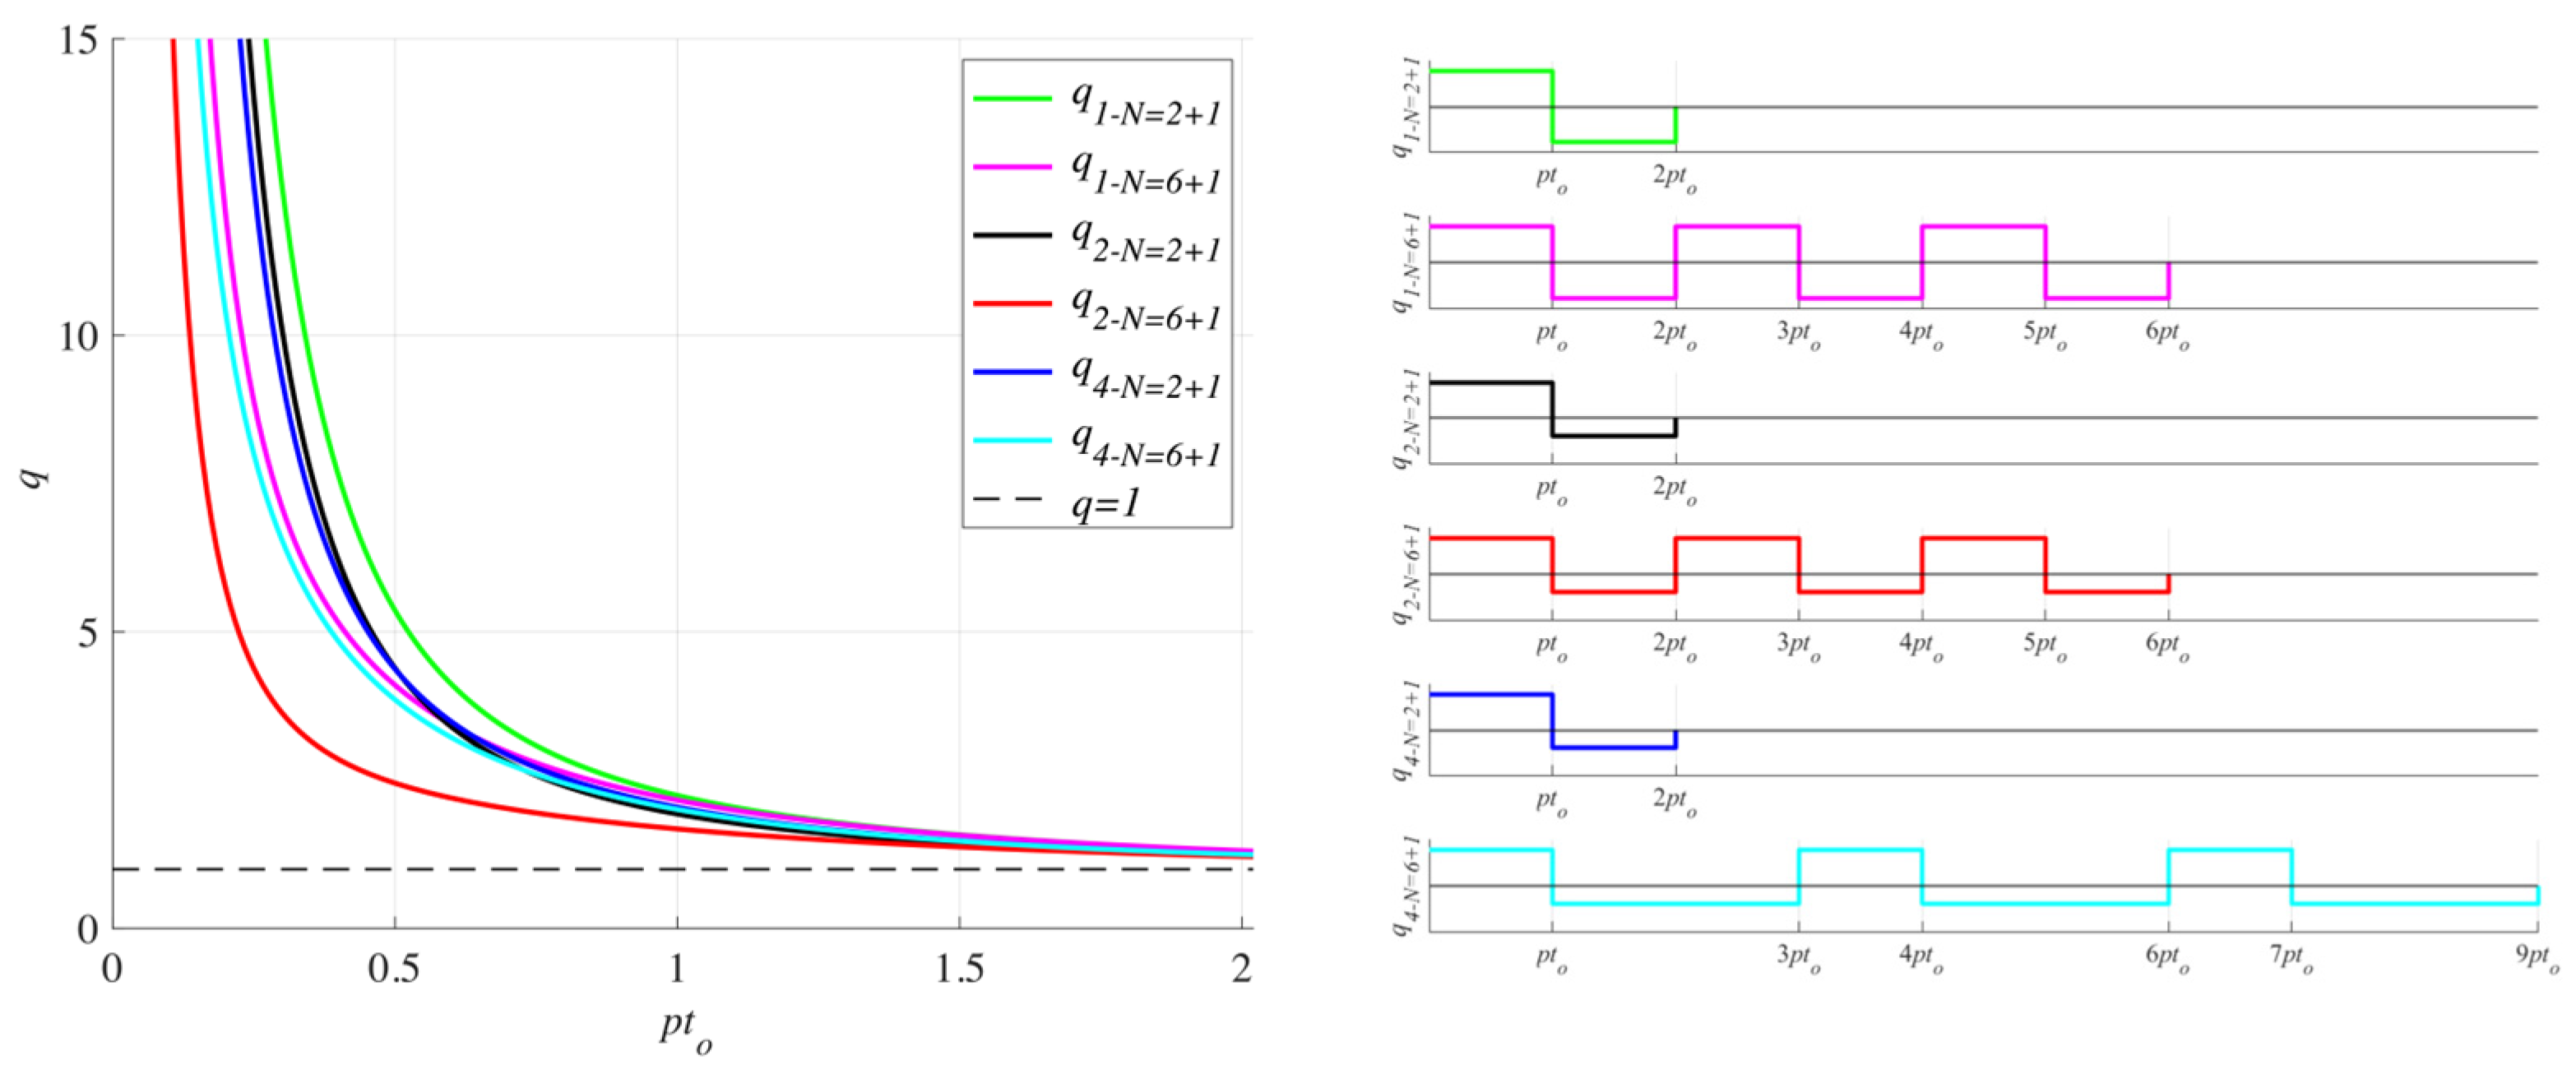
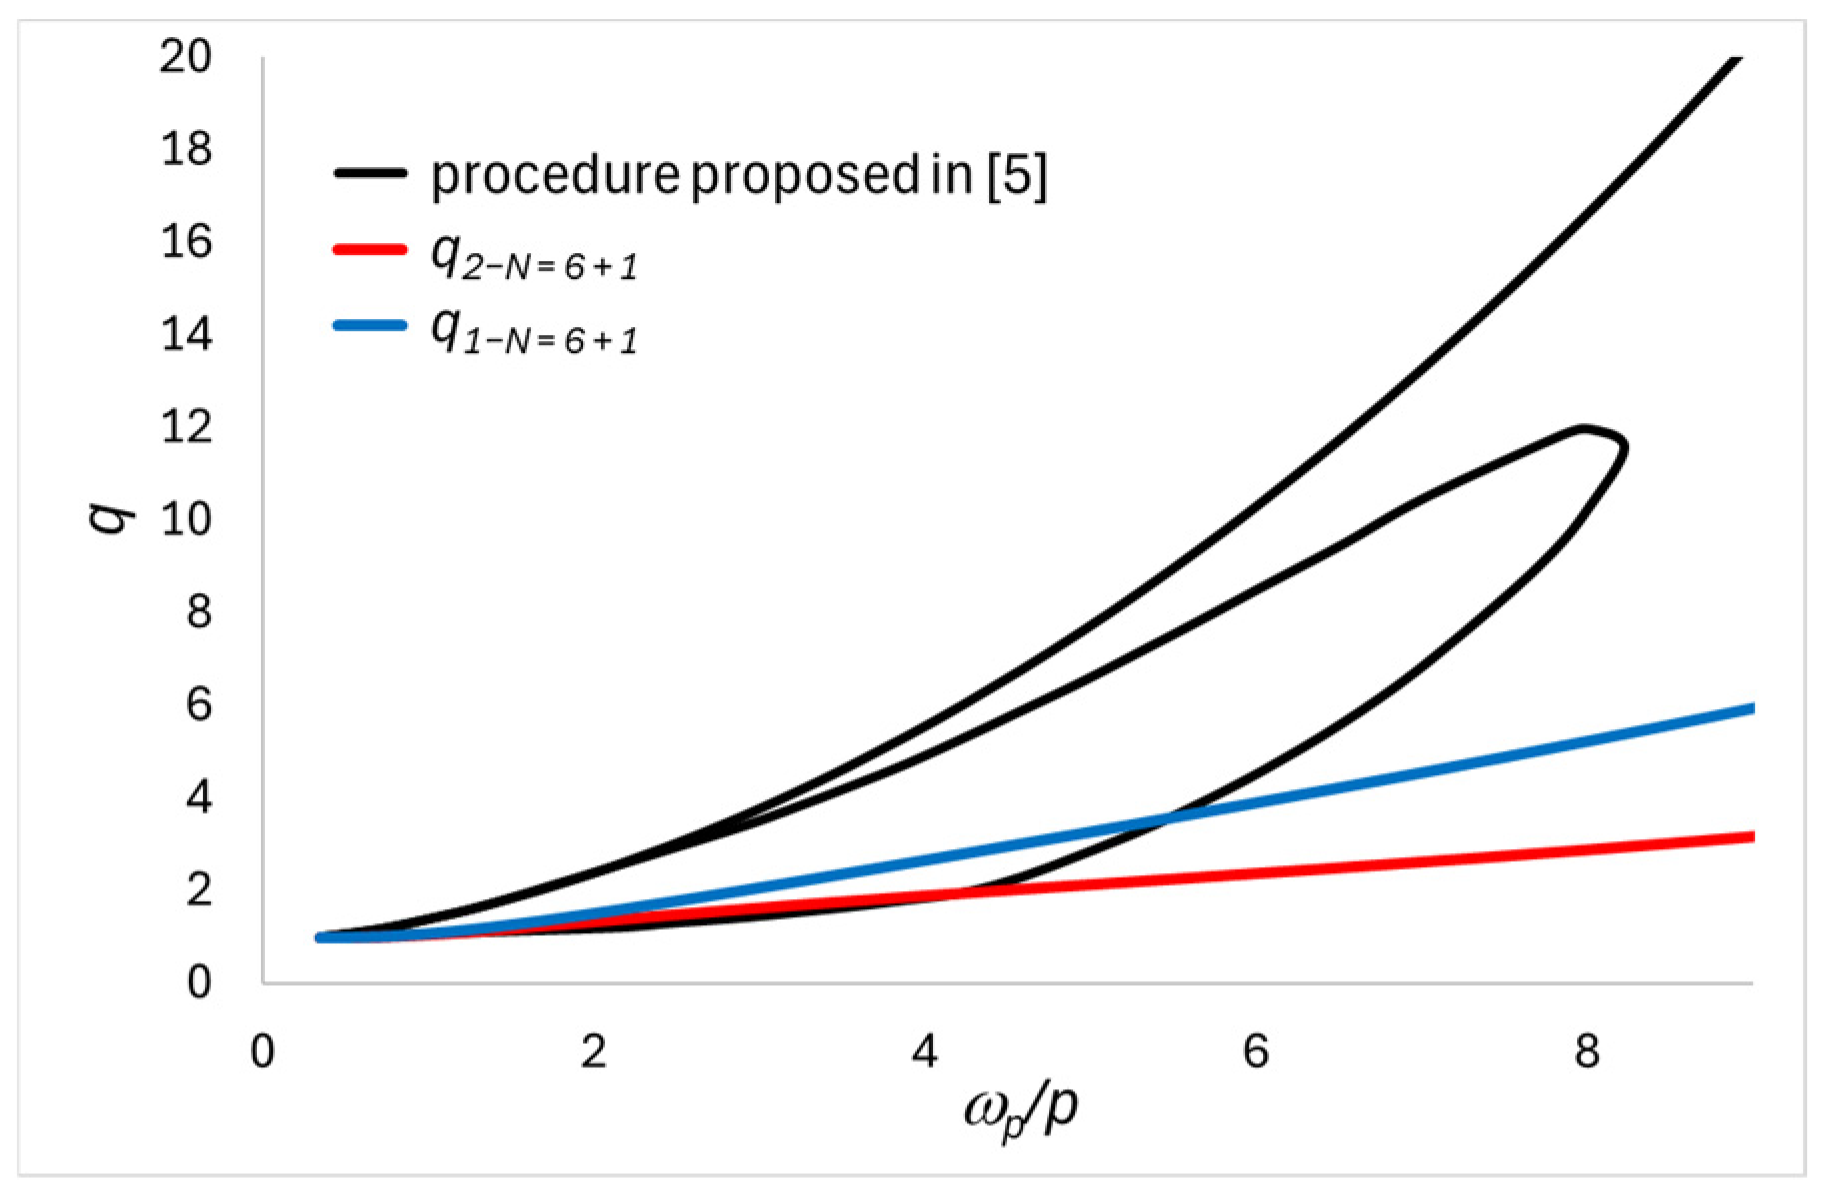
3. Influence of the Number of Pulses
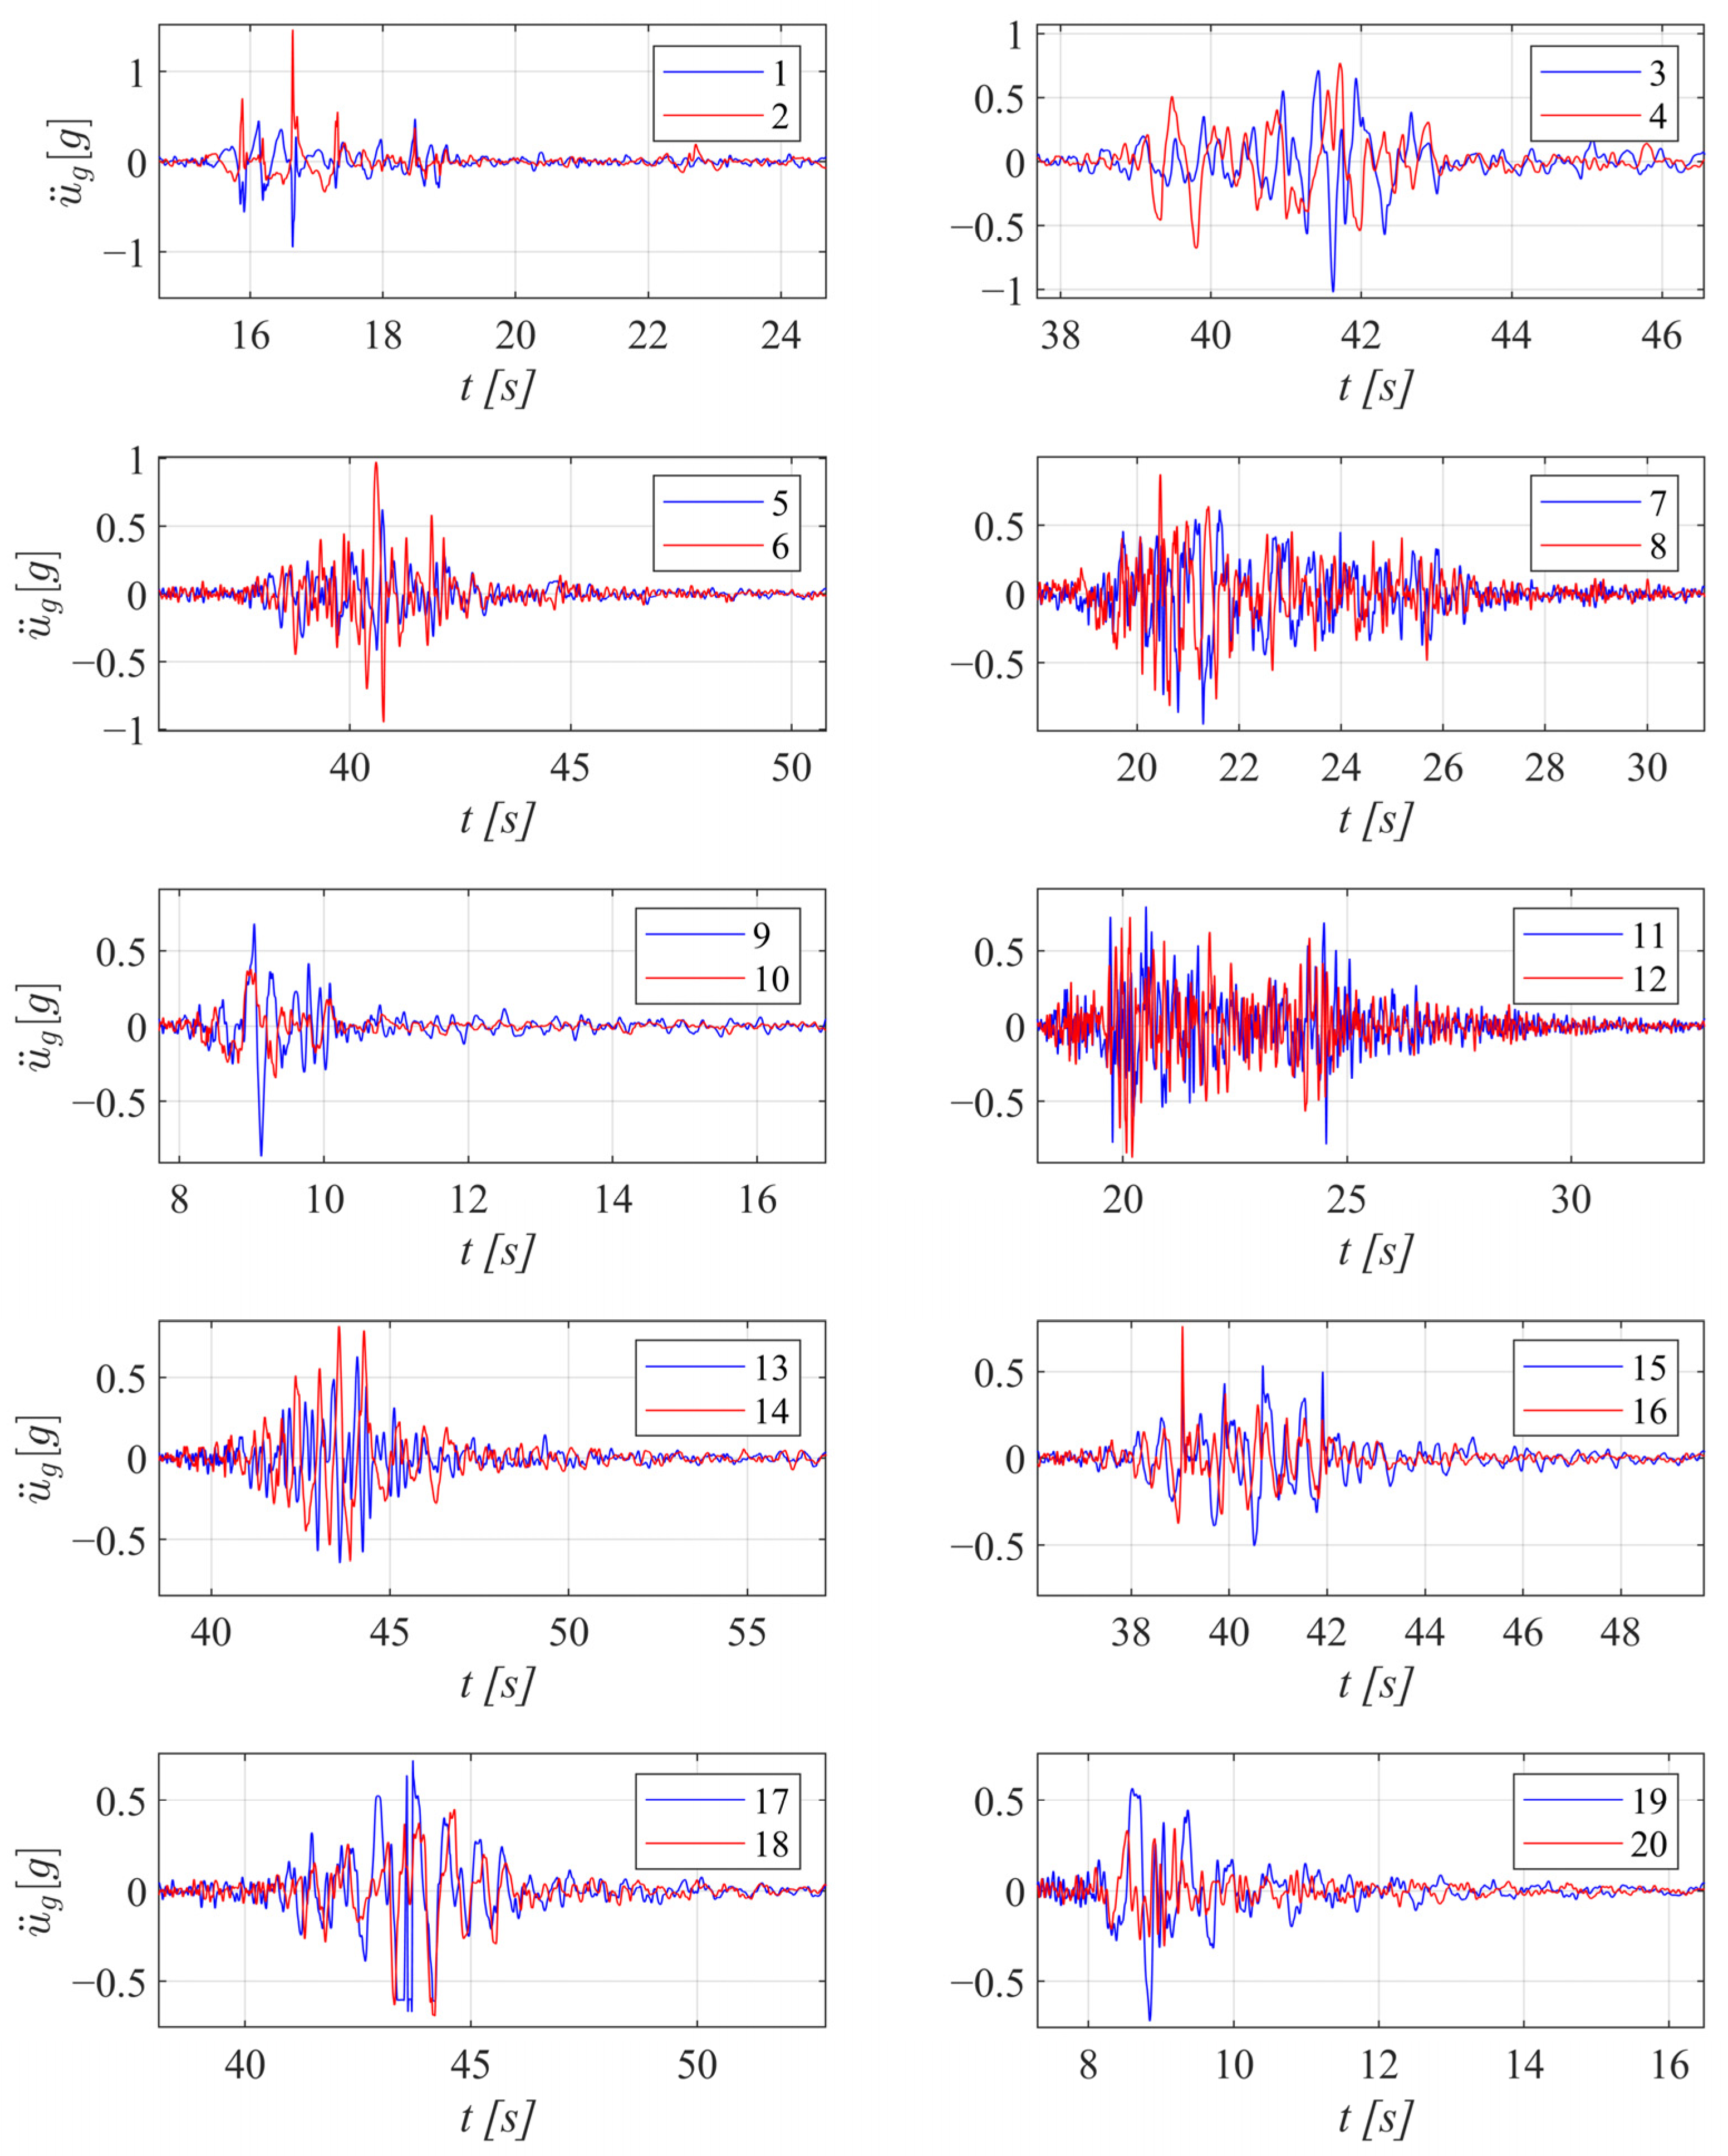
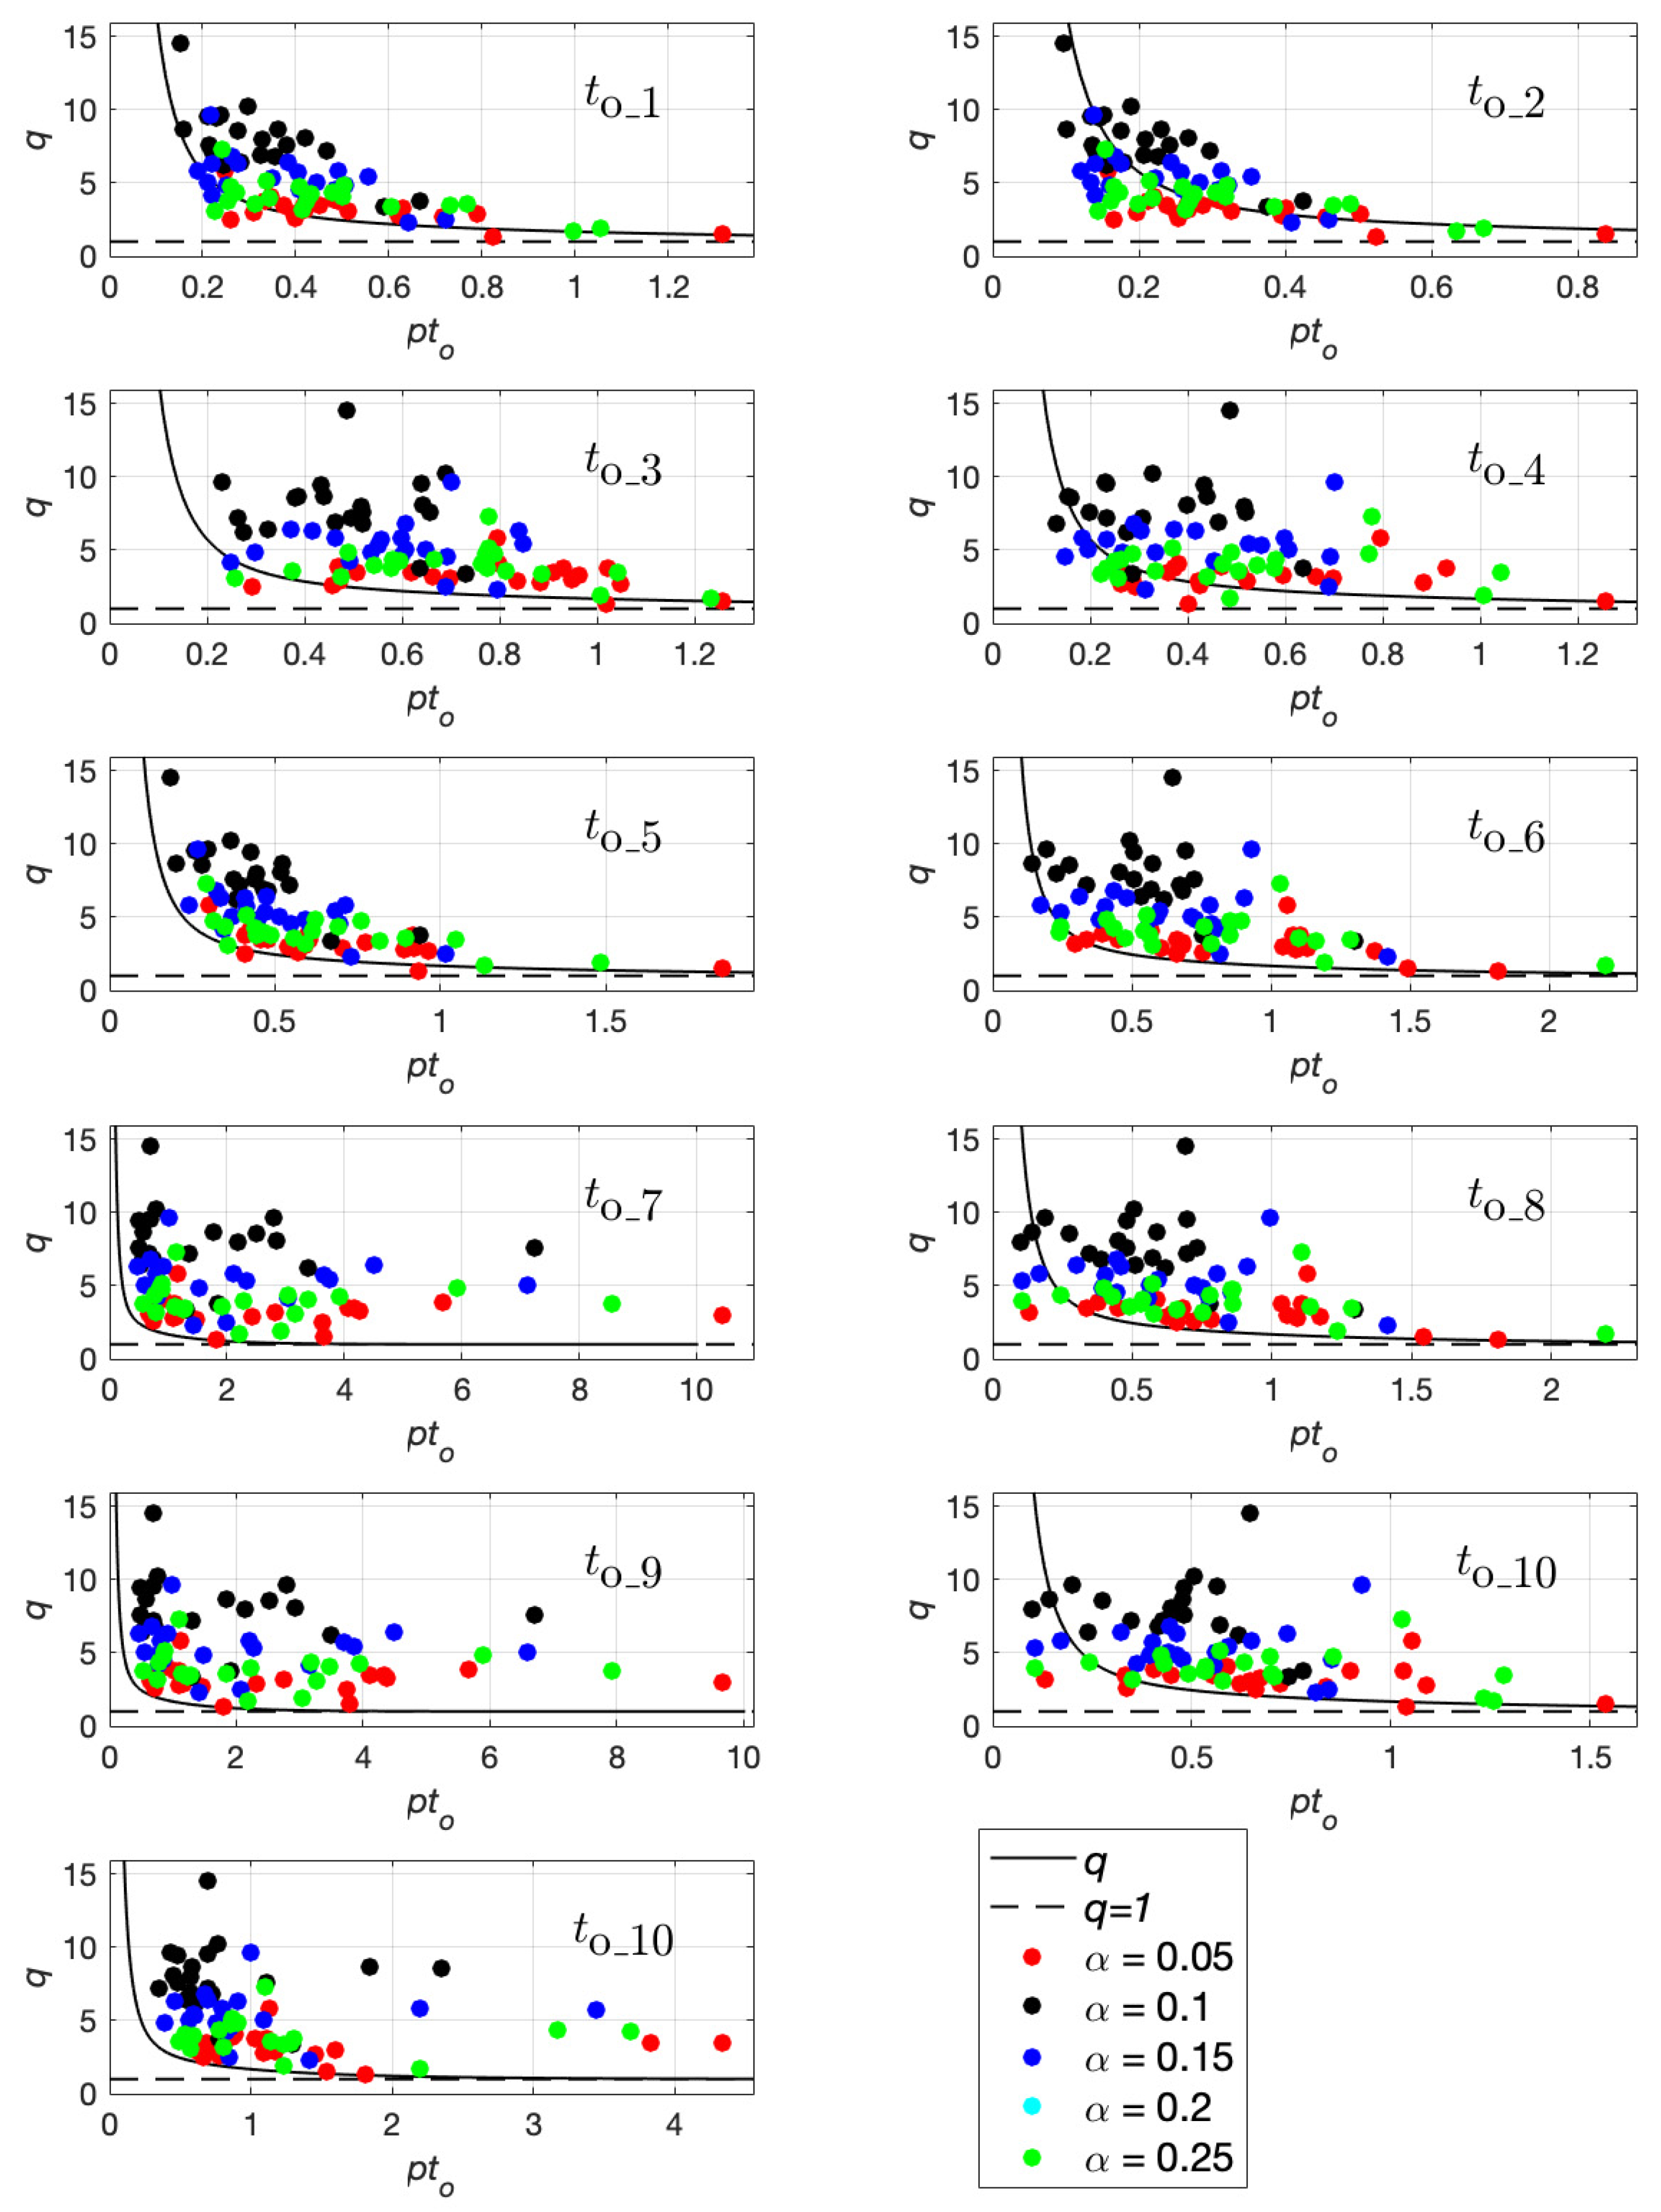
4. Comparison Between Natural Accelerograms and Simple Input for the Earthquake
- -
- -
- -
- -
- -
- to_5 is evaluated as half of the inverse of the frequency of an equivalent harmonic wave [44]:
- -
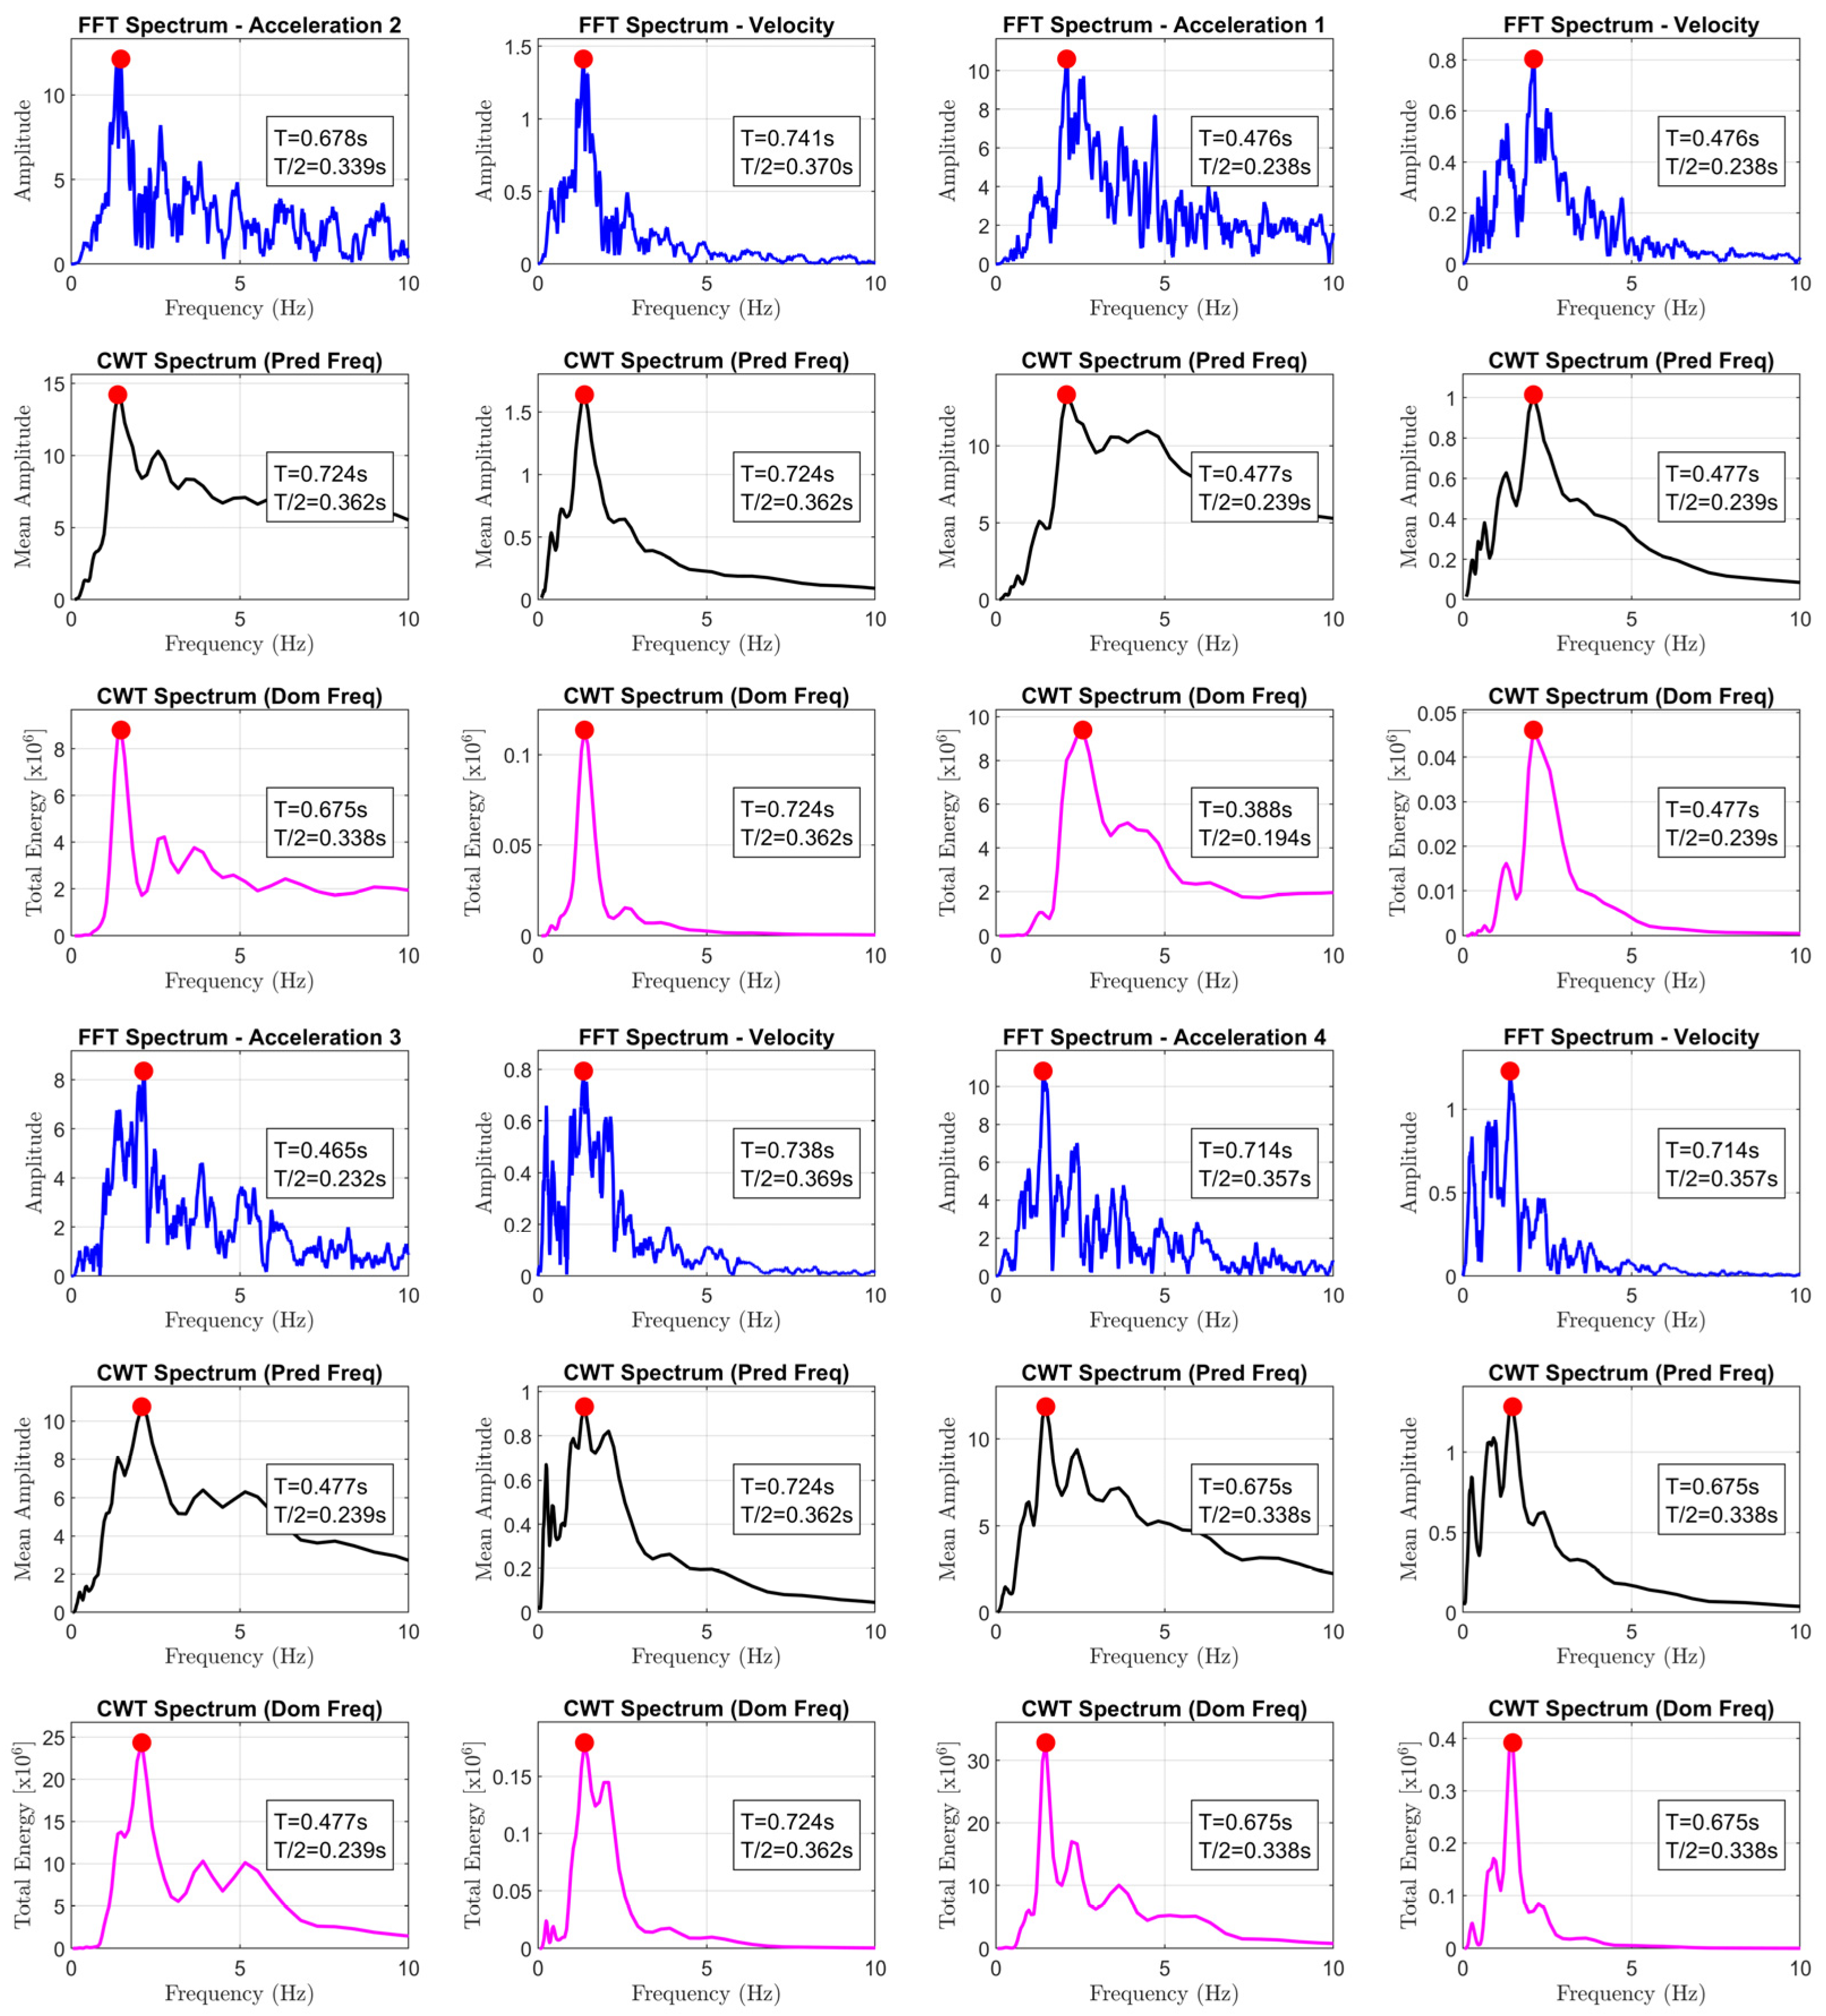
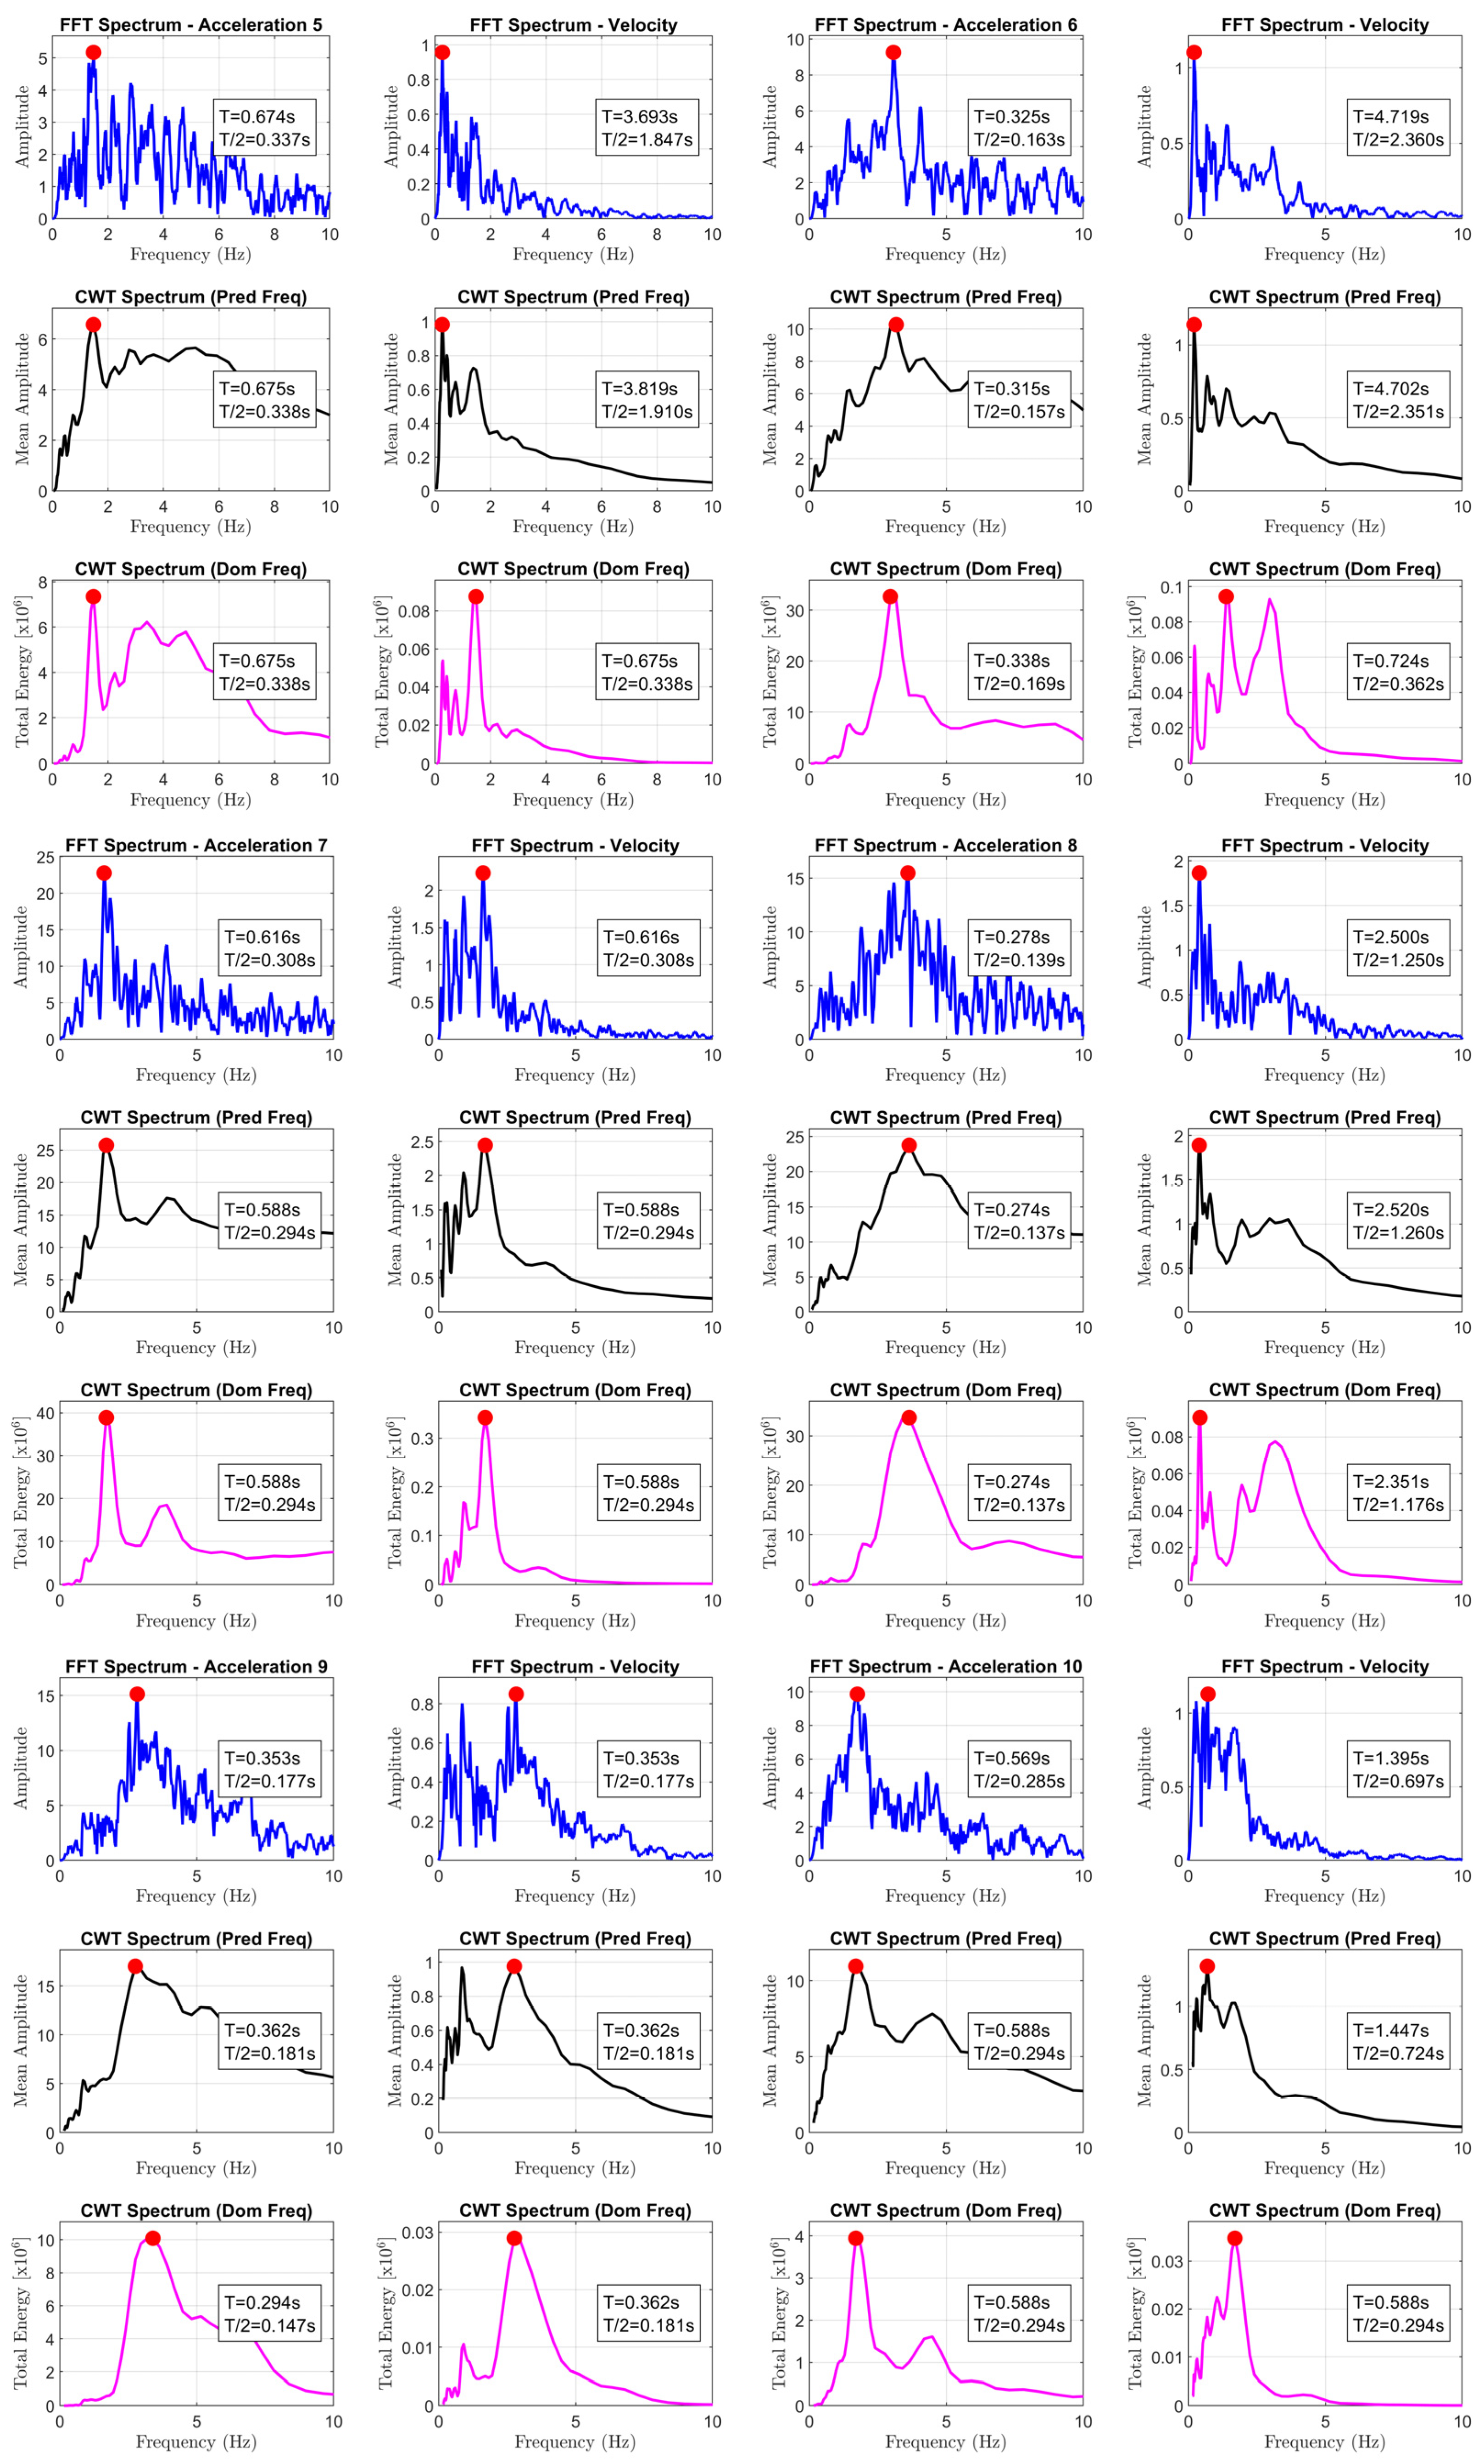
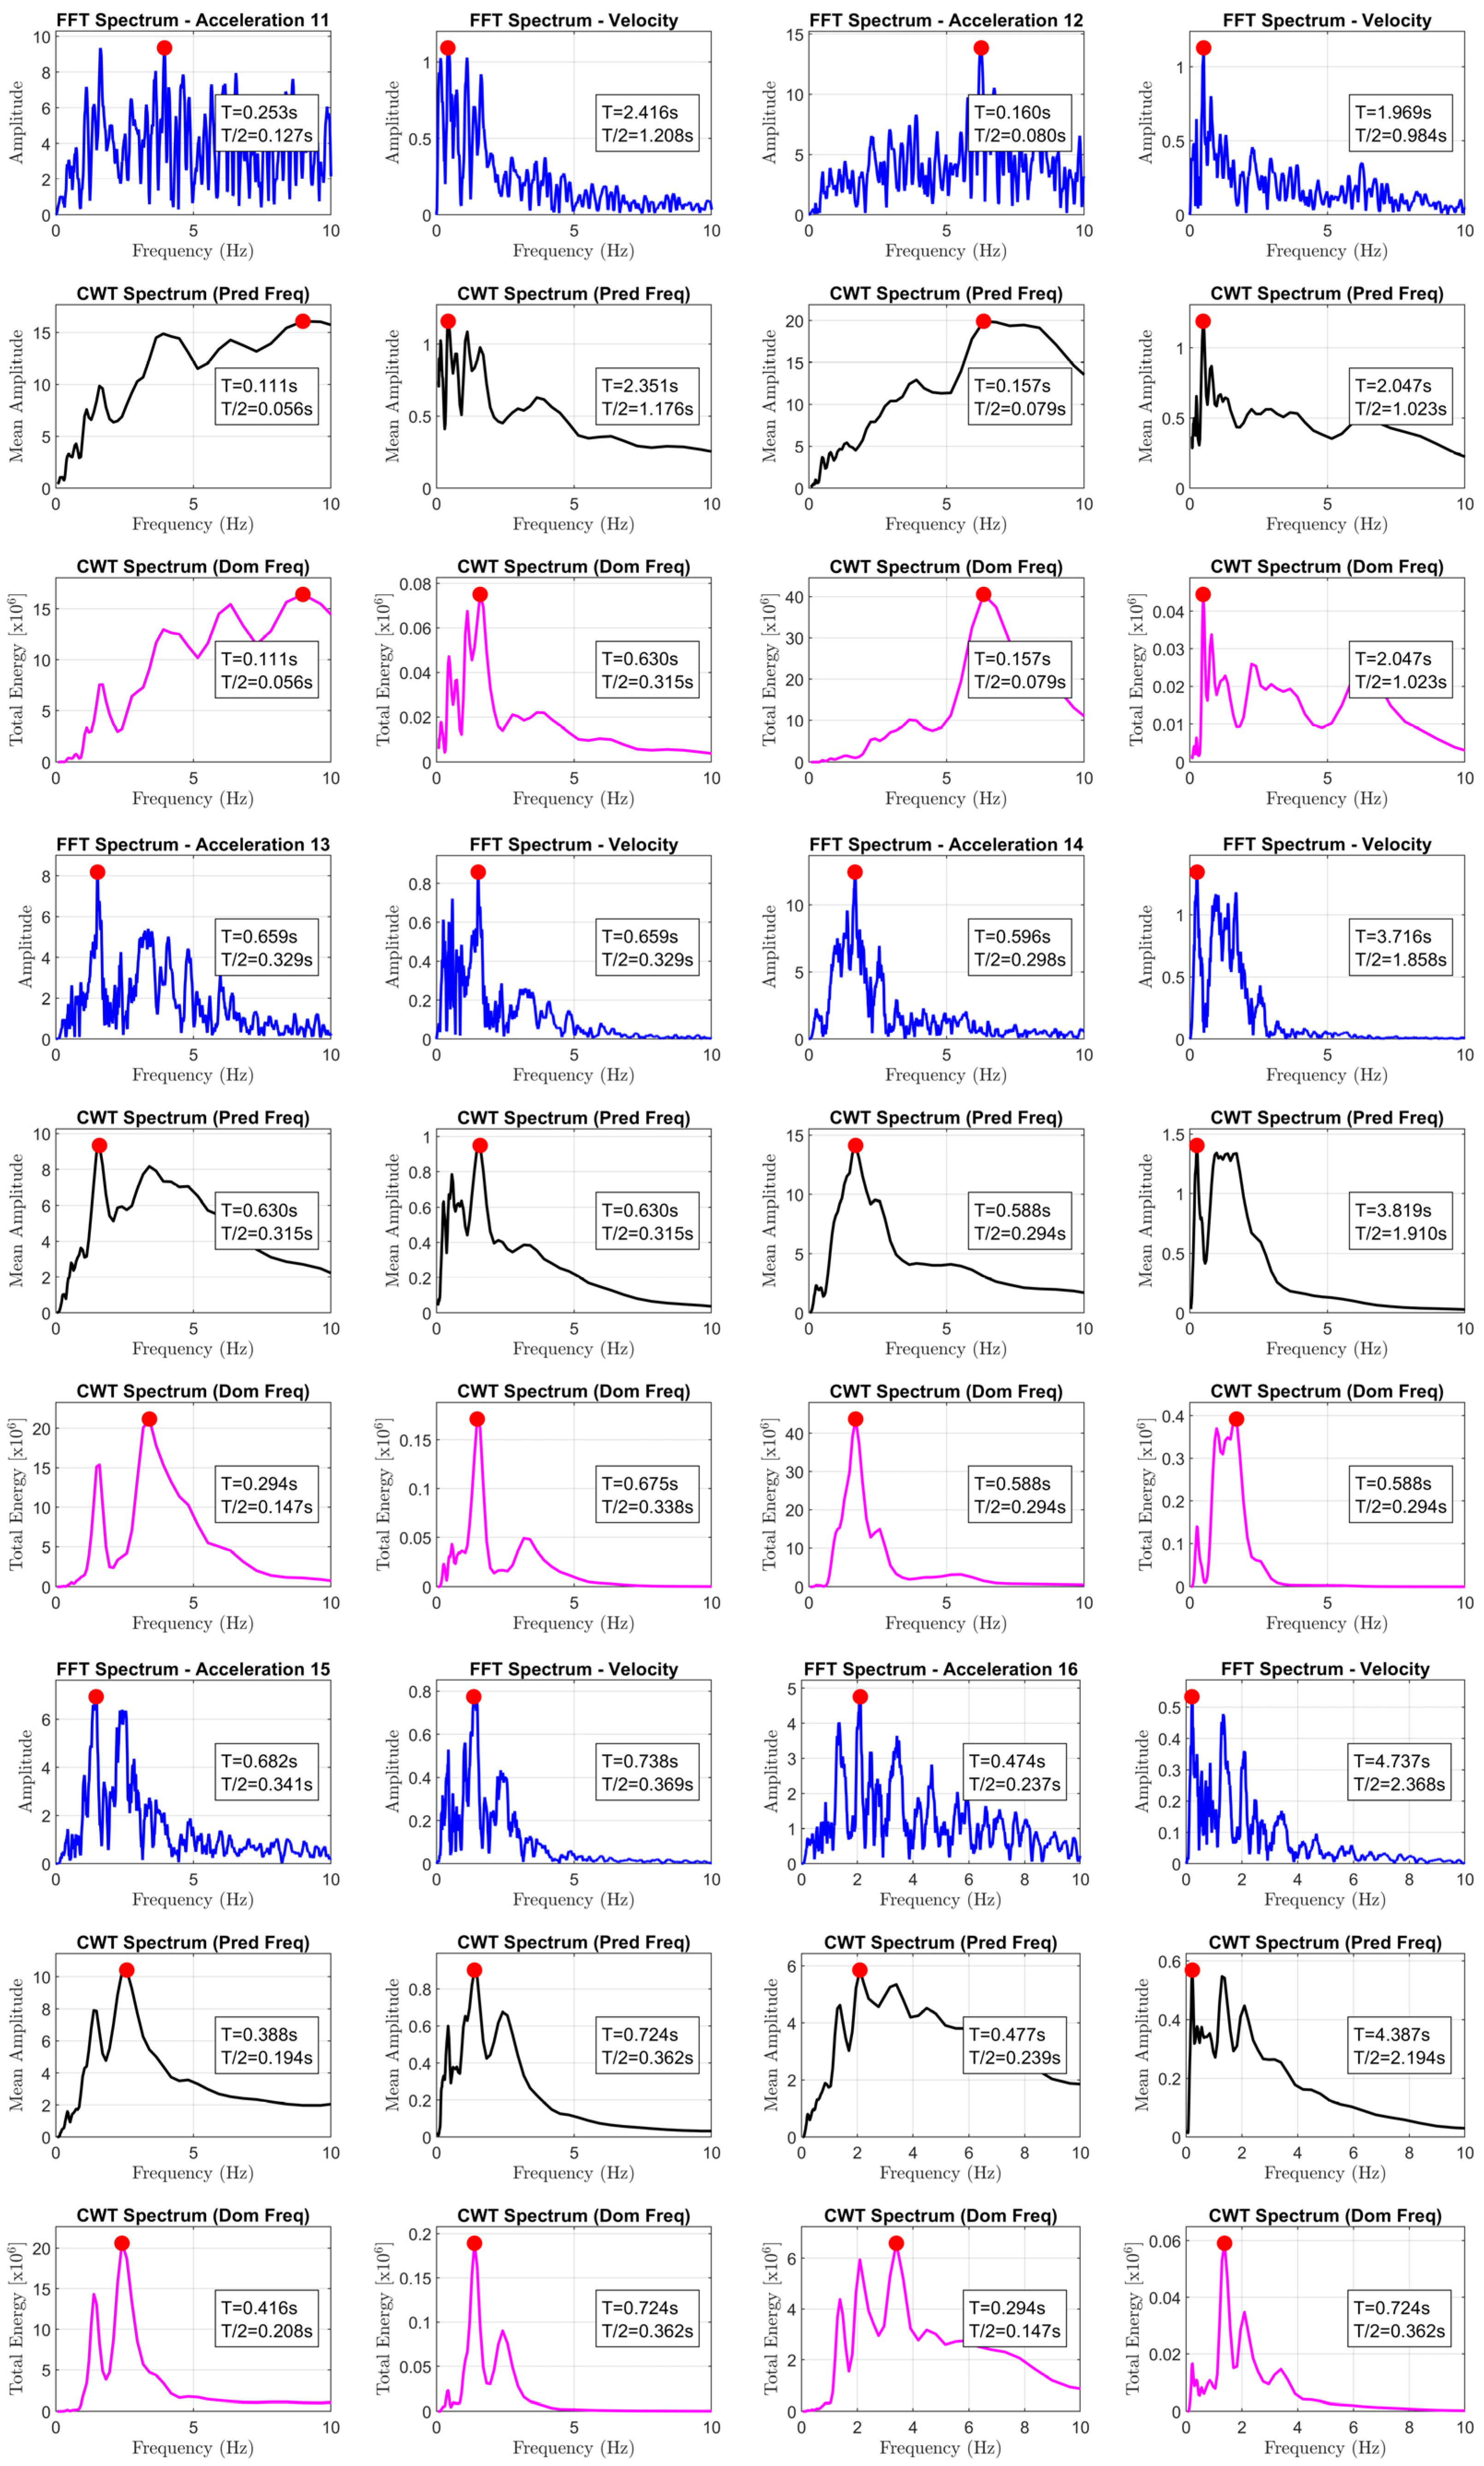
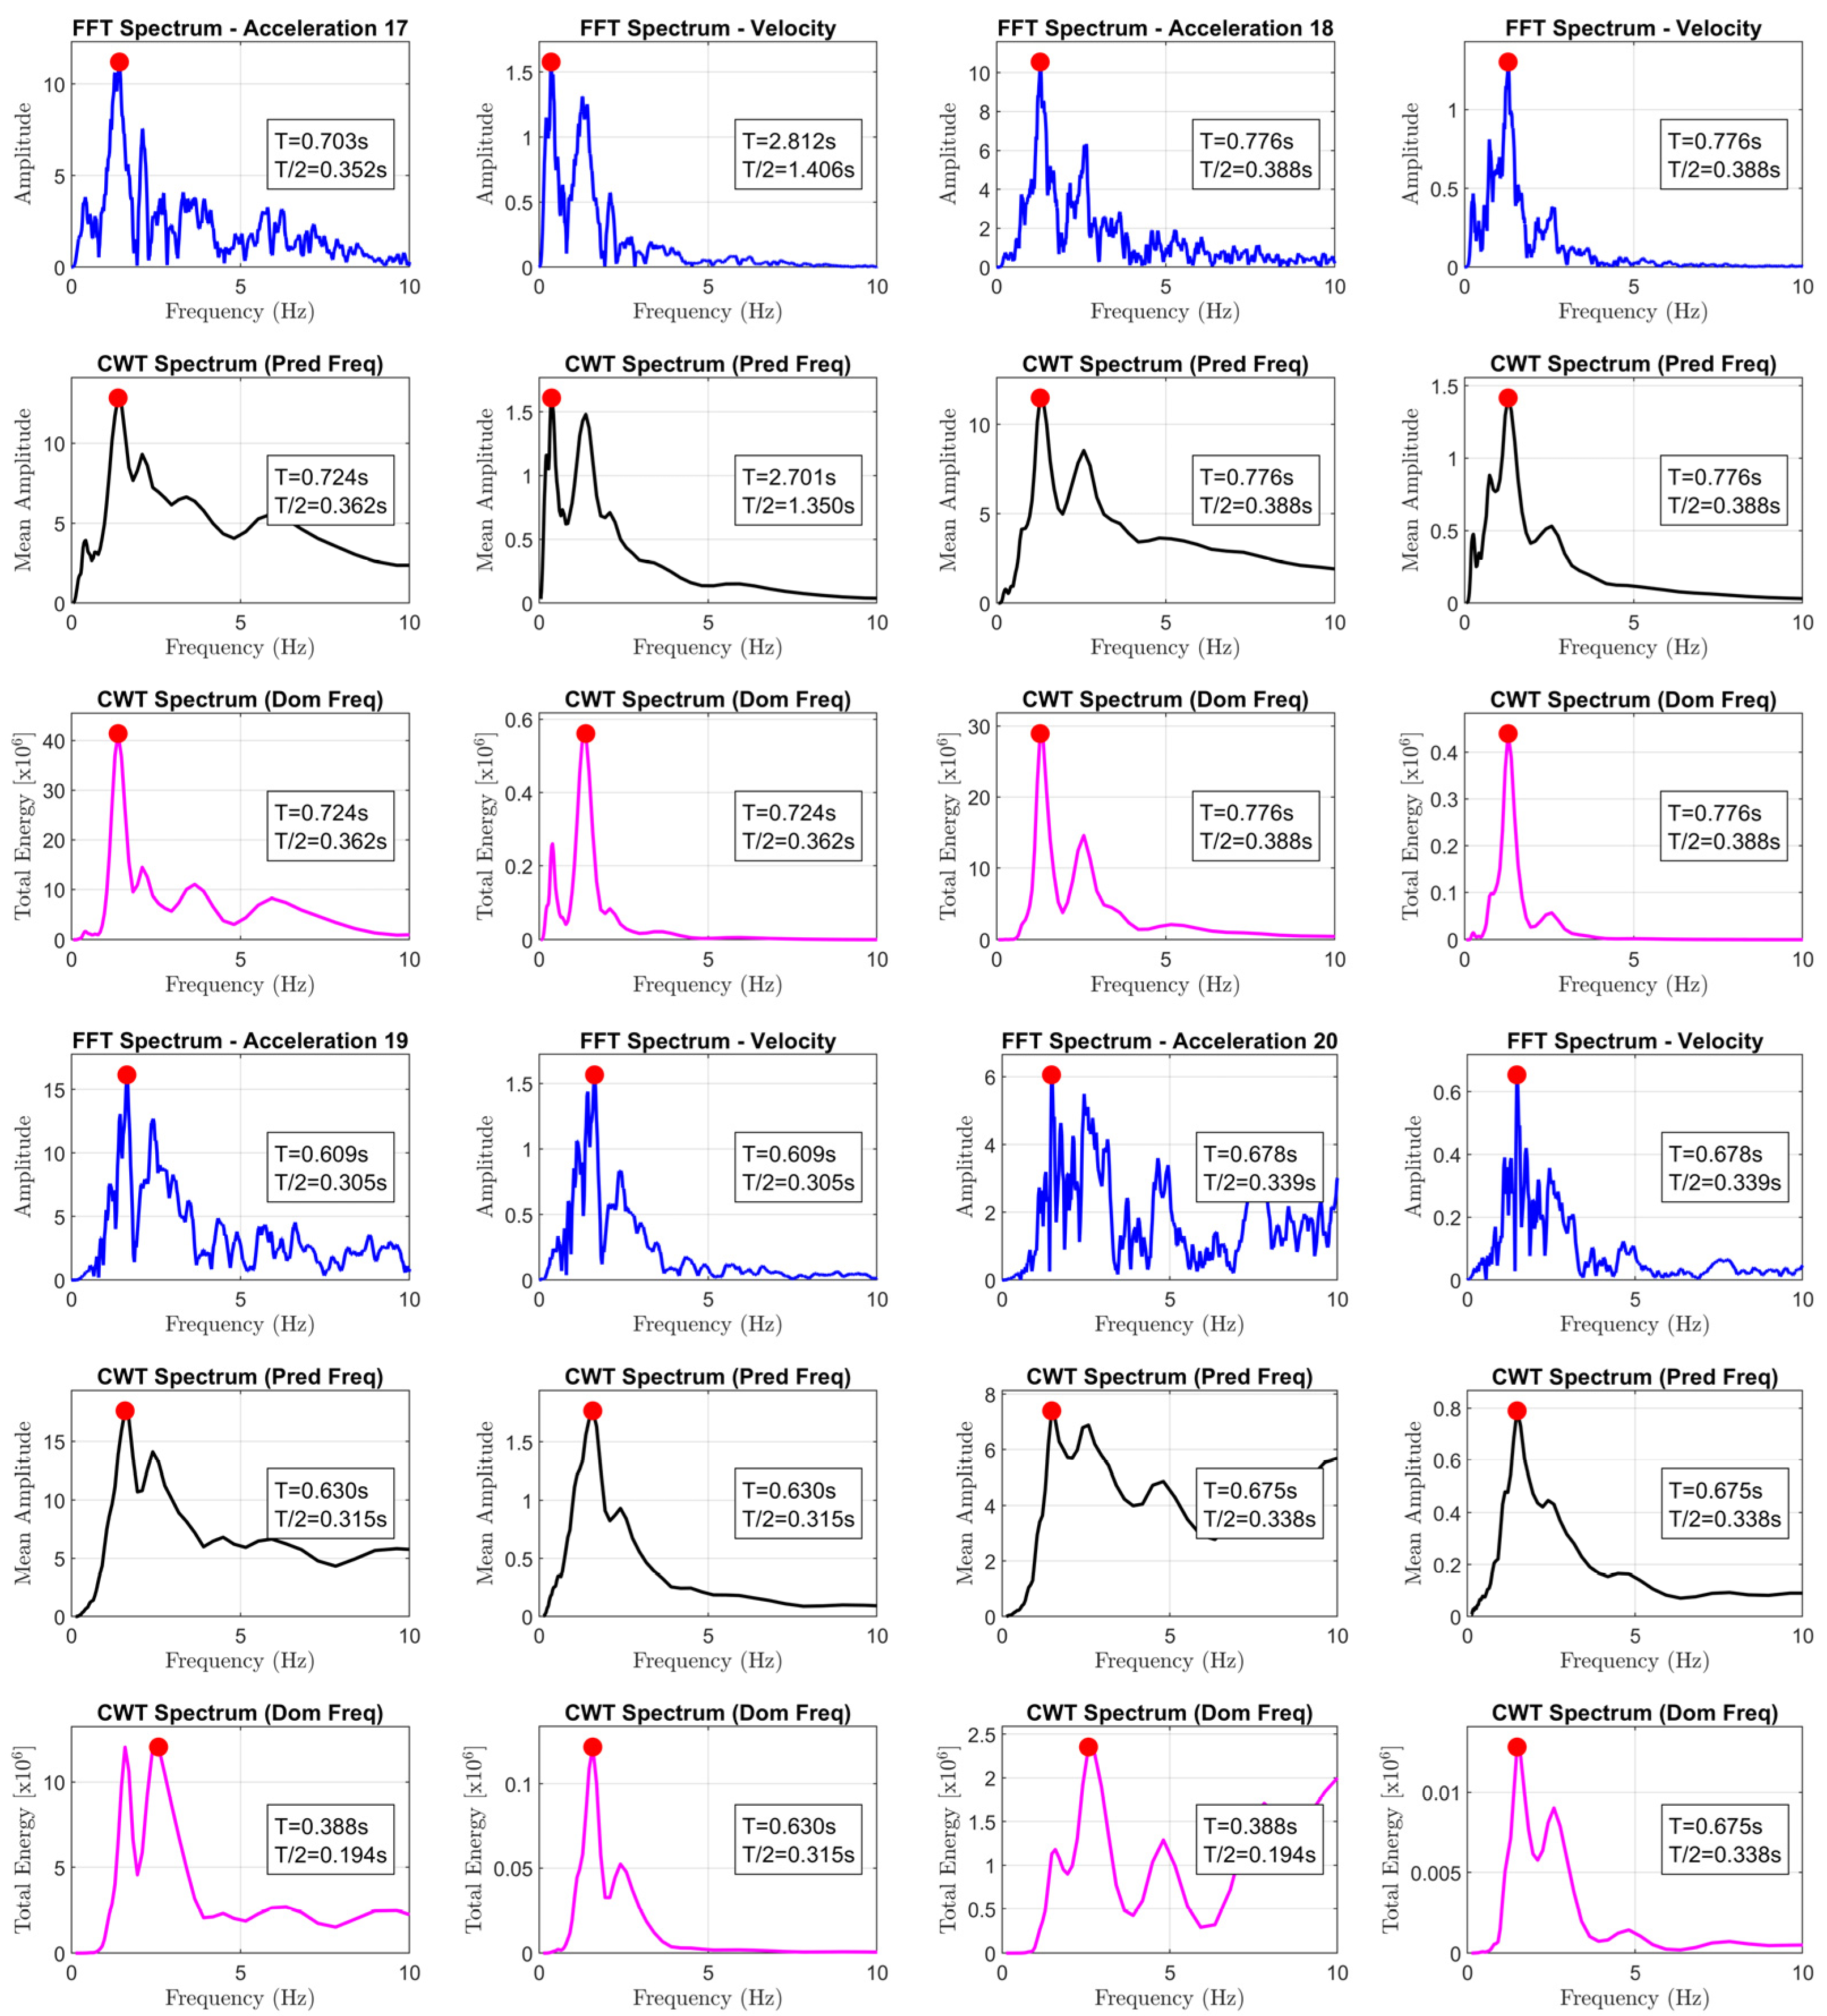
- to_6 is equal to half the inverse of the frequency that maximizes the Fourier amplitude spectra of ground acceleration time-history (the results are reported in Appendix A);
- -
- to_7 is equal to half the inverse of the frequency that maximizes the Fourier amplitude spectra of ground velocity time-history (the results are reported in Appendix A);
- -
- to_8 and to_10 are equal to half the inverse of the frequencies that maximize the amplitude or the total energy, respectively, of the wavelet analysis considering the ground acceleration time-history (the results are reported in Appendix A);
- -
- to_9 and to_11 are equal to half the inverse of the frequencies that maximize the mean amplitude or the total energy, respectively, of the wavelet analysis considering the ground velocity time-history (the results are reported in Appendix A).
5. Conclusions
Funding
Data Availability Statement
Conflicts of Interest
Appendix A
References
- Bernardo, V.; Campos Costa, A.; Lourenço, P.B. Stochastic-based vulnerability curves for the out-of-plane seismic safety assessment of URM walls. Bull. Earthq. Eng. 2024, 22, 435–459. [Google Scholar] [CrossRef]
- Ghezelbash, A.; Sharma, S.; D’Altri, A.M.; Lourenço, P.B.; Rots, J.G.; Messali, F. Challenges in High-Fidelity Implicit Block-Based Numerical Simulation of Dynamic Out-of-Plane Two-Way Bending in Unreinforced Brick Masonry Walls. Earthq. Eng. Struct. Dyn. 2025, 54, 1836–1858. [Google Scholar] [CrossRef]
- Mazzeo, M.; Laudani, R.; Santoro, R. Uncertainty effect on seismic capacity assessment in the out-of-plane failure mechanisms of masonry structures by probabilistic and non-probabilistic approaches. Dev. Built Environ. 2024, 17, 100366. [Google Scholar] [CrossRef]
- Manikandan, K.; Nidhi, M.; Micelli, F.; Cascardi, A.; Sivasubramanian, M.V. Seismic vulnerability assessment of slender masonry structures: A machine learning approach with vibration-based assessment and nonlinear dynamic analysis. Structures 2025, 79, 109272. [Google Scholar] [CrossRef]
- De Felice, G. Out-of-plane seismic capacity of masonry depending on wall section morphology. Int. J. Archit. Herit. 2011, 5, 466–482. [Google Scholar] [CrossRef]
- Housner, G.W. The behavior of inverted pendulum structures during earthquakes. Bull. Seismol. Soc. Am. 1963, 53, 403–417. [Google Scholar] [CrossRef]
- Yim, C.S.; Chopra, A.K.; Penzien, J. Rocking response of rigid blocks to earthquakes. Earthq. Eng. Struct. Dyn. 1980, 8, 565–587. [Google Scholar] [CrossRef]
- Aslam, M.; Godden, W.G.; Scalise, D.T. Earthquake rocking response of rigid bodies. J. Struct. Div. 1980, 106, 377–392. [Google Scholar] [CrossRef]
- Makris, N.; Kampas, G. Size versus slenderness: Two competing parameters in the seismic stability of free-standing rocking columns. Bull. Seismol. Soc. Am. 2016, 106, 104–122. [Google Scholar] [CrossRef]
- Coccia, S.; Como, M.; Di Carlo, F. The slender rigid block: Archetype for the seismic analysis of masonry structures. J. Earthq. Eng. 2023, 27, 2630–2654. [Google Scholar] [CrossRef]
- Makris, N.; Roussos, Y. Rocking Response and Overturning of Equipment Under Horizontal Pulse-Type Motions; Pacific Earthquake Engineering Research Center: Berkeley, CA, USA, 1998. [Google Scholar]
- Zhang, J.; Makris, N. Rocking response of free-standing blocks under cycloidal pulses. J. Eng. Mech. 2001, 127, 473–483. [Google Scholar] [CrossRef]
- Kounadis, A.N. On the overturning instability of a rectangular rigid block under ground excitation. Open Mech. J. 2010, 4, 43–57. [Google Scholar] [CrossRef]
- Hao, H.; Zhou, Y. Rigid structure response analysis to seismic and blast induced ground motions. Procedia Eng. 2011, 14, 946–955. [Google Scholar] [CrossRef]
- Dimitrakopoulos, E.G.; Fung, E.D.W. Closed-form rocking overturning conditions for a family of pulse ground motions. Proc. R. Soc. A Math. Phys. Eng. Sci. 2016, 472, 20160662. [Google Scholar] [CrossRef] [PubMed]
- Voyagaki, E.; Psycharis, I.N.; Mylonakis, G. Complex response of a rocking block to a full-cycle pulse. J. Eng. Mech. 2014, 140, 04014024-1–04014024-15. [Google Scholar] [CrossRef]
- Nabeshima, K.; Taniguchi, R.; Kojima, K.; Takewaki, I. Closed-form overturning limit of rigid block under critical near-fault ground motions. Front. Built Environ. 2016, 2, 9. [Google Scholar] [CrossRef]
- Taniguchi, R.; Nabeshima, K.; Kojima, K.; Takewaki, I. Closed-form rocking vibration of rigid block under critical and non-critical double impulse. Int. J. Earthq. Impact Eng. 2017, 2, 32–45. [Google Scholar] [CrossRef]
- Dimitrakopoulos, E.G.; DeJong, M.J. Revisiting the rocking block: Closed-form solutions and similarity laws. Proc. R. Soc. A Math. Phys. Eng. Sci. 2012, 468, 2294–2318. [Google Scholar] [CrossRef]
- Coccia, S.; Como, M. A new theory of the dynamical collapse of no-tension structures under sequences of pulses of horizontal acceleration. Meccanica 2025, 1–14. [Google Scholar] [CrossRef]
- Coccia, S.; Di Carlo, F.; Imperatore, S. Force reduction factor for out-of-plane simple mechanisms of masonry structures. Bull. Earthq. Eng. 2017, 15, 1241–1259. [Google Scholar] [CrossRef]
- Psycharis, I.N.; Papastamatiou, D.Y.; Alexandris, A.P. Parametric investigation of the stability of classical columns under harmonic and earthquake excitations. Earthq. Eng. Struct. Dyn. 2000, 29, 1093–1109. [Google Scholar] [CrossRef]
- Spanos, P.D.; Roussis, P.C.; Politis, N.P.A. Dynamic analysis of stacked rigid blocks. Soil Dyn. Earthq. Eng. 2001, 21, 559–578. [Google Scholar] [CrossRef]
- Ther, T.; Kollár, L.P. Model for multiblock columns subjected to base excitation. Earthq. Eng. Struct. Dyn. 2018, 47, 418–437. [Google Scholar] [CrossRef]
- Como, M.; Di Carlo, F.; Coccia, S. Dynamic response of rocking cracked masonry walls. Meccanica 2019, 54, 381–398. [Google Scholar] [CrossRef]
- Coccia, S.; Como, M. Out-of-Plane Dynamical Strength of Masonry Walls Under Seismic Actions. J. Earthq. Eng. 2024, 28(4), 1040–1068. [Google Scholar] [CrossRef]
- Destro Bisol, G.; Prajapati, S.; Sorrentino, L.; AlShawa, O. Vertical spanning wall elastically restrained at the top: Validation and parametric dynamic analysis. Bull. Earthq. Eng. 2024, 22, 3951–3978. [Google Scholar] [CrossRef]
- Oppenheim, I.J. The masonry arch as a four-link mechanism under base motion. Earthq. Eng. Struct. Dyn. 1992, 21, 1005–1017. [Google Scholar] [CrossRef]
- De Lorenzis, L.; DeJong, M.; Ochsendorf, J. Failure of masonry arches under impulse base motion. Earthq. Eng. Struct. Dyn. 2007, 36, 2119–2136. [Google Scholar] [CrossRef]
- Carlo, F.D.; Coccia, S.; Piedigrossi, M. Dynamics of masonry pointed arches under base motion. Int. J. Mason. Res. Innov. 2017, 2, 335–354. [Google Scholar] [CrossRef]
- Coccia, S.; Como, M. Dynamical Collapse of Masonry Arches Under Sequences of Impulses of Horizontal Acceleration. J. Earthq. Eng. 2024, 28, 4644–4671. [Google Scholar] [CrossRef]
- Bisegna, P.; Coccia, S.; Como, M.; Nodargi, N.A. A novel impact model for the rocking motion of masonry arches. Meccanica 2023, 58, 2079–2093. [Google Scholar] [CrossRef]
- Giresini, L. Effect of dampers on the seismic performance of masonry walls assessed through fragility and demand hazard curves. Eng. Struct. 2022, 261, 114295. [Google Scholar] [CrossRef]
- Nodargi, N.A.; Bisegna, P. Seismic fragility of free-standing rocking-sliding rigid blocks under earthquake excitation. Meccanica 2025, 1–25. [Google Scholar] [CrossRef]
- Giresini, L.; Solarino, F.; AlShawa, O. Dissipative tie-rods restraining one-sided rocking masonry walls: Analytical formulation and experimental tests. Bull. Earthq. Eng. 2025, 23, 779–804. [Google Scholar] [CrossRef]
- Lv, Y.; Liu, P.; Li, F. Rocking responses of free-standing rigid blocks on flexible foundation with a slope under earthquakes: Structure-foundation interaction effects. J. Vibroeng. 2025, 27, 462–478. [Google Scholar] [CrossRef]
- Destro Bisol, G.; DeJong, M.J.; Liberatore, D.; Sorrentino, L. Displacement-based design procedures for rigid block isolation. Earthq. Eng. Struct. Dyn. 2024, 53, 1552–1572. [Google Scholar] [CrossRef]
- Casapulla, C.; Giresini, L.; Argiento, L.U.; Maione, A. Nonlinear static and dynamic analysis of rocking masonry corners using rigid macro-block modeling. Int. J. Struct. Stab. Dyn. 2019, 19, 1950137. [Google Scholar] [CrossRef]
- Mavroeidis, G.P.; Dong, G.; Papageorgiou, A.S. Near-fault ground motions, and the response of elastic and inelastic single-degree-of-freedom (SDOF) systems. Earthq. Eng. Struct. Dyn. 2004, 33, 1023–1049. [Google Scholar] [CrossRef]
- Pelekis, I.; Madabhushi, G.S.; DeJong, M.J. Soil behaviour beneath buildings with structural and foundation rocking. Soil Dyn. Earthq. Eng. 2019, 123, 48–63. [Google Scholar] [CrossRef]
- MATLAB, Version R2024b; The MathWorks Inc.: Natick, MA, USA, 2024.
- Várkonyi, P.L.; Kocsis, M.; Ther, T. Rigid impacts of three-dimensional rocking structures. Nonlinear Dyn. 2022, 107, 1839–1858. [Google Scholar] [CrossRef]
- D’Amico, M.; Felicetta, C.; Russo, E.; Sgobba, S.; Lanzano, G.; Pacor, F.; Luzi, L. The new Italian accelerometric archive ITACA: Database, web-services, and tools to access and analyze earthquakes waveforms. Rapp. Tec. INGV 2021. [CrossRef]
- Kramer, S.L. Geotechnical Earthquake Engineering; Prentice Hall: New York, NY, USA, 1996; p. 794. [Google Scholar]
- delle Infrastrutture, M. Istruzioni per l’applicazione delle nuove norme tecniche per le costruzioni di cui al decreto ministeriale 14 gennaio 2008. Supplemento ordinario n. 27 alla Gazzetta Ufficiale 26 febbraio 2009, 47, 229–392. [Google Scholar]


| Case | PGA [cm/s2] | PGV [cm/s] | Station | Date | Epicentral Distance [km] | Direction | Slenderness α | |||||||||
|---|---|---|---|---|---|---|---|---|---|---|---|---|---|---|---|---|
| 0.05 | 0.1 | 0.15 | 0.2 | 0.25 | ||||||||||||
| q | p | q | p | q | p | q | p | q | p | |||||||
| 1 | 933.52 | 26.19 | T1245 | 26 October 2016 | 7.1 | E | 19.03 | 1.9 | 9.52 | 2.91 | 6.34 | 3.81 | 4.76 | 3.59 | 3.81 | 4.64 |
| 2 | 1423.06 | 43.57 | N | 29.01 | 1.62 | 14.51 | 1.91 | 9.67 | 2.75 | 7.25 | 3.05 | 5.80 | 3.12 | |||
| 3 | 1001.65 | 55.04 | MZ24 | 30 October 2016 | 24.4 | E | 20.42 | 1.22 | 10.21 | 2.12 | 6.81 | 1.87 | 5.11 | 2.39 | 4.08 | 2.46 |
| 4 | 747.74 | −73.6 | N | 15.24 | 1.2 | 7.62 | 1.42 | 5.08 | 1.66 | 3.81 | 1.58 | 3.05 | 1.91 | |||
| 5 | 612.63 | −40.98 | MZ51 | 30 October 2016 | 25.9 | E | 12.49 | 1.5 | 6.24 | 1.83 | 4.16 | 1.65 | 3.12 | 1.71 | 2.50 | 1.96 |
| 6 | 947.25 | −74.98 | N | 19.31 | 0.95 | 9.66 | 1.19 | 6.44 | 1.91 | 4.83 | 2.51 | 3.86 | 2.41 | |||
| 7 | 931.14 | 77.3 | FCC | 30 October 2016 | 10.9 | E | 18.98 | 0.8 | 9.49 | 1.64 | 6.33 | 1.57 | 4.75 | 2.91 | 3.80 | 3.51 |
| 8 | 843.73 | −37.81 | N | 17.20 | 1.06 | 8.60 | 2 | 5.73 | 2.93 | 4.30 | 3.14 | 3.44 | 3.26 | |||
| 9 | 850.8 | 43.55 | AMT | 24 August 2016 | 8.5 | E | 17.35 | 1.94 | 8.67 | 3.25 | 5.78 | 4.43 | 4.34 | 4.31 | 3.47 | 3.76 |
| 10 | 368.39 | −41.5 | N | 7.51 | 2.01 | 3.76 | 2.65 | 2.50 | 2.87 | 1.88 | 4.2 | 1.50 | 5.24 | |||
| 11 | 779.27 | −60.73 | T1213 | 30 October 2016 | 12.6 | E | 15.89 | 1.02 | 7.94 | 1.81 | 5.30 | 1.93 | 3.97 | 1.9 | 3.18 | 2.33 |
| 12 | 849.97 | −30.54 | N | 17.33 | 1.58 | 8.66 | 1.8 | 5.78 | 2.15 | 4.33 | 3.1 | 3.47 | 4.24 | |||
| 13 | 633.77 | 50.08 | MZ04 | 30 October 2016 | 23 | E | 12.92 | 1.41 | 6.46 | 1.62 | 4.31 | 2.46 | 3.23 | 2.38 | 2.58 | 2.29 |
| 14 | 793.29 | −85.39 | N | 16.17 | 0.8 | 8.09 | 1.53 | 5.39 | 2.02 | 4.04 | 1.82 | 3.23 | 2.29 | |||
| 15 | 668.61 | 50.91 | MZ28 | 30 October 2016 | 28.4 | E | 13.63 | 1.17 | 6.82 | 2 | 4.54 | 2.3 | 3.41 | 3.41 | 2.73 | 4.03 |
| 16 | 741.31 | 28.93 | N | 15.11 | 1.91 | 7.56 | 3.06 | 5.04 | 3.01 | 3.78 | 3.61 | 3.02 | 4.41 | |||
| 17 | 707.01 | 92.22 | MZ12 | 30 October 2016 | 27.1 | E | 14.41 | 0.78 | 7.21 | 0.96 | 4.80 | 1.09 | 3.60 | 1.36 | 2.88 | 1.72 |
| 18 | 672.93 | 67.79 | E | 13.72 | 1.41 | 6.86 | 1.47 | 4.57 | 2.2 | 3.43 | 3.31 | 2.74 | 2.81 | |||
| 19 | 706.8 | 55.7 | CMI | 30 October 2016 | 5.7 | N | 14.41 | 1.91 | 7.20 | 2.2 | 4.80 | 2.39 | 3.60 | 3.61 | 2.88 | 3.72 |
| 20 | 334.77 | 18.62 | E | 6.83 | 2.99 | 3.41 | 3.84 | 2.28 | 4.19 | 1.71 | 6.5 | 1.37 | 5.36 | |||
| Case | to_1 | to_2 | to_3 | to_4 | to_5 | to_6 | to_7 | to_8 | to_9 | to_10 | to_11 |
|---|---|---|---|---|---|---|---|---|---|---|---|
| 1 | 0.072 | 0.046 | 0.220 | 0.080 | 0.088 | 0.238 | 0.238 | 0.239 | 0.239 | 0.194 | 0.239 |
| 2 | 0.079 | 0.051 | 0.255 | 0.255 | 0.096 | 0.339 | 0.370 | 0.362 | 0.362 | 0.338 | 0.362 |
| 3 | 0.141 | 0.090 | 0.325 | 0.155 | 0.173 | 0.232 | 0.369 | 0.239 | 0.362 | 0.239 | 0.362 |
| 4 | 0.268 | 0.171 | 0.365 | 0.365 | 0.309 | 0.357 | 0.357 | 0.338 | 0.338 | 0.338 | 0.338 |
| 5 | 0.133 | 0.085 | 0.150 | 0.150 | 0.210 | 0.337 | 1.847 | 0.338 | 1.910 | 0.338 | 0.338 |
| 6 | 0.200 | 0.127 | 0.195 | 0.195 | 0.249 | 0.163 | 2.360 | 0.157 | 2.351 | 0.169 | 0.362 |
| 7 | 0.140 | 0.089 | 0.265 | 0.265 | 0.261 | 0.308 | 0.308 | 0.294 | 0.294 | 0.294 | 0.294 |
| 8 | 0.138 | 0.088 | 0.190 | 0.080 | 0.141 | 0.139 | 1.250 | 0.137 | 1.260 | 0.137 | 1.176 |
| 9 | 0.111 | 0.071 | 0.135 | 0.135 | 0.161 | 0.177 | 0.177 | 0.181 | 0.181 | 0.147 | 0.181 |
| 10 | 0.251 | 0.160 | 0.240 | 0.240 | 0.354 | 0.285 | 0.697 | 0.294 | 0.724 | 0.294 | 0.294 |
| 11 | 0.181 | 0.115 | 0.285 | 0.285 | 0.245 | 0.127 | 1.208 | 0.056 | 1.176 | 0.056 | 0.315 |
| 12 | 0.088 | 0.056 | 0.215 | 0.085 | 0.113 | 0.080 | 0.984 | 0.079 | 1.023 | 0.079 | 1.023 |
| 13 | 0.174 | 0.111 | 0.200 | 0.185 | 0.248 | 0.329 | 0.329 | 0.315 | 0.315 | 0.147 | 0.338 |
| 14 | 0.276 | 0.175 | 0.420 | 0.260 | 0.338 | 0.298 | 1.858 | 0.294 | 1.910 | 0.294 | 0.294 |
| 15 | 0.177 | 0.113 | 0.260 | 0.065 | 0.239 | 0.341 | 0.369 | 0.194 | 0.362 | 0.208 | 0.362 |
| 16 | 0.070 | 0.045 | 0.215 | 0.065 | 0.123 | 0.237 | 2.368 | 0.239 | 2.194 | 0.147 | 0.362 |
| 17 | 0.231 | 0.147 | 0.275 | 0.245 | 0.410 | 0.352 | 1.406 | 0.362 | 1.350 | 0.362 | 0.362 |
| 18 | 0.221 | 0.141 | 0.315 | 0.315 | 0.316 | 0.388 | 0.388 | 0.388 | 0.388 | 0.388 | 0.388 |
| 19 | 0.212 | 0.135 | 0.225 | 0.140 | 0.248 | 0.305 | 0.305 | 0.315 | 0.315 | 0.194 | 0.315 |
| 20 | 0.154 | 0.098 | 0.190 | 0.075 | 0.174 | 0.339 | 0.339 | 0.338 | 0.338 | 0.194 | 0.338 |
Disclaimer/Publisher’s Note: The statements, opinions and data contained in all publications are solely those of the individual author(s) and contributor(s) and not of MDPI and/or the editor(s). MDPI and/or the editor(s) disclaim responsibility for any injury to people or property resulting from any ideas, methods, instructions or products referred to in the content. |
© 2025 by the author. Licensee MDPI, Basel, Switzerland. This article is an open access article distributed under the terms and conditions of the Creative Commons Attribution (CC BY) license (https://creativecommons.org/licenses/by/4.0/).
Share and Cite
Coccia, S. Analytical Derivation of the q-Factor for Slender Masonry Structures Under Out-of-Plane Seismic Action. Buildings 2025, 15, 2622. https://doi.org/10.3390/buildings15152622
Coccia S. Analytical Derivation of the q-Factor for Slender Masonry Structures Under Out-of-Plane Seismic Action. Buildings. 2025; 15(15):2622. https://doi.org/10.3390/buildings15152622
Chicago/Turabian StyleCoccia, Simona. 2025. "Analytical Derivation of the q-Factor for Slender Masonry Structures Under Out-of-Plane Seismic Action" Buildings 15, no. 15: 2622. https://doi.org/10.3390/buildings15152622
APA StyleCoccia, S. (2025). Analytical Derivation of the q-Factor for Slender Masonry Structures Under Out-of-Plane Seismic Action. Buildings, 15(15), 2622. https://doi.org/10.3390/buildings15152622