Article

Shear Performance of UHPC-NC Composite Structure Interface Treated with Retarder: Quantification by Fractal Dimension and Optimization of Process Parameters

by
Runcai Weng
1,
Zhaoxiang He
1,
Jiajie Liu
1,
Bin Lei
2,
Linhai Huang
1,
Jiajing Xu
3,
Lingfei Liu
4 and
Jie Xiao
1,*
1
School of Civil and Transportation Engineering, Guangdong University of Technology, Guangzhou 510006, China
2
Guangzhou Krystic Material Technology Co., Ltd., Guangzhou 510940, China
3
School of Transportation and Civil Engineering, Nantong University, Nantong 226019, China
4
School of Transportation, Civil Engineering & Architecture, Foshan University, Foshan 528225, China
*
Author to whom correspondence should be addressed.
Buildings 2025, 15(15), 2591; https://doi.org/10.3390/buildings15152591
Submission received: 19 June 2025 / Revised: 16 July 2025 / Accepted: 21 July 2025 / Published: 22 July 2025
(This article belongs to the Special Issue Low Carbon and Green Materials in Construction—3rd Edition)

Abstract

Prefabricated Ultra-High-Performance Concrete (UHPC) and cast-in-place Normal Concrete (NC) composite members are increasingly used in bridge engineering because they combine high performance with cost-effectiveness. The bond at the UHPC-NC interface is critical as it directly impacts the composite structure’s safety. This study employed 3D laser scanning acquired the UHPC substrate geometry, utilized fractal dimension analysis to quantify the interface roughness, and adopted the slant shear test to evaluate the effects of retarder application mass and hydration delay duration on roughness and bond strength. The research results indicate that the failure modes of UHPC-NC specimens can be categorized into interface shear failure and NC splitting tensile failure. With the extension of hydration delay duration, both the interface roughness and bond strength show a decreasing trend. The influence of retarder dosage on interface roughness and bond strength exhibits a threshold effect. This study also confirms the effectiveness of fractal dimension as a quantitative tool for characterizing the macroscopic roughness features of the bonding interface. The findings of this paper provide a solid theoretical basis and quantitative support for optimizing key process parameters such as retarder dosage and precisely controlling hydration delay duration, offering significant engineering guidance for enhancing the interface bonding performance of UHPC-NC composite structures.

1. Introduction

Ultra-High-Performance Concrete (UHPC) achieves exceptional mechanical properties and durability by incorporating steel fibers and optimizing the mix design based on the maximum packing density theory. However, its relatively high cost has limited its widespread application in bridge engineering [1,2,3,4,5,6,7,8]. In contrast, Normal Concrete (NC) is cost-effective and readily available, making it suitable for basic structural applications. Nevertheless, NC exhibits low tensile strength and demonstrates limited durability and susceptibility to deterioration under harsh environmental conditions [9,10,11,12,13,14,15]. In many engineering structures, such as composite decks combining UHPC girders with NC bridge decks [16], the connection between UHPC repair layers and NC structures [17], and the assembly of prefabricated components (NC-UHPC joints) [18], it is often necessary to combine UHPC with NC. This approach leverages both the economy and convenience of NC and the superior performance of UHPC to compensate for NC’s shortcomings. Consequently, it significantly enhances the durability and overall performance of engineering structures while ensuring economic viability, meeting complex and diverse engineering demands [19,20,21]. This paper takes the UHPC-NC composite beam in an actual engineering project as the research [22,23,24] background. The beam design ingeniously places a U-shaped prefabricated UHPC beam in the lower tensile zone and employs a cast-in-place NC slab in the upper compression zone. This design fully utilizes the mechanical properties of both concrete materials, achieving optimized structural performance (Figure 1).
However, when UHPC and NC are combined, the stress transfer and deformation compatibility at the interface differ significantly from those in a single-material scenario. Therefore, research on the shear performance of the UHPC-NC interface is crucial for ensuring the safety and reliability of composite structures composed of UHPC and NC. Shear tests can directly reveal the mechanical behavior of the UHPC-NC interface under shear forces, including its shear strength, deformation characteristics, and failure modes, which is vital for accurately predicting and evaluating the overall performance of UHPC-NC composite structures. Numerous scholars have conducted extensive research on the bonding performance between UHPC and NC. Feng S. et al. [19] compared the interface bonding performance of UHPC and NC used as repair materials on substrates of different strength grades (C25, C35, C45) through slant shear tests and splitting tensile strength tests. They found that, for substrates of the same strength, the bonding strength (both shear and tensile) of UHPC was 6% to 154% higher than that of NC. Lyu J. et al. [20] reviewed the key factors influencing the bonding strength between UHPC and Normal Strength Concrete (NSC), such as substrate surface treatment, adhesive type, and repair material composition, and analyzed why the interface becomes a weak region in repair systems. Abo El-Khier M. et al. [21] investigated the shear performance of the interface when UHPC is cast over hardened Conventional Concrete (CC) through L-type push-out tests and slant shear tests. They analyzed the effects of interface surface texture, interface reinforcement ratio, the compressive strengths of CC and UHPC, and the presence of fibers on the interface shear resistance. Ganesh P. et al. [25] studied the interface bonding behavior between NSC and UHPC through slant shear tests, four-point bending tests, and splitting tensile tests. They quantified the impact of interface roughness (chiseled, grooved) and bonding conditions (cast-in-place, bonded after hardening) on bonding strength. Valikhani A. et al. [26] employed double-sided shear tests to evaluate the influence of different surface treatment methods (including sandblasting, mechanical connectors, and adhesives) on the bonding strength of UHPC and NC. Additionally, they utilized Terrestrial Laser Scanning (TLS) and Digital Image Processing (DIPM) techniques to assess the surface roughness of NC and investigate the correlation between surface roughness and bonding strength. Al-Madani M. K. et al. [27] examined the effects of varying surface roughness (cast-in-place surface, drilled treatment, and sandblasted treatment), curing conditions, exposure conditions, and test methods (slant shear tests, double-sided shear tests, splitting tensile tests, and three-point bending tests) on the interface bonding strength between UHPC and NC. Tian J. et al. [28] studied the influence of NC strength and grooving density on the bonding performance of grooved interfaces between UHPC and NC through slant shear tests and double-sided shear tests. Prado L. P. et al. [29] investigated the interface strength between High-Strength Concrete (HSC) and UHPC, with a particular focus on the effects of different HSC surface treatments on interface strength. Their research found that the shear strength, friction coefficient, and adhesion parameters of the HSC/UHPC interface were significantly higher than those reported in previous studies on HSC and NSC interfaces. Zhang Y. [30] et al. studied the interface bonding performance between UHPC and NC through slant shear tests, splitting tensile tests, and direct tensile tests, considering factors such as surface roughness, UHPC age, substrate moisture, curing conditions, NC strength, adhesives, and expanding agents. From the aforementioned literature, it can be observed that experimental methods for studying the shear performance of the UHPC-NC interface include single-sided shear tests, double-sided shear tests, L-type shear tests, and slant shear tests, among which the slant shear test method has been widely recognized and applied [31]. This is because the interface is typically subjected to both vertical stress and horizontal shear force simultaneously, and the slant shear test method can more accurately simulate the actual stress state. Therefore, this study adopts the slant shear test method to explore the shear performance of the UHPC and NC interface.
In existing research on the performance of UHPC-NC interfaces, the traditional perspective predominantly focuses on scenarios where UHPC is used as a repair material to strengthen existing NC structures. Consequently, a certain research foundation has been established regarding interface treatment processes, test methods, and roughness evaluation systems. Building upon previous achievements, this study demonstrates innovation in two aspects, specifically targeting the novel structural form of UHPC-NC composite beams: the treatment process for prefabricated UHPC substrates and the quantification method for roughness. The details are as follows: (1) Methods for forming rough concrete surfaces primarily include mechanical chiseling, grooving, acid etching, sandblasting (shot blasting), and the use of retarding agents [26,27,28]. Traditional chiseling methods (mechanical chiseling, grooving, sandblasting) exhibit significant drawbacks, such as high labor intensity, low efficiency, and the tendency to induce microcracks and local damage in the substrate due to high impact forces. Grooving and sandblasting also generate severe dust and noise pollution. Acid etching, which utilizes acidic solutions to dissolve cement hydration products, poses significant environmental hazards. In contrast, the retarding agent method involves pre-coating the formwork with a retarding agent to delay the hydration of the surface cement, followed by washing with a high-pressure water jet after demolding to form a uniformly rough surface. This method is not suitable for repair contexts and extends the cleaning time, but it offers advantages such as rapid construction, high efficiency, environmental friendliness, and the absence of mechanical damage, making it suitable for new construction projects. Previous studies have generally focused on scenarios where UHPC is used to strengthen existing NC structures, with an emphasis on using chiseling treatments of the NC substrate surface to enhance the bonding performance of UHPC as a repair or strengthening material. However, for the novel UHPC-NC composite beam structure explored in this study, which features a U-shaped prefabricated UHPC beam in the lower tensile zone and a cast-in-place NC slab in the upper compression zone, the technical logic of interface treatment differs significantly from traditional scenarios. In UHPC-NC composite beams, the strength of the prefabricated UHPC segments typically exceeds 120 MPa, and their high density and ultra-high strength make it difficult for traditional mechanical chiseling equipment to effectively create roughness. The retarding agent method exhibits unique advantages in such scenarios. In this study, we adopted the retarding agent method to chisel the UHPC substrate surface. This process involves applying a retarding agent to the surface of the UHPC prefabricated mold to delay the hydration reaction of the surface cement paste. After the initial setting of the UHPC, a high-pressure water jet is used to wash away the unhardened cement paste, forming an effective rough interface. (2) Traditional evaluations of concrete interface roughness commonly employ qualitative [32] or simplified quantitative description methods (such as the sand patch test [33]), which have certain limitations in terms of precision and comprehensiveness. Peak-to-Valley Height (PVH) is a traditional method for evaluating roughness, primarily based on measuring the vertical distance of a two-dimensional profile. Its limitations lie in the fact that it only reflects the maximum fluctuation along a single profile line, failing to comprehensively characterize the overall features of rough surfaces. Additionally, the absence of standardized guidelines for selecting profile lines leads to poor stability in the calculation results. As a non-contact measurement technique, three-dimensional laser scanning technology can rapidly and accurately acquire three-dimensional point cloud data of concrete surfaces, providing the possibility of a high-precision and quantitative characterization of roughness. The fractal dimension method comprehensively quantifies the complexity of surfaces through scale independence and utilizes three-dimensional grid analysis to achieve high-precision and high-reliability roughness evaluations [32]. This paper proposes combining three-dimensional laser scanning technology with fractal dimension assessment methods [34,35,36] to achieve the high-precision and quantitative characterization of rough UHPC surfaces. This approach provides a more scientific and refined research tool for an in-depth understanding of the intrinsic correlations between roughness characteristics and interface mechanical properties.
Therefore, this paper focuses on the shear performance of the UHPC and NC interface, using retarding agent technology to roughen the UHPC surface. The research aims to clarify the precise quantitative relationships between the UHPC surface roughness, quantified by three-dimensional laser scanning technology (specifically using fractal dimension as an indicator), the amount of retarding agent sprayed during the chiseling process (per unit area, hereinafter referred to as “spray amount”), and the time interval commencing from the application of the retarder onto the surface of freshly mixed UHPC until the removal of the unset slurry via high-pressure water jetting (hereinafter referred to as “hydration delay duration”). Building upon this, the study further analyzes the correlation between surface roughness and the shear strength of the UHPC-NC interface using slant shear tests. This endeavor aims to provide a solid scientific basis for assessing the safety and reliability of UHPC-NC composite structures and to offer more optimized interface treatment strategies and solutions for relevant engineering practices.
Although existing studies have extensively explored the interfacial performance between UHPC and NC, this research demonstrates significant novelty in the following aspects: (1) Innovation in interfacial treatment technology. For the novel structural form of precast UHPC and cast-in-place NC composite beams, we pioneered the application of the retarder etching method to roughen precast UHPC surfaces. Compared with traditional mechanical chiseling or acid etching, this approach utilizes high-pressure water jets to precisely remove unhydrated cement paste while avoiding microcrack damage to the substrate and environmental pollution. It is particularly suitable for the surface treatment of high-strength UHPC. (2) Proposal of a quantitative interfacial roughness system using 3D laser scanning with fractal dimension analysis. Through the Cube-Covering Method, we achieved high-precision, non-contact roughness measurements. This methodology resolves the insufficient accuracy of conventional Sand Patch Tests, thereby providing a more scientific basis for optimizing interfacial performance.

2. Experiment Design and Test Methods

2.1. Materials and Mix Proportions

Raw Materials for UHPC: The matrix of the material consists of P·I52.5 Portland cement, river sand, silica fume, calcium carbonate, high-performance water-reducing admixture, water, and steel fibers. The silica fume is produced by Elkem Trading (Shanghai) Co., Ltd. (Shanghai, China), with a silica content of 93.73% and a specific surface area of 20,200 m2/kg. The fly ash used is ground fly ash (Class I) from Beijing Jianghan Technology Co., Ltd. (Beijing, China), with a density of 2.34 g/cm3 and a specific surface area of 5180 m2/kg. This was used as a partial replacement for the cementitious materials in the mixture during the preparation of the UHPC. A quantity of 55.8 kg of fly ash per cubic meter of UHPC was added. The water-reducing admixture was a polycarboxylate, high-performance, water-reducing admixture with a solid content of 20% and a water-reducing rate of 35%. The steel fibers were straight copper-coated steel fibers with a diameter of 0.2 mm, a length of 13 mm, and a tensile strength of 2850 MPa. The mix proportion of UHPC is shown in Table 1. The 150 mm cube compressive strength of UHPC after 28 days of curing was 122.7 MPa.
Raw materials for NC: The cementitious material used was Conch Brand P·O42.5 ordinary Portland cement. The coarse aggregate was continuous-graded crushed stone with a particle size range of 5~20 mm. The fine aggregate was natural river sand from Zone II with a fineness modulus of 2.61. The mix proportion of NC is shown in Table 2. The 150 mm cube compressive strength of NC after 28 days of curing was 45.6 MPa.
A retarder is an admixture that delays the setting time of concrete without significantly affecting its long-term strength. Its primary components include polyhydroxy compounds, hydroxycarboxylates, sugar-rich lignosulfonates, etc. The dosage ranges from 0.1% to 0.6% of the weight of cement.

2.2. Specimen Design and Preparation

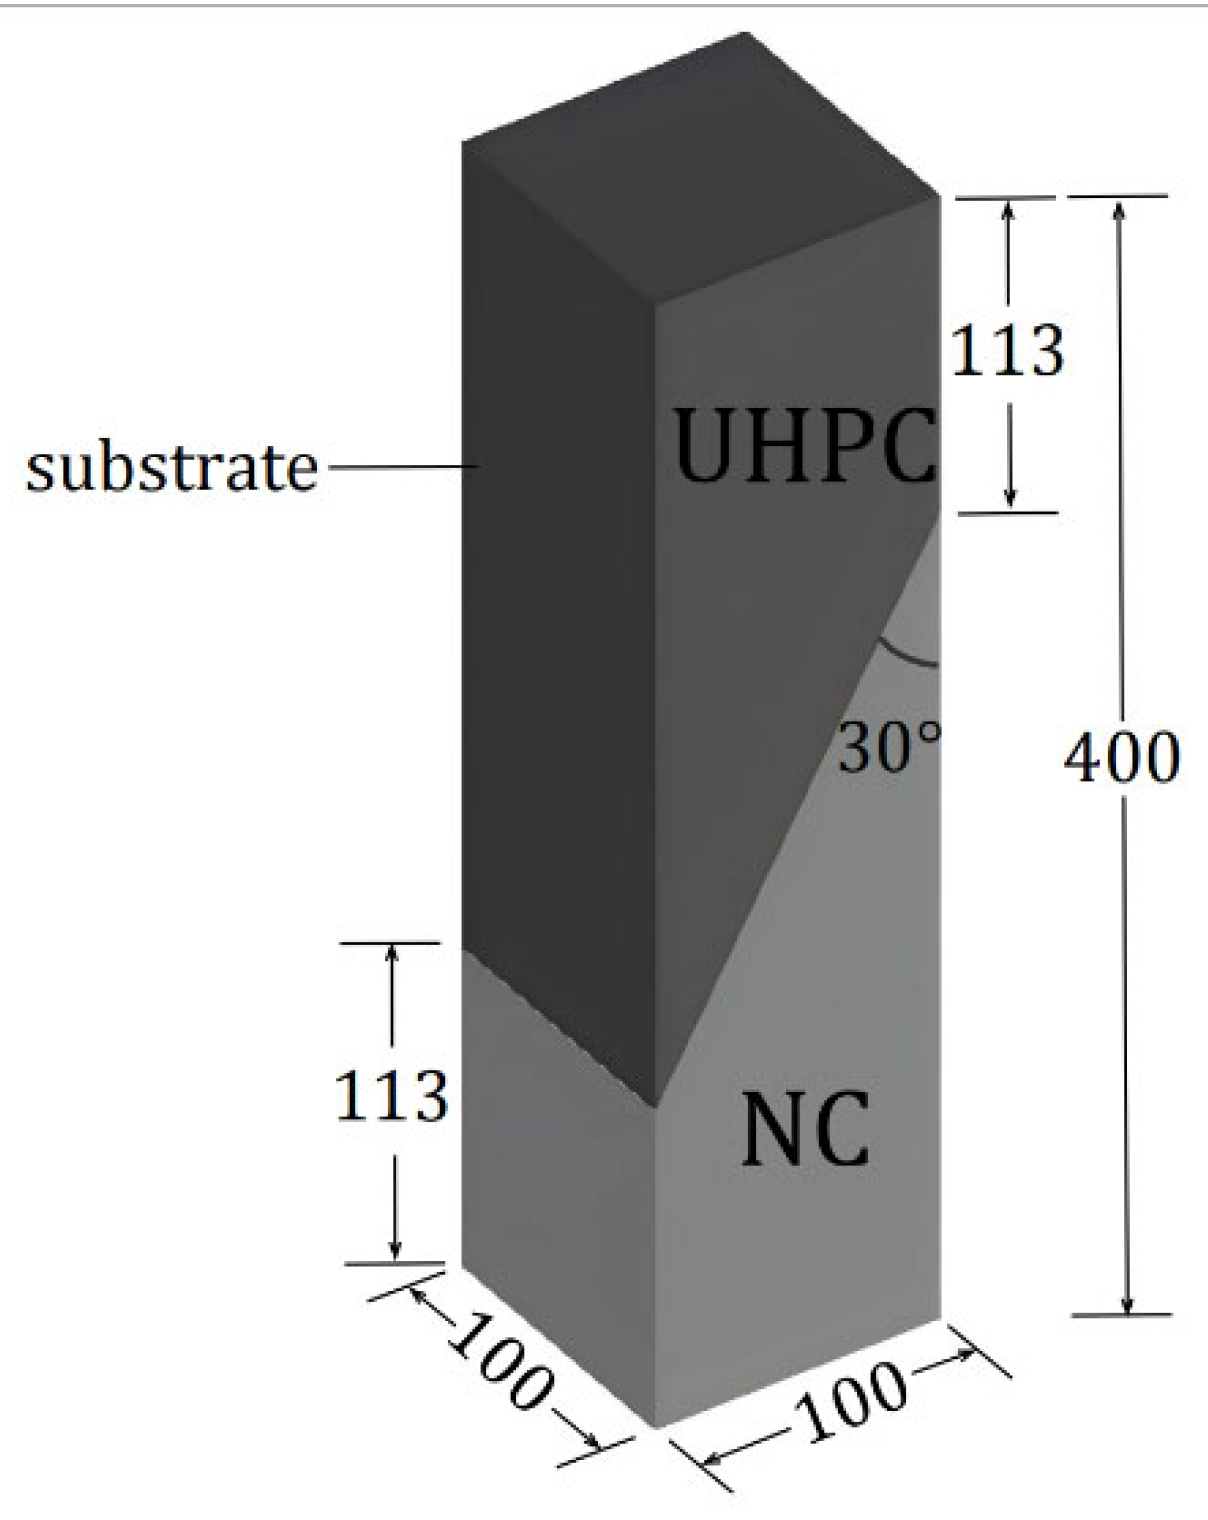
In accordance with the ASTM C882 standard [37], slant shear tests were carried out, in which specimens were subjected to a combined stress state of compression and shear. This experimental approach is designed to replicate the actual stress conditions prevalent in real-world structural systems. Referring to previous research by scholars [27,31], the oblique shear bond angle for the composite specimens in this experiment was set at 30°. UHPC-NC composite prismatic specimens with dimensions of 100 mm × 100 mm × 400 mm were used, where the compression surface had dimensions of 100 mm × 100 mm, and the oblique bond surface area was 200 mm × 100 mm. The specimens consisted of two concrete matrices and were loaded under axial compression. To reduce the discreteness of the experiment, three identical specimens were prepared for each group of tests. The dimensions of the UHPC-NC composite specimen are shown in Figure 2.
The UHPC-NC composite specimens were cast in two parts, and the main production process was as follows.
Mold Preparation: A rectangular prism mold was fabricated matching the specimen shape and dimensions shown in Figure 2 using wooden formwork. Additionally, a wooden partition plate was prepared with an area equal to that of the inclined bonding surface. This wooden partition plate was fixed at the designated bonding interface position between the UHPC and NC substrates within the mold.
Preparation of UHPC Matrix: First, different dosages of retarding agents were applied in advance to the surfaces of the inclined wooden baffles within the wooden mold, while the remaining inner surfaces of the mold were coated with a release agent. Subsequently, the raw materials were weighed according to Table 1 to prepare the UHPC. After thorough mixing, the UHPC mixture was poured into the mold equipped with inclined wooden baffles. The mold was then placed on a vibrating table and vibrated until the mixture was compacted. The top surface was smoothed out and left to stand. After standing for 6 h, 7 h, and 8 h, respectively, the inclined wooden baffles were removed. A high-pressure water jet was used to wash away the uncured cement paste layer on the inclined surface of the UHPC, exposing part of the steel fibers and creating a controlled roughened inclined bonding interface. After standing for 24 h, the mold was removed, and the specimen was subjected to natural curing for 28 days.
Preparation of UHPC-NC Composite Specimens: The cured UHPC matrix was placed into the corresponding test mold. The inclined rough bonding interface of the UHPC was wetted with water to achieve a saturated surface-dry (SSD) condition. The raw materials were then weighed according to Table 2 and the other half of the specimen was cast with C40 NC. After the casting of NC was completed, a plastic film covered the surface of the UHPC-NC composite specimens to prevent moisture evaporation. The mold was removed after 24 h, and the composite specimen was cured at room temperature (approximately 22 °C) for 28 days. During this period, the specimens were exposed to ambient environment, with occasional watering provided as needed to prevent excessive drying.
The interface treatment method is as follows. The retarder was applied by spraying total masses of 5 g, 7.5 g, and 10 g onto the inclined wooden baffles (fixed area: 0.2 m2). This corresponds to unit area dosages of 25 g/m2, 37.5 g/m2, and 50 g/m2, respectively. The UHPC matrix was subjected to high-pressure water jet interface treatment 6 h, 7 h, and 8 h after pouring, respectively. The water pressure used during the washing stage was maintained at 3–4 MPa. The interface roughness of the UHPC matrix was quantitatively calculated using three-dimensional laser scanning technology. Three specimens were prepared for each group, and a total of 27 UHPC-NC composite specimens were tested. The interface effect of the UHPC matrix treated by the retarder and water jet method is shown in Figure 3. The specimen parameters are shown in Table 3.

2.3. Test Methods

2.3.1. Laser Scanning Method for Rough Surfaces

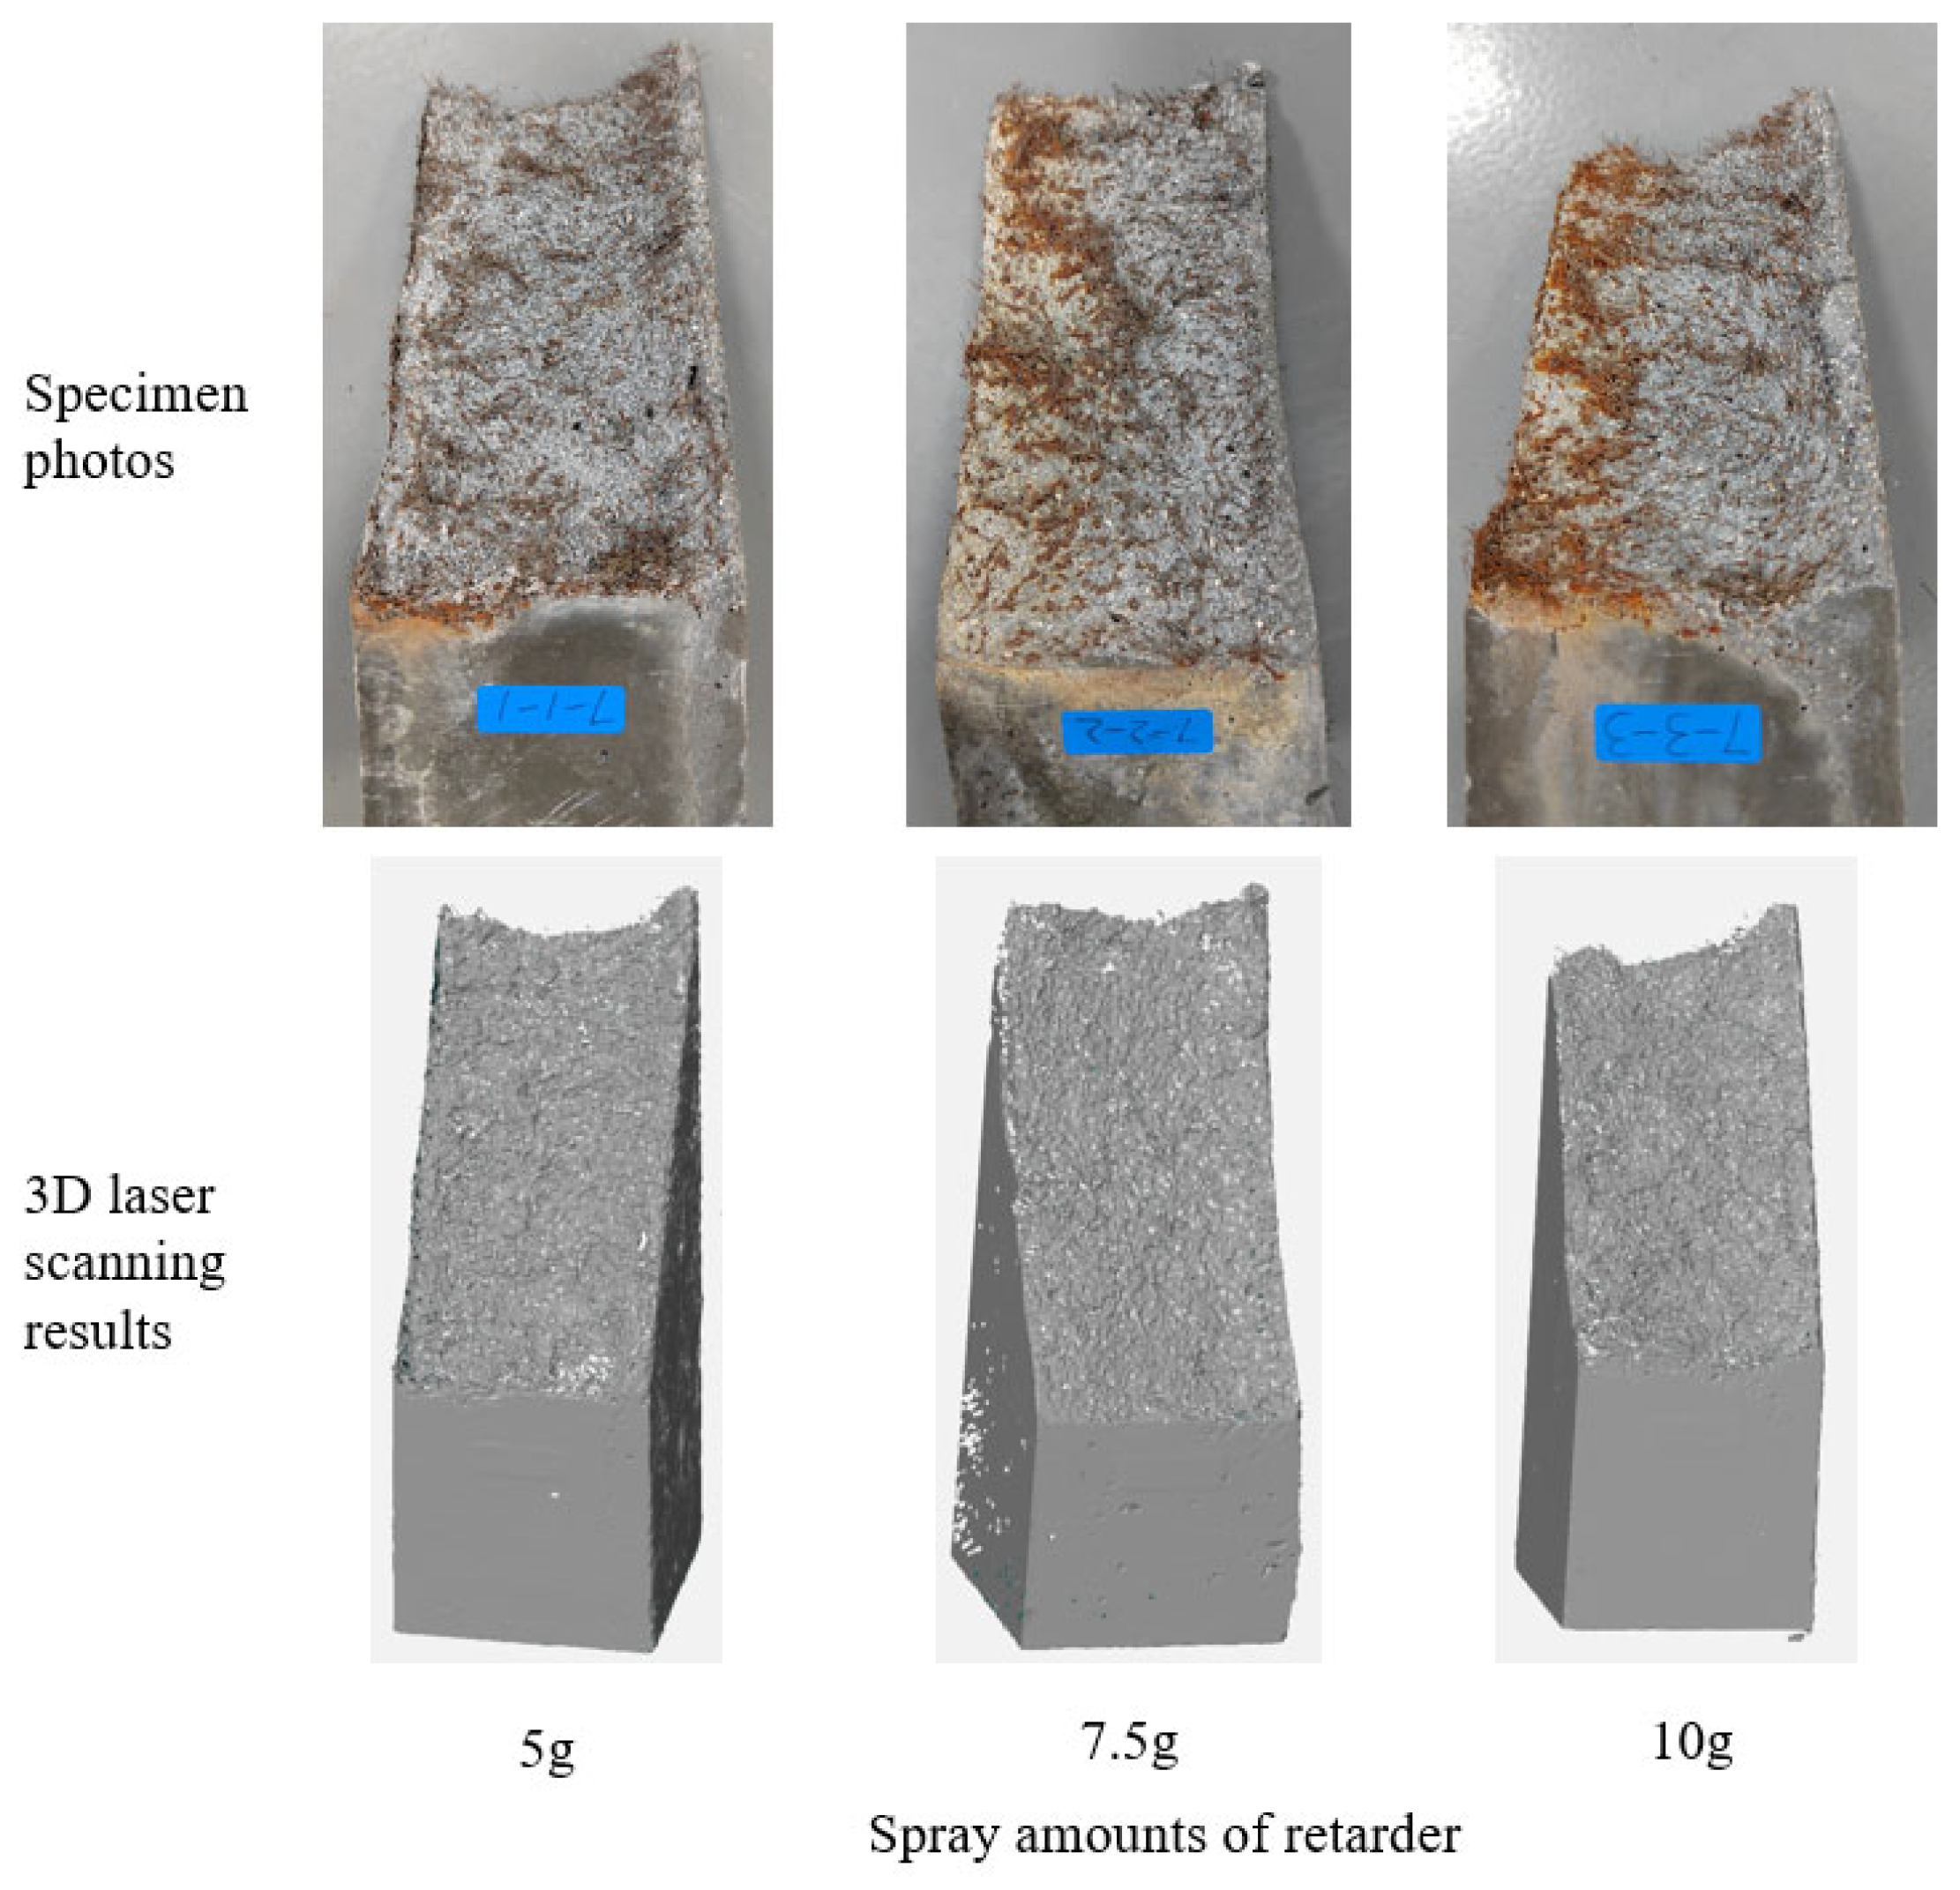
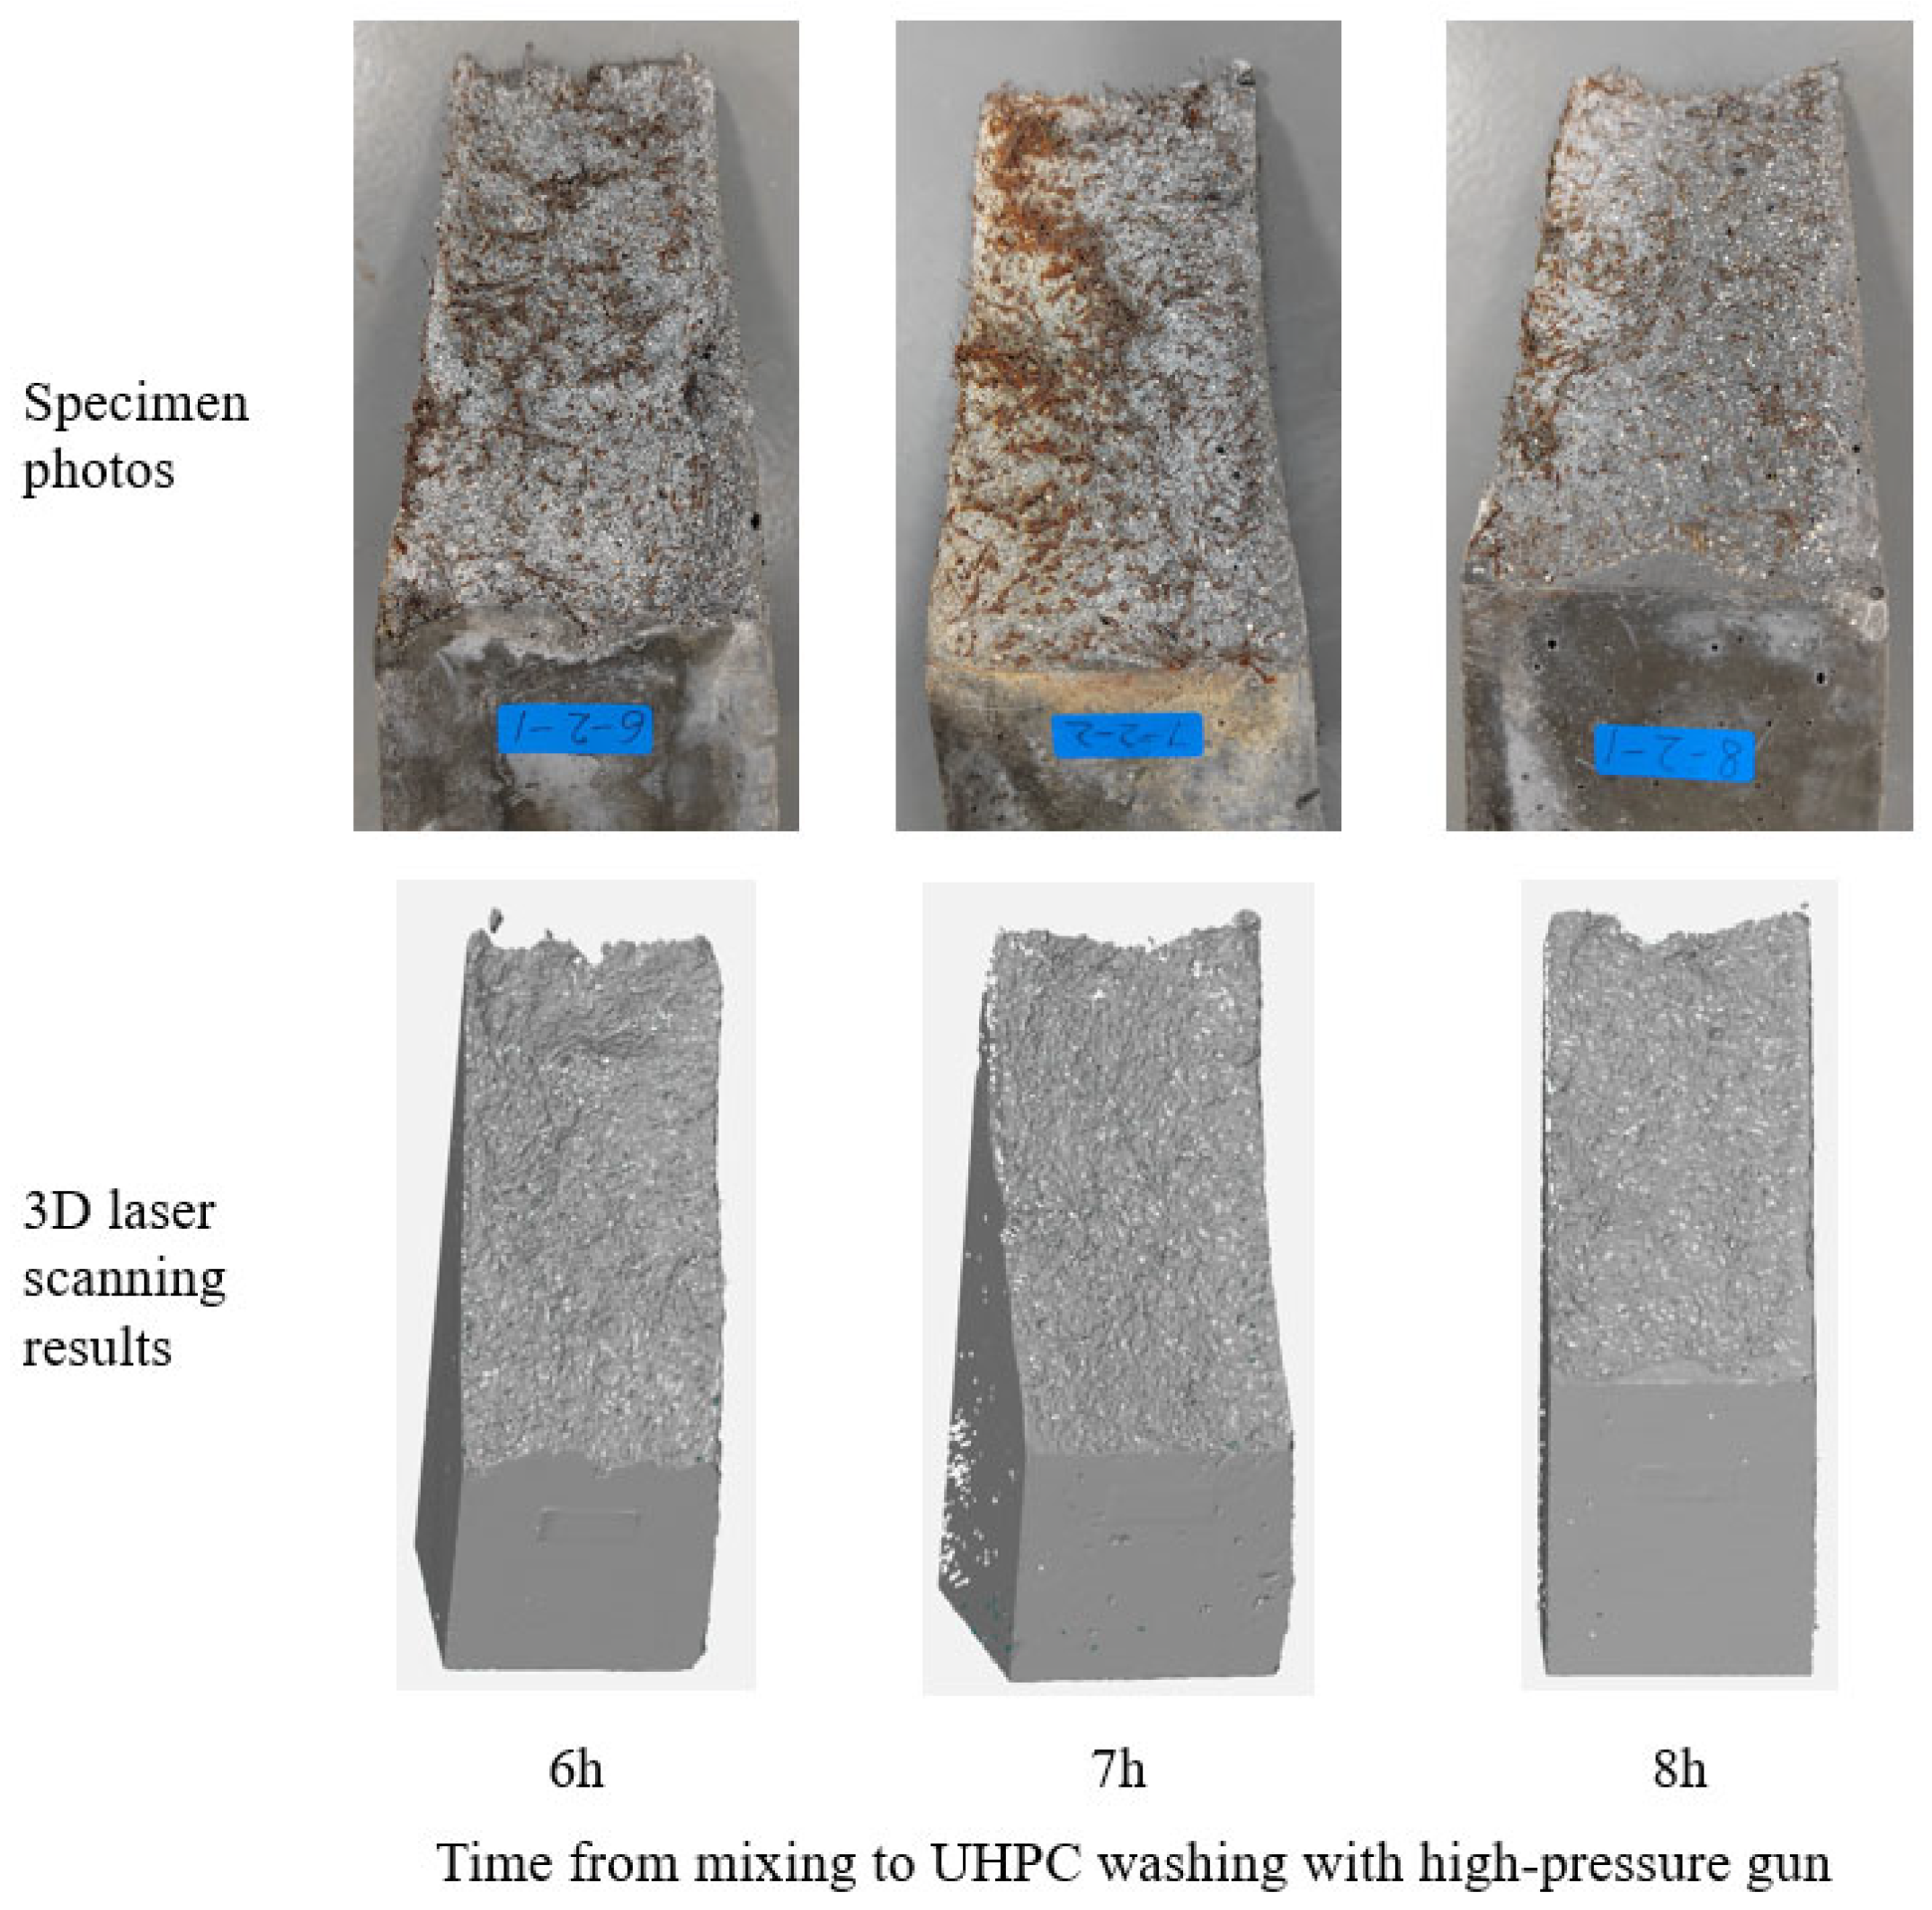
In this study, the Zeiss (Oberkochen, Germany) T-SCAN CS handheld 3D laser scanner was employed to obtain a 3D geometric model of the UHPC substrate and calculate its fractal dimensions. As shown in Figure 4, the instrument consists of three main components: a spatial positioning receiver system, a computer-controlled acquisition system, and a handheld laser scanner. The handheld scanner features eight antenna devices distributed across its three faces for signal transmission. The spatial positioning receiver system precisely locates the position of the handheld scanner in space by receiving these signals. Combined with the computer-controlled acquisition system, it digitally captures the surface of the object under test, obtaining point cloud data. The scanning results can be displayed in real-time on the computer screen, providing an intuitive operation experience. The specific scanning process is as follows. First, prepare the equipment and the site. Install the spatial positioning and receiving system in an appropriate location to ensure it can receive signals from the handheld scanner. Place the UHPC substrate specimen that is to be measured securely in a position that facilitates scanning, ensuring that the scanner can move around it and fully cover the surface to allow for measurement. Then, based on the surface characteristics of the specimen and the required accuracy, set parameters such as scanning speed, scanning angle, and scanning resolution. During scanning, select “Start Scan” on the device interface and move the scanner at a constant speed according to the preset parameters from one end to the other, repeating the scan around the specimen until the entire surface is covered. Simultaneously, monitor the real-time progress information to check for any missed or abnormal areas, and perform supplementary scans if necessary. After scanning is completed, save the data in a suitable format. In this paper, the T-SCAN hand-held laser scanner technical data are listed in Table 1 and this commercial laser scanner, after verification using a precision sphere (Φ = 50 mm) at distances of 2.5 m, 4.0 m and 5.5 m, exhibited a maximum deviation of 40 μm [38]. Figure 5 and Figure 6 show a comparison between the photos of UHPC and the results of the 3D laser scanning, respectively, under different retarding agent dosages after 7 h of delayed hydration, as well as a comparison between the photos of UHPC and the results of the 3D laser scanning at different time intervals, from water-mixing to the high-pressure water jet-washing of the UHPC surface, when the retarding agent dosage was 7.5 g.

2.3.2. Evaluation Method for Fractal Dimension of Rough Surfaces

In traditional Euclidean geometry, dimensions are integers: a point is 0-dimensional, a line is 1-dimensional, a plane is 2-dimensional, and a solid is 3-dimensional. However, numerous irregular and rough surfaces exist in nature, such as mountain ranges, coastlines, and rock surfaces, which are difficult to accurately describe using traditional Euclidean geometry due to their complex forms. Mandelbrot B. B. [39] was the first to propose using the fractal dimension of the profile lines of rough surfaces to characterize their complexity when studying these irregular surfaces. The theory of fractal dimension, which originated from Mandelbrot’s research on rough surfaces, evolved from calculating the dimension of profile lines to box-counting dimensions, and then to three-dimensional cube-covering methods. It progressed from a low-dimensional to a high-dimensional analysis and from simple to complex scenarios [40,41]. The three-dimensional cube-covering method is one of the most direct and commonly used approaches for calculating the fractal dimension of real three-dimensional rough surface topographies.
In this study, the cube-covering method proposed by Zhou and Xie [42] was adopted to calculate the fractal dimension of the three-dimensional rough surface of UHPC. The steps for calculating the three-dimensional fractal dimension using the cube-covering method are as follows: First, the three-dimensional coordinate data of the UHPC rough surface obtained through three-dimensional laser scanning technology is read into Matlab 2013 software and embedded within a three-dimensional Cartesian coordinate system, OXYZ. The surface morphology of the sample is characterized by the Z-coordinate values (height values) of the discrete points, forming a “rough surface” in three-dimensional space. Subsequently, cubes with a side length of δ are used to cover the entire “rough surface,” and the number of cubes required to cover the “rough surface” is counted and denoted as N(δ). When calculating for a specific local area, for instance, if there is a regular square grid ABCD on the plane XOY, its four vertices correspond to four points on the curved surface and their height values are represented as h(i,j), h(i,j + 1), h(i + 1,j), and h(i + 1,j + 1) (where i ≥ 1, j ≤ n−1, and n is the number of measurement points along each edge), as illustrated in Step 4 of Figure 7. If a cube with a side length of δ is used to cover the rough surface, the maximum difference among h(i,j), h(i,j + 1), h(i + 1,j), and h(i + 1,j + 1) will determine the number of cubes required, denoted as ccc.
N i , j = I N T 1 δ [ max ( h ( i , j ) , h ( i , j + 1 ) , h ( i + 1 , j ) , h ( i + 1 , j + 1 ) ) min ( h ( i , j ) , h ( i , j + 1 ) , h ( i + 1 , j ) , h ( i + 1 , j + 1 ) ) ] + 1
where INT denotes the integer-taking function. When the side length of the cube is δ, the total number of cubes required to cover the entire rough surface is given by
N ( δ ) = i , j = 1 n 1 N i , j
Repeat this process to calculate the number of cubes, N(δ), required to completely cover the entire rough surface using cubes with different side lengths δ. Clearly, the smaller the δ, the larger the N(δ). According to fractal theory, if the rough surface exhibits fractal characteristics, the relationship between the total number of cubes, N(δ), and the side length of the cubes, δ, can be described as
N ( δ ) δ D
where D is the fractal dimension of the UHPC rough surface.
The steps for obtaining the fractal dimension of the rough surface of a UHPC substrate formed using the retarding agent method are largely consistent with those described in [34,35], as illustrated in Figure 7. The process is divided into four main steps. In Step 1, a portable 3D laser scanner (T-SCAN CS) produced by Zeiss is used to scan the rough surface of the UHPC substrate, acquiring the three-dimensional coordinates of each point on the surface (i.e., the point cloud), which provides the foundational data for subsequent analysis. In Step 2, the scanned data is preprocessed in MatLab software. The five smooth surfaces of the UHPC substrate specimen that were not coated with the retarding agent are deleted, retaining only the rough surfaces formed through the retarding agent method. In Step 3, the topographical features of the UHPC rough surface are reconstructed and visualized in MatLab software, providing a clear geometric model for calculating the fractal dimension. In Step 4, the cube-covering method proposed by Zhou and Xie [42] is employed to calculate the fractal dimension of the UHPC rough surface. Through these steps, the 3D laser scanning data can be transformed into fractal dimensions to evaluate the roughness of the surface.

2.3.3. Slant Shear Test

After the composite specimens are cured to the standard age, they are tested using slant shear tests. The prismatic specimens are loaded on a microcomputer-controlled electro-hydraulic servo testing machine. To ensure balanced force application at both ends of the specimens during loading, the loading surfaces of the prismatic specimens are ground flat and wiped clean before loading. The specimens are placed in alignment so that their axes coincide with the centerline of loading, and two displacement meters are symmetrically arranged along the inclined contact interface. The displacement meters are fixed on the lower NC part, and angle steels are fixed on the upper UHPC part. The angle steels overhang to make contact with the displacement meters to monitor the slip condition of the UHPC-NC contact interface. The experimental loading setup is shown in Figure 8. The loading rate for the test is 0.2 mm/min, with continuous and uniform loading until specimen failure.

3. Experimental Results and Analysis

3.1. Test Phenomena and Failure Characteristics

Based on the failure characteristics observed during the tests, the slant shear failures of the UHPC-NC composite specimens can be categorized into two types.
(a) Bond interface shear failure. During the loading process, these composite specimens emitted a hissing sound internally, which might be attributed to the pull-out of steel fibers embedded in the post-poured NC, or the development of cracks and slippage within the bond interface. Upon reaching the ultimate load, the composite specimen did not fail immediately; however, after a rapid drop in load, a wide crack appeared at the bond interface between UHPC and NC, accompanied by a loud cracking sound. Shear failure occurred at the bond interface of the specimen (see Figure 9a). After the interface failure, the steel fiber-bridging effect was prominent, and the post-poured NC remained connected to the prefabricated UHPC. A comparison of Figure 9b,c reveals that numerous steel fibers are clearly visible on the bonded interface prior to failure. However, after interface failure, only a few fibers remain observable. This reduction in visible fibers is attributed to residual Normal Concrete (NC) adhering to their surfaces, providing clear evidence of the significant bridging effect exerted by the steel fibers. The mechanical model of the steel fiber bridging effect is generally considered to comprise three stages: (1) Elastic Stage: The steel fiber and UHPC matrix exhibit good bonding, with the interfacial shear stress τ following a parabolic distribution along the fiber length. (2) Debonding Stage: When the interfacial shear stress exceeds the bond strength, the fiber begins to debond. At this stage, the bridging stress is primarily dominated by frictional forces. (3) Pull-out Stage: After complete debonding of the fiber, the pull-out resistance consists of the hooked-end anchorage force and residual frictional forces.
(b) Splitting tensile failure of the post-poured NC. For these composite specimens, before the load increased to the ultimate load, fine cracks became visible on the NC surface, near the bond interface. As the load continued to increase, these surface cracks propagated longitudinally. After reaching the peak load, the load dropped rapidly, and obvious longitudinal main cracks appeared in the NC part, resulting in splitting tensile failure. The failure was accompanied by a relatively soft sound, and a large amount of the NC matrix adhered to the UHPC side. For the composite specimens, the bond interface remained effective among the fragments formed due to the splitting tensile failure (see Figure 9d).

3.2. Test Characteristic Values

Table 4 presents the statistical results of the peak loads, corresponding ultimate slip values, and failure modes for each group of specimens obtained from the slant shear tests. From the summarized results, it can be observed that the UN-7-5 group of specimens had the highest average peak load and exhibited the only Type b failure mode. In contrast, the UN-8-10 group of specimens had the lowest average peak load, with all specimens failing in Type a mode.

3.3. Bond Strength-Slip Curve

Figure 10 illustrates the slip curves of the UHPC-NC composite specimen interface under various bond strengths, as obtained through displacement meter tests (due to space limitations, only the curves for a retarder dosage of 10 g under different hydration delay durations (6 h, 7 h, 8 h), as well as for different retarder dosages (5 g, 7.5 g, 10 g) when the hydration delay duration is 6 h, are presented). From Figure 10, it can be observed that the bond strength–slip curve of the UHPC-NC interface comprises three stages, as follows: (1) Elastic Stage. During this stage, the bond strength exhibits an approximately linear relationship with slip, with bond strength increasing linearly with the amount of slip. The slip in this stage typically does not exceed 0.15 mm. (2) Softening Stage: In this stage, the slope of the bond strength–slip curve decreases significantly, indicating a reduced rate of increase in bond stress and an accelerated rate of slip. The bond strength continues to rise until it reaches its peak value at this stage. (3) Failure Stage: After reaching the peak bond strength, the curve enters the descending section, where the bond strength gradually decreases with an increase in slip until the specimen fails.

3.4. Calculation of Fractal Dimension

Figure 11a illustrates the variation in the fractal dimension of the bond interface of UHPC-NC composite specimens with hydration delay duration under different retarder applications. The fractal dimension exhibits a fluctuating trend as a whole with the hydration delay duration, and the curve trends corresponding to different retarder dosages show variations. The dosage of retarder influences the hydration of the cement paste on the UHPC surface layer, thereby altering the interface roughness (with fractal dimension serving as a quantitative indicator of roughness). Hydration delay duration refers to the duration from the moment when UHPC is cast into the mold to the time when the UHPC-NC contact surface coated with the retarder is washed. A shorter hydration delay duration results in more unhydrated cement paste and less hardened cement paste on the UHPC-NC contact surface, leading to greater roughness and a higher fractal dimension for the washed contact surface.
Figure 11b illustrates the correlation between the interface fractal dimension (D) and slip, revealing a generally weak positive relationship, as evidenced by an R2 value of 0.23, which indicates a relatively low correlation with significant data point dispersion. Notably, the slip reaches its peak when the fractal dimension approaches 2.13. Meanwhile, Figure 11c displays the relationship between the interface fractal dimension (D) and bond strength, demonstrating a strong positive correlation with an R2 value of 0.76. This suggests that higher interface roughness (reflected by a larger fractal dimension) corresponds to greater bond strength between UHPC and NC. Additionally, the bond strength attains its maximum when the fractal dimension is around 2.13.
Previous studies [34,35,36] have indicated that the fractal dimension of curved surfaces can serve as a quantitative indicator for the roughness of bonding interfaces. From Figure 11, it can be observed that the specimens with a hydration delay duration of 6 h have the highest fractal dimension. Moreover, the fractal dimension decreases continuously with increases in hydration delay duration, indicating a gradual reduction in the roughness of the bond interface of the UHPC-NC composite specimens. This phenomenon stems from differences in the setting characteristics of concrete and the hydration process: the retarder applied to the bond interface of the prefabricated UHPC delays the setting of the surface concrete, causing it to set slower than the interior (although, under normal circumstances, the surface sets faster than the interior). When flushing starts early, high-pressure water jets can effectively remove the unset cementitious materials. As the concrete curing/hydration time increases, the degree of setting improves (with more complete hydration), resulting in a reduction in the amount of cementitious material that can be removed by scouring and thereby leading to a decrease in interface roughness.
On the whole, the fractal dimension decreases with an increase in the amount of retarder applied, indicating a gradual reduction in the roughness of the bond interface of the UHPC-NC composite specimens. There are two possible reasons for this phenomenon. Firstly, an increase in the retarder dosage leads to a greater amount of unset gel material. Although scouring removes a significant portion of the mortar, the resulting bond surface becomes relatively smooth. In contrast, a retarder dosage of 5 g results in a rougher bond surface. Figure 12 is a schematic diagram showing the side profile positions of the rough UHPC surfaces formed by high-pressure water jet scouring after applying different masses of retarder for a certain period. Secondly, there is a limited amount of retarder that can be applied per unit area of the inclined baffle. Increasing the retarder dosage does not result in more retarder being adsorbed onto the baffle; instead, some of the retarder may be lost or carried away, thereby reducing its effectiveness at the bond interface.

3.5. Bond Strength of UHPC-NC Interface

To further assess the slant shear bond performance of UHPC-NC composite specimens, the slant shear bond strength of UHPC-NC was calculated using the formula defined in the literature [27], as follows:
τ n = P × cos θ / ( A / sin θ ) = P A × sin θ × cos θ
where P represents the maximum applied load (kN). A is the cross-sectional area of the prismatic specimen. θ is the angle between the bonded inclined plane and the vertical axis, which is 30° in this case. In this paper, after all the specimens underwent slant shear tests, the calculated bond strengths of UHPC-NC are presented in Table 5.
Figure 13 illustrates the influence of the different amounts of retarder used in the application (5 g, 7.5 g, 10 g) and the hydration delay duration (6 h, 7 h, 8 h) on the slant shear bond strength of the interface. It can be observed that as the hydration delay duration increases, the bond strength at the interface of the composite specimens significantly decreases, with specimens subjected to a 6 h hydration delay duration exhibiting higher bond strength. Specifically, the bond strength of specimens with 5 g retarder decreased by 21.16%, those with 7.5 g retarder decreased by 8.89%, and those with 10 g retarder decreased by 21.99%. This phenomenon occurs because the concrete has more time to set, resulting in less gel material being removable during washing, which in turn reduces the interface roughness and consequently the bond strength. Overall, specimens with a 5 g retarder application exhibited relatively higher bond strength, with the UN-7-5 group specimens achieving the highest bond strength. This indicates that the amount of retarder applied needs to be controlled within a certain range to increase the bond strength at the interface. To more effectively illustrate the influence of retarder dosage and hydration delay duration on bond strength, the results are listed in Table 6.

4. Conclusions

(1) The bond strength–slip curve of the UHPC-NC interface comprises three stages: the elastic stage, the softening stage, and the failure stage. Prior to reaching the peak bond strength, the amount of slip is minimal. Once the failure stage is reached, the bond strength drops sharply while the relative slip increases significantly, indicating the brittle failure characteristic of the specimens.
(2) This study confirms that the fractal dimension can effectively quantify and characterize the macroscopic roughness features of the bond interface. The rough UHPC surface formed through the retarding water-scouring method exhibits fractal characteristics, showing a significant negative correlation with hydration delay duration. This pattern provides a theoretical basis and quantitative support for optimizing key process parameters, such as retarder dosage and hydration delay duration, which holds significant engineering guidance for improving the bond performance of the UHPC-NC composite structure’s interface.
(3) The interface bond strength of UHPC-NC composite specimens decreases with an increase in hydration delay duration. When the hydration delay duration is increased from 6 h to 8 h, the maximum reduction in interface bond strength of the specimens is 4.58 MPa (21.99%). Therefore, when prefabricating UHPC and casting NC members in situ, it is recommended to appropriately reduce the hydration delay duration to achieve a better interface roughness, thereby ensuring the bond strength of the composite structure.
(4) When prefabricating UHPC and casting NC members in situ, it is advisable to control the retarder application mass within a certain range. This approach not only yields good economic benefits but also ensures the bond strength of the composite structure.
The present research primarily focused on two key process parameters: hydration delay duration (6 h–8 h) and retarder dosage (5 g–10 g). The study was conducted under laboratory-controlled conditions, without considering corrosive environments, such as sulfate attack, chloride penetration, or freeze–thaw cycles, and without considering fatigue loading, such as repeated traffic loads that may degrade the interface bond over time. Based on our current findings, the following structured research plan is proposed. While this study focuses on the interface shear behavior of unreinforced UHPC-NC composites, future work will systematically investigate the role of shear reinforcement (rebar) with the following variables: rebar diameter, rebar quantity, and rebar distribution.

Author Contributions

J.X. (Jie Xiao): investigation, formal analysis, methodology, funding acquisition, writing—original draft, supervision. R.W., Z.H., J.L. and L.H.: data curation, methodology, writing—review and editing. B.L., J.X. (Jiajing Xu) and L.L.: visualization, writing—review and editing, investigation, funding acquisition. All authors have read and agreed to the published version of the manuscript.

Funding

The authors are appreciated for the financial support provided by the National Natural Science Foundation of China with No. 52278160, No. 52408338 and No. 51808133, and Guangdong Natural Science Foundation with Grant No. 2023A1515012081, and GuangDong Basic and Applied Basic Research Foundation with Grant No. 2020A1515110814 and Natural Science Foundation of Jiangsu Province with Grant No. BK20240955.

Data Availability Statement

The data that support the findings of this study are available from the corresponding author upon reasonable request.

Acknowledgments

The authors would like to thank all the anonymous referees for their constructive comments and suggestions. The authors gratefully acknowledge the laboratory of School of Civil and Transportation Engineering, Guangdong University of Technology and Guangzhou Krystic Material Technology Co., Ltd. for providing the resources required for this study.

Conflicts of Interest

Author Bin Lei was employed by the company Guangzhou Krystic Material Technology Co., Ltd. The remaining authors declare that the research was conducted in the absence of any commercial or financial relationships that could be construed as a potential conflict of interest.

References

  1. Fu, J.D.; Wan, S.; Xiao, J.; Wang, X.; Zhou, P.; Dekemele, K. Cyclic loading test for prefabricated ultra-high performance concrete columns with bellows grouting connection. Struct. Concr. 2024, 25, 3361–3382. [Google Scholar] [CrossRef]
  2. Li, J.; Wu, Z.; Shi, C.; Yuan, Q.; Zhang, Z. Durability of ultra-high performance concrete—A review. Constr. Build. Mater. 2020, 255, 119296. [Google Scholar] [CrossRef]
  3. Xiao, J.; Liu, L.; Zeng, H.; Zhai, K.; Fu, J.; Jiang, H.; Pang, L. Research on the bond performance between glass fiber reinforced polymer (GFRP) bars and Ultra-high performance concrete(UHPC). J. Build. Eng. 2024, 98, 111340. [Google Scholar] [CrossRef]
  4. Tong, T.; Yuan, S.Q.; Liu, Z.; He, Z.Q.; Wang, J.Q. Experiments and Stress-Strain Model of Concrete Confined by UHPC Materials. J. Mater. Civ. Eng. 2023, 35, 04023006. [Google Scholar] [CrossRef]
  5. Feng, J.H.; Shao, X.D.; Qiu, M.H.; Li, H.H.; Gao, X.; Huang, Z.L. Reliability evaluation of flexural capacity design provision for UHPC beams reinforced with steel rebars/prestressing tendons. Eng. Struct. 2024, 300, 117160. [Google Scholar] [CrossRef]
  6. Luo, J.B.; Wu, G.Z.; Zhao, G.F.; Ma, Y.H.; Fang, Z.C.; Fang, S. Experimental and numerical analysis on shear performance of single embedded nut bolted shear connectors in prefabricated steel-UHPC composite structures under cyclic loading. Structures 2025, 73, 108446. [Google Scholar] [CrossRef]
  7. Jiang, H.B.; Chen, Z.Q.; Fang, Z.C.; Fang, S.; Tu, W.J.; Mo, F.; Xie, S.Y.; Liu, J. Rapid hardening high performance concrete (RHHPC) for bridge expansion joints: From material properties to interfacial shear performance. Constr. Build. Mater. 2025, 458, 139638. [Google Scholar] [CrossRef]
  8. Lin, S.; Lin, J.; Wu, Z.; Xiao, J.; Liu, L. Study on seismic performance of low yield point steel plate-ECC composite coupling beams. Structures 2025, 79, 109575. [Google Scholar] [CrossRef]
  9. Xiao, J.; Huang, L.; He, Z.; Qu, W.; Li, L.; Jiang, H.; Zhong, Z.; Long, X. Probabilistic models applied to concrete corrosion depth prediction under sulfuric acid environment. Measurement 2024, 234, 114807. [Google Scholar] [CrossRef]
  10. Shao, W.; Li, Q.M.; Zhang, W.B.; Shi, D.D.; Li, H.H. Numerical modeling of chloride diffusion in cement-based materials considering calcium leaching and external sulfate attack. Constr. Build. Mater. 2023, 401, 132913. [Google Scholar] [CrossRef]
  11. Yoon, I.S.; Chang, C. Quantitative Relationship between Chloride Penetration Depth and Hydraulic Conductivity of Concrete under Hydrostatic Pressure. J. Mater. Civ. Eng. 2022, 34, 04022074. [Google Scholar] [CrossRef]
  12. Xiao, J.; Zeng, H.; Huang, H.; Liu, L.; Li, L.; Yuan, B.; Zhong, Z. Experimental Investigation on the Influence of Strength Grade on the Surface Fractal Dimension of Concrete under Sulfuric Acid Attack. Buildings 2024, 14, 713. [Google Scholar] [CrossRef]
  13. Al-Kheetan, M.J.; Rahman, M.M.; Chamberlain, D.A. Remediation and protection of masonry structures with crystallising moisture blocking treatment. Int. J. Build. Pathol. Adapt. 2018, 36, 77–92. [Google Scholar] [CrossRef]
  14. Hosseinzadehfard, E.; Mobaraki, B. Corrosion performance and strain behavior of reinforced concrete: Effect of natural pozzolan as partial substitute for microsilica in concrete mixtures. Structures 2025, 79, 109397. [Google Scholar] [CrossRef]
  15. Mobaraki, B.; Vaghefi, M. The Effect of Protective Barriers on the Dynamic Response of Underground Structures. Buildings 2024, 14, 3764. [Google Scholar] [CrossRef]
  16. Jiang, H.; Shao, T.; Fang, Z.; Xiao, J.; Hu, Z. Shear-friction behavior of grooved construction joints between a precast UHPC girder and a cast-in-place concrete slab. Eng. Struct. 2021, 228, 111610. [Google Scholar] [CrossRef]
  17. Luo, X.; Zhang, S.; Zhang, Y.; Jiang, Y. Investigation of cracking and ductility performance of layered UHPC-NC composite members with reinforced UHPC as protective layer under bending moment. Thin-Walled Struct. 2025, 208, 112828. [Google Scholar] [CrossRef]
  18. Xu, J.; Wang, T.; Du, D.; Su, C.; Shi, X. Damage model of NC-UHPC interface zone in UHPC wet joint based on DIC. J. Build. Eng. 2024, 98, 111045. [Google Scholar] [CrossRef]
  19. Feng, S.; Xiao, H.; Li, H. Comparative studies of the effect of ultrahigh-performance concrete and normal concrete as repair materials on interfacial bond properties and microstructure. Eng. Struct. 2020, 222, 111122. [Google Scholar] [CrossRef]
  20. Lyu, J.; Feng, S.; Zhang, Q.; Xiao, H. Review of factors affecting bond strength between ultra-high-performance concrete and normal strength substrate. Constr. Build. Mater. 2024, 439, 137416. [Google Scholar] [CrossRef]
  21. Abo El-Khier, M.; Morcous, G. Friction and Cohesion Interface Shear Factors of Ultra-High-Performance Concrete (UHPC) Cast on Hardened Conventional Concrete. Buildings 2023, 13, 1253. [Google Scholar] [CrossRef]
  22. Tu, W.; Cheng, Q.; Zhang, L.; Li, P.; Jiang, H.; Tian, Y.; Fang, J. Shear performance of 25 m full-scale prestressed UHPC-NC composite I-beam without stirrups. Case Stud. Constr. Mater. 2024, 21, e03942. [Google Scholar] [CrossRef]
  23. Tu, L.; Zhao, H.; Qiao, D.; Hu, J.; Tan, C.; Ma, J.; Hu, Z.; Qiu, H.; Shao, X. Concept and flexural performance of non-prestressed steel plate-UHPC-NC composite girder bridge. Eng. Struct. 2024, 315, 118417. [Google Scholar] [CrossRef]
  24. Sun, X.D.; Ma, Y.Q.; Ji, Z.M.; Fan, X.M.; Wu, H.L. Shear resistance test analysis and calculation method of shear capacity of UHPC-NC beam without web reinforcement. Adv. Struct. Eng. 2024, 27, 1810–1825. [Google Scholar] [CrossRef]
  25. Ganesh, P.; Ramachandra Murthy, A. Simulation of surface preparations to predict the bond behaviour between normal strength concrete and ultra-high performance concrete. Constr. Build. Mater. 2020, 250, 118871. [Google Scholar] [CrossRef]
  26. Valikhani, A.; Jahromi, A.J.; Mantawy, I.M.; Azizinamini, A. Experimental evaluation of concrete-to-UHPC bond strength with correlation to surface roughness for repair application. Constr. Build. Mater. 2020, 238, 117753. [Google Scholar] [CrossRef]
  27. Al-Madani, M.K.; Al-Osta, M.A.; Ahmad, S.; Khalid, H.R.; Al-Huri, M. Interfacial bond behavior between ultra high performance concrete and normal concrete substrates. Constr. Build. Mater. 2022, 320, 126229. [Google Scholar] [CrossRef]
  28. Tian, J.; Jiang, X.; Yang, X.; Ma, M.; Li, L. Bonding performance of the grooved interface between ultrahigh performance concrete and normal concrete. Constr. Build. Mater. 2022, 336, 127525. [Google Scholar] [CrossRef]
  29. Pereira Prado, L.; Carrazedo, R.; Khalil El Debs, M. Interface strength of High-Strength concrete to Ultra-High-Performance concrete. Eng. Struct. 2022, 252, 113591. [Google Scholar] [CrossRef]
  30. Zhang, Y.; Zhu, P.; Liao, Z.; Wang, L. Interfacial bond properties between normal strength concrete substrate and ultra-high performance concrete as a repair material. Constr. Build. Mater. 2020, 235, 117431. [Google Scholar] [CrossRef]
  31. Lu, K.; Pang, Z.; Xu, Q.; Yao, Y.; Wang, J.; Miao, C. Bond strength between substrate and post-cast UHPC with innovative interface treatment. Cem. Concr. Compos. 2022, 133, 104691. [Google Scholar] [CrossRef]
  32. Millman, L.R.; Giancaspro, J.W. Three-Dimensional Optical Profilometry Analysis of the International Concrete Repair Institute Concrete Surface Profiles (CSPs). Aci Mater. J. 2013, 110, 519–527. [Google Scholar]
  33. Sengoz, B.; Topal, A.; Tanyel, S. Comparison of pavement surface texture determination by sand patch test and 3D laser scanning. Period. Polytech.-Civ. Eng. 2012, 56, 73–78. [Google Scholar] [CrossRef]
  34. Xiao, J.; Qu, W.J.; Jiang, H.B.; Li, L.; Huang, J.; Chen, L. Fractal characterization and mechanical behavior of pile-soil interface subjected to sulfuric acid. Fractals-Complex Geom. Patterns Scaling Nat. Soc. 2021, 29, 2140010. [Google Scholar] [CrossRef]
  35. Xiao, J.; Qu, W.J.; Jiang, H.B.; Dong, W.K. Three-Dimensional Fractal Characterization of Concrete Surface Subjected to Sulfuric Acid Attacks. J. Nondestruct. Eval. 2020, 39, 57. [Google Scholar] [CrossRef]
  36. Xiao, J.; Long, X.; Li, L.; Jiang, H.B.; Zhang, Y.W.; Qu, W.J. Study on the Influence of Three Factors on Mass Loss and Surface Fractal Dimension of Concrete in Sulfuric Acid Environments. Fractal Fract. 2021, 5, 146. [Google Scholar] [CrossRef]
  37. ASTM C882/C882M-20; Standard Test Method for Bond Strength of Epoxy-Resin Systems Used with Concrete by Slant Shear. ASTM: West Conshohocken, PA, USA, 2020.
  38. Xiao, J.; Long, X.; Qu, W.J.; Li, L.; Jiang, H.B.; Zhong, Z.C. Influence of sulfuric acid corrosion on concrete stress-strain relationship under uniaxial compression. Measurement 2022, 187, 110318. [Google Scholar] [CrossRef]
  39. Mandelbrot, B.B. How Long Is the Coast of Britain? Statistical Self-Similarity and Fractional Dimension. Science 1967, 156, 636–638. [Google Scholar] [CrossRef]
  40. Yang, L.-l.; Xu, W.-y.; Meng, Q.-x.; Wang, R.-b. Investigation on jointed rock strength based on fractal theory. J. Cent. South Univ. 2017, 24, 1619–1626. [Google Scholar] [CrossRef]
  41. Hou, Y.; Huang, Y.C.; Sun, F.Y.; Guo, M. Fractal Analysis on Asphalt Mixture Using a Two-Dimensional Imaging Technique. Adv. Mater. Sci. Eng. 2016, 2016, 8931295. [Google Scholar] [CrossRef]
  42. Zhou, H.W.; Xie, H. Direct Estimation of the Fractal Dimensions of a Fracture Surface of Rock. Surf. Rev. Lett. 2003, 10, 751–762. [Google Scholar] [CrossRef]
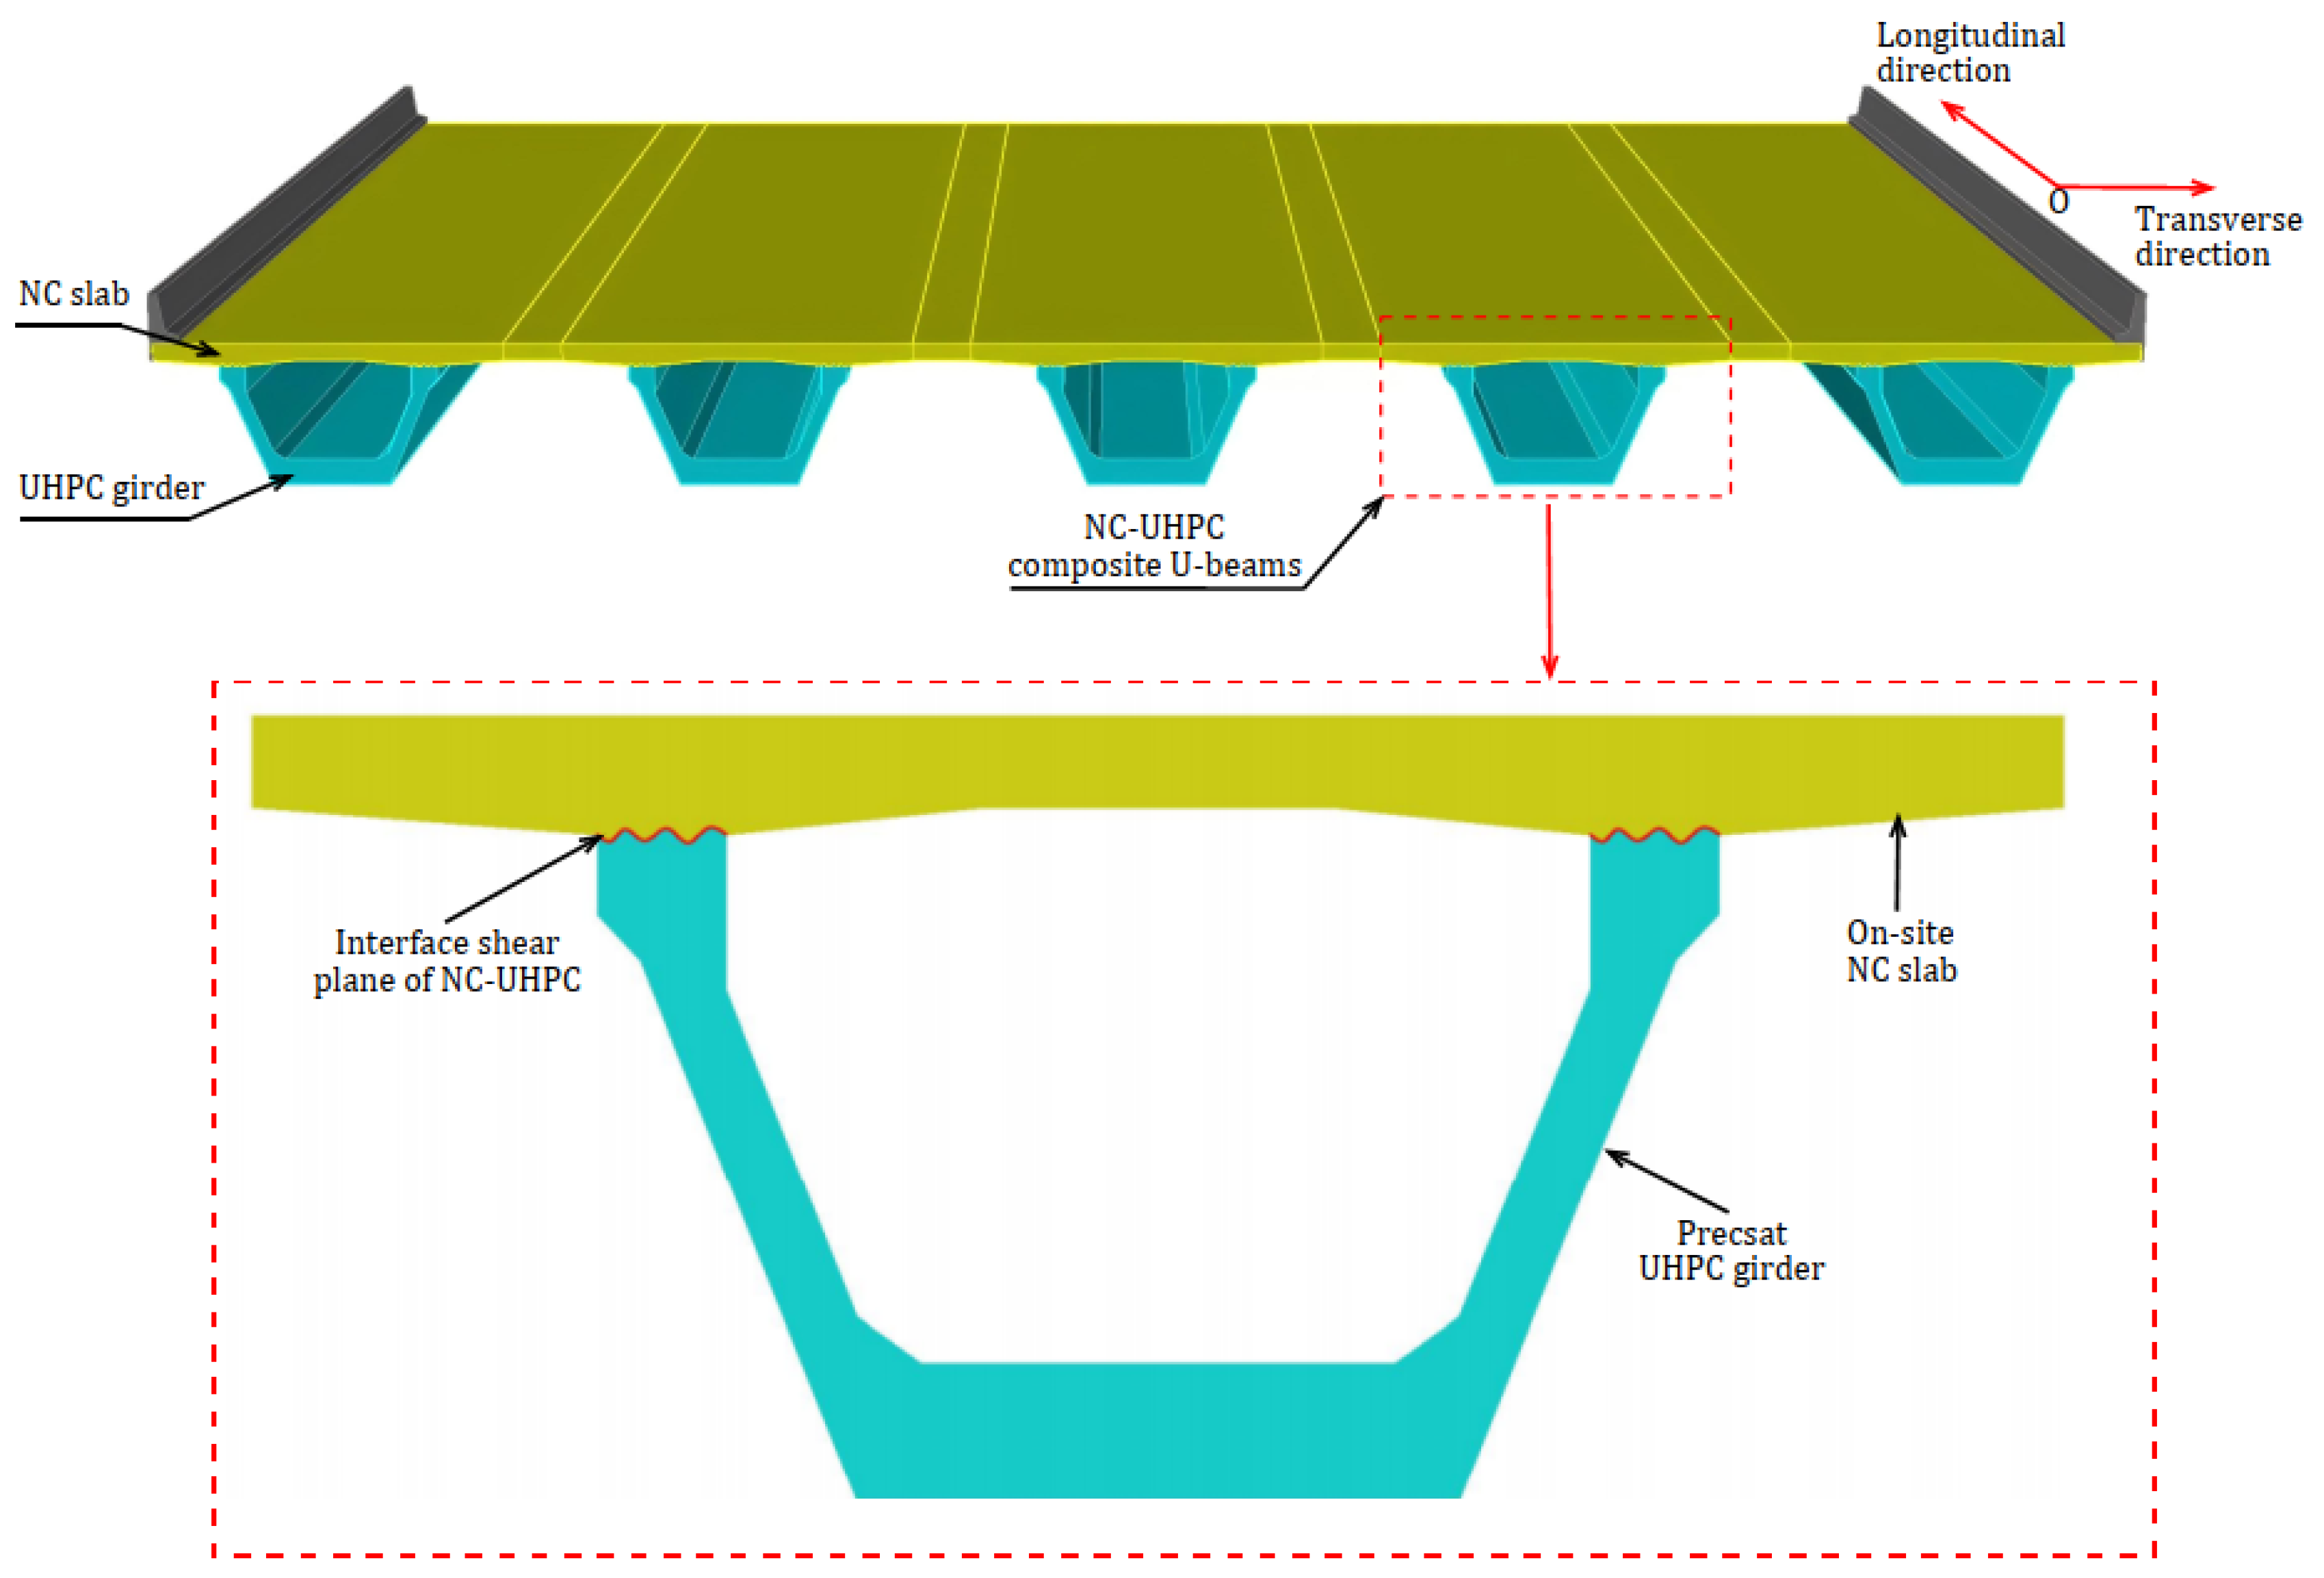
Figure 1. UHPC-NC composite beam, featuring a lower U-shaped prefabricated UHPC beam and an upper cast-in situ NC slab.
Buildings 15 02591 g001
Figure 2. Dimensions of the UHPC-NC composite slant shear specimen.
Buildings 15 02591 g002
Figure 3. Treatment of UHPC matrix using retarder and water jet method.
Buildings 15 02591 g003
Figure 4. Schematic diagram of a handheld 3D laser scanning system.
Buildings 15 02591 g004
Figure 5. UHPC photos and 3D laser scanning results at different retarder dosages after 7 h of delayed hydration.
Buildings 15 02591 g005
Figure 6. UHPC photos and 3D laser scanning results at various hydration delay durations when the retarder dosage is 7.5 g.
Buildings 15 02591 g006
Figure 7. Four steps to obtain the fractal dimensions of the rough surface of UHPC specimens.
Buildings 15 02591 g007
Figure 8. Shear loading diagram of UHPC-NC composite specimen.
Buildings 15 02591 g008
Figure 9. Slant shear failure modes of UHPC-NC composite specimens.
Buildings 15 02591 g009
Figure 10. Bond strength–slip curves of the UHPC-NC interface for different hydration delay durations and different retarder dosages.
Buildings 15 02591 g010aBuildings 15 02591 g010b
Figure 11. Variation in the fractal dimension of the UHPC-NC contact interface with hydration delay duration, slip, and bond strength. (a) Fractal dimension of UHPC-NC interface with hydration delay duration under varying retarder dosages. (b) Analysis of the relationship between the fractal dimension of the UHPC-NC contact surface and slip. (c) Analysis of the relationship between the fractal dimension of the UHPC-NC contact surface and bond strength.
Buildings 15 02591 g011
Figure 12. Schematic diagram showing the side profile positions of the rough UHPC surface.
Buildings 15 02591 g012
Figure 13. The influence of retarder application mass and hydration delay duration on bond strength.
Buildings 15 02591 g013
Table 1. Mix proportion of ultra-high-performance concrete.
ComponentCementRiver SandSilica FumeFly AshCalcium CarbonateWater-Reducing AdmixtureWaterSteel Fiber
Mass (kg/m3)827.581021.27203.3555.833.127.52191.53156
Table 2. Mix proportion of C40 concrete.
Design Strength GradeWater–Cement RatioSand Ratio (%)Material Usage (m3/kg)
C400.5936CementRiver SandGravelWater
3686401138217
Table 3. Parameter settings for slant shear specimens.
Specimen NumberHydration Delay Duration (h)Mass of Retarder Applied (g)
UN-6-5/7.5/1065, 7.5, 10
UN-7-5/7.5/107
UN-8-5/7.5/108
Note: The “UN” represent “UHPC—NC composite specimens” the middle numbers “6”, “7”, and “8” represent “hydration delay duration” the trailing numbers “5”,”7.5”, and “10” represent “amount of retarder applied”.
Table 4. Summary of slant shear test results.
Specimen IDAverage Peak Load
(P/kN)
Ultimate Slip (s/mm)Fractal DimensionsFailure Mode
UN-6-5412.940.3338 2.1357a, a, a
UN-6-7.5391.500.31942.1351a, a, a
UN-6-10416.560.41352.1278a, a, a
UN-7-5418.060.42472.1298a, a, b
UN-7-7.5385.170.25522.1241a, a, a
UN-7-10389.830.36782.1168a, a, a
UN-8-5325.620.27042.1193a, a, a
UN-8-7.5356.870.28272.1129a, a, a
UN-8-10325.070.25242.1107a, a, a
Table 5. Interfacial bond strength of UHPC-NC specimens.
Specimen IDInterface Bond Strength τ n (MPa)
UN-6-520.65
UN-6-7.519.58
UN-6-1020.83
UN-7-520.90
UN-7-7.519.26
UN-7-1019.49
UN-8-516.28
UN-8-7.517.84
UN-8-1016.25
Table 6. The influence of retarder application mass and hydration delay duration on bond strength.
Hydration Delay Duration6 h7 h8 h
Mass of Retarder
5 g20.6520.916.28
7.5 g19.5819.2617.84
10 g20.8319.4916.25
Disclaimer/Publisher’s Note: The statements, opinions and data contained in all publications are solely those of the individual author(s) and contributor(s) and not of MDPI and/or the editor(s). MDPI and/or the editor(s) disclaim responsibility for any injury to people or property resulting from any ideas, methods, instructions or products referred to in the content.