
Optimizing Kang-to-Room Area Ratios for Thermal Comfort in Traditional Chinese Architecture: An Empirical and Simulation-Based Approach


Abstract
1. Introduction
2. Materials and Methods
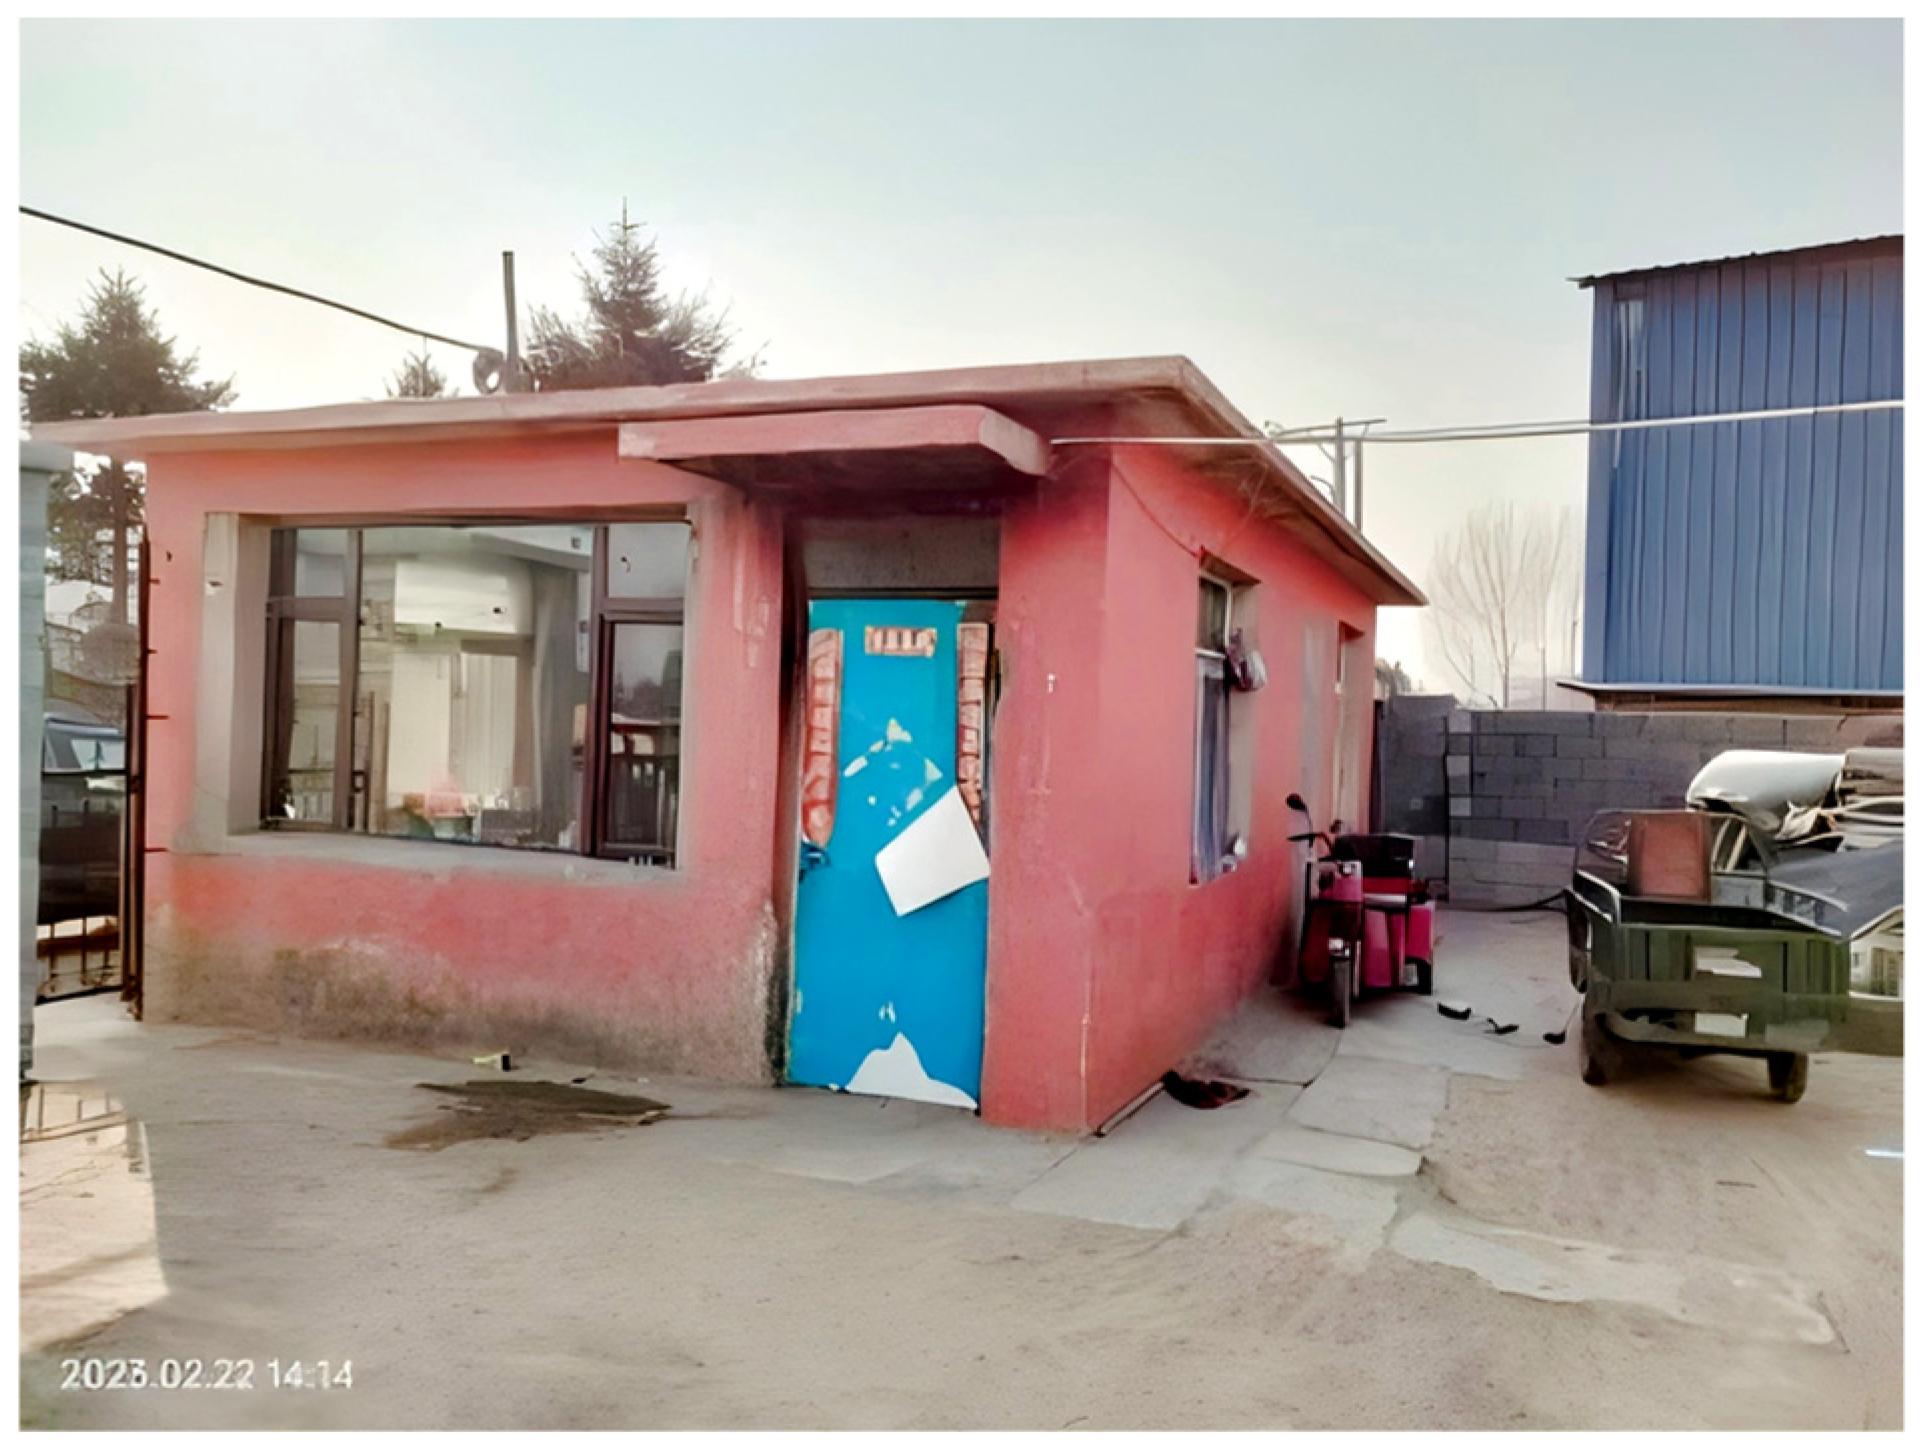
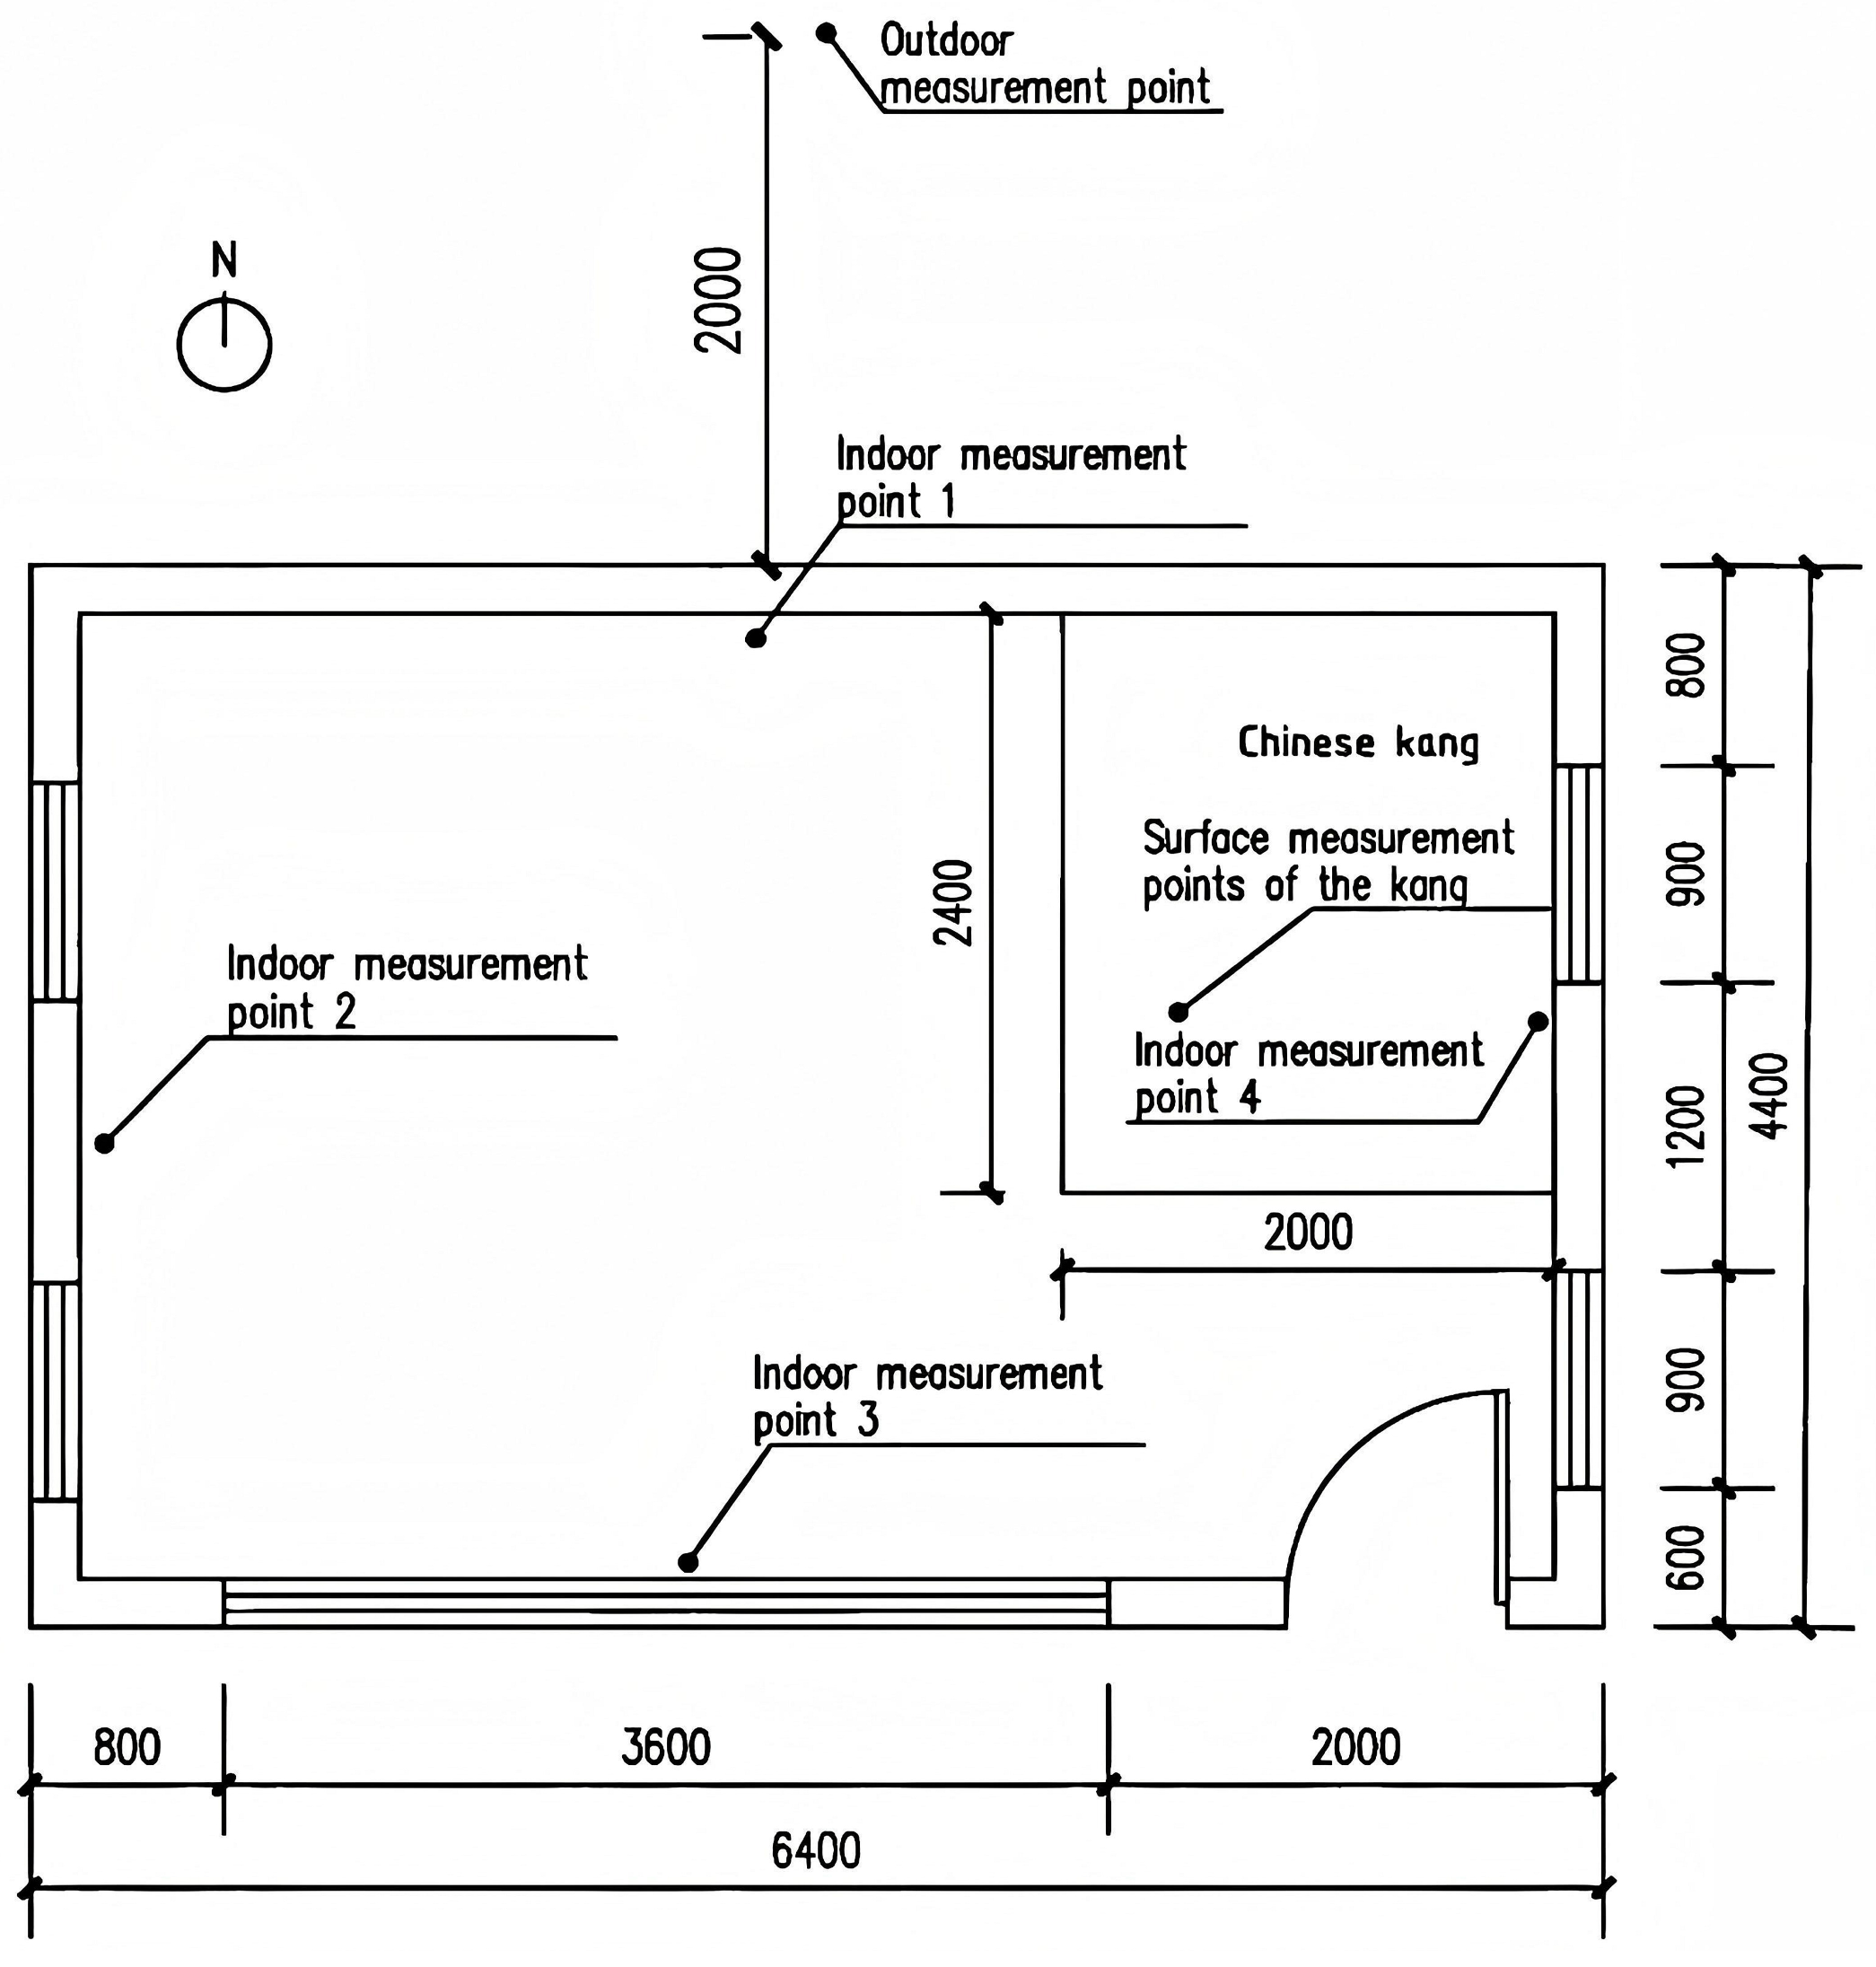
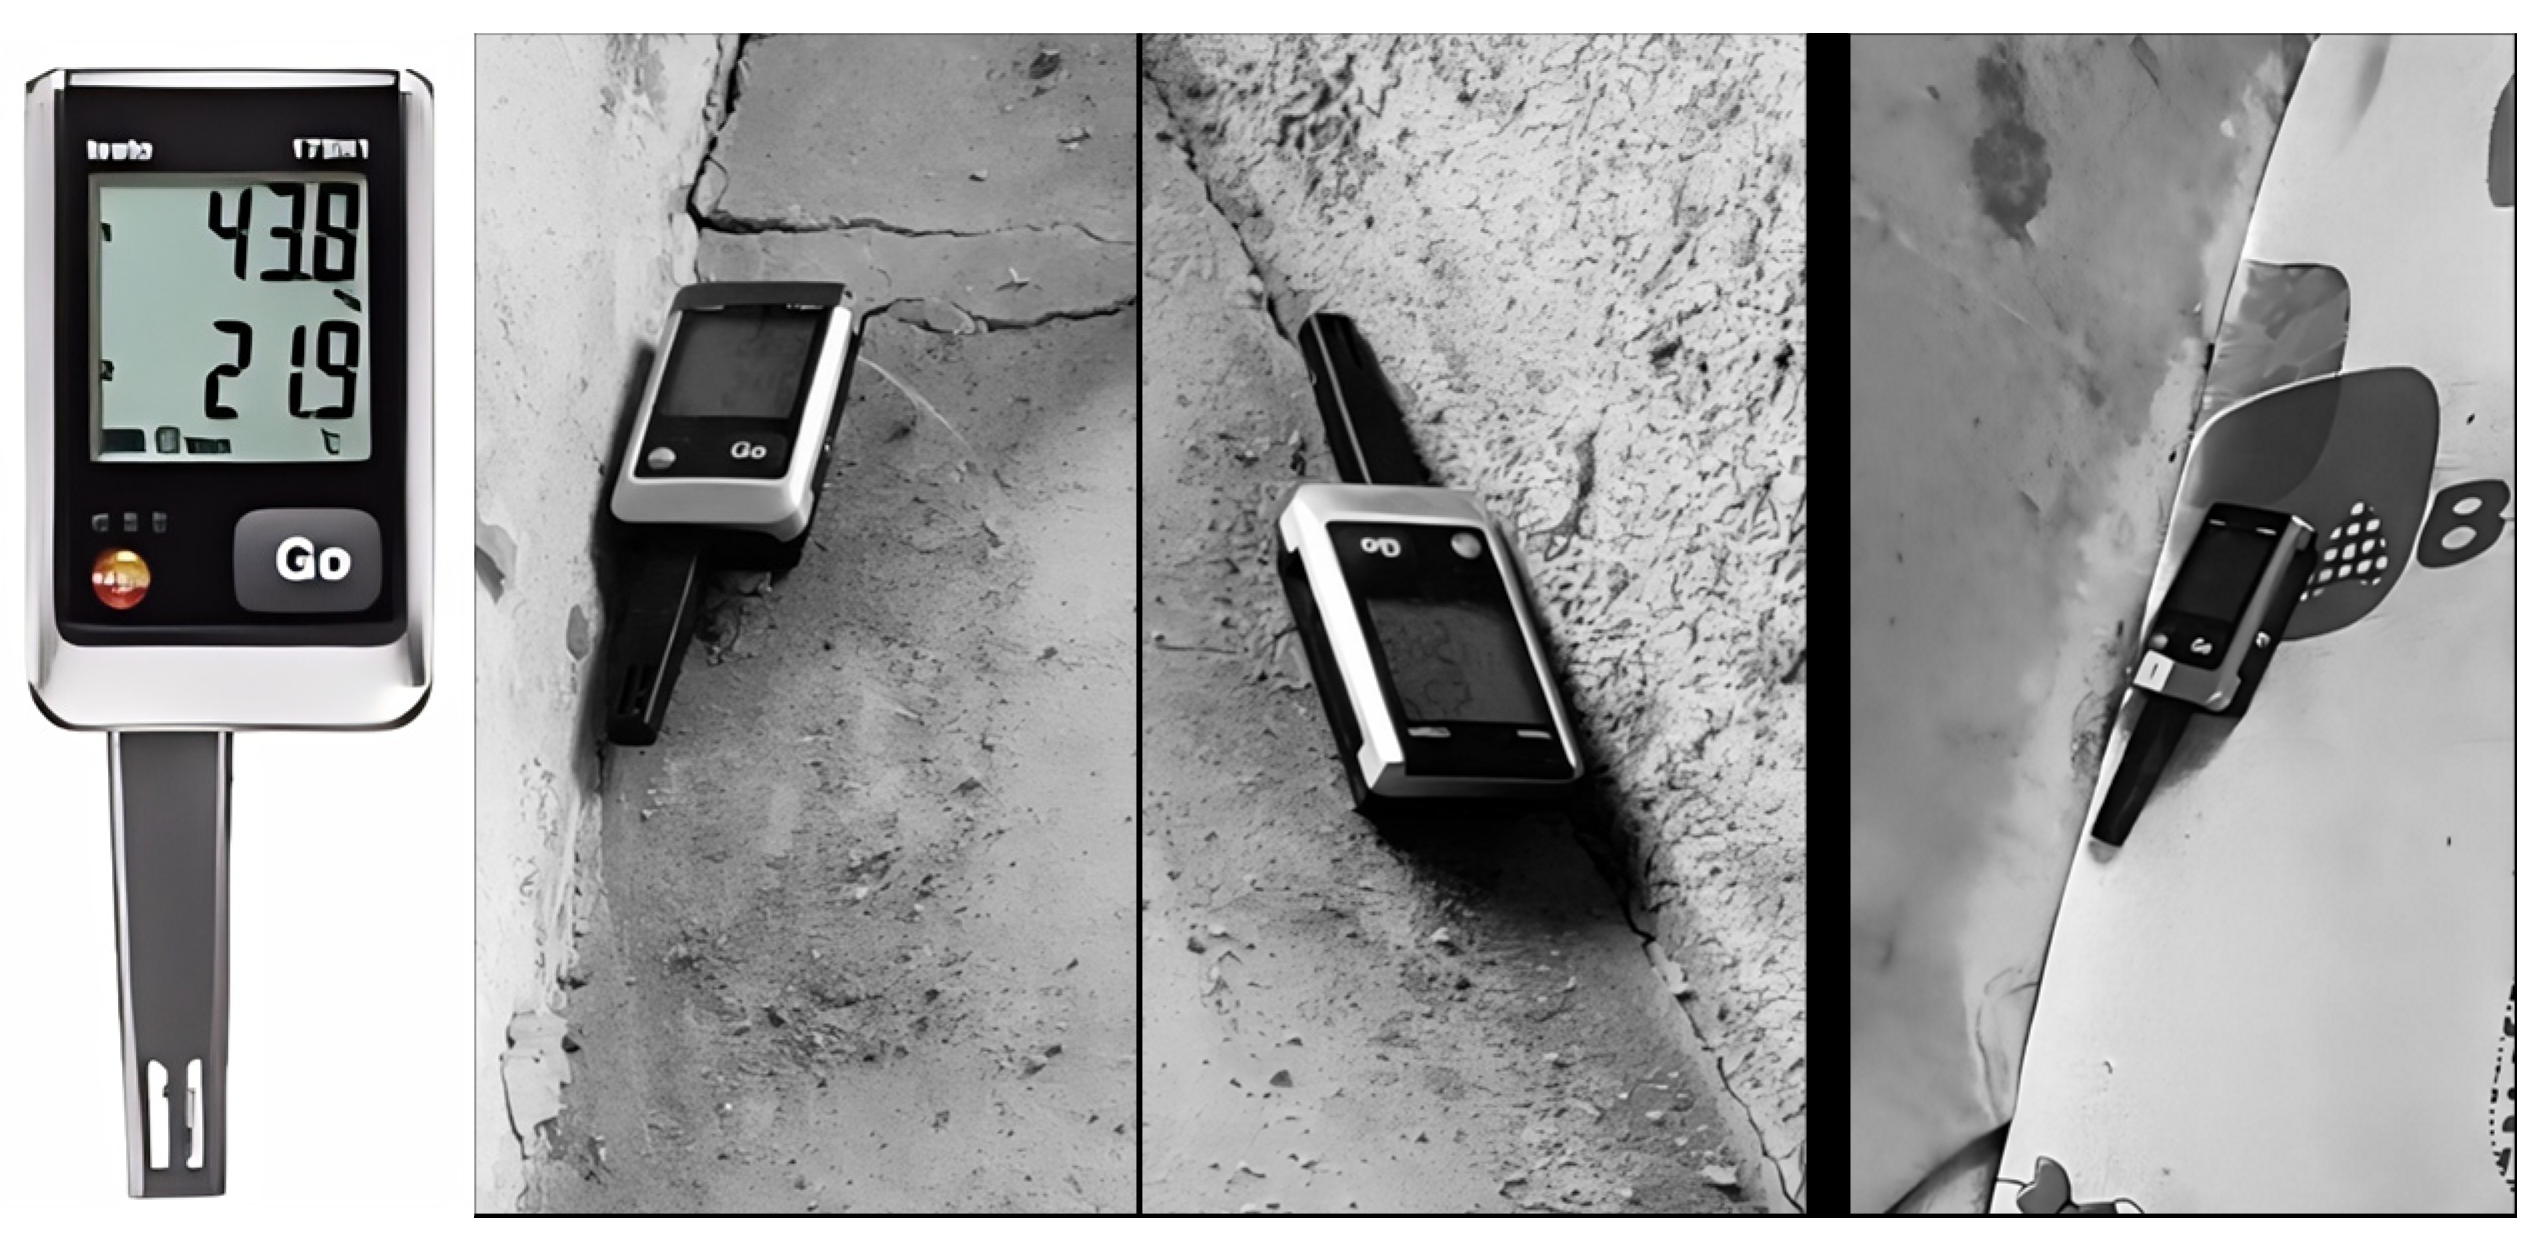
2.1. Experimental Methods
2.2. Experimental Materials
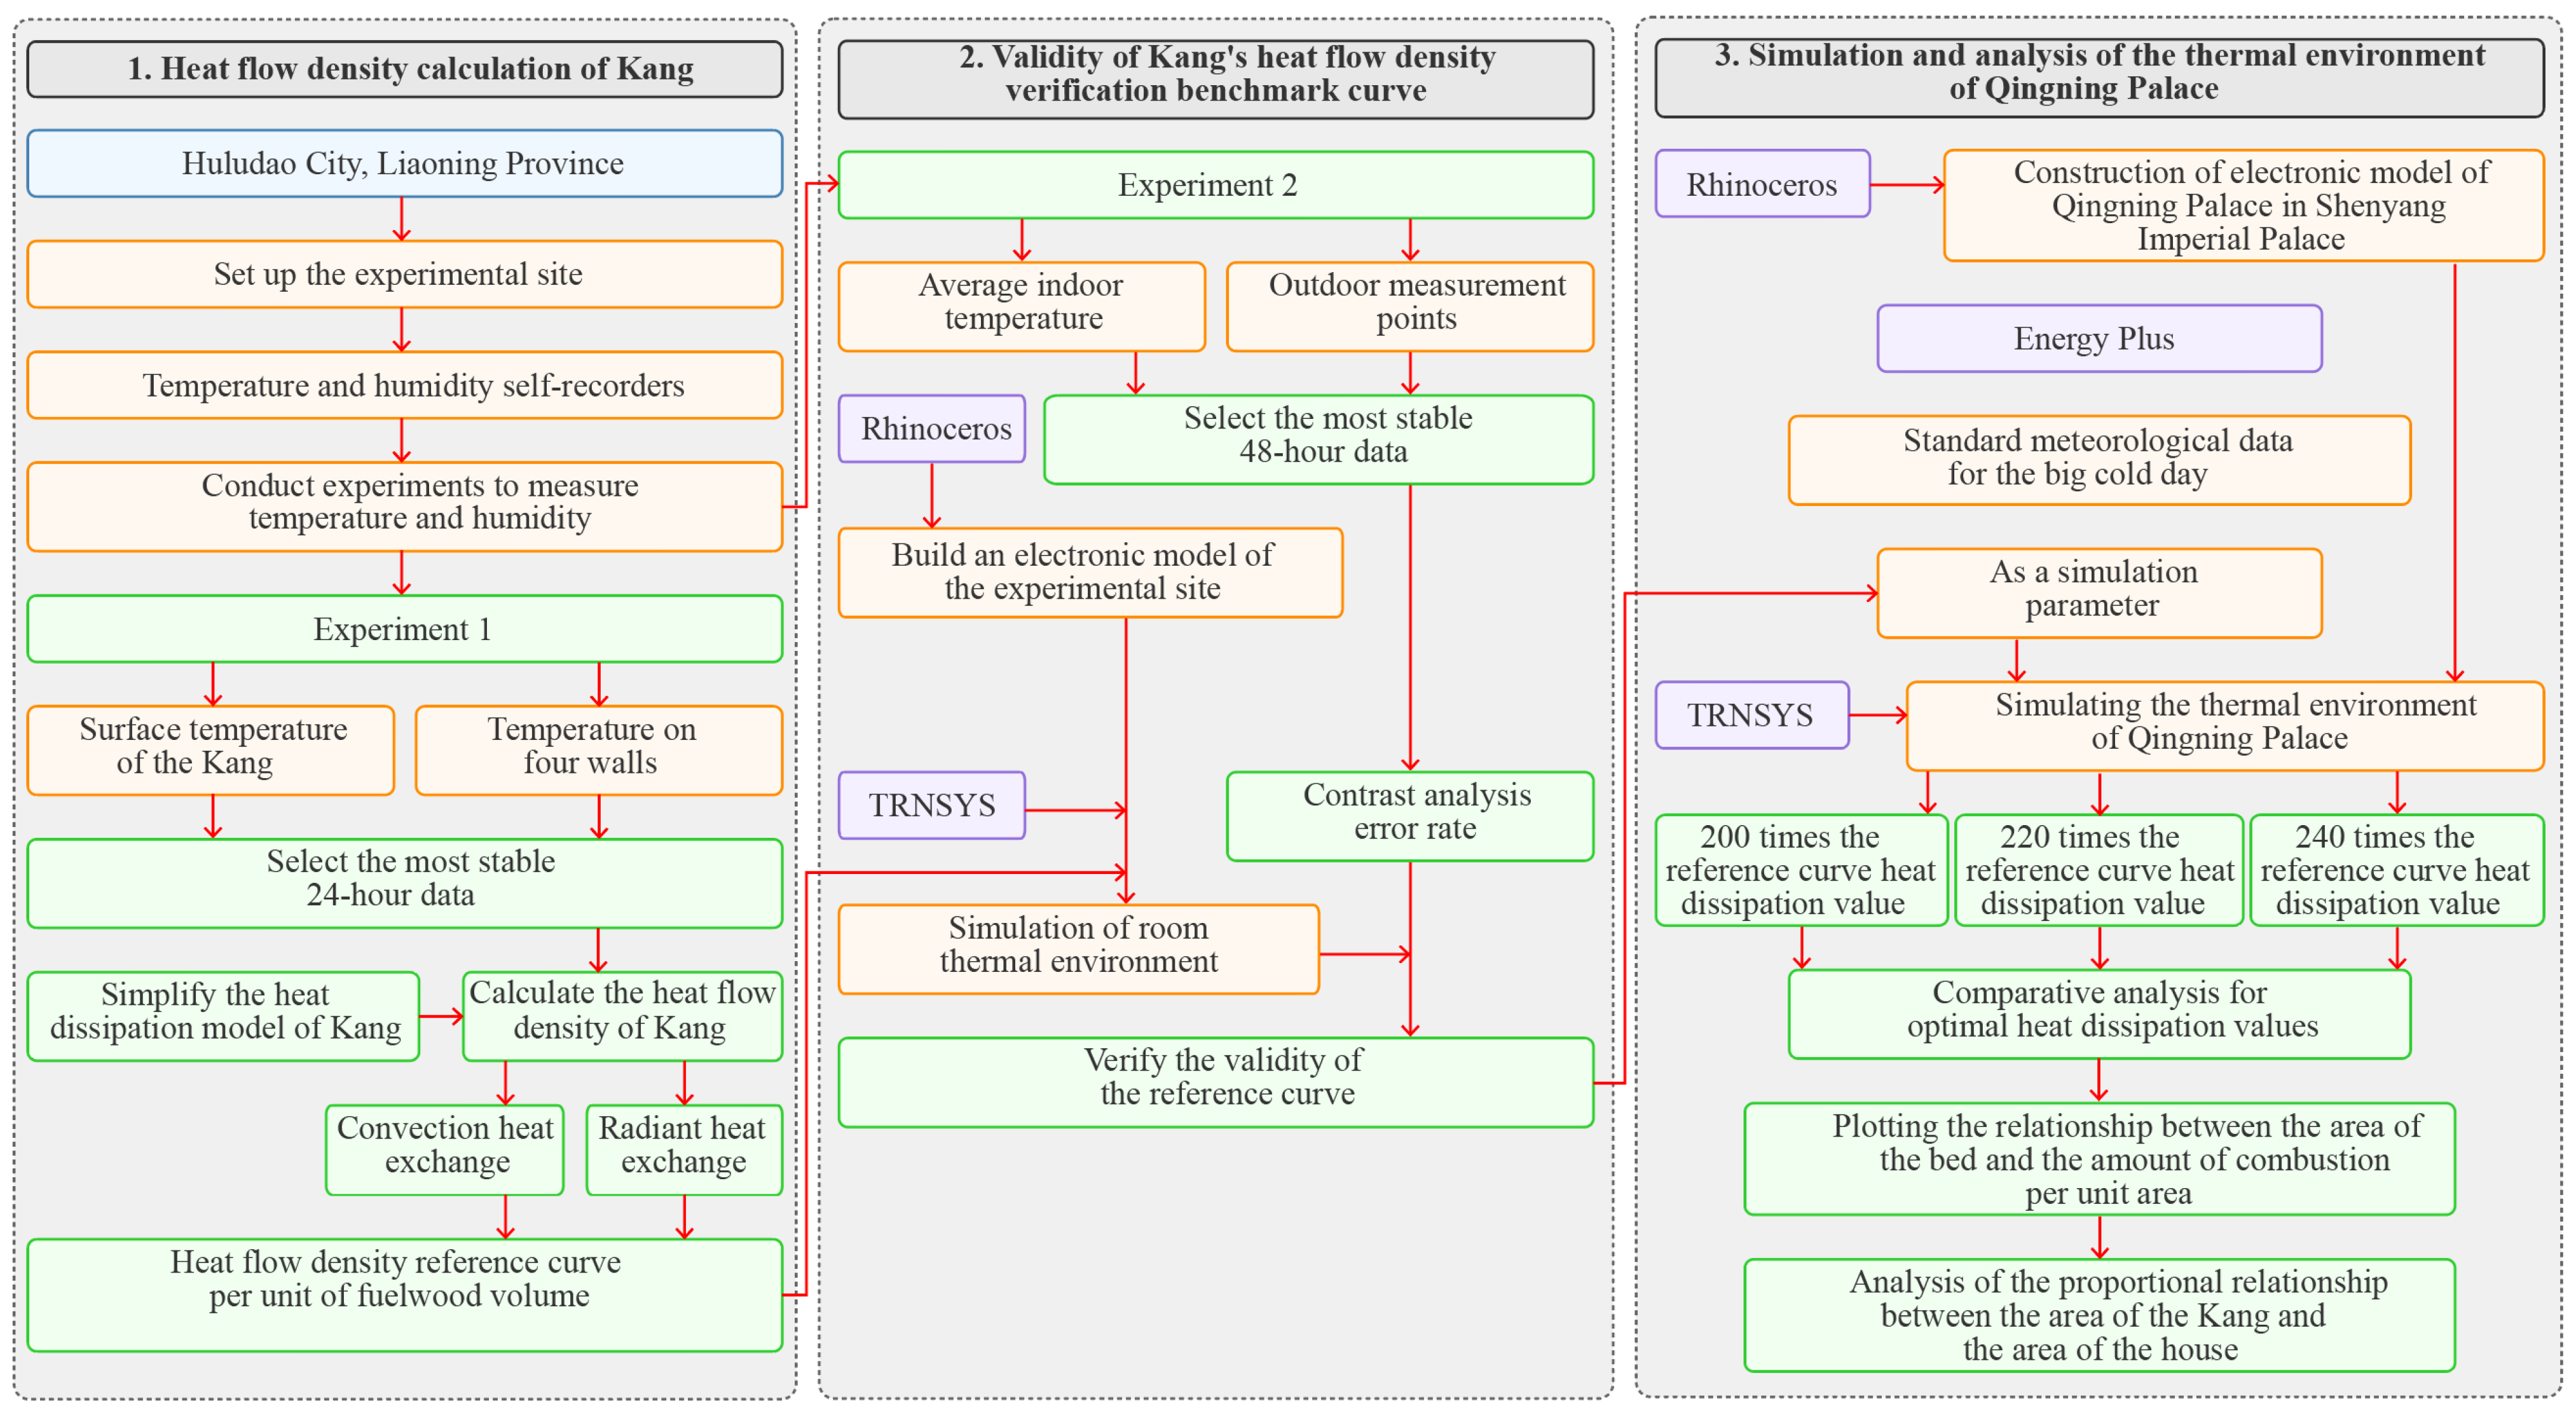
2.3. Research Methodology
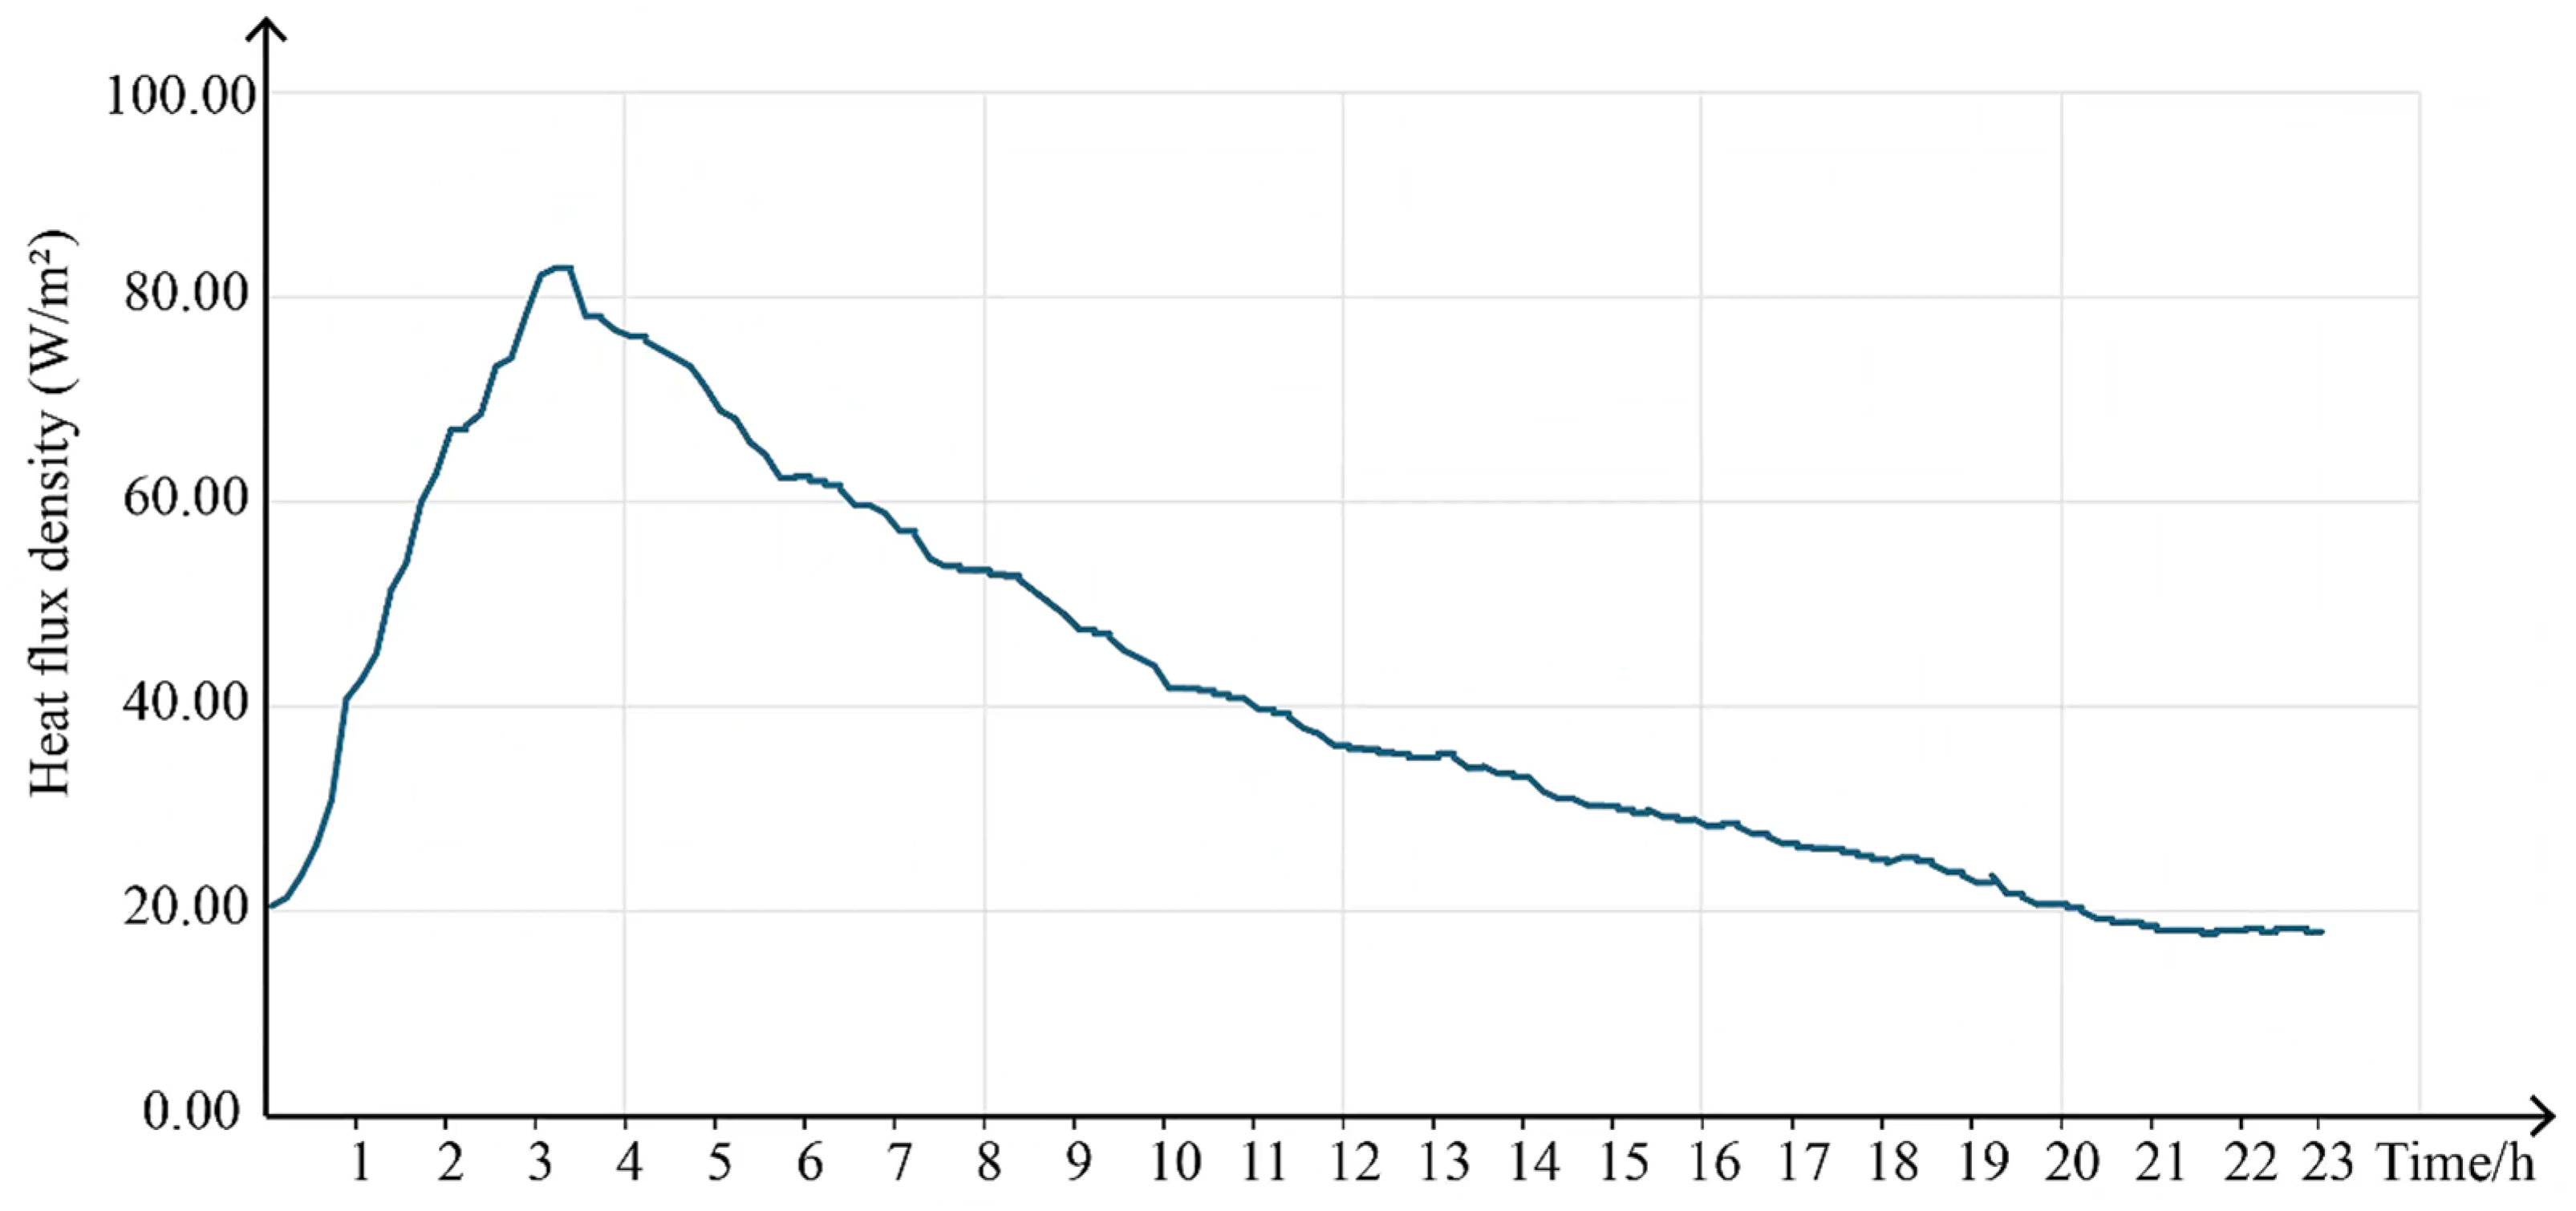
2.3.1. Part 1: Heat Flow Density Calculation of Kang
- (1)
- Direct Measurements in the Experimental House
- (2)
- Thermal Flux Density Computation
2.3.2. Part 2: Validity of Kang’s Heat Flow Density Verification Benchmark Curve
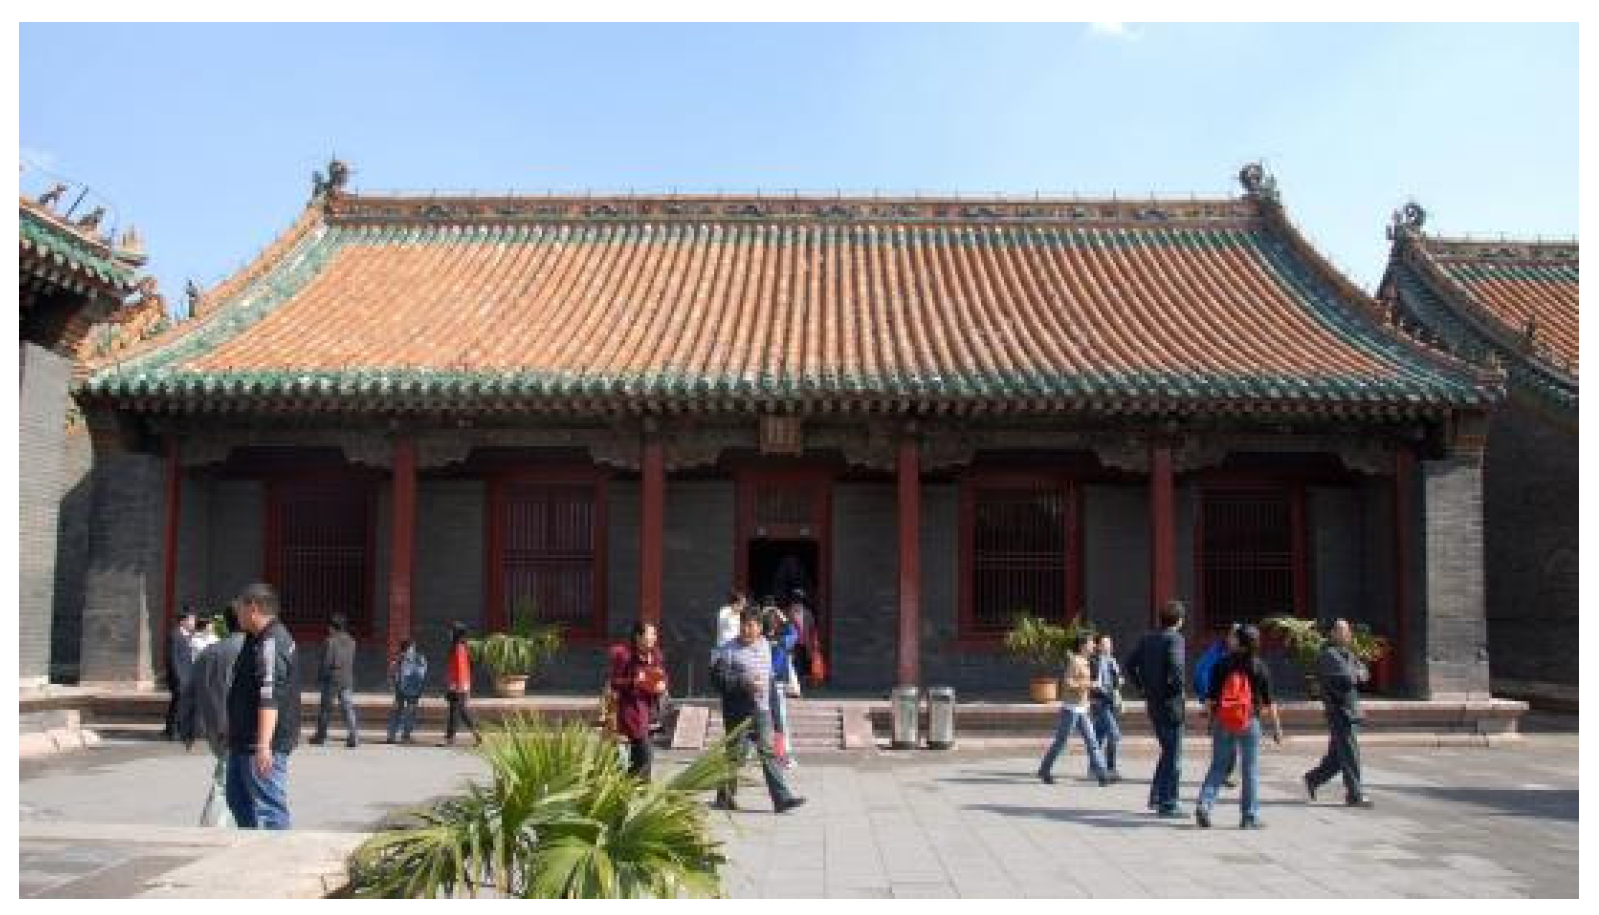
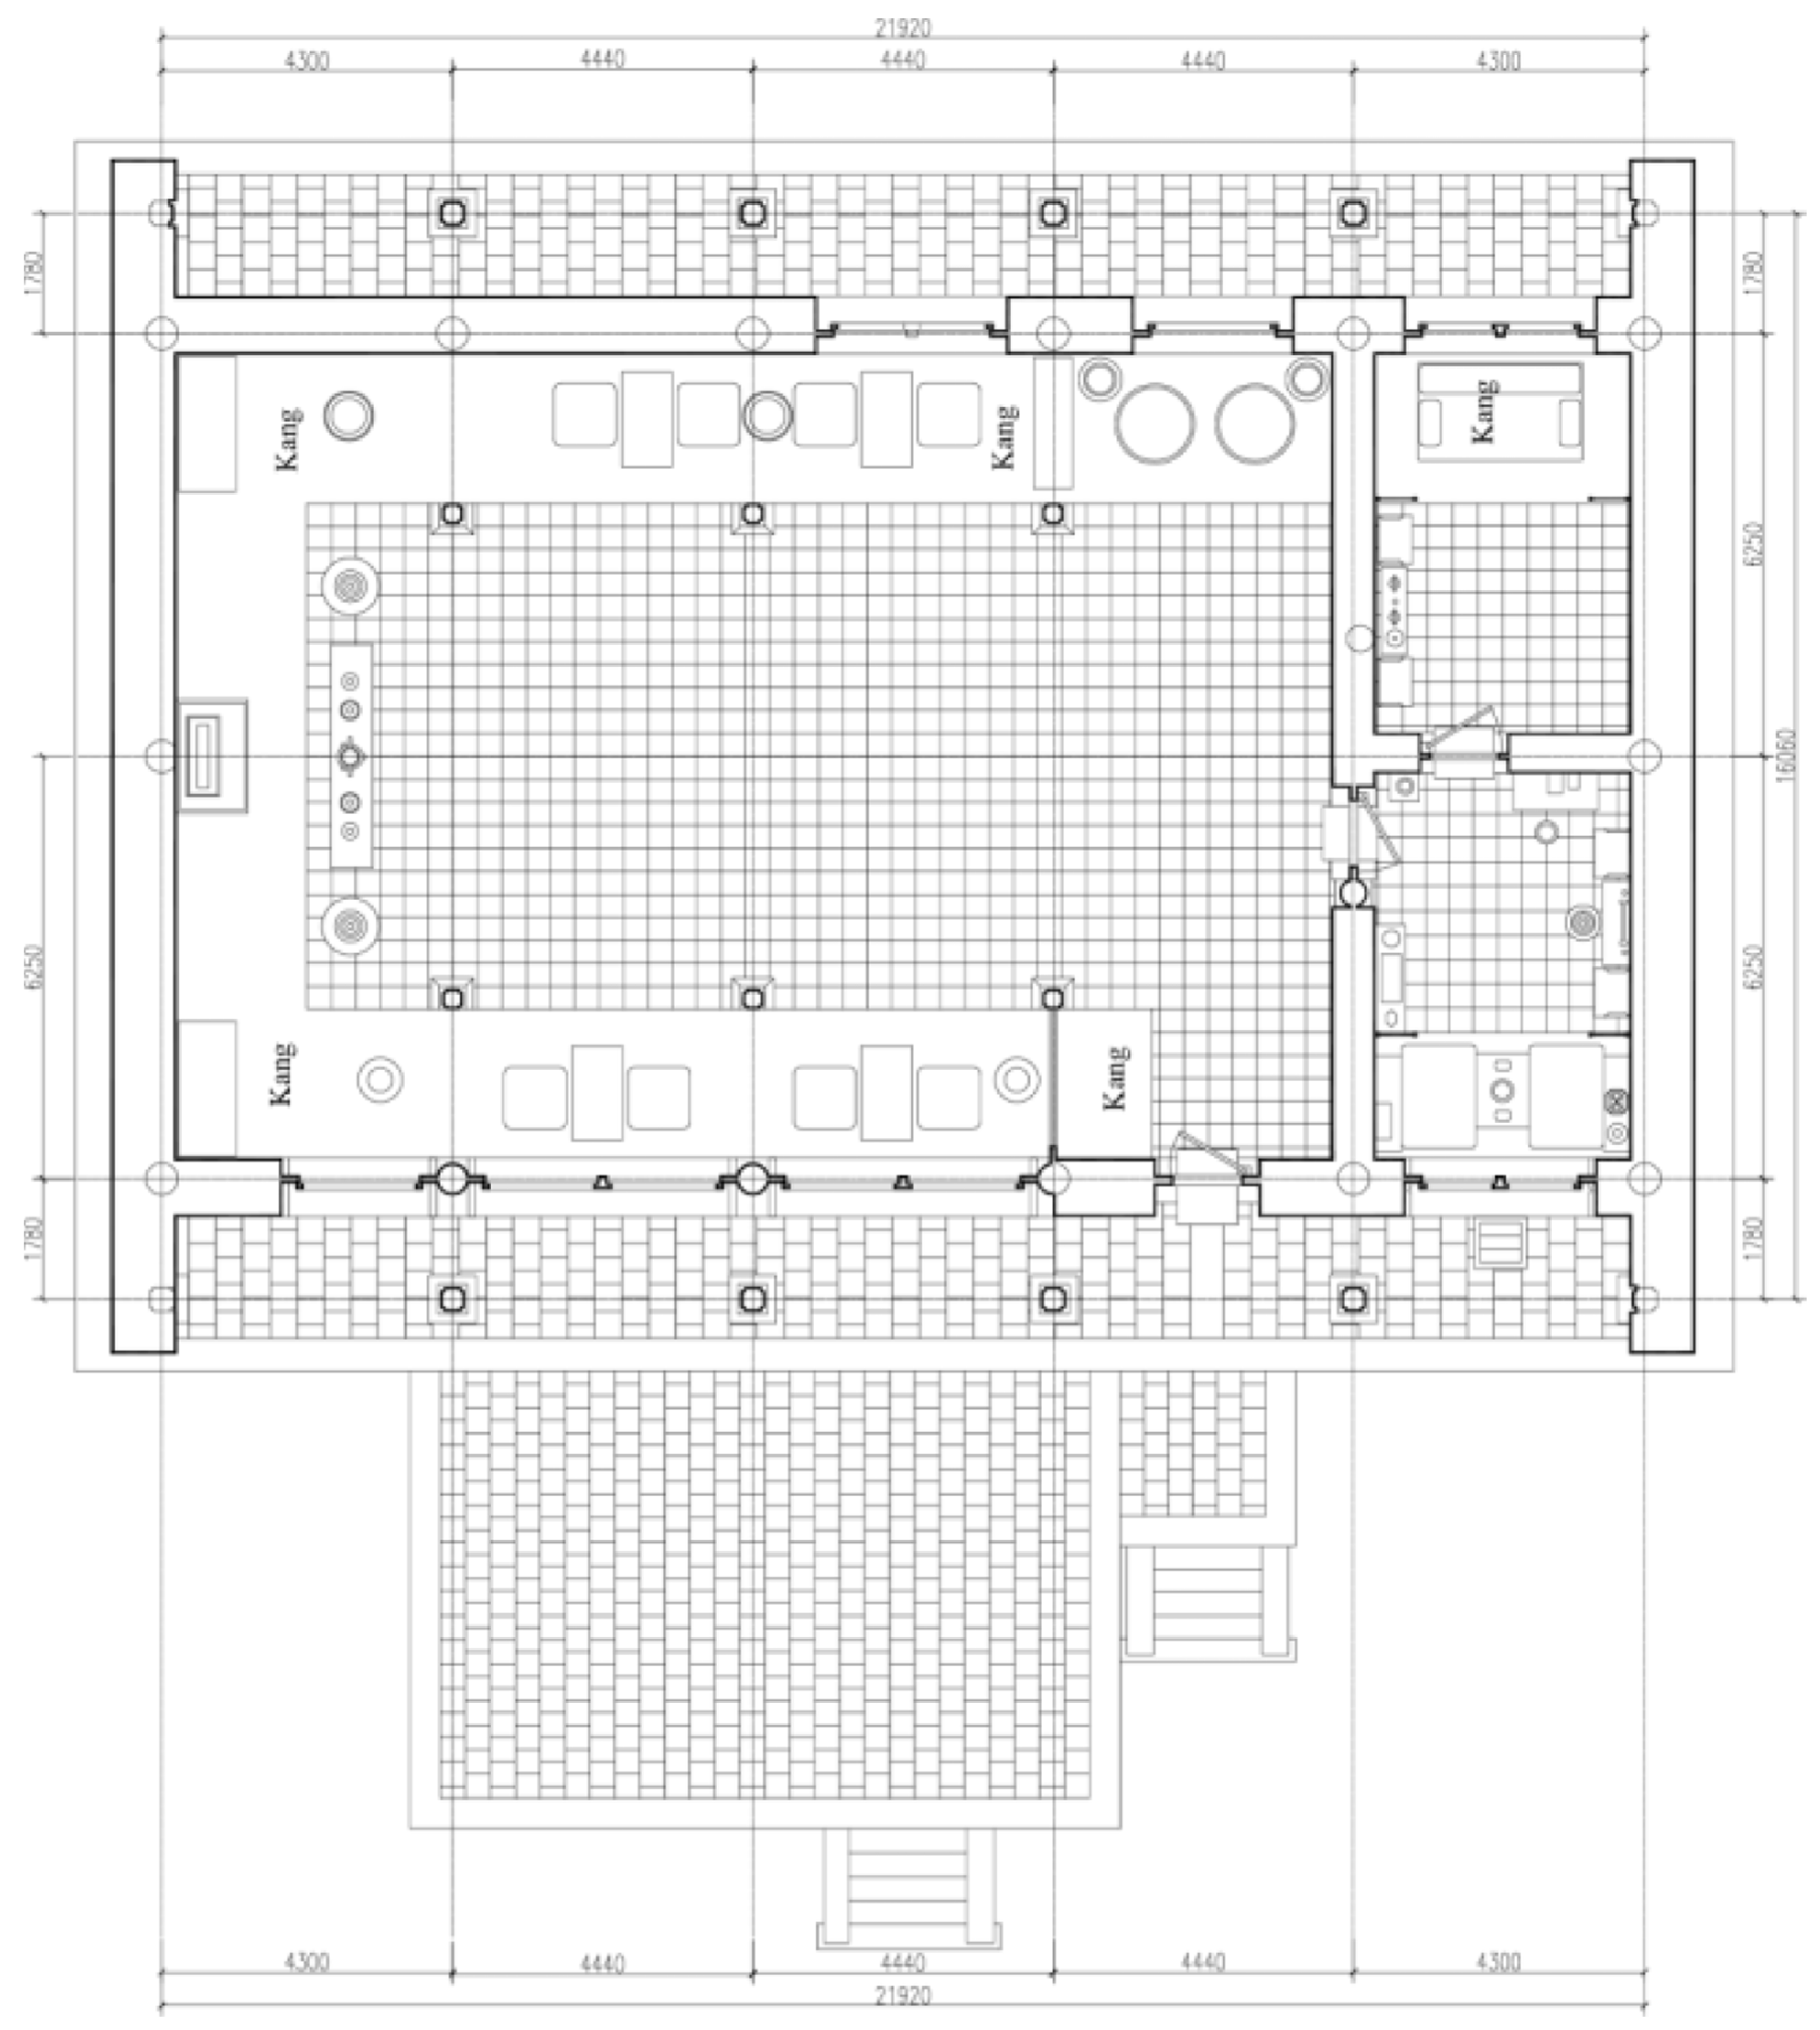
2.3.3. Part 3: Simulation and Analysis of the Thermal Environment of Qingning Palace
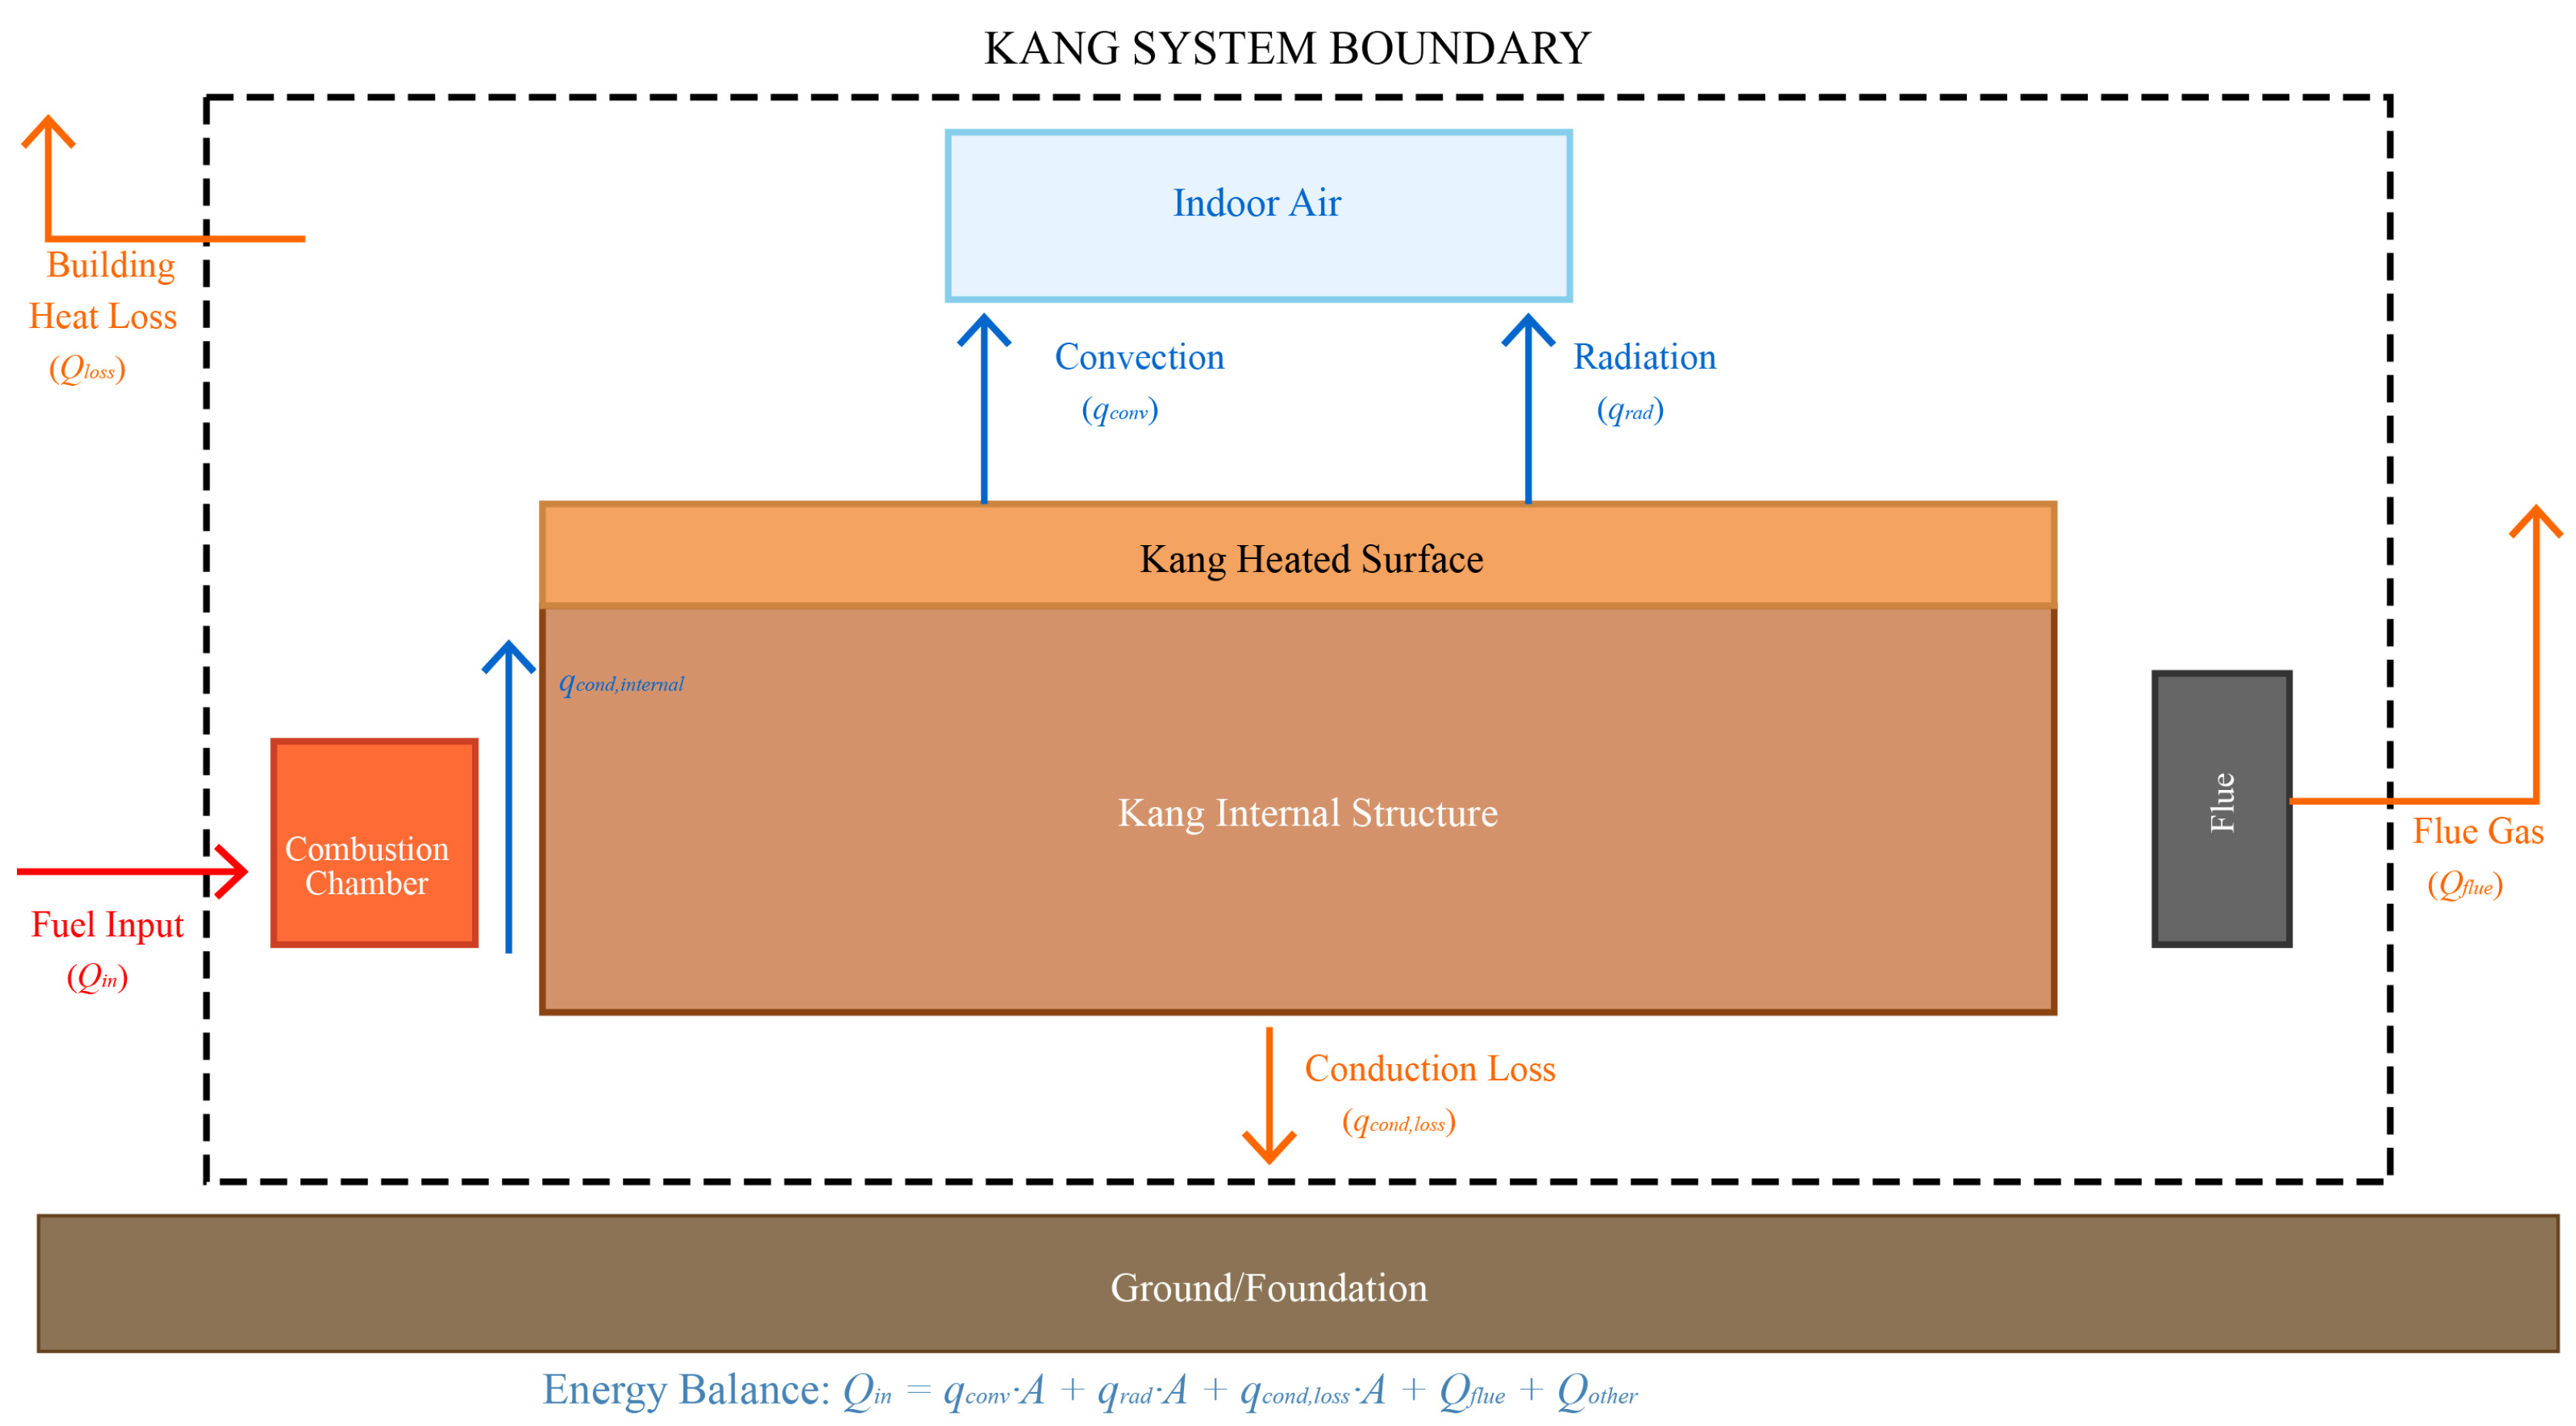
2.3.4. Mathematical Heat Transfer Model and Assumptions
- (1)
- Uniform Heat Distribution: Heat distribution across the Kang surface is assumed uniform, neglecting local variations due to flue positioning and internal geometry complexity.
- (2)
- Steady-State Thermal Properties: Material thermal properties remain constant over the operational temperature range, based on values in the literature for traditional building materials.
- (3)
- Natural Convection Regime: The Kang surface operates under natural convection conditions with Rayleigh numbers ranging from 107 to 1010, confirming turbulent natural convection.
- (4)
- Negligible Air Infiltration: Building air leakage is minimal due to traditional construction methods, validated through blower door testing showing air changes of less than 0.5 ACH.
- (5)
- Gray Body Radiation: Surface emissivities are assumed constant at 0.9 for clay-based Kang surfaces, consistent with published values for similar materials.
- (6)
- Conductive Heat Transfer Treatment: Conductive heat transfer within the Kang structure is implicitly incorporated through measured surface temperatures rather than explicitly modeled. This approach is justified because (a) internal conduction determines the surface temperature distribution measured experimentally, (b) heat losses through conduction to foundations and adjacent structures are minimal (<10% of total heat transfer), (c) the dominant heat transfer mechanisms are convection and radiation from the heated surface, and (d) validation results confirm this approach adequately captures system behavior.
2.3.5. TRNSYS Model Configuration and Parameters
2.3.6. Building Heat Loss Calculations and Energy Balance
2.3.7. Rationale for Constant Heat Flux Approach
- (1)
- Thermal Equivalence: By maintaining consistent fuel consumption per unit area (1 kg/m2), we establish a standardized thermal input that can be scaled proportionally for different room sizes while preserving the fundamental heat transfer characteristics of the Kang system.
- (2)
- Scalability: This approach allows for direct comparison between the experimental house (24 m2) and Qingning Palace (352 m2) by using multiplier factors (4.8× and 220×, respectively) that maintain the same underlying thermal performance curve.
- (3)
- Design Optimization: The constant flux rate provides a basis for determining optimal area ratios based on thermal comfort requirements (PMV values) rather than direct guesswork, ensuring that the Kang size is thermally justified for any given room size.
2.4. Thermal Comfort Assessment
2.5. Data Analysis Methods
- (1)
- Statistical Analysis: Microsoft Excel (2019, Microsoft Corporation, Redmond, WA, USA) and MATLAB (R2021a, The MathWorks, Inc., Natick, MA, USA) were used for data processing, calculations, and plotting graphs.
- (2)
- Error Analysis: The mean absolute error (MAE) and root mean square error (RMSE) were calculated between simulated and measured temperatures.
- (3)
- Thermal Comfort Metrics: The Center for the Built Environment Thermal Comfort Tool was utilized to compute PMV values based on simulated indoor conditions.
2.6. Assumptions and Simplifications
- (1)
- Uniform Heat Distribution: Uniform heat distribution from the Kang’s surface was assumed, neglecting the complexity of internal flue designs.
- (2)
- Negligible Air Infiltration: Minimal air leakage in the experimental house and Qingning Palace was assumed due to building tightness.
- (3)
- Constant Material Properties: The thermal properties of materials were considered to be constant over the temperature range studied.
3. Results
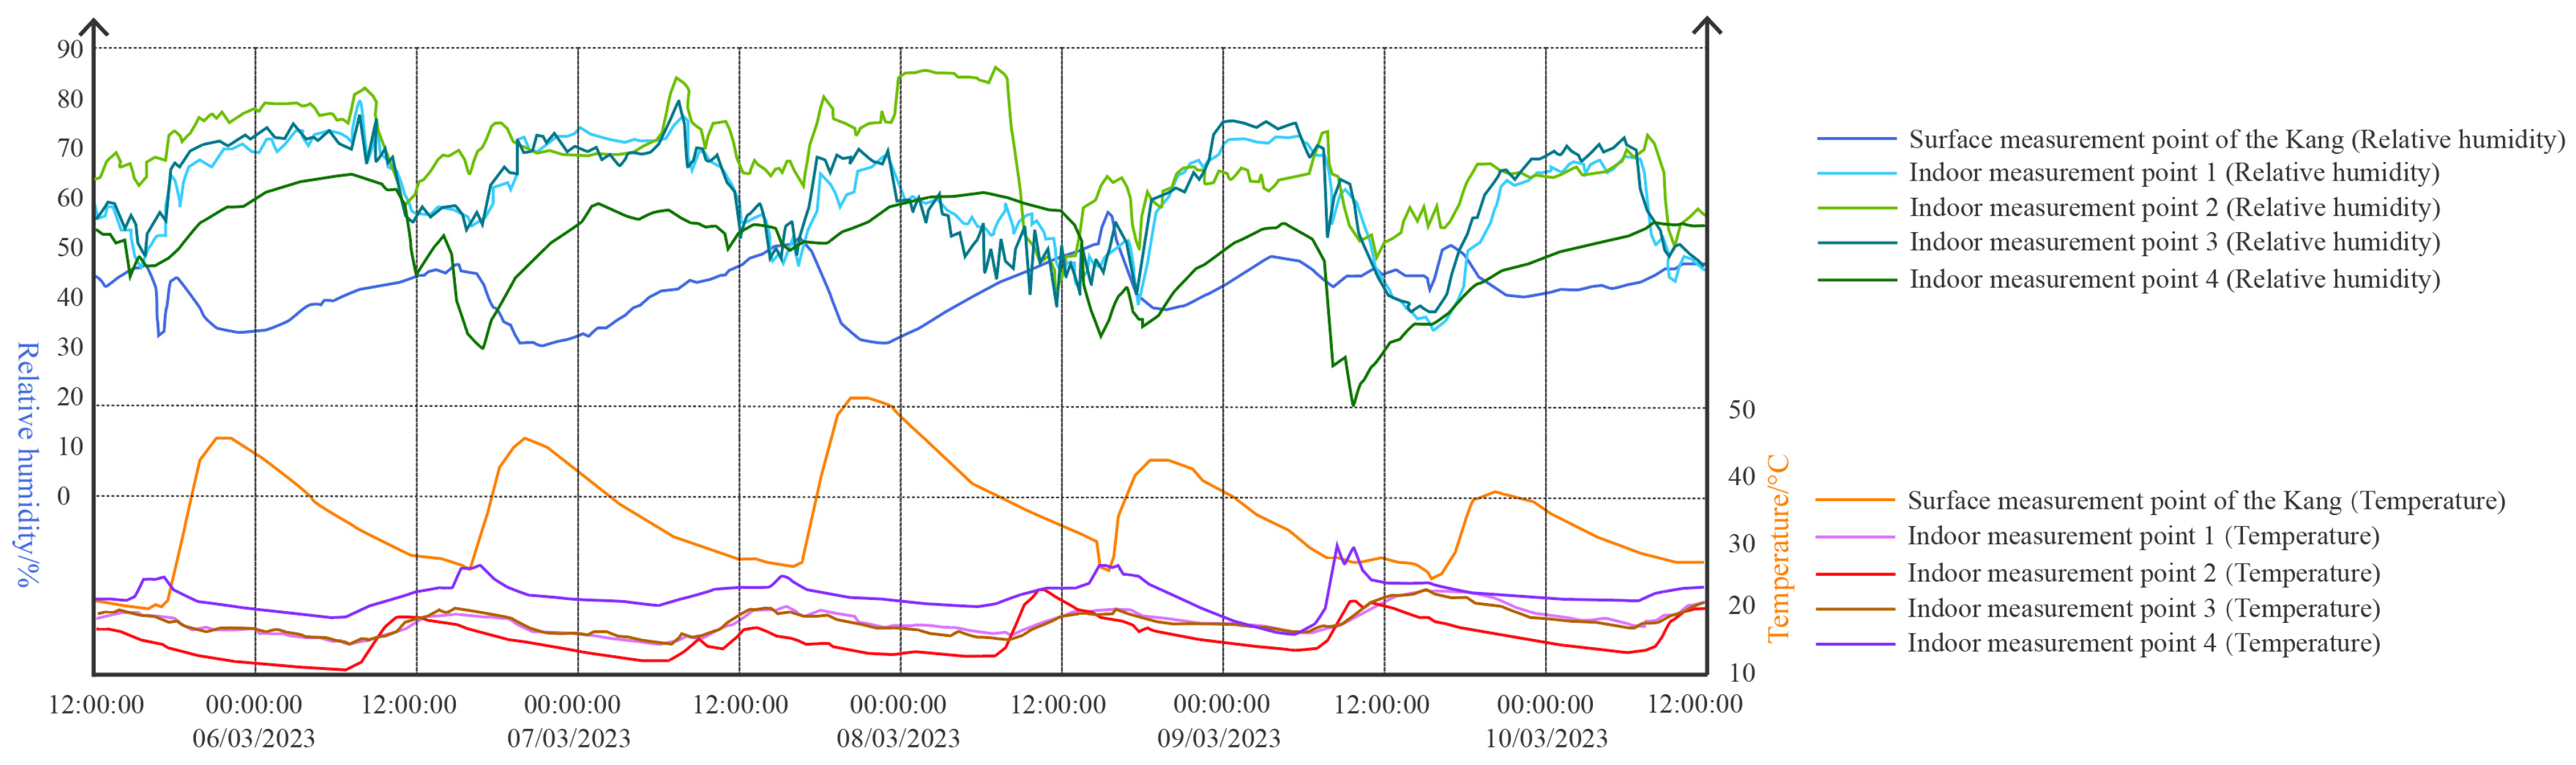
3.1. Experiment 1 Data and the Heat Flow Density Results
3.1.1. Data Analysis Discussions
3.1.2. Temperature Conversion and Calculation
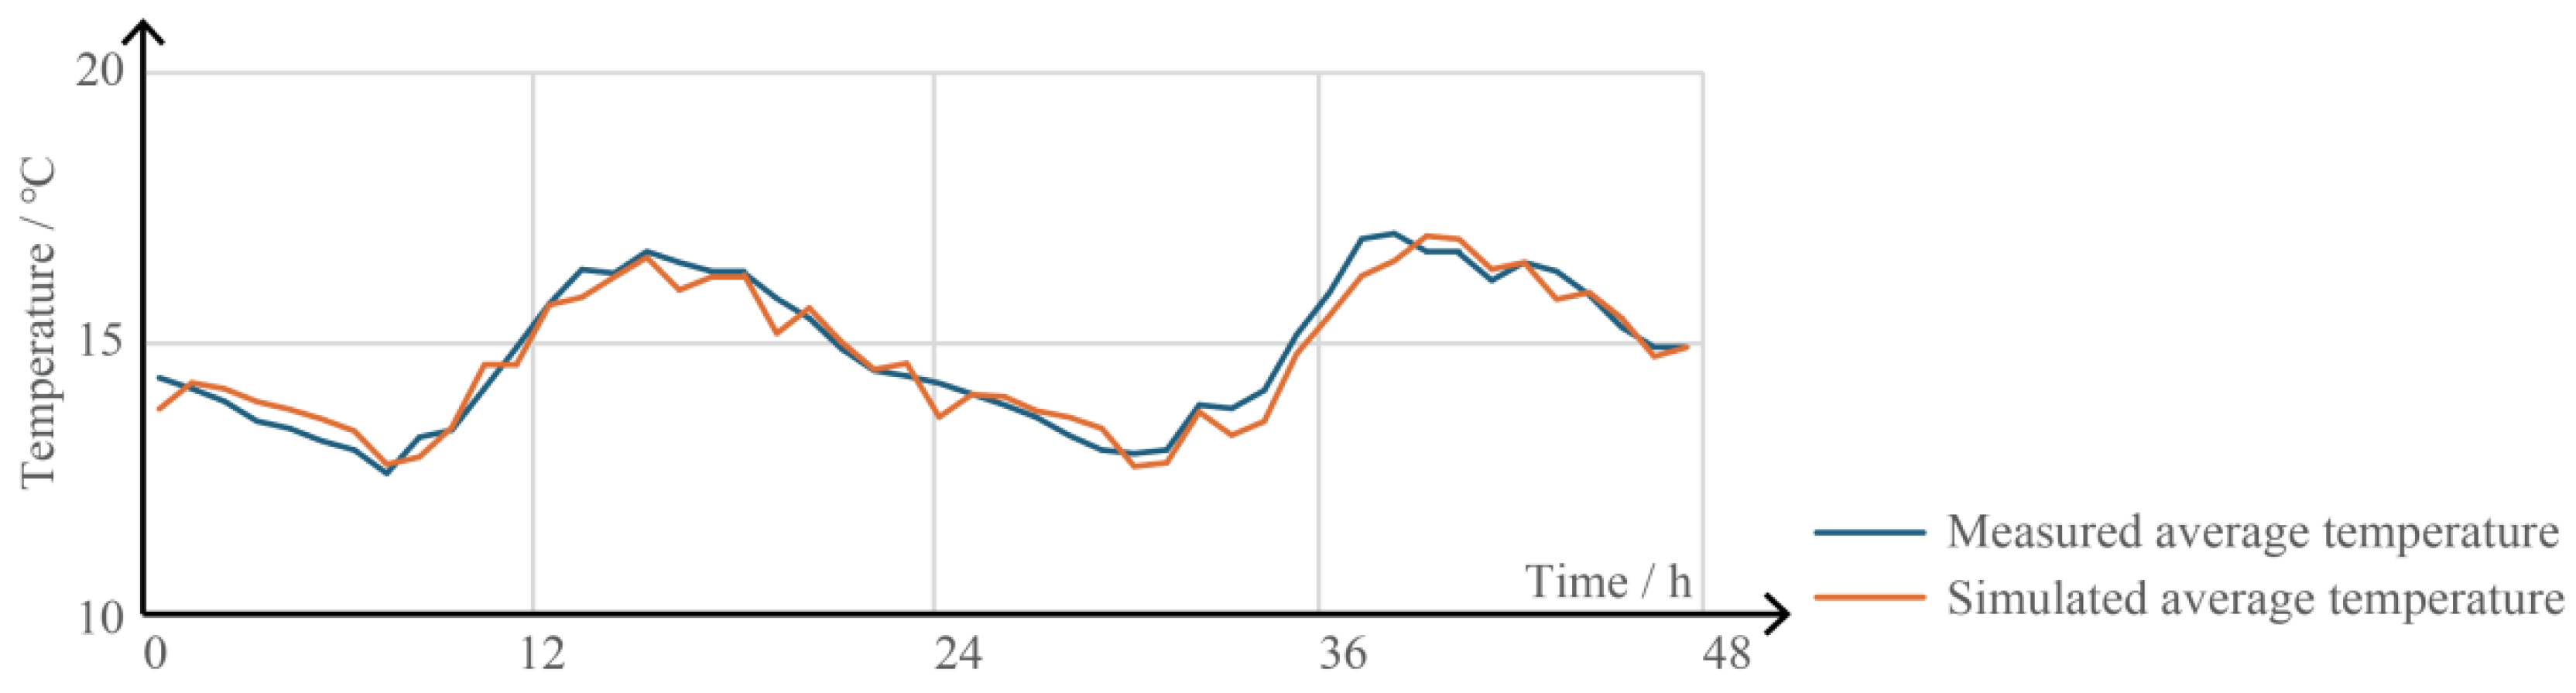
3.2. Computational Model Validation Through Experiment 2 Comparison
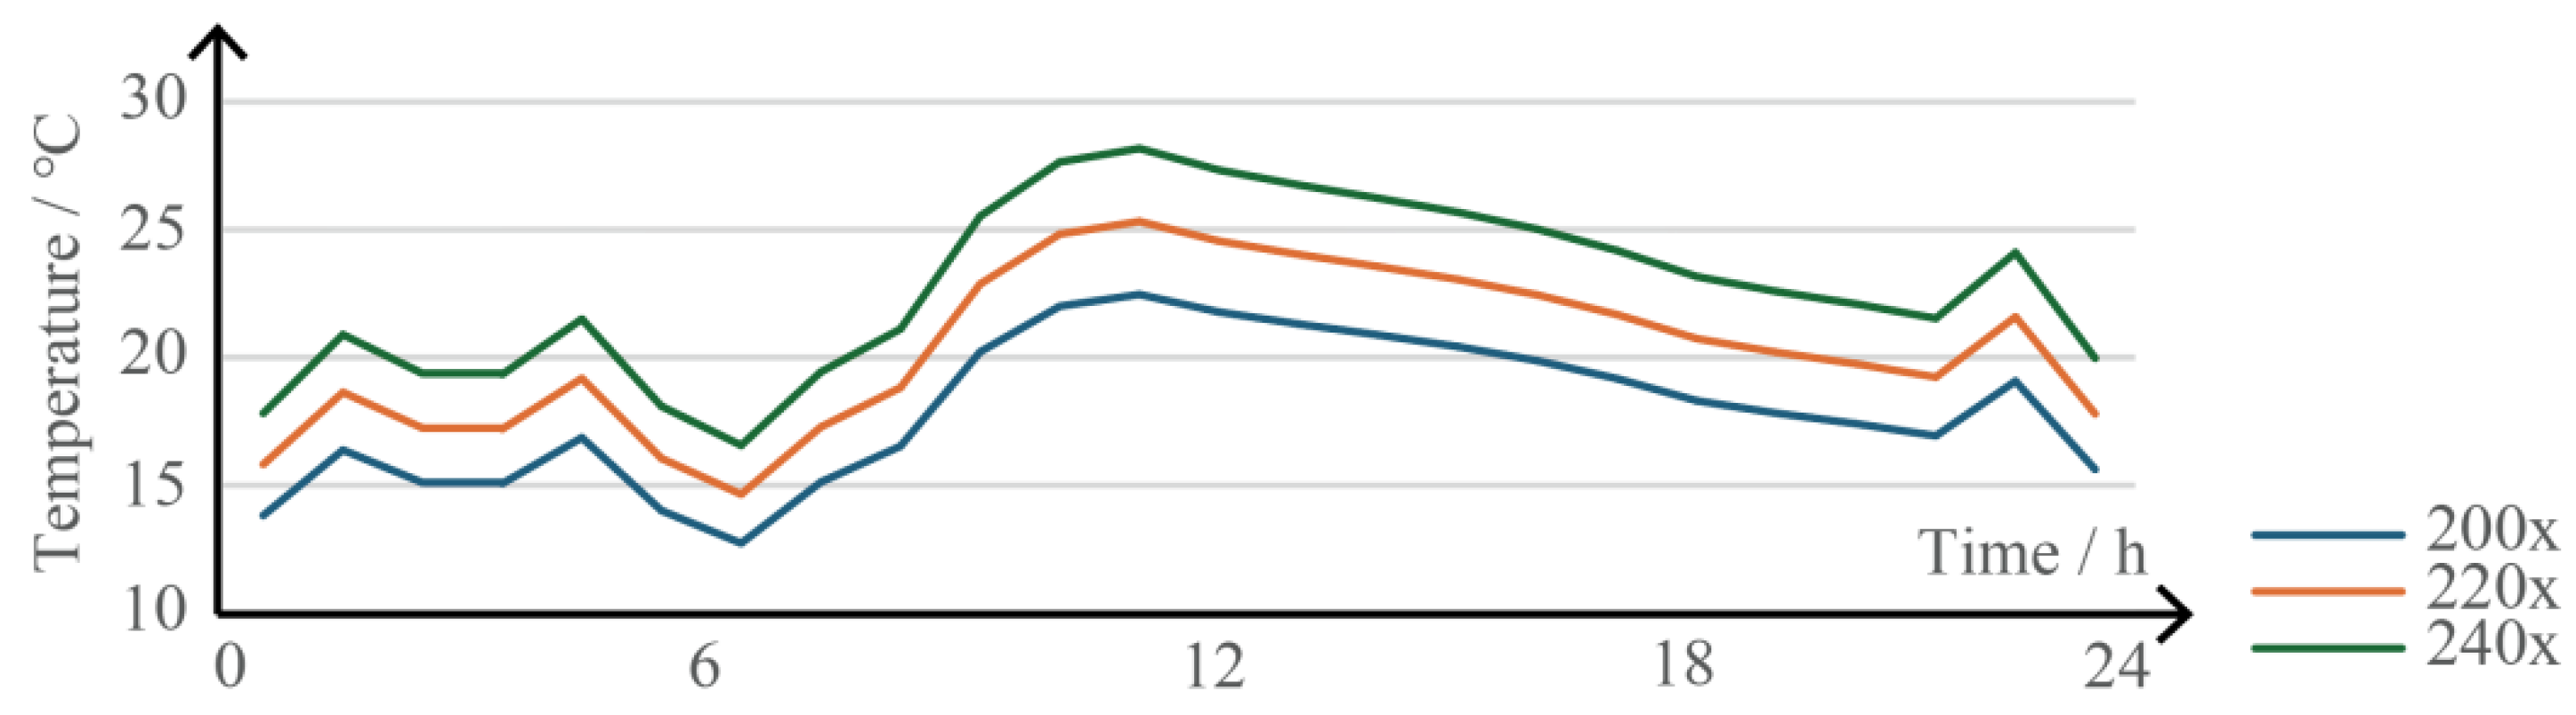
3.3. Comparative Analysis Results and Optimal Operating Conditions
3.3.1. Model Parameter Calculations
3.3.2. Temperature Performance Analysis
3.3.3. Thermal Comfort Evaluation
3.3.4. Optimal Operating Determination
3.3.5. Building Heat Loss and Energy Balance Results
3.4. Mathematical Relationships and Application
4. Discussion
- (1)
- Accuracy of the Benchmark Curve: The benchmark curve, derived from experimental data, precisely captures the time-dependent variation in heat flux density of the Kang system under a specific fuelwood consumption rate. Validation through comparisons of simulated and measured indoor temperatures revealed an MAE of 0.46 °C and RMSE of 0.53 °C, confirming the benchmark curve as a reliable tool for predicting the Kang’s thermal performance.
- (2)
- Insights from Simulation Results: TRNSYS simulations for the Qingning Palace demonstrated that scaling the benchmark curve by a factor of 220 optimizes indoor thermal conditions, aligning with thermal comfort standards (PMV ranging from −0.5 to +0.5). This indicates that a well-designed and operated Kang system can efficiently meet the heating needs of large traditional buildings without excessive energy use.
- (3)
- Validation of Traditional Design: The optimal Kang-to-room area ratio for the Qingning Palace was found to range between 0.28 and 0.69, with the existing ratio of 0.34 falling within this range. This confirms the rationality of traditional design practices, showing their consistency with modern scientific analysis and underscoring the sustainability of traditional architectural solutions.
- (1)
- Energy Efficiency: By defining a proportional relationship between the Kang area and room area, designers can tailor the Kang’s dimensions to the building’s thermal demands, minimizing unnecessary energy consumption and enhancing fuelwood efficiency.
- (2)
- Cultural Heritage Preservation: Confirming the efficacy of traditional Kang dimensions supports efforts to preserve cultural heritage. Integrating scientifically optimized traditional systems into modern designs can bolster cultural sustainability while meeting current comfort standards.
4.1. Study Constraints and Methodological Considerations
- (1)
- Simplified Heat Dissipation Model: This study assumed uniform heat distribution and neglected the influence of Kang’s flue design and chimney effects. In reality, these factors can significantly impact heat transfer and should be considered in future research.
- (2)
- Material Property Variations: The thermal properties of construction materials were assumed constant, whereas, in practice, they may vary with temperature and moisture content, affecting heat transfer dynamics.
- (3)
- Sample Size and Scope: The direct measurements were conducted in a single experimental house, and simulations focused on one historic building. Expanding the sample size and including diverse building types would enhance the generalizability of the findings.
- (4)
- Behavior Factors: This study did not account for variations in user behavior, such as differing fuel loading patterns or occupancy schedules, which can influence Kang’s performance.
- (5)
- Thermal Comfort Assessment Scope: While we employed PMV calculations as an initial thermal comfort indicator, our assessment did not include comprehensive local comfort analysis such as radiant temperature asymmetry evaluation, vertical temperature gradient assessment, or spatial analysis of thermal discomfort from surface temperature variability. Future research should incorporate detailed local thermal comfort measurements, including radiant asymmetry analysis and evaluation of thermal gradients, to provide a comprehensive occupant comfort assessment.
4.2. Future Research Directions
- (1)
- Incorporate Complex Heat Transfer Mechanisms: Develop more comprehensive models that include flue design, chimney effects, and variable material properties to better simulate real-world conditions.
- (2)
- Expand Direct Studies: Conduct experiments in multiple houses with varying designs, materials, and climatic conditions to validate and refine the proportional relationship established.
- (3)
- Explore Modern Materials and Technologies: Investigate the integration of modern insulation materials, phase change materials, or advanced combustion technologies to enhance Kang’s efficiency.
- (4)
- Assess User Behavior Impact: Study the influence of user practices on Kang’s performance to develop guidelines that encourage optimal operation and maintenance.
- (5)
- Evaluate Long-term Sustainability: Analyze the Kang system’s lifecycle environmental impact, including fuel sourcing, emissions, and potential for renewable energy integration.
5. Conclusions
Supplementary Materials
Author Contributions
Funding
Data Availability Statement
Conflicts of Interest
Abbreviations
| Roman Symbols: | |
| A | surface area (m2) |
| h | convective heat transfer coefficient (W/m2·K) |
| i | Kang-to-room area ratio (dimensionless) |
| N | heat dissipation factor (W) |
| n | air change rate (h−1) |
| Nu | Nusselt number (dimensionless) |
| Pr | Prandtl number (dimensionless) |
| q | heat flux density (W/m2) |
| qc | convective heat flux density (W/m2) |
| qn | fuel consumption rate per unit area (kg/m2) |
| qr | radiative heat flux density (W/m2) |
| Q | heat transfer rate (W) |
| Ra | Rayleigh number (dimensionless) |
| R | thermal resistance (m2·K/W) |
| S | Kang surface area (m2) |
| SA | room area (m2) |
| t | time (h) |
| T | absolute temperature (K) |
| tf | air temperature near Kang surface ( °C) |
| tw | Kang surface temperature ( °C) |
| Ts(t) | heat flux density as function of time (W/m2) |
| U | thermal transmittance (W/m2·K) |
| V | building volume (m3) |
| x | characteristic length (m) |
| Greek Symbols: | |
| ΔT | temperature difference (K) |
| ε | emissivity (dimensionless) |
| λ | thermal conductivity (W/m·K) |
| σb | Stefan–Boltzmann constant (5.67 × 10⁻⁸ W/m2·K4) |
| Subscripts: | |
| i | internal surface |
| o | external surface |
| si | internal surface resistance |
| so | external surface resistance |
| trans | transmission |
| vent | ventilation |
| wall | wall component |
References
- Yang, B.J. Chunqiu Zuozhuan Zhu [Commentary on the Zuo Tradition of the Spring and Autumn Annals]; Zhonghua Book Company: Beijing, China, 1981. [Google Scholar]
- Xu, M. San Chao Bei Meng Hui Bian (Jia) [Compilation of the Northern Alliance in Three Dynasties (Vol. 1)]; Da Hua Bookstore: Beijing, China, 1979. [Google Scholar]
- Bian, M. Numerical simulation research on heat transfer characteristics of a Chinese Kang. Case Stud. Therm. Eng. 2021, 25, 100922. [Google Scholar] [CrossRef]
- Yu, K.; Tan, Y.; Zhang, T.; Zhang, J.; Wang, X. The traditional Chinese kang and its improvement: A review. Energy Build. 2020, 218, 110051. [Google Scholar] [CrossRef]
- Cao, G.; Jokisalo, J.; Feng, G.; Duanmu, L.; Vuolle, M.; Kurnitski, J. Simulation of the heating performance of the Kang system in one Chinese detached house using biomass. Energy Build. 2011, 43, 189–199. [Google Scholar] [CrossRef]
- GB7651-87; Testing Methods for Thermal Performance of Chinese Kang Used with Firewood or Straw Stoves. China National Standards: Beijing, China, 1987.
- Yu, K.; Bai, L.; Zhang, T.; Tan, Y. Improving the thermal performance of the traditional Chinese Kang system by employing smoldering combustion and mechanical ventilation: An experimental study. Energy Build. 2022, 256, 111736. [Google Scholar] [CrossRef]
- Wang, P.; Shan, M.; Xiong, D.; Yang, X. A new Chinese Kang with forced convection: System design and thermal performance measurements. Energy Build. 2014, 85, 410–415. [Google Scholar] [CrossRef]
- Zhai, Z.; Yates, A.P.; Duanmu, L.; Wang, Z. An evaluation and model of the Chinese Kang system to improve indoor thermal comfort in northeast rural China—Part-1: Model development. Renew. Energy 2015, 84, 3–11. [Google Scholar] [CrossRef]
- Li, T.; Wang, Z.; Mao, Q.; Li, G.; Wang, D.; Liu, Y. Simulation and optimization of the key parameters of combined floor and Kang heating terminal based on differentiated thermal demands. Energy Build. 2022, 254, 111624. [Google Scholar] [CrossRef]
- Yang, M.; Yang, X.; Wang, P.; Shan, M.; Deng, J. A new Chinese solar Kang and its dynamic heat transfer model. Energy Build. 2013, 62, 539–549. [Google Scholar] [CrossRef]
- Yan, S.; Liu, N.; Chen, M.; Liu, Y.; Han, S. The thermal effect of the tandem kang model for rural houses in Northern China: A case study in Tangshan. J. Asian Archit. Build. Eng. 2022, 21, 187–196. [Google Scholar] [CrossRef]
- Zhuang, Z.; Li, Y.; Chen, B.; Guo, J. Chinese kang as a domestic heating system in rural northern China—A review. Energy Build. 2009, 41, 111–119. [Google Scholar] [CrossRef]
- Wang, X.; Tan, Y.; Zhang, T.; Lu, X.; Yu, K. Experimental and numerical research on the performance of an energy-saving elevated kang in rural buildings of northeast China. Energy Build. 2018, 177, 47–63. [Google Scholar] [CrossRef]
- Liu, L.; Liu, Q.; Peng, X.; Chen, M.; Li, T. Study on indoor temperature and thermal performance of a novel solar coupled floor and Kang heating system. Sol. Energy 2024, 223, 412–425. [Google Scholar] [CrossRef]
- Shenyang Imperial Palace Museum. Architectural Survey and Documentation of Qingning Palace [Internal Technical Report]; Shenyang Imperial Palace Museum: Shenyang, China, 2019. [Google Scholar]
- UNESCO World Heritage Centre. Imperial Palaces of the Ming and Qing Dynasties in Beijing and Shenyang [World Heritage List Documentation]; UNESCO: Paris, France, 2004. [Google Scholar]
- ISO 6946:2017; Building Components and Building Elements—Thermal Resistance and Thermal Transmittance—Calculation Methods. ISO: Geneva, Switzerland, 2017.
- EnergyPlus. Weather Data; U.S. Department of Energy. 2023. Available online: https://energyplus.net/weather (accessed on 10 March 2023).
- Incropera, F.P.; DeWitt, D.P.; Bergman, T.L.; Lavine, A.S. Fundamentals of Heat and Mass Transfer, 8th ed.; Wiley: Hoboken, NJ, USA, 2017. [Google Scholar]
- Holman, J.P. Heat Transfer, 10th ed.; McGraw-Hill: New York, NY, USA, 2010. [Google Scholar]
- McAdams, W.H. Heat Transmission, 3rd ed.; McGraw-Hill: New York, NY, USA, 1954. [Google Scholar]
- Churchill, S.W.; Chu, H.H.S. Correlating equations for laminar and turbulent free convection from a horizontal cylinder. Int. J. Heat Mass Transf. 1975, 18, 1049–1053. [Google Scholar] [CrossRef]
- Modest, M.F. Radiative Heat Transfer, 3rd ed.; Academic Press: Cambridge, MA, USA, 2013. [Google Scholar]
- Zhu, T.; An, Q.S.; Liu, X.H.; Zhang, X.; Ren, Z.; Mei, F. Heat Transfer, 7th ed.; China Construction Industry Press: Beijing, China, 2018. [Google Scholar]
- Klein, S.A.; Beckman, W.A.; Mitchell, J.W.; Duffie, J.A.; Duffie, N.A.; Freeman, T.L.; Mitchell, J.C.; Braun, J.E.; Evans, B.L.; Kummer, J.P.; et al. TRNSYS 18: A Transient System Simulation Program; Solar Energy Laboratory, University of Wisconsin-Madison: Madison, WI, USA, 2017. [Google Scholar]
- ISO 13790:2008; Energy Performance of Buildings—Calculation of Energy Use for Space Heating And Cooling. ISO: Geneva, Switzerland, 2008.
- ISO 7730:2005; Ergonomics of the Thermal Environment—Analytical Determination and Interpretation of Thermal Comfort Using Calculation of the PMV and PPD Indices and Local Thermal Comfort Criteria. ISO: Geneva, Switzerland, 2005.
- Center for the Built Environment. CBE Thermal Comfort Tool; University of California: Berkeley, CA, USA, 2022; Available online: https://comfort.cbe.berkeley.edu/ (accessed on 15 March 2023).
- Kim, K.-H.; Jeon, S.-E.; Kim, J.-K.; Yang, S. An experimental study on thermal conductivity of concrete. Cem. Concr. Res. 2003, 33, 363–371. [Google Scholar] [CrossRef]
- Vasić, M.; Lalić, Ž.; Radojević, Z. Clay brick walls thermal properties. Int. J. Mod. Manuf. Technol. 2010, 2, 75–80. [Google Scholar]
- GreenSpec. Building Design Materials and Techniques; GreenSpec: Wrexham, UK, 2023; Available online: https://norseconsulting.co.uk/wp-content/uploads/2023/12/Guide-to-Building-Materials_v3.1.pdf (accessed on 10 March 2023).
- IESVE. Table 6 Thermal Conductivity, Specific Heat Capacity and Density. 2021. Available online: https://help.iesve.com/ve2021/table_6_thermal_conductivity__specific_heat_capacity_and_density.htm (accessed on 10 March 2023).
- Lemmon, E.W.; Jacobsen, R.T. Viscosity and thermal conductivity of dry air in the gaseous phase. J. Phys. Chem. Ref. Data 1985, 14, 947–969. [Google Scholar] [CrossRef]
- Detommaso, M.; Costanzo, V.; Nocera, F. Application of weather data morphing for calibration of urban ENVI-met microclimate models. Results and critical issues. Urban Clim. 2021, 38, 100895. [Google Scholar] [CrossRef]


| Parameter Category | Component | Experimental House | Qingning Palace |
|---|---|---|---|
| Building Geometry | Length (m) | 6 | 22 |
| Width (m) | 4 | 12.5 | |
| Height (m) | 3 | 4 | |
| Total Volume (m3) | 72 | 1100 | |
| Thermal Zones | Single zone | Multi-zone | |
| Wall Construction | Material | Concrete | Brick |
| Thickness (mm) | 240 | 500 | |
| Thermal Conductivity (W/m·K) | 1.561 | 0.869 | |
| Density (kg/m3) | 2400 | 1800 | |
| Specific Heat (J/kg·K) | 1000 | 900 | |
| Roof Construction | Material | Concrete | Tiles |
| Thickness (mm) | 240 | 100 | |
| Thermal Conductivity (W/m·K) | 1.561 | 3.704 | |
| Density (kg/m3) | 2400 | 2000 | |
| Specific Heat (J/kg·K) | 1000 | 800 | |
| Window Properties | Glass Thickness (mm) | 150 | 200 |
| U-value (W/m2·K) | 6.0 | 5.5 | |
| Solar Heat Gain Coefficient | 0.7 | 0.7 | |
| Kang Heat Source | Surface Area (m2) | 4.8 | 121 |
| Heat Input Profile | Experimental benchmark curve | Experimental benchmark curve | |
| Internal Gain Distribution | 100% convective | 100% convective | |
| Weather Data | Location | Huludao City, Liaoning Province | Huludao City, Liaoning Province |
| Coordinates | 40.7° N, 120.9° E | 40.7° N, 120.9° E | |
| Data Format | TMY3 hourly | TMY3 hourly | |
| Critical Design Day | 20 January 2023 (−18 °C) | 20 January 2023 (−18 °C) | |
| Simulation Control | Time Step (hours) | 0.25 | 0.25 |
| Simulation Period | 48 h (validation) | Annual (design analysis) | |
| Convergence Tolerance | 0.001 | 0.001 | |
| Integration Method | Modified Euler | Modified Euler |
| Location | Highest Temperature (°C) | Lowest Temperature (°C) | Average Temperature (°C) | Reference Figure |
|---|---|---|---|---|
| Heated Bed Surface | 53.1 | 18.1 | 34.2 | Figure 13 |
| Indoor Measurement Point 1 | 22.0 | 13.7 | 18.7 | |
| Indoor Measurement Point 2 | 21.9 | 10.1 | 15.6 | |
| Indoor Measurement Point 3 | 22.0 | 13.6 | 18.5 | |
| Indoor Measurement Point 4 | 28.9 | 15.4 | 21.2 |
| Material | Thermal Conductivity (W/m·K) | Density (kg/m3) | Specific Heat (J/kg·K) | Thickness (mm) | Reference |
|---|---|---|---|---|---|
| Experimental House | |||||
| Concrete (walls/roof) | 1.561 | 2400 | 1000 | 240 | Kim et al. (2003) [30] |
| Glass (windows) | 1.104 | 2500 | 750 | 150 | Incropera et al. (2017) [20] |
| Qingning Palace | |||||
| Brick (walls) | 0.869 | 1800 | 900 | 500 | Vasić et al. (2010) [31] |
| Tiles (roof) | 3.704 | 2000 | 800 | 100 | GreenSpec [32] |
| Glass (windows) | 1.104 | 2500 | 750 | 200 | Incropera et al. (2017) [20] |
| Wood (window frames) | 0.588 | 600 | 2400 | 200 | IESVE (2021) [33] |
| Air Properties (18 °C) | |||||
| Dry air | 0.0259 | 1.2 | 1005 | Lemmon & Jacobsen (1985) [34] |
| Metric | Value (°C) | Acceptable Range (Detommaso et al., 2021) [35] |
|---|---|---|
| MAE | 0.46 | 0.39–1.12 |
| RMSE | 0.53 | 0.53–1.46 |
Disclaimer/Publisher’s Note: The statements, opinions and data contained in all publications are solely those of the individual author(s) and contributor(s) and not of MDPI and/or the editor(s). MDPI and/or the editor(s) disclaim responsibility for any injury to people or property resulting from any ideas, methods, instructions or products referred to in the content. |
© 2025 by the authors. Licensee MDPI, Basel, Switzerland. This article is an open access article distributed under the terms and conditions of the Creative Commons Attribution (CC BY) license (https://creativecommons.org/licenses/by/4.0/).
Share and Cite
Li, N.; Zhao, Z.; Wang, D.; Zhang, Q.; Li, L. Optimizing Kang-to-Room Area Ratios for Thermal Comfort in Traditional Chinese Architecture: An Empirical and Simulation-Based Approach. Buildings 2025, 15, 2593. https://doi.org/10.3390/buildings15152593
Li N, Zhao Z, Wang D, Zhang Q, Li L. Optimizing Kang-to-Room Area Ratios for Thermal Comfort in Traditional Chinese Architecture: An Empirical and Simulation-Based Approach. Buildings. 2025; 15(15):2593. https://doi.org/10.3390/buildings15152593
Chicago/Turabian StyleLi, Ning, Zhihua Zhao, Dongxu Wang, Qian Zhang, and Lin Li. 2025. "Optimizing Kang-to-Room Area Ratios for Thermal Comfort in Traditional Chinese Architecture: An Empirical and Simulation-Based Approach" Buildings 15, no. 15: 2593. https://doi.org/10.3390/buildings15152593
APA StyleLi, N., Zhao, Z., Wang, D., Zhang, Q., & Li, L. (2025). Optimizing Kang-to-Room Area Ratios for Thermal Comfort in Traditional Chinese Architecture: An Empirical and Simulation-Based Approach. Buildings, 15(15), 2593. https://doi.org/10.3390/buildings15152593