Article

Behavior of Demountable and Replaceable Fabricated RC Beam with Bolted Connection Under Mid-Span Compression

1
Institute of High Performance Engineering Structure, Wuhan University of Science and Technology, Wuhan 430065, China
2
School of Civil Engineering, Wuhan University, Wuhan 430072, China
*
Authors to whom correspondence should be addressed.
Buildings 2025, 15(15), 2589; https://doi.org/10.3390/buildings15152589
Submission received: 22 June 2025 / Revised: 12 July 2025 / Accepted: 16 July 2025 / Published: 22 July 2025
(This article belongs to the Section Building Structures)

Abstract

In order to verify the rationality and feasibility of a demountable and replaceable fabricated RC beam with bolted connection under mid-span compression, one cast-in-place RC beam and four fabricated RC beams were designed and fabricated. Through the mid-span static loading test and analysis of five full-scale RC beams, the effects of high-strength bolt specifications and stiffeners were compared, and the behavior of the fabricated RC beams with bolted connections was analyzed. The test process was observed and the test results were analyzed. The failure mode, cracking load, yield load, ultimate load, stiffness change, deflection measured value, ductility, and other indicators of the specimens were compared and analyzed. It was shown that the failure mode of the fabricated RC beam was reinforcement failure, which met the three stress stages of the normal section bending of the reinforcement beam. The failure position occurred at 10~15 cm of the concrete outside the bolt connection, and the beam support and the core area of the bolt connection were not damaged. The fabricated RC beam has good mechanical performance and high bearing capacity. In addition, comparing the test value with the simulation value, it is found that they are in good agreement, indicating that ABAQUS software of 2024 can be well used for the simulation analysis of the behavior of fabricated RC beam structure.

1. Introduction

Prefabricated concrete structures, serving as the core vehicle for construction industrialization transformation, exhibit distinct advantages, including shortened construction periods, reduced labor costs, enhanced construction efficiency, improved on-site and surrounding environments, guaranteed green construction practices, and facilitated modular batch production [1,2]. The structural reliability of such systems is fundamentally constrained by the beam-to-beam bolted connection performance in prefabricated RC members [3]. Compared with traditional wet joint connections, bolted connection technology has emerged as a critical bottleneck restricting the development of high-performance prefabricated structures [4], despite its inherent benefits in construction convenience, quality controllability, and disassemblability/reusability.
Current practice in joint connection technologies predominantly involves two typical configurations—wet connections and dry connections [5]. Wet connection joints present operational challenges such as labor-intensive on-site formwork installation and economic inefficiency during construction [6]. In contrast, dry connection joints demonstrate significant advantages, including environmental friendliness, construction period reduction, simplified erection procedures, and mass production feasibility [7]. Consequently, dry connection joints warrant substantial research attention due to their technical superiority in sustainable structural systems [8]. Liu et al. [9] conducted experimental and numerical investigations on five prefabricated RC beams with beam-to-beam steel sleeve connections under static bending loads. Their findings demonstrated that the steel plate thickness in the sleeve assemblies significantly governs the flexural capacity of prefabricated components. Yang et al. [10] conducted experimental and numerical investigations on six prefabricated RC beams featuring beam-to-beam angle steel dry connections. Numerical simulations demonstrated an inverse correlation between bolt spacing and flexural capacity, with excessive spacing, inducing angle steel slippage and premature failure. Kulkarni et al. [11] implemented comparative experimental and numerical studies on cast-in-place RC beams versus two types of beam-to-beam dry-connected prefabricated RC beams. The prefabricated systems demonstrated optimized load-transfer mechanisms and serviceability performance, validating their structural efficacy. Ersoy et al. [12] developed an innovative welded rib-plate connection system, experimentally evaluating five prefabricated RC beams and two frames under static bending and low-cycle reversed loading. The significance of detachable and replaceable components in structural design, particularly those prone to extensive and repeated damage; research by Valente et al. [13,14] has involved experimental and numerical analyses of such detachable replaceable ductile components in steel beams. Their research quantified the system’s dual competency in flexural resistance and seismic energy dissipation, while emphasizing weld width verification as a critical quality control parameter for engineering applications. Yang et al. [10] pioneered a simplified ductile connection method for H-shaped steel-RC beam assemblies. Experimental testing of three specimens under static bending confirmed that prestressed longitudinal reinforcement significantly enhanced flexural capacity and ductility while maintaining crack-free interfacial zones. Strain measurements at H-beam flanges showed <5% deviation from theoretical predictions, validating the proposed analytical model. Lin et al. [15] pioneered a systematic investigation into the fatigue behavior of straight steel-concrete composite beams through cyclic loading tests. Hicks et al. found that prefabricated RC beams with full shear connections were only applicable when using the recommended rM values. For prefabricated RC beams featuring partial shear connections, the calculated rM values exceeded the recommended thresholds [16]. To ensure safety, Nie et al. proposed a conversion factor that reduces the partial coefficients in the design model [17]. As evidenced above, the connection methodologies for prefabricated RC beams remain a critical research focus, with standardized design guidelines having not yet been unified [18]. Current investigations into connected prefabricated RC beams predominantly employ two approaches—full-scale model testing and numerical simulations [19]. Experimental investigations have elucidated the failure processes and load-transfer mechanisms during beam degradation, while numerical simulations enable parametric analyses of mechanical performance. These systematic validation studies confirm the superior structural efficacy of steel sleeve bolted connections and their optimized geometric configurations.
This study makes significant contributions to understanding prefabricated RC beams with steel sleeve bolted connections under mid-span static loading. The research systematically investigates the influence mechanisms of high-strength bolt specifications and stiffening ribs on mechanical performance. Comprehensive parametric analysis of failure modes and load characteristics provides new insights into structural behavior. An advanced finite element model incorporating bolt and stiffener effects was developed and rigorously validated through experimental-numerical comparisons, demonstrating high predictive accuracy.

2. Experimental Procedure

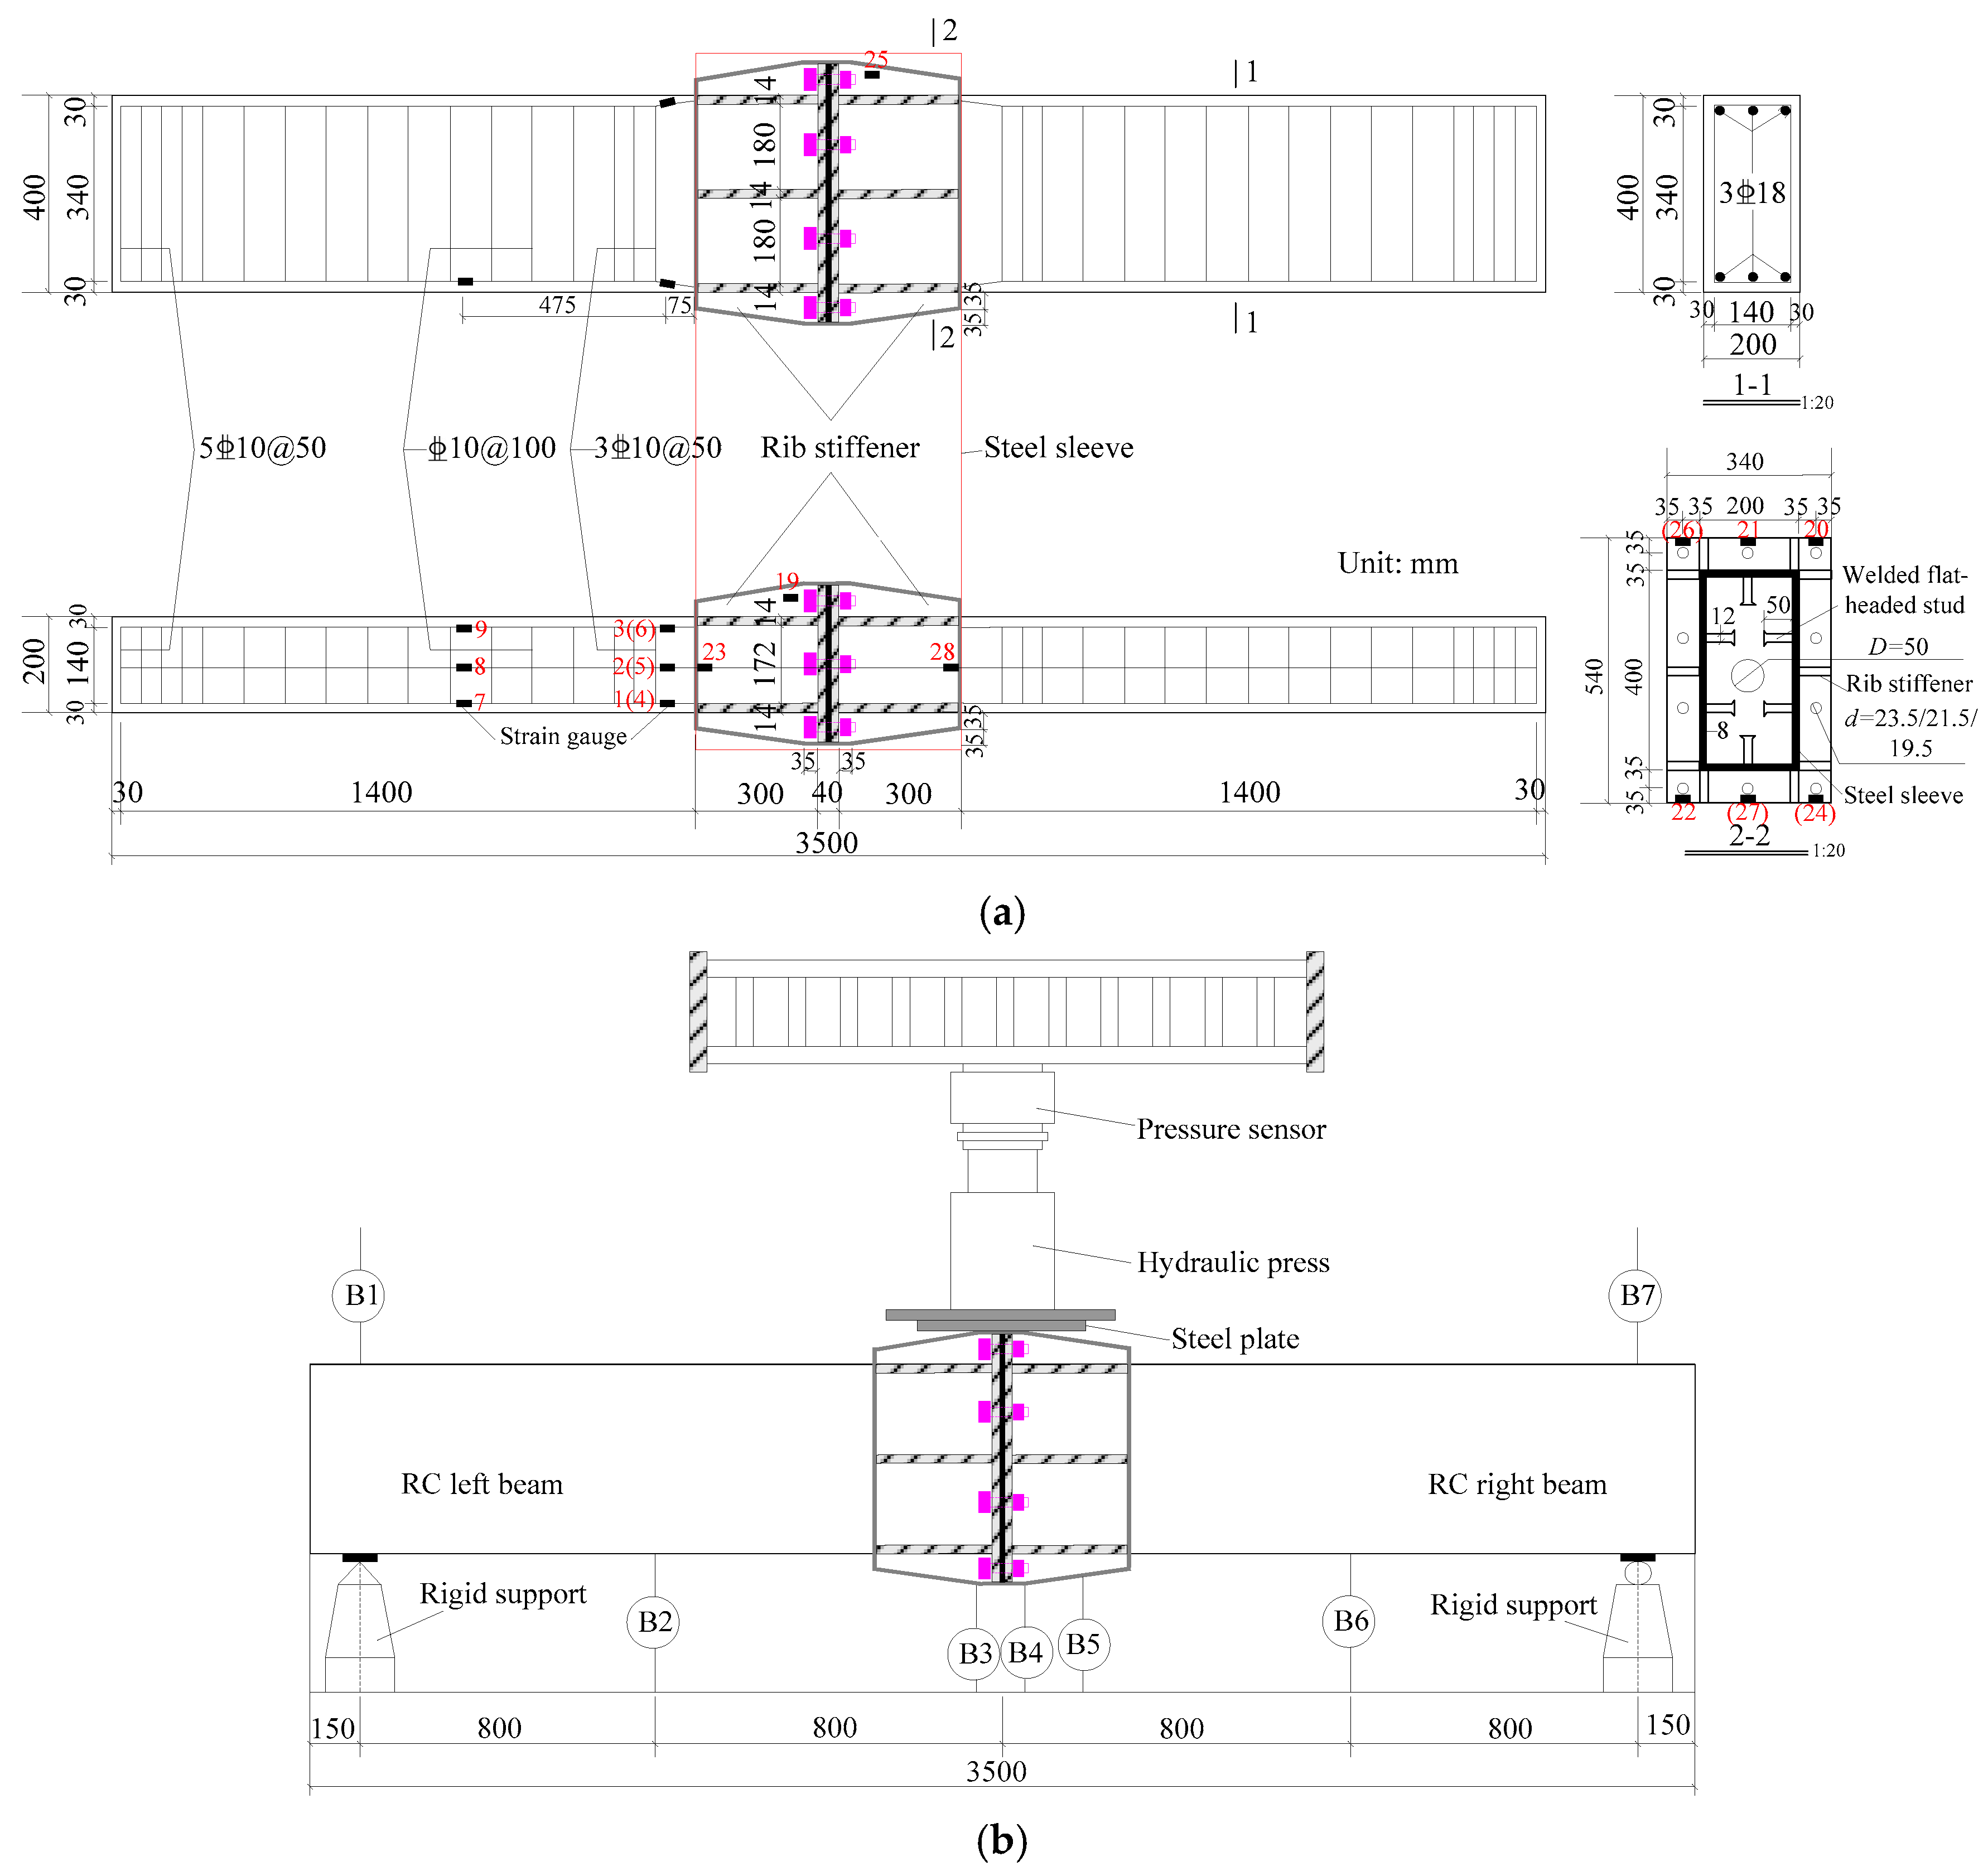
2.1. Specimen Designed

In prefabricated reinforced concrete (RC) frame structures, bolted connections represent a prevalent technique for assembling RC beams [20]. To investigate the mechanical performance of such connections, one cast-in-place RC beam (NH-1) and eight prefabricated RC beams were fabricated in compliance with standardized specifications. The eight prefabricated beams were assembled into four composite specimens (DH-1 to DH-4) using steel sleeves and Grade 10.9 bolts [21]. Specimens NH-1 and DH-1 to DH-3 incorporated stiffening ribs, while NH-1, DH-2, and DH-4 were equipped with M20 high-strength bolts. Specimens DH-1 and DH-3 utilized M22 and M18 high-strength bolts, respectively. The primary design parameters of all specimens are summarized in Table 1.
The C30 concrete, composed of cement, sand (0.25–0.5 mm), coarse aggregate (5–40 mm), and water with a mix ratio of 1:1.18:2.63:0.41 (by mass), exhibits a water-to-cement ratio (W/C) of 0.41 [20]. The water-reducing agent is of the polycarboxylic acid system, and the value of the amount of cementitious materials is 0.3%. The binder employs Type I ordinary Portland cement (P.O 42.5) supplied by Hubei Shiji Xinfeng Leishan Cement Co., Ltd., Ezhou, China. The fine aggregate comprises quartz sand with a fineness modulus of 2.8, while the coarse aggregate utilizes continuously graded crushed limestone. Standard cube specimens (150 mm × 150 mm × 150 mm) cured for 28 days under ISO 1920-3:2019 [22] protocols demonstrate a mean compressive strength of 30.3 MPa, consistent with the stress–strain curve depicted in Figure 1. The monotonic loading protocol applied displacement control at 0.5 mm/min until failure [21], with strain gauges monitoring axial and lateral deformations.
The prefabricated RC beam, with an overall length of 3500 mm and cross-sectional dimensions of 200 mm × 400 mm, features bolted connections between left and right RC beam segments through steel sleeves. A concrete cover thickness of 30 mm is maintained in accordance with the Code for Design of Concrete Structures (GB 50010-2010) [20]. The longitudinal and stirrup reinforcements employ HRB400-grade steel bars, while the connecting bolts utilize Q355-grade steel. Critical physical dimensions of steel components were detailed in Figure 2, which included connecting plates, bolts, stiffeners, studs, and steel sleeves.

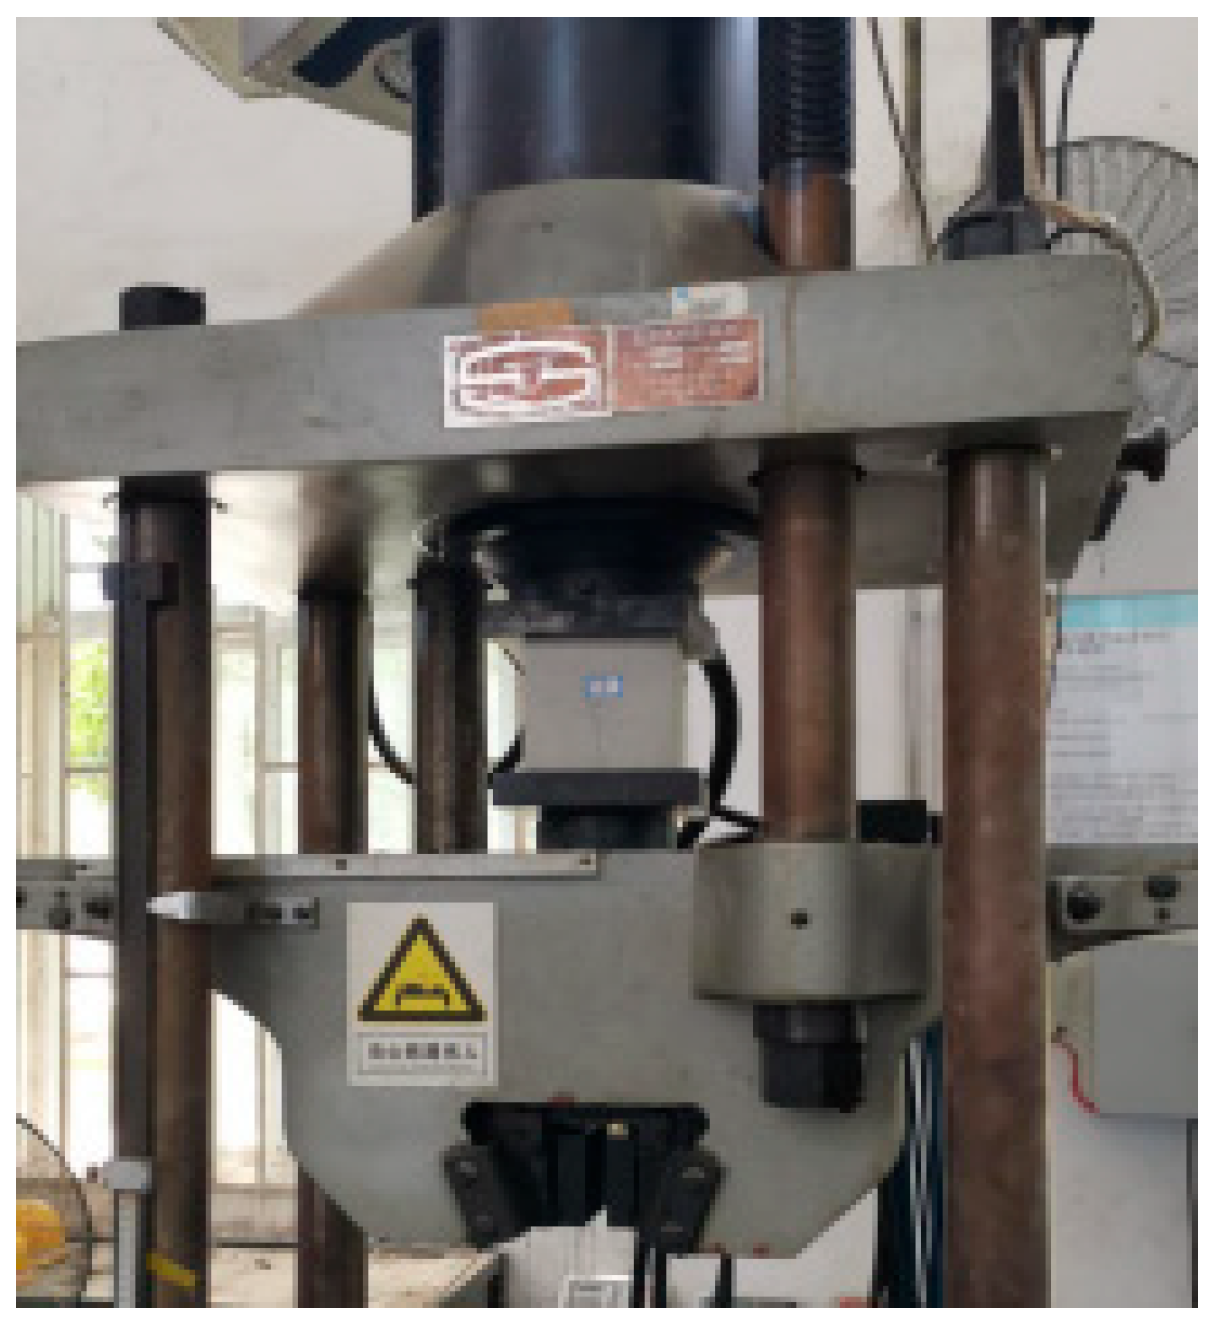
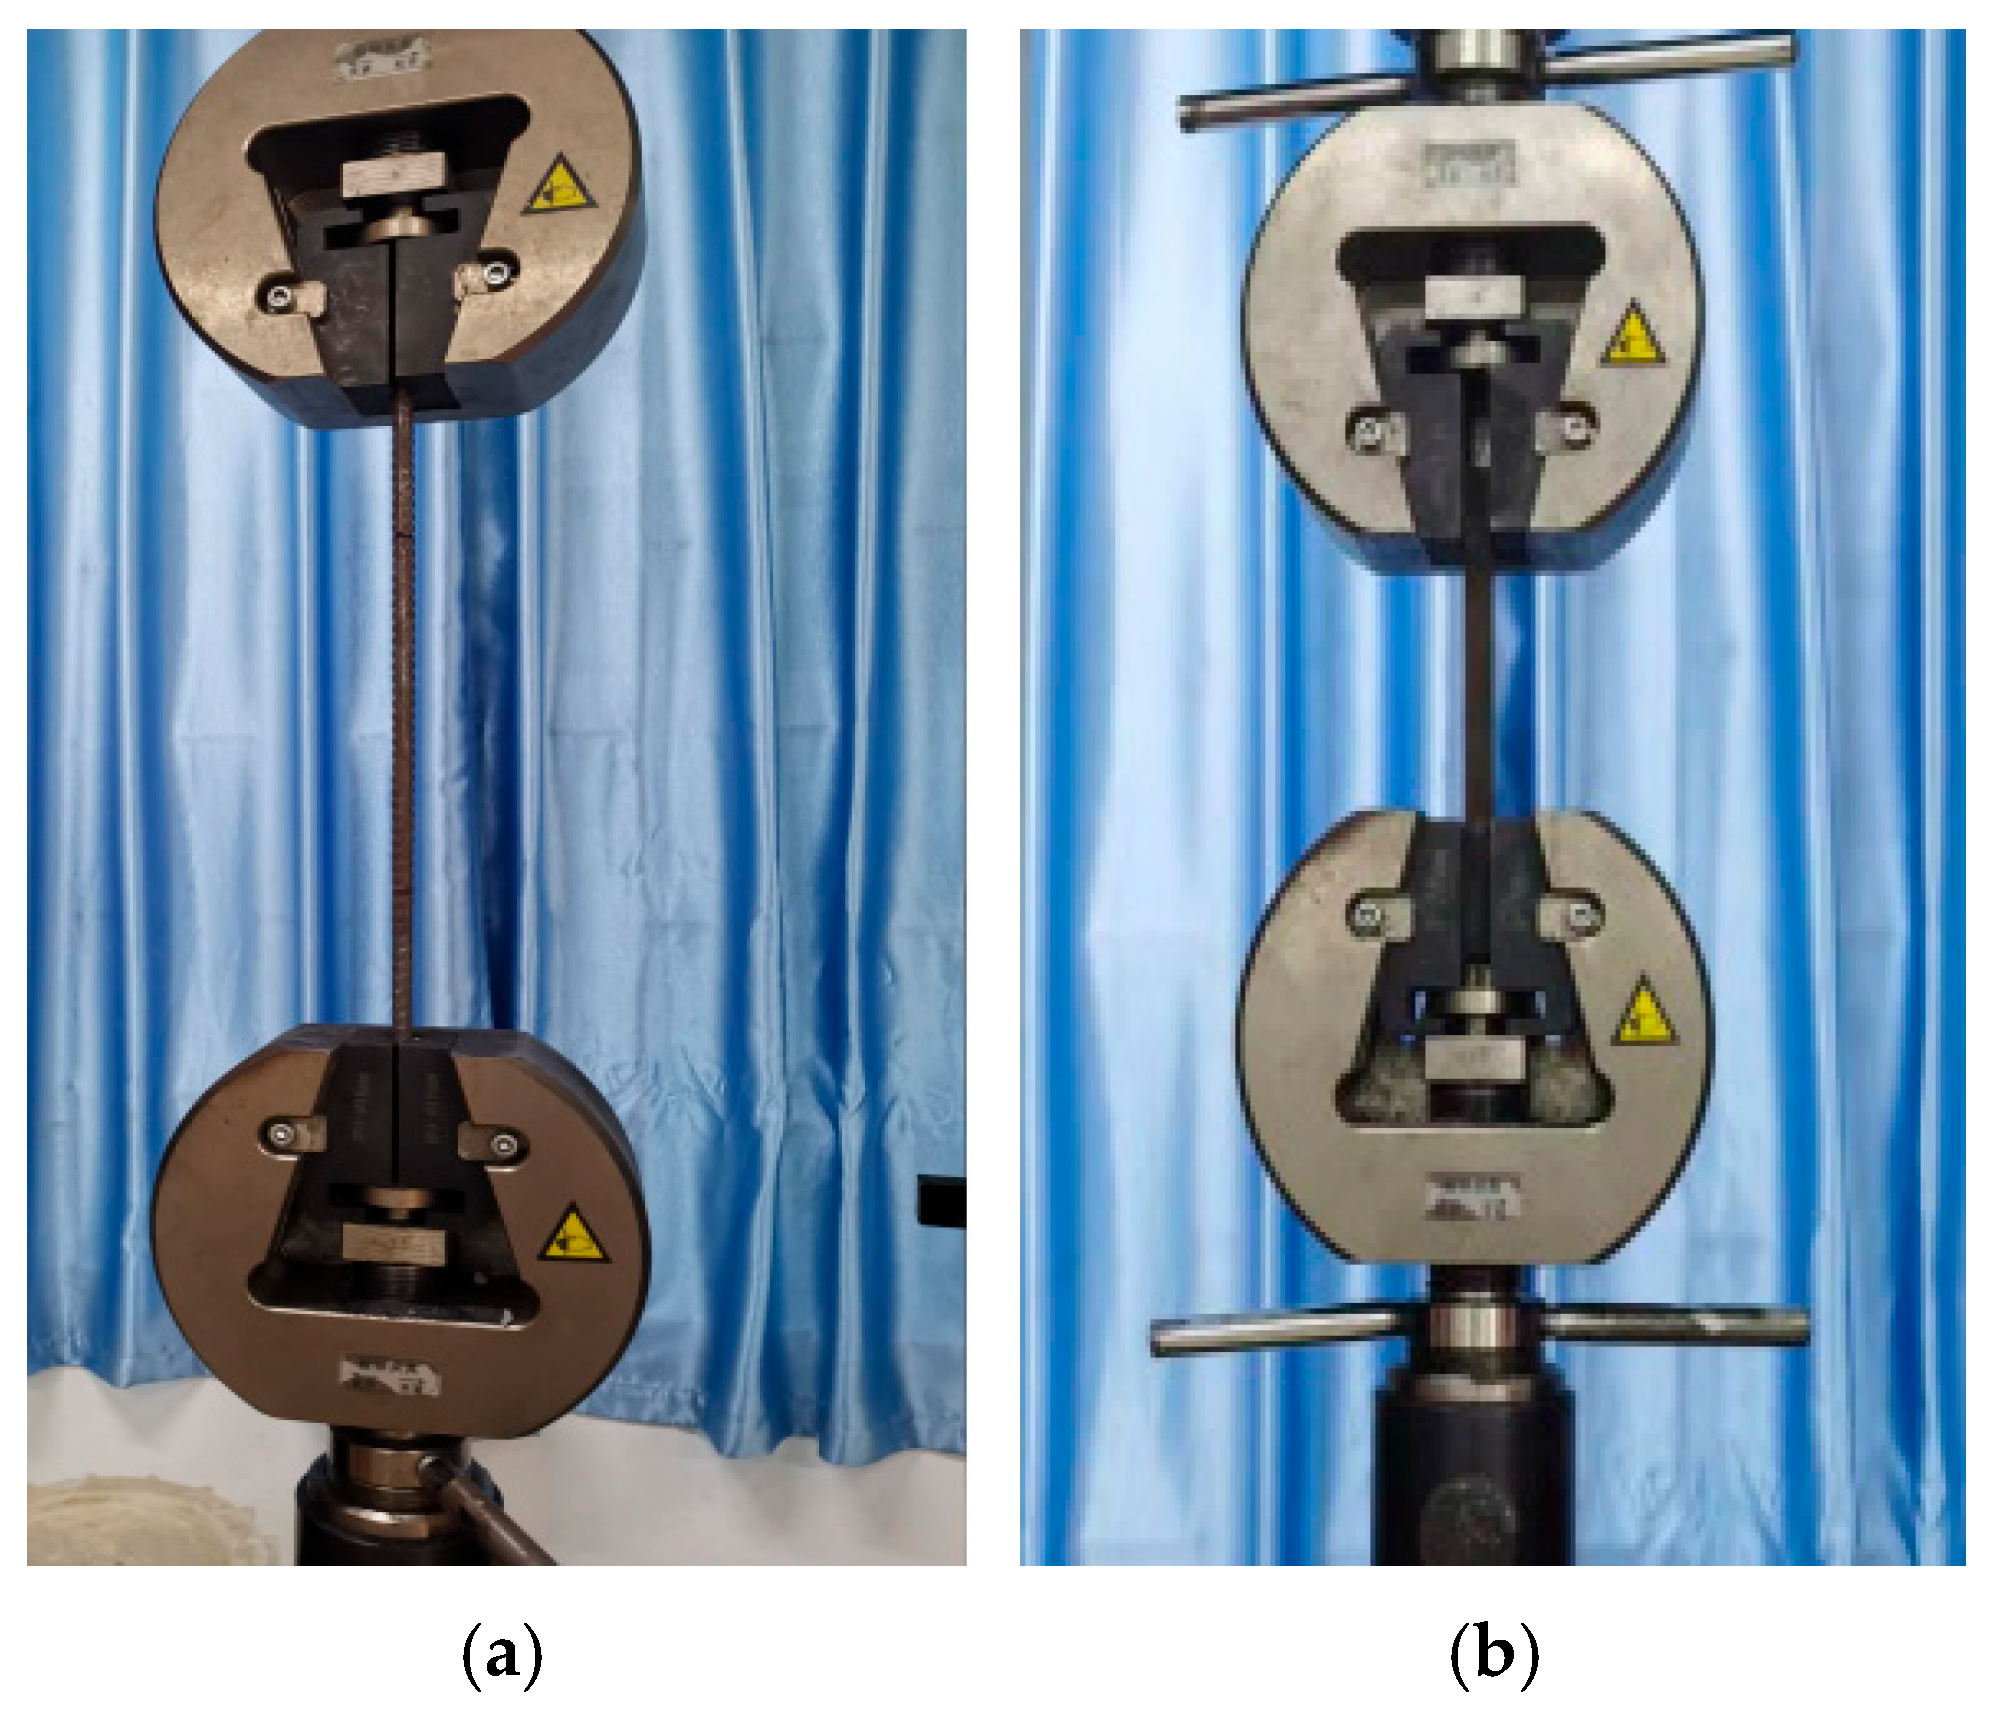
2.2. Material Property

The material mechanical property tests were conducted at the Civil Engineering Experimental Center of Wuhan University of Science and Technology. To measure the mechanical properties of steel reinforcement in prefabricated RC beams and steel materials at bolted connection joints, three sets of each specification were reserved during the concrete pouring and bolting processes [23]. The tensile tests for steel reinforcement and steel plates are illustrated in Figure 3. The mechanical properties of the materials measured in Figure 3 are listed in Table 2.

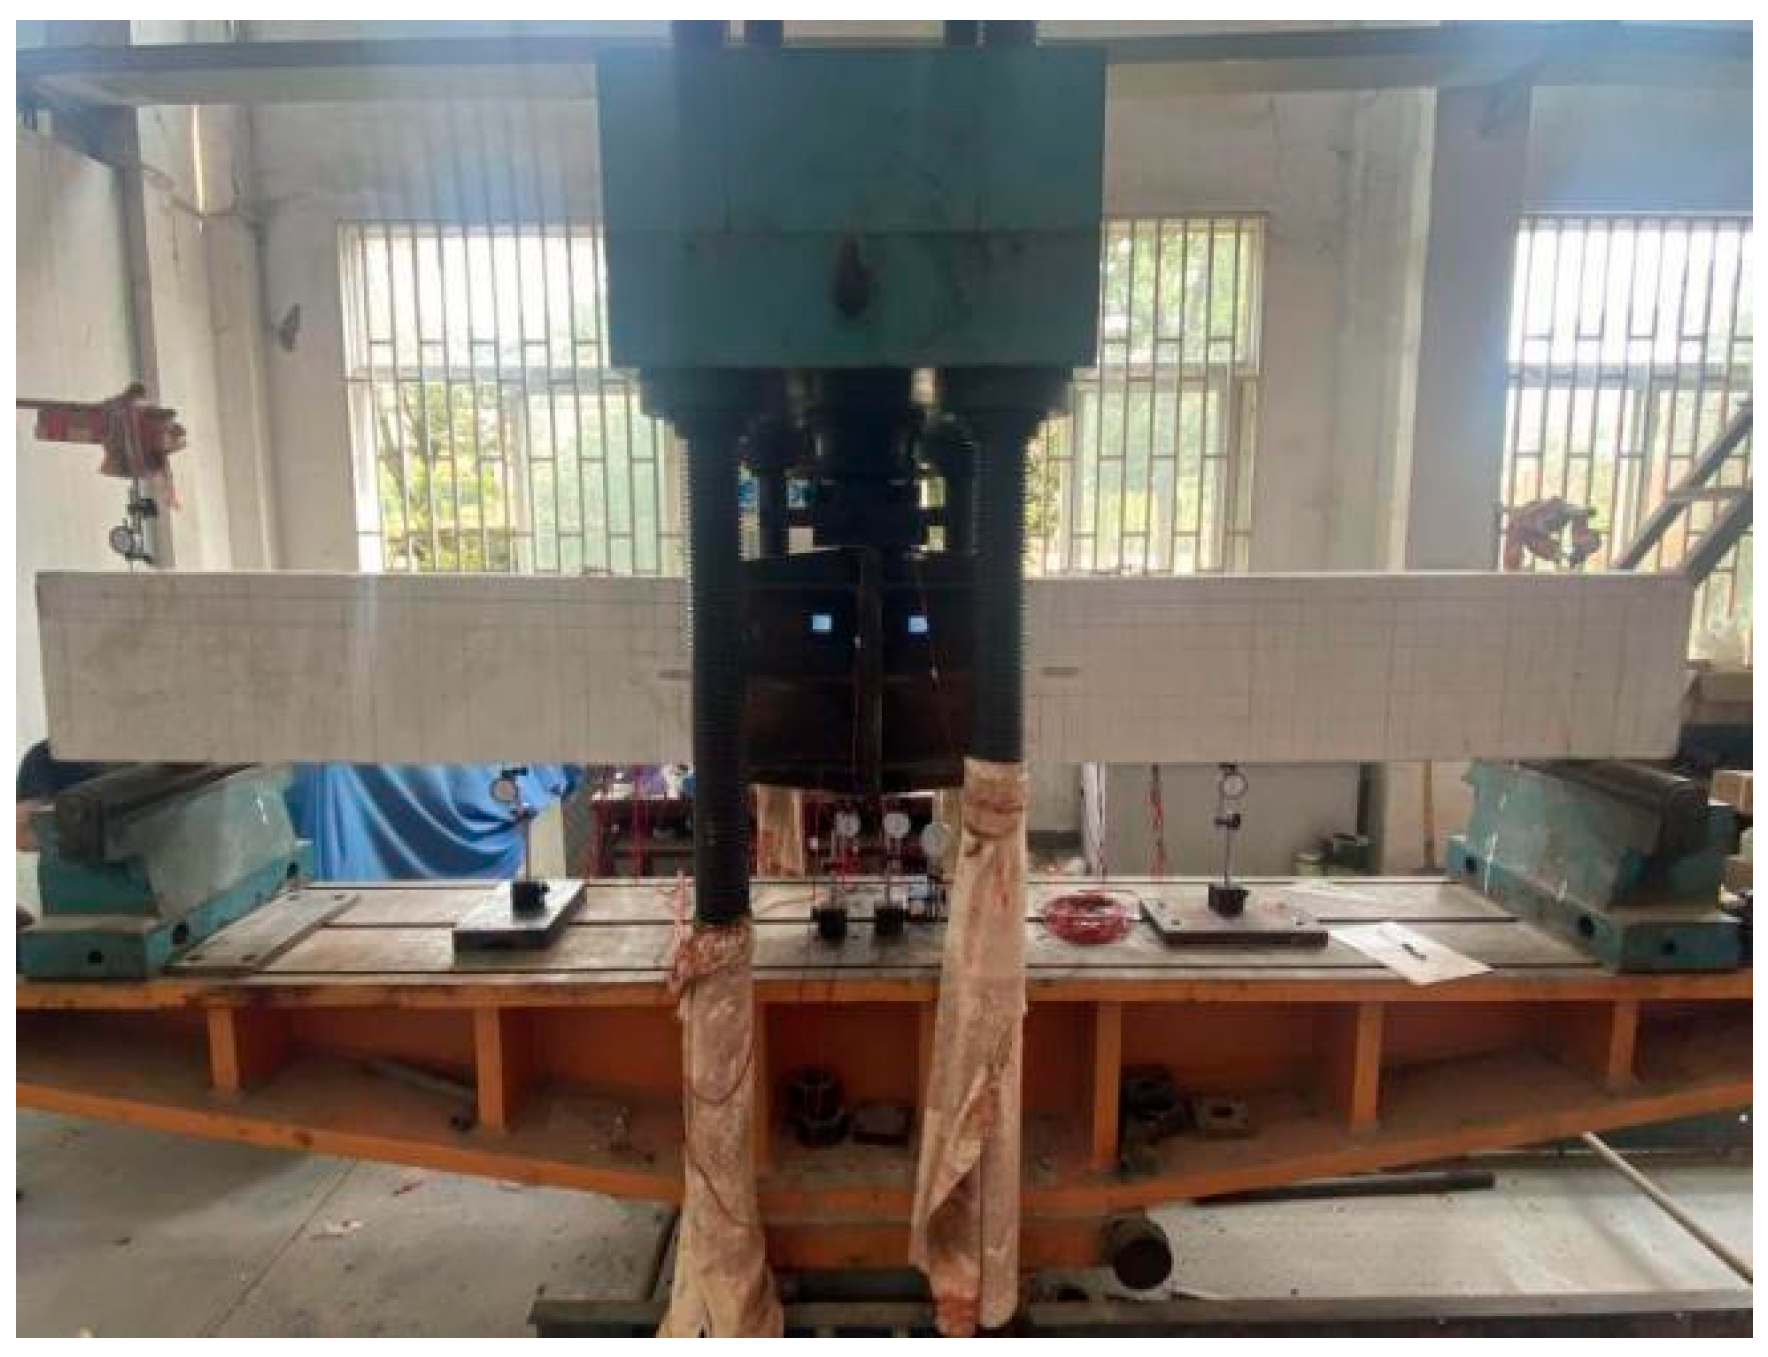
2.3. Test Loading Setup and Protocol

A monotonic loading regime was adopted, with concentrated loads applied at the steel sleeve locations [12]. The load was gradually increased until the test was terminated when either of the following criteria was met: (1) the load-bearing capacity dropped below 80% of the peak load or (2) the concrete at the compressive zone edge crushed, resulting in section failure. The prefabricated RC beam was configured as a simply supported member, with a fixed hinge support at one end and a roller hinge support at the other. A 150 mm unsupported span was reserved at each end of the beam. To prevent local crushing, steel plates were placed at the loading points, as illustrated in Figure 4.

3. Analysis of Test Results

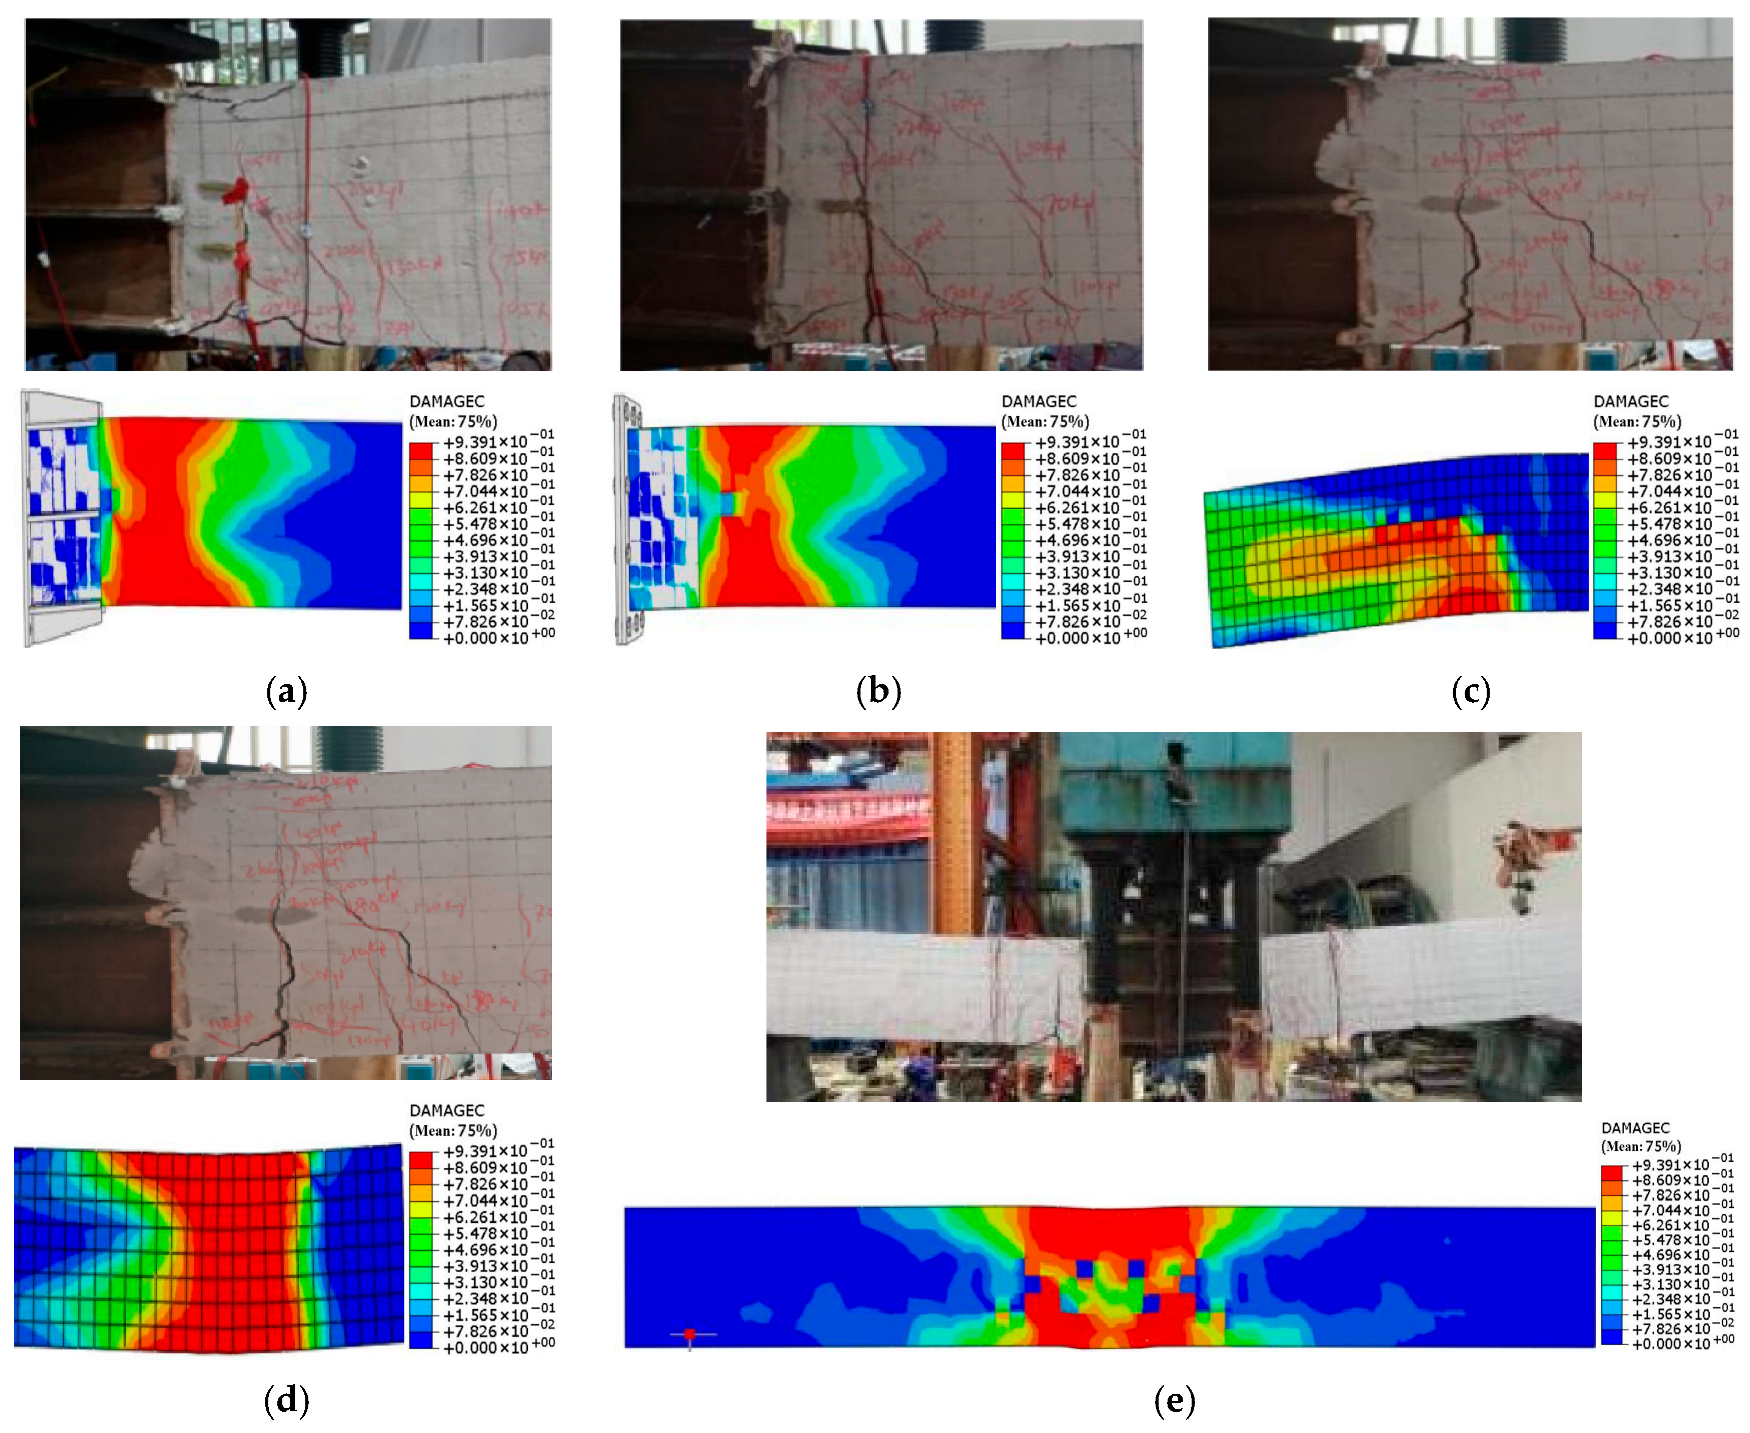
3.1. Failure Phenomena

(1) Specimen DH-1
During initial loading, the concrete surface remained crack-free, indicating elastic behavior. As loading progressed, the mid-span vertical displacement of the prefabricated RC beam increased linearly at a gradual rate, with stable strain variations observed in both reinforcement bars and steel sleeves. When the load reached 60 kN, vertical micro-cracks initially emerged at measuring point 3 along both edges of the bolted connection. Subsequent loading induced multiple fine vertical cracks on the concrete surface, with the first diagonal crack propagating between measuring points 3 and 2, accompanied by progressive widening and elongation of existing cracks. At 120 kN loading, pre-existing cracks coalesced into dominant fractures through upward propagation. The left-side diagonal crack of the bolted connection continued extending upward, while a horizontally oriented diagonal crack formed along the primary fracture path at measuring point 3 on the connection’s right side. Upon reaching 180 kN, yielding of longitudinal reinforcement occurred with a recorded strain of 2115 με. A downward-propagating diagonal crack emerged at measuring point 8, while another diagonal crack extended from measuring point 3 toward measuring point 4. The principal crack width attained 4 mm during this phase. When loaded to 210 kN, concrete spalling manifested in the compression zones adjacent to the bolted connection. A continuous primary crack penetrated the tensile zone, with the left side of the connection developing an additional diagonal crack along the main fracture path toward measuring point 3. Horizontal cracking appeared near measuring point 2 in the compression zone, and a vertical crack initiated on the connection’s right side. At 240 kN loading, compressive concrete crushing occurred bilaterally near the connection, concurrent with substantial vertical displacement escalation. The principal crack width expanded to 10 mm (1 cm). Further loading caused load reduction below 80% of the peak capacity, prompting test termination. The failure morphology of specimen DH-1 is illustrated in Figure 5a.
(2) Specimen DH-2
When the load reached 50 kN, vertically oriented micro-cracks spanning three grid units were initiated at measuring point 3 along both edges of the bolted connection. Upon loading to 90 kN, a diagonal crack formed on the connection’s right side, while the left-side crack propagated upward along the primary fracture path at measuring point 3. Concurrently, a vertical crack spanning three grid units developed upward from measuring point 6. At 170 kN loading, yielding of longitudinal reinforcement occurred with a measured strain of 2037 με. The left-side main crack extended toward measuring point 2, followed by the emergence of an upward-propagating diagonal crack. On the connection’s right side, diagonal cracks propagated from measuring point 2 to measuring point 6 within the compression zone. Existing cracks coalesced into dominant fractures, attaining a maximum width of 2.5 mm. When loaded to 200 kN, concrete spalling occurred in the compression zones adjacent to the connection. A continuous primary crack penetrated the tension zone, surrounded by networked cracking radiating outward. The principal crack width expanded to 6.5 mm during this phase. At 230 kN loading, compressive concrete crushing manifested bilaterally near the connection, accompanied by substantial vertical displacement escalation. The principal crack width reached 8 mm. Subsequent loading reduced the applied load below 80% of the peak capacity, prompting test termination. The failure morphology of specimen DH-2 is documented in Figure 5b.
(3) Specimen DH-3
When loaded to 40 kN, vertically oriented micro-cracks spanning three grid units simultaneously emerged at measuring point 3 along both edges of the bolted connection. Upon reaching 80 kN loading, a diagonal crack formed on the connection’s right side, while the left-side primary crack propagated upward along the existing fracture path at measuring point 3. At 160 kN loading, yielding of longitudinal reinforcement occurred with a measured strain of 2032 με. On the connection’s left side, an upward-propagating diagonal crack extended from the original fracture at measuring point 3 to measuring point 4. Concurrently, an ascending crack developed on the right side, with pre-existing cracks coalescing into dominant fractures attaining a maximum width of 2 mm. When loaded to 190 kN, concrete spalling manifested in the compression zones adjacent to the connection. A continuous primary crack penetrated the tension zone, surrounded by networked secondary cracks radiating outward. The principal crack width expanded to 4 mm during this phase. At 220 kN loading, compressive concrete crushing occurred bilaterally near the connection, accompanied by significant vertical displacement escalation. The principal crack width reached 7 mm before subsequent loading reduced the applied load below 80% of peak capacity, prompting test termination. The failure morphology of specimen DH-3 is documented in Figure 5c.
(4) Specimen DH-4
When the load reached 35 kN, the first micro-crack emerged at measuring point 3. Upon loading to 70 kN, visible diagonal cracks developed on both sides of the bolted connection, accompanied by widening and propagation of the initial micro-crack. At 154 kN loading, yielding of the longitudinal reinforcement occurred with a strain measurement of 2020 με. The initial micro-crack evolved into a dominant fracture reaching a width of 5.5 mm. When loaded to 205 kN, the principal crack width expanded to 8 mm. Subsequent loading caused the load to decline below 80% of the peak load, leading to test termination. The failure pattern of specimen DH-4 is illustrated in Figure 5d.
(5) Specimen NH-1
When the load reached 30 kN, micro-cracks initiated on the tension side of the RC beam. Upon loading to 60 kN, visible diagonal cracks developed on the tension side, accompanied by concrete crushing in the compression zone. At 125 kN loading, longitudinal reinforcement yielding occurred with a strain measurement of 2165 με, while the principal crack attained a width of 3.5 mm. When loaded to 187 kN, the principal crack expanded to 9 mm in width. Subsequent loading caused the load to decline below 80% of the peak load capacity, prompting test termination. The failure pattern of specimen NH-1 is illustrated in Figure 5e.

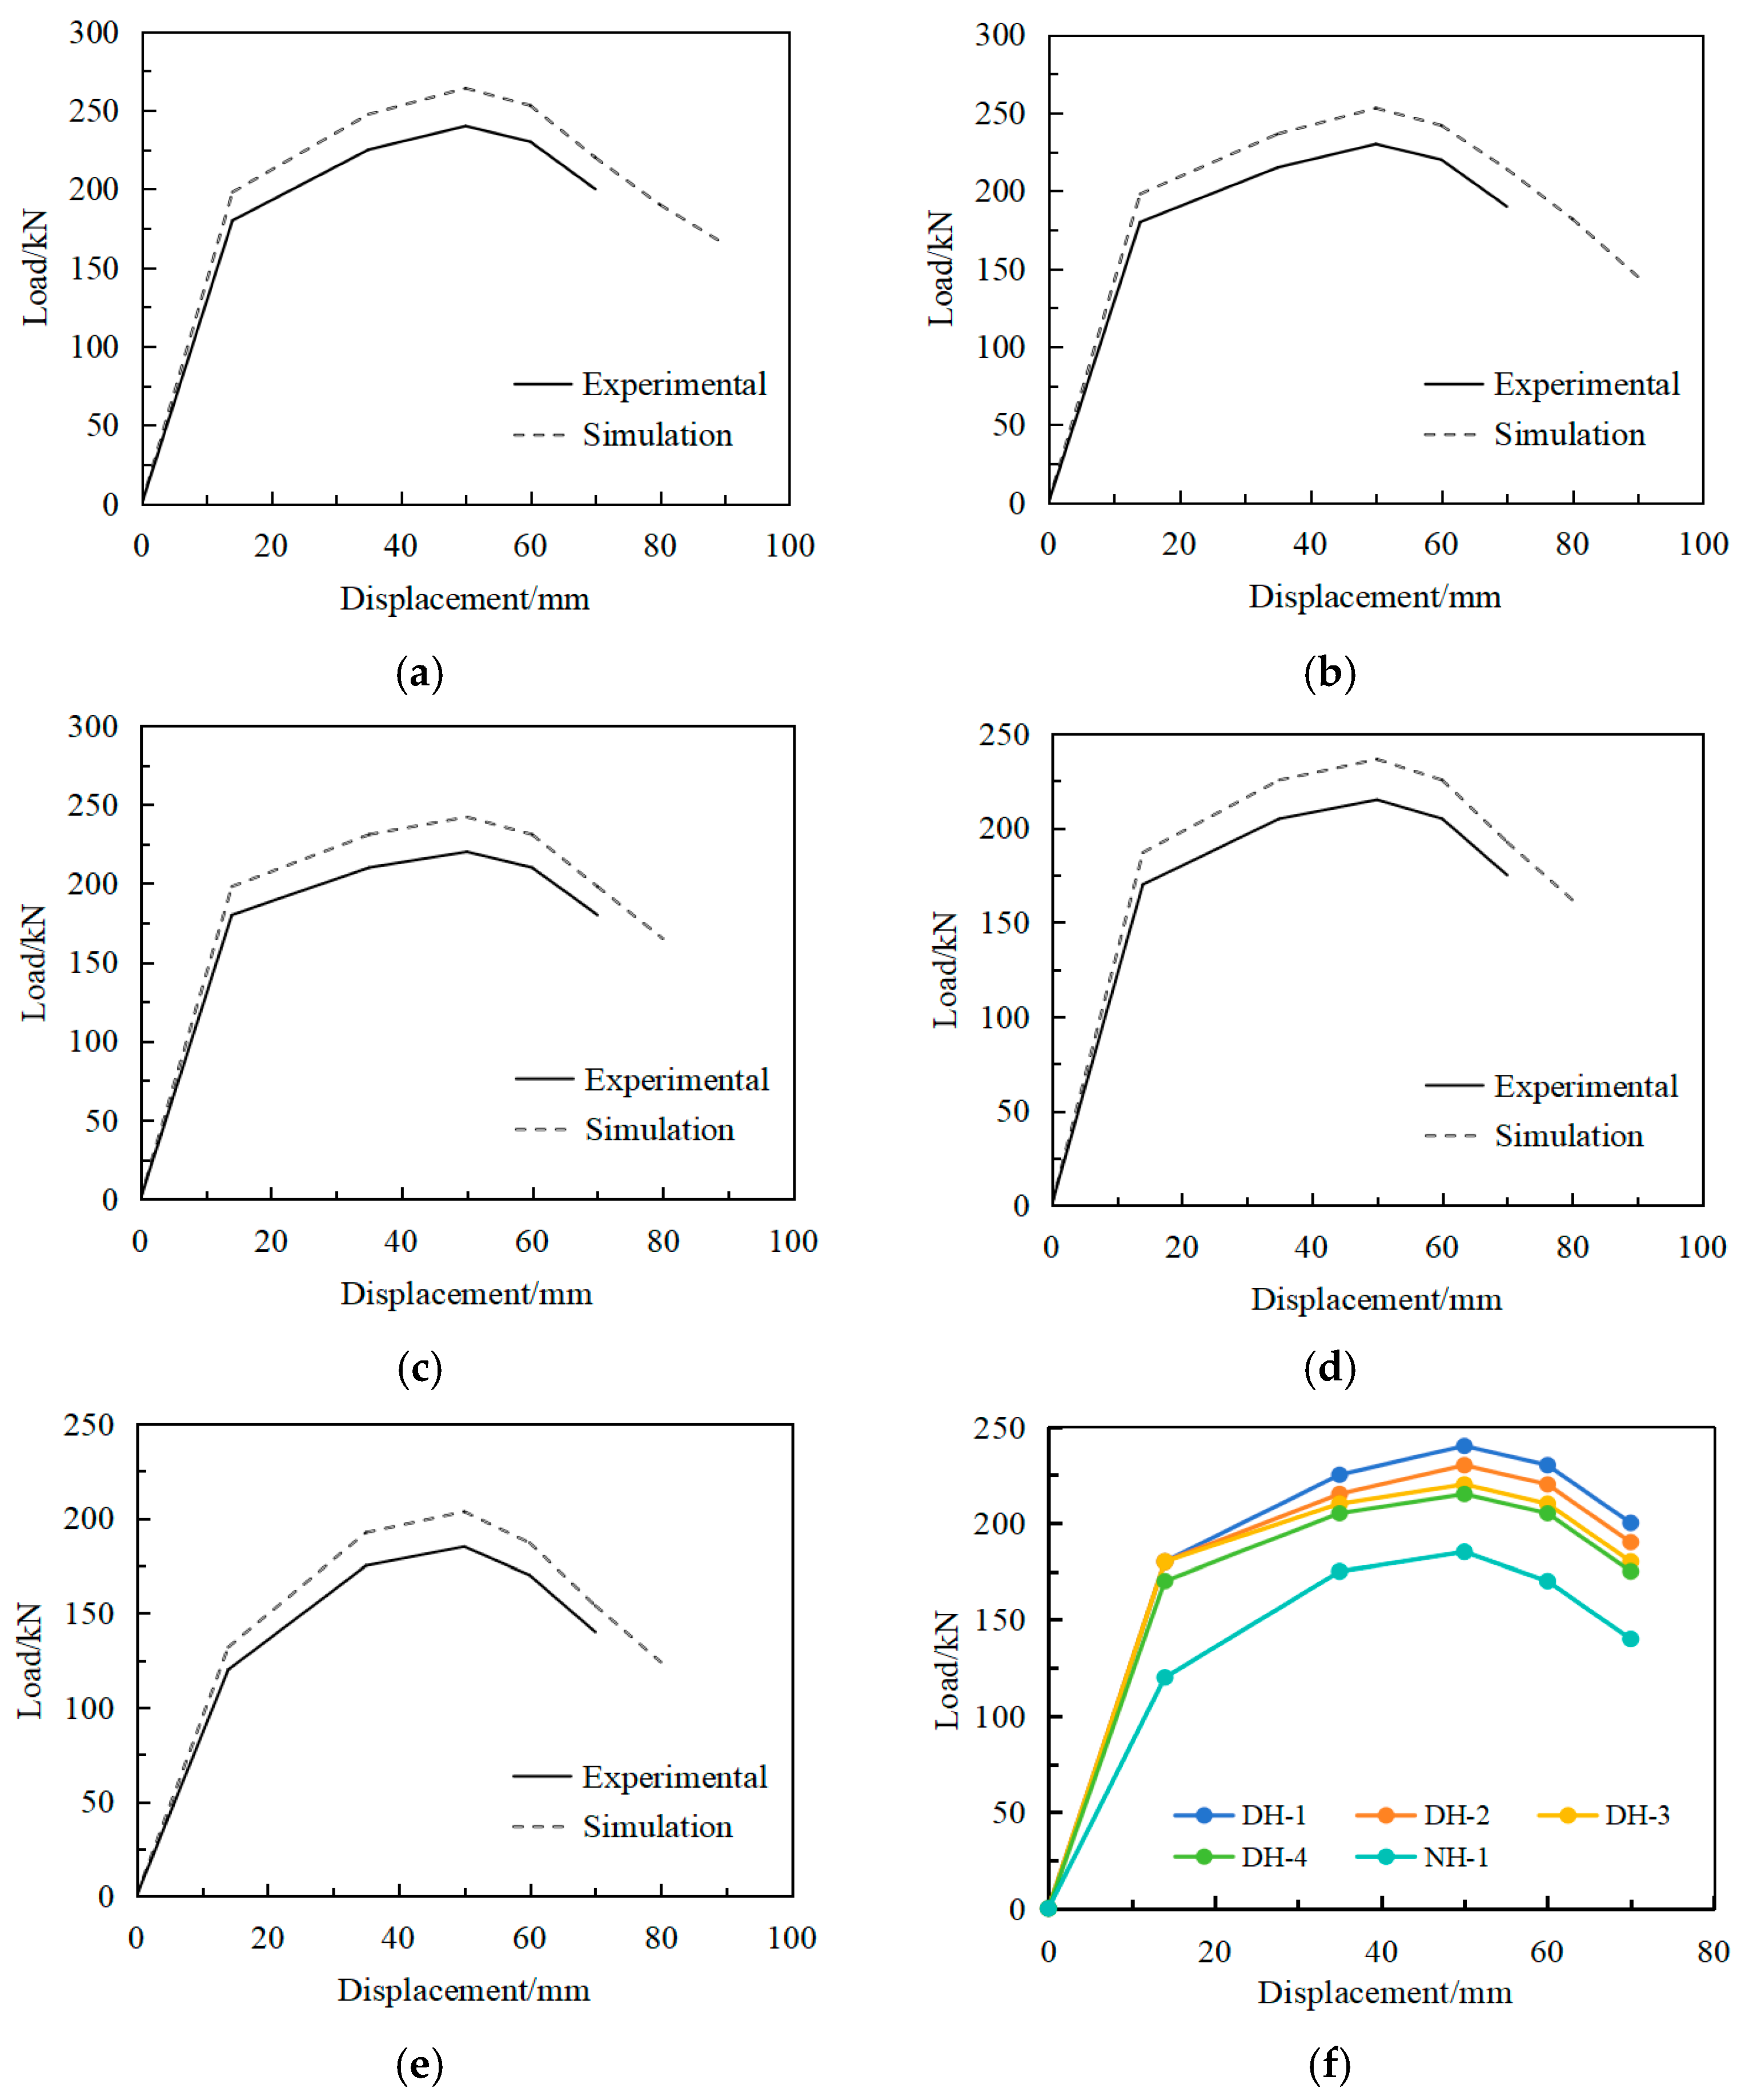
3.2. Experimental and Simulated of Load–Displacement Curves

The displacement was determined by averaging the measured values from dial gauges B3 and B4 at the bolted connection, with the corresponding load–displacement curve plotted in Figure 6. As illustrated in Figure 6, the monotonic loading process exhibited three distinct phases: elastic stage, elastoplastic stage, and failure stage. During the elastic stage, the load–displacement curve prior to cracking exhibited a linear relationship. When the concrete in the lower portion of the specimen reached its tensile strength limit, initial surface cracks emerged in the tensile zone, with the corresponding load defined as the cracking load. In the elastoplastic stage, multiple vertical microcracks developed on the concrete surface of the tensile zone after reaching the cracking load. Specimen stiffness progressively declined, accompanied by a transition from linear to nonlinear characteristics in the load–displacement curve. This phase concluded when the steel reinforcement strain attained its yield strain, with the second inflection point on the curve corresponding to the yield load. At the failure stage, yielding of tensile reinforcement triggered rapid mid-span displacement growth and accelerated crack propagation. The specimen ultimately failed due to concrete crushing in the compressive zone, accompanied by a sharp decline in load-bearing capacity. A pronounced inflection point in the load–displacement curve marked the peak load capacity, corresponding to the maximum point of the curve. During this phase, the specimen exhibited significantly accelerated stiffness degradation.

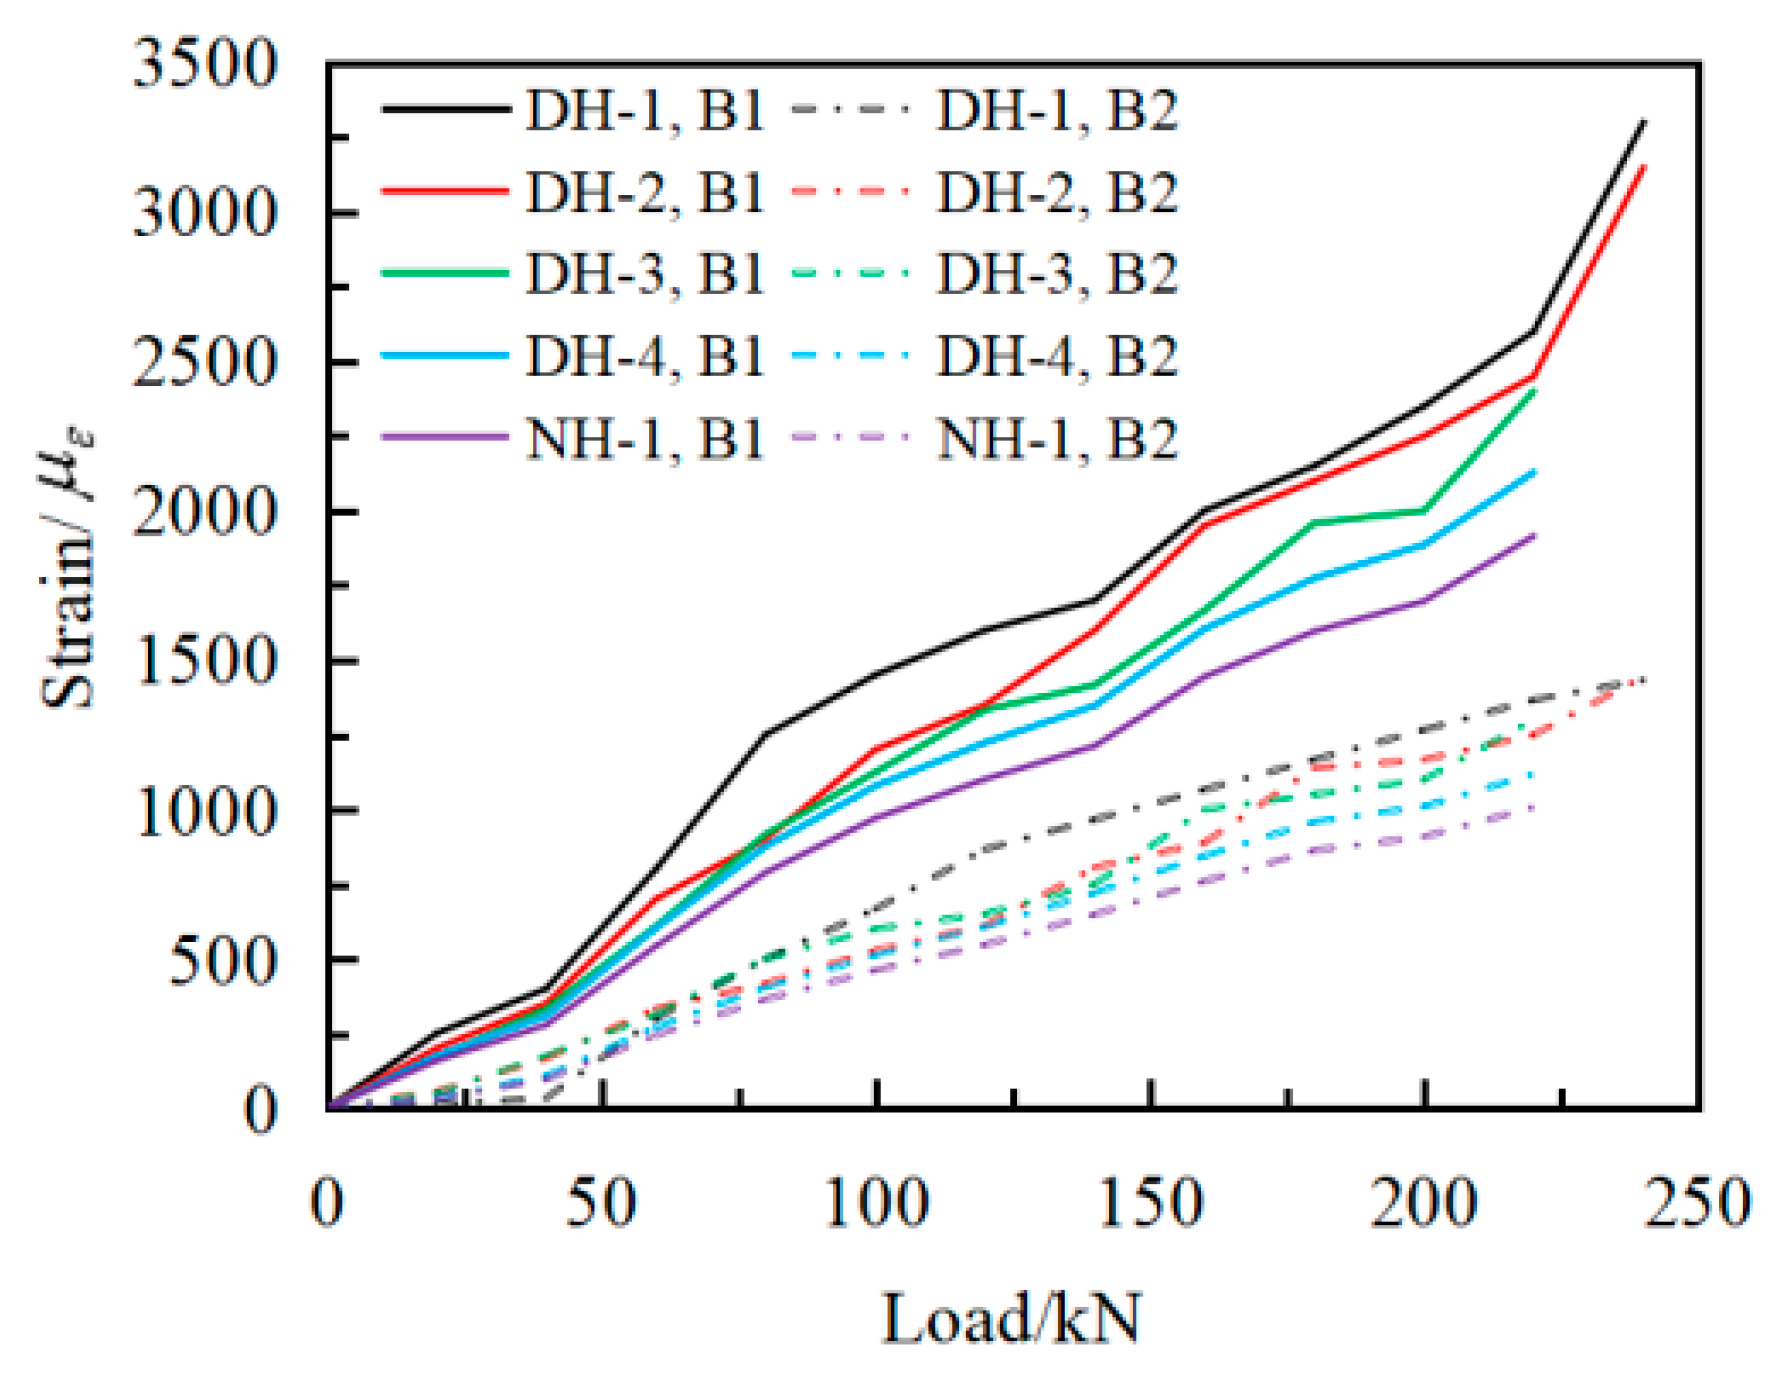
3.3. Load–Strain Analysis of Steel Reinforcement and Connecting Plate

The load–strain relationships of the steel reinforcement and connecting plate were measured using strain gauges B1 and B2, respectively, as shown in Figure 7. Prior to cracking, both the longitudinal tensile reinforcement at the specimen bottom and the connecting plate at the bolted joint exhibited linear strain–load responses with increasing load. Following crack initiation, the strain growth rate of the longitudinal tensile reinforcement accelerated, demonstrating a nonlinear correlation with the applied load. In contrast, the connecting plate exhibited a nonlinear but relatively gradual strain increase under loading. Upon further loading, the longitudinal tensile reinforcement yielded, characterized by a plateau in load with rapid strain accumulation. Meanwhile, the connecting plate maintained a nonlinear strain–load relationship with enhanced strain rates yet remained in the elastic stage without yielding. Notably, the load–strain behavior of the longitudinal tensile reinforcement aligned with that of specimen NH-1. The connecting plate displayed minimal strain throughout loading, confirming its elastic performance. These observations validate the efficient load transfer mechanism of the prefabricated RC beam’s bolted connection joints.

4. Numerical Simulation Analysis

4.1. Element Type Selection

The concrete, end plates, stiffeners, steel sleeves, bolts, and rivets of the precast RC beam were modeled using C3D8R solid elements, while the reinforcing steel bars were modeled with T3D2 truss elements [24,25]. C3D8R entity elements did not appear to be causing any errors [25].

4.2. Constitutive Models
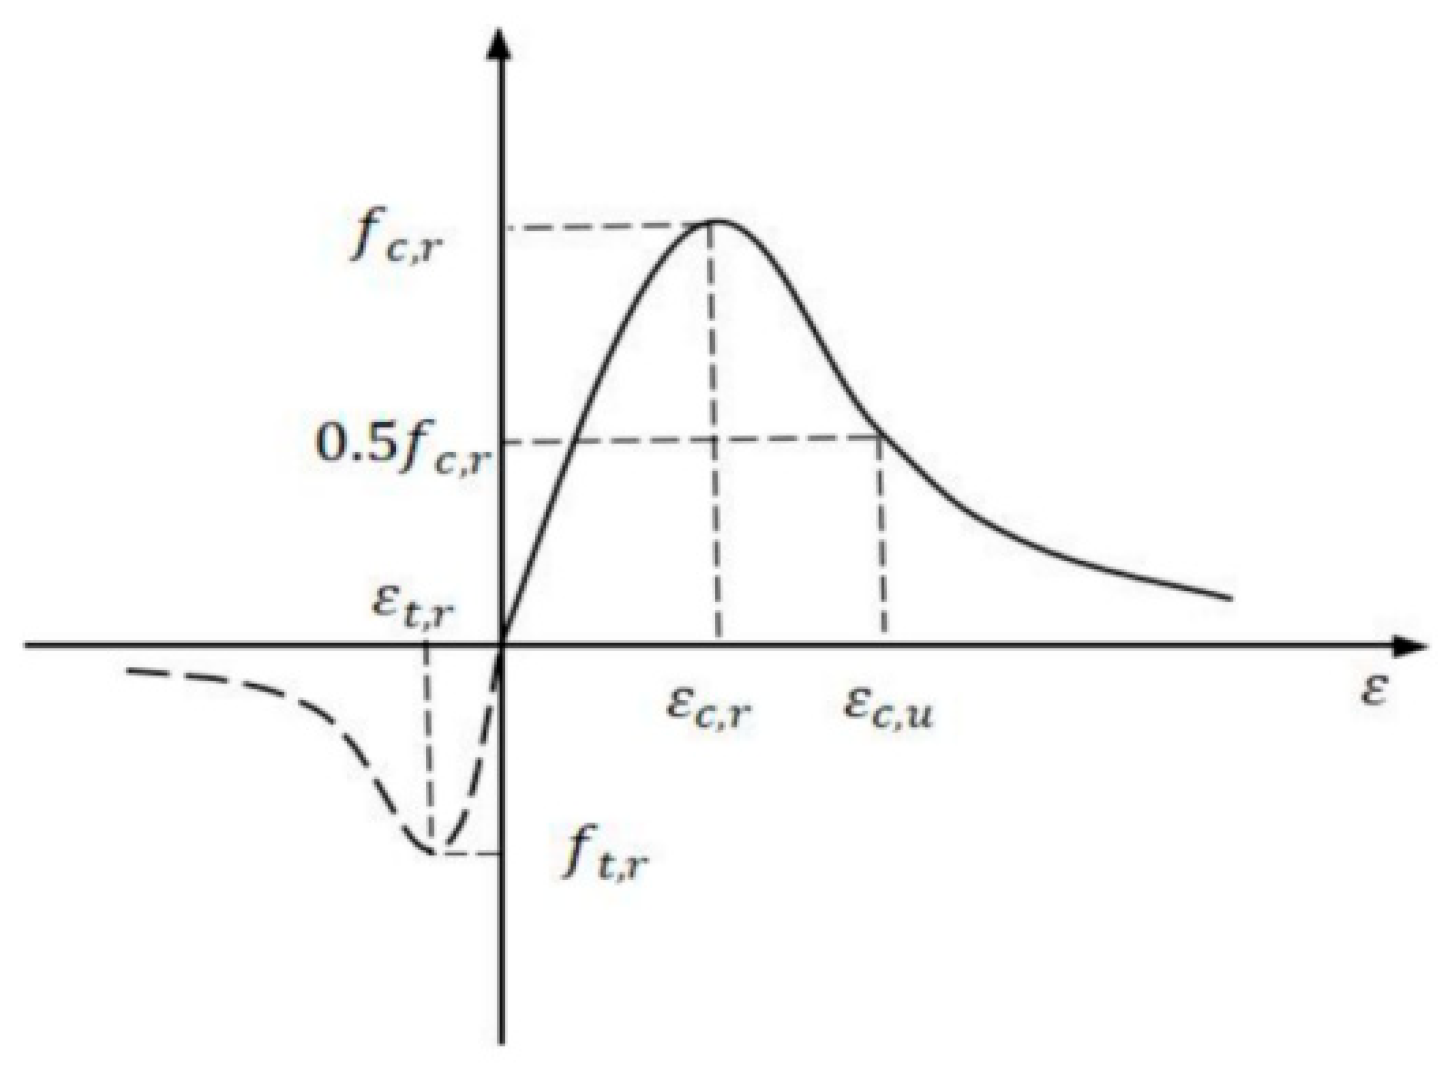
4.2.1. Concrete

The uniaxial stress–strain relationship for concrete, as specified in the Code for Design of Concrete Structures (GB50010-2010) [20], is illustrated in Figure 8. This constitutive model defines the nonlinear behavior of concrete under compression and tension, critical for simulating cracking, crushing, and ductility degradation in precast RC structures.
Based on Figure 8, the uniaxial stress–strain curve of concrete is divided into tension (first quadrant) and compression (fourth quadrant). Consequently, the expression for the uniaxial tensile stress–strain relationship of concrete is given by Equation (1).
σ = ε f t , r 1.2 0.2 ε / ε t . r 5 ε t . r , ε / ε t . r 1 ε f t , r ε t . r a t ε / ε t . r 1 1.7 ε / ε t . r , ε / ε t . r > 1
where at is the parameter governing the descending branch of the concrete uniaxial tensile stress–strain curve, calculated by Equation (2). ε represents the peak tensile strain of concrete, determined by Equation (3).
a t = 0.312 f t , r 2
ε t , r = f t , r 0.54 × 65 × 10 6
where ft,r is the characteristic value of the concrete uniaxial tensile strength.
The uniaxial compressive stress–strain curve of concrete is given by Equation (4).
σ = ε n f c , r ε c , r n 1 ε / ε c , r n , ε / ε t . r 1 ε f c , r ε c , r a c ε / ε c , r 1 2 + ε / ε c , r , ε / ε t . r > 1
where ac is the parameter governing the descending branch of the concrete uniaxial compressive stress–strain curve, calculated by Equation (5). εc,r represents the peak tensile strain of concrete, determined by Equations (6) and (7).
a c = 0.157 f c 0.785 0.905
ε c , r = 700 + 172 f c , r × 10 6
ε c u ε c , r = 1 2 a c 1 + 2 a c + 1 + 4 a c
When using the elastoplastic damage model, the following five parameters must be determined first: dilation angle, eccentricity, biaxial-to-uniaxial initial yield strength ratio fb0/fc0, ratio of the second stress invariant on the tensile-compressive meridian plane Kc, and viscosity coefficient, with respective values of 30°, 0.1, 1.16, 0.6667, and 0.005.

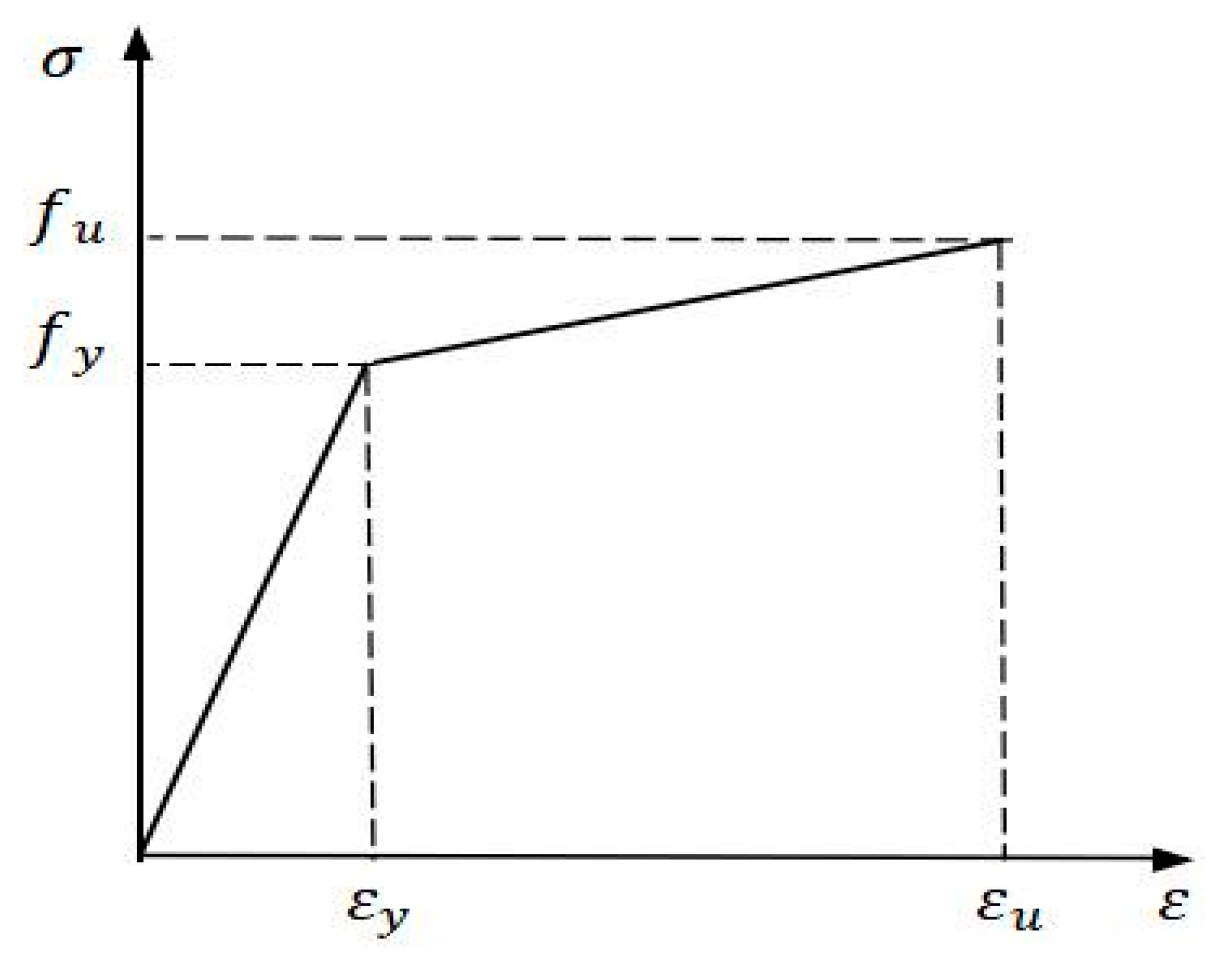
4.2.2. Reinforcement Steel and Bolts

The constitutive model for reinforcement steel and bolts adopts a bilinear model [20], which consists of two stages—the elastic stage and the strain-hardening stage, as shown in Figure 9.
As illustrated in Figure 9, the stress–strain curves for reinforcement steel and bolts are calculated using Equation (8).
σ s = E s ε s , ε s ε y f y + E s h ε s ε y , ε s > ε y
where Es is the initial elastic modulus of steel reinforcement; Esh is the hardening modulus of steel reinforcement, typically taken as 0.01 Es [26]; εy is the tensile yield strain of steel reinforcement; εs is the steel strain; fy is the tensile yield strength of steel reinforcement; and σs is the stress in the steel.

4.3. Contact Settings

The interactions between components in the finite element model of bolted connections for precast RC beams primarily included the following: surface-to-surface contact was defined between concrete and endplates; surface-to-surface contact was established between endplates and bolts; surface-to-surface interaction was employed between adjacent endplates; embedded constraints were assigned between concrete and steel reinforcement; tie constraints were implemented between reinforcement and steel sleeves; rigid connections were created between stiffeners and endplates; tie constraints were specified between steel sleeves and endplates; bonded interaction was configured between steel sleeves and stiffeners; embedded constraints were applied between steel sleeves and concrete [25]. The loading and boundary points were coupled using coupling constraints.

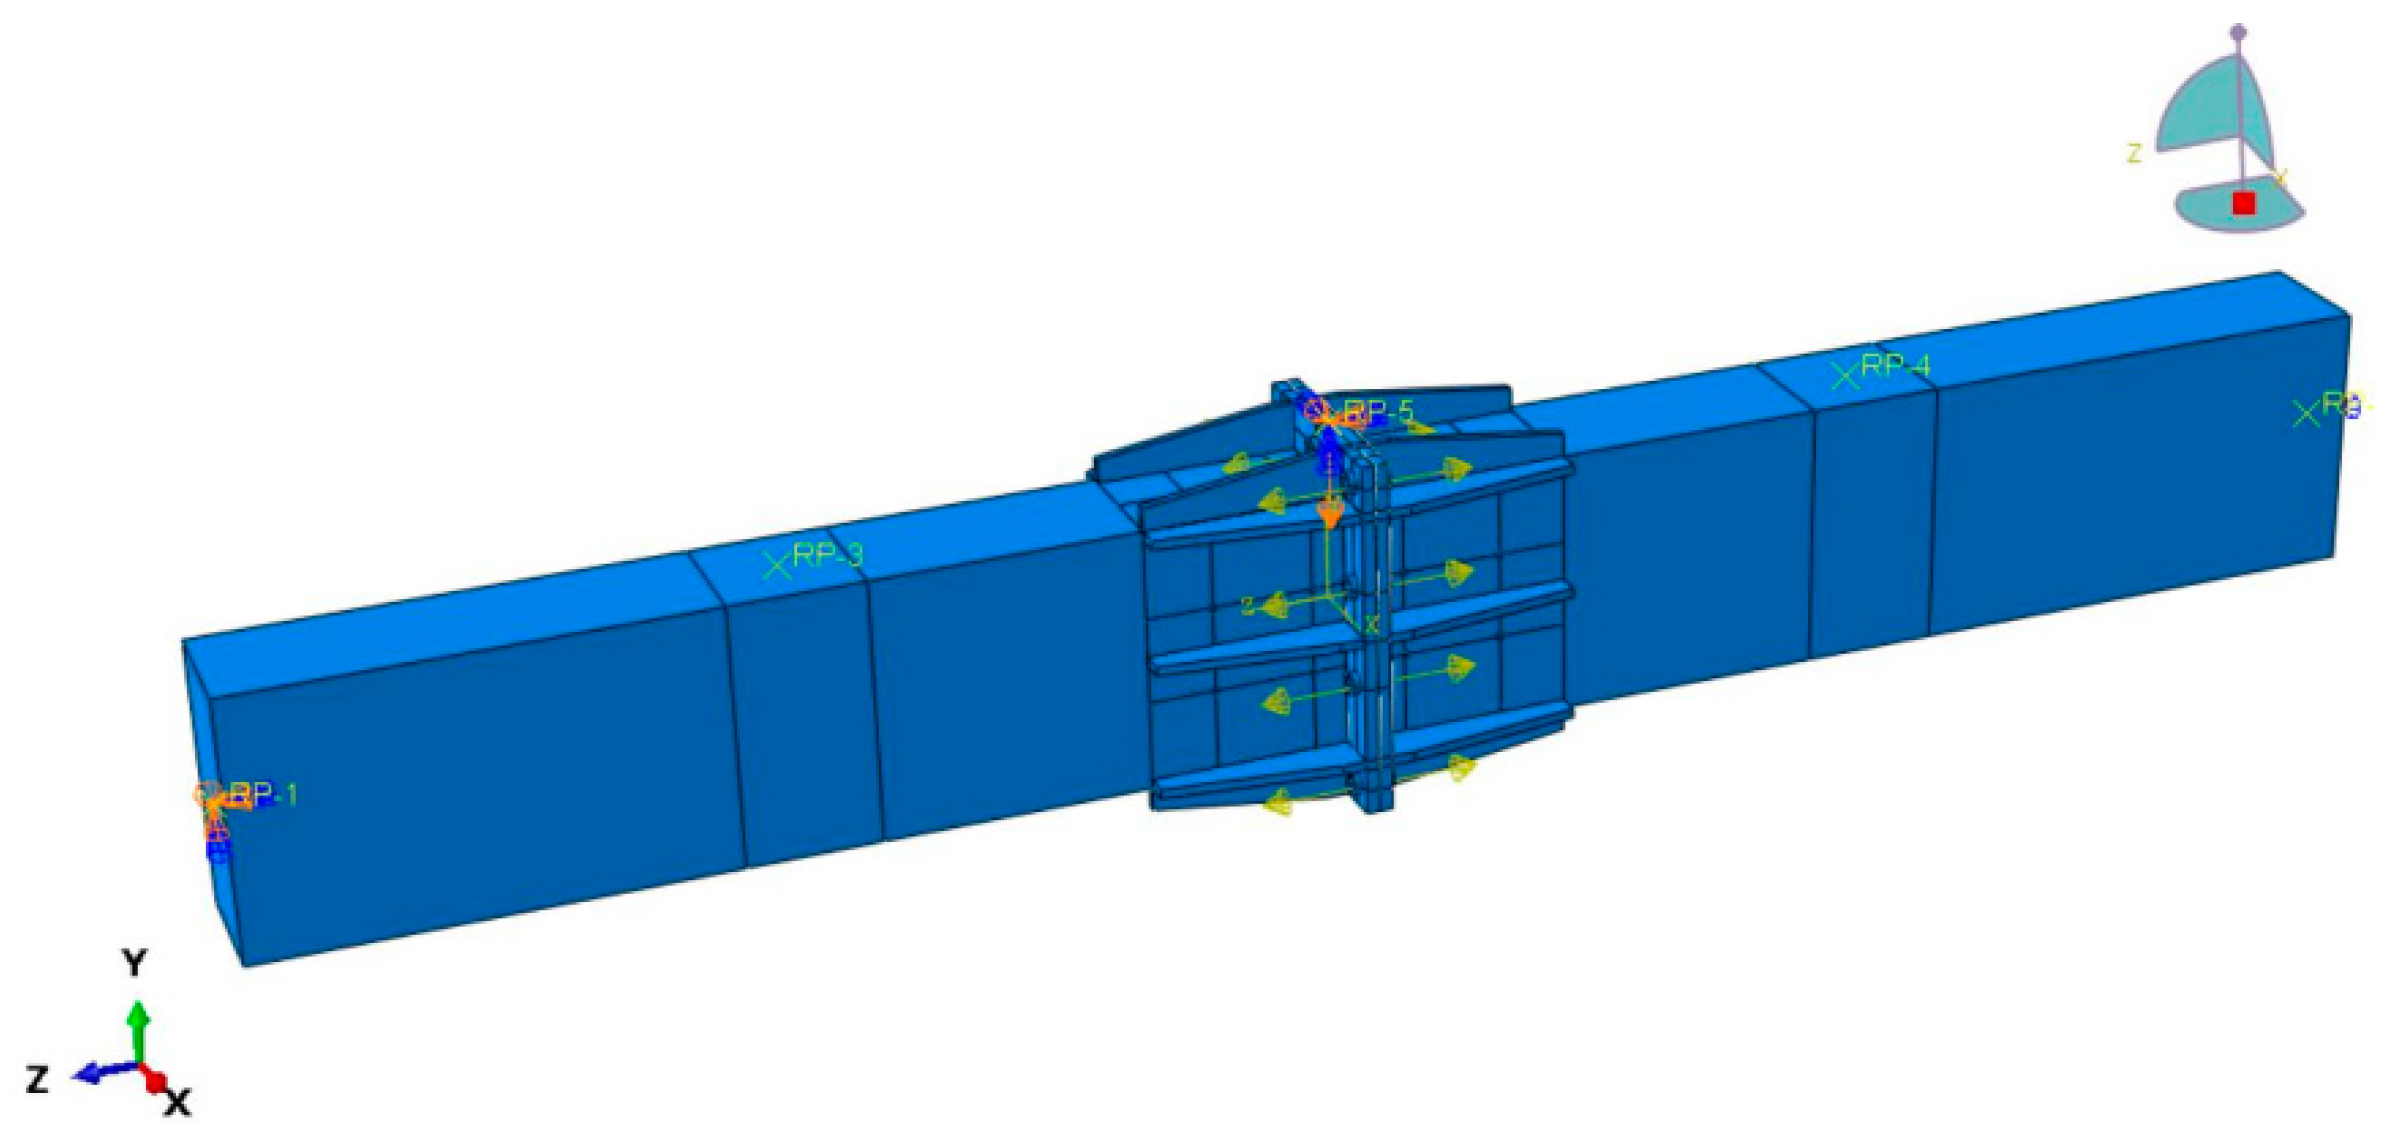
4.4. Loading Protocol and Boundary Conditions

The finite element model employed displacement-controlled loading, where displacement was designated as the independent variable and incrementally increased in proportional steps for validation. The boundary conditions were established as follows: boundary reference point RP1 constrained U1, U2, U3, UR2, and UR3 degrees of freedom, while RP2 restricted U1, U2, UR2, and UR3. The boundary conditions and loading configuration of the bolted connection assembly in the precast RC beam finite element model are illustrated in Figure 10.

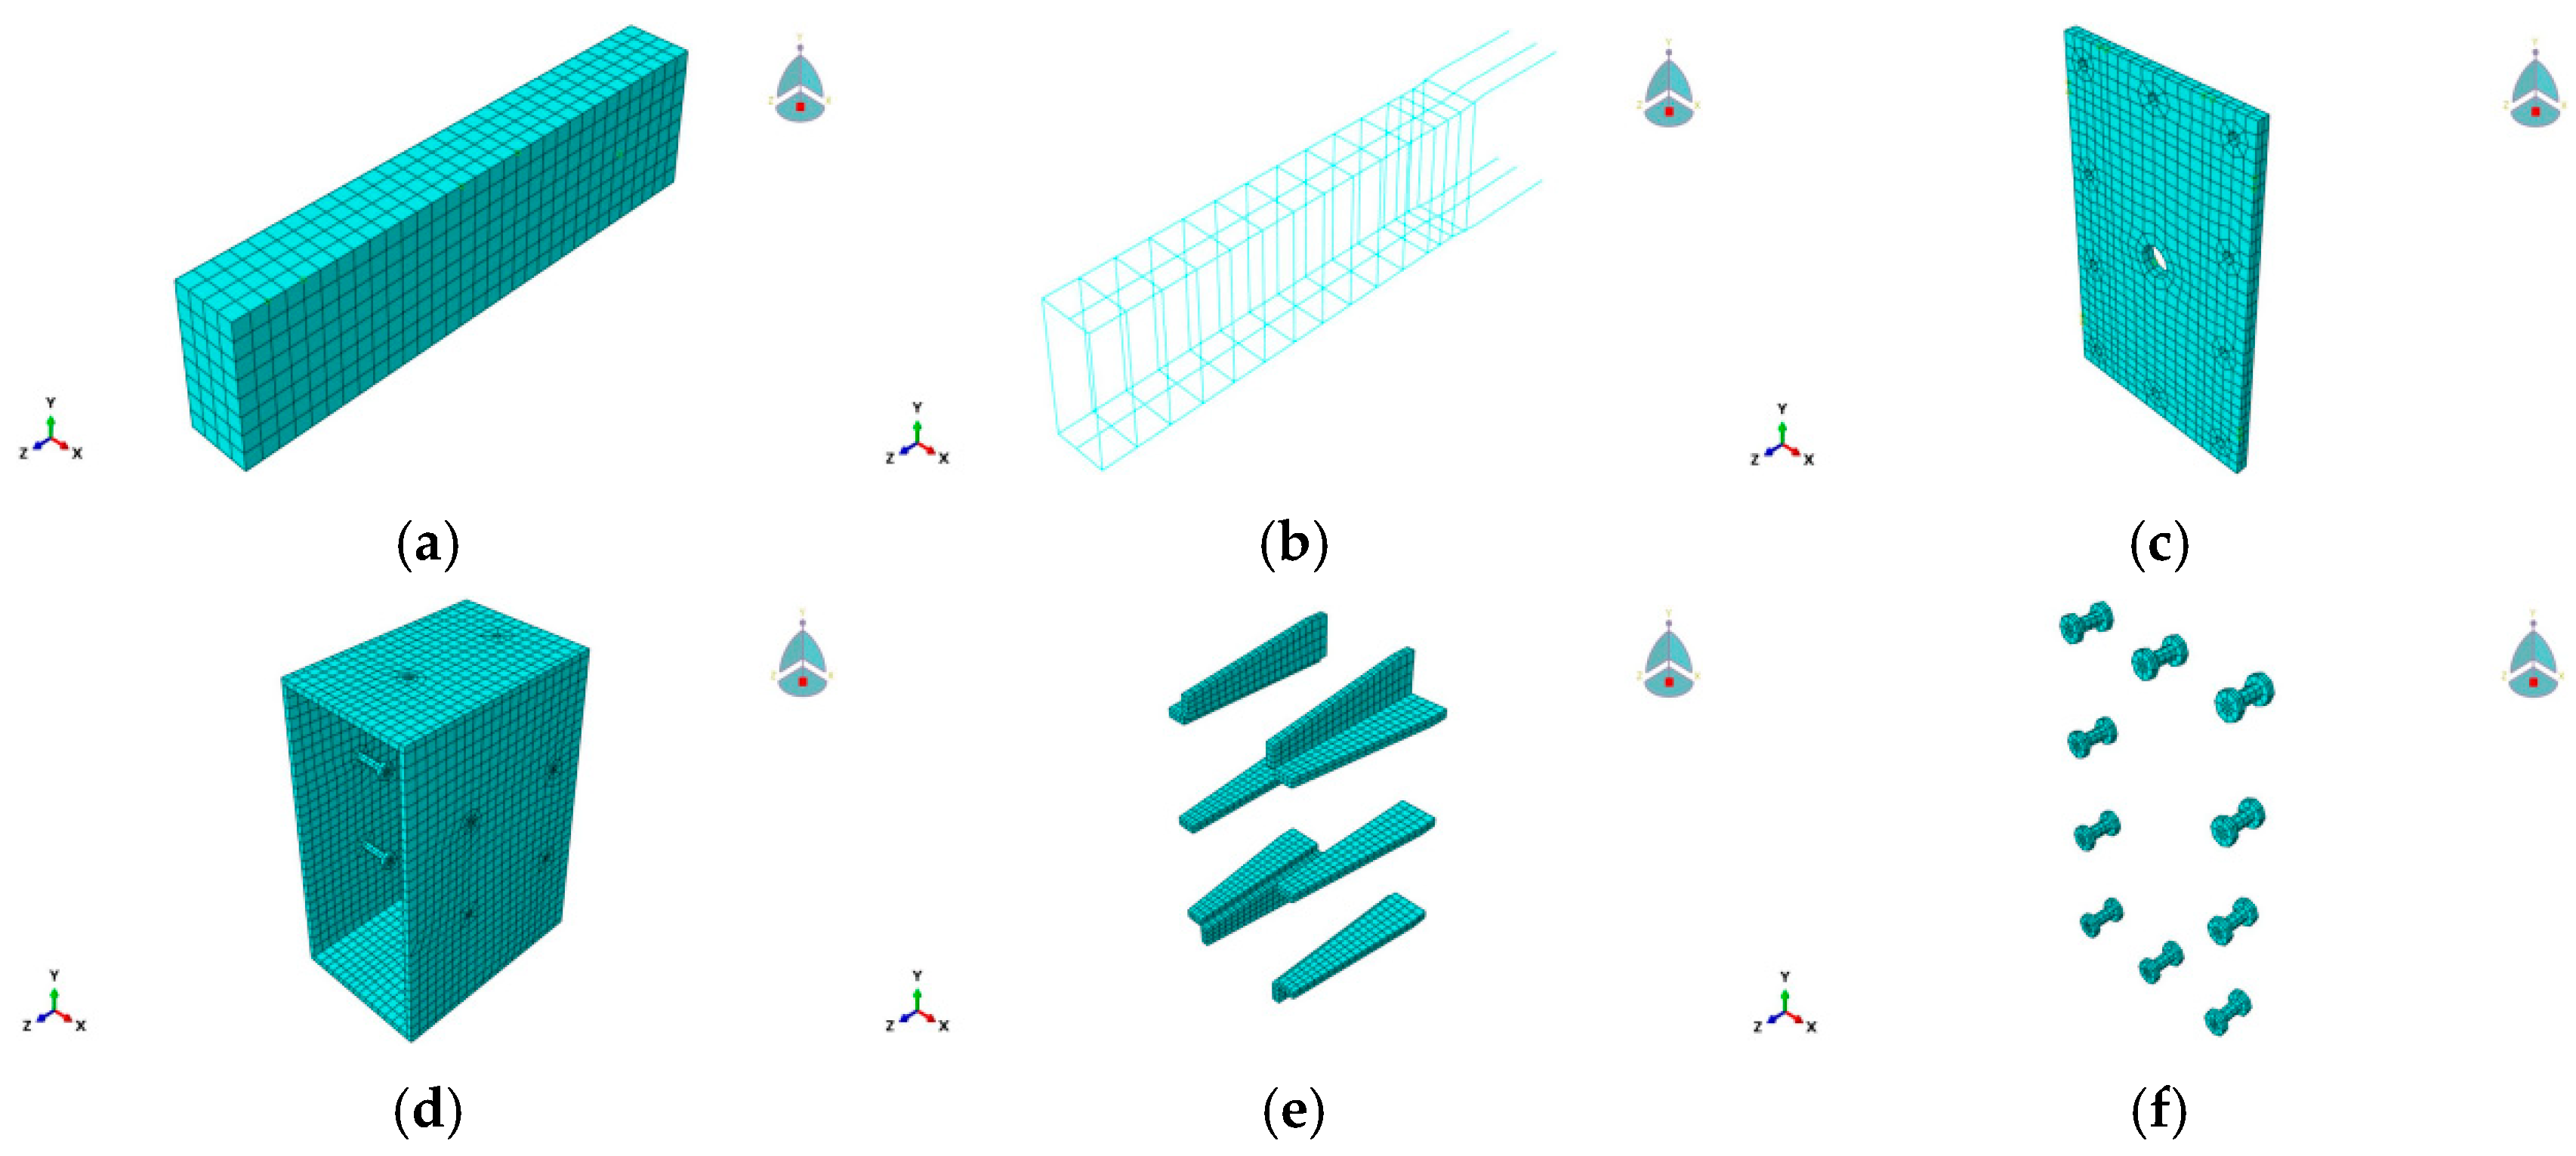
4.5. Meshing Approach

The meshing strategy for the finite element model of bolted connections in precast RC beams was implemented as follows: the concrete component was assigned a mesh size of 50 mm, endplates were discretized with 20 mm elements, stiffeners and steel sleeves adopted 15 mm element sizes, while bolts were refined to an 8 mm mesh resolution. The resultant meshing configuration is illustrated in Figure 11.

4.6. Numerical Model Validation

4.6.1. Failure Mode Comparison

As evidenced in Figure 5, the numerical simulation accurately replicates the experimental failure patterns, with specimen failure consistently localized near the steel-concrete variable stiffness interface. Notably, no steel fracture occurred at bolted connections. This comparative analysis demonstrates the numerical model’s effectiveness in simulating the experimental loading process.

4.6.2. Ultimate Load Comparison

Table 3 presents the experimental and simulated ultimate load-bearing capacities exhibit discrepancies within 4%, demonstrating strong consistency. This close agreement validates the fidelity of the ABAQUS numerical model in replicating actual working conditions and establishes a reliable foundation for subsequent parametric studies.

4.6.3. Comparative Analysis of Experimental and Simulated Load–Displacement Curves

As illustrated in Figure 6, the experimental and simulated load–displacement curves exhibit similar trends, with minor discrepancies arising from the elastic assumptions inherent in the numerical model. Table 3 confirms that the ultimate load discrepancies between experimental and simulated results remain within 4%. The load–displacement curve serves as a critical indicator for evaluating the initial stiffness, bearing capacity, and deformation characteristics of prefabricated structural joints.

4.6.4. Mechanistic Analysis of Load–Displacement Curves

Figure 12 presents the load–displacement curves of the bolted connection joints in prefabricated concrete beams. The load–displacement curve progression can be categorized into four distinct stages: elastic stage, yielding stage, hardening stage, and failure stage. During the initial loading phase (O–A), the curve demonstrates linear growth, with the joint stiffness remaining nearly constant, indicating elastic behavior. The secant stiffness of this phase defines the initial stiffness. As the load increases (A–B), the joint transitions into the yielding stage, characterized by nonlinear growth in the curve due to the initiation of plastic deformation. With continued loading (B–C), the hardening stage emerges, where the curve displays a slight linear hardening trend accompanied by a noticeable reduction in the slope. Further loading (C–D) leads to the failure stage, during which the bearing capacity gradually diminishes under increasing external loads, resulting in a descending curve until complete joint failure occurs. This staged evolution reflects the interplay between material nonlinearity, interfacial slip mechanisms, and progressive damage accumulation in the joint system. The close alignment between experimental and numerical results underscores the validity of the modeling framework for capturing key mechanical behaviors while highlighting opportunities to refine constitutive laws for enhanced predictive accuracy.

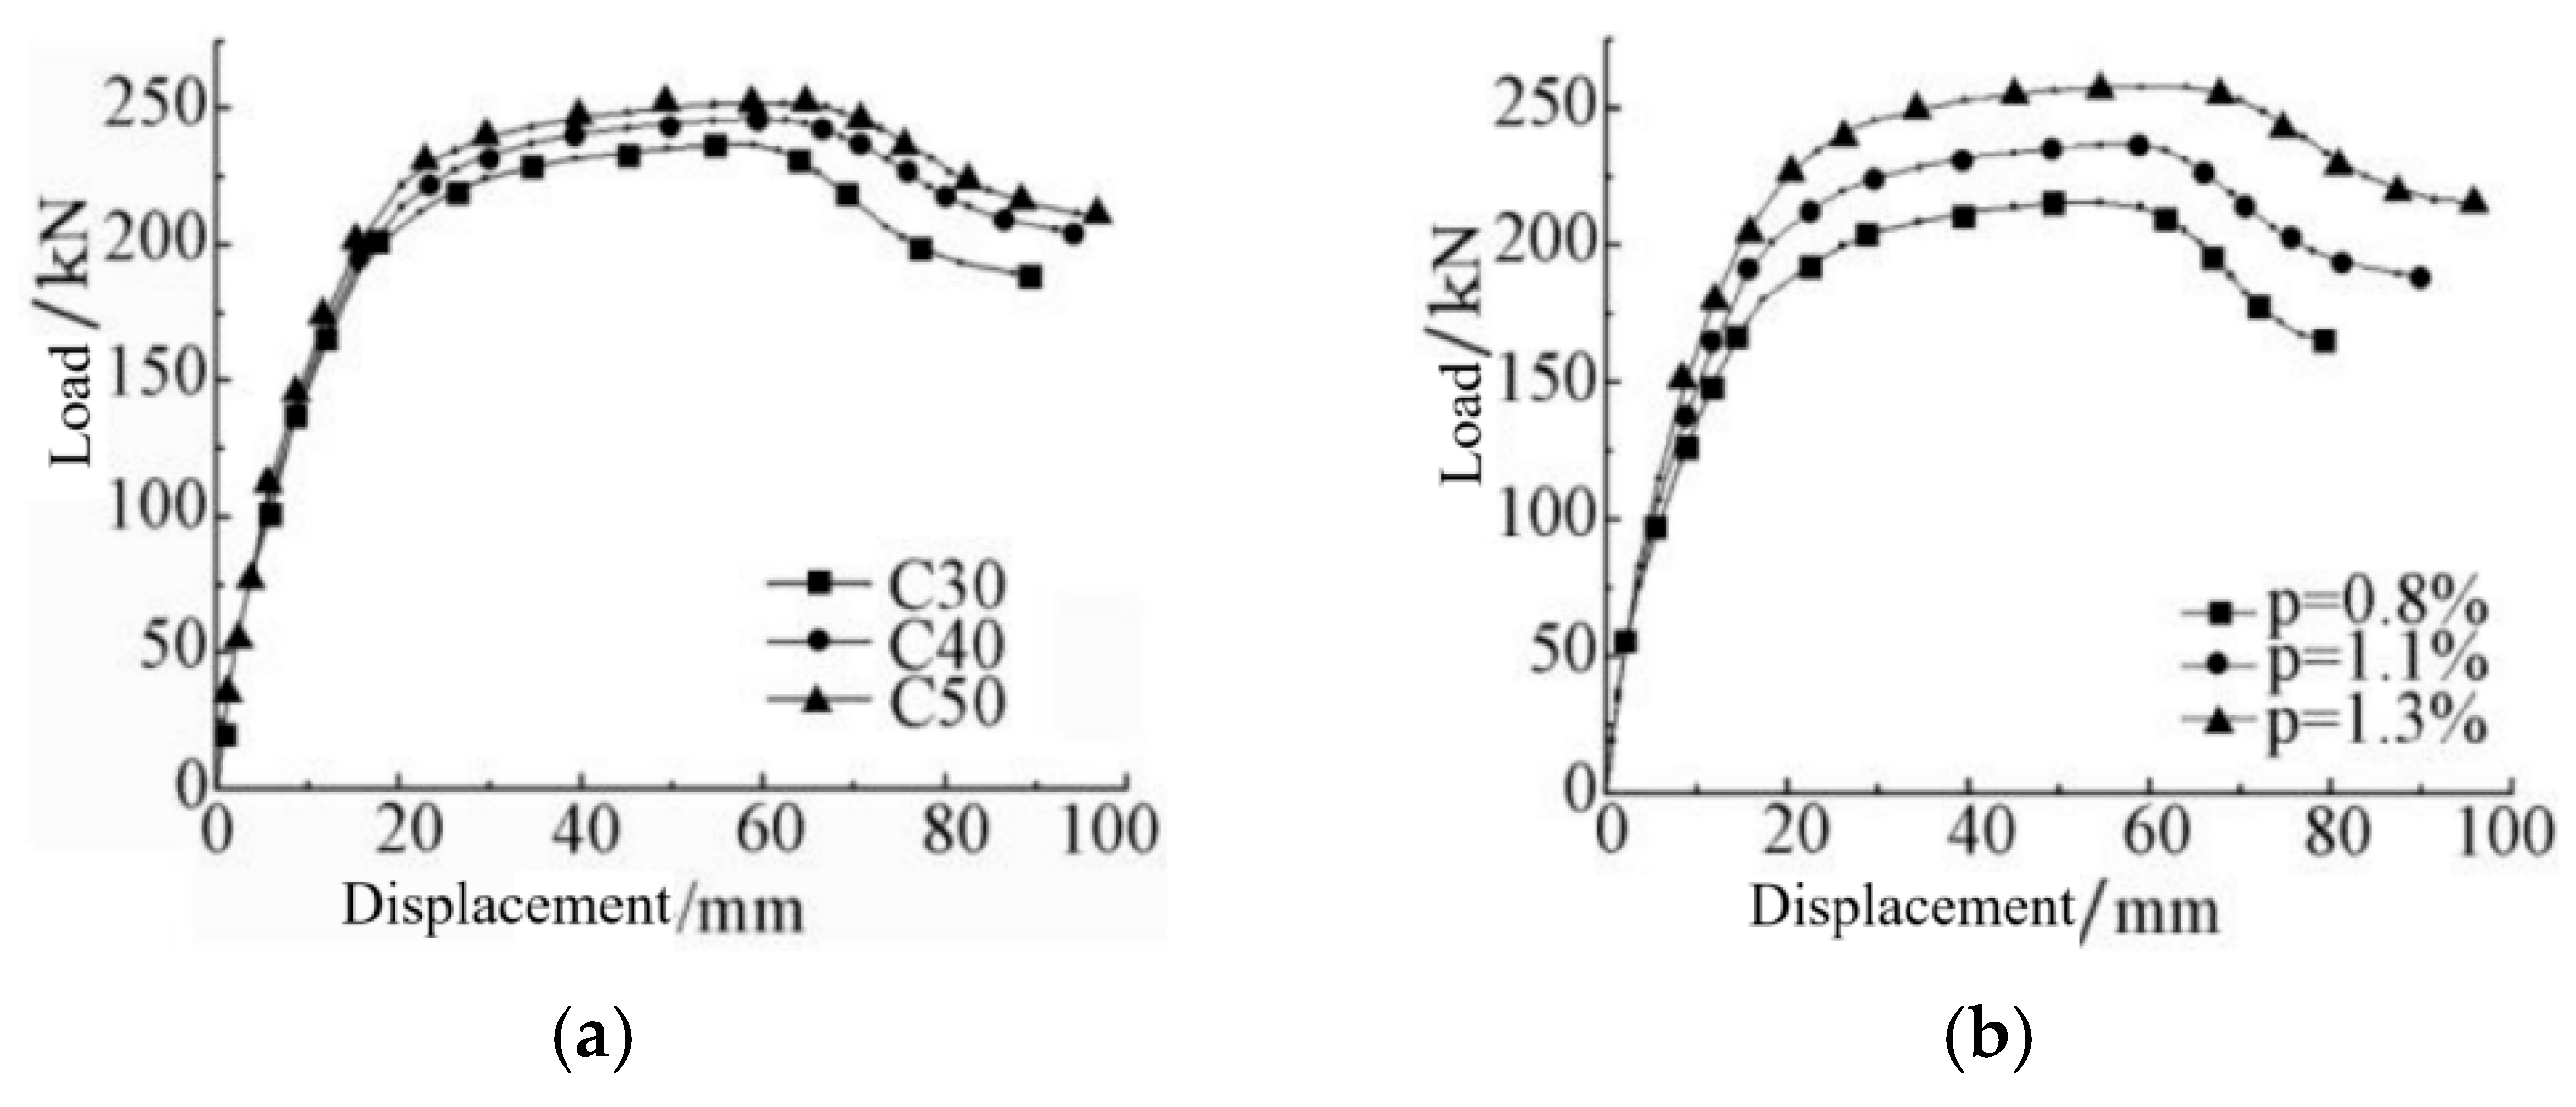
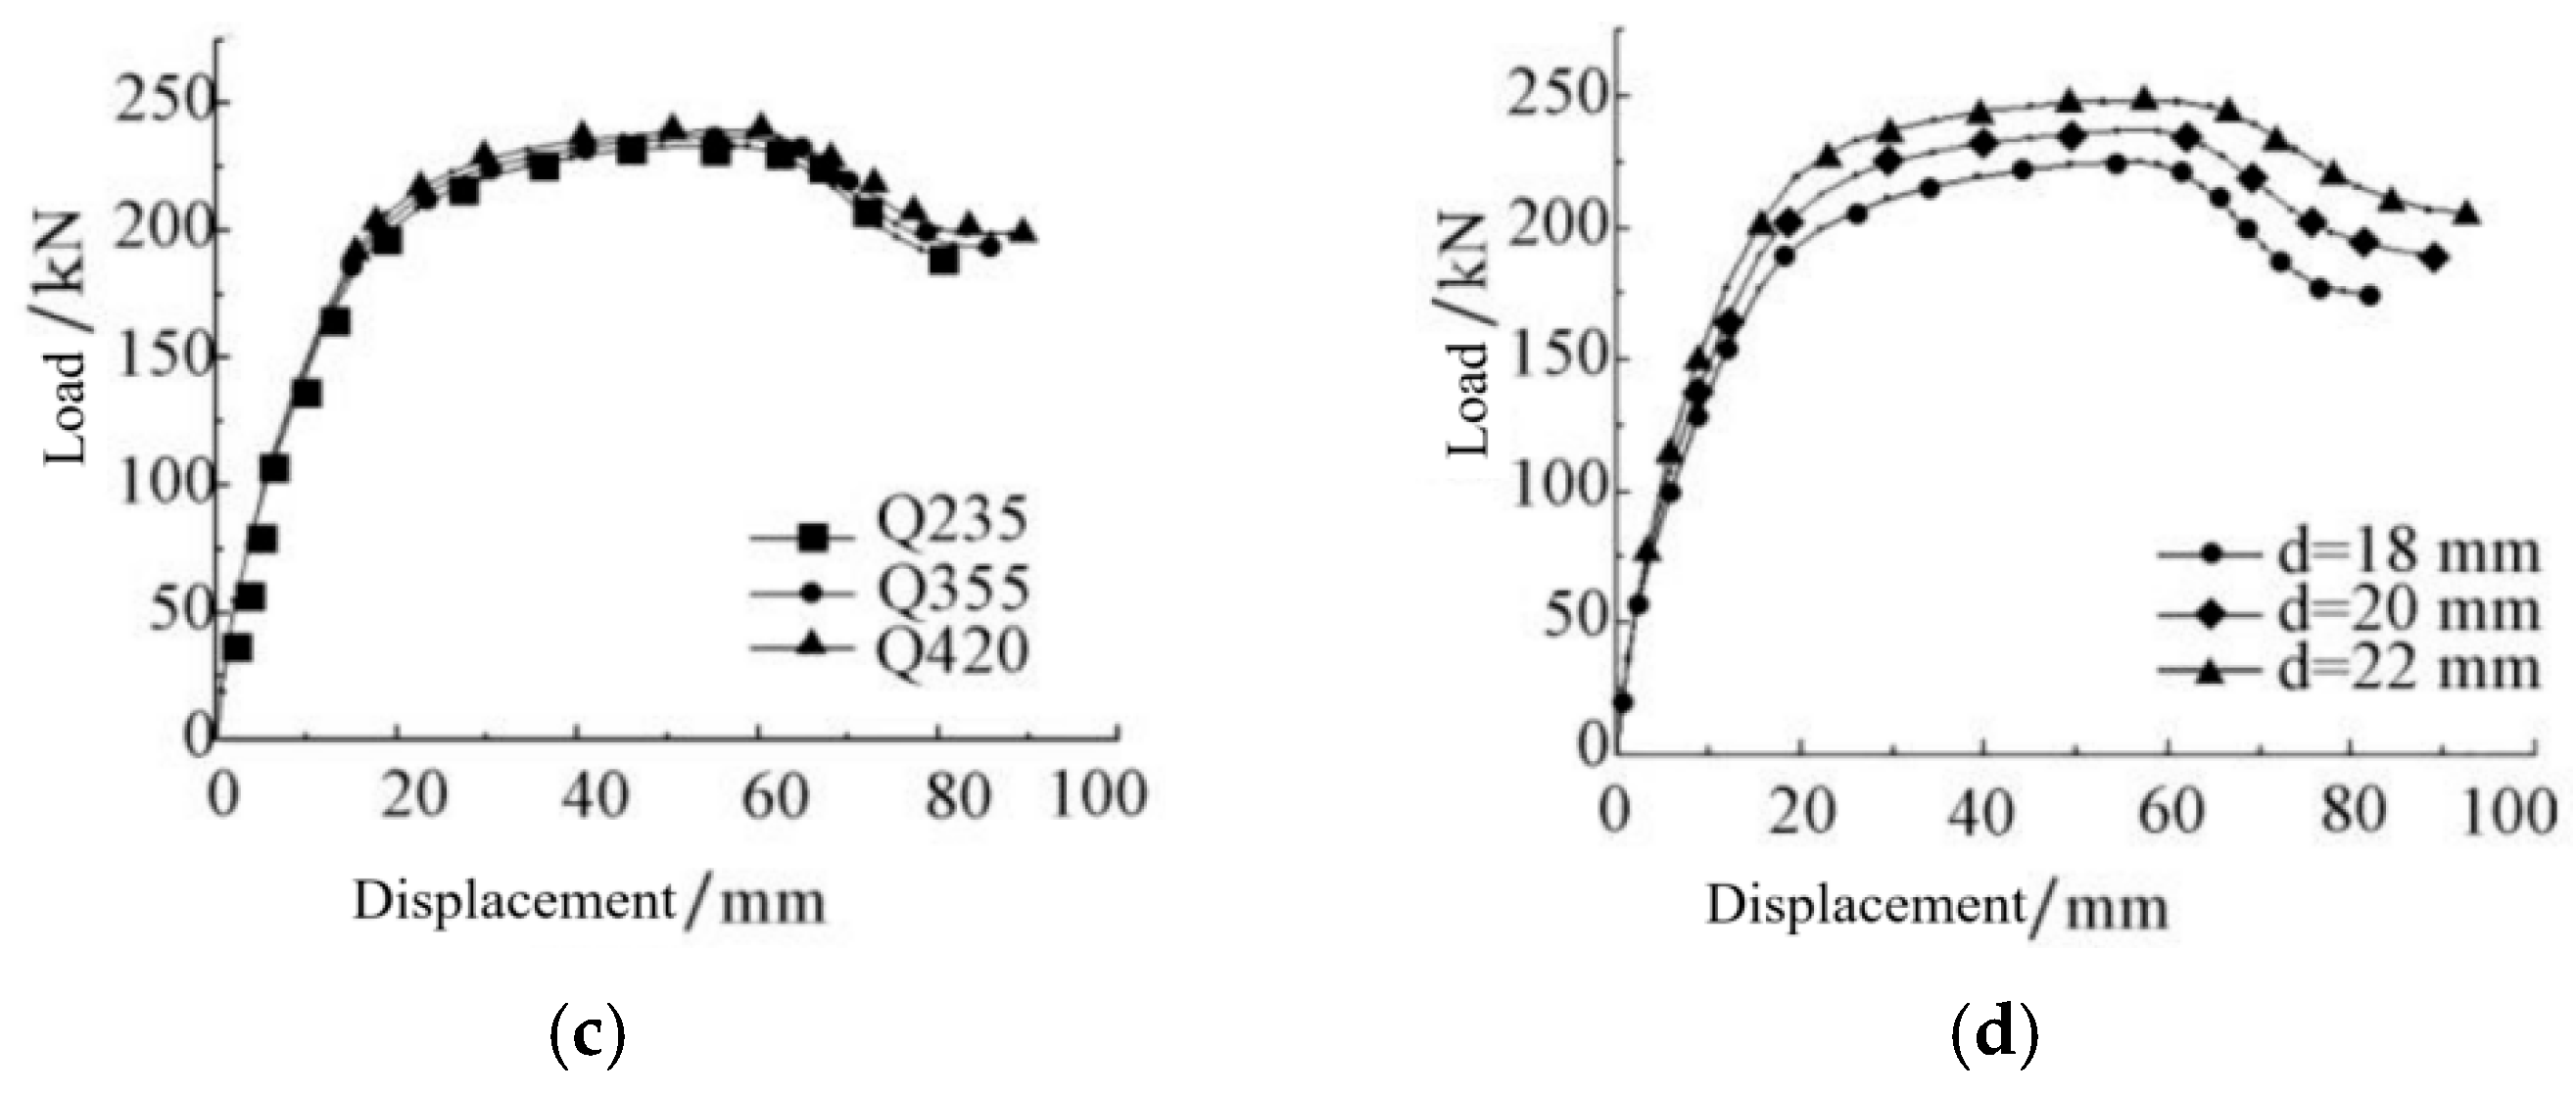
4.6.5. Parametric Analysis of Simulation

The mechanical behavior of bolted connections in prefabricated concrete beams is governed by the following four key parameters: concrete strength, reinforcement ratio, steel strength, and bolt pre-tension. The load–displacement curves of these connections under varying parameter combinations are illustrated in Figure 13, with characteristic values (e.g., initial stiffness, K0, yield load, Py, maximum load, Pmax, and ultimate load, Pu) corresponding to each parameter summarized in Table 4.
(1) Influence of Concrete Strength Grade
The parametric analysis focuses on concrete as a critical constituent of prefabricated beams, given the observed failure mechanism characterized by extensive yielding of tensile reinforcement and concrete crushing in the compression zone adjacent to the joint. Under constant geometric and material parameters, comparative analyses were conducted for concrete grades C30, C40, and C50. Figure 13a demonstrates consistent load–displacement trends across all specimens during the initial elastic phase, with nearly identical initial stiffness. The post-yielding phase reveals diverging curves, showing 4.05% and 6.41% enhancements in ultimate load capacity for C40 and C50 specimens, respectively, compared to the C30 baseline (Table 4). Notably, the strength improvement exhibits diminishing returns beyond the C40 grade, with stiffness increments limited to 0.31% (C40) and 0.49% (C50). These results quantitatively confirm the strength-dependent yet nonlinear relationship between concrete grade and joint performance, suggesting optimal material selection thresholds for engineering applications.
(2) Influence of Reinforcement Ratio
A parametric study was conducted on nodes with reinforcement ratios of 0.80%, 1.10%, and 1.30% while maintaining constant geometric configurations. Figure 13b reveals that all specimens exhibit fundamentally similar deformation patterns with notable divergence in post-elastic phases. Both stiffness and load-carrying capacity demonstrate statistically significant enhancements with increased reinforcement ratios. As quantified in Table 4, specimens with 1.10% and 1.30% reinforcement ratios exhibit 4.04% and 7.52% improvements in initial rotational stiffness, respectively, along with 9.80% and 19.54% increases in ultimate bearing capacity compared to the 0.80% baseline. This reinforcement-dependent behavior stems from the failure mechanism transition: higher reinforcement ratios enhance deformation capacity in beam-joint transition zones. Fracture of larger-diameter rebars requires greater tensile forces during failure initiation, thereby systematically improving both stiffness and strength performance.
(3) Influence of Steel Strength
Parametric analysis was conducted on nodes with steel grades Q235, Q355, and Q420 while maintaining identical geometric configurations. Figure 13c demonstrates minimal divergence among load–displacement curves across all specimens, indicating negligible sensitivity of initial stiffness and ultimate capacity to steel strength variations. Quantitative analysis (Table 4) reveals marginal improvements of 0.13% and 0.18% in initial stiffness for Q355 and Q420 specimens compared to the Q235 baseline, attributable to similar elastic moduli across steel grades. Ultimate bearing capacity exhibits modest increases of 1.63% and 2.60%, respectively, while displacement characteristics remain statistically unchanged. These results confirm substantial material redundancy in the current design—further steel strength enhancement beyond Q420 would yield diminishing returns in both structural capacity and deformation performance.
(4) Influence of Bolt Diameter
A systematic investigation was conducted on nodes with bolt diameters of 18 mm, 20 mm, and 22 mm while maintaining other geometric and material parameters. Figure 13d demonstrates progressive enhancement of both initial stiffness and ultimate bearing capacity with increasing bolt dimensions. Quantitative analysis (Table 4) reveals that specimens with 20 mm and 22 mm bolts achieve 1.64% and 3.50% improvements in initial stiffness, along with 5.34% and 10.23% increases in ultimate load capacity, respectively, compared to the 18 mm baseline.

5. Conclusions

This study designed and fabricated five prefabricated reinforced concrete beam specimens with bolted connections, incorporating different high-strength bolt specifications, to investigate their flexural performance under vertical static loading. The results are as follows:
(1) First demonstration of consistent three-phase mechanical responses across specimens, with load–displacement curves showing less than 5% ultimate capacity variation, validating the connection scheme’s universality.
(2) Revolutionary fully bolted prefabrication method, reducing the onsite operation time by 60%, featuring pioneering reversible connections for building adaptation.
(3) Established parameter sensitivity hierarchy: reinforcement ratio dominates with 25.7% stiffness and 34.2% capacity gains when doubled; concrete strength below C40 shows significant effects; bolt diameter ranks secondary; steel strength proves negligible. The C30-C40 concrete with 18–22 mm bolts emerges as the optimal solution.
(4) It provides a scientific basis for research toward future inspection of potential degradation mechanisms at the concrete–bolt interface.

Author Contributions

D.W.: Writing—original draft, visualization, validation, software, methodology, investigation, formal analysis, data curation, conceptualization. Y.L. and H.L.: Writing-review and editing, supervision, resources, software, project administration. S.P.: Writing-review and editing, investigation, funding acquisition, formal analysis, conceptualization. All authors have read and agreed to the published version of the manuscript.

Funding

The authors would like to acknowledge the financial support provided by the Natural Science Foundation of Hubei Province (Grant No. 2022CFB662), Scientific Research Fund of Institute of Engineering Mechanics, China Earthquake Administration (Grant No. 2024D30), and the Wuhan Knowledge Innovation Special Dawn Plan Project of China (Grant No. 2023020201020403).

Data Availability Statement

Data is contained within the article.

Conflicts of Interest

The authors declare no conflicts of interest.

References

  1. Hossein, P.; Iman, H.; Reza, R. A new ductile moment-resisting connection for precast concrete frames in seismic regions: An experimental investigation. Eng. Struct. 2014, 70, 144–157. [Google Scholar] [CrossRef]
  2. Zhang, Z.; Zhang, Y. Research Status on Reinforcement Connection Form of Precast Concrete Shear Wall Structure. IOP Conf. Ser. Mater. Sci. Eng. 2018, 322, 042001. [Google Scholar] [CrossRef]
  3. Zheng, G.; Kuang, Z.; Xiao, J.; Pan, Z. Mechanical performance for defective and repaired grouted sleeve connections under uniaxial and cyclic loadings. Constr. Build. Mater. 2020, 233, 117233. [Google Scholar] [CrossRef]
  4. Li, X.; Xiao, S.; Gao, R.; Harries, K.A.; Wang, Z.; Xu, Q. Effects of grout sleeve defects and their repair on the seismic performance of precast concrete frame structures. Eng. Struct. 2021, 242, 112619. [Google Scholar] [CrossRef]
  5. Xiong, L.; Li, S.; Jiang, K.; He, J.; Kong, F. Development and assessment of sustainable steel-concrete composite beams with novel demountable shear connections. Soil Dyn. Earthq. Eng. 2024, 180, 108606. [Google Scholar] [CrossRef]
  6. Luo, Y.-B.; Yan, J.-B. Developments of prefabricated steel-concrete composite beams with novel steel-yielding demountable bolt connectors. J. Constr. Steel Res. 2022, 190, 107123. [Google Scholar] [CrossRef]
  7. Ataei, A.; Mahmoudy, S.A. Modeling of innovative bolted shear connectors in demountable cold-formed steel-concrete composite beams: Validation of finite element model and parametric study. J. Build. Eng. 2024, 95, 110076. [Google Scholar] [CrossRef]
  8. Liu, X.; Hou, C.; Peng, J.; Wang, Y.; Rasmussen, K.J.R. Recent advancements of inter-module connections for modular buildings: An overview and multi-dimensional assessment. Eng. Struct. 2025, 335, 120378. [Google Scholar] [CrossRef]
  9. Liu, Q.; Chen, S.; Lin, W.; Zeng, F. Experimental study on novel energy-dissipating prefabricated beam-column joints. Adv. Civ. Eng. 2019, 17, 8151087. [Google Scholar] [CrossRef]
  10. Yang, K.-H.; Oh, M.-H.; Kim, M.-H.; Lee, H.-C. Flexural behavior of hybrid precast concrete beams with H-steel beams at both ends. Eng. Struct. 2010, 32, 2940–2949. [Google Scholar] [CrossRef]
  11. Kulkarni, S.A.; Li, B.; Yip, W.K. Finite element analysis of precast hybrid-steel concrete connections under cyclic loading. Steel Constr. 2008, 23, 83–84. [Google Scholar] [CrossRef]
  12. Ersoy, U.; Tugrul, T. Precast concrete members with welded plate connections under reversed cyclic loading. PCI J. 1993, 38, 89–99. [Google Scholar] [CrossRef]
  13. Valente, M.; Castiglioni, C.A.; Kanyilmaz, A. Dissipative devices for earthquake resistant composite steel structures: Bolted versus welded solution. Bull. Earthq. Eng. 2016, 14, 3613–3639. [Google Scholar] [CrossRef]
  14. Valente, M.; Castiglioni, C.A.; Kanyilmaz, A. Numerical investigations of repairable dissipative bolted fuses for earthquake resistant composite steel frames. Eng. Struct. 2017, 131, 275–292. [Google Scholar] [CrossRef]
  15. Lin, W.; Yoda, T.; Taniguchi, N. Fatigue tests on straight steel-concrete composite beams subjected to hogging moment. Steel Constr. 2013, 80, 42–56. [Google Scholar] [CrossRef]
  16. Hicks, S.J.; Pennington, A. Partial factors for the design resistance of composite beams in bending. J. Constr. Steel Res. 2015, 105, 74–85. [Google Scholar] [CrossRef]
  17. Nie, X.; Huang, D.; Zhuang, L.; Fan, J.; Deng, N. Precast concrete connections for alleviating reinforcement congestion: A state-of-the-art review. Eng. Struct. 2025, 331, 119985. [Google Scholar] [CrossRef]
  18. Li, Y.-H.-S.; Chen, B.-C.; Deng, Y.-X.; Cheng, J.-T.; Zhang, J.-P. Experimental Study on Shear and Tensile Behavior of T-Shaped Embedded-Nut Bolted Shear Connectors in Prefabricated Steel-Concrete Composite Beams. Eng. Mech. 2025, 42, 191–201. [Google Scholar] [CrossRef]
  19. Eom, T.-S.; Park, H.-G.; Hwang, H.-J.; Kang, S.-M. Plastic hinge relocation methods for emulative PC beam-column connections. J. Struct. Eng. 2016, 142, 04015111. [Google Scholar] [CrossRef]
  20. GB 50010-2010; Code for Design of Concrete Structures. Architecture Industrial Press of China: Beijing, China, 2024. (In Chinese)
  21. GB/T 50081-2019; The Standard for Test Methods of Concrete Physical and Mechanical Properties. Architecture Industrial Press of China: Beijing, China, 2024. (In Chinese)
  22. ISO 1920-3:2019; Testing of Concrete Part 3: Making and Curing Test Specimens. ISO: Geneva, Switzerland, 2019.
  23. Huang, Y.; Mazzarolo, E.; Briseghella, B.; Zordan, T.; Chen, A. Experimental and numerical investigation of the cyclic behaviour of an innovative prefabricated beam-to-column joint. Eng. Struct. 2017, 150, 373–389. [Google Scholar] [CrossRef]
  24. Wang, H.; Marino, E.M.; Pan, P.; Liu, H.; Nie, X. Experimental study of a novel precast prestressed reinforced concrete beam-to-column joint. Eng. Struct. 2018, 156, 68–81. [Google Scholar] [CrossRef]
  25. Xue, W.; Zhang, B.; Liao, X. Cyclic loading response of precast concrete frame with composite beams prestressed by partially bonded draped tendons under high axial compression. Eng. Mech. 2025, 334, 120229. [Google Scholar] [CrossRef]
  26. Sharos, P.A.; Egan, B.; Mccarthy, C.T. An analytical model for strength prediction in multi-bolt composite joints at various loading rates. Compos. Struct. 2014, 116, 300–310. [Google Scholar] [CrossRef]
Figure 1. Axial compression loading test on standard concrete cube specimens.
Buildings 15 02589 g001
Figure 2. Physical dimension and loading diagram of fabricated RC beam. (a) Geometric dimensions of fabricated RC beam and steel sleeve; (b) loading device and measuring point layout.
Buildings 15 02589 g002
Figure 3. Tensile tests of steel reinforcement and steel plate. (a) Tensile test of steel reinforcement; (b) tensile test of steel plate.
Buildings 15 02589 g003
Figure 4. Test setup and physical loading arrangement.
Buildings 15 02589 g004
Figure 5. Failure mode of experimental and simulation. (a) DH-1; (b) DH-2; (c) DH-3; (d) DH-4; (e) NH-1.
Buildings 15 02589 g005
Figure 6. Experimental and simulated of load–displacement curves. (a) Test and simulation curves of DH-1; (b) test and simulation curves of DH-2; (c) test and simulation curves of DH-3; (d) test and simulation curves of DH-4; (e) test and simulation curves of NH-1; (f) test curves of specimens DH-1~DH-4 and NH-1.
Buildings 15 02589 g006
Figure 7. Load–strain curves of steel reinforcement and steel plate.
Buildings 15 02589 g007
Figure 8. Uniaxial stress–strain curves for concrete in tension and compression.
Buildings 15 02589 g008
Figure 9. Stress–strain curve for reinforcement steel and bolts.
Buildings 15 02589 g009
Figure 10. Setting of loading protocol and boundary conditions.
Buildings 15 02589 g010
Figure 11. Mesh configuration. (a) Concrete; (b) reinforcement; (c) endplate; (d) steel sleeve; (e) stiffeners; (f) bolts.
Buildings 15 02589 g011
Figure 12. Diagram of load–displacement rules.
Buildings 15 02589 g012
Figure 13. Influence of concrete strength, reinforcement ratio, steel strength and bolt diameter. (a) Concrete strength; (b) reinforcement ratio; (c) steel strength; (d) bolt diameter.
Buildings 15 02589 g013aBuildings 15 02589 g013b
Table 1. The primary design parameters.
SpecimenCasting TypeStiffening RibsHigh-Strength Bolt SpecificationsBolt Grades
DH-1PrefabricatedYM2210.9 grade
DH-2PrefabricatedYM2010.9 grade
DH-3PrefabricatedYM1810.9 grade
DH-4PrefabricatedNM2010.9 grade
NH-1Cast-in-placeYM2010.9 grade
Table 2. Mechanical properties of steel reinforcement and other steel components.
Steel TypeRebar Diameter/Steel Plate Thickness/mmYield Strength
/MPa
Ultimate Strength
/MPa
Elastic Modulus
/MPa
HRB400104085492.00 × 105
HRB400184175662.00 × 105
Q35583654842.02 × 105
Q355143565242.02 × 105
Q355203895312.02 × 105
Table 3. Comparison of experimental and simulated ultimate load-bearing capacities.
SpecimenExperimental Ultimate Load/kNSimulated Ultimate Load/kNExperimental-to-Simulated Ultimate Load RatioRelative Error
/%
DH-1240247.80.9693.25
DH-2230236.80.9712.96
DH-3220224.80.9792.18
DH-4210218.50.9613.56
NH-1145147.40.9841.89
Table 4. Characteristic values of the four influencing parameters.
Different ParametersPy/kNΔy/mmPmax/kNΔmax/mmPu/kNΔu/mmK0/(kN·m)·rad−1
Concrete strengthC30181.9814.12236.8058.96201.2876.1431,133.43
C40188.2814.27246.3962.47209.4386.5331,230.21
C50192.9613.90251.9964.77214.1990.7431,285.80
Reinforcement ratio0.8%163.5713.94215.6654.47183.3170.3329,925.15
1.1%181.9814.12236.8058.96201.2876.1431,133.43
1.3%198.8714.59257.8064.06219.1389.0532,176.49
Steel strengthQ235178.2114.10233.0057.18198.0575.2231,093.01
Q335181.9814.12236.8058.96201.2876.1431,133.43
Q420184.8314.48239.0559.08203.1978.4431,148.97
Bolt diameter18 mm172.0114.03224.8056.57190.0870.9830,629.81
20 mm181.9814.12236.8058.96201.2876.1431,133.43
22 mm189.5914.38247.8061.06210.6384.5731,700.81
Disclaimer/Publisher’s Note: The statements, opinions and data contained in all publications are solely those of the individual author(s) and contributor(s) and not of MDPI and/or the editor(s). MDPI and/or the editor(s) disclaim responsibility for any injury to people or property resulting from any ideas, methods, instructions or products referred to in the content.

