
Archetype Identification and Energy Consumption Prediction for Old Residential Buildings Based on Multi-Source Datasets


Abstract
1. Introduction
2. Materials and Methods
2.1. Study Area and Data Collection
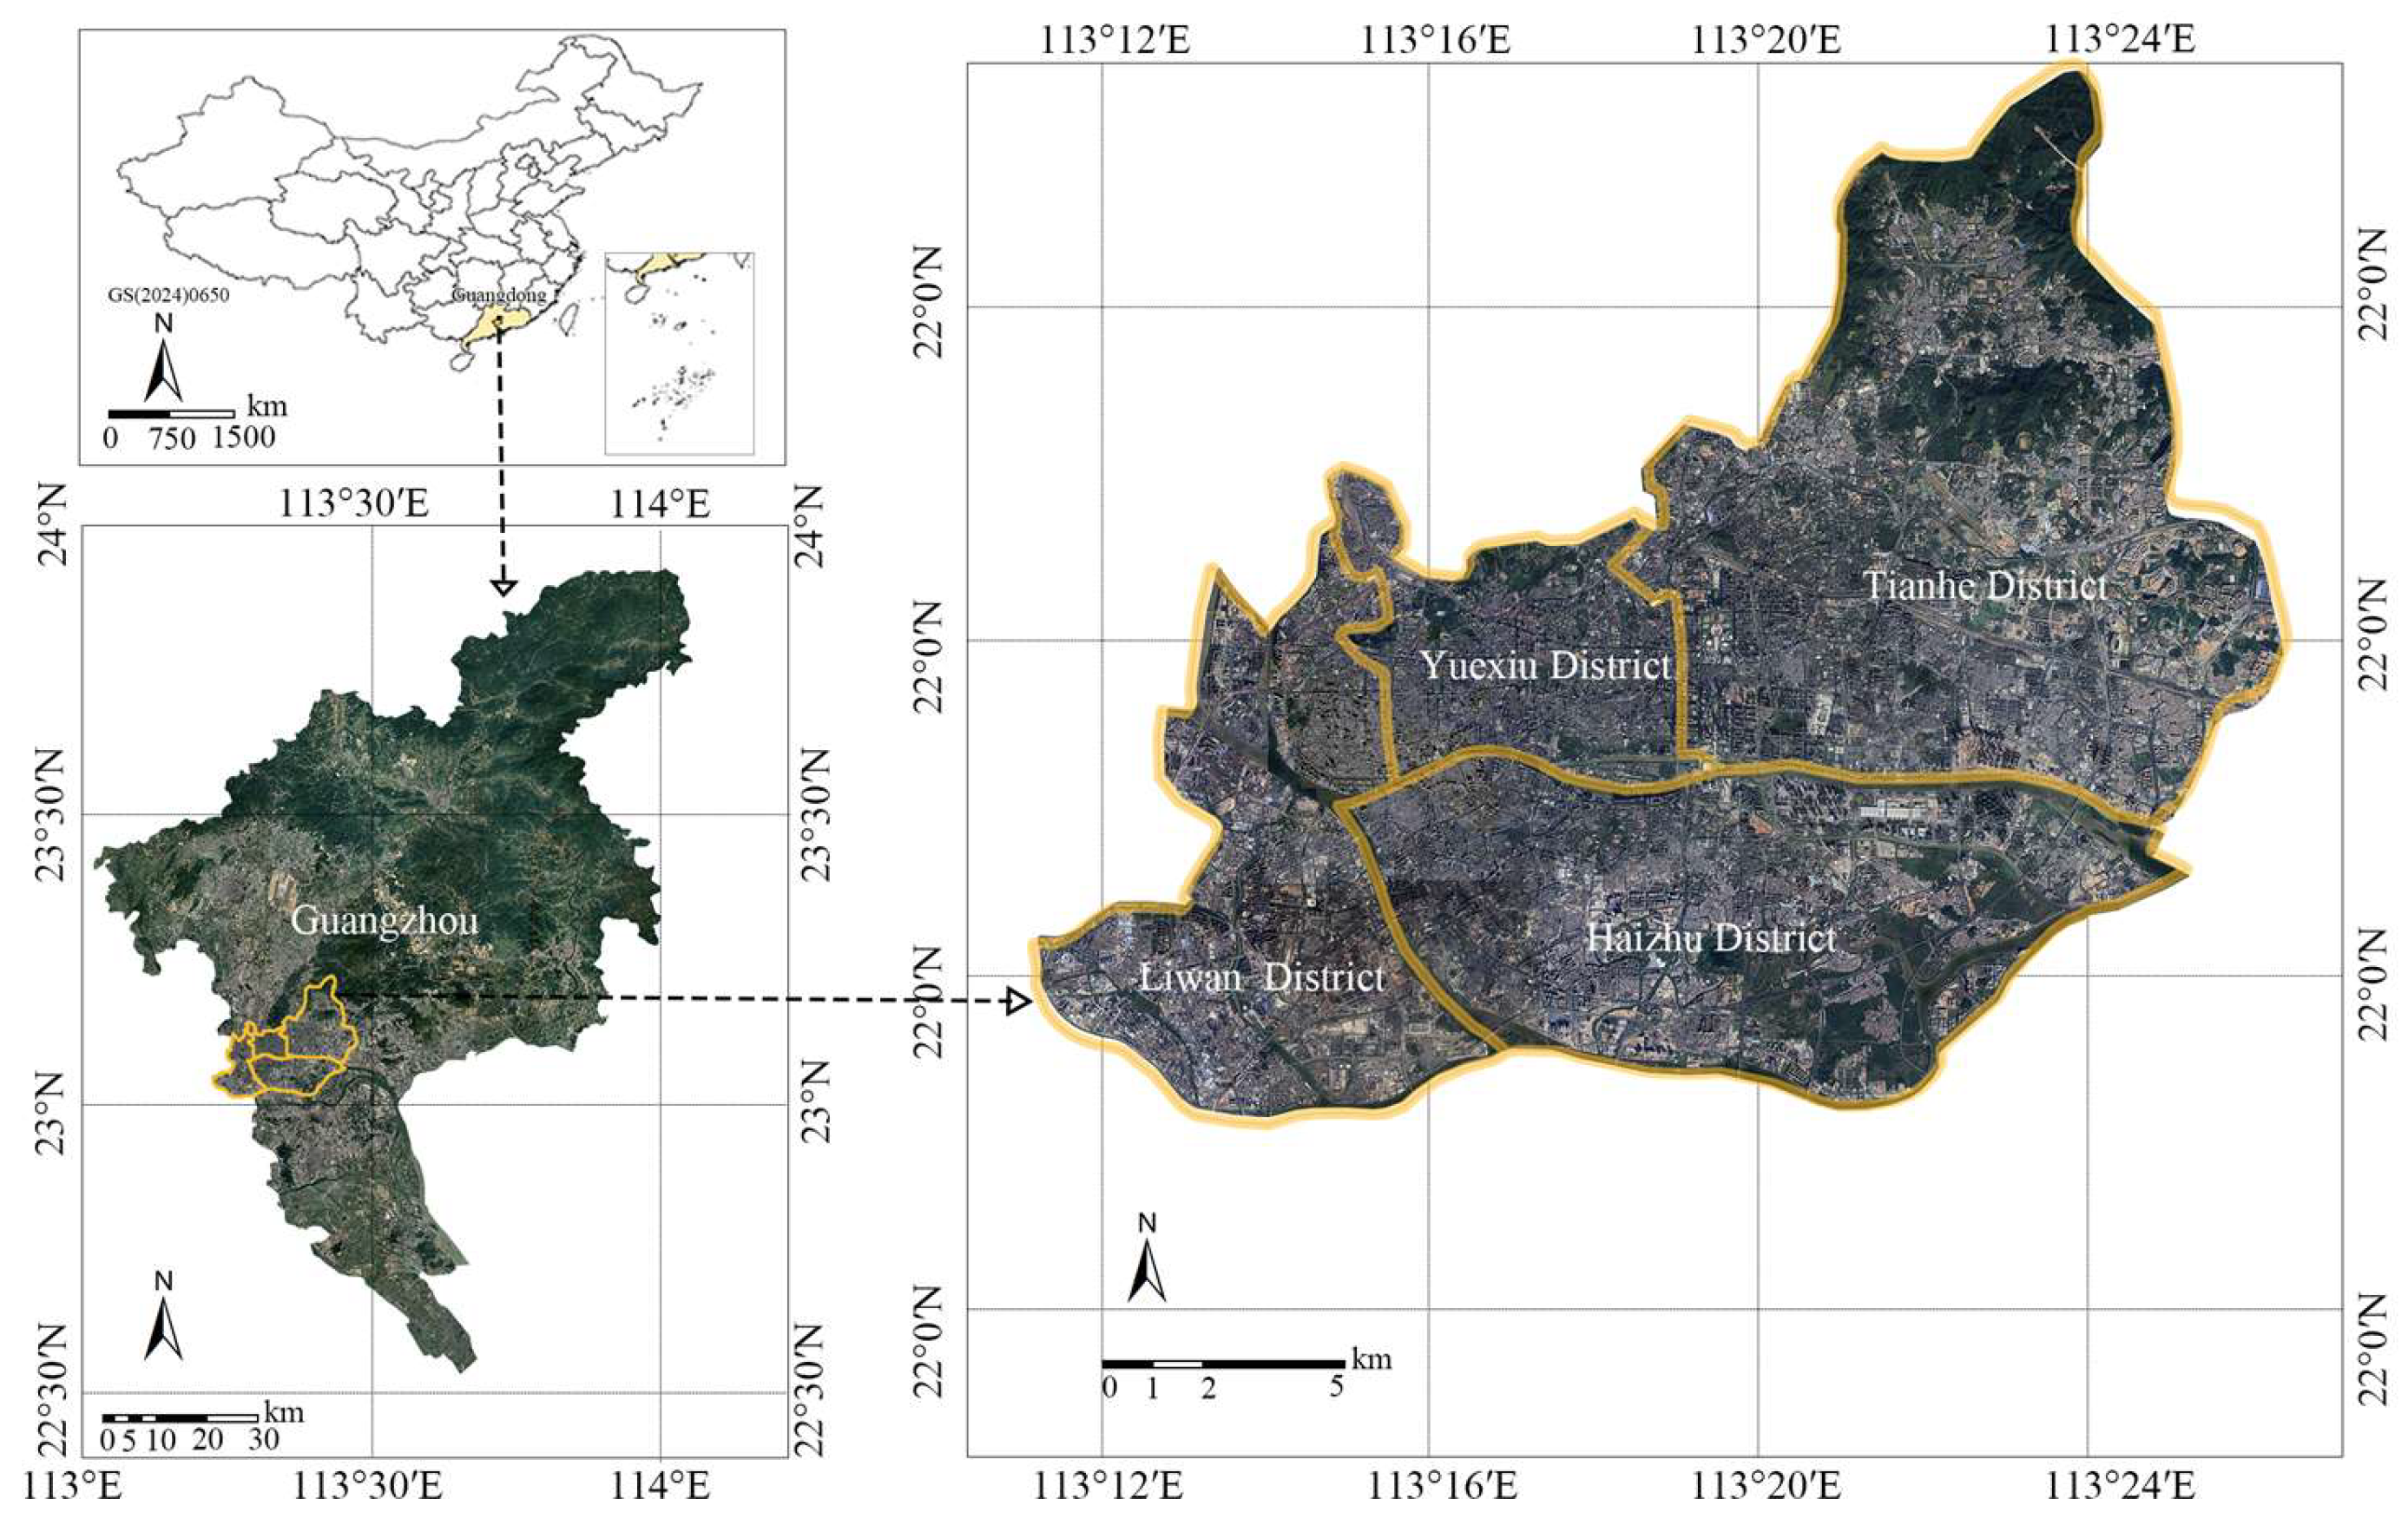
2.1.1. Case Study Area
2.1.2. Data Collection and Pre-Processing
2.2. Prototype of Old Residential Buildings
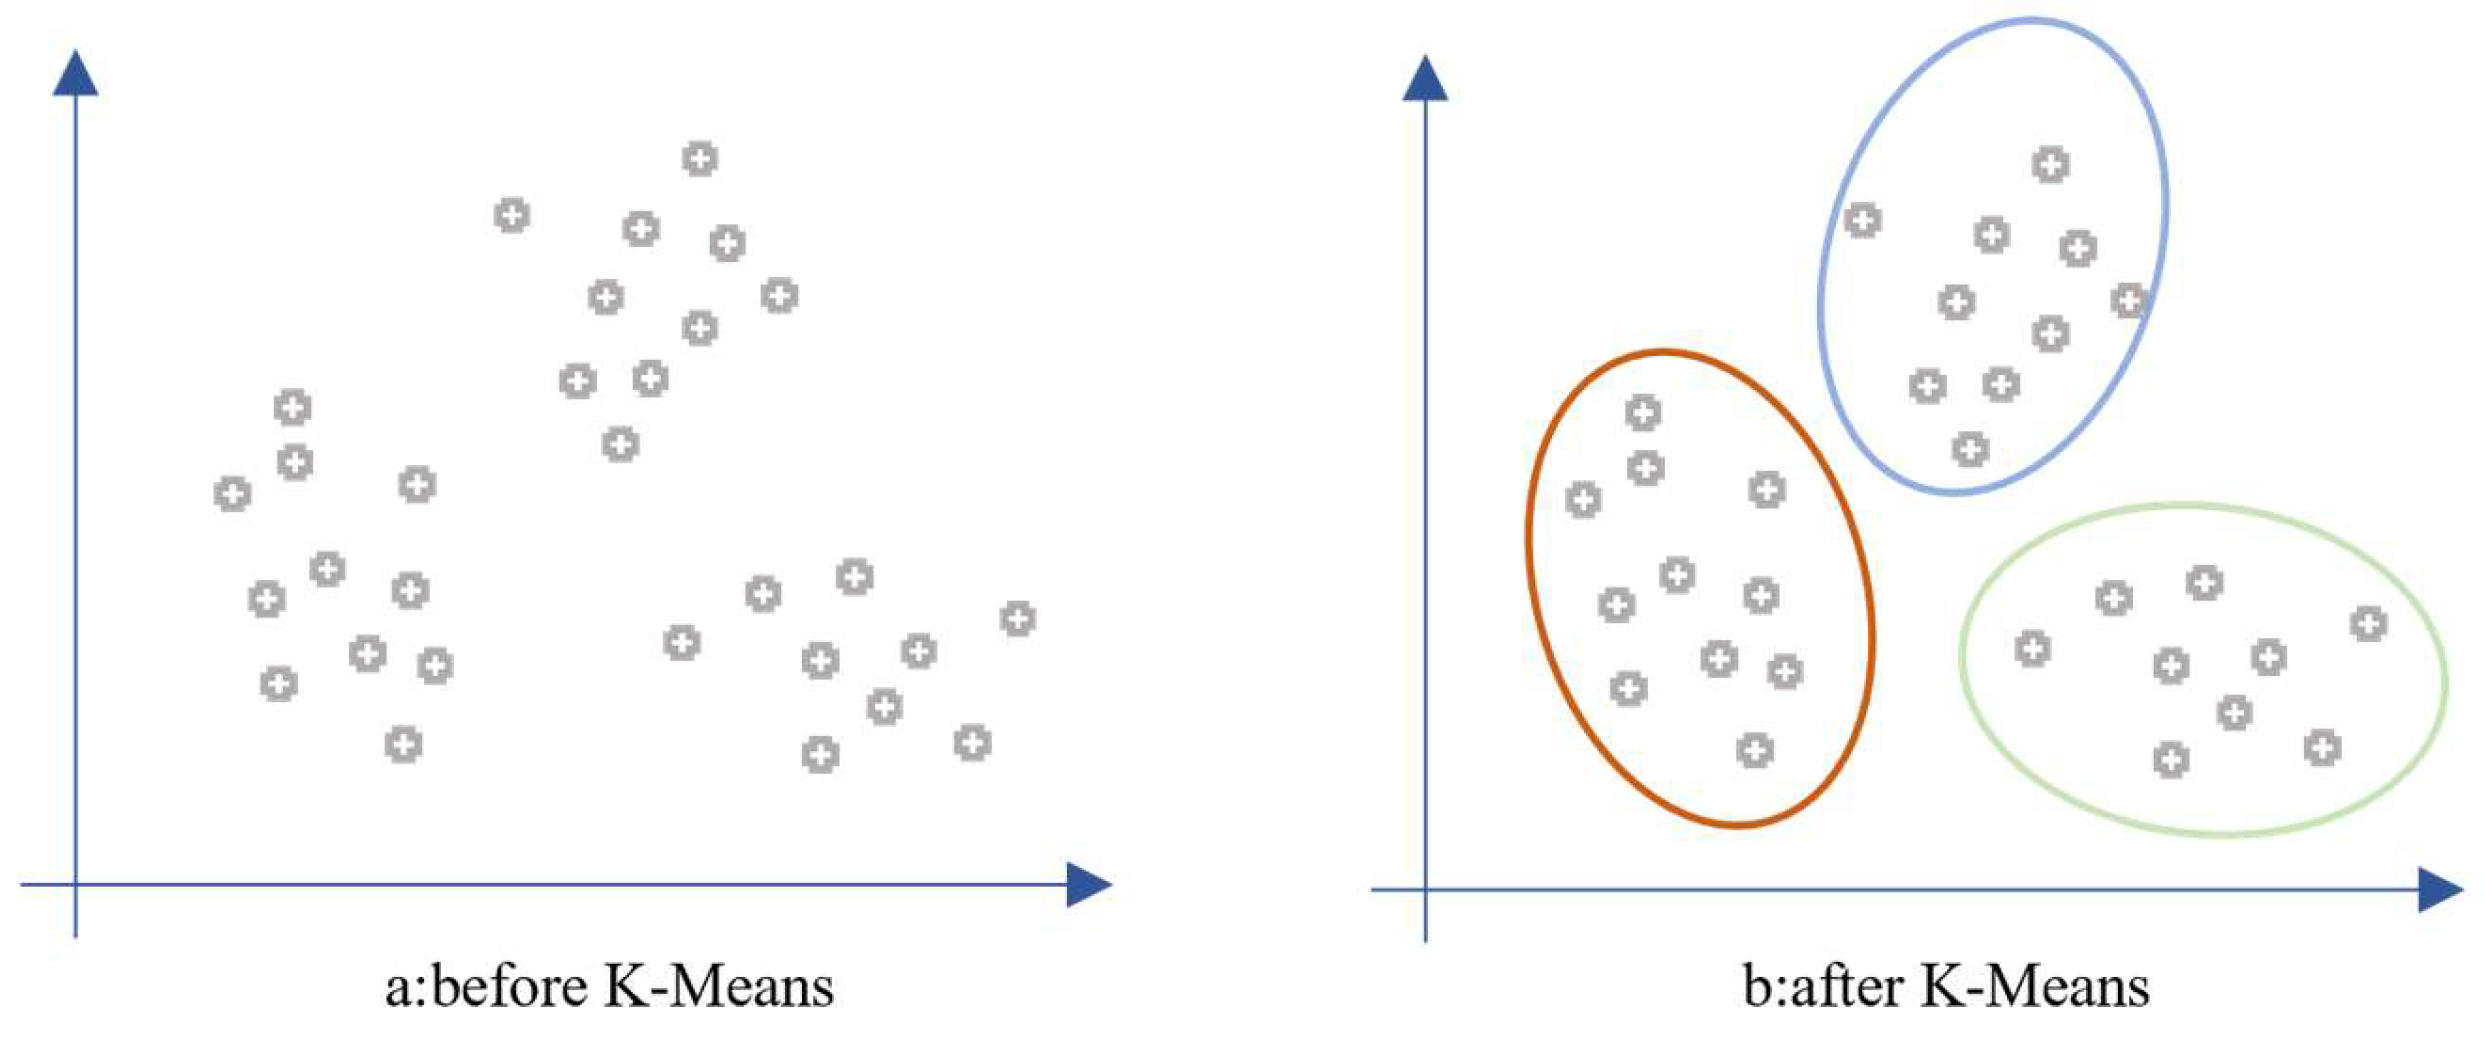
2.2.1. K-Means Method
2.2.2. Parameters of Old Residential Prototypes
2.3. Energy Consumption Prediction Model
2.4. Mapping Energy Consumption
3. Results
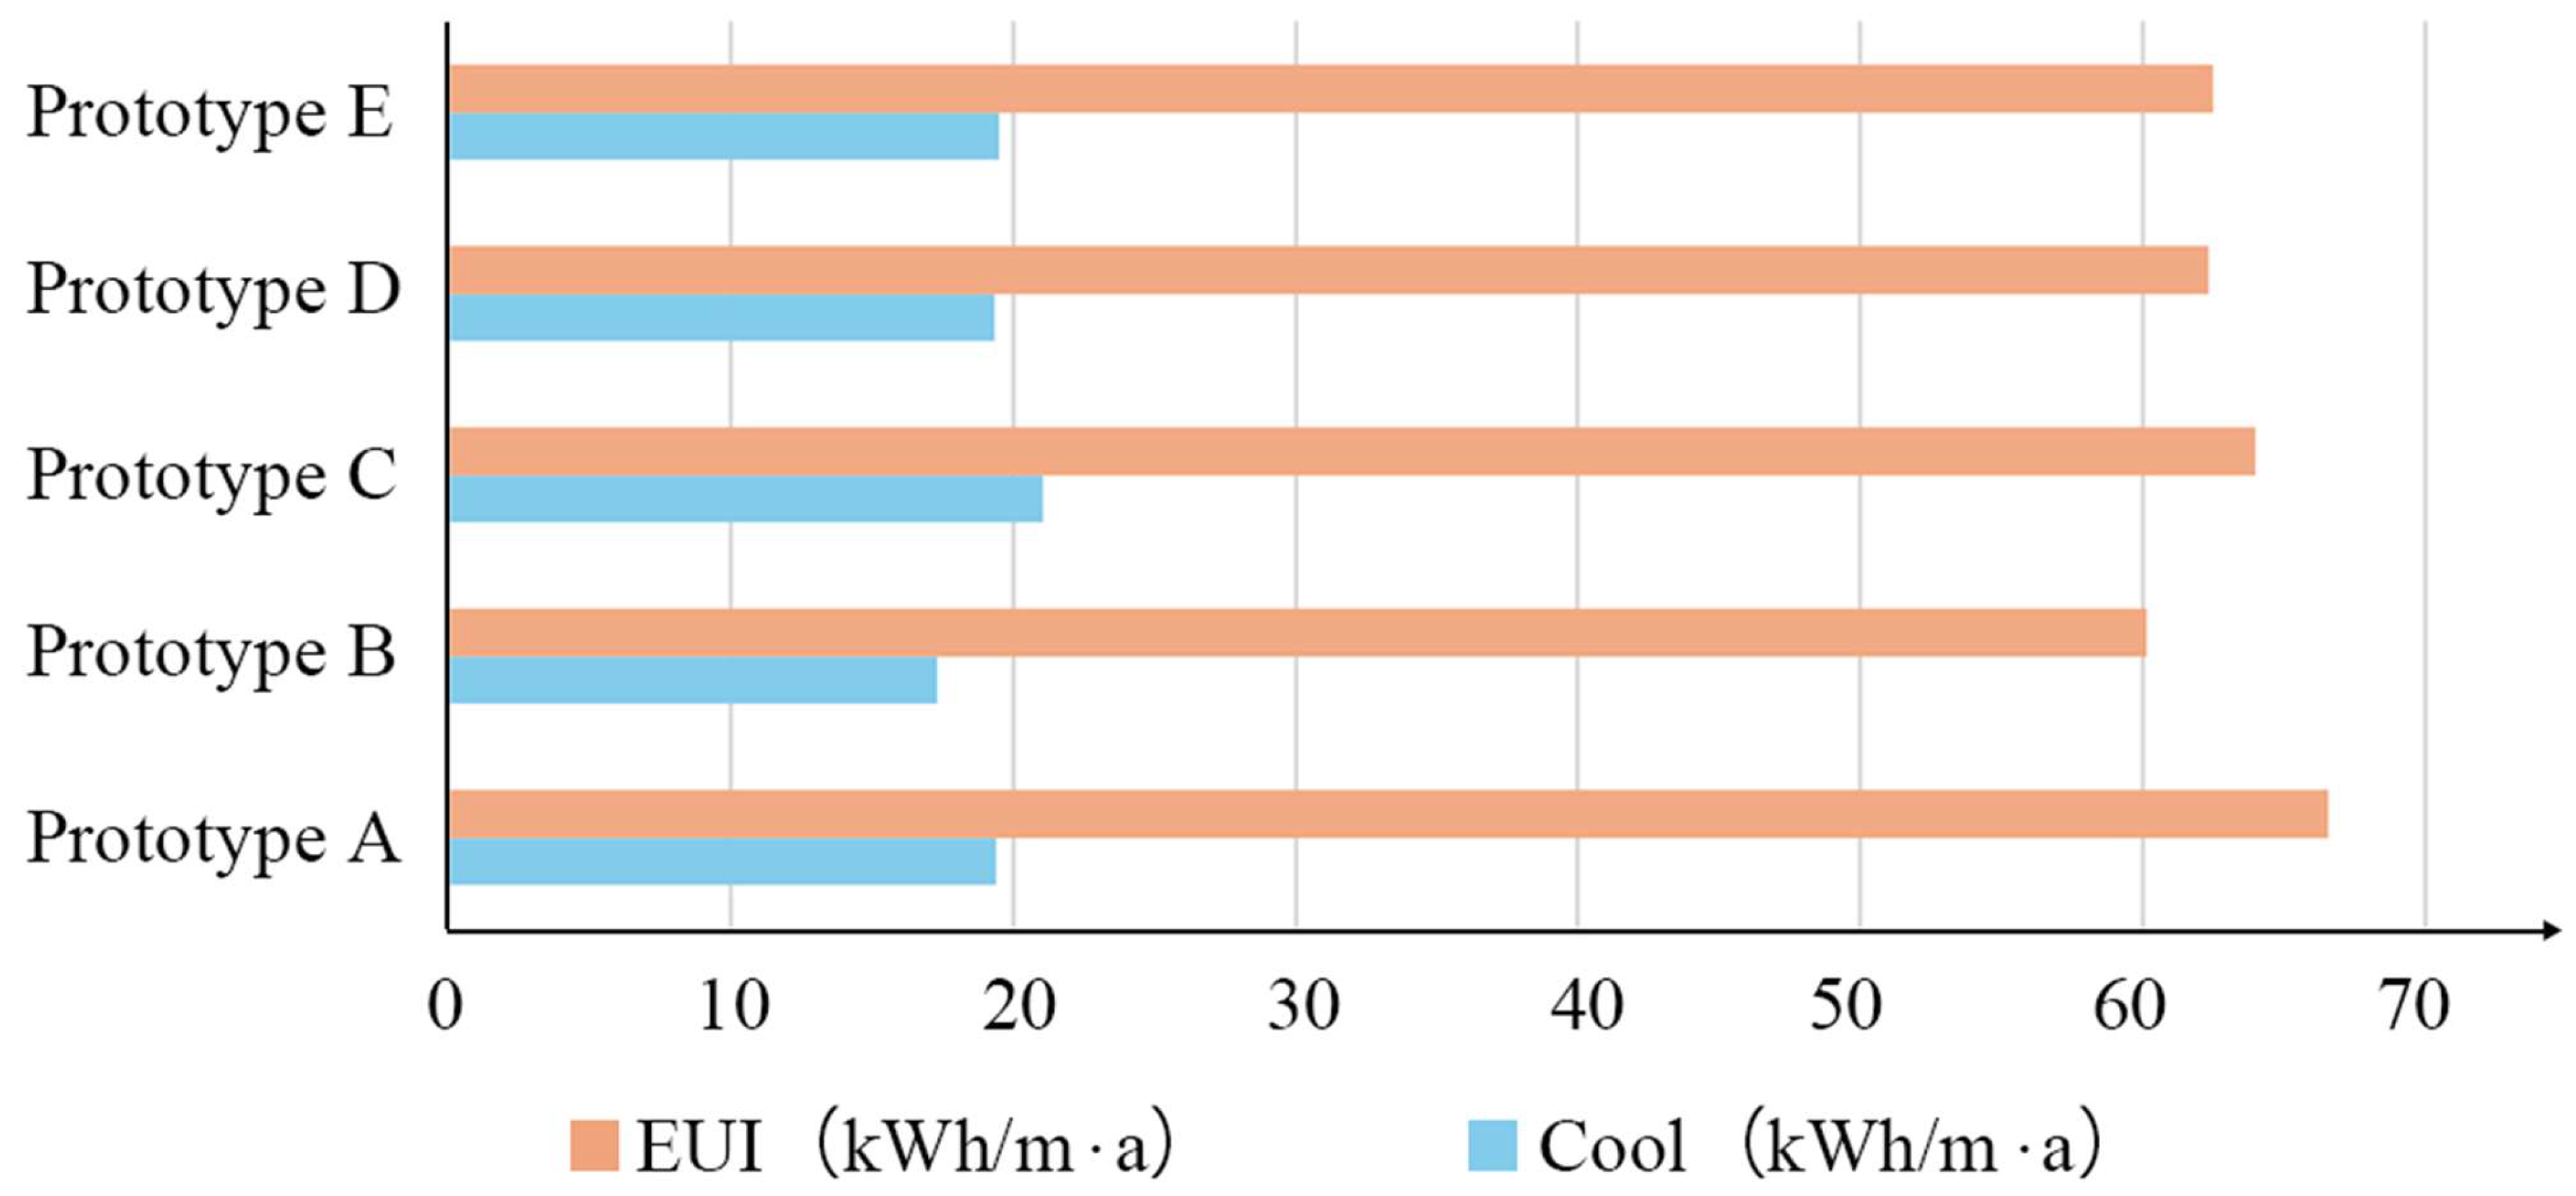
3.1. Energy Consumption of Prototypes
3.2. Prediction of Building Energy Consumption at City Scale
3.2.1. Comparison of Different Prediction Models
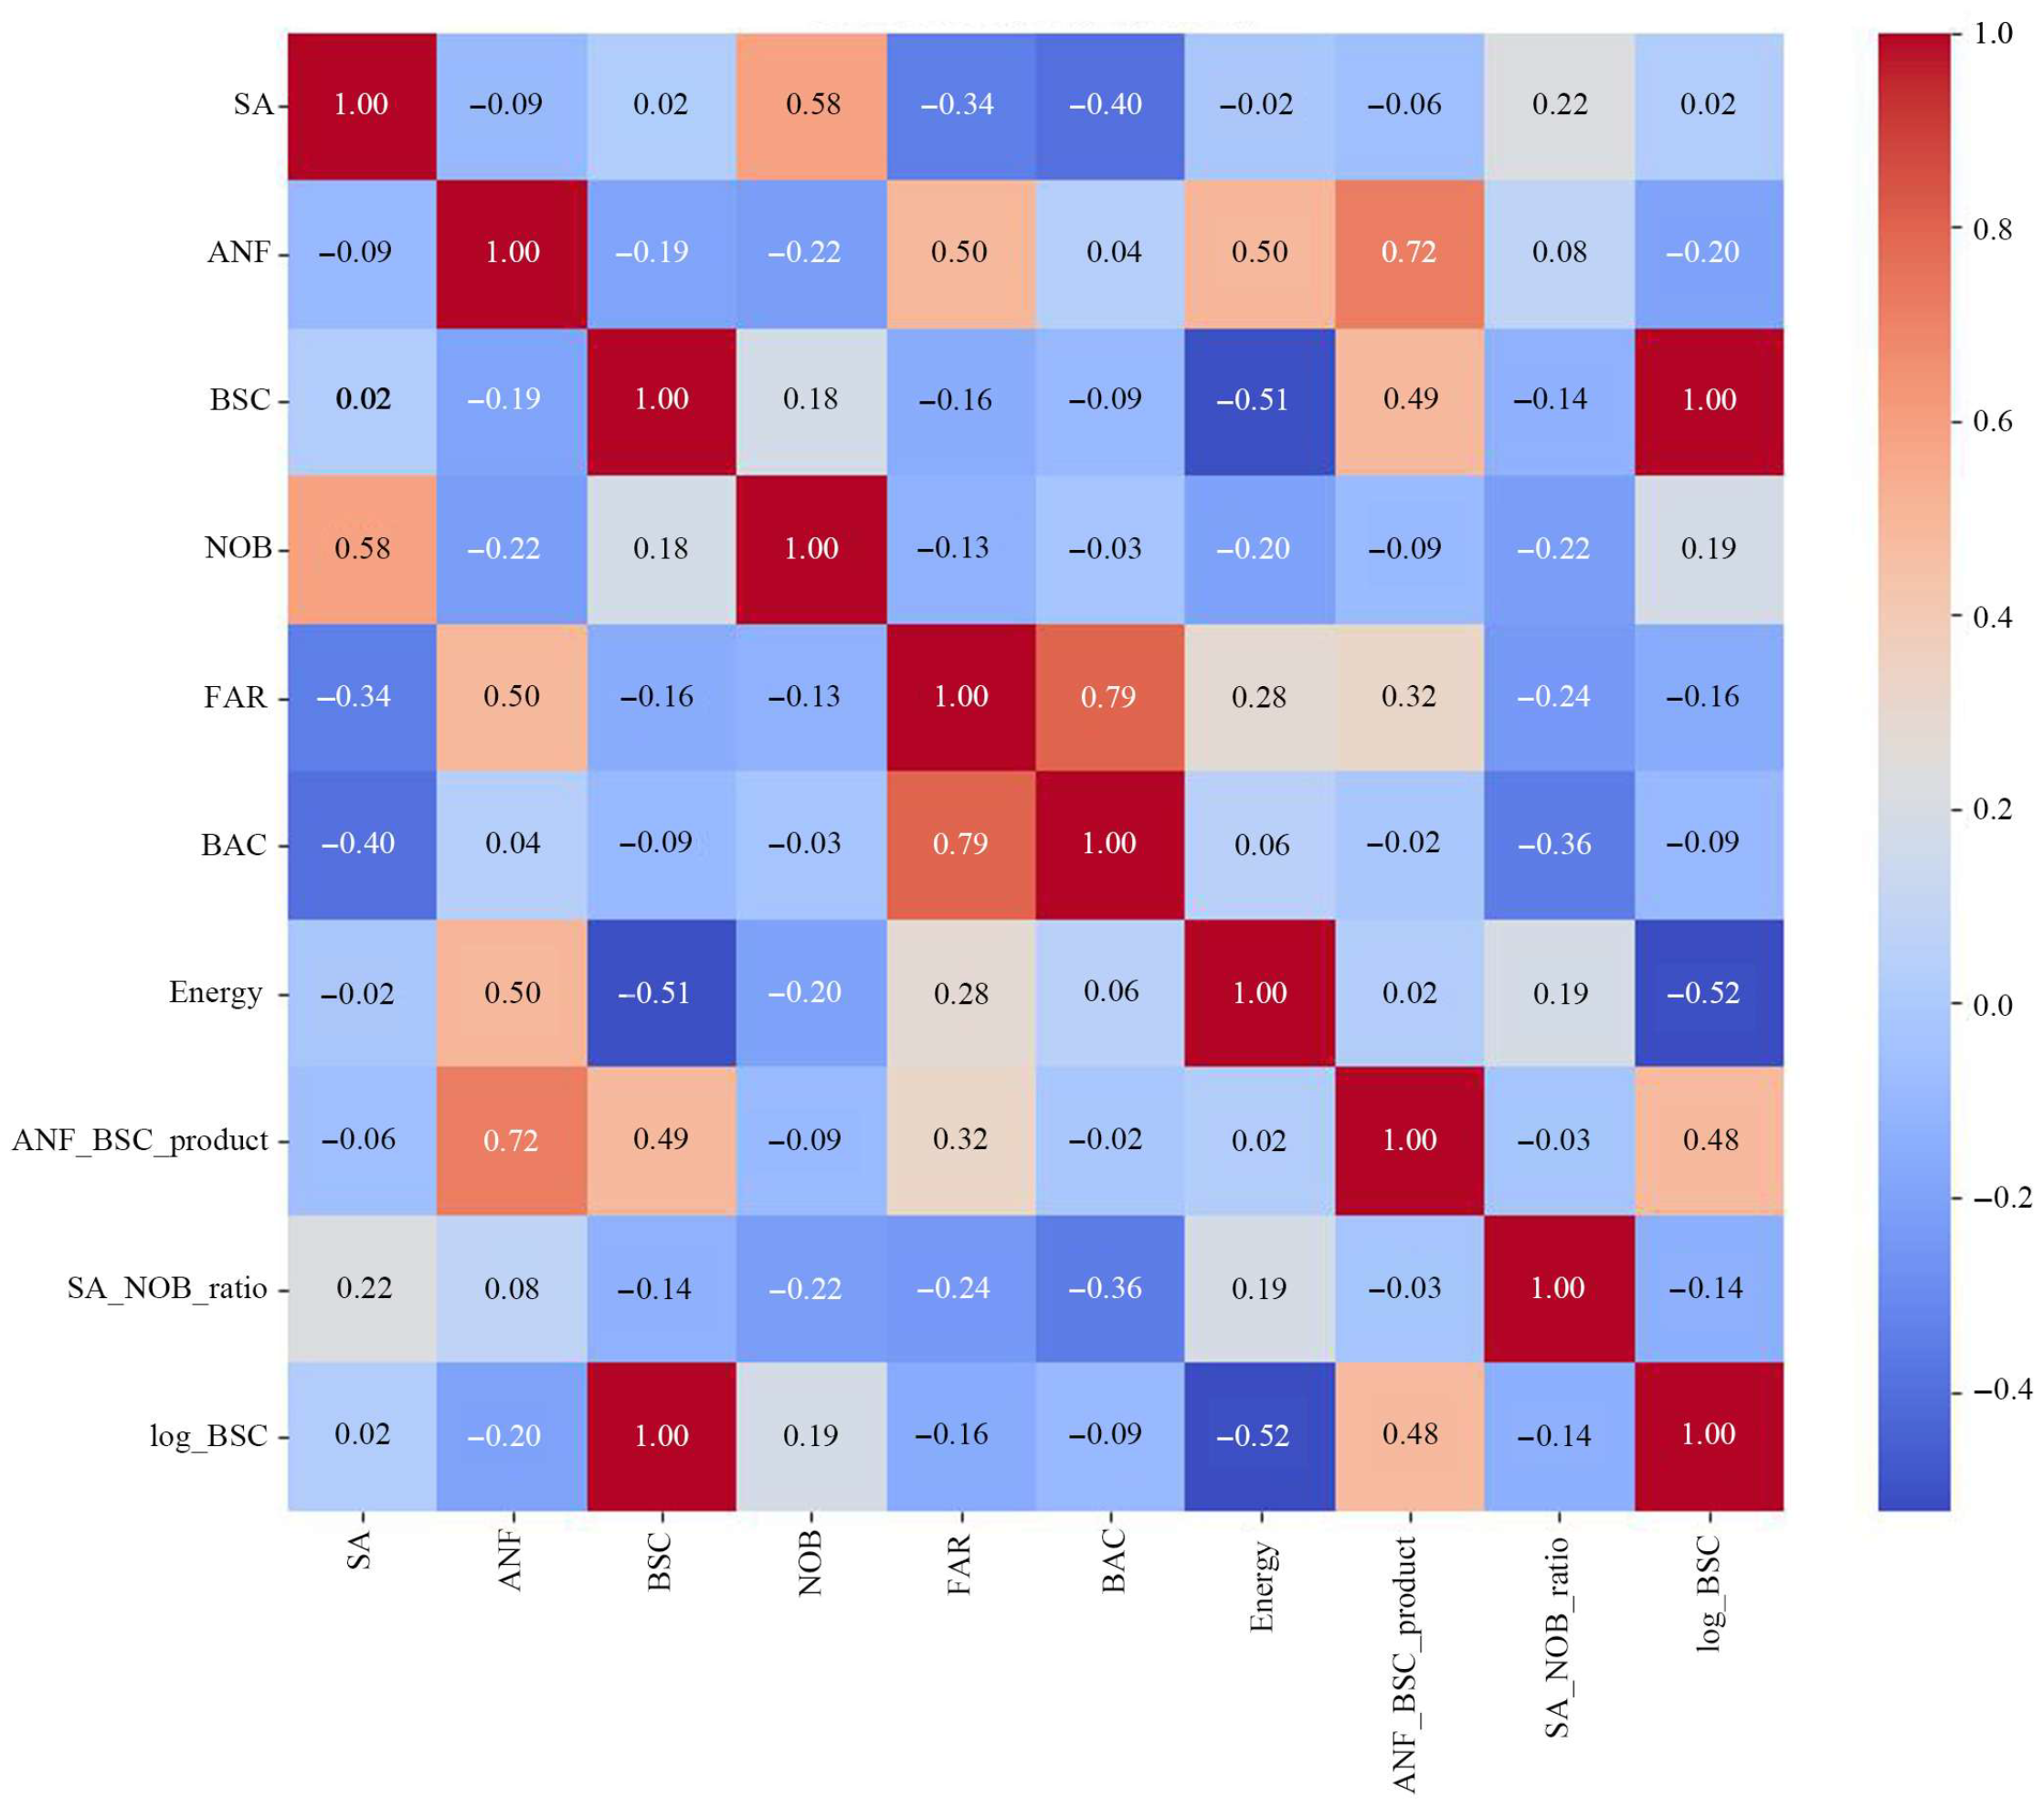
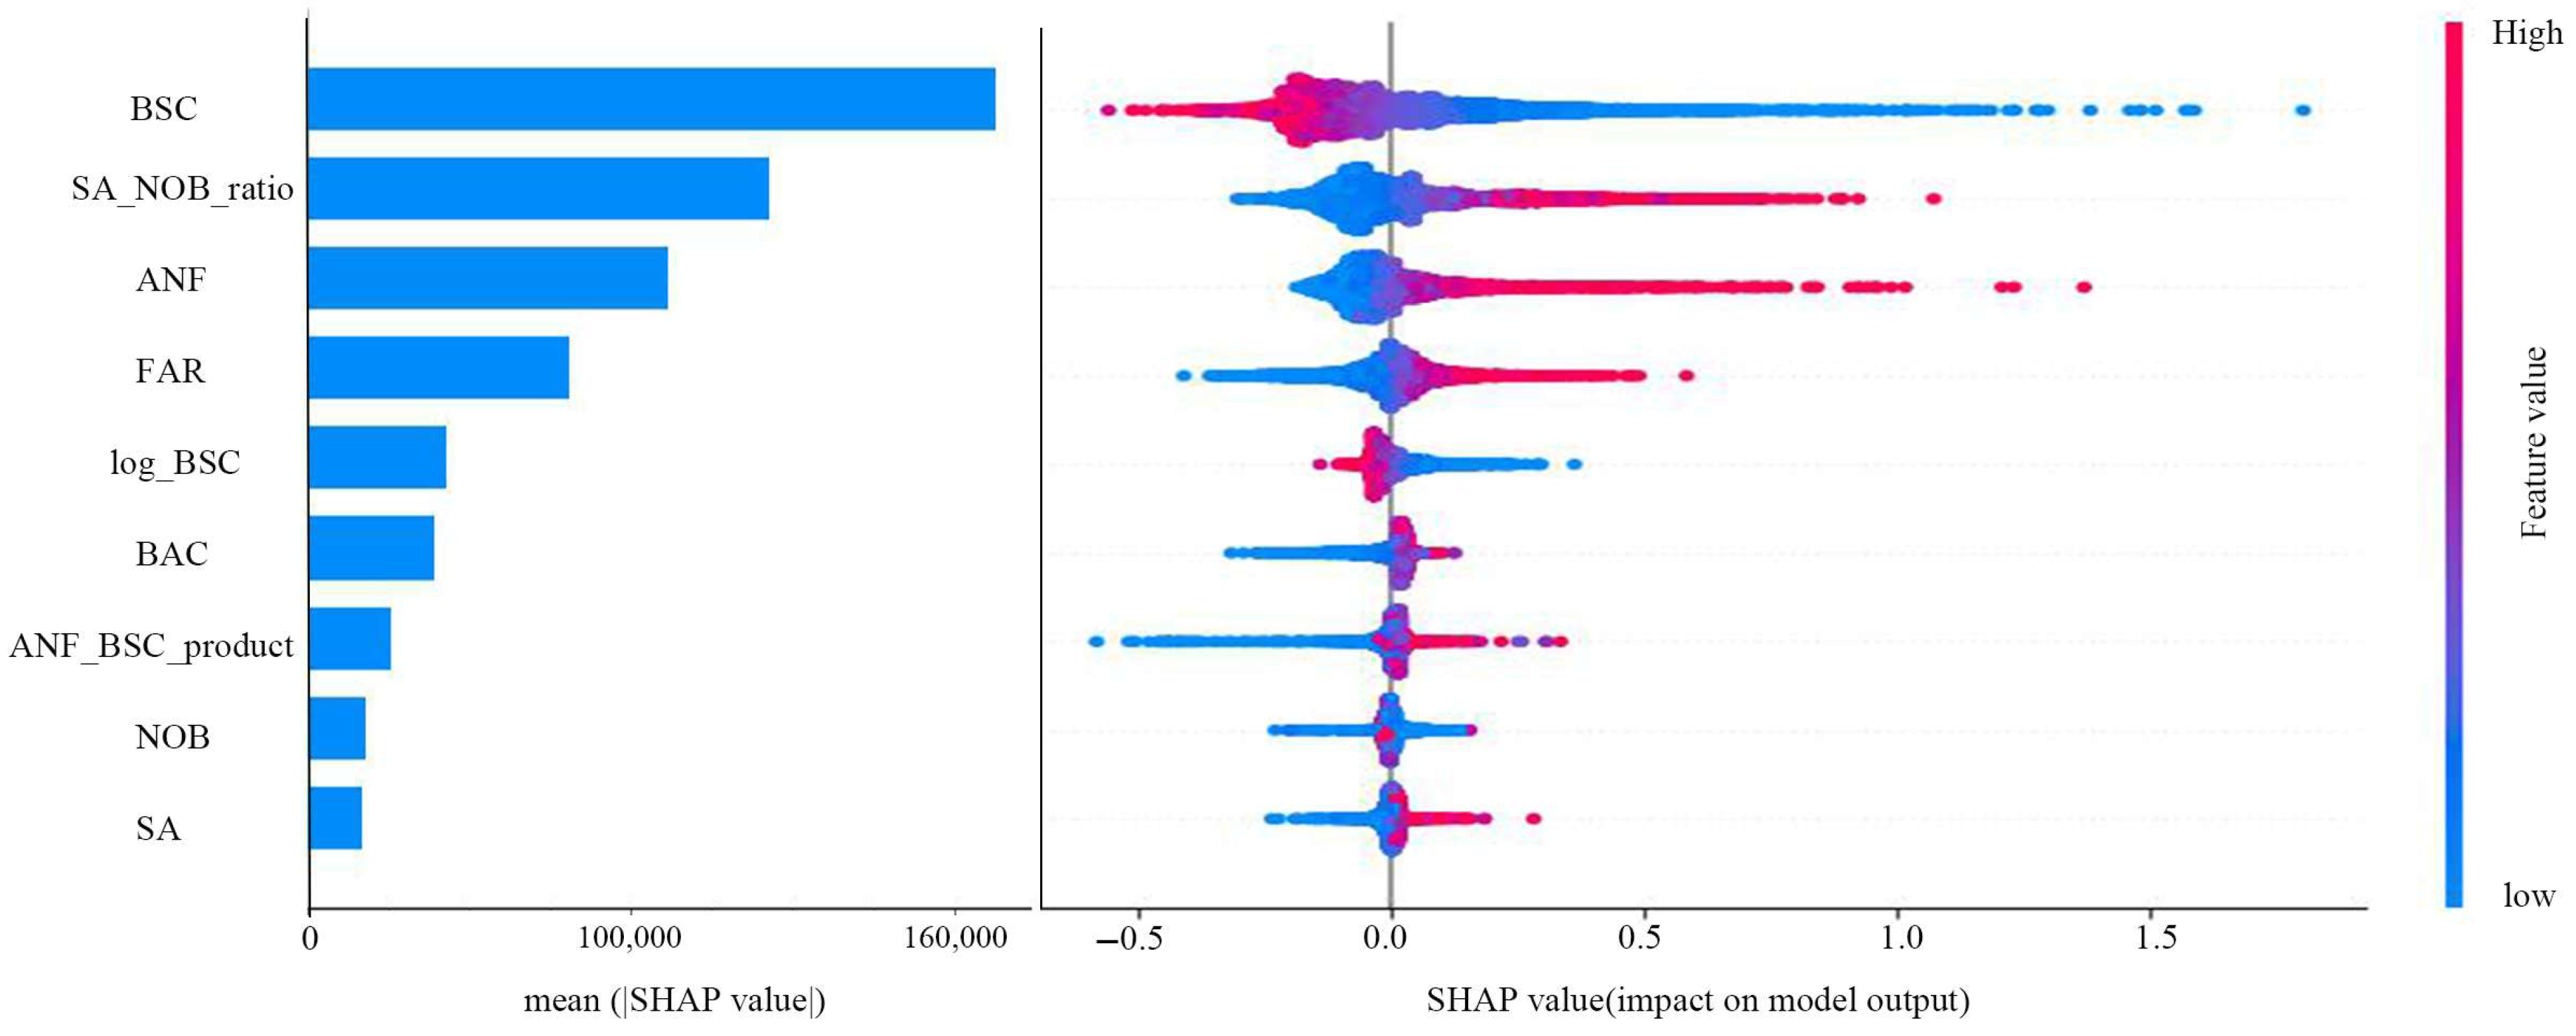
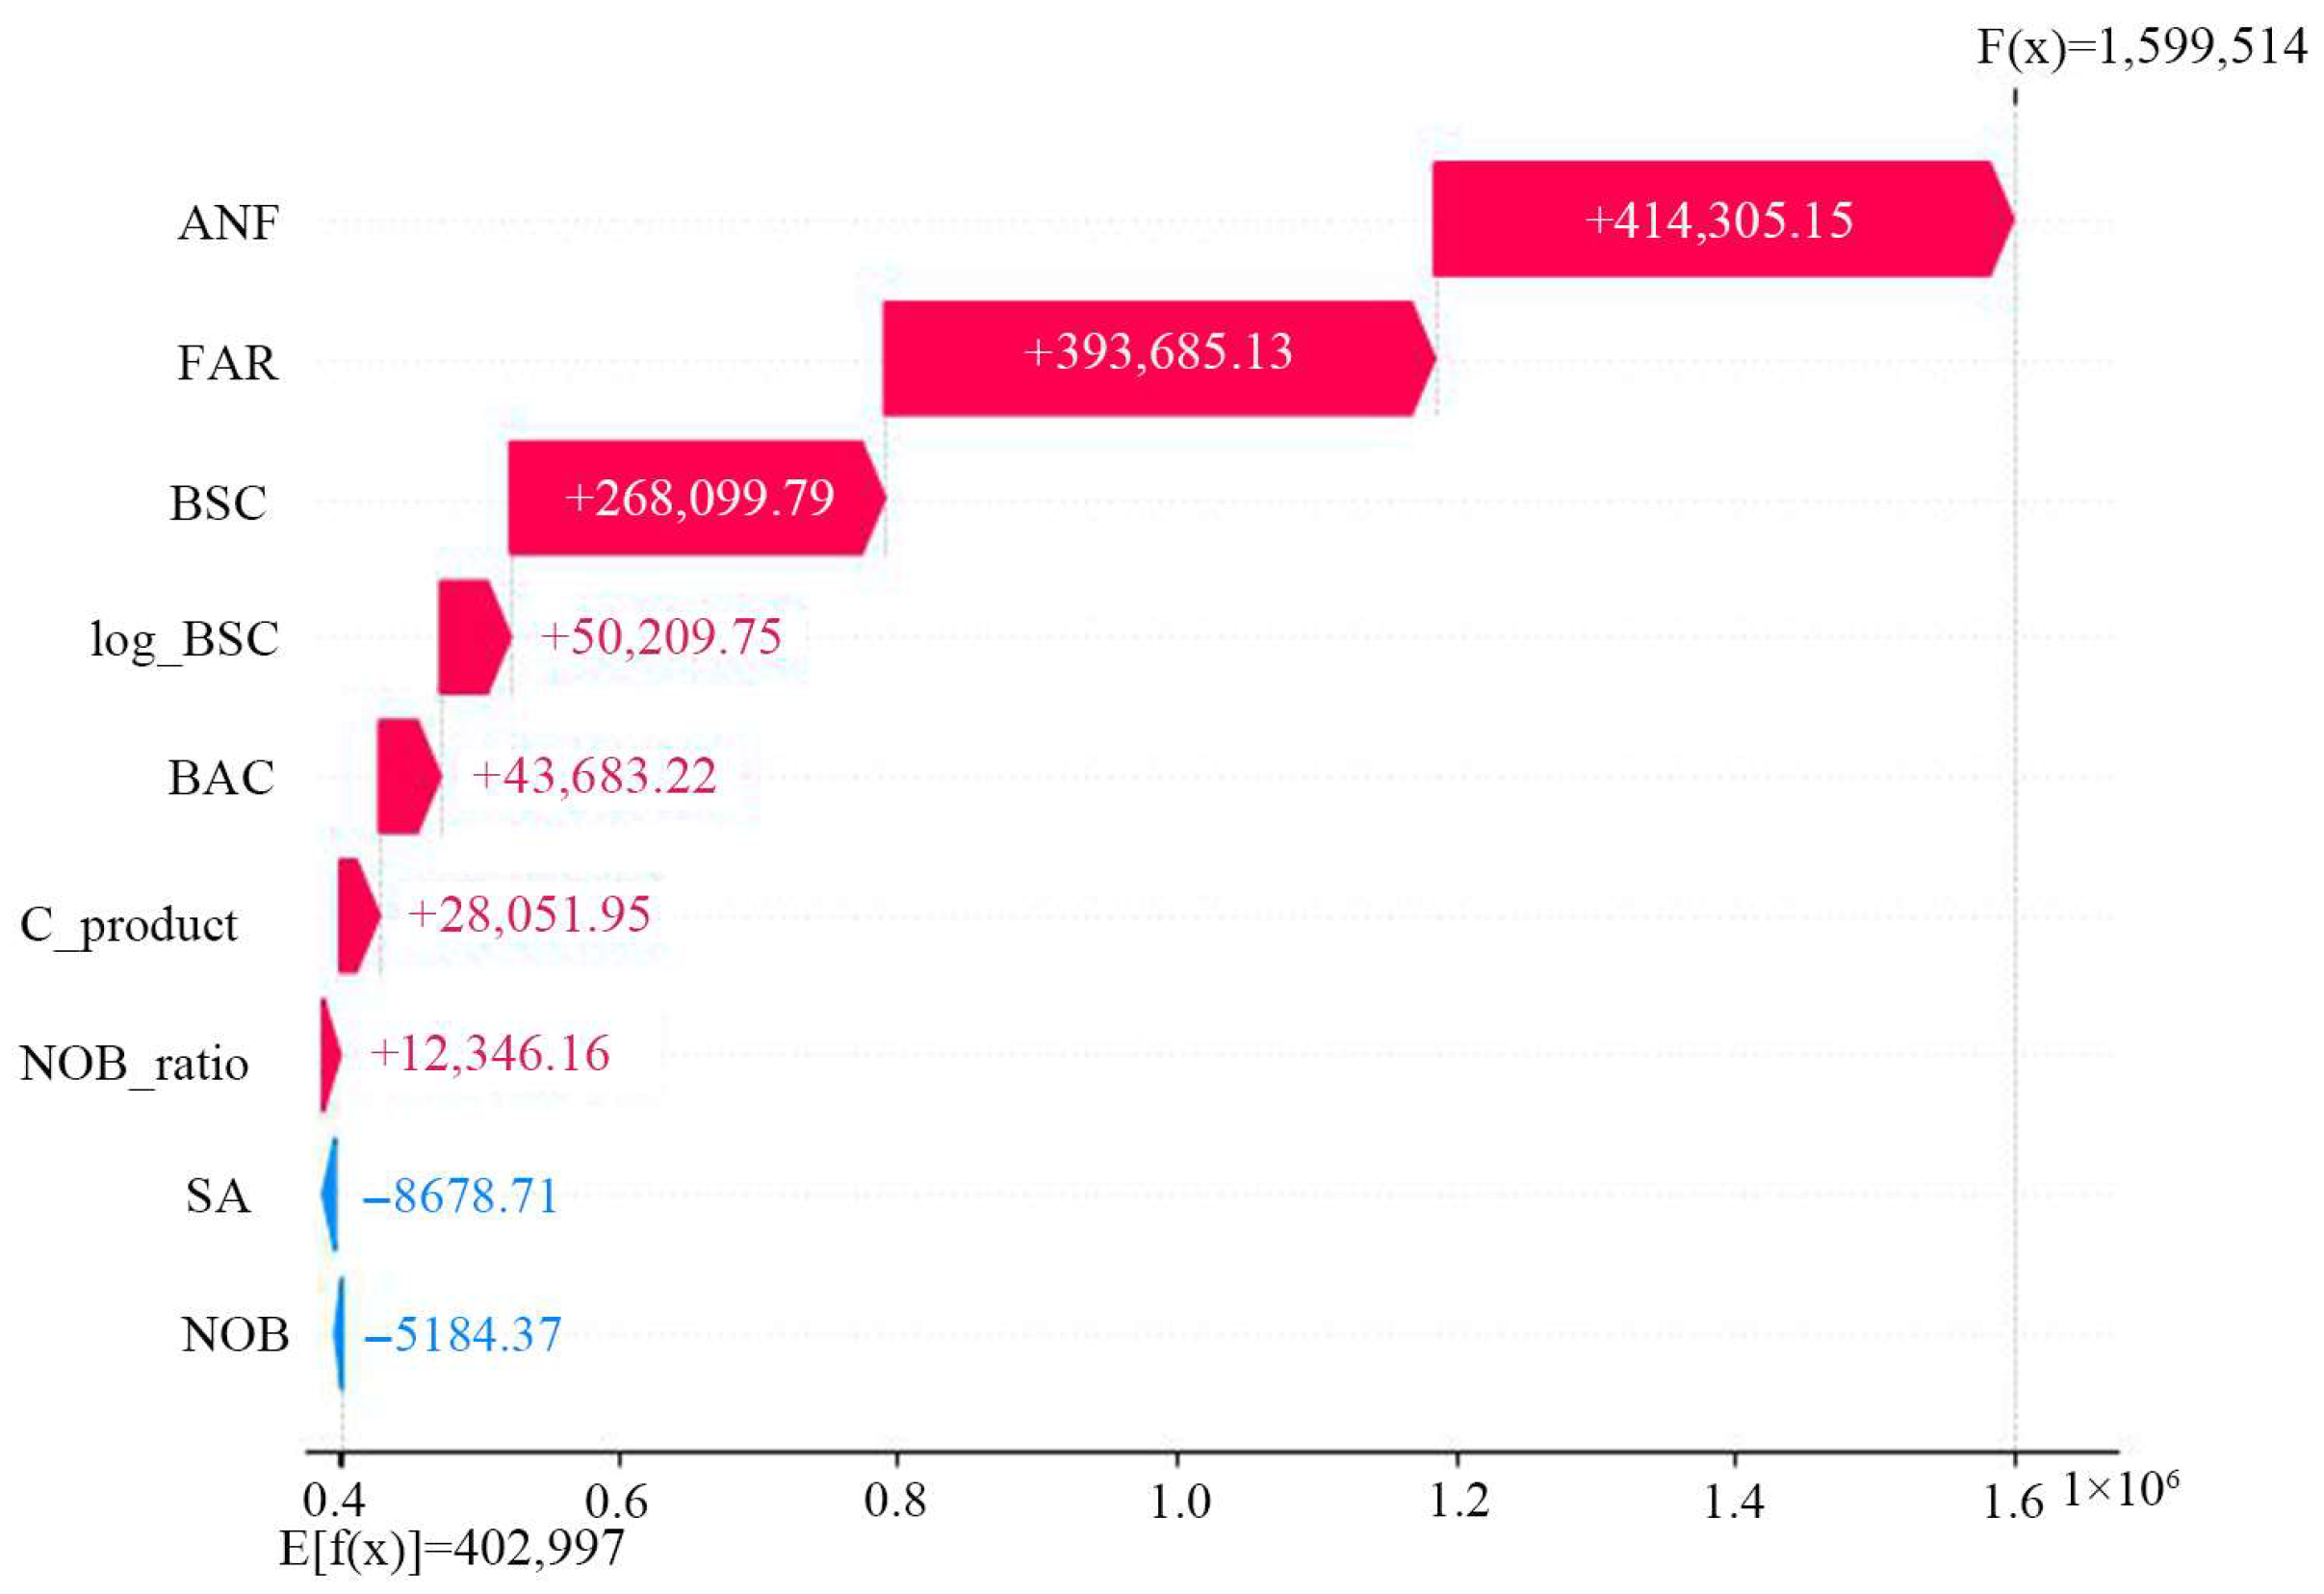
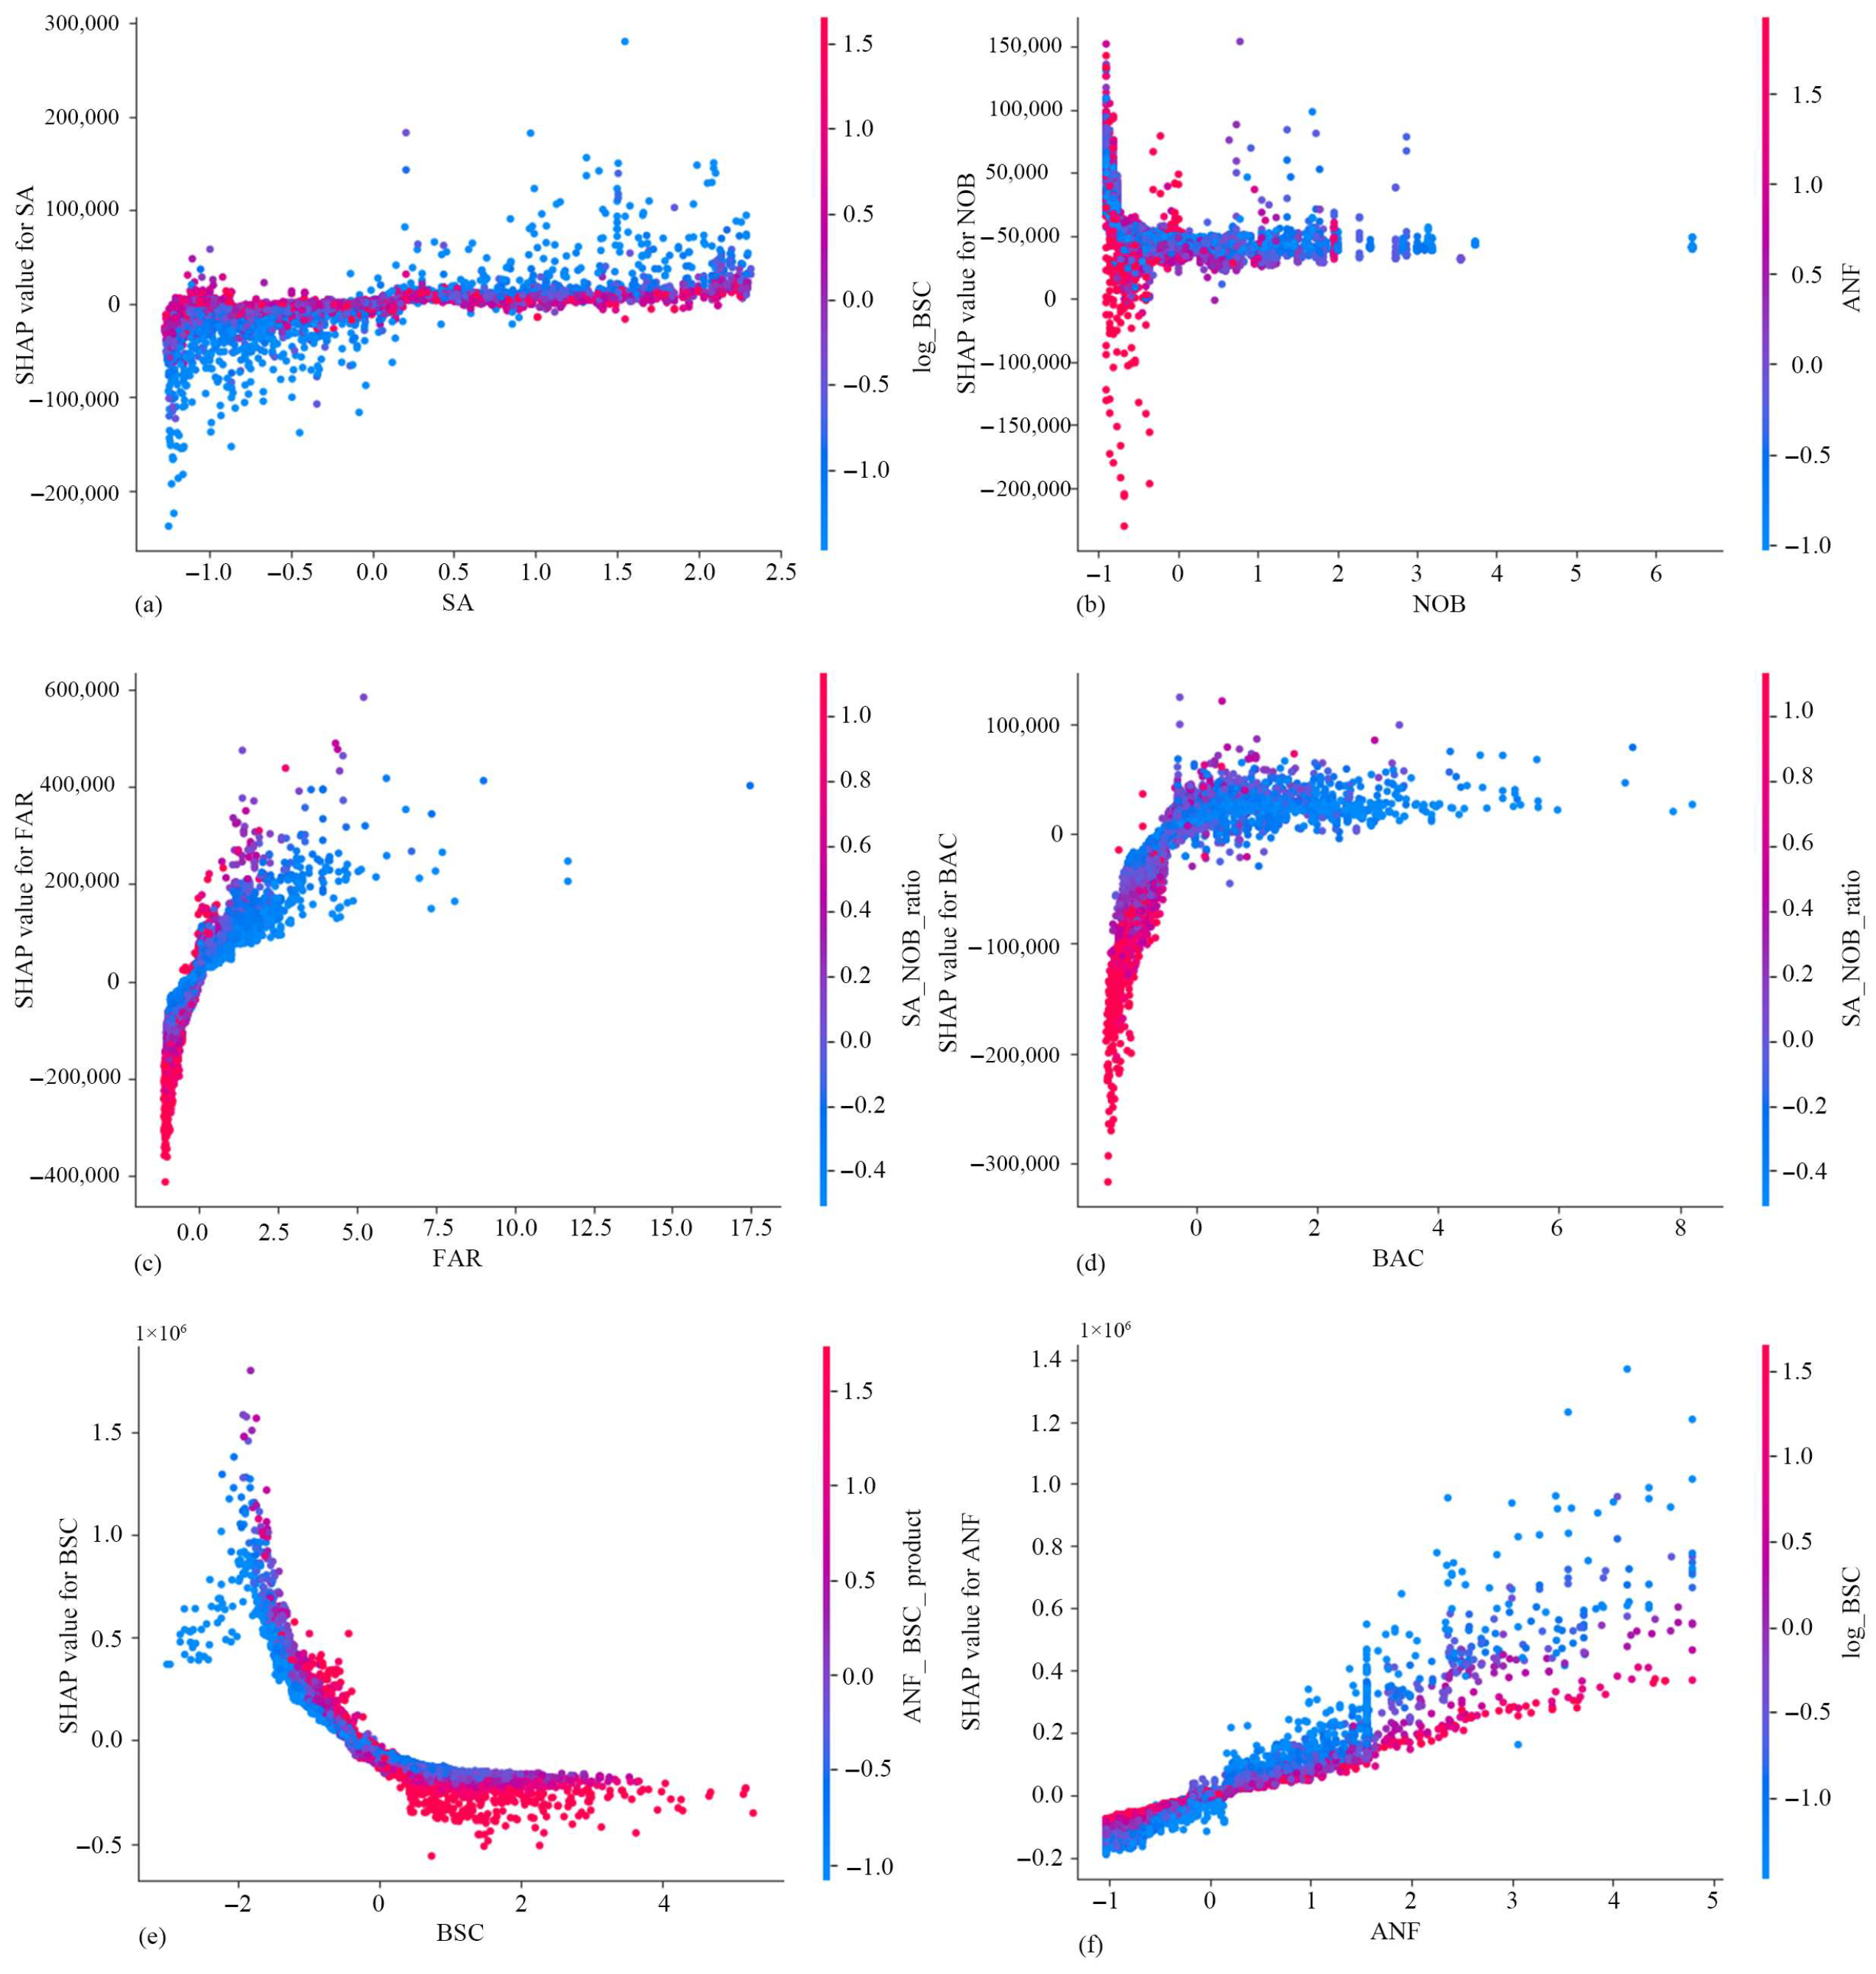
3.2.2. Analysis of Influencing Factors
3.3. Analysis of Old Residential Building Energy Consumption
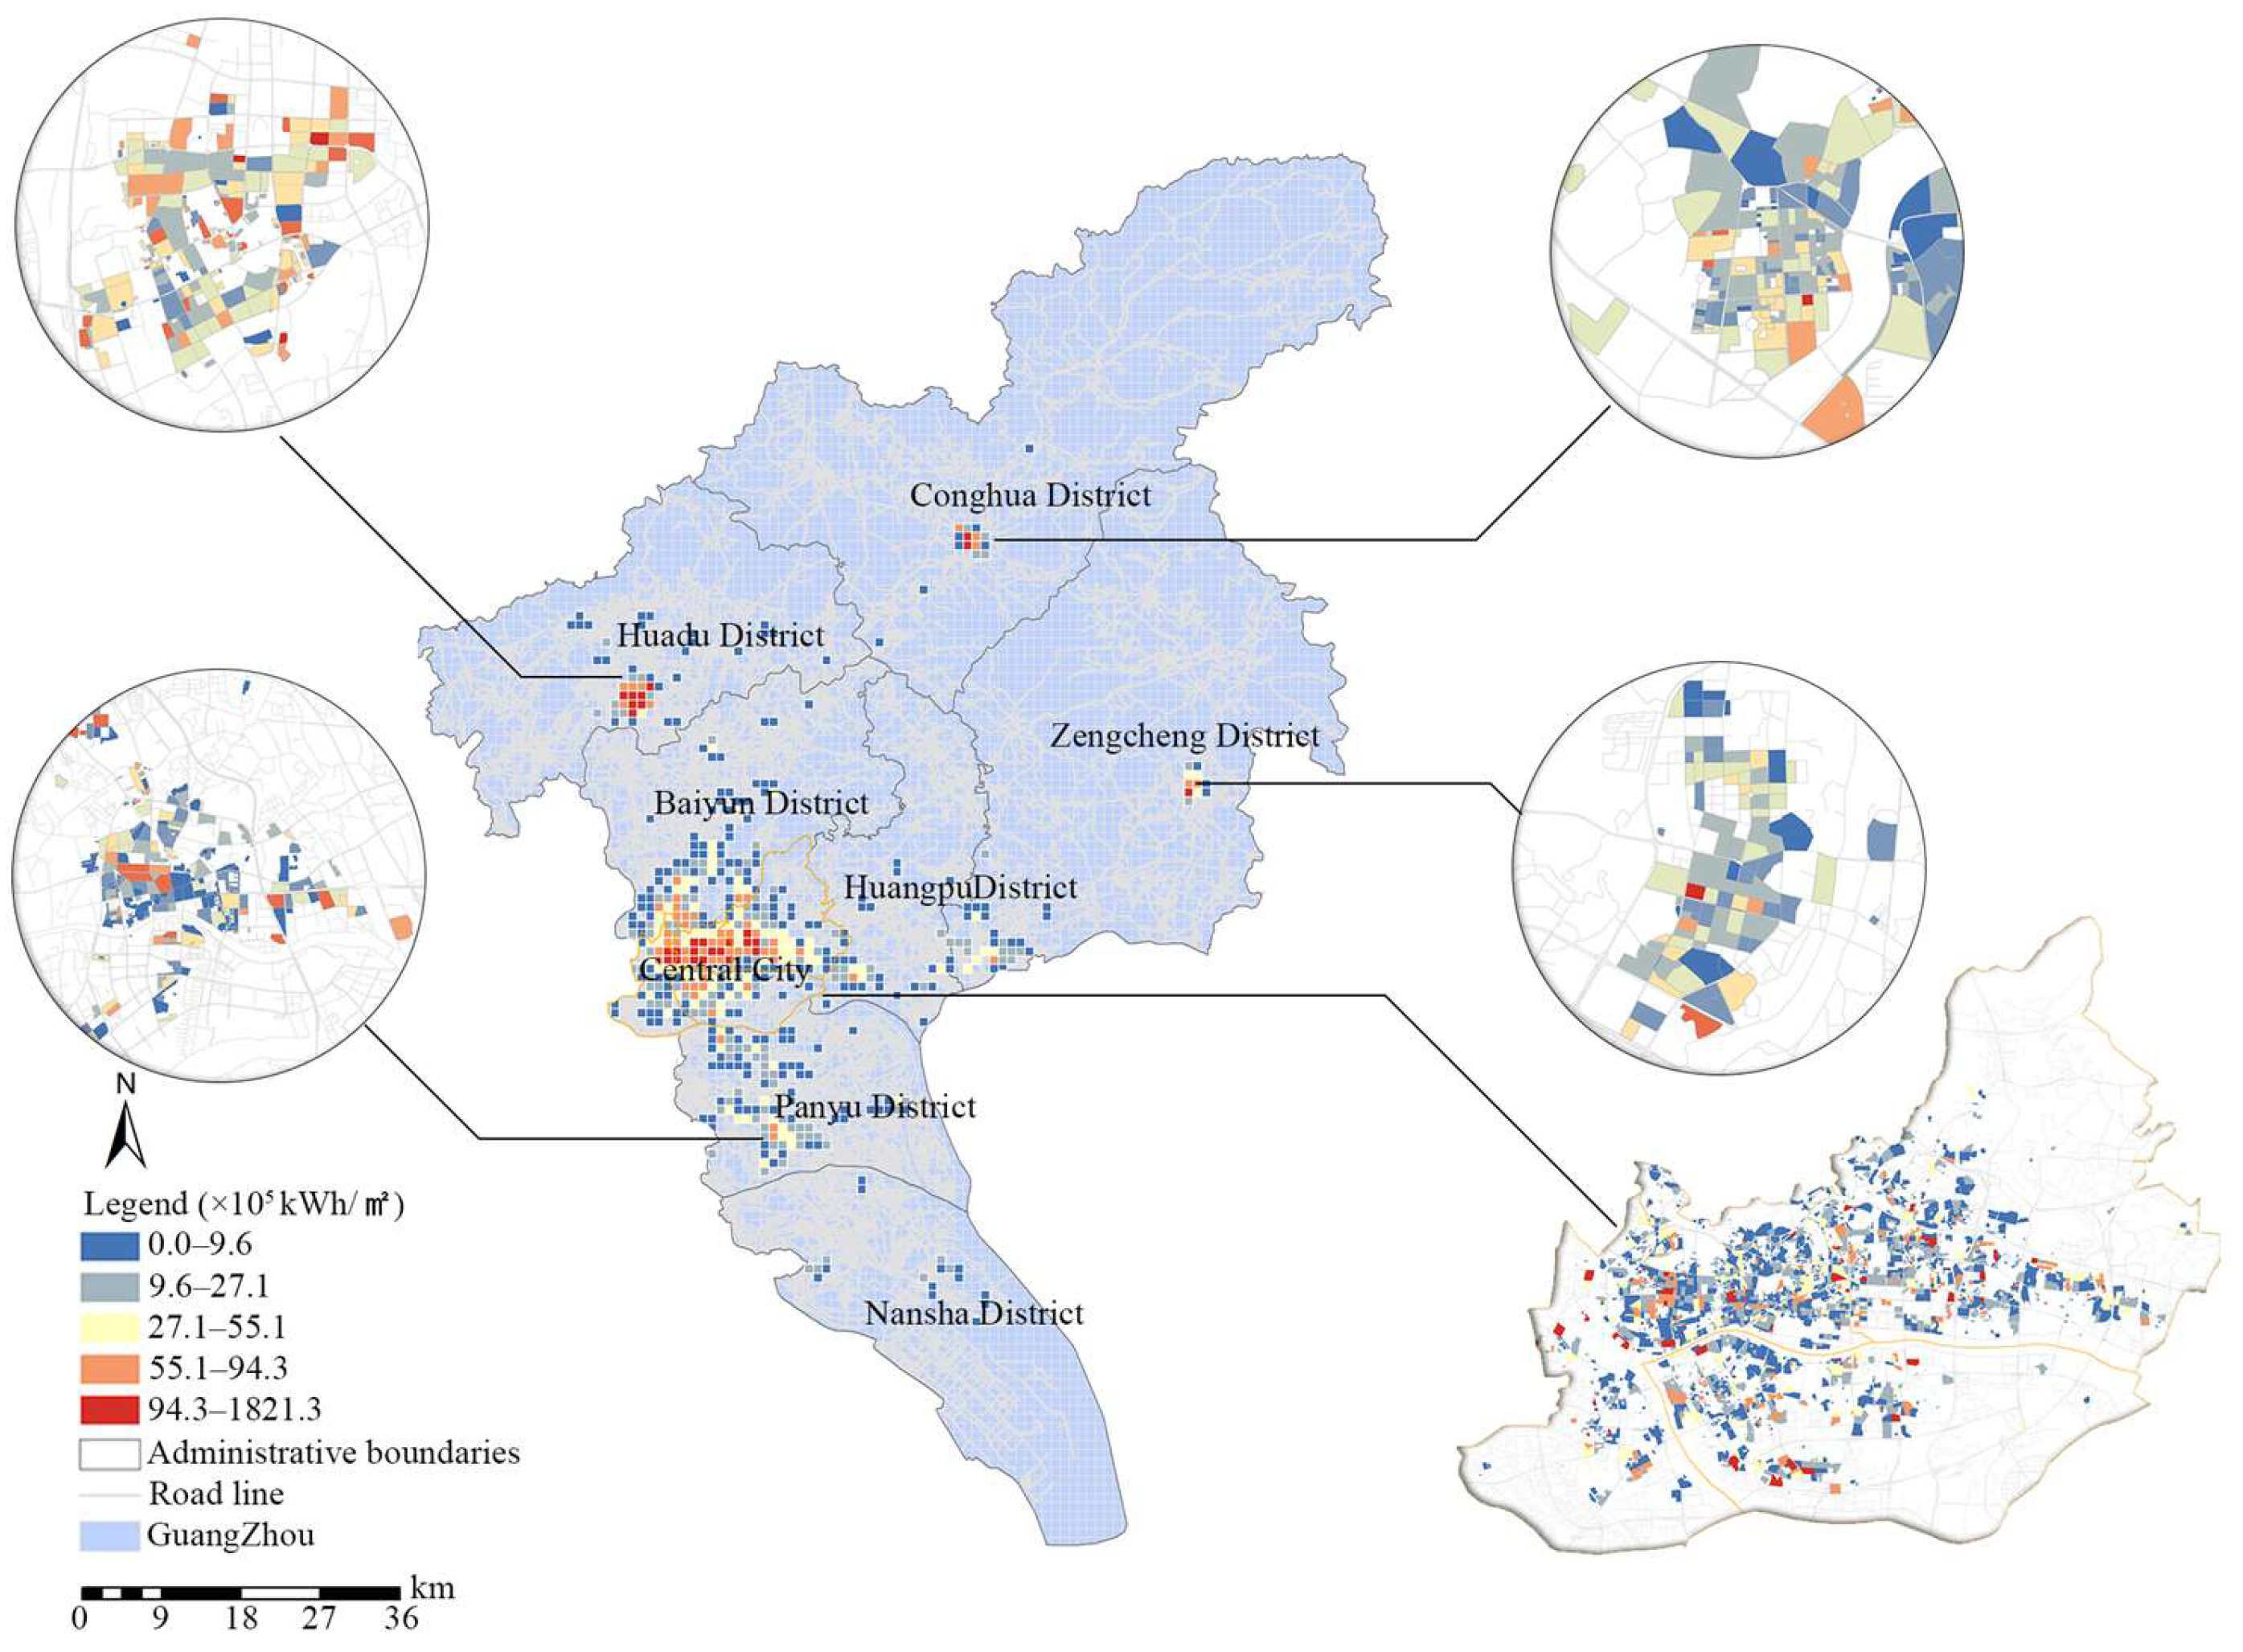
3.3.1. Energy Consumption Analysis at Urban Scale
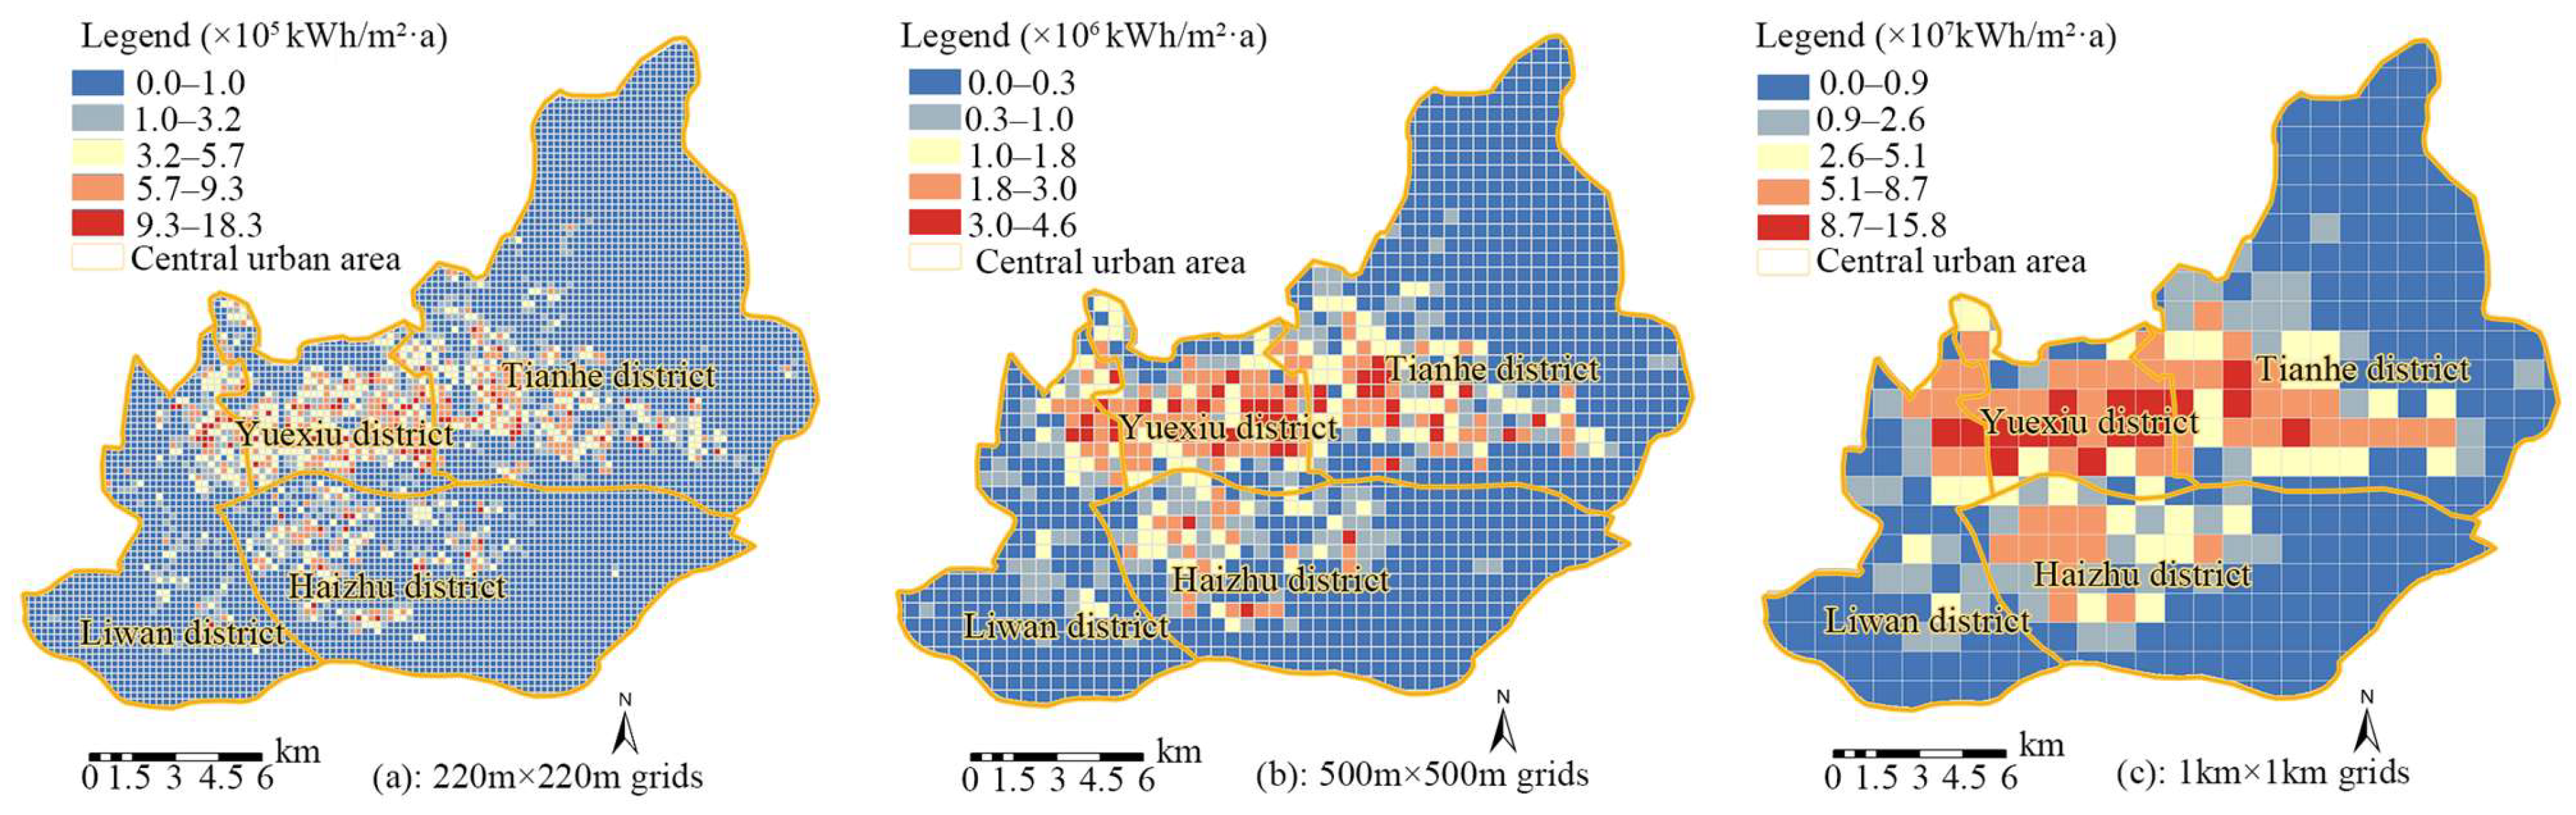
3.3.2. Energy Consumption Differences Under Different Grids
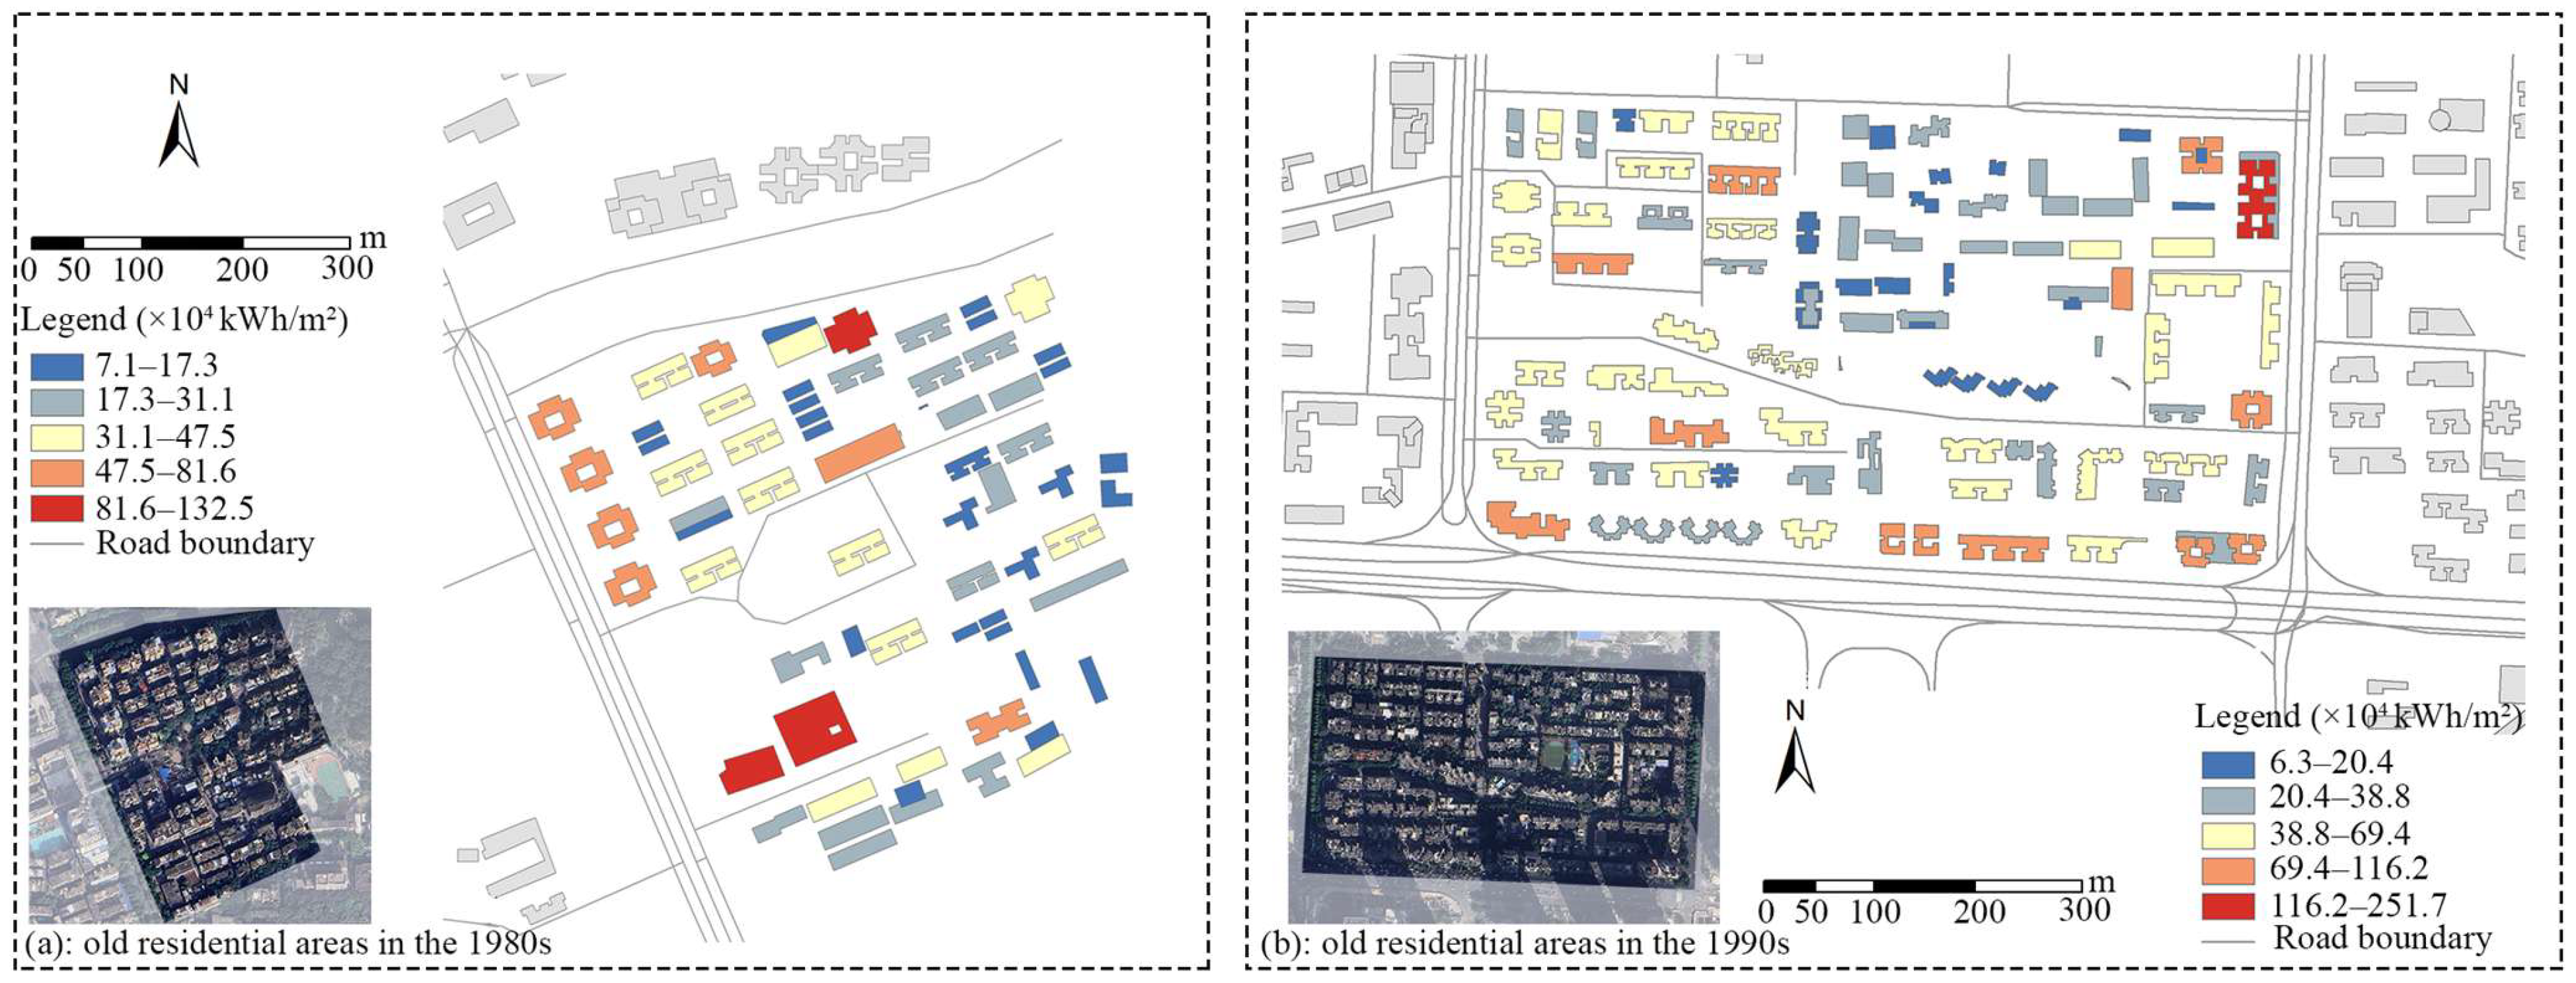
3.3.3. Energy Consumption of Different Prototypes
4. Discussion
5. Conclusions
- Pre-2003 residential buildings were identified from 706,188 building outlines in Guangzhou using AOI data and internet housing data. This identification method was validated with 90% accuracy, yielding a total of 31,209 confirmed pre-2003 residential buildings;
- Five representative prototypes exhibited cooling energy use (17.32–21.05 kWh/m2) and annual electricity EUI (60.10–66.53 kWh/m2), scalable to city-scale energy assessment for low-carbon planning;
- A prediction model establishing the correlation between urban morphological factors and energy consumption was developed. The reliability of the XGBoost model was confirmed through cross-validation and its predictive accuracy for energy consumption. Model performance demonstrated that the XGBoost algorithm (R2 = 0.667) outperformed the RF model. Furthermore, a strong positive correlation (r = 0.79) was identified between BSC and the energy consumption of old residential buildings;
- Spatial analysis of Guangzhou’s old residential buildings revealed distinct energy consumption patterns: Huadu Central District exhibited peak intensity (27.1–94.3 × 10⁵ kWh/m2), while Nansha and Huangpu showed relatively lower consumption levels. Multi-scale grid analysis (ranging from 220 m to 1 km) identified Yuexiu as the highest energy consumption zone, with peak values reaching up to 18.3 × 10⁵ kWh/m2·a at 220 m resolution. Prototype energy simulations of 1980s–1990s communities indicated that building envelope was the key inefficiency factor.
Author Contributions
Funding
Data Availability Statement
Conflicts of Interest
Abbreviations
| XGBoost | eXtreme Gradient Boosting |
| RF | Random Forest |
| SHAP | Shapley Additive Explanations |
| BSC | Building Shape Factor |
| EUI | Energy Use Intensity |
| SN | Building Serial Number |
| SA | Site Area |
| SHGC | Solar Heat Gain Coefficient |
| SEER | Seasonal Energy Efficiency Ratio |
| ANF | Average number of building floors |
| NoB | Number of Buildings |
| BCR | Building Coverage Ratio |
| FAR | Floor Area Ratio |
| MSE | Mean Squared Error |
References
- WCR PR Chinese Press Release. wuf.unhabitat. 2022. Available online: https://wuf.unhabitat.org/sites/default/files/2022-06/files/WCR-PR-Chinese-press-release-29-06-2022.pdf (accessed on 20 June 2025).
- Zou, B.; Fan, C.; Wang, M.; Li, J.; Zhou, X.; Liao, Y. How Do Urban-Rural and Regional Summer Heat Exposures Evolve? A Case Study of 301 Cities in China from 2000 to 2020. Build. Environ. 2025, 271, 112584. [Google Scholar] [CrossRef]
- Wang, Z.; Hong, Y.; Huang, L.; Zheng, M.; Yuan, H.; Zeng, R. A Comprehensive Review and Future Research Directions of Ensemble Learning Models for Predicting Building Energy Consumption. Energy Build. 2025, 335, 115589. [Google Scholar] [CrossRef]
- Statistical Communiqué of the People’s Republic of China on National Economic and Social Development in 2024; National Bureau of Statistics: Beijing, China, 2025.
- Annual Research Report on China Building Energy Efficiency 2025 (Urban Residential Buildings Special Topic); Tsinghua University Building Energy Research Center: Beijing, China, 2025.
- Action Plan for Carbon Dioxide Peaking Before 2030; Department of Resource Conservation and Environmental Protection: Beijing, China, 2021.
- Peng, Z.; Sun, Q.; Li, P.; Sun, F.; Ren, S.; Guan, R. The Environmental Impact of the Entire Renovation Process of Urban Aged Residential Buildings in China. IJBPA 2024. [Google Scholar] [CrossRef]
- Dahlström, L.; Broström, T.; Widén, J. Advancing Urban Building Energy Modelling through New Model Components and Applications: A Review. Energy Build. 2022, 266, 112099. [Google Scholar] [CrossRef]
- Ferrando, M.; Causone, F.; Hong, T.; Chen, Y. Urban Building Energy Modeling (UBEM) Tools: A State-of-the-Art Review of Bottom-up Physics-Based Approaches. Sustain. Cities Soc. 2020, 62, 102408. [Google Scholar] [CrossRef]
- Hong, T.; Chen, Y.; Luo, X.; Luo, N.; Lee, S.H. Ten Questions on Urban Building Energy Modeling. Build. Environ. 2020, 168, 106508. [Google Scholar] [CrossRef]
- Abbasabadi, N.; Ashayeri, M. Urban Energy Use Modeling Methods and Tools: A Review and an Outlook. Build. Environ. 2019, 161, 106270. [Google Scholar] [CrossRef]
- Gan, L.; Liu, Y.; Shi, Q.; Cai, W.; Ren, H. Regional Inequality in the Carbon Emission Intensity of Public Buildings in China. Build. Environ. 2022, 225, 109657. [Google Scholar] [CrossRef]
- Johari, F.; Peronato, G.; Sadeghian, P.; Zhao, X.; Widén, J. Urban Building Energy Modeling: State of the Art and Future Prospects. Renew. Sustain. Energy Rev. 2020, 128, 109902. [Google Scholar] [CrossRef]
- Koral Iseri, O.; Duran, A.; Canlı, I.; Meral Akgul, C.; Kalkan, S.; Gursel Dino, I. A Method for Zone-Level Urban Building Energy Modeling in Data-Scarce Built Environments. Energy Build. 2025, 337, 115620. [Google Scholar] [CrossRef]
- Yang, J.; Zhang, Q.; Peng, C.; Chen, Y. AutoBPS-Prototype: A Web-Based Toolkit to Automatically Generate Prototype Building Energy Models with Customizable Efficiency Values in China. Energy Build. 2024, 305, 113880. [Google Scholar] [CrossRef]
- Oraiopoulos, A.; Hsieh, S.; Schlueter, A. Energy Futures of Representative Swiss Communities under the Influence of Urban Development, Building Retrofit, and Climate Change. Sustain. Cities Soc. 2023, 91, 104437. [Google Scholar] [CrossRef]
- Cerezo, C.; Sokol, J.; AlKhaled, S.; Reinhart, C.; Al-Mumin, A.; Hajiah, A. Comparison of Four Building Archetype Characterization Methods in Urban Building Energy Modeling (UBEM): A Residential Case Study in Kuwait City. Energy Build. 2017, 154, 321–334. [Google Scholar] [CrossRef]
- Shen, P.; Wang, H. Archetype Building Energy Modeling Approaches and Applications: A Review. Renew. Sustain. Energy Rev. 2024, 199, 114478. [Google Scholar] [CrossRef]
- Henninger, R.H.; Witte, M.J.; Crawley, D.B. Analytical and Comparative Testing of EnergyPlus Using IEA HVAC BESTEST E100–E200 Test Suite. Energy Build. 2004, 36, 855–863. [Google Scholar] [CrossRef]
- Yan, D.; Zhou, X.; An, J.; Kang, X.; Bu, F.; Chen, Y.; Pan, Y.; Gao, Y.; Zhang, Q.; Zhou, H.; et al. DeST 3.0: A New-Generation Building Performance Simulation Platform. Build. Simul. 2022, 15, 1849–1868. [Google Scholar] [CrossRef]
- Carnieletto, L.; Ferrando, M.; Teso, L.; Sun, K.; Zhang, W.; Causone, F.; Romagnoni, P.; Zarrella, A.; Hong, T. Italian Prototype Building Models for Urban Scale Building Performance Simulation. Build. Environ. 2021, 192, 107590. [Google Scholar] [CrossRef]
- Liu, M.; Gou, Z. A Regional Domestic Energy Consumption Model Based on LoD1 to Assess Energy-Saving Potential. Adv. Eng. Inform. 2025, 65, 103247. [Google Scholar] [CrossRef]
- Deng, Z.; Chen, Y.; Pan, X.; Peng, Z.; Yang, J. Integrating GIS-Based Point of Interest and Community Boundary Datasets for Urban Building Energy Modeling. Energies 2021, 14, 1049. [Google Scholar] [CrossRef]
- Deng, Z.; Chen, Y.; Yang, J.; Chen, Z. Archetype Identification and Urban Building Energy Modeling for City-Scale Buildings Based on GIS Datasets. Build. Simul. 2022, 15, 1547–1559. [Google Scholar] [CrossRef]
- Song, C.; Deng, Z.; Zhao, W.; Yuan, Y.; Liu, M.; Xu, S.; Chen, Y. Developing Urban Building Energy Models for Shanghai City with Multi-Source Open Data. Sustain. Cities Soc. 2024, 106, 105425. [Google Scholar] [CrossRef]
- An, J.; Wu, Y.; Gui, C.; Yan, D. Chinese Prototype Building Models for Simulating the Energy Performance of the Nationwide Building Stock. Build. Simul. 2023, 16, 1559–1582. [Google Scholar] [CrossRef]
- Peng, H.; Li, M.; Lou, S.; He, M.; Huang, Y.; Wen, L. Investigation on Spatial Distribution and Thermal Properties of Typical Residential Buildings in South China’s Pearl River Delta. Energy Build. 2020, 206, 109555. [Google Scholar] [CrossRef]
- Xia, D.; Wu, Z.; Zou, Y.; Chen, R.; Lou, S. Developing a Bottom-up Approach to Assess Energy Challenges in Urban Residential Buildings of China. Front. Archit. Res. 2025, S209526352500041X. [Google Scholar] [CrossRef]
- Yu, H.; Wang, M.; Lin, X.; Guo, H.; Liu, H.; Zhao, Y.; Wang, H.; Li, C.; Jing, R. Prioritizing Urban Planning Factors on Community Energy Performance Based on GIS-Informed Building Energy Modeling. Energy Build. 2021, 249, 111191. [Google Scholar] [CrossRef]
- Alasmar, R.; Schwartz, Y.; Burman, E. Developing a Housing Stock Model for Evaluating Energy Performance: The Case of Jordan. Energy Build. 2024, 308, 114010. [Google Scholar] [CrossRef]
- Li, X.; Yao, R.; Liu, M.; Costanzo, V.; Yu, W.; Wang, W.; Short, A.; Li, B. Developing Urban Residential Reference Buildings Using Clustering Analysis of Satellite Images. Energy Build. 2018, 169, 417–429. [Google Scholar] [CrossRef]
- Bourdeau, M.; Zhai, X.Q.; Nefzaoui, E.; Guo, X.; Chatellier, P. Modeling and Forecasting Building Energy Consumption: A Review of Data-Driven Techniques. Sustain. Cities Soc. 2019, 48, 101533. [Google Scholar] [CrossRef]
- Sheng, Y.; Arbabi, H.; Ward, W.O.C.; Álvarez, M.A.; Mayfield, M. City-Scale Residential Energy Consumption Prediction with a Multimodal Approach. Sci. Rep. 2025, 15, 5313. [Google Scholar] [CrossRef]
- Jiang, Q.; Huang, C.; Wu, Z.; Yao, J.; Wang, J.; Liu, X.; Qiao, R. Predicting Building Energy Consumption in Urban Neighborhoods Using Machine Learning Algorithms. FURP 2024, 2, 6. [Google Scholar] [CrossRef]
- Wang, R.; Lu, S.; Li, Q. Multi-Criteria Comprehensive Study on Predictive Algorithm of Hourly Heating Energy Consumption for Residential Buildings. Sustain. Cities Soc. 2019, 49, 101623. [Google Scholar] [CrossRef]
- Liu, K.; Xu, X.; Zhang, R.; Kong, L.; Wang, W.; Deng, W. Impact of Urban Form on Building Energy Consumption and Solar Energy Potential: A Case Study of Residential Blocks in Jianhu, China. Energy Build. 2023, 280, 112727. [Google Scholar] [CrossRef]
- Liu, K.; Xu, X.; Zhang, R.; Kong, L.; Wang, X.; Lin, D. An Integrated Framework Utilizing Machine Learning to Accelerate the Optimization of Energy-Efficient Urban Block Forms. Build. Simul. 2024, 17, 2017–2042. [Google Scholar] [CrossRef]
- Wang, W.; Liu, K.; Zhang, M.; Shen, Y.; Jing, R.; Xu, X. From Simulation to Data-Driven Approach: A Framework of Integrating Urban Morphology to Low-Energy Urban Design. Renew. Energy 2021, 179, 2016–2035. [Google Scholar] [CrossRef]
- Feng, Y.; Duan, Q.; Chen, X.; Yakkali, S.S.; Wang, J. Space Cooling Energy Usage Prediction Based on Utility Data for Residential Buildings Using Machine Learning Methods. Appl. Energy 2021, 291, 116814. [Google Scholar] [CrossRef]
- Chen, P.; Wu, Y.; Zhong, H.; Long, Y.; Meng, J. Exploring Household Emission Patterns and Driving Factors in Japan Using Machine Learning Methods. Appl. Energy 2022, 307, 118251. [Google Scholar] [CrossRef]
- Wei, Z.; Zhang, T.; Yue, B.; Ding, Y.; Xiao, R.; Wang, R.; Zhai, X. Prediction of Residential District Heating Load Based on Machine Learning: A Case Study. Energy 2021, 231, 120950. [Google Scholar] [CrossRef]
- Qavidelfardi, Z.; Tahsildoost, M.; Zomorodian, Z.S. Using an Ensemble Learning Framework to Predict Residential Energy Consumption in the Hot and Humid Climate of Iran. Energy Rep. 2022, 8, 12327–12347. [Google Scholar] [CrossRef]
- Luo, C.; Feng, C.; Zhong, H.; Liu, Y.; Dou, M. Design Optimization of Climate-Responsive Rural Residences in Solar Rich Areas Considering Sustainability and Occupant Comfort. Energy Build. 2025, 336, 115546. [Google Scholar] [CrossRef]
- Ye, Z.; Cheng, K.; Hsu, S.-C.; Wei, H.-H.; Cheung, C.M. Identifying Critical Building-Oriented Features in City-Block-Level Building Energy Consumption: A Data-Driven Machine Learning Approach. Appl. Energy 2021, 301, 117453. [Google Scholar] [CrossRef]
- Liu, Y.; Zhang, W.; Liu, W.; Tan, Z.; Hu, S.; Ao, Z.; Li, J.; Xing, H. Exploring the Seasonal Effects of Urban Morphology on Land Surface Temperature in Urban Functional Zones. Sustain. Cities Soc. 2024, 103, 105268. [Google Scholar] [CrossRef]
- Zou, B.; Fan, C.; Li, J.; Wang, M.; Liao, Y.; Zhou, X. Assessing the Impact of Land Use Changes on Urban Heat Risk under Different Development Scenarios: A Case Study of Guangzhou in China. Sustain. Cities Soc. 2025, 130, 106532. [Google Scholar] [CrossRef]
- Zhou, X.; Deng, S.; Cui, Y.; Fan, C. Developing a Co-Benefits Evaluation Model to Optimize Greening Coverage Designs on University Campuses in Hot and Humid Areas. Energy Build. 2025, 328, 115214. [Google Scholar] [CrossRef]
- Cui, Y.; Fan, C.; Zhou, X.; Liao, Y. Analysis of Green Belt Designs in Mitigating Anthropogenic Heat Emission from Buildings by Considering Cooling Efficiency and Nurture Costs. Indoor Built Environ. 2024, 34, 438–459. [Google Scholar] [CrossRef]
- Zou, B.; Fan, C.; Li, J. Quantifying the Influence of Different Block Types on the Urban Heat Risk in High-Density Cities. Buildings 2024, 14, 2131. [Google Scholar] [CrossRef]
- JGJ 75-2003; Design Standard for Energy Efficiency of Residential Buildings in Hot Summer and Warm Winter Zone. Ministry of Housing and Urban-Rural Development of China (MOHURD) China Architecture & Building Press: Beijing, China, 2003.
- Zhang, X.; Chen, Z.; Yue, Y.; Qi, X.; Zhang, C.H. Fusion of Remote Sensing and Internet Data to Calculate Urban Floor Area Ratio. Sustainability 2019, 11, 3382. [Google Scholar] [CrossRef]
- Song, S.; Leng, H.; Xu, H.; Guo, R.; Zhao, Y. Impact of Urban Morphology and Climate on Heating Energy Consumption of Buildings in Severe Cold Regions. IJERPH 2020, 17, 8354. [Google Scholar] [CrossRef]
- Perera, A.T.D.; Javanroodi, K.; Nik, V.M. Climate Resilient Interconnected Infrastructure: Co-Optimization of Energy Systems and Urban Morphology. Appl. Energy 2021, 285, 116430. [Google Scholar] [CrossRef]
- Ratti, C.; Baker, N.; Steemers, K. Energy Consumption and Urban Texture. Energy Build. 2005, 37, 762–776. [Google Scholar] [CrossRef]
- Guangdong Construction Yearbook Compilation Committee. Guangdong Construction Yearbook 2015; Guangdong People’s Publishing House: Guangzhou, China, 2015; ISBN 978-7-218-10509-3. [Google Scholar]
- Wang, Z.; Zhou, R.; Rui, J.; Yu, Y. Revealing the Impact of Urban Spatial Morphology on Land Surface Temperature in Plain and Plateau Cities Using Explainable Machine Learning. Sustain. Cities Soc. 2025, 118, 106046. [Google Scholar] [CrossRef]
- Li, Z.; Ma, J.; Jiang, F.; Zhang, S.; Tan, Y. Assessing the Impacts of Urban Morphological Factors on Urban Building Energy Modeling Based on Spatial Proximity Analysis and Explainable Machine Learning. J. Build. Eng. 2024, 85, 108675. [Google Scholar] [CrossRef]
- Wang, J.; Ren, C. Analysis of residential energy consumption ratio from Guangzhou Asian Games City project. Water Wastewater Eng. 2011, 37, 92–96. [Google Scholar] [CrossRef]
- Demir Dilsiz, A.; Ng, K.; Kämpf, J.; Nagy, Z. Ranking Parameters in Urban Energy Models for Various Building Forms and Climates Using Sensitivity Analysis. Build. Simul. 2023, 16, 1587–1600. [Google Scholar] [CrossRef]
- Fan, C.; Zou, B.; Li, J.; Wang, M.; Liao, Y.; Zhou, X. Exploring the Relationship between Air Temperature and Urban Morphology Factors Using Machine Learning under Local Climate Zones. Case Stud. Therm. Eng. 2024, 55, 104151. [Google Scholar] [CrossRef]
- Chen, Y.; Fan, C.; Nie, Y.; Wu, H.; Zhu, Y.; Liao, Y.; Li, H.; Wu, L.; Lao, M. Integrating Bottom-up Energy Model with Urban Parameterization for Fine-Scale Anthropogenic Heat Estimation. Case Stud. Therm. Eng. 2025, 73, 106627. [Google Scholar] [CrossRef]
- Oh, S.; Ahn, H.; Bae, M.; Kang, J. Development and Analysis of Easy-to-Implement Green Retrofit Technologies for Windows to Reduce Heating Energy Use in Older Residential Buildings. Sustainability 2025, 17, 3307. [Google Scholar] [CrossRef]


| Dataset Name | Data Source | Format | Attributes |
|---|---|---|---|
| 2023 Guangzhou Building Footprint | Baidu Map (https://map.baidu.com/; accessed 15 May 2023) | Shapefile | Polygon data |
| Guangzhou Road Network | OpenStreetMap (https://www.openstreetmap.org/) | Shapefile | Line data |
| Residential Areas with Year Built | Anjuke (https://www.anjuke.com/) | Xlsx | Point data with year tags |
| Areas of interest | Amap (https://ditu.amap.com/) | Shapefile | Polygon data |
| Community Coordinates | Baidu Coordinate Picker (https://api.map.baidu.com/lbsapi/getpoint/) | Shapefile | Point data |
| Meteorological Data | EnergyPlus (https://energyplus.net/) | Epw | Climate parameters |
| Parameters | Prototype A | Prototype B | Prototype C | Prototype D | Prototype E |
|---|---|---|---|---|---|
| Equipment power density (W/m2) | 4.3 | 4.3 | 4.3 | 4.3 | 4.3 |
| Lighting power density (W/m2) | 7 | 7 | 7 | 7 | 7 |
| Occupancy (people/m2) | 0.07 | 0.07 | 0.07 | 0.05 | 0.05 |
| Exterior wall U-value (W/(m2·K)) | 2.47 | 2.47 | 2.47 | 1.62 | 1.62 |
| Roof U-value (W/(m2·K)) | 1.8 | 1.8 | 1.8 | 1.66 | 1.66 |
| Window U-value (W/(m2·K)) | 6.4 | 6.4 | 6.4 | 4.99 | 4.99 |
| Window SHGC | 0.85 | 0.85 | 0.85 | 0.85 | 0.85 |
| Room Air Conditioner SEER | 2.7 | 2.7 | 2.7 | 2.7 | 2.7 |
| Cooling/heating setpoints (°C) | 26/16 | 26/16 | 26/16 | 26/16 | 26/16 |
| Variable | Definition | Formula | Reference |
|---|---|---|---|
| Building Serial Number (SN) | Unique identifier of a building, used to distinguish and mark different buildings. | ||
| Site Area (SA) | Refers to the area of the plot of land on which the building belongs. | ||
| Average number of building floors (ANF) | The average number of floors in a building’s total height, usually expressed as an integer or decimal, used to estimate the building’s mass. | [51] | |
| Number of Buildings (NoB) | The number of buildings within the site calculation unit. | ||
| Building Coverage Ratio (BCR) | The ratio of building area to total land area. | [52] | |
| Floor Area Ratio (FAR) | The ratio of the total building area in a region to the total area of the region. | [53] | |
| Building Shape Coefficient (BSC) | Used to measure the complexity of a building’s outline; the ratio of the building’s surface area to the unit building volume. | [54] |
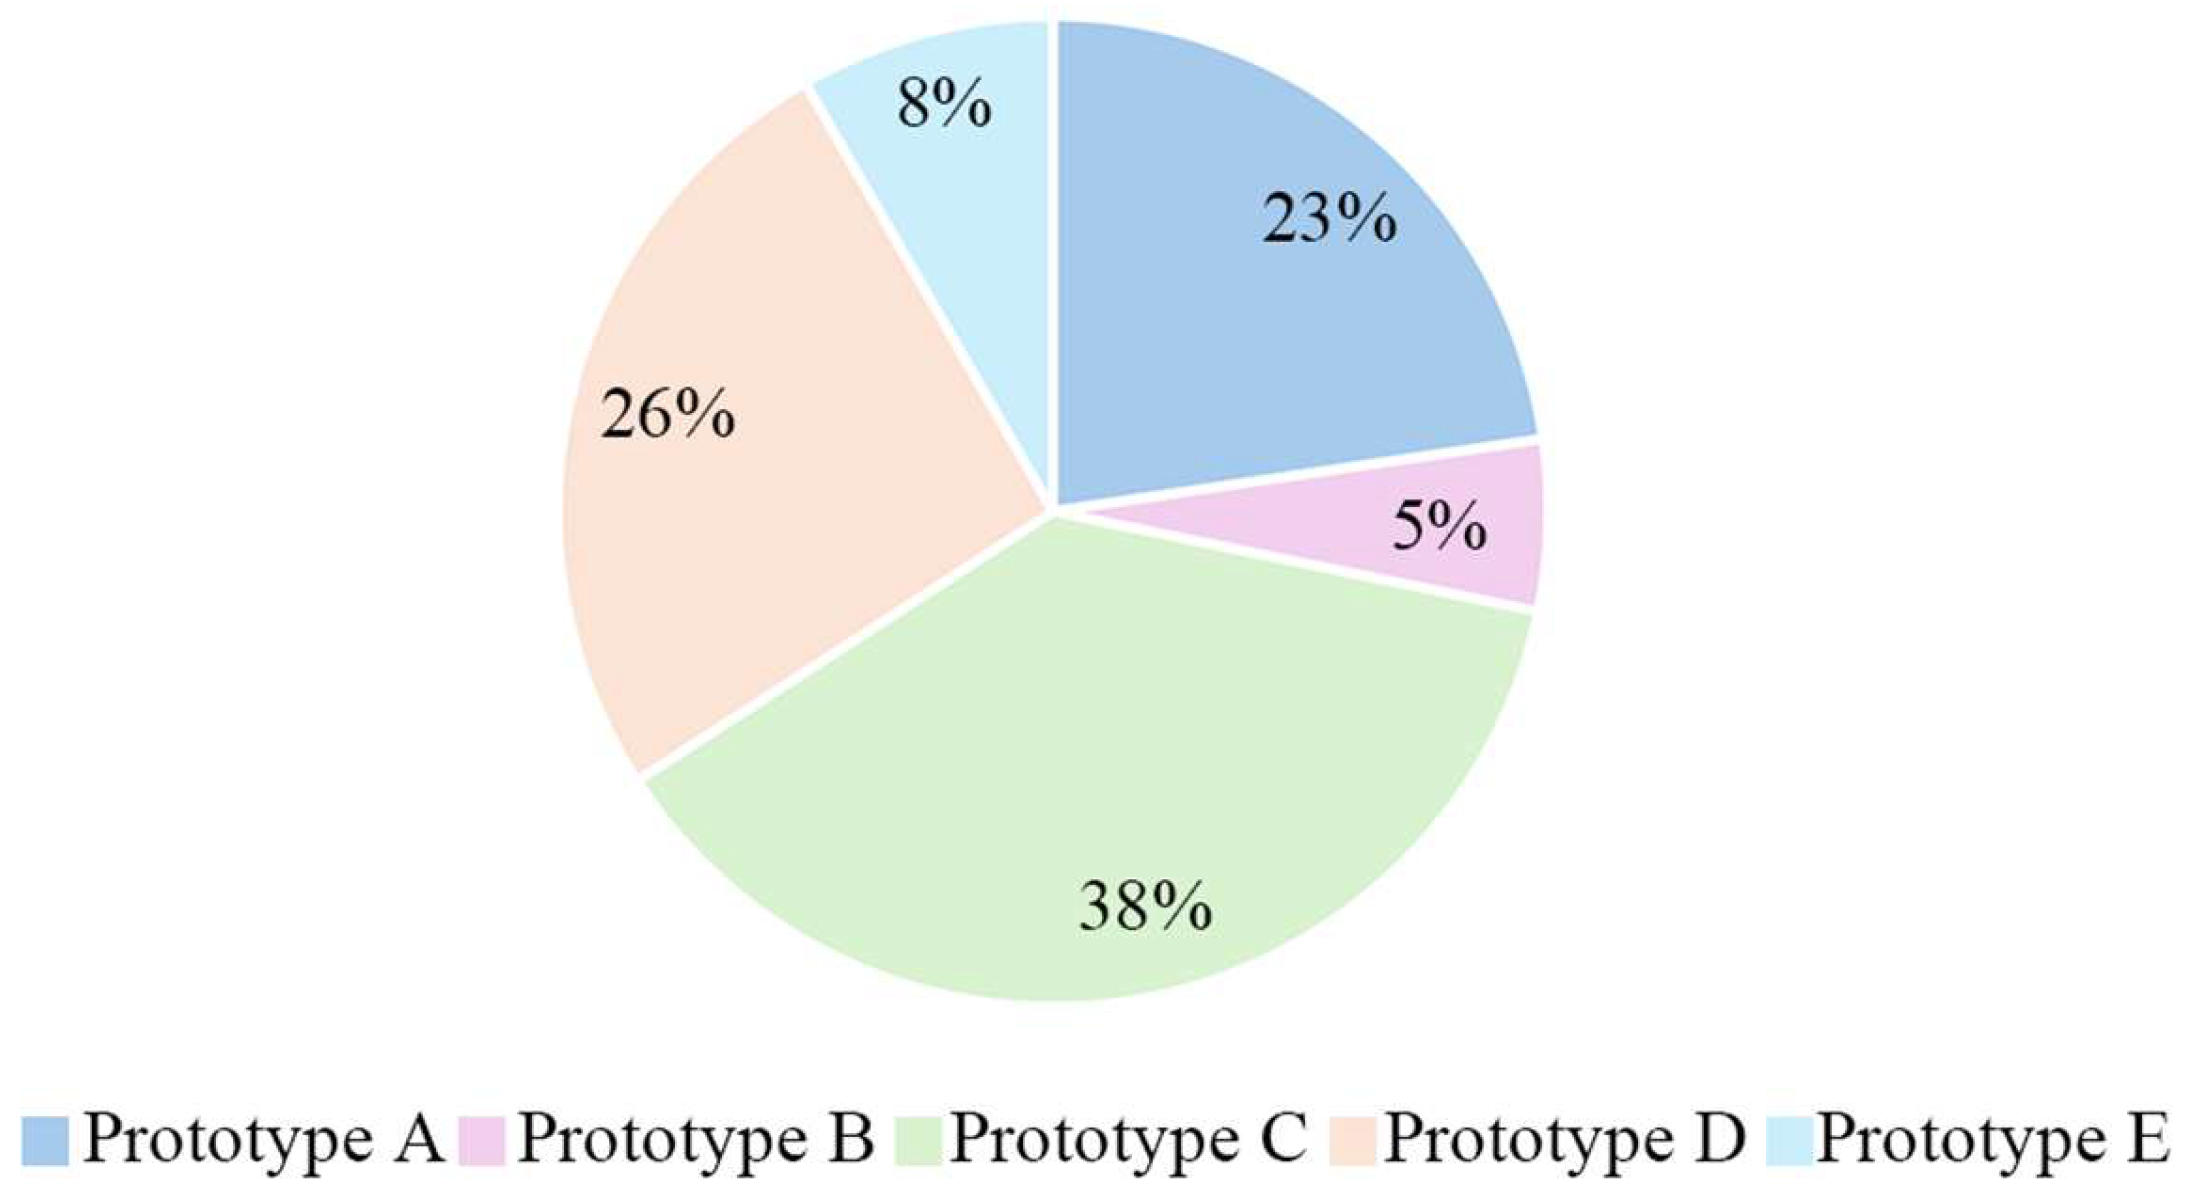
| Prototype Category | Number | Building Aspect Ratio | Length × Width | Graphic |
|---|---|---|---|---|
| Prototype A | 9708 | 3.10 | 42 × 17 |  |
| Prototype B | 2394 | 4.01 | 78 × 26 |  |
| Prototype C | 16,114 | 1.94 | 21 × 12 |  |
| Prototype D | 11,057 | 2.09 | 30 × 17 |  |
| Prototype E | 3575 | 3.21 | 73 × 27 |  |
Disclaimer/Publisher’s Note: The statements, opinions and data contained in all publications are solely those of the individual author(s) and contributor(s) and not of MDPI and/or the editor(s). MDPI and/or the editor(s) disclaim responsibility for any injury to people or property resulting from any ideas, methods, instructions or products referred to in the content. |
© 2025 by the authors. Licensee MDPI, Basel, Switzerland. This article is an open access article distributed under the terms and conditions of the Creative Commons Attribution (CC BY) license (https://creativecommons.org/licenses/by/4.0/).
Share and Cite
Fan, C.; Liu, R.; Liao, Y. Archetype Identification and Energy Consumption Prediction for Old Residential Buildings Based on Multi-Source Datasets. Buildings 2025, 15, 2573. https://doi.org/10.3390/buildings15142573
Fan C, Liu R, Liao Y. Archetype Identification and Energy Consumption Prediction for Old Residential Buildings Based on Multi-Source Datasets. Buildings. 2025; 15(14):2573. https://doi.org/10.3390/buildings15142573
Chicago/Turabian StyleFan, Chengliang, Rude Liu, and Yundan Liao. 2025. "Archetype Identification and Energy Consumption Prediction for Old Residential Buildings Based on Multi-Source Datasets" Buildings 15, no. 14: 2573. https://doi.org/10.3390/buildings15142573
APA StyleFan, C., Liu, R., & Liao, Y. (2025). Archetype Identification and Energy Consumption Prediction for Old Residential Buildings Based on Multi-Source Datasets. Buildings, 15(14), 2573. https://doi.org/10.3390/buildings15142573