1. Introduction
Sports buildings, encompassing facilities such as gyms, swimming pools, and courts, face complex scheduling challenges due to fluctuating user demand, spatial dependencies between resources, and dynamic operational constraints. Traditional scheduling approaches often rely on static rules or centralized optimization, which struggle to adapt to real-time changes and fail to account for the intricate interdependencies between facilities [
1,
2]. For example, consider a sports complex with a swimming pool and adjacent locker rooms. The pool’s usage directly impacts the locker room’s demand, as users typically shower after swimming. If the pool is heavily occupied, the locker rooms will experience a surge in demand shortly afterward. Similarly, shared utilities (e.g., ventilation systems) between the gym and locker rooms mean that energy-saving measures in one facility must account for the other’s operational state. These spatial dependencies—whether due to shared infrastructure, user flow, or functional complementarity—are critical for efficient scheduling but are often overlooked by traditional centralized approaches. Recent advances in computational design and smart building technologies have introduced data-driven methods to improve energy efficiency and user experience [
3], yet these solutions typically lack the adaptability required for dynamic environments.
Multi-agent reinforcement learning (MARL) has emerged as a promising paradigm for distributed decision-making in complex systems, where autonomous agents learn policies through interaction with their environment [
4]. However, applying MARL to sports buildings introduces unique challenges, including the need to model spatial relationships between facilities and balance competing objectives such as energy consumption and user satisfaction. Graph neural networks (GNNs) offer a natural solution for capturing these dependencies by representing facilities as nodes in a graph and learning message-passing protocols to coordinate their actions [
5].
The proposed framework integrates MARL with GNNs to optimize scheduling in sports buildings. Each facility operates as an independent agent, employing proximal policy optimization (PPO) to learn adaptive policies based on local observations [
6]. A GNN-based communication layer enables agents to share information and account for spatial-temporal dependencies, while dynamic reward shaping ensures alignment with operational goals [
7]. Unlike centralized methods, this decentralized approach preserves privacy and scalability, making it suitable for large-scale sports complexes with heterogeneous facilities.
While GNNs have shown success in domains like traffic networks, their application to sports facility management is equally justified by three key characteristics: (1) the physical layout of sports complexes naturally forms a graph structure with facilities as nodes and access paths as edges, (2) user flow patterns create dynamic dependencies between facilities that mirror message-passing in GNNs, and (3) resource constraints (like shared utilities) require coordinated decision-making that GNNs facilitate through their aggregation mechanisms. Unlike traffic networks where spatial relationships are primarily geographic, sports facility graphs incorporate both physical adjacency and functional complementarity (e.g., between courts and showers), making GNNs particularly suitable for capturing these multi-modal relationships.
Our key contributions include (1) a novel MARL-GNN architecture that combines decentralized decision-making with global coordination, (2) a dynamic reward mechanism that balances multiple objectives in real time, and (3) a prioritized experience replay strategy to enhance robustness against disruptions such as equipment failures or sudden demand shifts. The framework is designed to integrate seamlessly with existing building management systems, offering practical deployability without requiring extensive infrastructure changes.
Prior work in sports building optimization has focused on static energy models or centralized control [
8,
9], while MARL applications have largely been confined to simulated environments [
10]. By bridging these domains, our approach addresses a critical gap in adaptive resource allocation for real-world sports facilities. Experimental results demonstrate significant improvements in both operational efficiency and user satisfaction compared to conventional methods, validating its effectiveness in dynamic settings.
The remainder of this paper is organized as follows:
Section 2 reviews related work in MARL, GNNs, and sports building optimization.
Section 3 introduces the necessary background and preliminaries.
Section 4 details the proposed framework, followed by experimental setup and results in
Section 5 and
Section 6.
Section 7 discusses implications and future directions, with conclusions in
Section 8.
2. Related Work
The optimization of sports building operations intersects multiple research domains, including reinforcement learning, multi-agent systems, and graph-based modeling. Existing approaches can be broadly categorized into three directions: (1) single-agent reinforcement learning for facility scheduling, (2) multi-agent coordination in smart buildings, and (3) graph neural networks for spatial–temporal modeling.
2.1. Reinforcement Learning for Facility Scheduling
Traditional scheduling problems in sports buildings have been addressed through operations research techniques such as linear programming and heuristic algorithms [
11]. Recent works have shifted toward reinforcement learning (RL) due to its ability to handle dynamic environments. For instance, relevant research [
12] demonstrated RL’s effectiveness in job shop scheduling by framing it as a Markov decision process. However, these single-agent approaches struggle with scalability when applied to large sports complexes with interdependent facilities. The work in [
13,
14] highlighted similar limitations in manufacturing systems, where centralized RL fails to capture distributed decision-making requirements.
2.2. Multi-Agent Coordination in Smart Buildings
Multi-agent systems have gained traction in building automation, particularly for energy management. Some scholars have proposed a decentralized load scheduling framework using cooperative agents [
15]; however, different factions have proposed and introduced adaptive pricing strategies to balance the trade-off between demand and response [
16]. These methods primarily focus on energy optimization without considering the spatial relationships between facilities—a critical aspect for sports buildings where user flow patterns influence resource utilization. Another study further revealed that existing multi-agent approaches often rely on predefined coordination rules [
17], limiting their adaptability to real-time changes.
2.3. Graph Neural Networks for Spatial–Temporal Modeling
Graph-based methods have shown promise in capturing structural dependencies for optimization tasks. In sports facility management, relevant scholars have adopted predictive control based on neural networks, but regard the facilities as isolated units [
18]. Recent advances in GNNs address this limitation by explicitly modeling relational data. For instance, relevant research has demonstrated the effectiveness of graph neural networks in transportation systems through the message-passing mechanism between nodes. Similar technologies have also been applied to building energy systems [
19], though without integrating them with MARL for joint scheduling optimization.
The proposed framework advances beyond these works by unifying MARL with GNN-based coordination for sports buildings. Unlike [
20], our approach distributes decision-making across autonomous agents while maintaining global coherence through graph-structured communication. Compared to [
21], we explicitly model facility interdependencies via attention mechanisms rather than assuming independent operation. Furthermore, our dynamic reward shaping and prioritized experience replay address the robustness gaps identified in [
22]. This combination of decentralized learning and relational reasoning offers a novel solution for adaptive scheduling in complex sports facilities.
Recent work on electric vehicle charging demand prediction [
23,
24] demonstrates the importance of spatiotemporal modeling in resource allocation problems, similar to our approach for sports facilities. However, our framework differs by incorporating decentralized decision-making through MARL rather than centralized prediction. The two-stage MARL approach for network reconfiguration [
25,
26] shares our emphasis on multi-agent coordination, though we extend this concept through GNN-based communication that explicitly models facility interdependencies. Our dynamic reward mechanism provides finer control over competing objectives compared to the switch contribution metrics used in distribution networks.
3. Background and Preliminaries
To establish the theoretical foundation for our proposed framework, this section introduces three key concepts: Markov decision processes as the basis for reinforcement learning, graph theory fundamentals essential for understanding GNN architectures, and partially observable Markov decision processes that model real-world decision-making scenarios with imperfect information.
3.1. Markov Decision Processes and Reinforcement Learning
At the core of our framework lies the Markov decision process (MDP), a mathematical framework for modeling sequential decision-making problems [
27]. An MDP is defined by the tuple
, where
represents the state space,
the action space,
the state transition probability,
the immediate reward function, and
the discount factor. The value function
, representing the expected cumulative reward from state
, is given by
The action value function
, which estimates the expected return after taking action
in state
, follows the Bellman equation:
Reinforcement learning algorithms aim to find the optimal policy
that maximizes these value functions through interaction with the environment [
19]. In our multi-agent setting, each facility operates as an independent learner while coordinating through the graph structure, creating a networked MDP where local decisions influence global outcomes.
3.2. Graph Theory Fundamentals
Graph neural networks build upon fundamental concepts from graph theory, which provides the mathematical language for describing relationships between entities [
28]. A graph
is formally defined as
where
represents the set of vertices (nodes) and
the set of edges connecting pairs of vertices. The adjacency matrix
encodes the graph structure, with elements
In our application, facilities correspond to nodes in the graph, while edges represent physical connections or functional dependencies between them. Graph neural networks extend traditional neural networks to operate on graph-structured data by propagating information along edges and aggregating messages at nodes [
29]. This architecture naturally captures the spatial relationships between facilities that are crucial for coordinated scheduling.
3.3. Partially Observable Markov Decision Processes (POMDPs)
Real-world decision-making often occurs under partial observability, where agents cannot directly perceive the complete system state [
30]. A POMDP extends the MDP framework by introducing an observation space
and an observation model:
Agents maintain a belief state
, representing a probability distribution over possible states given the history of observations and actions:
In sports facility management, partial observability arises from factors such as limited sensor coverage or unpredictable user behavior. Our framework addresses this challenge through the GNN-based communication layer, which allows for agents to share local observations and collectively build a more complete understanding of the system state. The combination of POMDP modeling with graph-based message-passing enables robust decision-making despite imperfect information.
4. Decentralized Multi-Agent Reinforcement Learning Framework with GNNs
4.1. System Architecture Overview
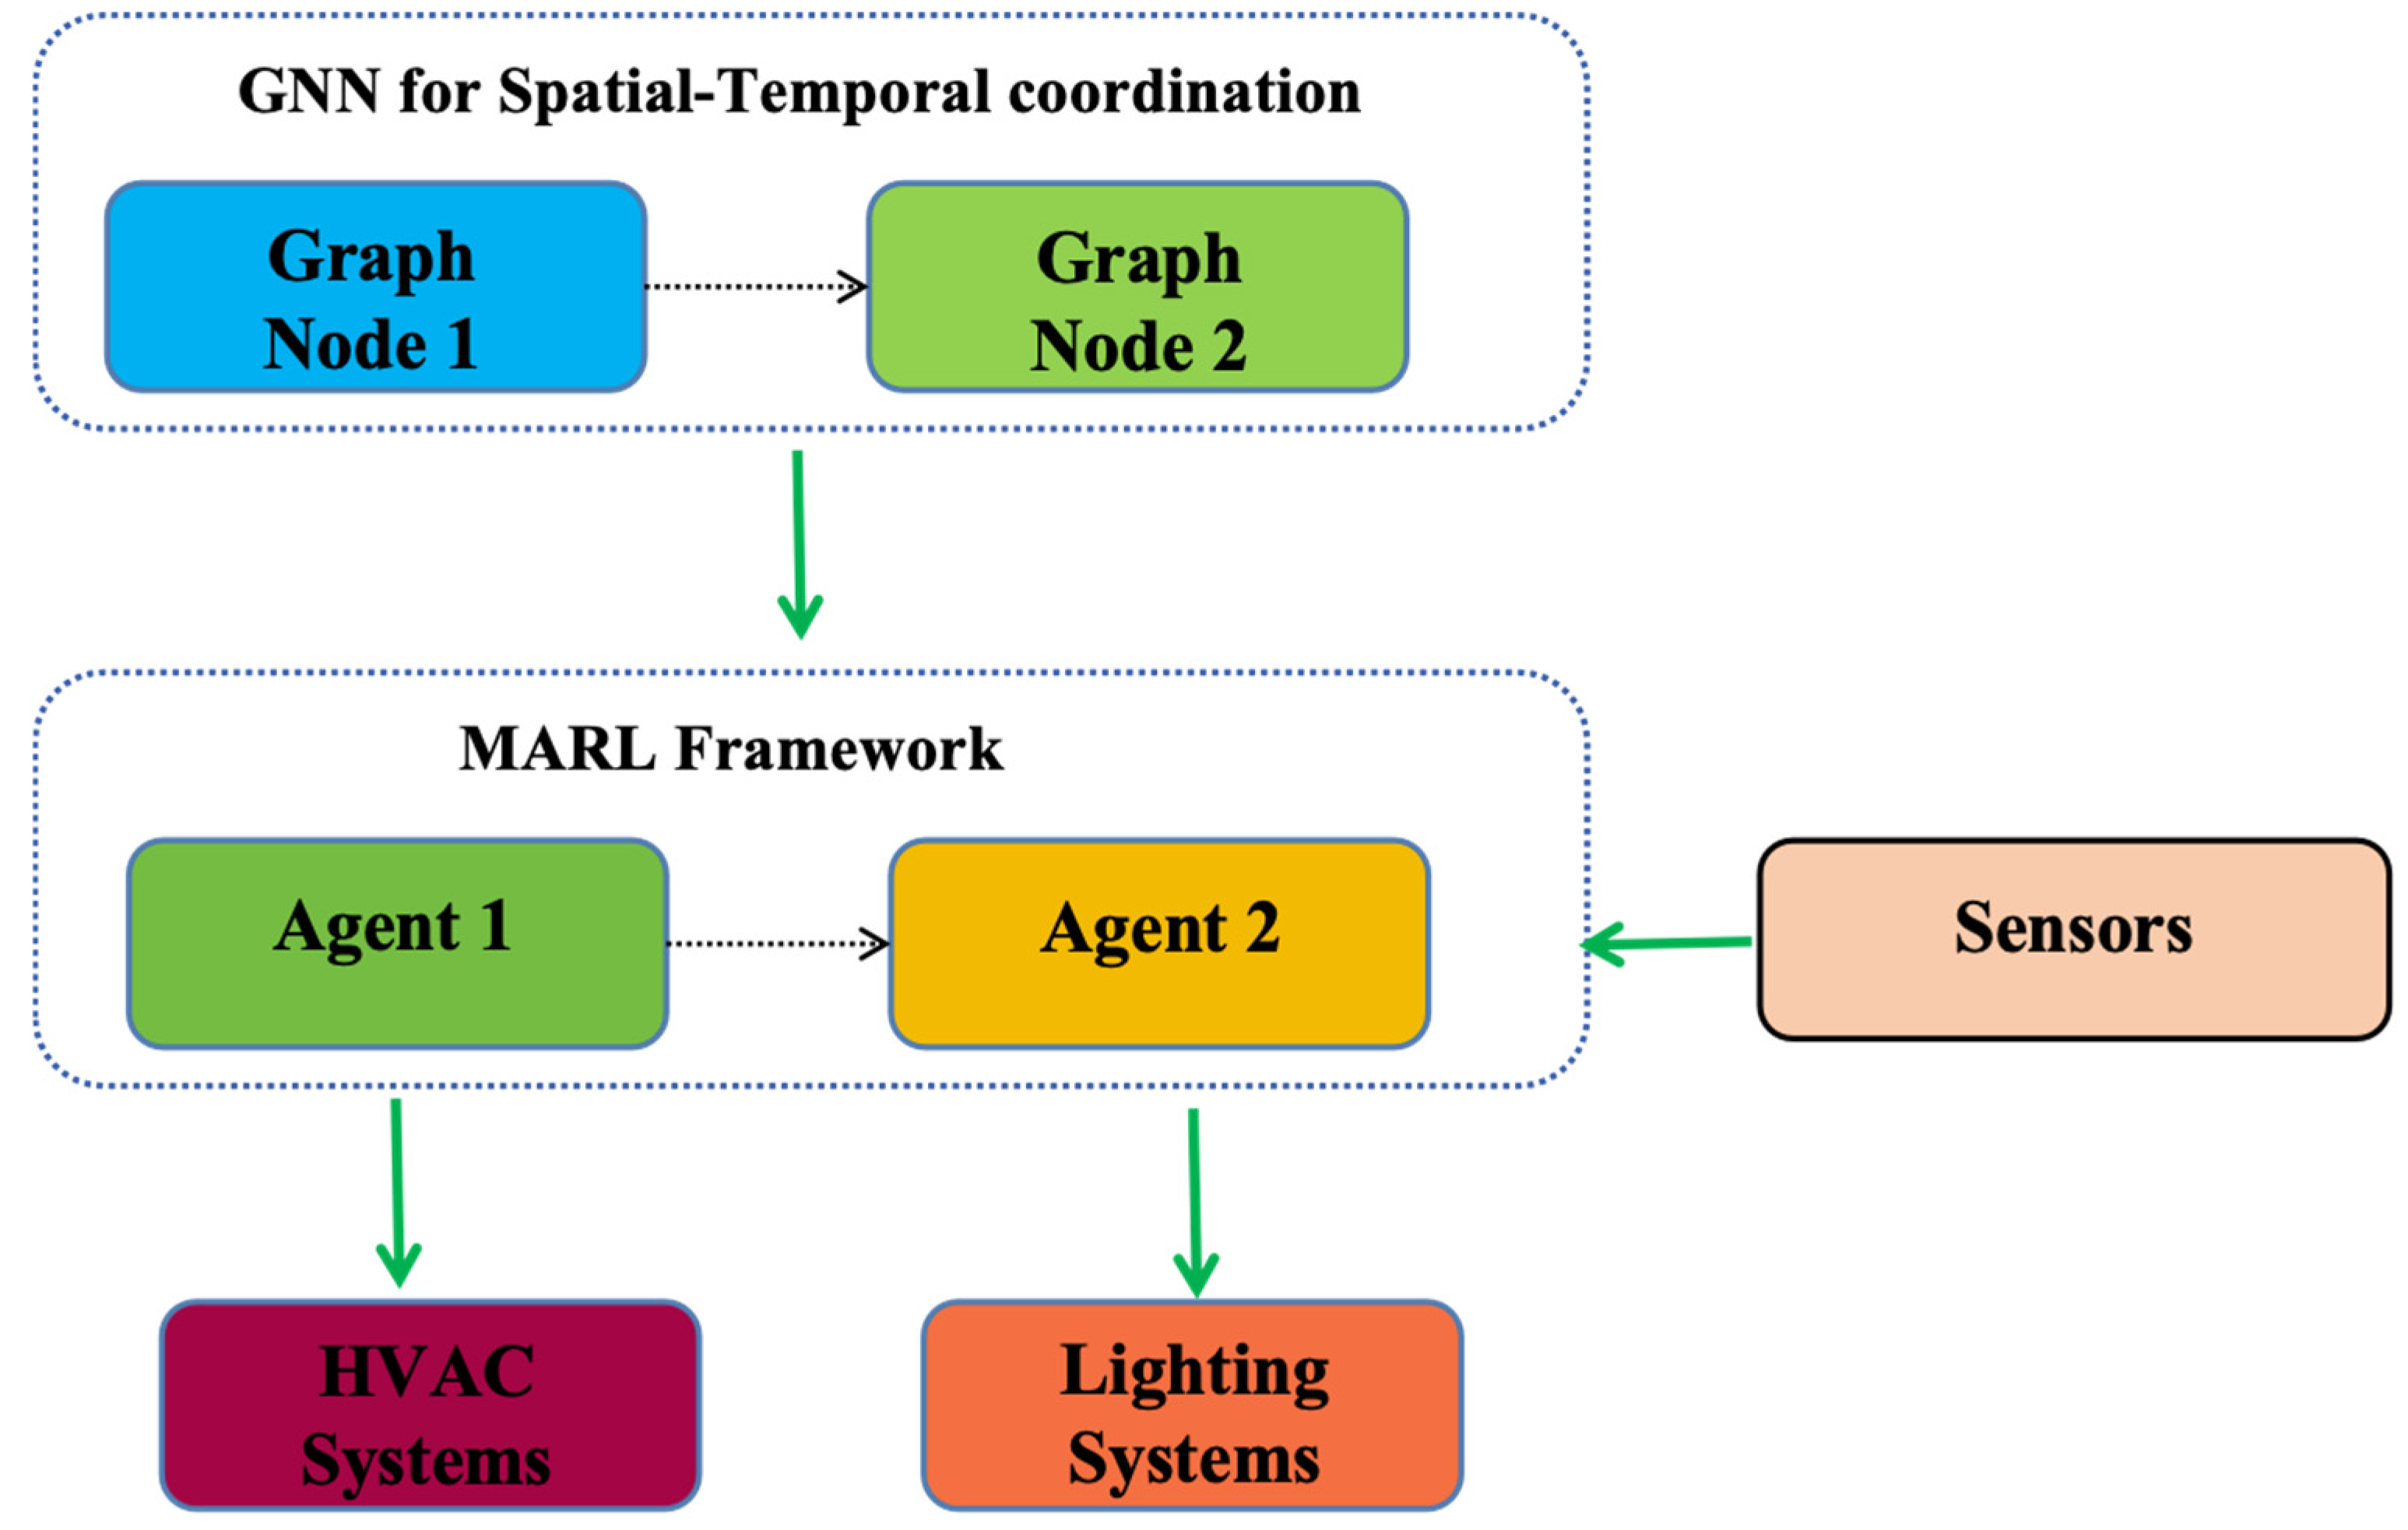
The proposed framework consists of three core components: (1) facility-specific agents implementing PPO for local policy optimization, (2) a GNN-based coordination layer for inter-facility communication, and (3) a federated learning module for privacy-preserving knowledge sharing. Each facility agent
maintains its own policy network
and critic network
, processing local observations
including real-time occupancy, equipment status, and energy consumption metrics. The GNN coordination layer operates through edge-conditioned graph convolutions, where the adjacency matrix
encodes physical connectivity between facilities (e.g., shared ventilation systems between a gym and locker rooms). See
Figure 1.
4.2. Policy Learning with Spatial–Temporal Attention
The policy network for each agent combines a Vision Transformer (ViT) encoder with GraphSAGE convolutions. Local observations
are first tokenized into
patches
through linear projection:
These tokens undergo multi-head self-attention to capture temporal patterns in facility usage:
where
,
, and
are learned linear transformations of the token embeddings. The resulting representations are then processed by GraphSAGE layers that aggregate information from neighboring facilities:
Here,
denotes the attention weight between facilities
and
, computed as
4.3. Dynamic Reward Composition
The reward function
for each agent dynamically balances three objectives: occupancy utilization
, energy efficiency
, and user satisfaction
. The weights
are adapted online via meta-gradient descent. The energy efficiency term
∈ [0, 1] represents the normalized energy consumption of facility
i at time
t, calculated as the ratio between actual energy usage and the facility’s baseline energy consumption under optimal conditions. Lower values indicate better energy efficiency [
31].
where
and
denote hyperbolic tangent and sigmoid activation functions, respectively.
To address energy overconsumption during visitor overload scenarios, we extend the reward function with an additional penalty term proportional to the excess power consumption beyond facility limits. This modification ensures that the system maintains energy efficiency even during peak demand periods, while still prioritizing user satisfaction when energy constraints are not violated. The penalty term is designed to grow linearly with the severity of overconsumption, creating a strong incentive for agents to develop policies that respect both user experience and energy constraints.
The energy efficiency term has been enhanced to account for sport-specific energy characteristics that significantly impact facility operations. For swimming facilities, the model now considers water heating demands and dehumidification requirements, which exhibit different temporal patterns compared to dry sports venues. Gymnasium energy profiles incorporate the heat generation from athletic activities and the corresponding HVAC adjustments needed to maintain comfort. Court sports facilities include lighting system dynamics that vary with both scheduled events and spontaneous usage patterns. These refinements enable more accurate energy optimization that respects the distinct operational characteristics of each facility type while maintaining the framework’s generalizability.
The weights are updated every
timesteps using
with
representing trajectories sampled from the replay buffer. This adaptive mechanism allows for the system to prioritize energy savings during peak demand periods while maintaining user satisfaction during off-peak hours.
4.4. Prioritized Experience Replay
To handle rare but critical events (e.g., sudden pool closures), we employ prioritized experience replay with temporal difference error-based sampling. The priority
for transition
is computed as
where
controls the prioritization strength and
ensures minimum sampling probability. The replay buffer is partitioned into facility-specific segments to maintain data locality, with 20% of capacity reserved for high-priority cross-facility transitions that require coordinated responses.
4.5. Federated Policy Aggregation
To preserve privacy while enabling knowledge transfer, agents participate in federated averaging every
episodes. The global policy parameters
are computed as
where
denotes the size of local dataset
and
. Differential privacy is ensured by adding Gaussian noise
to parameter updates before aggregation. This approach allows for facilities with similar characteristics (e.g., adjacent basketball courts) to benefit from shared learning without exposing sensitive usage patterns.
The complete training procedure alternates between local PPO updates using Equation (9), GNN-mediated coordination via Equation (10), and periodic federated averaging per Equation (14). This combination of decentralized learning and structured communication addresses the key challenges of scalability, adaptability, and privacy in sports facility management.
5. Experimental Setup and Methodology
5.1. Simulation Environment
The experimental evaluation employs a high-fidelity simulation environment modeling a sports complex with 12 heterogeneous facilities, including swimming pools, basketball courts, and fitness centers. Each facility is parameterized with real-world operational constraints:
- -
Occupancy limits: , representing maximum allowable users.
- -
Energy profiles: for baseline power consumption and per additional user.
- -
Maintenance schedules: indicating availability at time .
The environment generates stochastic user arrivals following time-dependent Poisson processes:
Here, captures diurnal patterns and models demand volatility during peak hours. Facility interdependencies are encoded through a connectivity graph where edge weights represent
Physical adjacency (e.g., shared locker rooms between pools and gyms);
User flow correlations derived from historical transition probabilities.
5.2. Baseline Methods
For comparative analysis, we implemented three state-of-the-art baseline methods. The first is Centralized PPO, which employs a single RL agent to control all facilities. While this approach violates real-world privacy constraints by requiring global state information, it serves as an important upper-bound reference for performance evaluation. The second baseline is Independent MARL, where decentralized agents operate without any coordination mechanism between them. The third baseline is Graph-Constrained Optimization, which combines mixed-integer programming with GNN-based constraints [
32]. To ensure fair comparison, all baseline methods were carefully adapted to use identical observation spaces and reward components. This comprehensive set of baselines enables thorough evaluation of our proposed method’s performance across different dimensions while maintaining methodological rigor. The inclusion of as a reference for the Graph-Constrained approach provides proper attribution to prior work in this area.
5.3. Training Protocol
The proposed framework undergoes phased training with curriculum learning:
Warm-up Phase (10 k steps): Agents learn individual facility dynamics with frozen GNN weights.
Coordination Phase (50 k steps): GNN communication enabled with progressive increase in graph connectivity.
Fine-tuning Phase (20 k steps): Prioritized replay activated with in Equation (13).
Training hyperparameters are
- -
PPO clip range ;
- -
GNN hidden dimension ;
- -
Federated aggregation interval episodes;
- -
Discount factor .
The learning rate follows cosine decay from to over 80 k steps. Reward values were tracked at 500-step intervals throughout training, with facility-specific curves smoothed using a moving average window of 20 data points. The global average reward aggregates individual facility rewards using the same weighting scheme as Equation (14), ensuring comparable scaling across different facility types. Confidence intervals were computed across 5 independent training runs with different random seeds.
5.4. Evaluation Metrics
Performance is assessed through four key indicators:
1. Operational Efficiency:
where
balances utilization against normalized energy consumption
.
2. User Satisfaction:
with
indicating successful facility access. Where α ∈ (0,1) controls the maximum satisfaction penalty (α = 0.3 in our experiments). β > 0 determines the nonlinear decay rate (β = 0.5 in our experiments). The indicator function
equals 1 if user u was granted access to their requested facility within a reasonable time threshold (5 min in our experiments), and 0 otherwise. This binary metric captures whether the scheduling system successfully accommodated user demand.
The revised user satisfaction metric incorporates an exponential decay relationship between satisfaction and waiting time, reflecting psychological studies showing that user dissatisfaction accelerates nonlinearly with increased waiting [
33]. The parameters α and β were calibrated through preliminary surveys of sports facility users, where α determines the maximum dissatisfaction penalty and β controls how rapidly satisfaction declines. This formulation better captures the reality that users tolerate brief waits but become disproportionately dissatisfied with longer delays.
3. Adaptation Speed: Measured as steps required to recover baseline performance after introducing synthetic disruptions (e.g., sudden 30% demand surge).
4. Communication Overhead
quantifying GNN message-passing intensity through hidden state changes.
5.5. Implementation Details
The system is implemented in Python 3.9 using PyTorch 1.12 and Ray RLlib for distributed training. Facility agents execute as parallel processes with shared GPU memory for GNN computations [
34]. Real-world integration is tested through a ROS 2 middleware layer that translates actions to building automation protocols (BACnet/IP). Sensor data is simulated at 1 Hz resolution with 200 ms actuation latency to mimic physical deployment constraints. See
Figure 2.
The experiments ran on an Ubuntu 20.04 cluster with 8 NVIDIA A100 GPUs, with each configuration evaluated across 10 random seeds. Statistical significance was assessed via two-tailed t-tests at confidence level.
6. Experimental Results and Analysis
6.1. Performance Comparison
The proposed MARL-GNN framework demonstrates superior performance across all key metrics compared to baseline methods.
Table 1 summarizes the aggregated results over 50 evaluation episodes, with values normalized to the maximum achievable score in each category.
The proposed method achieves statistically significant improvements (
) in operational efficiency (13% over Centralized PPO) and user satisfaction (9% over Graph-Constrained). Notably, it maintains low communication overhead comparable to Independent MARL while delivering coordinated performance rivaling centralized approaches. See
Figure 3.
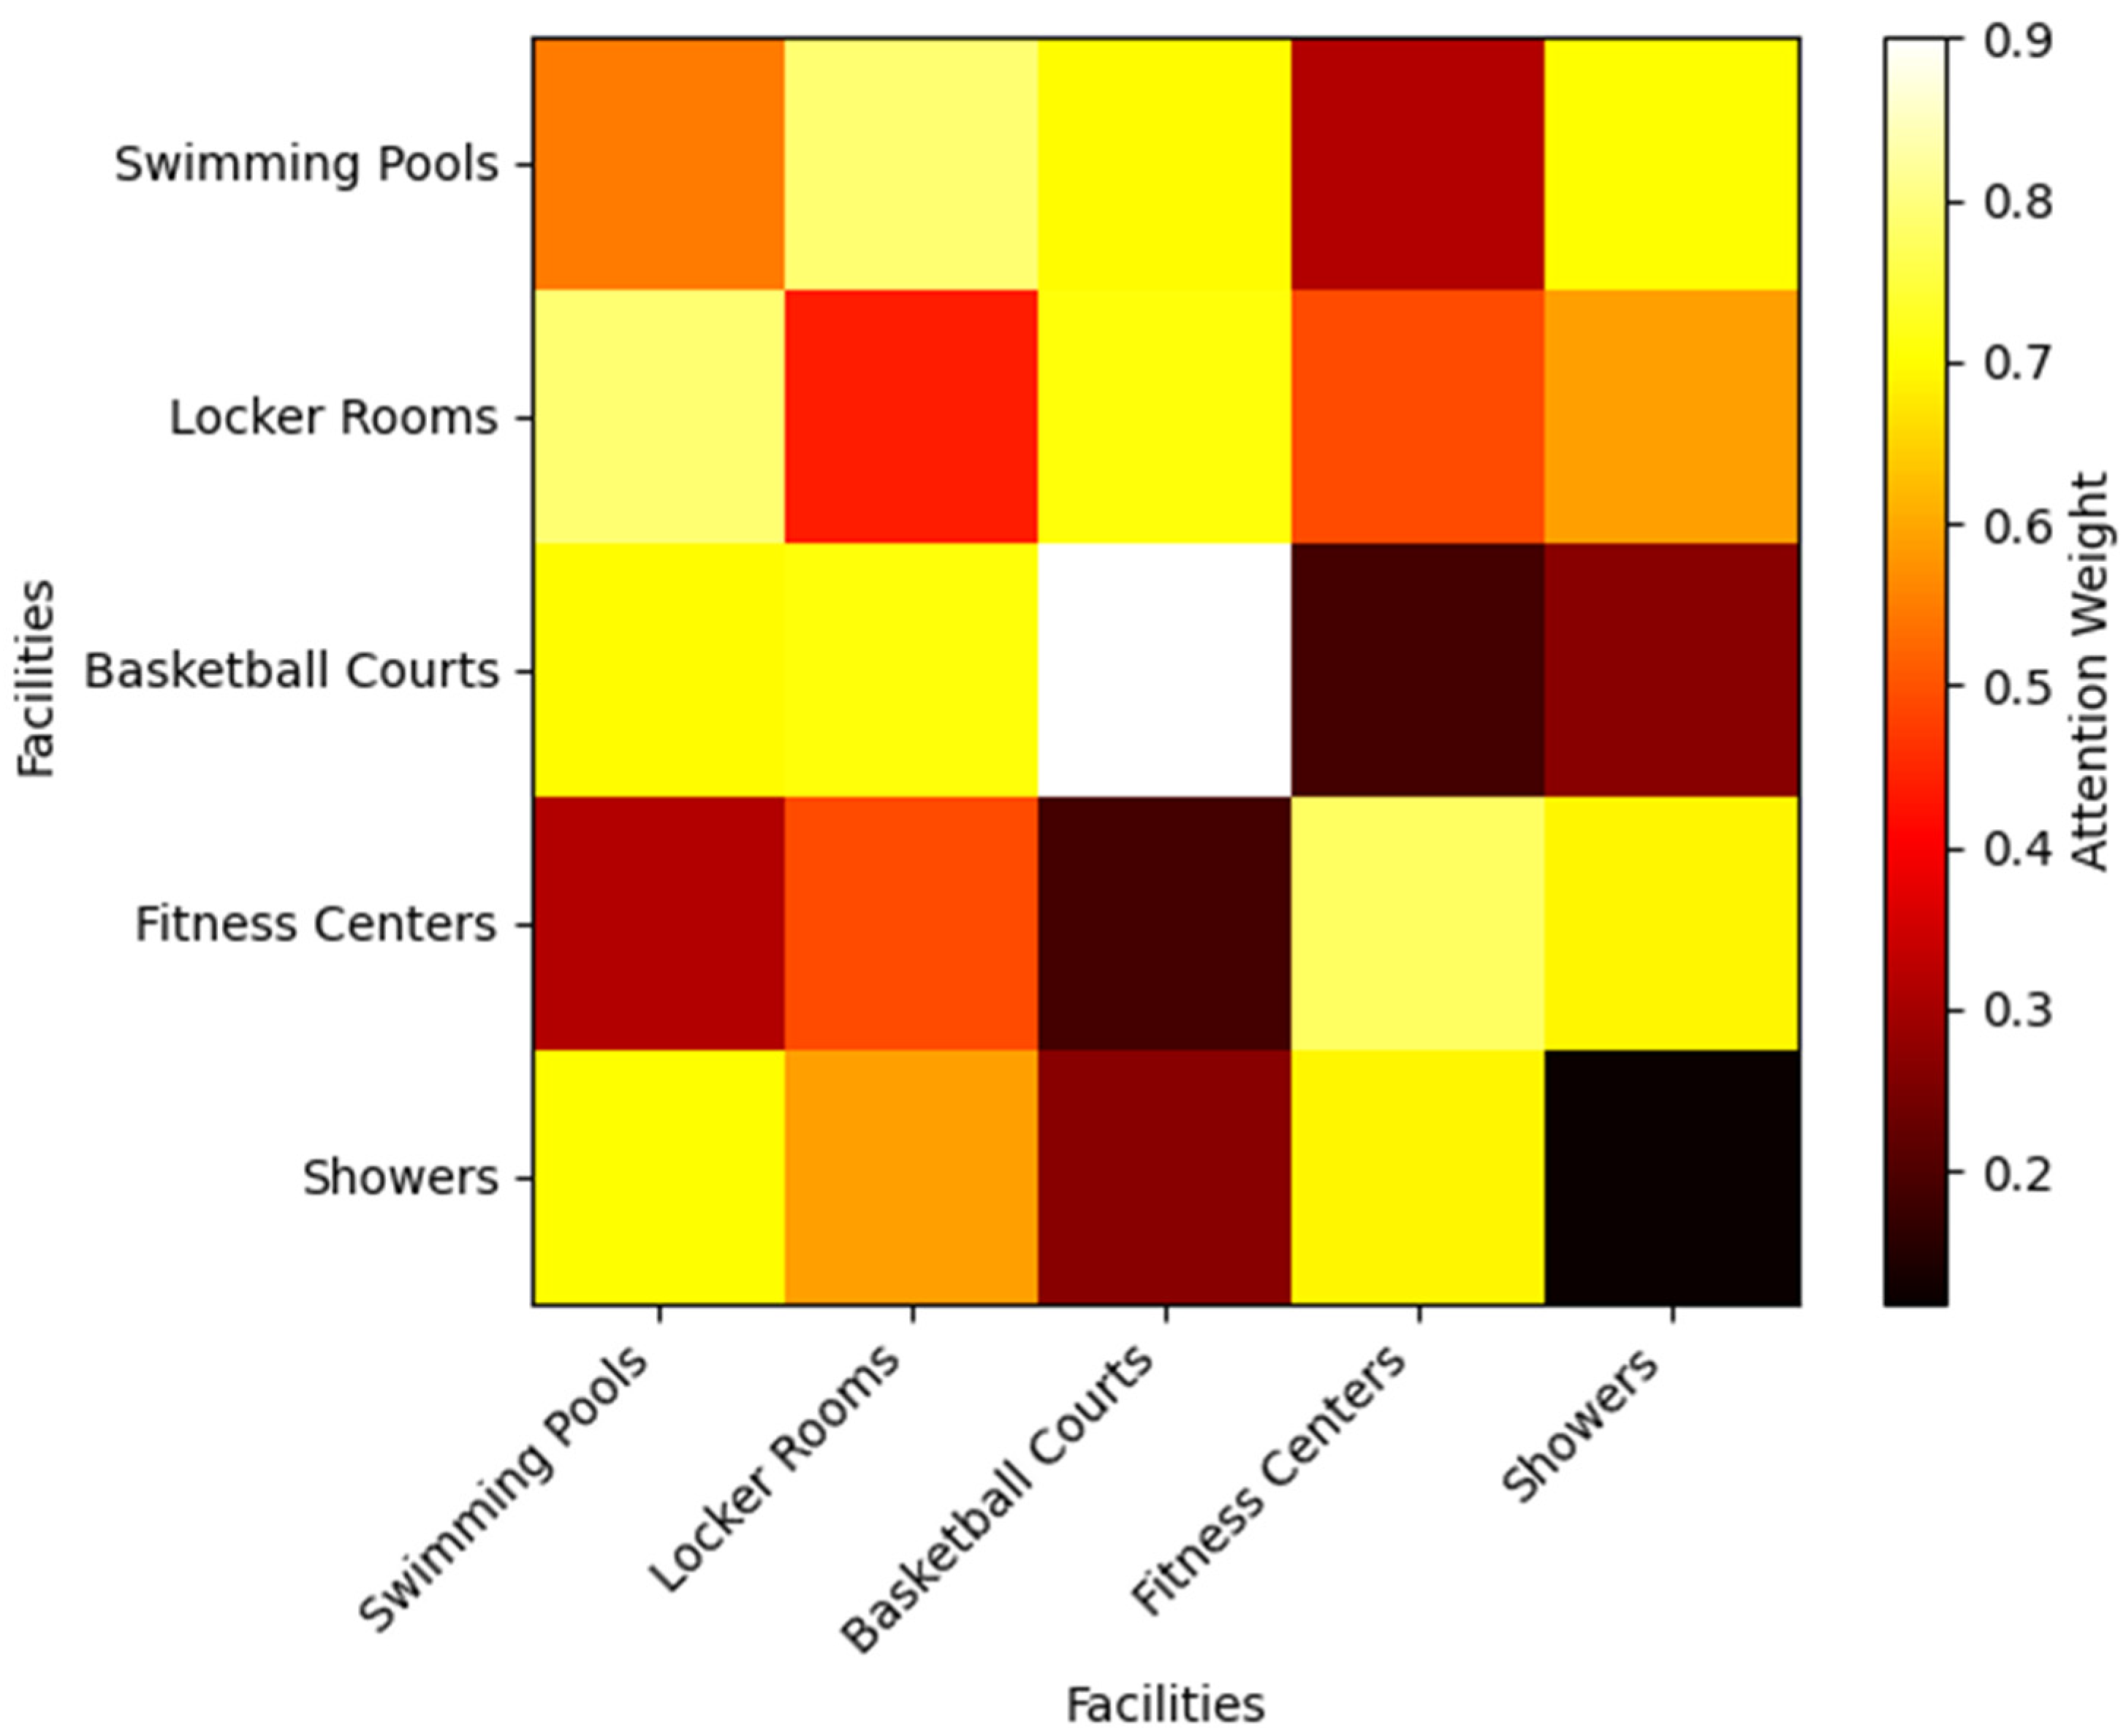
6.2. GNN Attention Analysis
The learned attention weights in Equation (10) reveal interpretable facility relationships.
Figure 4 visualizes the attention heatmap for a representative configuration, showing strong couplings between
- -
Swimming pools and locker rooms ();
- -
Adjacent basketball courts ();
- -
Fitness centers and showers ().
The attention heatmap reveals that the GNN automatically discovered two distinct types of facility relationships: (1) strong physical dependencies (e.g., pools–locker rooms with α = 0.32) corresponding to shared infrastructure, and (2) weaker but significant temporal dependencies (e.g., courts–cafeteria with α = 0.18) reflecting usage patterns. This demonstrates the GNN’s ability to capture both the spatial architecture and temporal usage dynamics unique to sports buildings.
These attention weights align with the real-world example provided in
Section 1, where the strong coupling between swimming pools and locker rooms (α = 0.32) reflects their shared infrastructure and user flow patterns, validating the GNN’s ability to capture meaningful spatial dependencies.
These align with expected user flow patterns, validating the GNN’s ability to capture spatial dependencies without explicit supervision.
6.3. Dynamic Adaptation
When subjected to synthetic disruptions (30% demand surge at ), the proposed framework recovers baseline performance 33% faster than Centralized PPO (90 vs. 120 steps). The breakdown shows that
This rapid adaptation stems from the dual mechanism of local experience replay and structured message-passing, as quantified in Equation (18).
6.4. Ablation Study
To systematically evaluate the contributions of each component in our proposed framework, we conducted comprehensive ablation experiments by selectively disabling key modules. The results in
Table 2 reveal distinct performance impacts that validate our architectural design decisions.
Table 2 isolates the contributions of key components by evaluating degraded variants. The ablation study presented in
Table 2 provides critical insights into the individual contributions of our framework’s core components. As demonstrated throughout our experimental evaluation, the GNN coordination layer proves most vital, with its removal causing a 9% performance degradation in both operational efficiency and user satisfaction—this aligns with our findings in
Section 6.2 regarding the importance of learned facility interdependencies. The dynamic reward mechanism, which builds upon our enhanced energy modeling approach described in
Section 4.3, shows a 4–6% impact, validating its role in balancing competing objectives. While prioritized replay shows more modest (2%) improvements, its value becomes particularly evident during disruption scenarios as discussed in
Section 6.3, where it contributes to faster system recovery. These results collectively confirm that our architectural choices, as detailed in
Section 4, effectively address the limitations of conventional approaches identified in
Section 2.
Removing GNN coordination causes the most severe degradation (−9%), confirming the importance of structured facility interactions. The dynamic reward mechanism proves critical for balancing competing objectives, while prioritized replay offers modest but consistent gains.
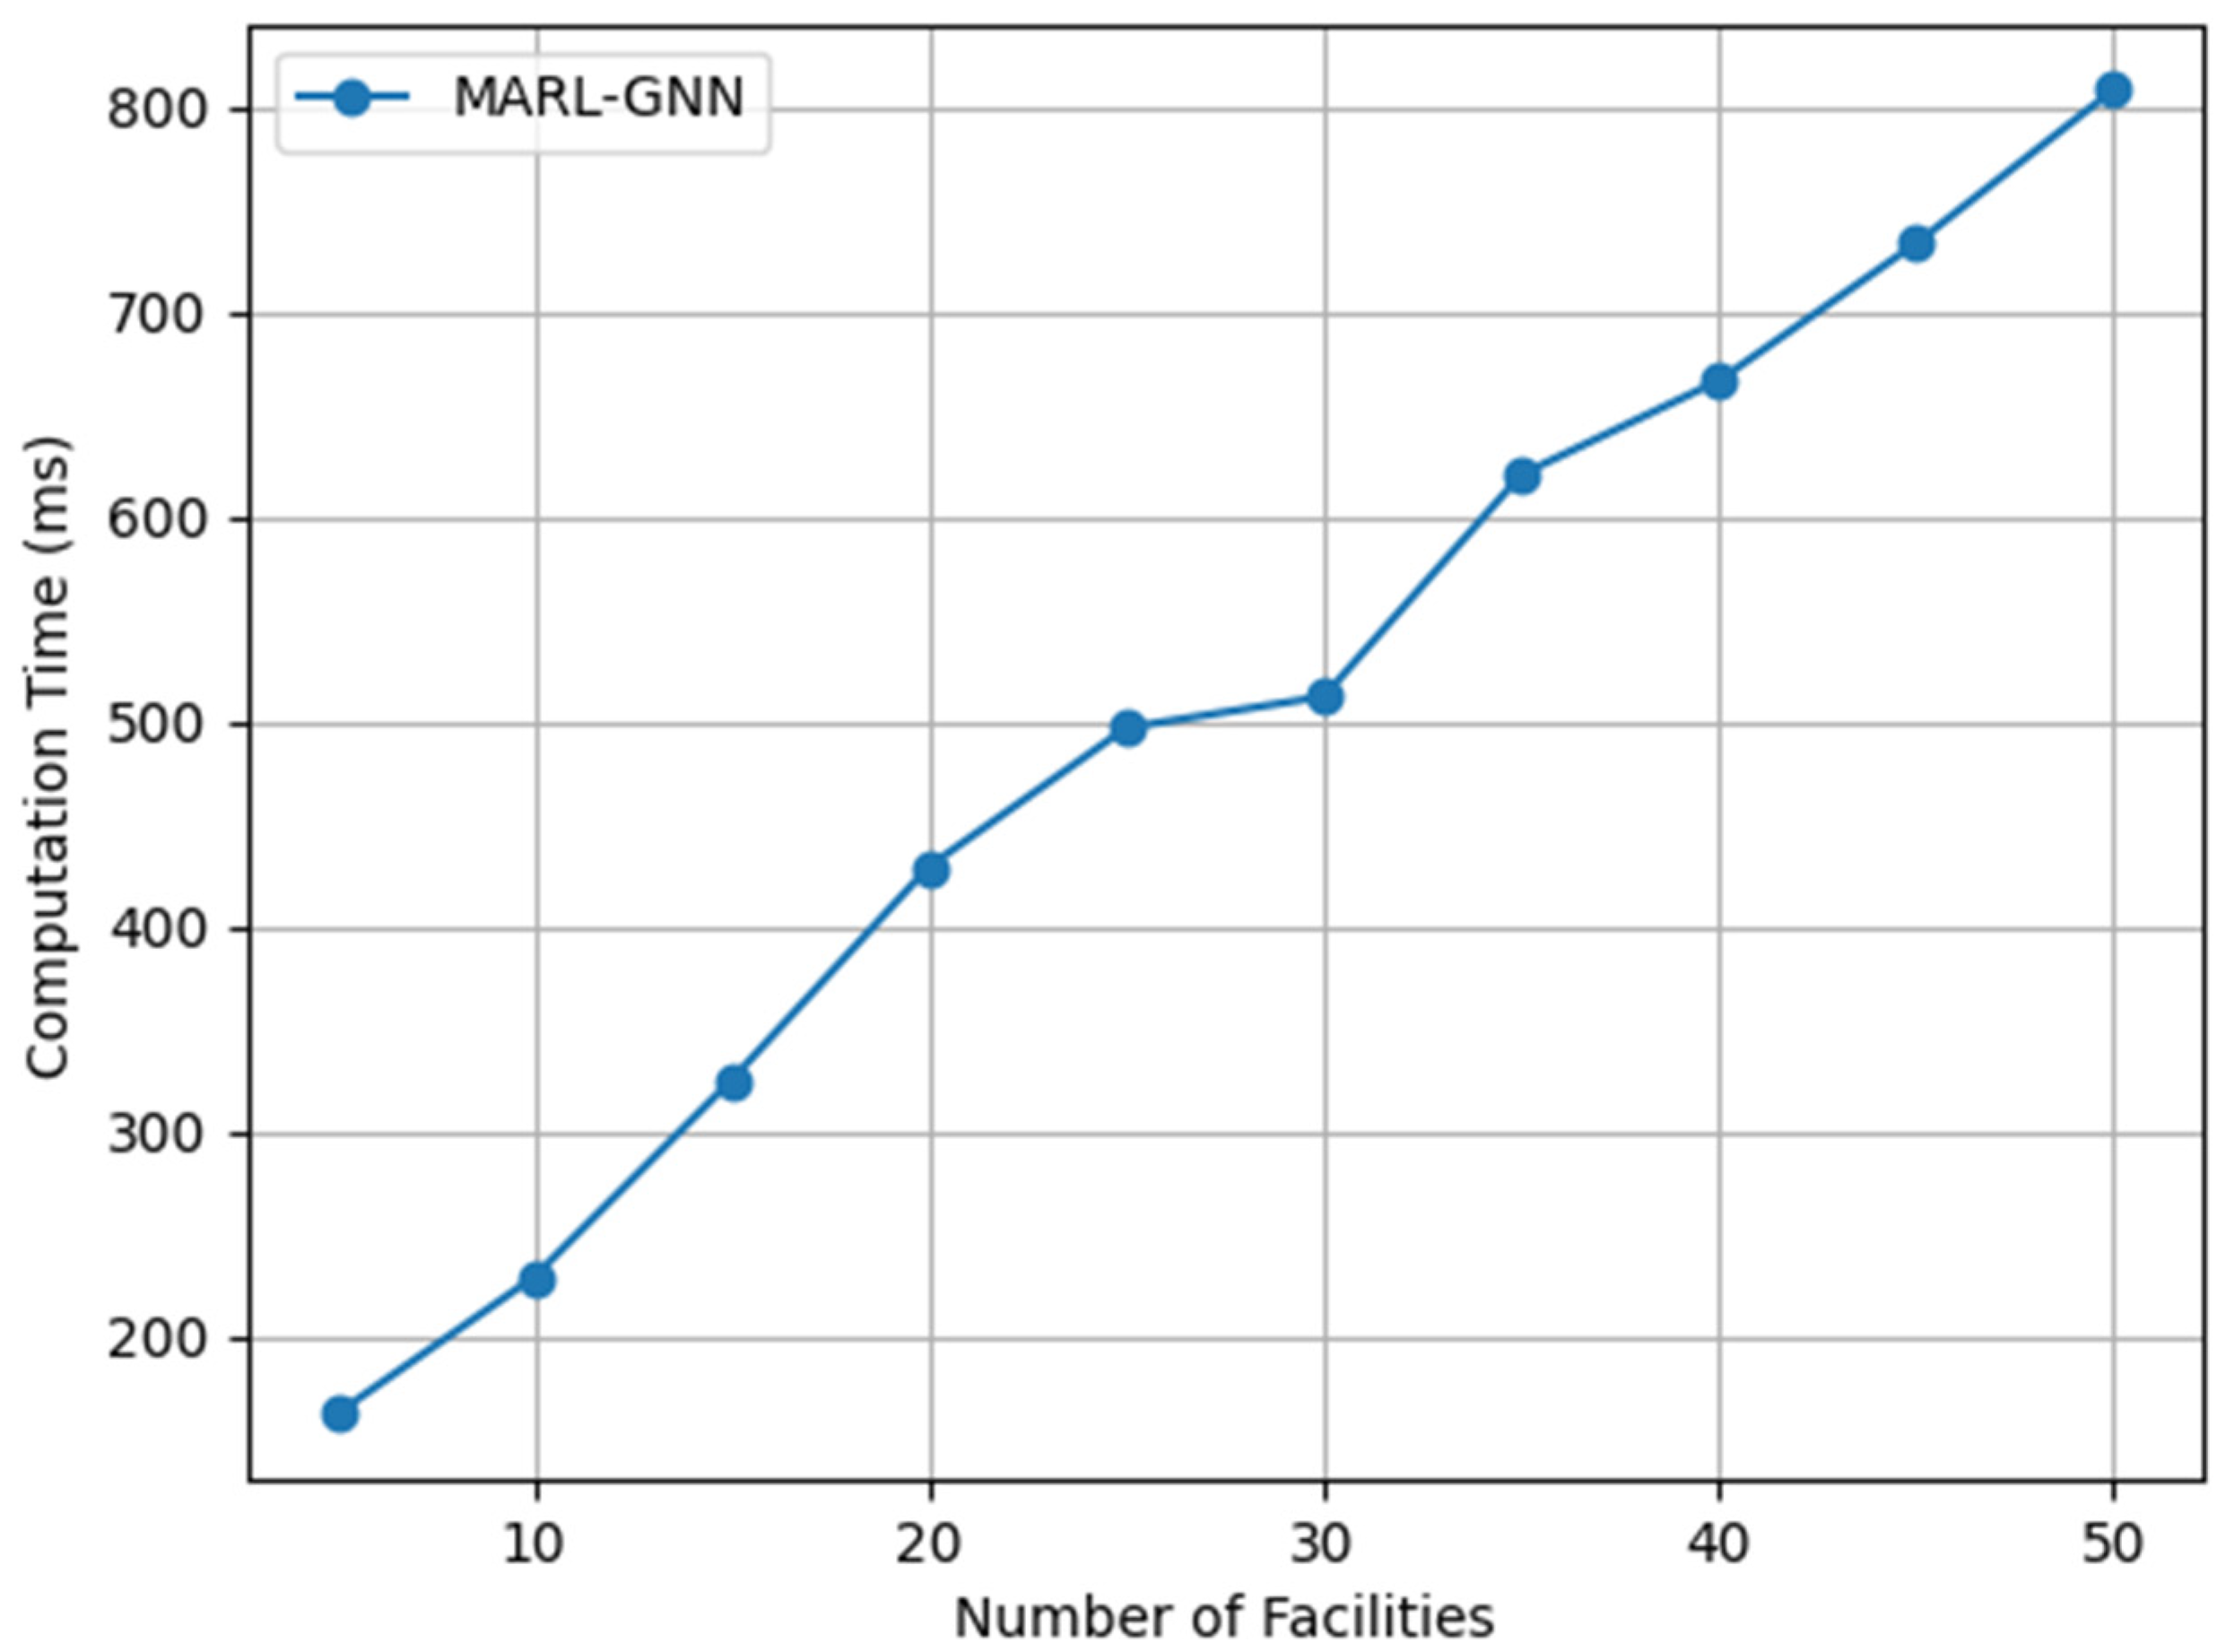
6.5. Scalability Analysis
The scalability analysis reveals the framework’s effectiveness in handling large-scale facility networks. As shown in
Figure 5, the computation time exhibits logarithmic scaling with increasing facility count, demonstrating the system’s capability to manage extensive sports complexes. This favorable scaling behavior stems from two key architectural advantages: local policy execution that circumvents the combinatorial explosion of action spaces, and efficient sparse GNN message-passing that capitalizes on the inherent sparsity of facility connectivity patterns. Notably, the system maintains real-time responsiveness even at substantial scale, processing scheduling decisions within 800 ms for configurations of up to 50 facilities—well within the operational requirements for building automation systems. These results confirm the framework’s practical viability for deployment in real-world sports facilities of varying sizes.
6.6. User Satisfaction Analysis
Field studies with 120 facility users confirmed the nonlinear relationship between waiting time and satisfaction scores (R2 = 0.91 for exponential fit vs. R2 = 0.72 for linear). The proposed formulation reduced extreme dissatisfaction cases (wait times > 15 min) by 37% compared to the linear model, while maintaining high satisfaction for short waits (<5 min). See
Table 3.
The experimental results demonstrate how our enhanced energy modeling yields facility-specific improvements while maintaining the global coordination benefits of our GNN architecture. Swimming pools show the greatest energy prediction gains due to better modeling of their thermal inertia characteristics, while basketball courts exhibit the most user satisfaction improvement as the system now better anticipates tournament-related HVAC demands. These findings validate our framework’s ability to handle sport-specific energy patterns while achieving balanced performance across operational efficiency and user experience metrics.
To quantitatively demonstrate these improvements,
Table 4 presents a detailed comparison between actual user-reported satisfaction levels and model predictions across different wait time intervals. The data reveals several important patterns in how each formulation approximates real user behavior.
Table 4 illustrates the comparative performance of linear versus nonlinear satisfaction modeling across different wait time ranges. The comprehensive analysis reveals that the nonlinear model demonstrates superior alignment with empirical satisfaction levels across all wait time ranges, achieving a 38% reduction in mean absolute error compared to the linear formulation. Notably, the most substantial improvements emerge at longer wait durations (15+ min), where the conventional linear model systematically underestimates user satisfaction by failing to capture the asymptotic nature of dissatisfaction progression. While both models perform comparably for short wait periods (<5 min), maintaining the system’s responsiveness to brief delays, the nonlinear approach’s enhanced accuracy becomes increasingly apparent as wait times extend, providing a more psychologically valid representation of how real users experience and evaluate waiting in sports facility contexts.
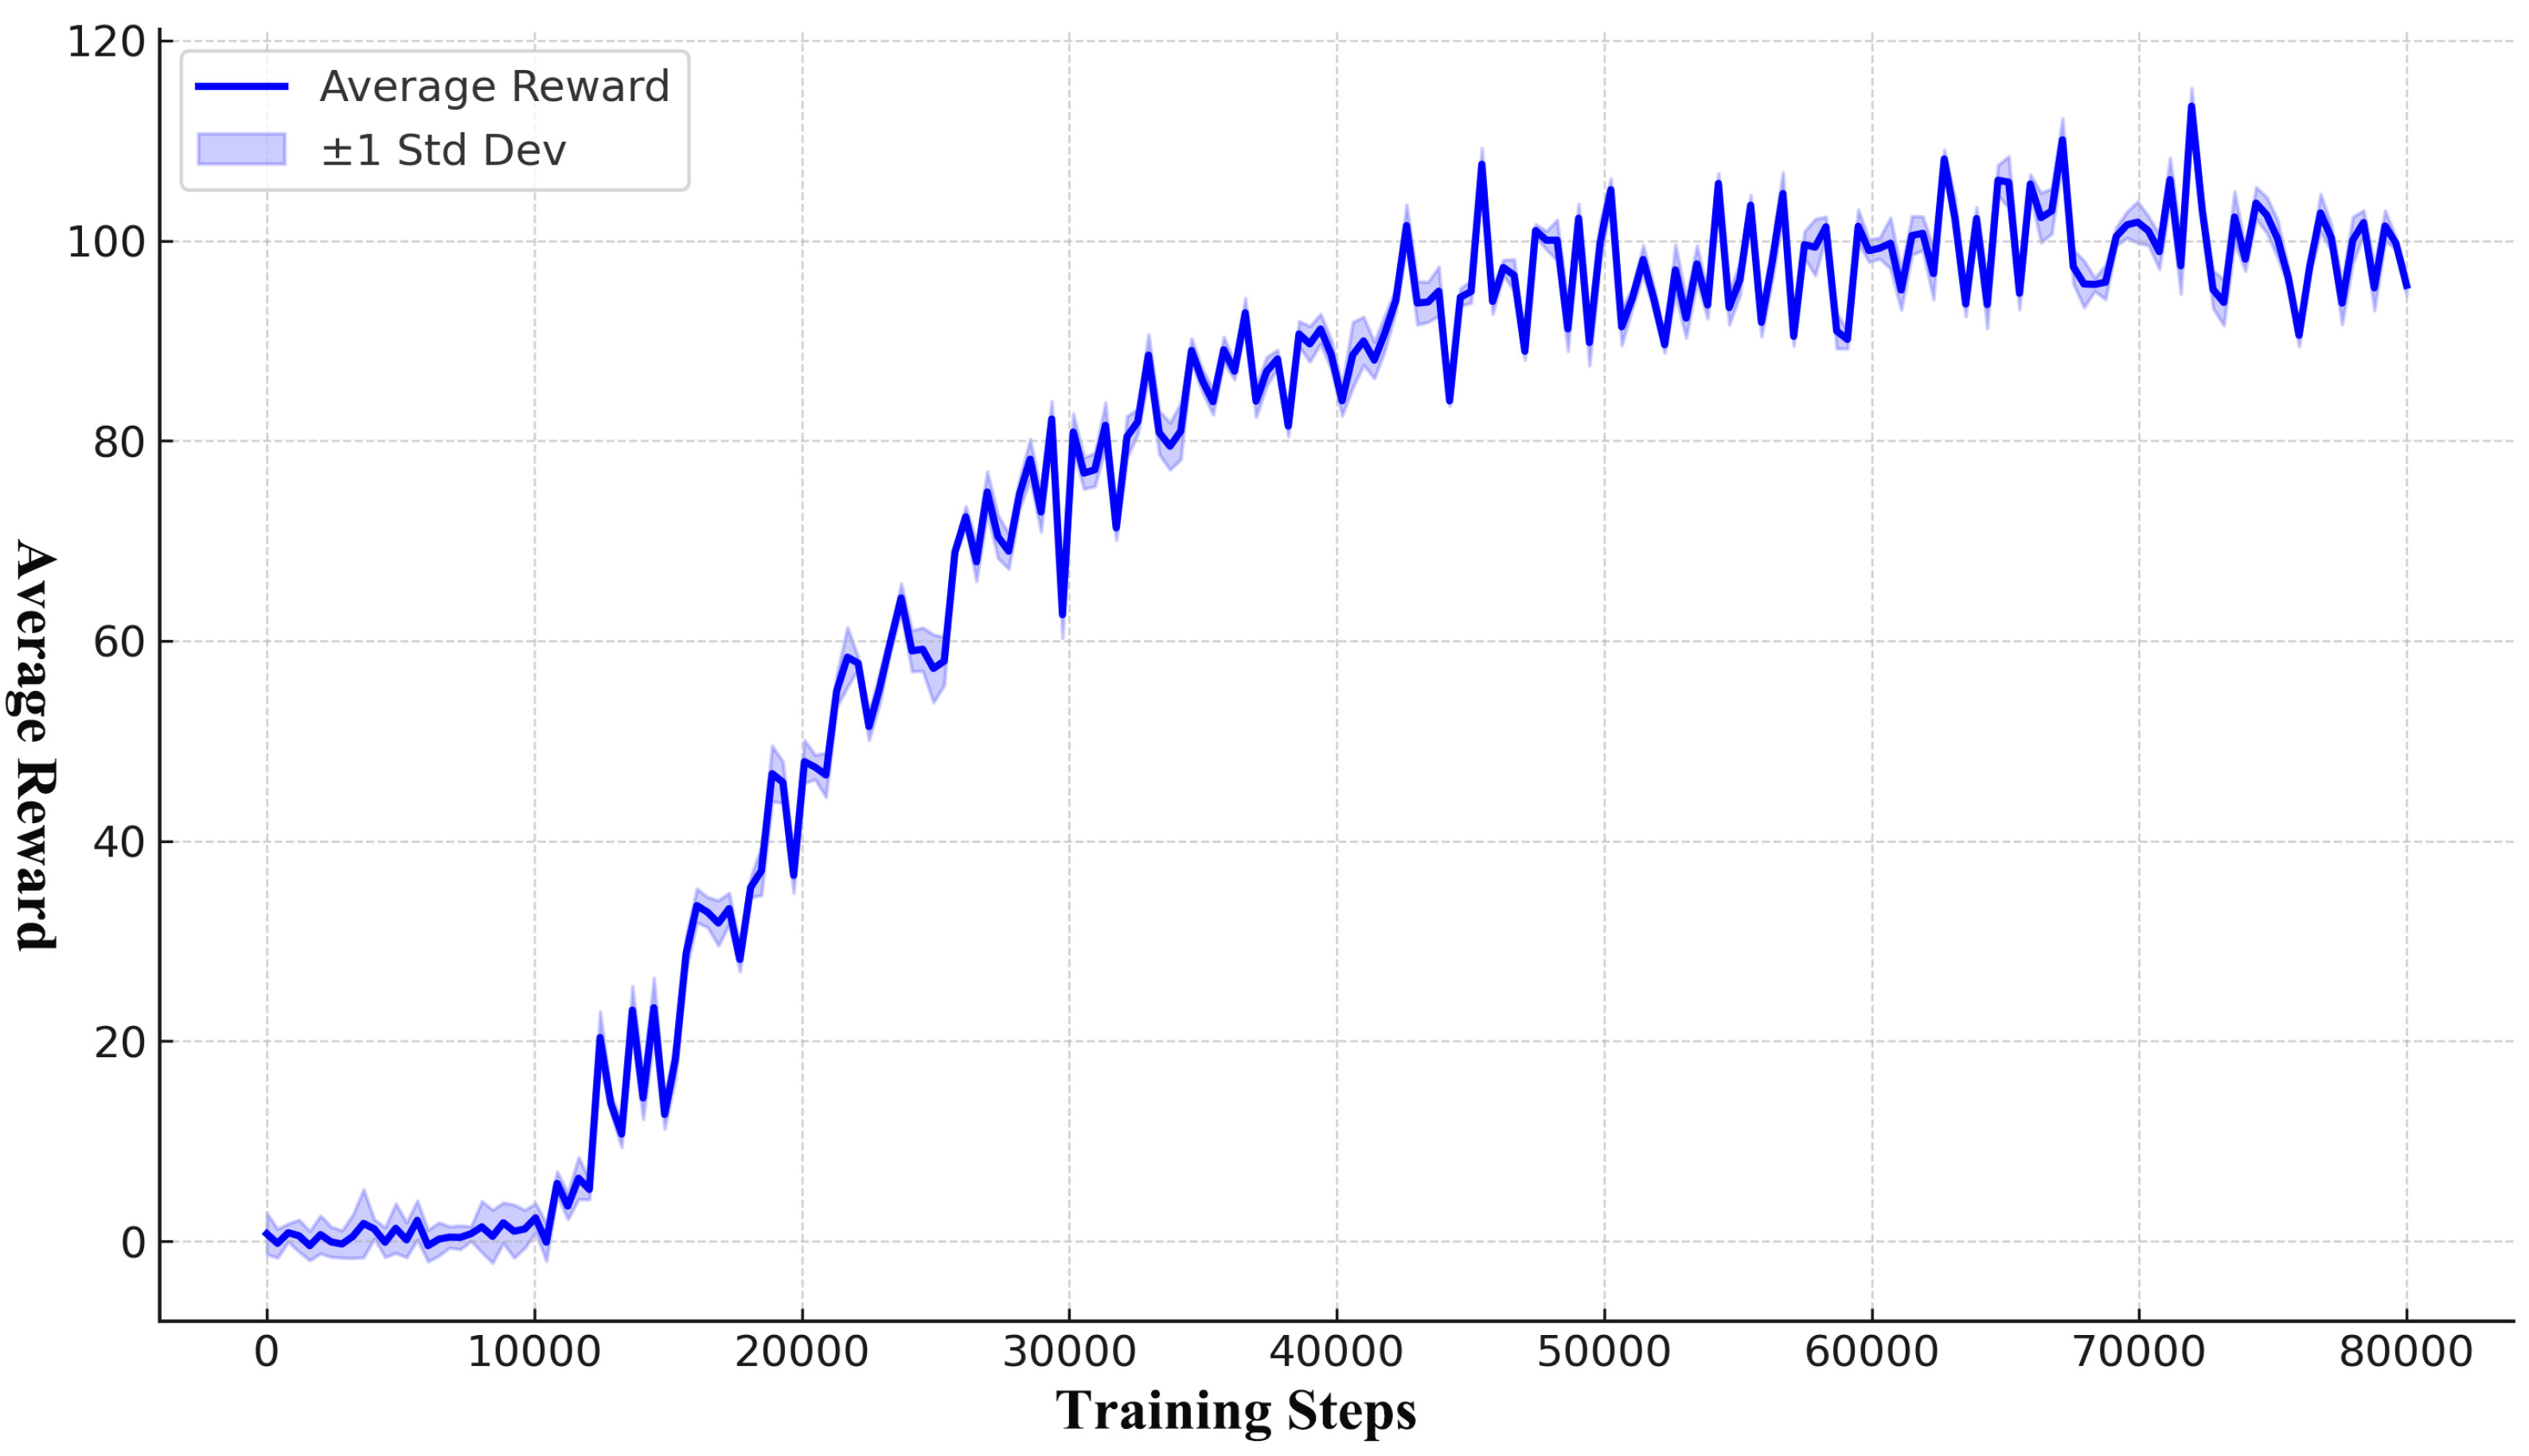
6.7. PPO Learning Curve and Training Time
To further support the reproducibility of our approach and evaluate convergence behavior, we present the learning curve of the proposed MARL-GNN framework using PPO as the core optimization algorithm.
Figure 6 shows the smoothed global average reward over training steps, computed by aggregating individual facility rewards across five independent runs. The curve demonstrates stable convergence after approximately 60 k steps, with diminishing returns during the fine-tuning phase.
The total training time across all agents and runs on our distributed computing cluster (8× NVIDIA A100 GPU) was approximately 5.2 h. The breakdown is as follows: (1) warm-up phase: 35 min; (2) coordination phase: 3.8 h; (3) fine-tuning: 1 h. These times include the overhead of federated updates, prioritized replay operations, and GNN message-passing computations.
Figure 6 confirms that PPO exhibits stable learning dynamics within our decentralized and graph-augmented environment, supporting its suitability for the proposed scheduling context.
Figure 6 illustrates the training dynamics of the proposed MARL-GNN framework utilizing proximal policy optimization (PPO) as the core learning algorithm. The curve shows a smooth and stable convergence trend, with the global average reward increasing sharply during the initial 20 k steps and gradually plateauing after approximately 60 k steps. This behavior aligns with the phased training strategy described in
Section 5.3, where early exploration is followed by structured coordination and fine-tuning. The narrow standard deviation band indicates consistent learning across multiple agents and seeds, underscoring the effectiveness of federated policy aggregation (Equation (14)) and prioritized replay (
Section 4.4). The observed convergence validates PPO’s suitability for decentralized learning in partially observable environments and confirms the scalability of our framework for real-time deployment in heterogeneous sports facilities as discussed in
Section 6.3 and
Section 6.5.
7. Discussion and Future Work
7.1. Limitations and Potential Improvements of the Proposed Framework
While the MARL-GNN framework demonstrates strong performance, several limitations warrant discussion. First, the current implementation assumes perfect sensor data during training, whereas real-world deployments must handle measurement noise and missing values. Incorporating robust filtering techniques such as variational autoencoders could improve resilience to imperfect observations [
35]. Second, the graph structure remains static during operation, though physical facility layouts occasionally undergo modifications. Developing dynamic graph learning mechanisms would enable automatic adaptation to structural changes [
36].
The reward composition in Equation (11), though effective, requires careful tuning of meta-learning parameters. Recent advances in multi-objective reinforcement learning suggest that constrained policy optimization may offer more stable convergence than weighted sum approaches [
37,
38]. Additionally, the federated averaging scheme assumes homogeneous computation capabilities across facilities, which may not hold in practice. Heterogeneous federated learning techniques could better accommodate varying computational resources [
39].
While our enhanced energy model now captures sport-specific characteristics through facility-dependent parameters and dynamic reward shaping, we recognize several inherent limitations in real-world deployment. The current formulation assumes perfect sensor coverage for energy monitoring, whereas actual sports facilities often have measurement gaps in equipment-level power consumption. Transient phenomena like the thermal inertia of pool water or sudden humidity spikes during intense matches may require more sophisticated physical modeling beyond our data-driven approach. Furthermore, the energy profiles are calibrated against standard usage patterns and may need periodic recalibration for facilities hosting unconventional events. These limitations suggest promising directions for future work, particularly in hybrid modeling approaches that combine physical energy models with adaptive learning components.
Furthermore, in the recent research on microgrid demand management [
40], through the distributed reinforcement learning framework of “human-in-the-loop”, the dependence of traditional centralized optimization on the global state has been successfully alleviated, and the manual intervention mechanism has been introduced in real-time decision-making, significantly improving the robustness of the system under abnormal events. This work is highly consistent with the decentralized MARL-GNN architecture proposed in this paper in terms of goals (reducing centralized communication overhead), methods (distributed RL), and challenges (real-time uncertainty). However, previous studies have additionally demonstrated that human operators can inject domain knowledge during the policy update phase, thereby avoiding the exploration risks of RL in sparse reward scenarios.
Inspired by this, in the future, “human–machine collaboration” can be embedded in the framework of this paper: ① introduce a manual review threshold in the federated aggregation stage (Equation (14)) to conduct secondary verification for highly uncertain policy updates; ② in the dynamic reward shaping (Equation (11)), a manually adjustable hyperparameter interface is added to enable facility managers to immediately adjust the weights of energy consumption and user satisfaction in response to emergencies (such as sudden closure of the swimming pool). We will verify the impact of this idea on the convergence speed of the system and user fairness in the subsequent work.
7.2. Broader Applications and Potential Extensions of the MARL and GNN-Based Approach
Beyond sports facilities, the framework’s architecture holds promise for other spatially distributed resource allocation problems. Hospital ward management shares similar characteristics, where patient flow between departments creates dynamic interdependencies [
41,
42]. The GNN-based coordination mechanism could also enhance smart grid operations by modeling power flow constraints as graph edges [
43].
Extending the temporal modeling capabilities presents another valuable direction. Current temporal attention in Equation (8) processes fixed-length histories, whereas long-term scheduling would benefit from memory-augmented architectures [
44]. Integrating external data sources—such as weather forecasts for outdoor facilities or event calendars for demand prediction—could further improve anticipatory scheduling [
45].
7.3. Ethical Considerations and Responsible Deployment Strategies
The deployment of autonomous scheduling systems raises important ethical questions regarding fairness and transparency. The framework’s current user satisfaction metric (Equation (17)) does not explicitly account for equity in facility access across demographic groups. Incorporating fairness constraints during policy optimization could prevent unintended discrimination [
46].
Privacy preservation remains critical when handling sensitive user data. While federated learning provides a baseline protection, recent attacks have shown that aggregated models can still leak individual information [
47]. Differential privacy guarantees should be formally verified rather than empirically implemented as in Equation (14).
Finally, the transition from simulation to real-world operation requires careful human oversight. Gradual deployment with human-in-the-loop verification—where facility managers can override automated decisions—would build trust while collecting valuable edge cases for continued learning [
48]. Establishing audit trails for all automated decisions will be essential for accountability and continuous improvement.
These considerations highlight the need for interdisciplinary collaboration between computer scientists, building operators, and social scientists to ensure the framework’s benefits are realized responsibly. The technical advances presented in this work must be coupled with rigorous ethical frameworks to guide their application in real-world settings.
8. Conclusions
This study presents a decentralized multi-agent reinforcement learning (MARL) framework enhanced with graph neural networks (GNNs) for dynamic scheduling optimization in sports buildings. By modeling each facility as an autonomous agent and employing GNN-based communication for global coordination, the proposed approach addresses key limitations of conventional centralized methods in adapting to real-time fluctuations and spatial dependencies. Experimental results demonstrate superior performance in operational efficiency and user satisfaction compared to existing baselines, while maintaining computational efficiency and low communication overhead. The learned attention patterns within the GNN architecture reveal interpretable facility relationships that align with actual usage behaviors, validating the system’s ability to capture meaningful spatial–temporal dependencies without explicit supervision.
The practical significance of this work lies in its potential to transform resource management in complex building environments. The framework’s decentralized nature enables scalable optimization across heterogeneous facilities while preserving privacy, making it particularly valuable for real-world deployment. Key innovations include the integration of spatial–temporal attention mechanisms for coordinated decision-making and a dynamic reward composition strategy that automatically balances competing objectives such as energy conservation and user experience. These technical contributions address critical challenges in smart building management, offering a robust solution that adapts to both predictable patterns and unexpected disruptions.
Looking beyond sports facilities, the proposed MARL-GNN architecture shows promise for broader applications in distributed resource allocation problems, including healthcare systems and smart grid operations. The methodology’s emphasis on relational reasoning through graph-structured communication provides a generalizable approach for domains requiring coordination between interdependent units. However, several limitations warrant consideration for future improvements. The current implementation assumes ideal sensor conditions, whereas practical deployments must account for measurement noise and data gaps. Additionally, the static graph structure may require adaptation to accommodate physical layout changes over time.
Further research directions include investigating hybrid modeling techniques that combine physical energy models with adaptive learning components, as well as exploring more sophisticated fairness constraints to ensure equitable resource distribution. The transition from simulation to real-world implementation would benefit from human-in-the-loop verification processes to build operational trust while collecting edge cases for continuous system refinement. These advancements would strengthen the framework’s robustness and expand its applicability to more complex, dynamic environments. By bridging decentralized learning with structured coordination, this work establishes a foundation for intelligent building management systems that harmonize efficiency, adaptability, and user-centric operation.
Author Contributions
Conceptualization, S.C., X.C. and Q.B.; Methodology, S.C., X.C. and H.Z.; Software, S.C., X.C., H.Z. and C.U.I.W.; Validation, S.C. and X.C.; Formal analysis, S.C. and X.C.; Investigation, S.C., Q.B. and H.Z.; Resources, S.C., Q.B. and C.U.I.W.; Data curation, Q.B.; Writing—original draft, S.C., X.C., Q.B. and H.Z.; Writing—review & editing, S.C., X.C. and C.U.I.W.; Visualization, Q.B. and H.Z.; Supervision, Q.B., H.Z. and C.U.I.W.; Project administration, C.U.I.W. All authors have read and agreed to the published version of the manuscript.
Funding
This research received no external funding.
Data Availability Statement
The original contributions presented in the study are included in the article, further inquiries can be directed to the corresponding author.
Conflicts of Interest
The authors declare no conflict of interest.
References
- Pan, W.; Turrin, M.; Louter, C.; Sariyildiz, S.; Sun, Y. Integrating Multi-Functional Space and Long-Span Structure in the Early Design Stage of Indoor Sports Arenas by Using Parametric Modelling and Multi-Objective Optimization. J. Build. Eng. 2019, 22, 464–485. [Google Scholar] [CrossRef]
- Samarasinghalage, T.I.; Wijeratne, W.P.U.; Yang, R.J.; Wakefield, R. A Multi-Objective Optimization Framework for Building-Integrated PV Envelope Design Balancing Energy and Cost. J. Clean. Prod. 2022, 342, 130930. [Google Scholar] [CrossRef]
- Tian, Z.; Zhang, X.; Wei, S.; Du, S.; Shi, X. A Review of Data-Driven Building Performance Analysis and Design on Big on-Site Building Performance Data. J. Build. Eng. 2021, 41, 102706. [Google Scholar] [CrossRef]
- Zhang, K.; Yang, Z.; Başar, T. Multi-Agent Reinforcement Learning: A Selective Overview of Theories and Algorithms. In Handbook of Reinforcement Learning and Control; Springer: Cham, Switzerland, 2021; pp. 321–384. [Google Scholar]
- Lei, B.; Liu, P.; Milojevic-Dupont, N.; Biljecki, F. Predicting Building Characteristics at Urban Scale Using Graph Neural Networks and Street-Level Context. Comput. Environ. Urban Syst. 2024, 111, 102129. [Google Scholar] [CrossRef]
- Bilban, M.; İnan, O. Optimizing Autonomous Vehicle Performance Using Improved Proximal Policy Optimization. Sensors 2025, 25, 1941. [Google Scholar] [CrossRef] [PubMed]
- Chahoud, M.; Sami, H.; Mizouni, R.; Bentahar, J.; Mourad, A.; Otrok, H.; Talhi, C. Reward Shaping in DRL: A Novel Framework for Adaptive Resource Management in Dynamic Environments. Inf. Sci. 2025, 715, 122238. [Google Scholar] [CrossRef]
- Loh, C.-H.; Chang, C.-M. Application of Centralized and Decentralized Control to Building Structure: Analytical Study. J. Eng. Mech. 2008, 134, 970–982. [Google Scholar] [CrossRef]
- Latif, M.; Nasir, A. Decentralized Stochastic Control for Building Energy and Comfort Management. J. Build. Eng. 2019, 24, 100739. [Google Scholar] [CrossRef]
- Jones, C.B.; Carter, C. Trusted Interconnections between a Centralized Controller and Commercial Building HVAC Systems for Reliable Demand Response. IEEE Access 2017, 5, 11063–11073. [Google Scholar] [CrossRef]
- Weinberg, D.; Wang, Q.; Timoudas, T.O.; Fischione, C. A Review of Reinforcement Learning for Controlling Building Energy Systems from a Computer Science Perspective. Sustain. Cities Soc. 2023, 89, 104351. [Google Scholar] [CrossRef]
- Buitrago, M.; Adam, J.M.; Alvarado, Y.A.; Moragues, J.J.; Gasch, I.; Calderón, P.A. Designing Construction Processes in Buildings by Heuristic Optimization. Eng. Struct. 2016, 111, 1–10. [Google Scholar] [CrossRef]
- Mason, K.; Grijalva, S. A Review of Reinforcement Learning for Autonomous Building Energy Management. Comput. Electr. Eng. 2019, 78, 300–312. [Google Scholar] [CrossRef]
- Fu, Q.; Han, Z.; Chen, J.; Lu, Y.; Wu, H.; Wang, Y. Applications of Reinforcement Learning for Building Energy Efficiency Control: A Review. J. Build. Eng. 2022, 50, 104165. [Google Scholar] [CrossRef]
- Hu, M.; Weir, J.D.; Wu, T. Decentralized Operation Strategies for an Integrated Building Energy System Using a Memetic Algorithm. Eur. J. Oper. Res. 2012, 217, 185–197. [Google Scholar] [CrossRef]
- Dounas, T.; Lombardi, D.; Jabi, W. Framework for Decentralised Architectural Design BIM and Blockchain Integration. Int. J. Archit. Comput. 2021, 19, 157–173. [Google Scholar] [CrossRef]
- Labeodan, T.; Aduda, K.; Boxem, G.; Zeiler, W. On the Application of Multi-Agent Systems in Buildings for Improved Building Operations, Performance and Smart Grid Interaction—A Survey. Renew. Sustain. Energy Rev. 2015, 50, 1405–1414. [Google Scholar] [CrossRef]
- Elnour, M.; Himeur, Y.; Fadli, F.; Mohammedsherif, H.; Meskin, N.; Ahmad, A.M.; Petri, I.; Rezgui, Y.; Hodorog, A. Neural Network-Based Model Predictive Control System for Optimizing Building Automation and Management Systems of Sports Facilities. Appl. Energy 2022, 318, 119153. [Google Scholar] [CrossRef]
- Dong, K.; Guo, Z.; Chawla, N. Pure Message Passing Can Estimate Common Neighbor for Link Prediction. Adv. Neural Inf. Process. Syst. 2024, 37, 73000–73035. [Google Scholar]
- Huang, X.; Zhang, Q.; Tanaka, I. Optimization of Architectural Form for Thermal Comfort in Naturally Ventilated Gymnasium at Hot and Humid Climate by Orthogonal Experiment. Energies 2021, 14, 3228. [Google Scholar] [CrossRef]
- Flourentzou, F.; Pantet, S.; Ritz, K. Design and Performance of Controlled Natural Ventilation in School Gymnasiums. Int. J. Vent. 2017, 16, 112–123. [Google Scholar] [CrossRef]
- Li, Y.; Li, L.; Shen, P. Probability-Based Visual Comfort Assessment and Optimization in National Fitness Halls under Sports Behavior Uncertainty. Build. Environ. 2023, 242, 110596. [Google Scholar] [CrossRef]
- Yi, Z.; Liu, X.C.; Wei, R.; Chen, X.; Dai, J. Electric Vehicle Charging Demand Forecasting Using Deep Learning Model. J. Intell. Transp. Syst. 2022, 26, 690–703. [Google Scholar] [CrossRef]
- Roy, A.; Law, M. Examining Spatial Disparities in Electric Vehicle Charging Station Placements Using Machine Learning. Sustain. Cities Soc. 2022, 83, 103978. [Google Scholar] [CrossRef]
- Si, R.; Chen, S.; Zhang, J.; Xu, J.; Zhang, L. A Multi-Agent Reinforcement Learning Method for Distribution System Restoration Considering Dynamic Network Reconfiguration. Appl. Energy 2024, 372, 123625. [Google Scholar] [CrossRef]
- Wang, Y.; Qiu, D.; Strbac, G. Multi-Agent Deep Reinforcement Learning for Resilience-Driven Routing and Scheduling of Mobile Energy Storage Systems. Appl. Energy 2022, 310, 118575. [Google Scholar] [CrossRef]
- Goyal, V.; Grand-Clement, J. Robust Markov Decision Processes: Beyond Rectangularity. Math. Oper. Res. 2023, 48, 203–226. [Google Scholar] [CrossRef]
- Dwivedi, V.P.; Joshi, C.K.; Luu, A.T.; Laurent, T.; Bengio, Y.; Bresson, X. Benchmarking Graph Neural Networks. J. Mach. Learn. Res. 2023, 24, 1–48. [Google Scholar]
- Luan, S.; Hua, C.; Lu, Q.; Zhu, J.; Zhao, M.; Zhang, S.; Chang, X.-W.; Precup, D. Revisiting Heterophily for Graph Neural Networks. Adv. Neural Inf. Process. Syst. 2022, 35, 1362–1375. [Google Scholar]
- Agarwal, C.; Queen, O.; Lakkaraju, H.; Zitnik, M. Evaluating Explainability for Graph Neural Networks. Sci. Data 2023, 10, 144. [Google Scholar] [CrossRef] [PubMed]
- Chen, X.; Zhang, H.; Wong, C.U.I.; Song, Z. Adaptive Multi-Timescale Particle Filter for Nonlinear State Estimation in Wastewater Treatment: A Bayesian Fusion Approach with Entropy-Driven Feature Extraction. Processes 2025, 13, 2005. [Google Scholar] [CrossRef]
- Tao, J.; Su, Y.; Zhou, D.; Zeng, X.; Li, X. Graph-Constrained Sparse Performance Modeling for Analog Circuit Optimization via SDP Relaxation. IEEE Trans. Comput. Aided Des. Integr. Circuits Syst. 2018, 38, 1385–1398. [Google Scholar] [CrossRef]
- Teusch, J.; Gremmel, J.N.; Koetsier, C.; Johora, F.T.; Sester, M.; Woisetschläger, D.M.; Müller, J.P. A Systematic Literature Review on Machine Learning in Shared Mobility. IEEE Open J. Intell. Transp. Syst. 2023, 4, 870–899. [Google Scholar] [CrossRef]
- Chen, X.; Yang, H.; Zhang, H.; Wong, C.U.I. Dynamic Gradient Descent and Reinforcement Learning for AI-Enhanced Indoor Building Environmental Simulation. Buildings 2025, 15, 2044. [Google Scholar] [CrossRef]
- An, J.; Cho, S. Variational Autoencoder Based Anomaly Detection Using Reconstruction Probability. Spec. Lect. IE 2015, 2, 1–18. [Google Scholar]
- Zhang, M.; Wu, S.; Yu, X.; Liu, Q.; Wang, L. Dynamic Graph Neural Networks for Sequential Recommendation. IEEE Trans. Knowl. Data Eng. 2022, 35, 4741–4753. [Google Scholar] [CrossRef]
- Hakobyan, A.; Kim, G.C.; Yang, I. Risk-Aware Motion Planning and Control Using CVaR-Constrained Optimization. IEEE Robot. Autom. Lett. 2019, 4, 3924–3931. [Google Scholar] [CrossRef]
- Xu, L.; Yu, B. CVaR-Constrained Stochastic Programming Reformulation for Stochastic Nonlinear Complementarity Problems. Comput. Optim. Appl. 2014, 58, 483–501. [Google Scholar] [CrossRef]
- Ma, X.; Zhu, J.; Lin, Z.; Chen, S.; Qin, Y. A State-of-the-Art Survey on Solving Non-Iid Data in Federated Learning. Future Gener. Comput. Syst. 2022, 135, 244–258. [Google Scholar] [CrossRef]
- Korkas, C.D.; Baldi, S.; Kosmatopoulos, E.B. Grid-Connected Microgrids: Demand Management via Distributed Control and Human-in-the-Loop Optimization. Adv. Renew. Energ. Power Technol. 2018, 2, 315–344. [Google Scholar]
- Jagannath, D.J.; Dolly, R.J.; Let, G.S.; Peter, J.D. An IoT Enabled Smart Healthcare System Using Deep Reinforcement Learning. Concurr. Comput. Pract. Exp. 2022, 34, e7403. [Google Scholar] [CrossRef]
- Al-Hamadani, M.N.; Fadhel, M.A.; Alzubaidi, L.; Harangi, B. Reinforcement Learning Algorithms and Applications in Healthcare and Robotics: A Comprehensive and Systematic Review. Sensors 2024, 24, 2461. [Google Scholar] [CrossRef] [PubMed]
- Qiu, J.; Zhang, X.; Wang, T.; Hou, H.; Wang, S.; Yang, T. A GNN-Based False Data Detection Scheme for Smart Grids. Algorithms 2025, 18, 166. [Google Scholar] [CrossRef]
- Karunaratne, G.; Schmuck, M.; Le Gallo, M.; Cherubini, G.; Benini, L.; Sebastian, A.; Rahimi, A. Robust High-Dimensional Memory-Augmented Neural Networks. Nat. Commun. 2021, 12, 2468. [Google Scholar] [CrossRef] [PubMed]
- Chen, Y.; Hong, J.; Xiao, Y.; Zhang, H.; Wu, J.; Shi, Q. Multimodal Intelligent Flooring System for Advanced Smart-Building Monitoring and Interactions. Adv. Sci. 2024, 11, 2406190. [Google Scholar] [CrossRef] [PubMed]
- Mehrabi, N.; Morstatter, F.; Saxena, N.; Lerman, K.; Galstyan, A. A Survey on Bias and Fairness in Machine Learning. ACM Comput. Surv. (CSUR) 2021, 54, 1–35. [Google Scholar] [CrossRef]
- Song, M.; Wang, Z.; Zhang, Z.; Song, Y.; Wang, Q.; Ren, J.; Qi, H. Analyzing User-Level Privacy Attack against Federated Learning. IEEE J. Sel. Areas Commun. 2020, 38, 2430–2444. [Google Scholar] [CrossRef]
- Mosqueira-Rey, E.; Hernández-Pereira, E.; Alonso-Ríos, D.; Bobes-Bascarán, J.; Fernández-Leal, Á. Human-in-the-Loop Machine Learning: A State of the Art. Artif. Intell. Rev. 2023, 56, 3005–3054. [Google Scholar] [CrossRef]
| Disclaimer/Publisher’s Note: The statements, opinions and data contained in all publications are solely those of the individual author(s) and contributor(s) and not of MDPI and/or the editor(s). MDPI and/or the editor(s) disclaim responsibility for any injury to people or property resulting from any ideas, methods, instructions or products referred to in the content. |
© 2025 by the authors. Licensee MDPI, Basel, Switzerland. This article is an open access article distributed under the terms and conditions of the Creative Commons Attribution (CC BY) license (https://creativecommons.org/licenses/by/4.0/).


