Article

Quantifying the Synergy Between Industrial Structure Optimization, Ecological Environment Management, and Socio-Economic Development

1
College of Computer and Information Sciences, Fujian Agriculture and Forestry University, Fuzhou 350002, China
2
School of Public Administration and Law, Fujian Agriculture and Forestry University, Fuzhou 350002, China
3
Chinese Academy of Forestry, Beijing 100091, China
*
Authors to whom correspondence should be addressed.
Buildings 2025, 15(14), 2469; https://doi.org/10.3390/buildings15142469
Submission received: 4 May 2025 / Revised: 2 July 2025 / Accepted: 9 July 2025 / Published: 14 July 2025
(This article belongs to the Special Issue Promoting Green, Sustainable, and Resilient Urban Construction)

Abstract

In the context of the new developmental philosophy, this study aimed to address the bottleneck of regional sustainable development; it constructs a three-system evaluation indicator system for Industrial Structure Optimization (ISO), Ecological Environment Management (EEM), and Socio-economic Development (SED), based on panel data from 20 cities in the Western Taiwan Straits Economic Zone between 2011 and 2023. To reveal how the synergistic development of the three subsystems in different domains can achieve sustainable development through their interactions and to analyze the dynamic patterns of the three subsystems, this study employed the panel vector autoregression (PVAR) model to examine the interactions between subsystems. Additionally, drawing on the framework of evolutionary economics, the study quantified the temporal evolution and spatial characteristics of the coupling coordination level among the three subsystems based on the results of the degree of coupling coordination model. The results indicate the following: (1) ISO shows a significant upward trend, EEM slightly declines, and SED experiences minor fluctuations before accelerating. (2) ISO, EEM, and SED exhibited self-reinforcing effects. (3) The degree of coupling, coordination, and coupling coordination all exhibit a trend of “fluctuating and increasing initially, followed by steady growth”. The spatial patterns of the degree of coupling, coordination, and coupling coordination have shifted from “decentralized” to “centralized”, with clear signs of synergistic development. (4) The difference in the degree of coupling coordination along the north–south direction remained the primary factor contributing to inter-regional disparities. Regions with the higher degrees of coupling coordination were concentrated in the southeastern coastal areas, while those with the lower degrees of coupling coordination appeared in the northeastern mountainous areas and southwestern coastal areas. (5) The spatial connection in the strength of the degree of coupling coordination has gradually increased, with notable intra-provincial connections and weakened inter-city connections across the province. The study’s results provided decision-making references for the construction of a sustainable development community.

1. Introduction

As China enters a stage of high-quality development, the new development philosophy based on innovation, coordination, greenness, openness, and sharing has become the core driver of systemic economic and social transformation [1]. In this context, the synergy between industrial construction and ecological environment construction is a core principle in the era of high-quality development. Adhering to the concept of “lucid waters and lush mountains are invaluable assets” while promoting green, sustainable development is both a practical requirement of the new development philosophy and an essential step toward achieving modernization and harmonious coexistence between humans and nature [2].
Since the reform and opening-up, China has achieved significant progress in terms of industrialization, with rising industrial added value, an increasingly complete industrial system, and the formation of competitive industrial clusters [3]. However, the traditional industrialization model has led to a profound crisis—China’s carbon emissions from the industrial sector rose from 71% in 1990 to 83% in 2018, highlighting the issues of “high carbon emissions, high energy consumption, and high pollution” inherent to the industrial structure [4]. The conflict between the urgent demand for the expansion of China’s industrial scale and the environmental carrying capacity reaching the ecological threshold has intensified [5]. Therefore, how to optimize industrial structure while promoting the sustainable governance of the ecological environment, while also balancing Socio-economic Development, has become a pressing scientific issue that needs to be addressed.
Economic zones can overcome the rigid constraints of administrative boundaries, effectively capture the cross-field and cross-regional flows of the “industrial chain and ecological chain”, and build a spatial correlation network to facilitate industrial gradient transfer and institutional synergy innovation [6]. The Western Taiwan Straits Economic Zone is a representative example of industrialization along China’s southeastern coast; its industrial layout shows a gradient, with technology-intensive industries in the coastal areas and resource-dependent industries in the mountainous regions [7]. The intensity of industrial development in the coastal areas has exceeded the ecological threshold, while the mountainous regions face the imbalanced scenario of “resource surplus–economic lag”; these regions also face imbalances between ecological carrying capacity and various socio-economic processes [8]. In this context, selecting the Western Taiwan Straits Economic Zone as the research object and analyzing how the “industrial chain” and “ecological chain” can be synergistically optimized aims to address the urgent need for promoting regional sustainable development. Therefore, this study innovatively combines a multidimensional perspective on Industrial Structure Optimization (ISO), Ecological Environment Management (EEM), and Socio-economic Development (SED). It systematically examines the coupling and coordination mechanisms of ISO, EEM, and SED in the Western Taiwan Straits Economic Zone, with the aim of providing scientific evidence for the formulation of dynamic and differentiated regional policies and achieving sustainable and high-quality regional development.

2. Literature Review

The report of the 20th National Congress of the CPC emphasizes that Chinese modernization focuses on harmony between humanity and nature [9]. Many scholars have focused their research on the coordinated relationship between industry, the ecological environment, and socio-economic systems. Regarding the coupling of industrial structure and the ecological environment, Li et al. suggested that industrial ecological agglomeration is crucial in the stage of deepening the synergistic development of high-quality economic growth and ecological protection, they also noted that industrial ecological agglomeration is influenced by the exogenous, interacting effects of industrial structure and social security level [10]. Through case studies, Gu et al. deeply explored technological transformation and upgrading in the “unfolding” of industrial civilization, the introduction of technology in the “construction” of ecological civilization, and technology transfer, technological competition, and system adjustments in the “concurrent” development of industrial and ecological civilizations [11]. Niu et al. constructed a theoretical framework for the complex symbiotic system of industrial development and ecological environment based on the “driving-pressure-state-impact-response (DPSIR)” causal relationship model and the Lotka-Volterra ecological model. They made a breakthrough by establishing a symbiotic safety early warning mechanism and demonstrated the feasibility and effectiveness of this early warning mechanism for the ecological-economic corridor of the Three Gorges of the Yangtze River in China [12].
Regarding the coupling of industrial structure and socio-economic systems, Fan et al. found that while the interaction between industrial land expansion and economic growth in the central Yunnan city cluster is primarily characterized by inefficient expansion, a long-term equilibrium exists between the two [13]. Liu et al. applied the Tapio decoupling elasticity coefficient model, and found that the decoupling relationship between industrial three-waste emissions and GDP growth per capita in six central provinces has gradually evolved towards absolute decoupling. However, there is still volatility and regional heterogeneity [14]. Xie et al. also employed the Tapio model to explore the decoupling relationship between industrial carbon emissions and economic growth in Jinan. They found that the decoupling state faces instability and industry variability [15]. Liu et al. innovatively introduced the concept of rank matching degree, designed to comprehensively measure the alignment between industrial water use efficiency and economic development at the city level in China [16]. Miao et al. revealed the coupling coordination characteristics and spatial correlation between industrial water resource efficiency and economic development [17]. Some scholars have analyzed the coordinated development of the industrial economy and the environment from a comprehensive perspective, focusing on topics such as environmental pollution levels [18] and ecological protection [19,20].
Regarding the coupling of the ecological environment and socio-economic systems, Huang et al. emphasized the need to balance high-level ecological protection with high-quality development, striving to promote their benign interaction for sustainable development [21]. Yu et al. examined the coupling coordination between ecological civilization construction and tourist-economic development from a green development perspective [22]. Ju et al. found that Tibet’s environmental carrying capacity is near its threshold, with a lagging SED and other pressing issues. There is an urgent need to leverage the strength of government, enterprises, and society to explore the formation of a unique “eco-modernization and green development” model through the connection of transmission mechanisms [23].
Overall, existing studies have empirically analyzed the coupling coordination relationship and coupling evolutionary trend between ecological environment and socio-economic dimensions at various research scales, such as provincial [24], municipal [25], and county levels [26], and across different application fields, including agriculture [27] and tourism [28]. Furthermore, studies on spatio-temporal evolution [29], obstacle factor identification [30], influencing factor analysis [31], goal optimization [32], and development prediction [33], based on the coupling coordination between the ecological environment and socio-economic factors, have recently become more refined. Some scholars have focused on the decoupling relationship between industrial and economic indicators [34,35], indicating that research on the coupling coordination between the systems of industry, the ecological environment, and socio-economic dimensions is gradually being enriched.
In contrast to micro- and macro-scale studies focused on a single research object, applying a research scale based on the economic zone can transcend provincial boundaries, accurately identify blocking nodes in coupling coordination, and offer a profound understanding of the spatial spillover effect from “point to surface”. In the context of the developing “city cluster and economic zone” strategy [36], economic zone research serves two functions—namely, correlation deconstruction and heterogeneity analysis—providing theoretical support for integrated governance. Research on the coupling coordination of “city cluster and economic zone” primarily focuses on regions such as the Yangtze River Economic Belt [37], the Hexi Corridor Economic Belt [38], the Huaihe River Ecological Economic Belt [39], the Yellow River Basin [40], the Bohai Rim Area [41], the Guangxi Beibu Gulf Economic Zone [42], and the Northeast Comprehensive Economic Zone [43]. The Western Taiwan Straits Economic Zone, as a strategic area of the “the 21st-Century Maritime Silk Road Core Area”, has been the subject of research that primarily focuses on the configuration of driving factors and causal combinations in the context of the tourism economic network [44], the coupling between urban vitality and urban sprawl [45], the evaluation of land use effectiveness [46], and the structure and influencing factors of urban consumption networks [47].
In summary, existing research has mainly focused on the interaction of the “ecological environment–economic society” [21] and “industry–socio-economic” [14] dualistic systems. Scholars have often treated the industrial system as a general component of the ecological system, without fully recognizing the pivotal role of ISO factors, such as industrial scale expansion, green production, and resource-efficient utilization, as core conduits within the coupling system. Additionally, current research on the coupling of the three systems has been centered on specific industrial sectors, evaluating the coupling coordination of the industrial, ecological, and economic systems from a cross-sectional perspective [48]. This static viewpoint fails to reveal the dynamic evolution within the ISO, EEM, and SED subsystems and the complex mechanisms of their inter-systemic synergy and coupling. Specifically, there is a lack of an analytical framework based on classical evolutionary theory and adequate causal testing for the dynamic coupling process between subsystems. Most regional studies focus on areas like the Yangtze River Delta, the Yellow River Basin, and the Bohai Rim Area, while the Western Taiwan Straits Economic Zone, a key region for promoting cross-strait integration, presented a unique research background formed by its “gradient industrial layout”, “imbalanced ecological carrying capacity”, providing a typical scenario for evolutionary analysis. To thoroughly explore the dynamic synergistic evolution mechanism of the three subsystems in this context, there was an urgent need to embed evolutionary economics theory into the coupling coordination framework for systematic analysis.

3. Mechanisms and Research Frameworks

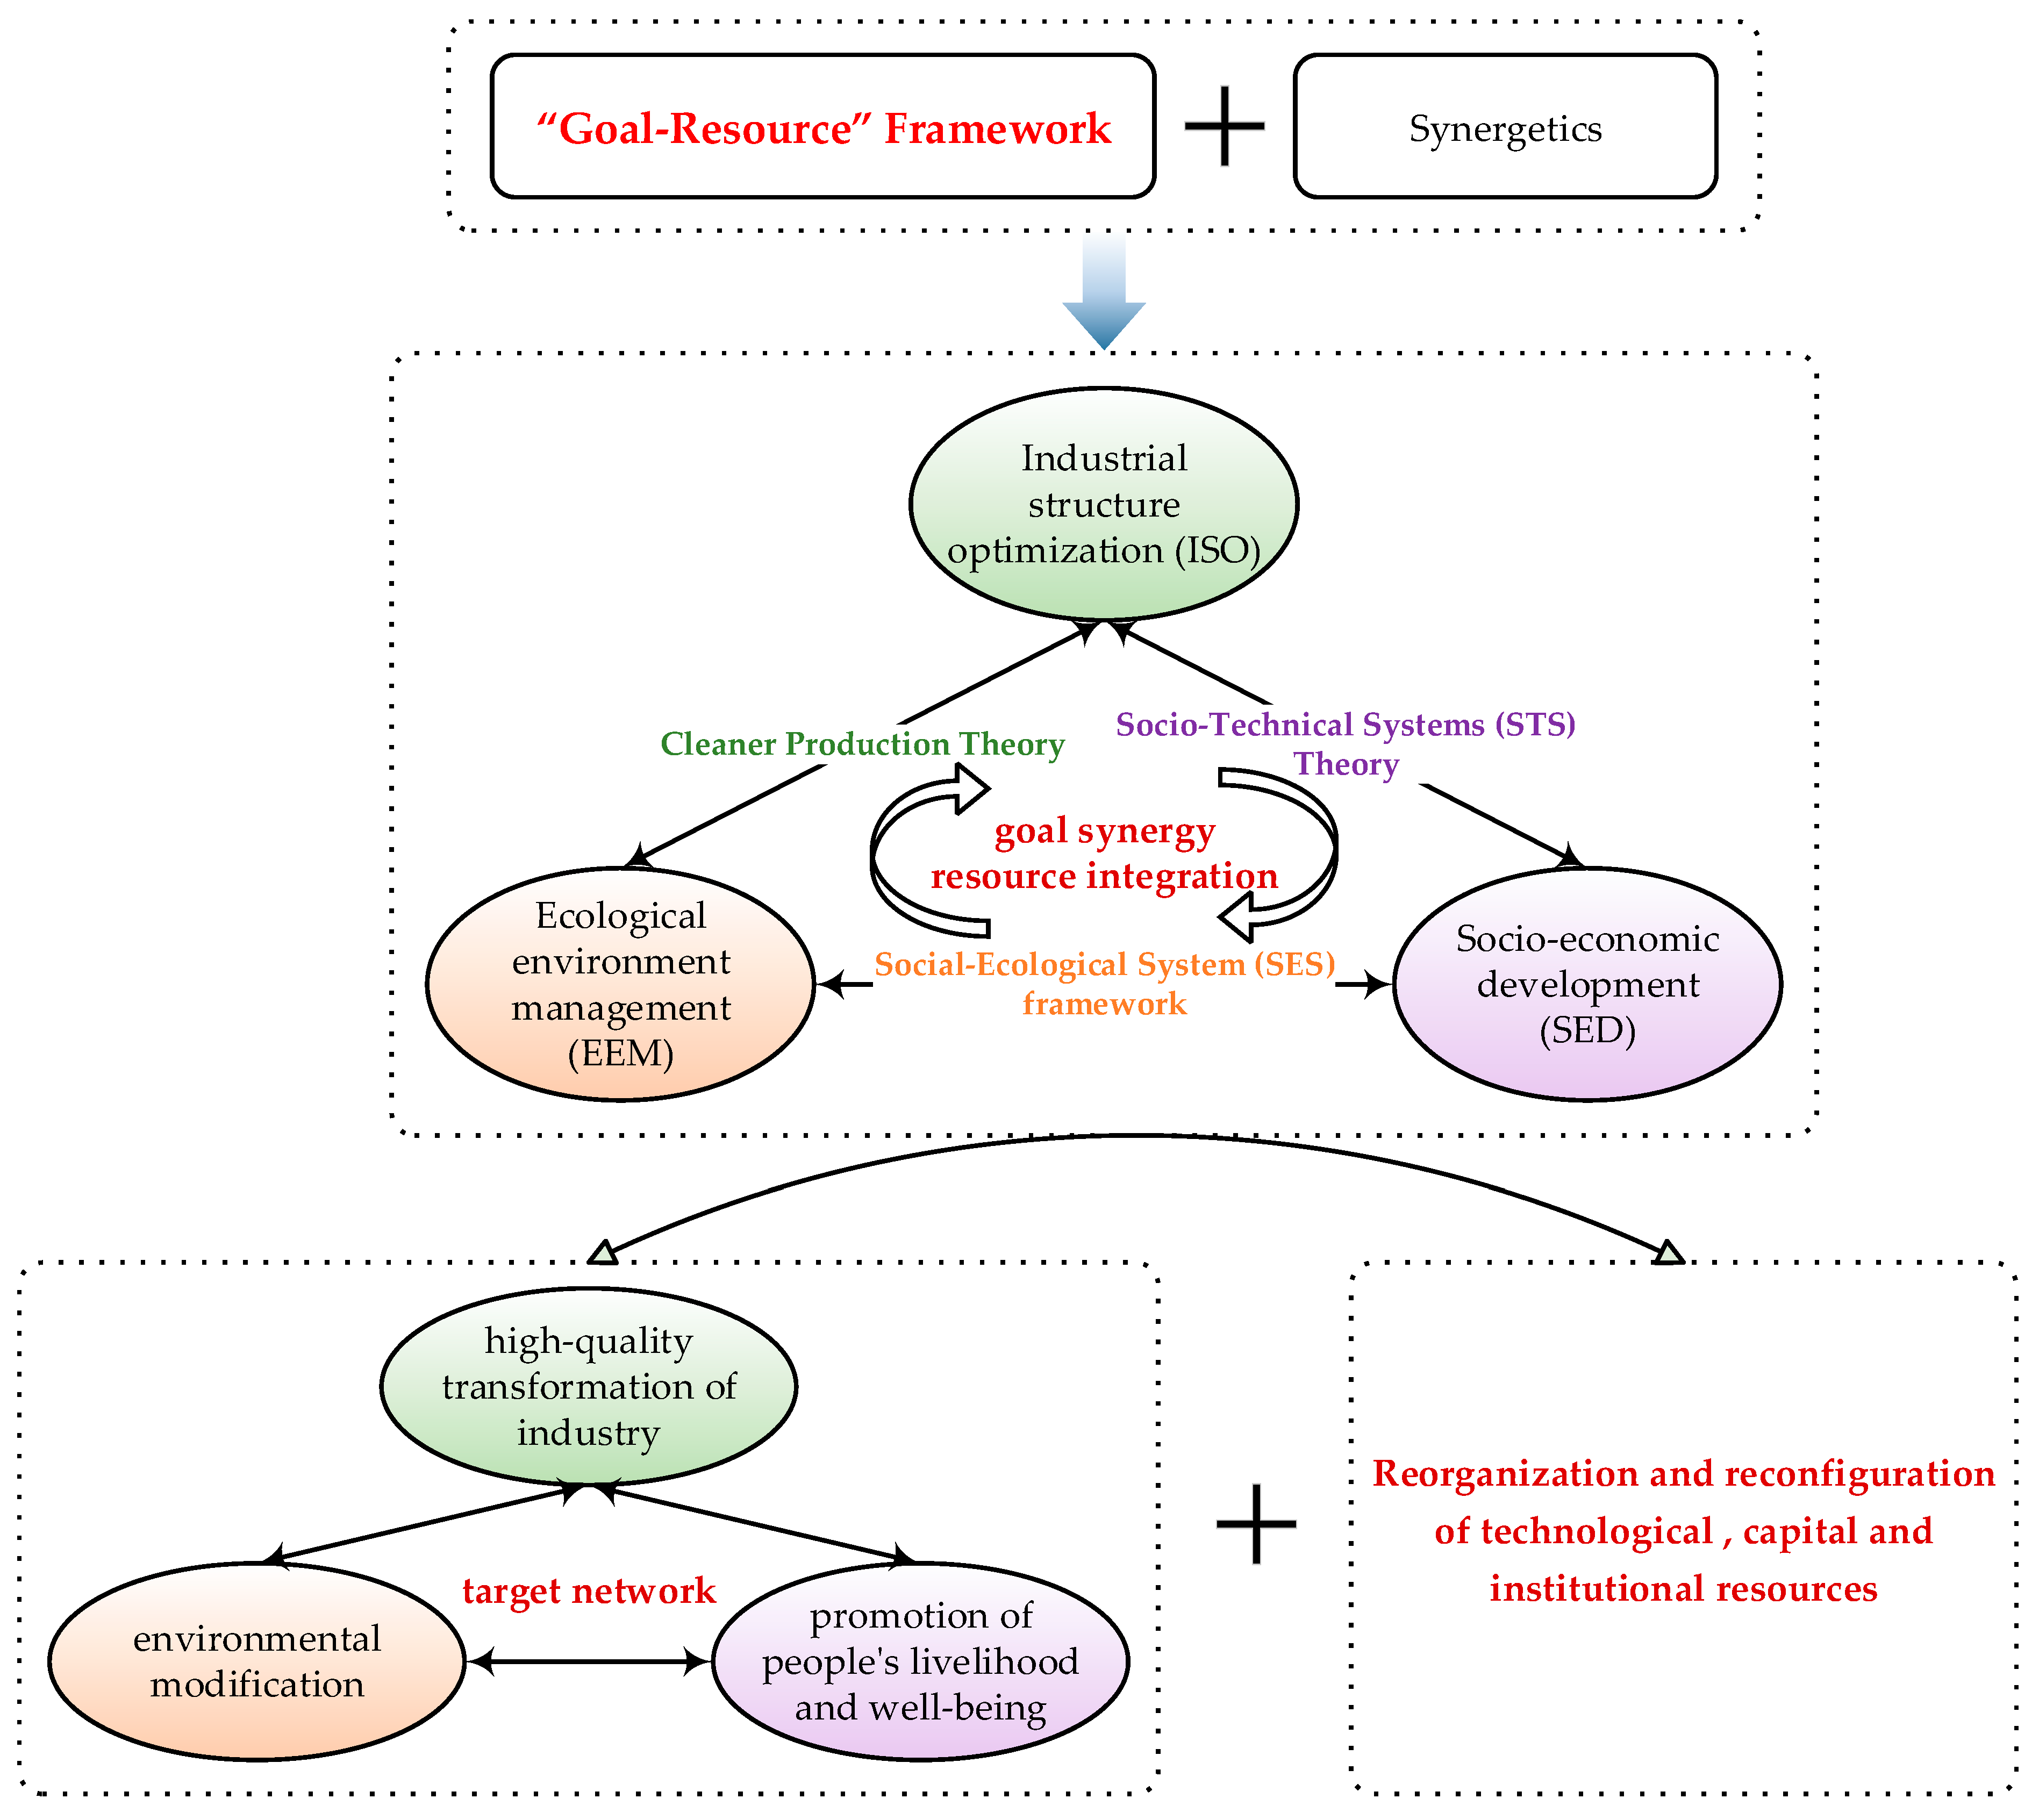
3.1. Interactive Relationships and Coupling Mechanisms

Based on the “Goal–Resource” analytical framework and Synergetics [49], the coupling mechanisms connecting ISO, EEM, and SED represent a goal coordination network formed by the three subsystems through “goal synergy” and “resource integration”, illustrating various goal-oriented and resource integration patterns of factor reallocation (Figure 1). ISO referred to the process of achieving industrial structure optimization and industrial sustainable development through technological innovation and advances in production methods. ISO was an industrial high-quality transformation process guided by resource conservation, lightweight resource consumption, and improvement in resource utilization efficiency, with technological breakthroughs serving as the key focus [50]. EEM involves promoting sustainable development principles while fully considering the ecological environment’s carrying capacity. At its core lies comprehensive, multi-dimensional ecological protection and restoration, emphasizing a dynamic “response–governance” system and aiming to enhance the resilience and restorative capacity of the ecological environment [51]. SED involves not only economic growth and structural transformation, but also the effective improvement of people’s well-being [51]. Innovation is also the key driving force behind SED [52].
The interactions between ISO, EEM, and SED subsystems relied on the multi-dimensional interconnection of cleaner production theory, socio-technical systems (STS) theory, and socio-ecological systems (SES) framework, forming a “industry–ecology–society” ternary interaction model. The cleaner production theory, rooted in the concept of sustainable development, emphasized improving resource utilization efficiency and environmental conditions by changing industrial production methods [53]. ISO based on the dual paths of improving resource utilization efficiency and controlling pollution emissions, guided technology to concentrate in high-energy-consuming areas, thereby reducing environmental burdens. Meanwhile, EEM through environmental carrying capacity constraints, pressured the industrial structure to deeply adjust towards a low-carbon, circular economy [54].
Eric Lansdown Trist pioneered STS theory in the 1950s, exploring the dialectical relationship between technological change and social needs. He emphasized that the social system cannot exist independently of the technological system, providing a theoretical foundation for the study of social–technical interaction [55]. ISO leveraged technological means to continuously enhance the level of industrial intelligence and improve public service efficiency. SED, in turn, provided capital accumulation, market demand, and policy support for ISO, driving the industrial structure towards a resource-intensive direction through consumption upgrading [56].
The SES framework, proposed by Ostrom in 2009 and published in the journal Science, provides theoretical guidance for addressing ecosystem governance issues that have long challenged the academic community [57]. According to Ostrom, ecosystem governance research should not focus solely on the natural attributes of system resources, as both human and natural factors are equally important, and resource use is characterized by sustainability, diversity, competitiveness, and equity [57]. Based on the SES framework, EEM released ecological service values through carbon sink accumulation, biodiversity protection, and other approaches, reducing public health costs and effectively improving people’s well-being [58,59]. SED, in turn, guided green investments towards strategic emerging industries and restored the ecological environment through ecological compensation mechanisms [60].
Through the deep integration of cleaner production theory, STS theory, and SES framework, the subsystems of ISO, EEM, and SED formed a deeply nested goal network of “high-quality industrial transformation—environmental restoration—improvement of people’s well-being”. At the same time, the three subsystems, guided by the goal of sustainable development, relied on the reorganization and reconfiguration of technological, capital, and institutional resources to achieve efficient resource flow between systems. The synergy effect manifested under the paradigm of “goal synergy and resource integration”: industrial quality enhancement and efficiency improvements provided technical support for environmental management, while effective ecological management reduced the ecological constraint costs on economic growth. ISO was an intrinsic requirement of SED, while SED provided capital accumulation, market demand, and policy support for ISO. SED, through institutional innovation and resource allocation optimization, balanced the dynamic needs of ISO and environmental sustainability governance. Therefore, ISO, EEM, and SED realized dynamic interaction and coupling development under the framework of “goal synergy and resource integration”.
Based on this, the following research hypotheses are proposed:
H1a: 
ISO has a significant positive impact on EEM.
H1b: 
EEM has a significant positive impact on ISO.
H2a: 
ISO has a significant positive impact on SED.
H2b: 
SED has a significant positive impact on ISO.
H3a: 
EEM has a significant positive impact on SED.
H3b: 
SED has a significant positive impact on EEM.

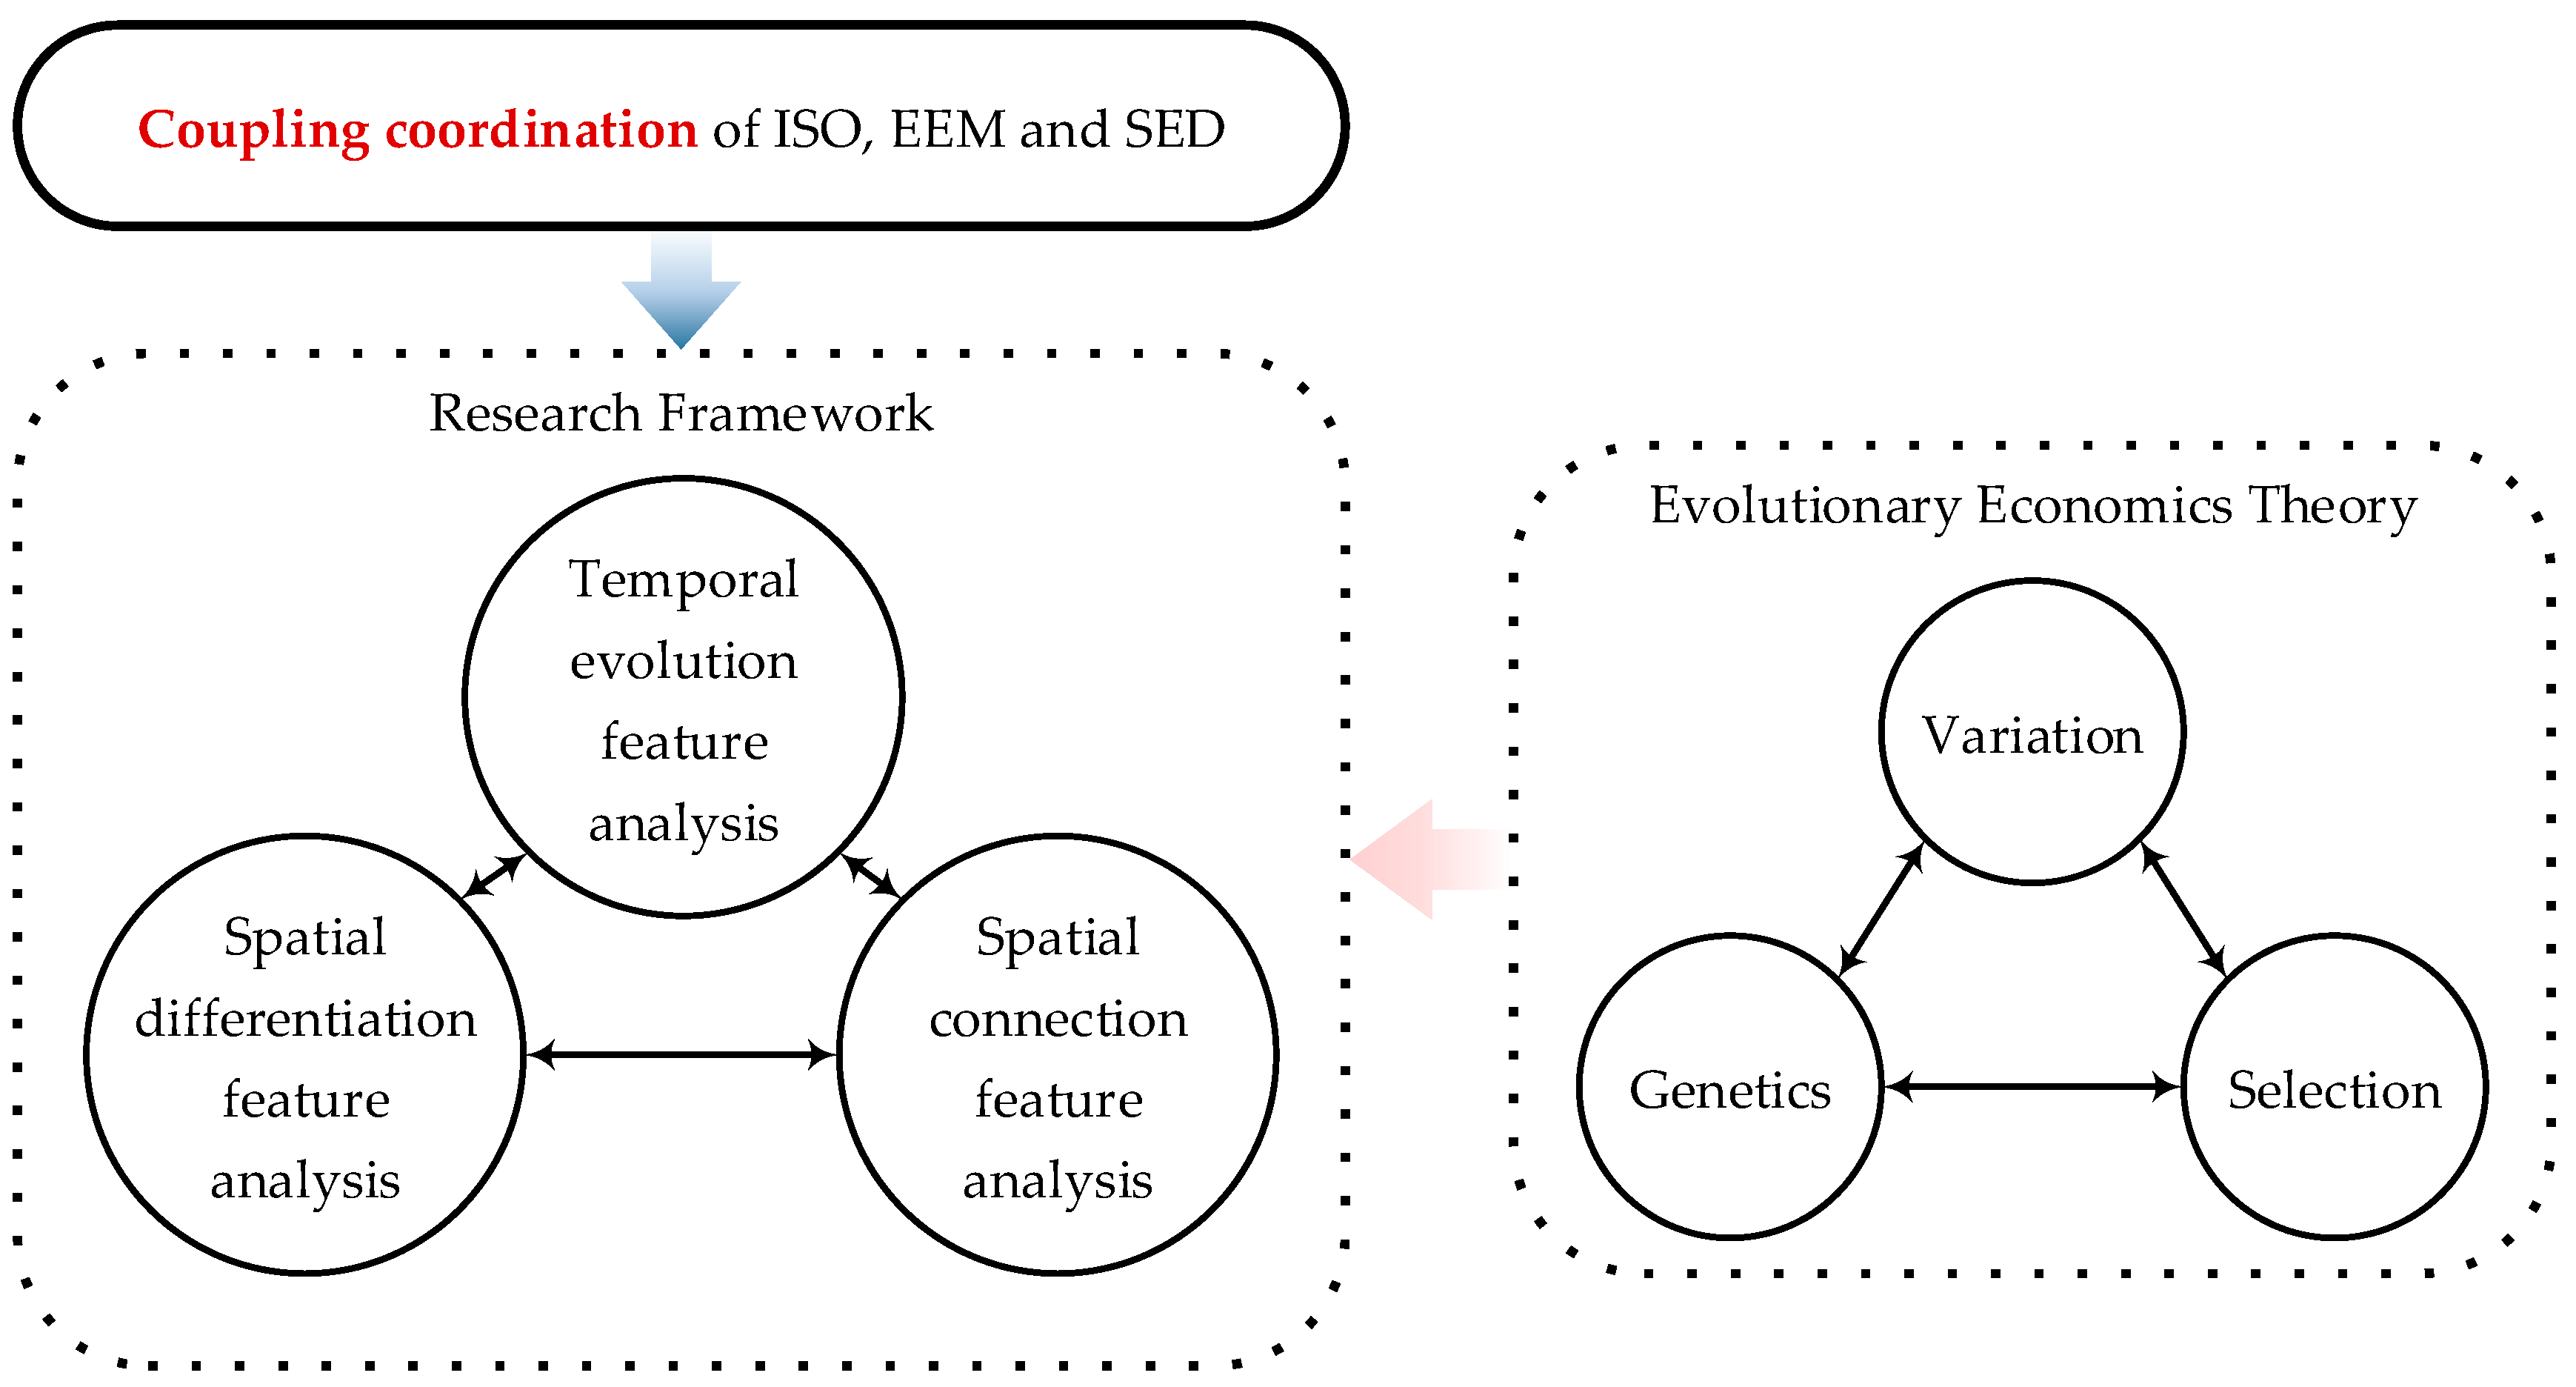
3.2. Research Frameworks

This study aimed to investigate the spatio-temporal dynamic evolution characteristics of the coupling coordination between ISO, EEM, and SED in the Western Taiwan Straits Economic Zone. This coupling relies on the synergistic effects of “goal synergy and resource integration”, and exhibits complex characteristics such as strong path dependence, multi-factor interaction, and systemic reconstruction. These features stood in stark contrast to the static equilibrium analysis paradigm of traditional neoclassical economics [61], transcending the explanatory boundaries of neoclassical economics. Evolutionary economics theory deconstructs the system’s evolutionary trajectory from a dynamic process perspective, focusing on the study of “change”, it effectively portrays the systematic reconstruction of multiple subsystems in synergistic evolution [62]. Evolutionary economics originated from Thorstein B Veblen’s book Why is Economics Not an Evolutionary Science. In 1982, Nelson and Winter further explained in An Evolutionary Theory of Economic Change that economic change is a dynamic process where “genetic continuity, mutation dynamics, and environmental selection pressures” interact [62]. At the same time, evolutionary economics viewed the world as complex, formed through the intersection, cyclical feedback, and nonlinear interactions of multiple paths such as technological innovation, structural changes, and institutional regulations within a specific spatio-temporal context. It emphasized driving evolution by stimulating the creativity of organizations and actors [63].
Existing research based on traditional degree of coupling coordination model has mainly focused on aspects such as spatio-temporal evolution characteristics and influencing factors [64,65]. However, these studies are often loosely connected, lacking a core theory that organically links them, and have not yet formed a systematic and holistic understanding of the spatio-temporal evolution process of coupling coordination. Therefore, this study introduced the evolutionary economics mechanism based on “variation-genetics-selection”, which provided logically coherent and dynamically consistent theoretical support for the “temporal evolution—spatial differentiation—spatial connection” analysis framework. It systematically explained the complete spatio-temporal dynamic chain (Figure 2).
Specifically, evolutionary economics theory, with its unique dynamic mechanism of “variation-genetics-selection” and its theoretical core of “institution-organization-technology” multidimensional integration [62], provided a systematic theoretical foundation for analyzing the spatio-temporal dynamic evolution trajectory of ISO, EEM, and SED coupling system. In terms of analyzing dynamic mechanisms, the sequential evolution characteristics of ISO, EEM, and SED coupling coordination corresponded to the variation mechanism, where technological innovation or institutional reform creatively altered existing development paths. Spatial differentiation arose from the genetics mechanism, where path dependency was influenced by different geographical locations, natural resource endowments, and political systems. Spatial connection mapped the selection mechanism, where environmental forces, such as market power, policy interventions, and environmental regulations, drove inter-regional interactions and clarified the direction of coupling coordination. In terms of achieving multidimensional integration, ISO relied on technological upgrades and organizational changes, EEM depended on institutional regulation and governance model innovations, and SED was inseparable from the creation of institutional environments and the cultivation of people’s well-being.
As evolutionary economics gradually matured, the emerging field of evolutionary economic geography, based on evolutionary economics, gradually developed. Research on evolutionary economic geography mainly focused on economic phenomena such as population agglomeration, industrial clustering [66], and industrial gradient transfer [67]. This study innovatively established a deep correspondence between the “variation-genetics-selection” mechanism and spatial attributes, particularly applying the genetics mechanism to explain spatial differentiation in non-economic attributes. It emphasized that spatial path dependence and lock-in effects were the fundamental causes of regional imbalances. The systematic embedding of evolutionary economics into the “temporal evolution—spatial differentiation—spatial connection” geographical attributes research framework was an attempt at theoretical advancement. It effectively enriched the theoretical toolbox of evolutionary economics in explaining the dynamic evolution of complex spatial systems.
Existing research has attempted to use evolutionary economics to analyze the co-evolution of digital government and new quality productivity within the “technology-institution-ecology” framework. However, its focus has primarily been on the “government governance—economic development” interaction within the socio-economic system [68]. In contrast to the above-mentioned homogenous system synergy, this study expanded the multidimensional integration analysis perspective of evolutionary economics to the “ISO-EEM-SED” heterogeneous systems. It revealed the nonlinear feedback of technology, institutions, and organizational dynamics in cross-system transmission, providing a theoretical tool that could be referenced for regional sustainable development.
In light of this, the expected contributions of this study are as follows: (1) Using the “goal synergy” and “resource integration” framework and Synergetics, we systematically constructed a three-system evaluation index for ISO, EEM, and SED. (2) Innovatively incorporating the “variation–genetics–selection” mechanism from evolutionary economics into the study of “temporal evolution, spatial differentiation, and spatial connection”, this research framework offers support based in classical economic theory for analyzing the spatio-temporal complexity of multi-system synergy. (3) Focusing on the complex characteristics of the Western Taiwan Straits Economic Zone, including “industrial layout gradient, ecological carrying capacity imbalance, and socio-economic process differentiation”, a PVAR model was used to analyze the interactive relationships between ISO, EEM, and SED. Degree of coupling coordination model was applied to quantify the synergy between ISO, EEM, and SED. Kernel density estimation was employed to capture temporal evolution patterns, while trend surface analysis and cold–hot spots analysis were used to reveal spatial differentiation. The gravity model was then applied to examine spatial connection.

4. Materials and Methods

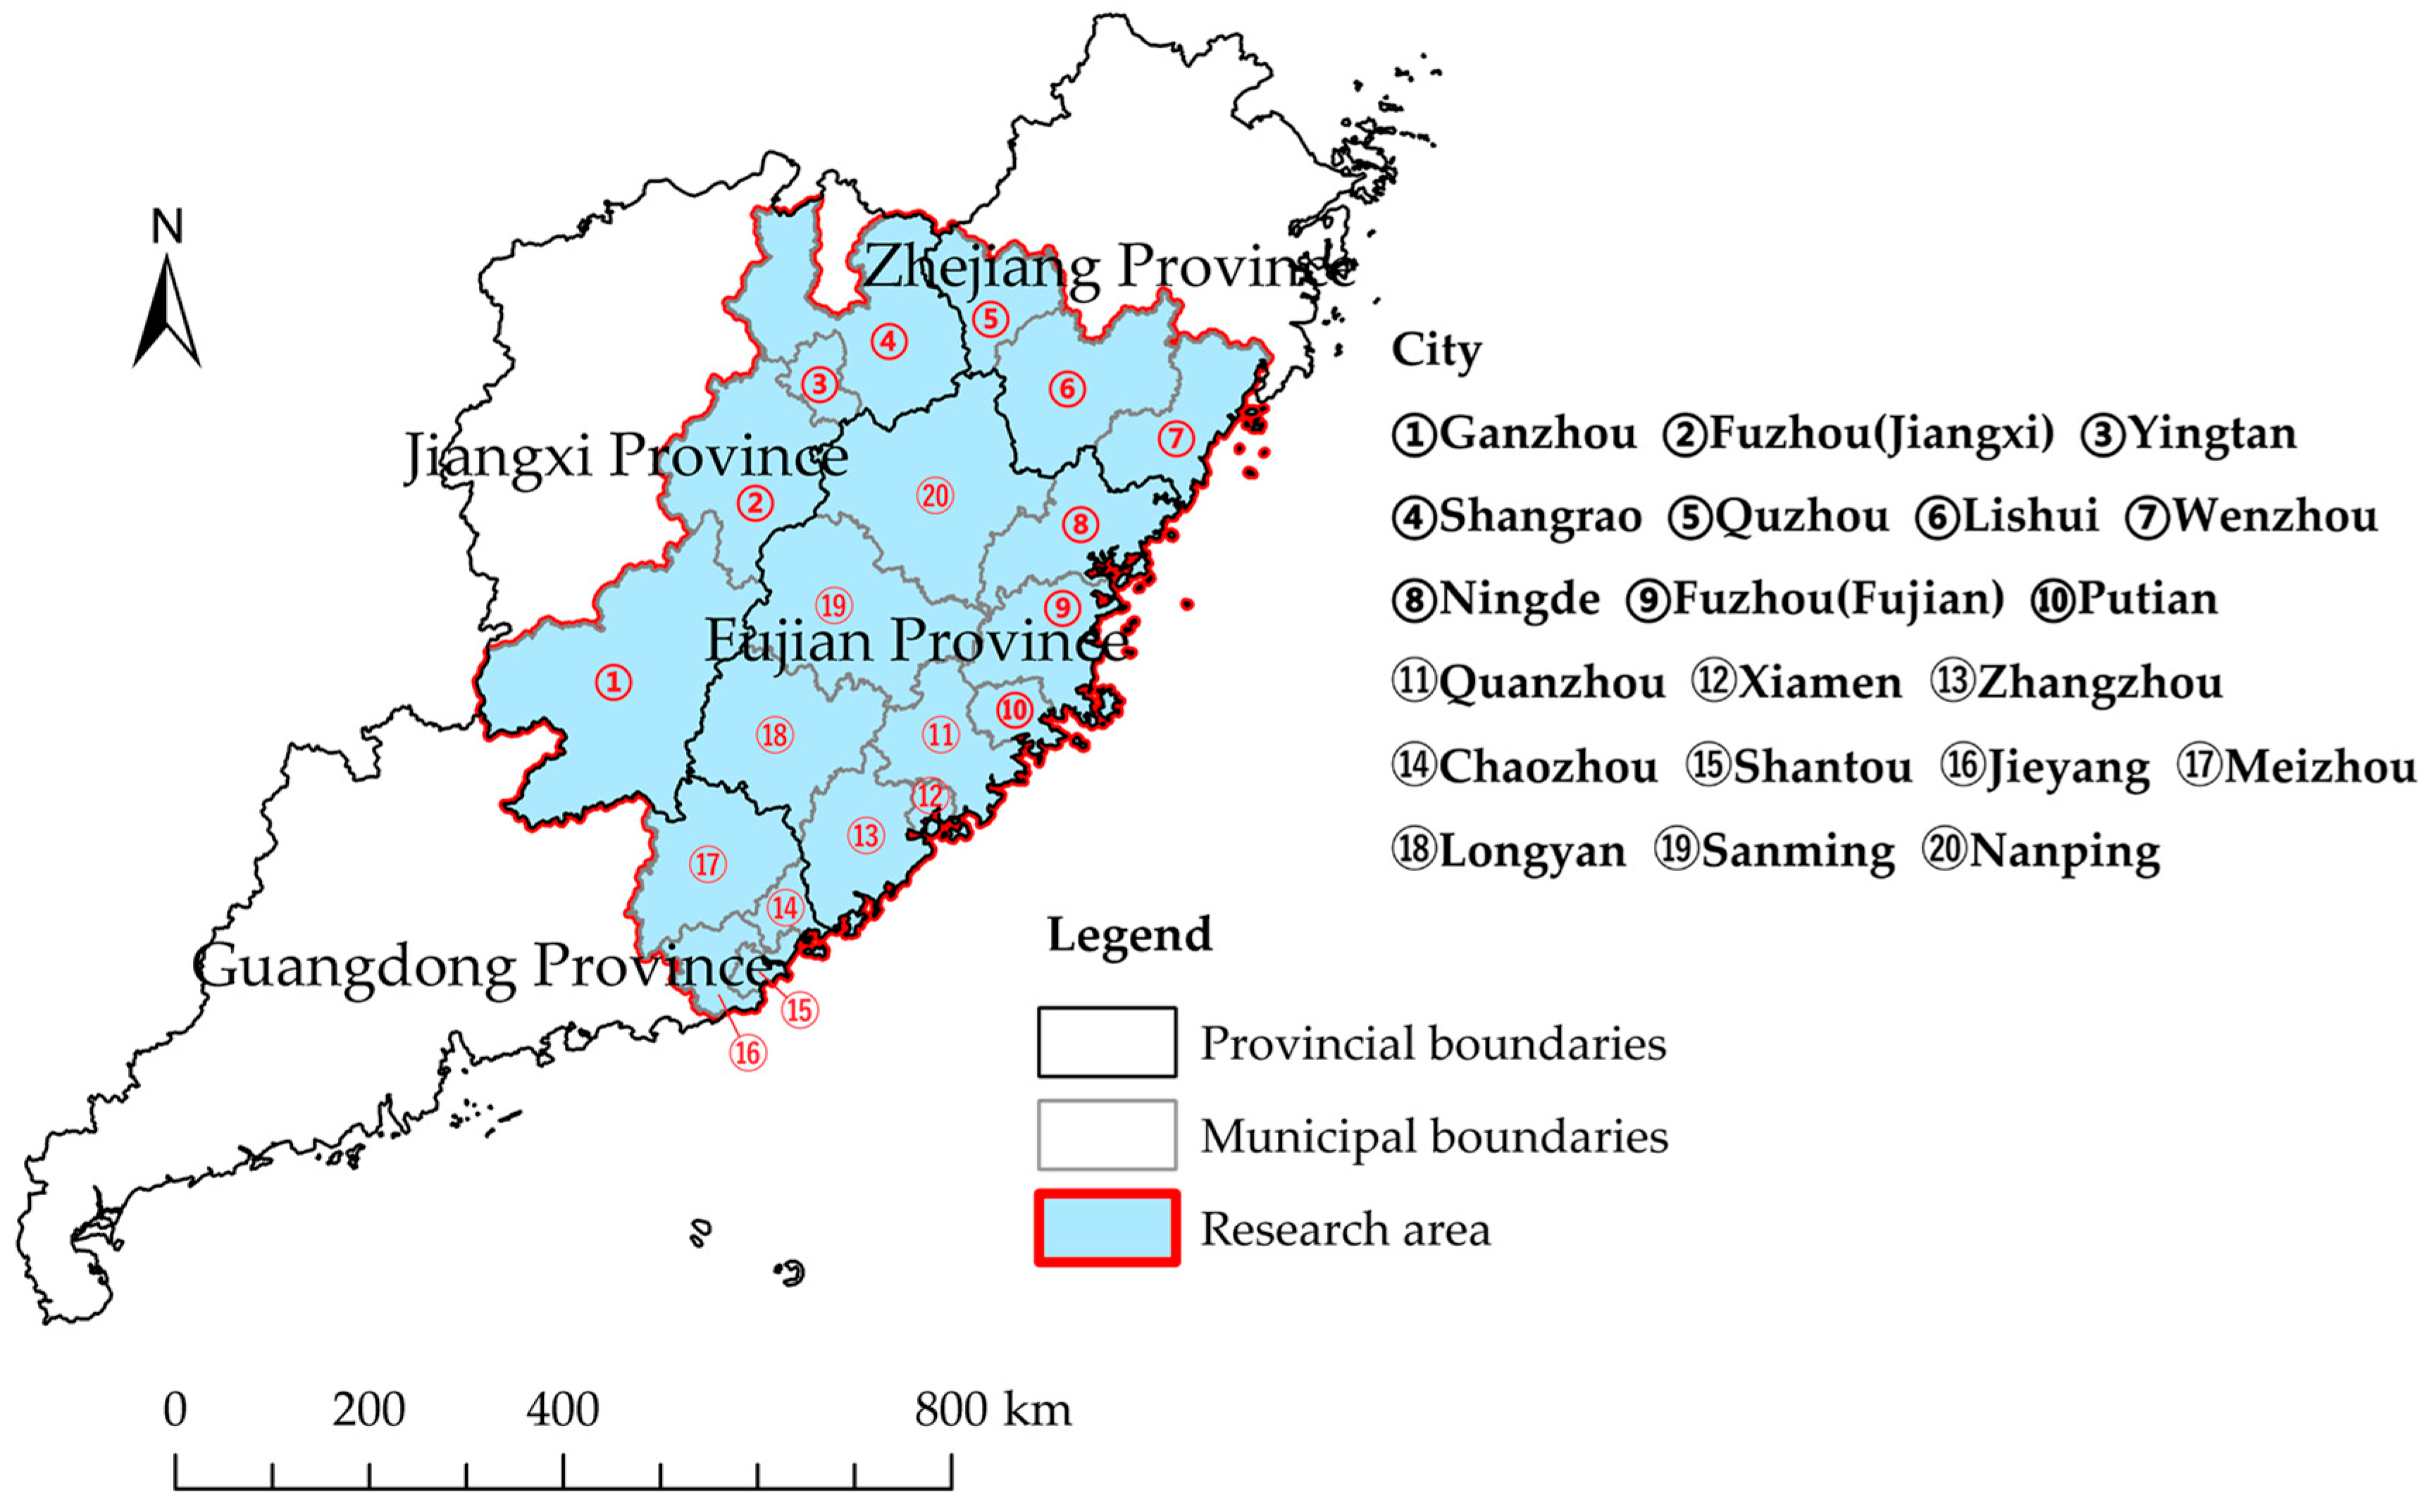
4.1. Overview of the Research Area

The Western Taiwan Straits Economic Zone spans Fujian, the southern part of Zhejiang, the eastern part of Guangdong, and part of Jiangxi (Figure 3), with a total area of approximately 270,000 km2, covering 20 cities [69] (Table 1). Since its formal inclusion in the national development plan in 2009, the Western Taiwan Straits Economic Zone has gradually become an important economic growth hub in China’s southeast coastal areas and a key gateway for international outreach and cross-strait cooperation [69]. The Western Taiwan Straits Economic Zone combined both advanced manufacturing capabilities of emerging industries in coastal areas with the rich ecological resource endowments of mountainous areas. However, the high energy consumption of traditional manufacturing industries led to an overloaded the ecological carrying capacity, making ISO an urgent necessity [70]. Given the unique features of the “industrial layout gradient [7], ecological carrying capacity imbalance, and socio-economic process differentiation [8]”, the Western Taiwan Straits Economic Zone has emerged as a critical area for analyzing the dynamic coupling mechanisms between ISO, EEM, and SED.

4.2. Construction of the Indicator System

4.2.1. Criteria for Selecting the Indicator System

Based on the studies of Fan et al. [18] and Miao [71], and considering the principles of data availability, indicator typicality, and system relevance, 12 secondary indicators and 27 tertiary indicators were selected to construct a coupling coordination evaluation index system for ISO, EEM, and SED (Table 2).
(1) ISO (X). The key to ISO lies in advancing industrial production technology and improving resource efficiency [72]. The expansion of industrial scale accelerated the process of ISO and drove high-quality industrial transformation [73]. Therefore, two indicators were selected: the number of industrial enterprises above the per capita scale and the total industrial output value above the per capita scale. “The 14th Five-Year Plan for Energy Conservation and Emission Reduction” pointed out that the industrial wastewater recycling transformation should be carried out, promoting the coordinated reduction of volatile organic compounds and nitrogen oxides, and strengthening the control of fine particulate matter [74]. However, due to incomplete monitoring data on volatile organic compounds, four indicators were selected: industrial wastewater emissions, sulfur dioxide emissions, smoke and dust emissions, and nitrogen oxide emissions. Additionally, the resource utilization situation was focused through two indicators: the comprehensive utilization rate of general industrial solid waste and industrial electricity consumption [75].
(2) EEM (Y). EEM aims to achieve sustainable development, focusing on optimizing environmental quality, enhancing governance capacity, and increasing governance input [76]. To represent the stock of natural capital, three indicators were selected: water resources per capita, forest coverage rate, and park green space area. The centralized treatment rate of sewage treatment plants and the non-hazardous treatment rate of domestic waste were used to characterize the governance capacity of the ecological environment. To reveal the human resource reserves in basic industries such as water conservancy and geology, two indicators were selected: the proportions of employees in water conservancy and environmental protection and the proportions of employees in the geological exploration industry.
(3) SED (Z). SED encompasses both economic growth and the improvement of social services and social security coverage [77]. To reflect the regional economic scale and reveal the process of economic structure optimization, five indicators were selected: Gross Domestic Product (GDP) per capita, total investment in fixed assets per capita, total retail sales of consumer goods per capita, the added value of the tertiary industry, and urbanization rate. At present, basic public services such as education and healthcare are key indicators for evaluating social services [78]. The improvement of social services and social security directly impacts the quality of life. Therefore, the accessibility of public social services and the status of social security are represented through indicators such as the total collection of books in public libraries per thousand people, the number of hospitals per thousand people, the number of full-time teachers in higher education institutions per thousand people, the proportion of participants in the basic endowment insurance for urban employees, and the proportion of participants in the basic medical insurance for urban areas. Meanwhile, technological innovation is an advanced means to stimulate industrial upgrading and promote economic development. To represent technological innovation input and output, two indicators were used: the number of patents authorized per capita and the proportion represented by science and education in fiscal expenditure compared to total financial expenditure [79].

4.2.2. Multicollinearity Test

To examine whether there is linear correlation between the indicators within each subsystem, the tolerance (TOL) and Variance Inflation Factor (VIF) were used as part of the multicollinearity analysis method to test multicollinearity among the indicators. Severe multicollinearity can lead to unstable analysis results. Generally, the following rules apply: 0 < V I F < 10 , no multicollinearity; 10 V I F < 100 , moderate multicollinearity; V I F 100 , severe multicollinearity [80]. This study used SPSS 26 software for Multicollinearity Test. According to Table 2, the VIF value of “added value of the tertiary industry” in SED subsystem was 15.496, indicating moderate multicollinearity. The VIF values of the other indicators were all less than 10, suggesting no multicollinearity and confirming the reliability and validity of the selected indicators.
Although “added value of the tertiary industry” has multicollinearity risks, this indicator directly measures the qualitative transformation of the industrial structure from “industry-driven” to “service-driven”, and it serves as the core proxy variable for the “demand-side driving supply-side upgrading” in STS theory. Excluding this indicator would disrupt the explanatory chain of STS theory; therefore, this indicator was retained.

4.3. Methods

4.3.1. Entropy Method

ISO, EEM, and SED are complex, multidimensional concepts that require systematic evaluation of the three subsystems. When using subjective weighting methods such as the Analytic Hierarchy Process (AHP), it is necessary to rely on the decision-maker’s scoring to determine the weights. However, decision-makers face limited rationality and are prone to introducing personal preferences, which can lead to significant bias in the results [81]. In contrast, the entropy method is an objective approach to determining indicator weights, assigning weights based on information entropy, thereby capturing the relative variation in the evaluated indicators [82]. This method had been widely applied in the evaluation of sustainable development. For instance, Zhang et al. used the entropy method to compute the comprehensive indices of four subsystems: carbon reduction, pollution mitigation, ecological greening, and economic growth [83]. Similarly, Ye et al. employed the entropy method to assess the level of marine ecological resilience in China’s coastal provinces [84]. Scholars who calculated the coupling coordination level of various subsystems based on the results derived from the entropy method, consistently confirming the method’s universality and robustness within multidimensional indicator systems. Given that this study required the construction of indicator systems for three subsystems, which involved a large number of indicators and complex panel datasets, the entropy method was considered more appropriate, as it was particularly well suited for studies involving multidimensional evaluations based on long-term panel data series [82]. Consequently, this study uses the entropy method to evaluate the ISO, EEM, and SED in 20 cities within the Western Taiwan Straits Economic Zone from 2011 to 2023. The calculation steps are as follows.
In the first step, a standardization method was applied to convert the raw data into dimensionless and comparable relative values. This process eliminated the dimensional differences among various indicators and laid the foundation for subsequent information entropy calculations and objective weighting.
X i j t = x i j t m i n x i j t m a x x i j t m i n x i j t ,   t he   jth   indicator   is   positive m a x x i j t x i j t m a x x i j t m i n x i j t ,   t he   jth   indicator   is   negative
In the second step, the weights for the indicators are calculated.
y i j t = X i j t t = 1 13 i = 1 20 X i j t e j = 1 l n i t t = 1 13 i = 1 20 y i j t l n y i j t , 0 e j 1 d j = 1 e j w j = d j j = 1 27 d j
Here, i denotes city (i = 1, …, 20); j denotes indicator (j = 1, …, 27); t denotes year (t = 1, …, 13); X i j t denotes the raw value of the jth indicator for city i in year t; and w j denotes the weight of each indicator.

4.3.2. Panel Vector Autoregression Model

Holtz-Eakin et al. proposed the concept of the panel vector autoregression model [85]. The PVAR model, while considering both individual effects and time effects, was able to reflect the dynamic influence mechanism of the “ISO-EEM-SED” ternary relationship [86].
y i , t = α 0 + j = 1 p α i , j y i , t j + γ i + θ t + ε i , t y i , t = I S O i , t ; E E M i , t ; S E D i , t T
where i represented city (i = 1, …, 20), and t represented year (t = 1, …, 13). p indicated the lag order. α 0 was the intercept term, and α i , j was a 3 × 3 coefficient matrix. γ i represented the individual fixed effects, and θ t represented the time fixed effects. ε i , t denoted the random disturbance term, which followed a normal distribution.

4.3.3. Degree of Coupling Coordination Model

The degree of coupling coordination model was used to study the interaction between multiple systems and to assess the degree of coordinated development among these systems [87]. This study used the degree of coupling coordination model to explore the interactions among the three subsystems: ISO, EEM, and SED. The degree of coupling coordination model includes three indicators:
C = X Y Z X + Y + Z 3 3 3 T = α X + β Y + γ Z D = C × T
where X represents the comprehensive score of ISO, Y represents the comprehensive score of EEM, and Z represents the comprehensive score of SED. C denotes the degree of coupling between ISO, EEM, and SED. It reflected the strength of interdependence among the subsystems and measured the tightness of resource factor flows and technological spillovers. T represents the degree of coordination among the three subsystems, indicating the balance in their levels of development and emphasizing the degree of compatibility in the evolutionary states of each subsystem. α , β , and γ refers pending weights. D represents the degree of coupling coordination among the three subsystems, providing a comprehensive assessment of the collaborative level between the intensity of interactions and the quality of development among the subsystems. The value of D ranges from 0 to 1, with a higher (lower) value of D indicating a stronger (weaker) degree of coupling coordination between the subsystems.
According to the “Notice on Issuing Several Policies to Promote Stable Growth of the Industrial Economy” issued by the National Development and Reform Commission, the policy orientation of “coordinating industrial growth, environmental constraints, and social benefits” was proposed. ISO (X), EEM (Y), and SED (Z) were included as equally important strategic dimensions [88]. Based on this, this study followed the principle of balanced development and set α = β = γ = 1 3 . Similarly, the equal-weight setting model has been widely applied in the regional coordinated development evaluation of multidimensional subsystems [65,89].
Based on regional conditions, the degree of coupling of the three subsystems was divided into four levels (Table 3), while the degree of coordination was divided into five levels (Table 4) [90,91].
Based on the division of coupling coordination levels by Fu et al. [92], this study categorizes the degree of coupling coordination of the three subsystems into ten levels, as shown in Table 5.

4.3.4. Kernel Density Estimation

Based on the coupling coordination results, this study aimed to reveal the dynamic distribution characteristics, trace the evolutionary process of regional coupling coordination levels, and observe the changing trends in development gaps among cities. The Dagum Gini coefficient had been an effective tool for analyzing the spatial differentiation characteristics of the degree of coupling coordination [93]. However, it focused on depicting spatial differentiation patterns that were static or at a single point in time, making it difficult to capture their dynamic evolution characteristics over time. In contrast, kernel density estimation proved to be more effective in analyzing the dynamic evolution process of differences in the degree of coupling coordination among cities [64]. Kernel Density Estimation is a non-parametric method used to estimate the probability density function of a random variable. It described the dynamic evolution process of the degree of coupling coordination over time by examining the distribution position, kurtosis, polarization patterns, and other characteristics of the density curve [64]. Let x 1 , x 2 , . . . , x n be random variables with independent distributions, and the probability density estimation formula for the degree of coupling coordination be as follows:
f x = 1 n h n K x i x ¯ h
where n represents the number of observations, h represents the bandwidth, x i denotes the individual observations, x ¯ denotes the mean of the individual observations, and K · represents the Gaussian kernel function.
When the bandwidth was set too small, it resulted in overfitting; conversely, when bandwidth was set too large, it caused underfitting [94]. To select the optimal bandwidth, Silverman proposed an empirical rule based on the assumption that the data followed a normal distribution [95]. This rule was optimal under the criterion of minimizing the mean squared error (MSE). Assuming that f x followed a normal distribution N 0 , σ 2 , the formula for calculating the optimal bandwidth was as follows:
h ^ = 1.06 σ ^ n 1 5 σ ^ = m i n { S , Q 1.34 }
where S represents the sample standard deviation, and Q denotes the interquartile range, which is the difference between the 75th and 25th percentiles of the sample.

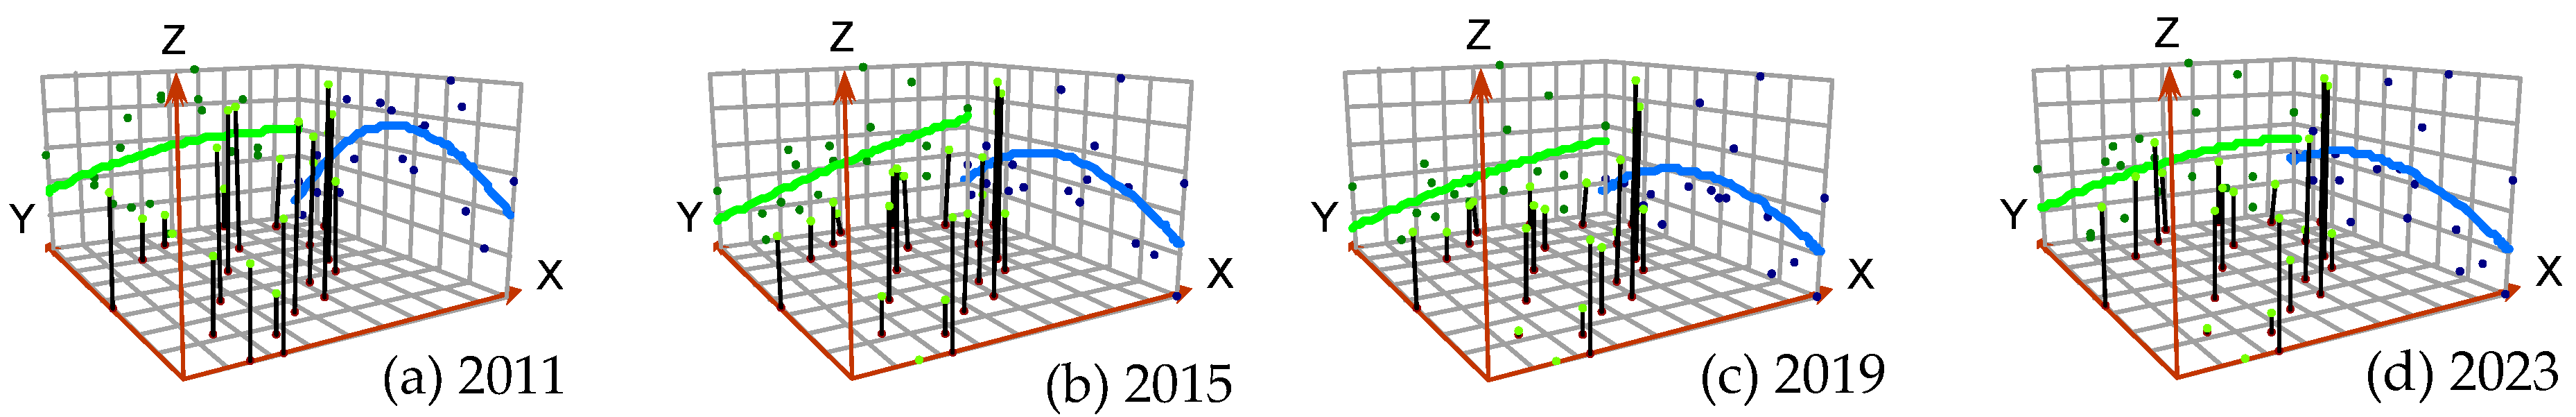
4.3.5. Trend Surface Analysis

Trend surface analysis utilizes spatial data to simulate the spatial distribution and evolutionary trend of geographic elements [96]. This study established the trend function of degree of coupling coordination, analyzed its spatial differentiation characteristics using the trend surface tool in ArcGIS 10.8, and explored the evolutionary trend of degree of coupling coordination from a macroscopic perspective.

4.3.6. Cold–Hot Spots Analysis

Cold and hot spots analysis is a spatial clustering method used to identify the distribution pattern of high and low attribute values. It utilizes the G i * coefficient, first proposed by Getis and Ord, to measure the spatial clustering of attribute values [97]. In this study, the hot spot analysis tool (Getis-Ord G i * ) in ArcGIS 10.8 is used to identify cold–hot spots in the spatial pattern of degree of coupling coordination, as shown in the following formula:
G i * d = j n W i j d X j j n X j
Z G i * = G i * E G i * V a r G i *
where W i j d is the spatial weight matrix and X j is the degree of coupling coordination.

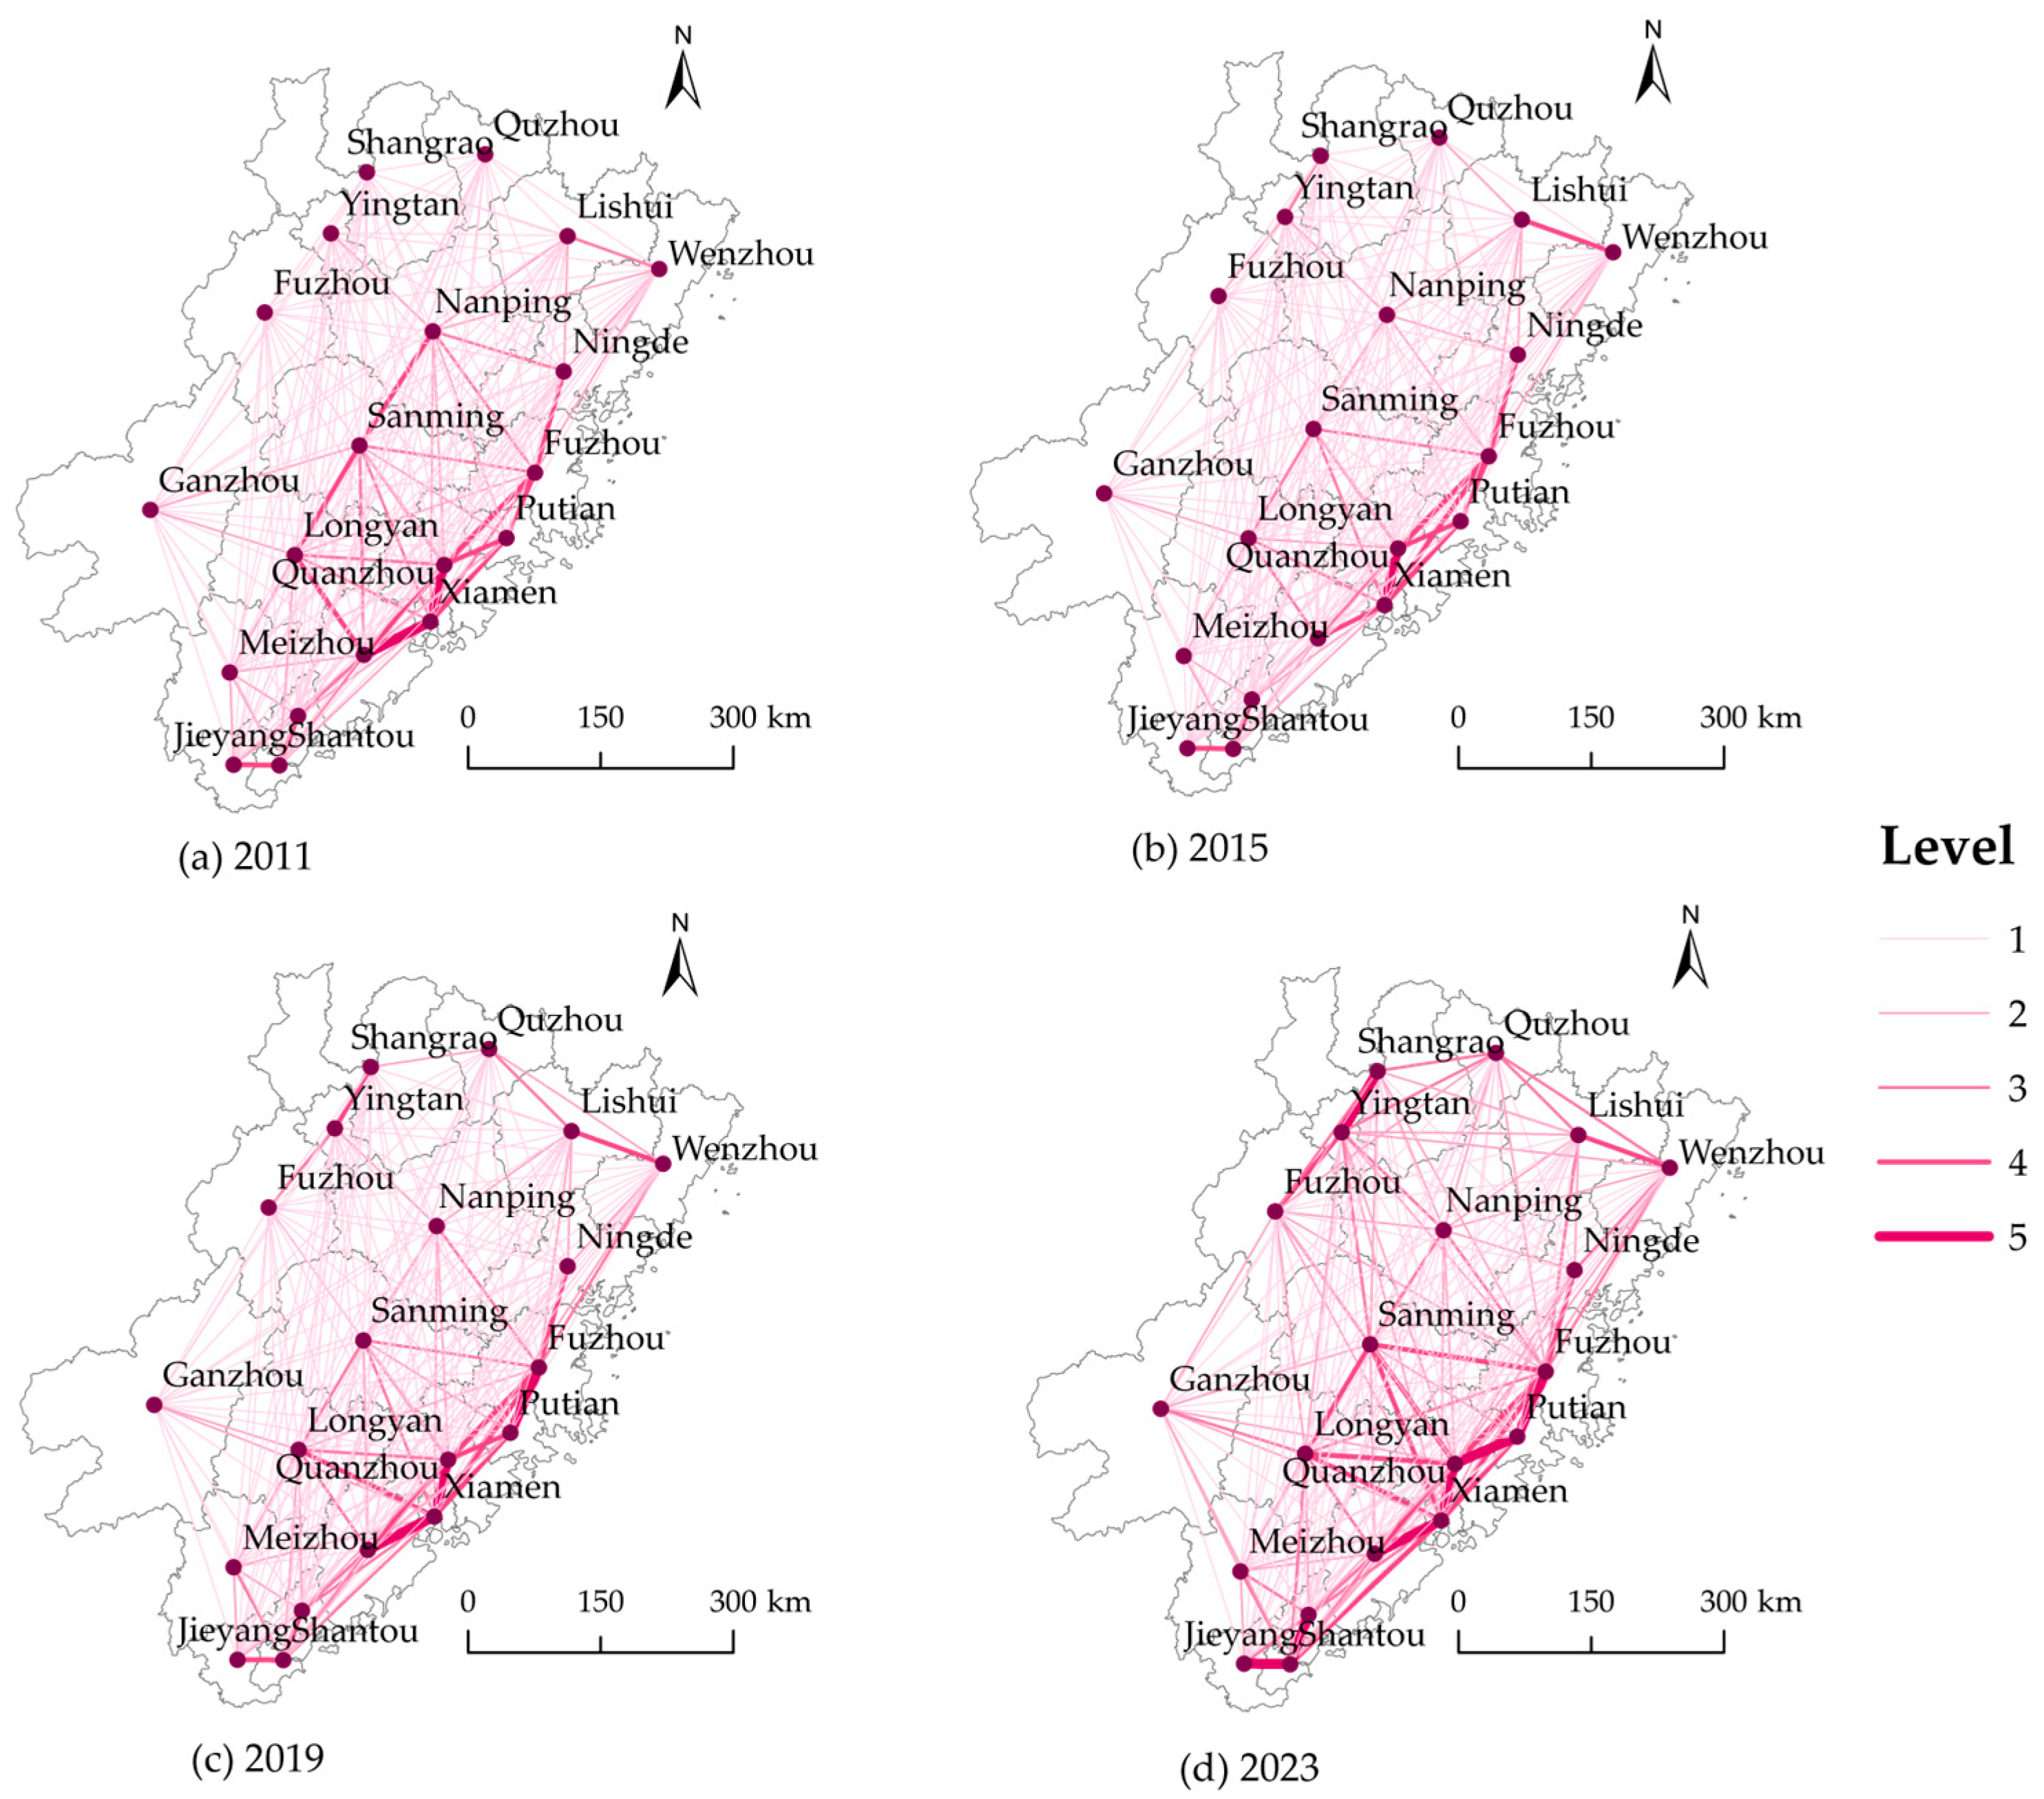
4.3.7. Gravity Model

Compared to the traditional VAR model, which focused on temporal dynamic correlations, the gravity model emphasized the influence of distance relationships among research subjects on regional development [98]. It analyzed the strength of spatial connections, thereby better aligning with the goal of revealing the regional spatial network structure. Therefore, this study uses the gravity model to analyze the spatial connection characteristics of the degree of coupling coordination. The formula of the gravity model is:
R c k = g D c D k L c k b
where R c k represents the strength of the coupling coordination spatial link between city c and city k; g is the gravitational constant (set to 1); D c and D k denote the degree of coupling coordination between city c and city k; L c k represents the distance between the centroids of city c and city k; b is the distance index (set to 2).

4.4. Data Sources

In March 2011, the State Council of the People’s Republic of China officially approved the Development Plan for the Western Taiwan Straits Economic Zone [69]. In April 2011, the National Development and Reform Commission released the full text of the plan. Based on this, panel data from 20 cities in the Western Taiwan Straits Economic Zone for the period 2011–2023 were selected [69]. The data were sourced from the China Urban Statistical Yearbook, China Environmental Statistical Yearbook, China Marine Statistical Yearbook, Guangdong Industrial Statistical Yearbook, Zhejiang Natural Resources and Environment Statistical Yearbook, provincial and statistical yearbooks and National Economic and Social Development Statistical Bulletins of each province and city over the years. Partial missing values were filled using regionally independent linear interpolation method, aiming to avoid issues arising from cross-regional data mixing.

5. Results

5.1. ISO, EEM, and SED Subsystem Comprehensive Score

5.1.1. Robustness Test and Error Range Estimation

To assess the robustness of the indicator weights obtained by the entropy method, this study employed the Bootstrap method (a statistical inference technique) to perform resampling with replacement based on the original data. The core principle of the Bootstrap method was to substitute the unknown population distribution with the known empirical distribution, deriving new parameter estimates through sampling from the existing data, thereby enabling statistical inference about the characteristics of the overall population [99]. By repeated sampling, the Bootstrap method encompassed all possible combinations of the sample data, resulting in more stable outcomes than those based on the original data. This study utilized Matlab R2023b software to set the number of resamples at 1000 and calculated the 99% confidence interval for the weights of each indicator (Table 6). The results demonstrated that the original weights of all indicators fell within their respective 99% confidence intervals, indicating that the weight estimates possessed very high reliability; the confidence intervals were generally narrow, suggesting low volatility of the weight estimates under repeated resampling; moreover, the mean weights after Bootstrap resampling closely approximated the original weights, further confirming the robustness of the weight calculations based on the entropy method.

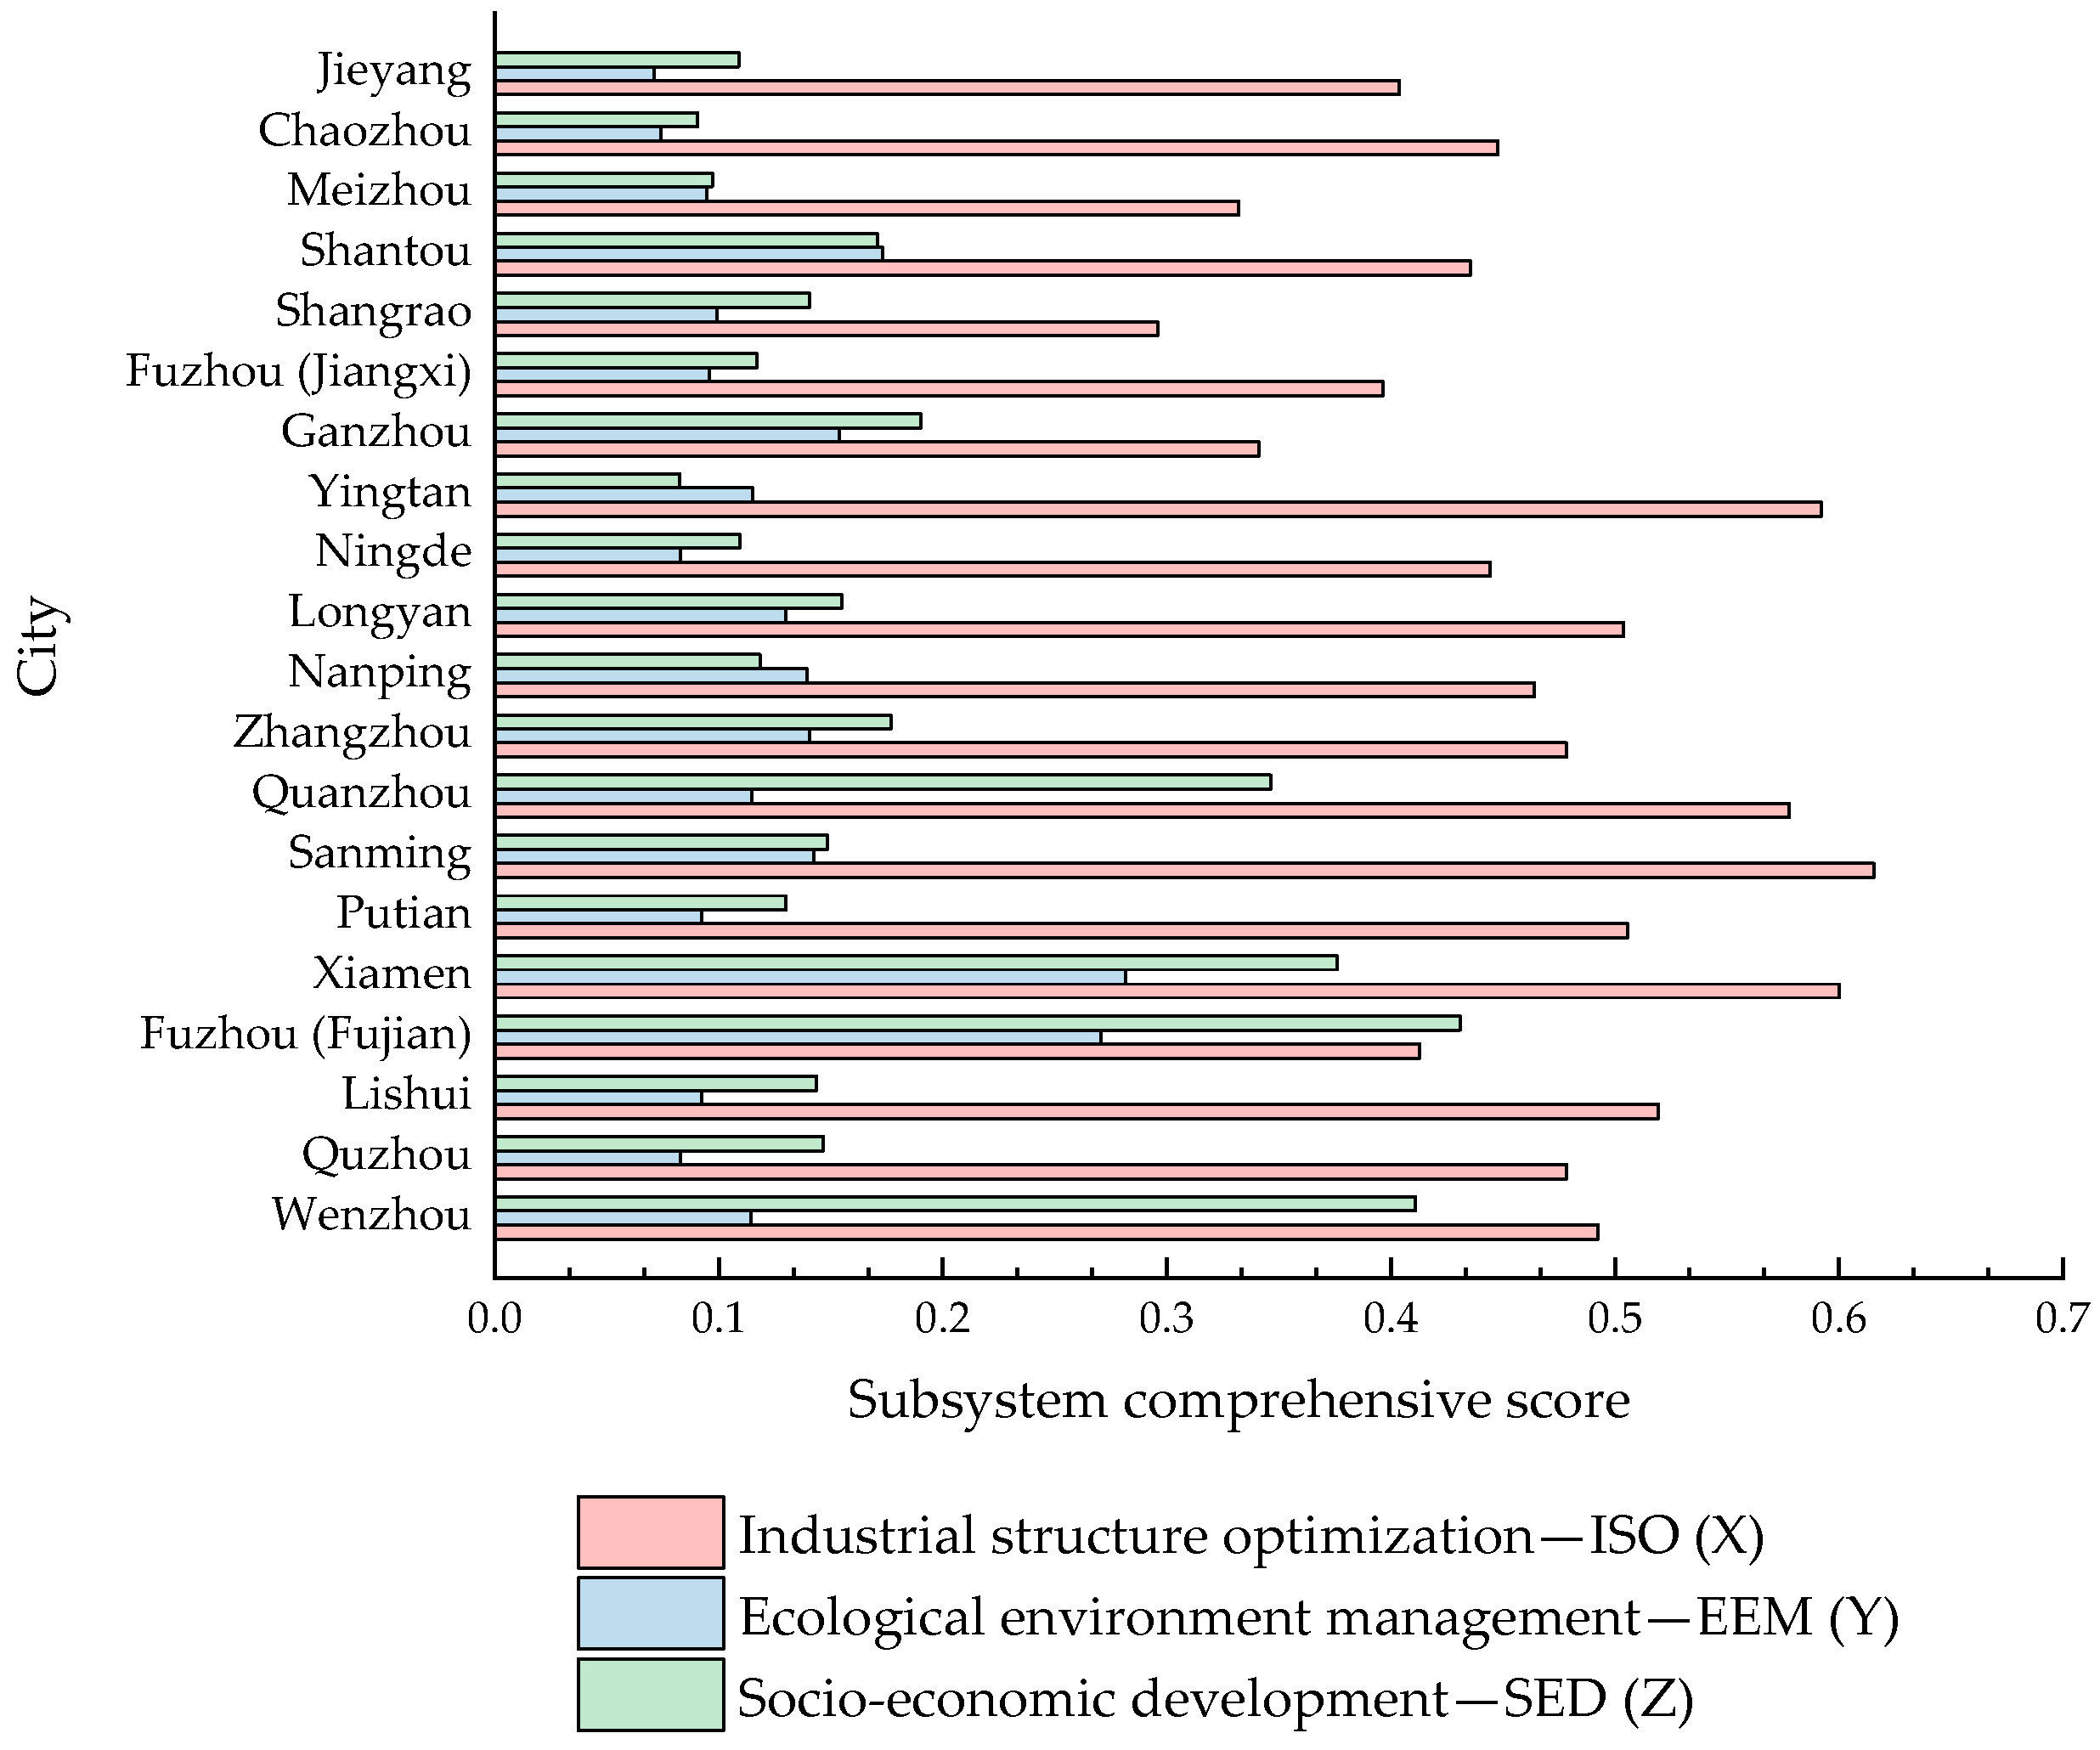
5.1.2. Comprehensive Score

Based on the entropy method, the comprehensive scores of the subsystems for ISO, EEM, and SED from 2011 to 2023 were calculated (Figure 4). The comprehensive score for ISO is the highest, displaying a significant upward trend. It experienced the fastest growth rate of 4.747% in 2012–2013 and a slight decline in 2017–2018, followed by another upward trend, indicating the continued progress in the ISO of the Western Taiwan Straits Economic Zone. The comprehensive score for EEM experienced a slight overall decline, with a continuous decrease from 2012 to 2016 at an average annual rate of 11.244%. This decline was likely attributable to the industrial expansion of high energy-consuming and heavily polluting industries and the rapid urbanization in the Western Taiwan Straits Economic Zone during that period. The industrial structure was probably still dominated by traditional manufacturing and resource-based industries, with a relatively low proportion of high-tech industries. Moreover, the environmental management system was relatively weak, environmental infrastructure construction lagged behind, and the enforcement of environmental supervision mechanisms was insufficient. This period marked a concentrated period of conflict among economic development, industrial expansion, and the lack of effective EEM. However, it showed steady improvement from 2016 to 2023, increasing from 0.107 to 0.142. This subsystem is expected to continue its upward trend in the future. In 2012, the comprehensive score for SED exceeded that for EEM. SED exhibited a high growth rate after small fluctuations from 2011 to 2017, increasing from 0.160 to 0.265 in 2017–2023, which closely mirrors China’s economic growth since the reform and opening-up in 1978 [100]. Overall, the SED subsystem has shown the fastest growth rate, followed by ISO. Although the growth rate of EEM is slower, there is still significant potential for improvement. At present, the Western Taiwan Straits Economic Zone is prioritizing SED, with ISO as its primary objective. However, addressing the growing conflict between EEM and SED will be critical in the future.
Figure 5 presented the comprehensive scores of the subsystems at the city level. The results showed that, significant imbalances exist in ISO, EEM, and SED. The mean comprehensive score for ISO from 2011 to 2023 is 0.467. The top three cities in the rankings are Sanming, Xiamen, and Yingtan. The ISO process in Fujian Province is progressing rapidly. In contrast, Ganzhou, Meizhou, and Shangrao rank at the bottom. This indicates that factors such as economic development, policy support, resource allocation, and local government execution significantly impact ISO in each city. The comprehensive score for EEM is low, with a mean value of 0.128. Xiamen, Fuzhou, and Shantou rank in the top three, while Ningde, Chaozhou, and Jieyang occupy the bottom positions. The mean comprehensive score for SED is 0.185. Fuzhou, Wenzhou, and Xiamen rank in the top three, with scores of 0.431, 0.411, and 0.376, respectively. Only five cities exceeded the mean comprehensive score for SED, indicating a severe imbalance in SED, with a pattern of “high in coastal areas and low in mountainous areas”.

5.2. Interaction Among ISO, EEM, and SED

5.2.1. Stationarity Test

To avoid the problem of spurious regression, this study conducted LLC, IPS, HT, ADF, and PP unit root tests on the three subsystem variables (ISO, EEM, SED) using STATA 17.0 software (Table 7). The panel data for ISO, EEM, and SED all exhibited non-stationary characteristics. To ensure the reliability of the model estimation, all variables underwent first-order differencing and were subjected to unit root tests again. The results after first-order differencing indicated that D.ISO, D.EEM, and D.SED all passed the stationarity tests, thus meeting the fundamental prerequisites for constructing the PVAR model.

5.2.2. Optimal Lag Order

This study determined the optimal lag order based on the minimum values of the AIC, BIC, and HQIC. As shown in Table 8, when the PVAR model lag order was set to 2, the values of BIC and HQIC reached their minimum. Therefore, this study selected a lag order of 2 as the optimal lag order for the PVAR model.

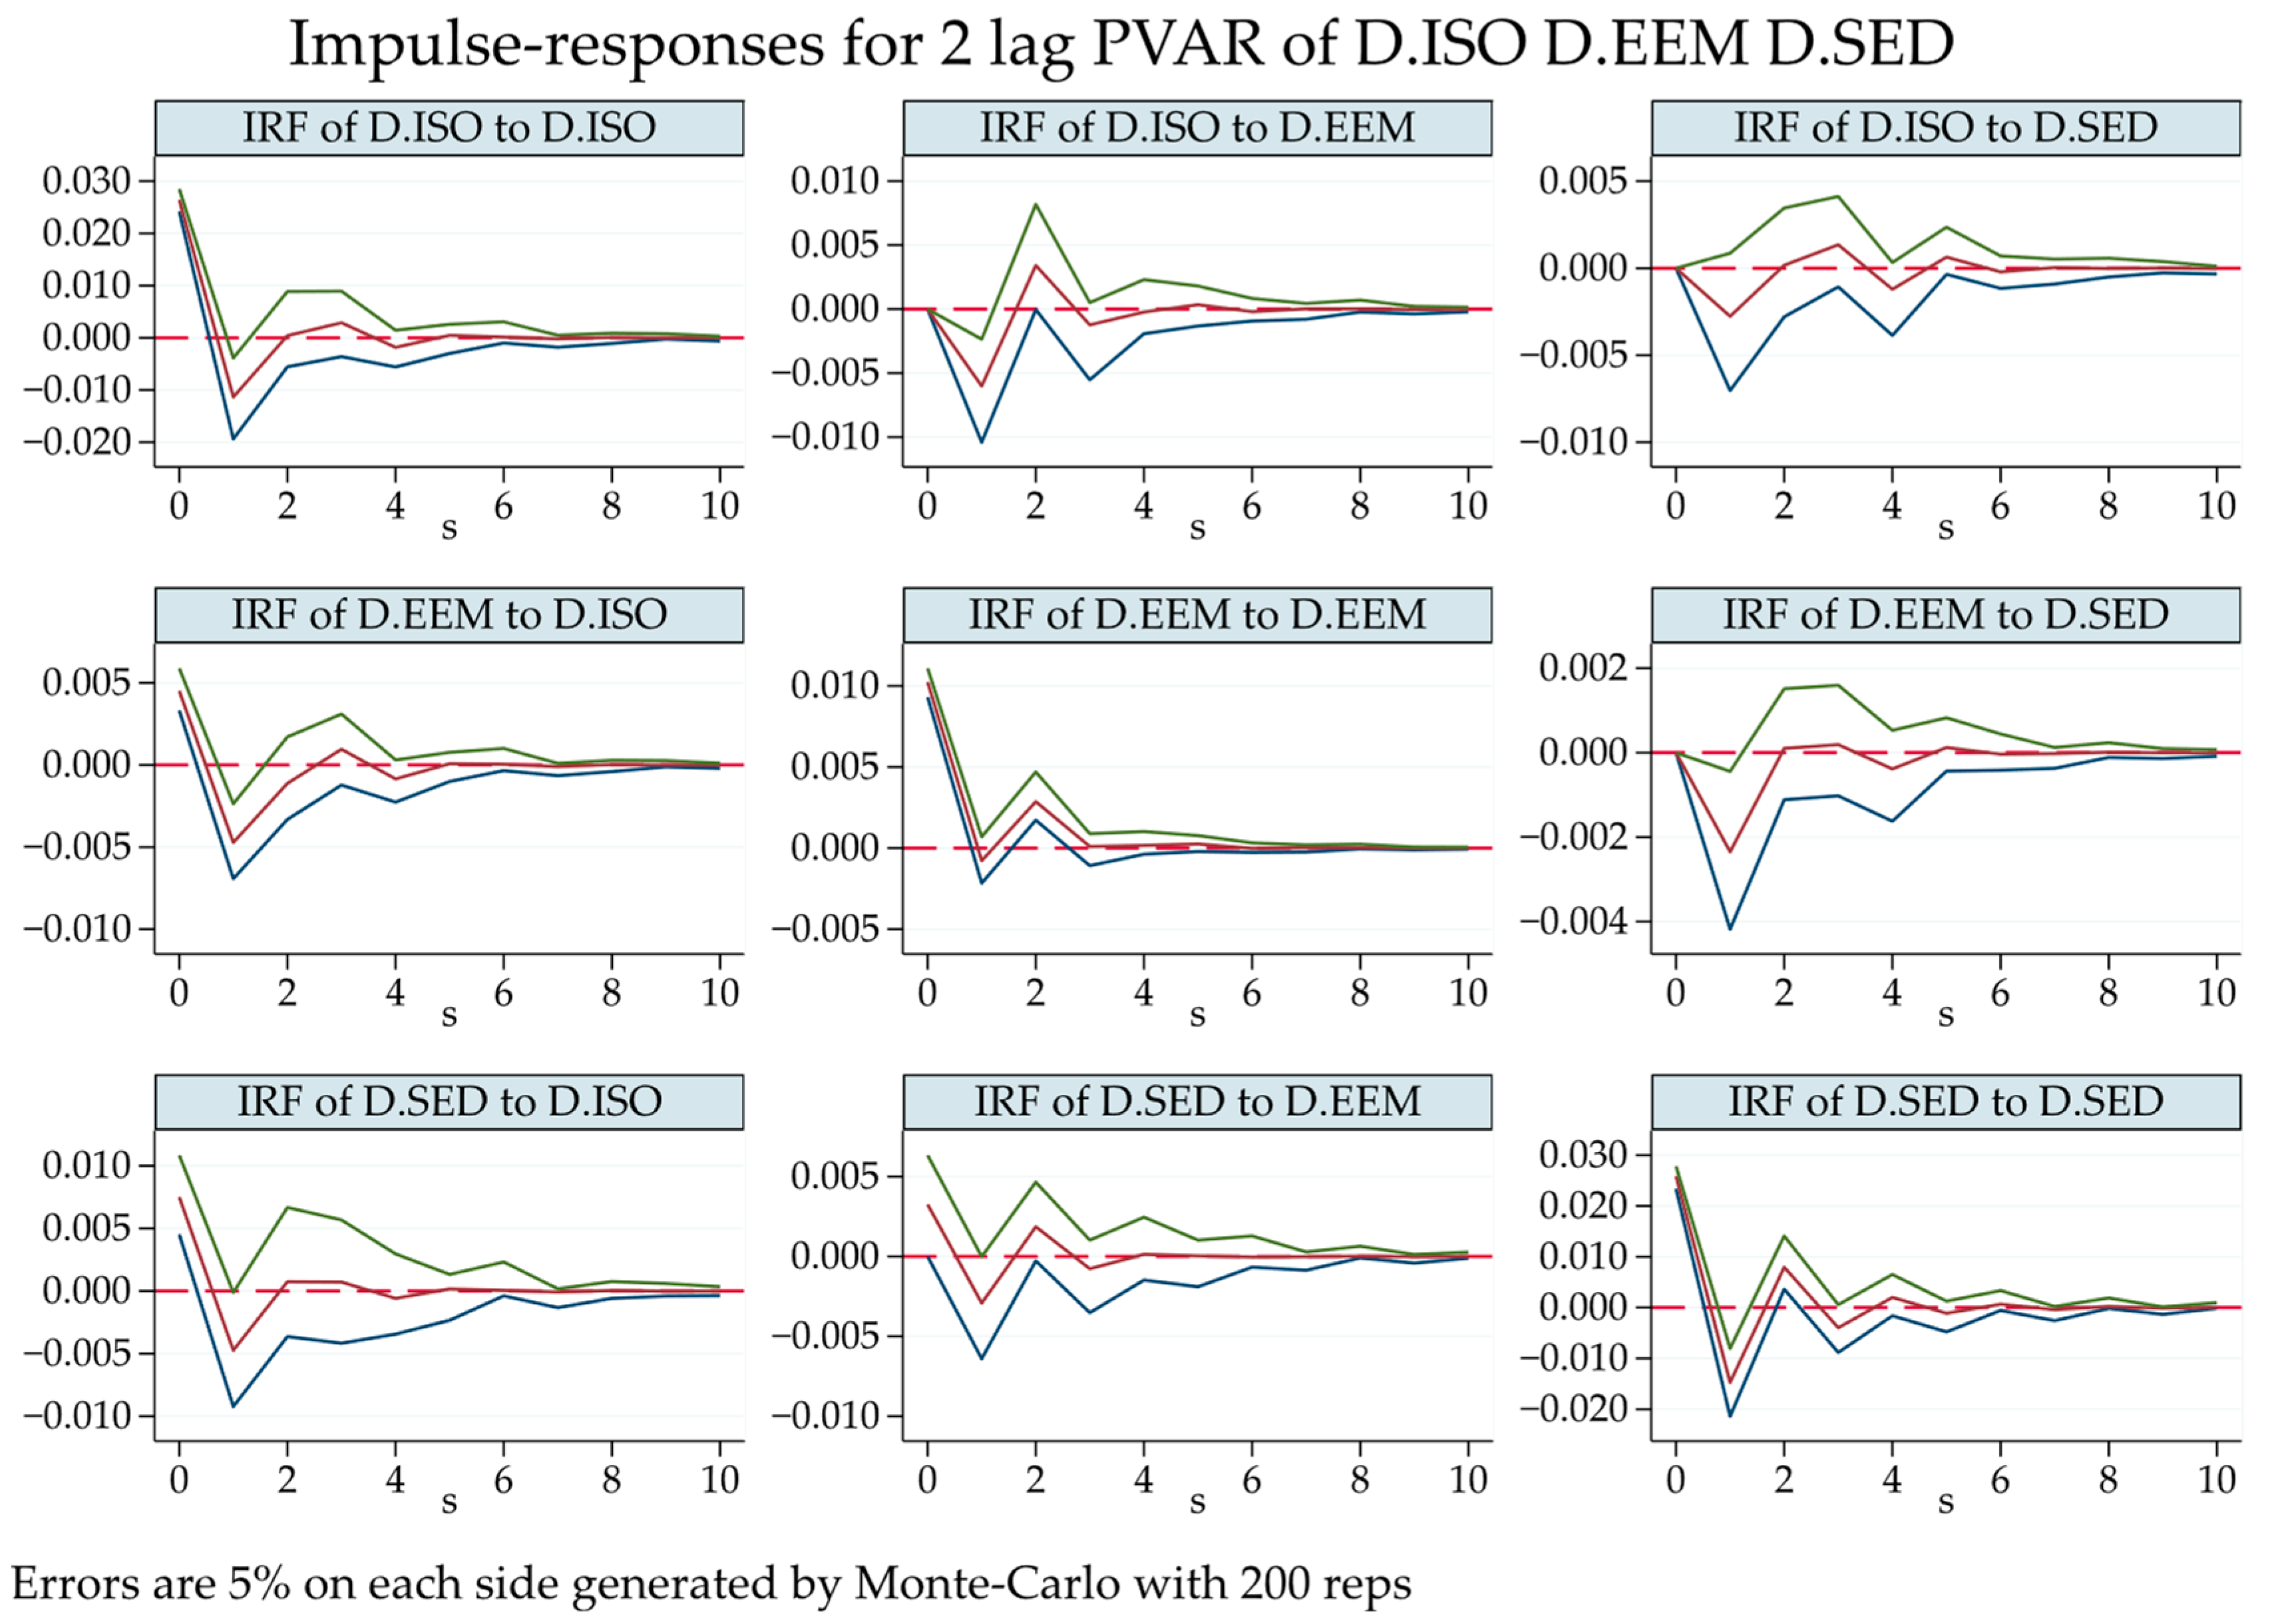
5.2.3. Impulse Response Analysis

To further elucidate the dynamic interactions among ISO, EEM, and SED, the impulse response results were used to describe the dynamic shocks and transmission paths among these three variables. This study set the impulse response horizon to 10 periods [101] with a lag order of 2. In Figure 6, the horizontal axis represented the impulse response horizon (in years), and the vertical axis denoted the standardized impulse response value. Each graph contained three lines from top to bottom: the upper bound, the estimated response, and the lower bound.
(1) When ISO, EEM, and SED were subjected to their respective shocks, the responses reached a positive maximum peak within the current period, exhibited a negative response in the first period, recovered to a positive response in the second period, after which the amplitude of the positive and negative fluctuations gradually diminished, converging near zero after the sixth period. They exhibited short-term policy dividends but immediately revealed transitional bottlenecks in the first period, subsequently experiencing oscillations around zero under adaptive policy adjustments before converging to a steady state.
(2) When shocks were imposed by EEM on ISO, SED on ISO, and SED on EEM, the response values reached a positive maximum peak within the current period, indicating the existence of positive transmission effects. A negative maximum peak occurred in the first period, followed by a significant positive response in the second period. Thereafter, the responses gradually decayed and converged near zero after the fifth period. The immediate positive peak in the current period revealed the underlying reasons for the similar trends: environmental management constrained high-pollution enterprises, while livelihood demands stimulated industrial transformation. However, industrial enterprises subsequently faced challenges such as reduced R&D intensity due to ecological regulations and decreased industrial investment resulting from expanded social welfare. At the same time, economic development pressures compelled concessions in ecological protection, revealing a short-term resource competition among the subsystems. Subsequently, as the market adaptively recovered, the impact gradually reverted to a positive direction and approached a steady state.
(3) When shocks were imposed by ISO on EEM, ISO on SED, and EEM on SED, the response values were zero in the current period, declined in the first period, gradually reached their positive peaks in the second to third periods, and then maintained relatively stable fluctuations, with minimal long-term effects. The impact of ISO on EEM indicated that the diffusion of green industrial technologies required undergoing an industrial capacity renewal cycle, exhibiting a certain lag effect. The impacts of ISO on SED and EEM on SED suggested that the promotion of high-quality employment through industrial upgrading involved a buffering period, and that the facilitation of livelihood benefits transformation through ecological management depended on gradual adjustment.

5.3. Spatio-Temporal Analysis of the Coupling Coordination of ISO, EEM, and SED

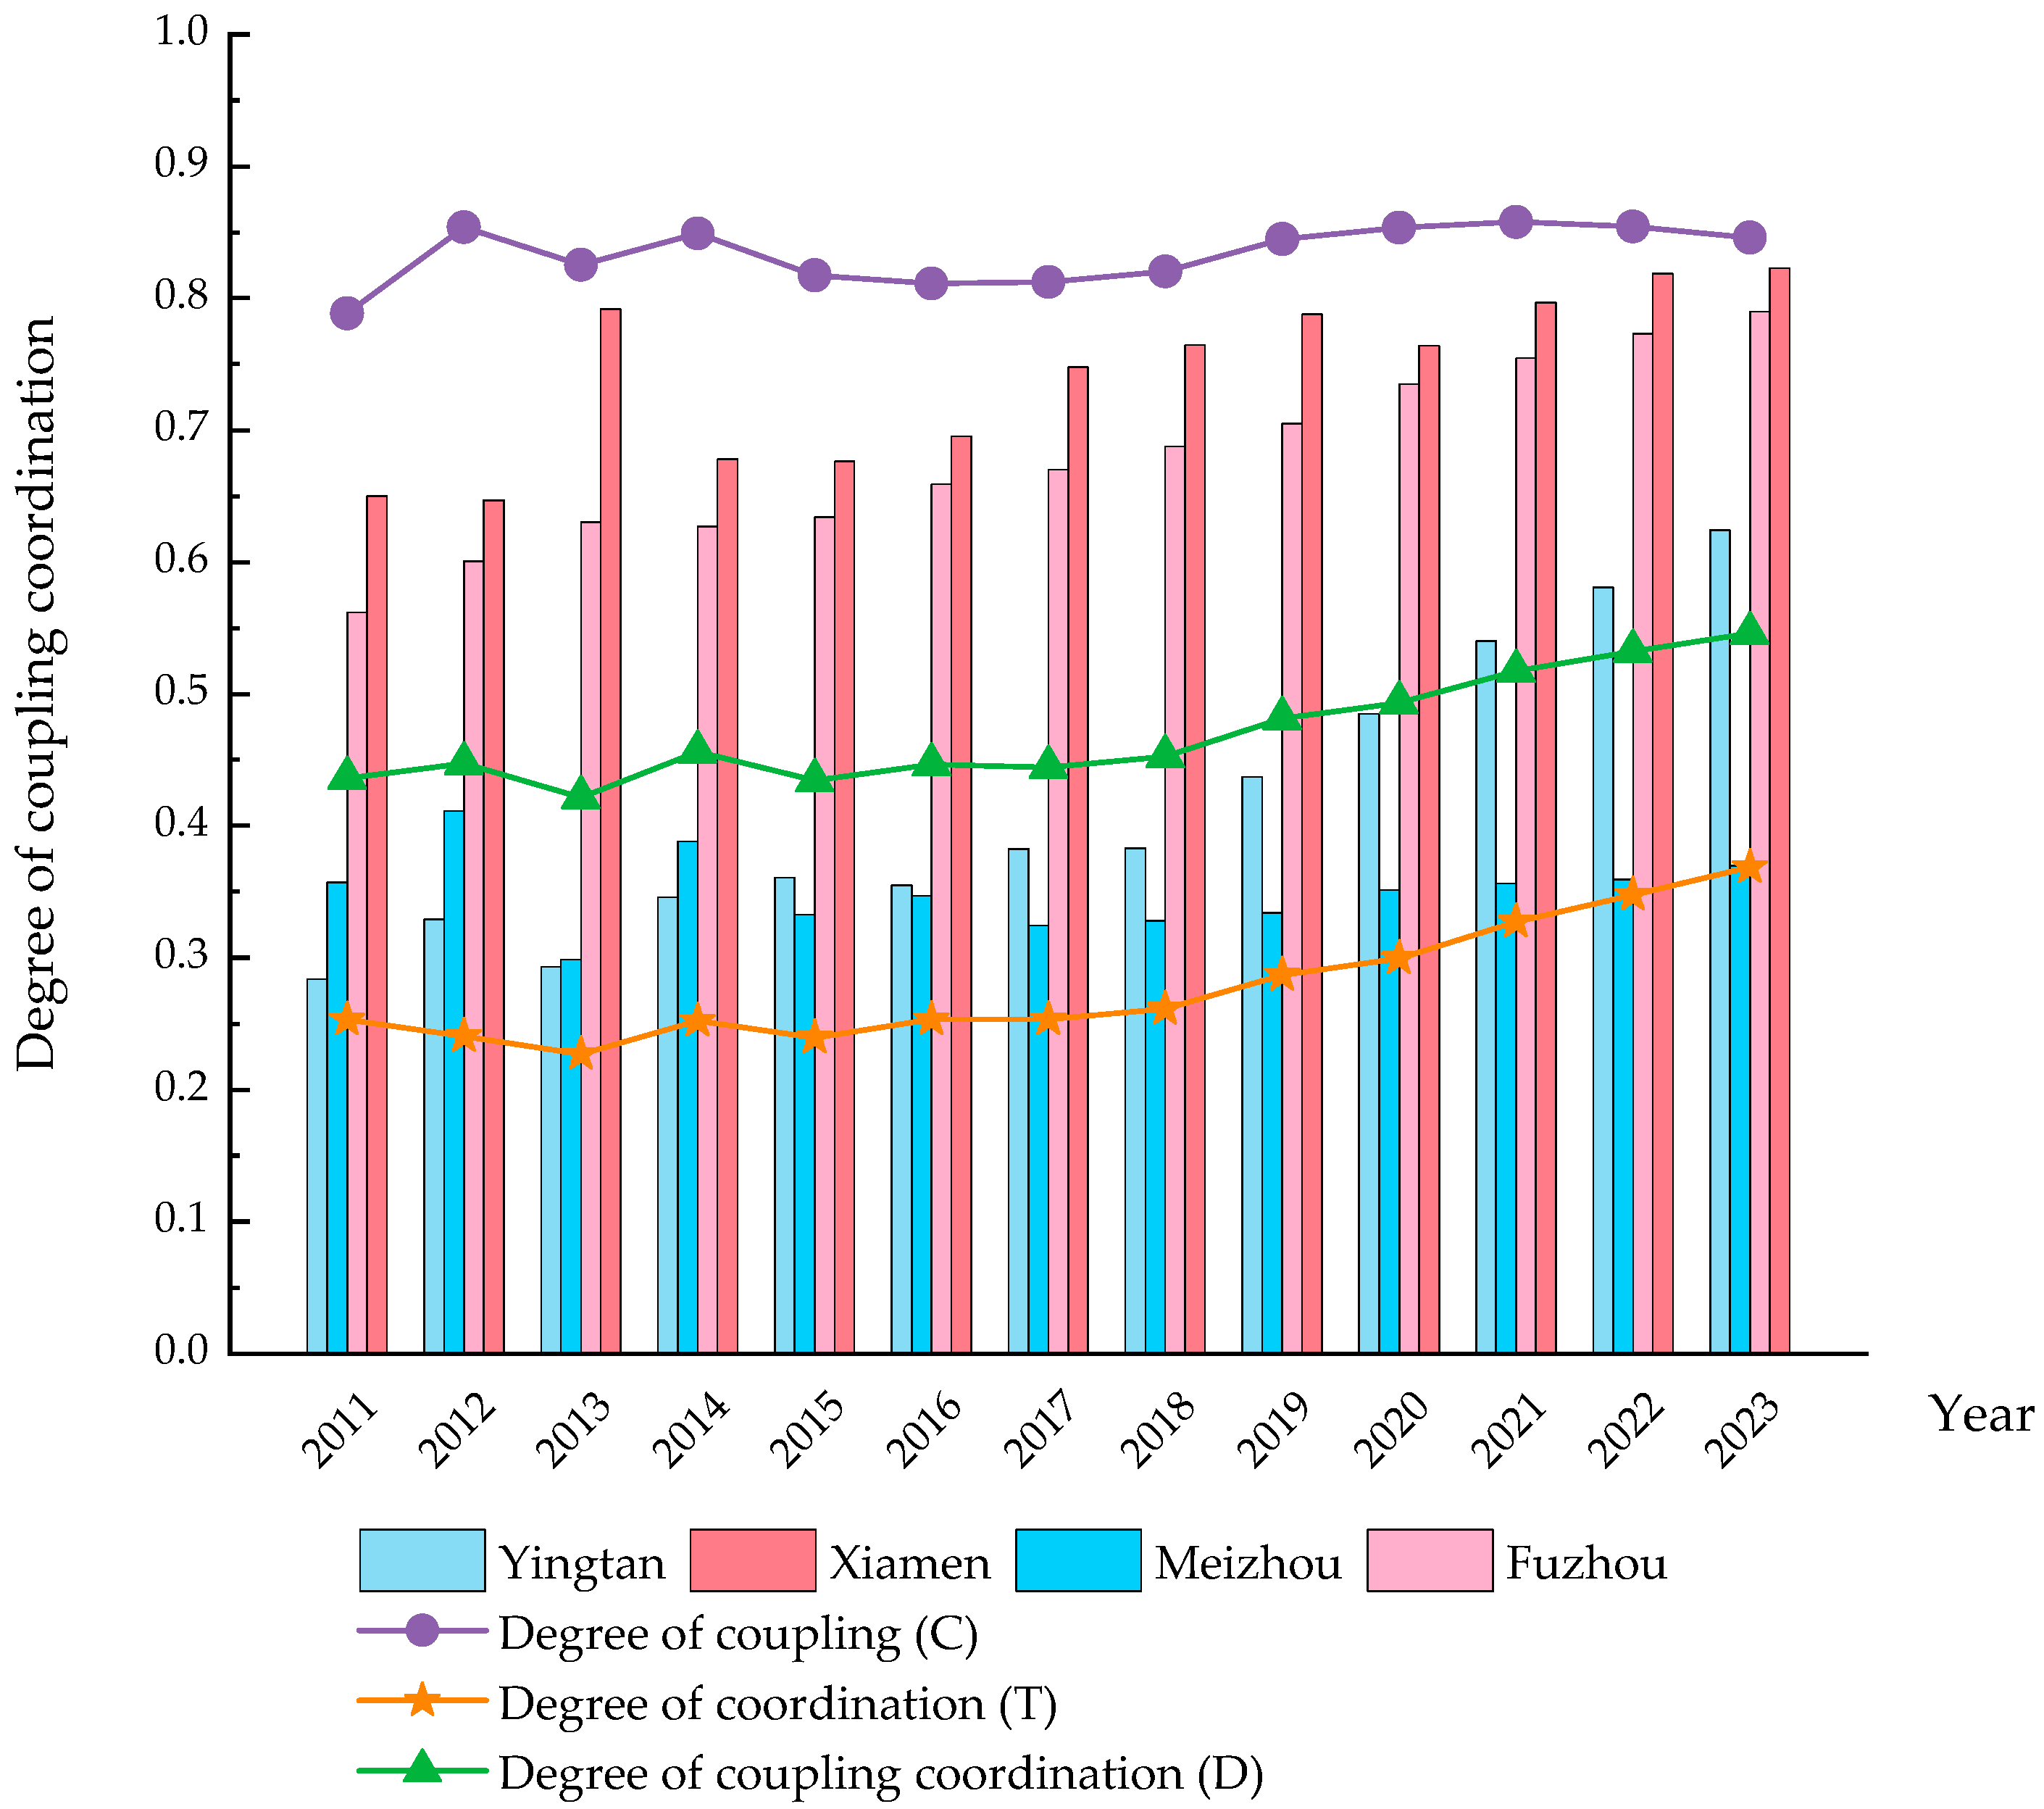
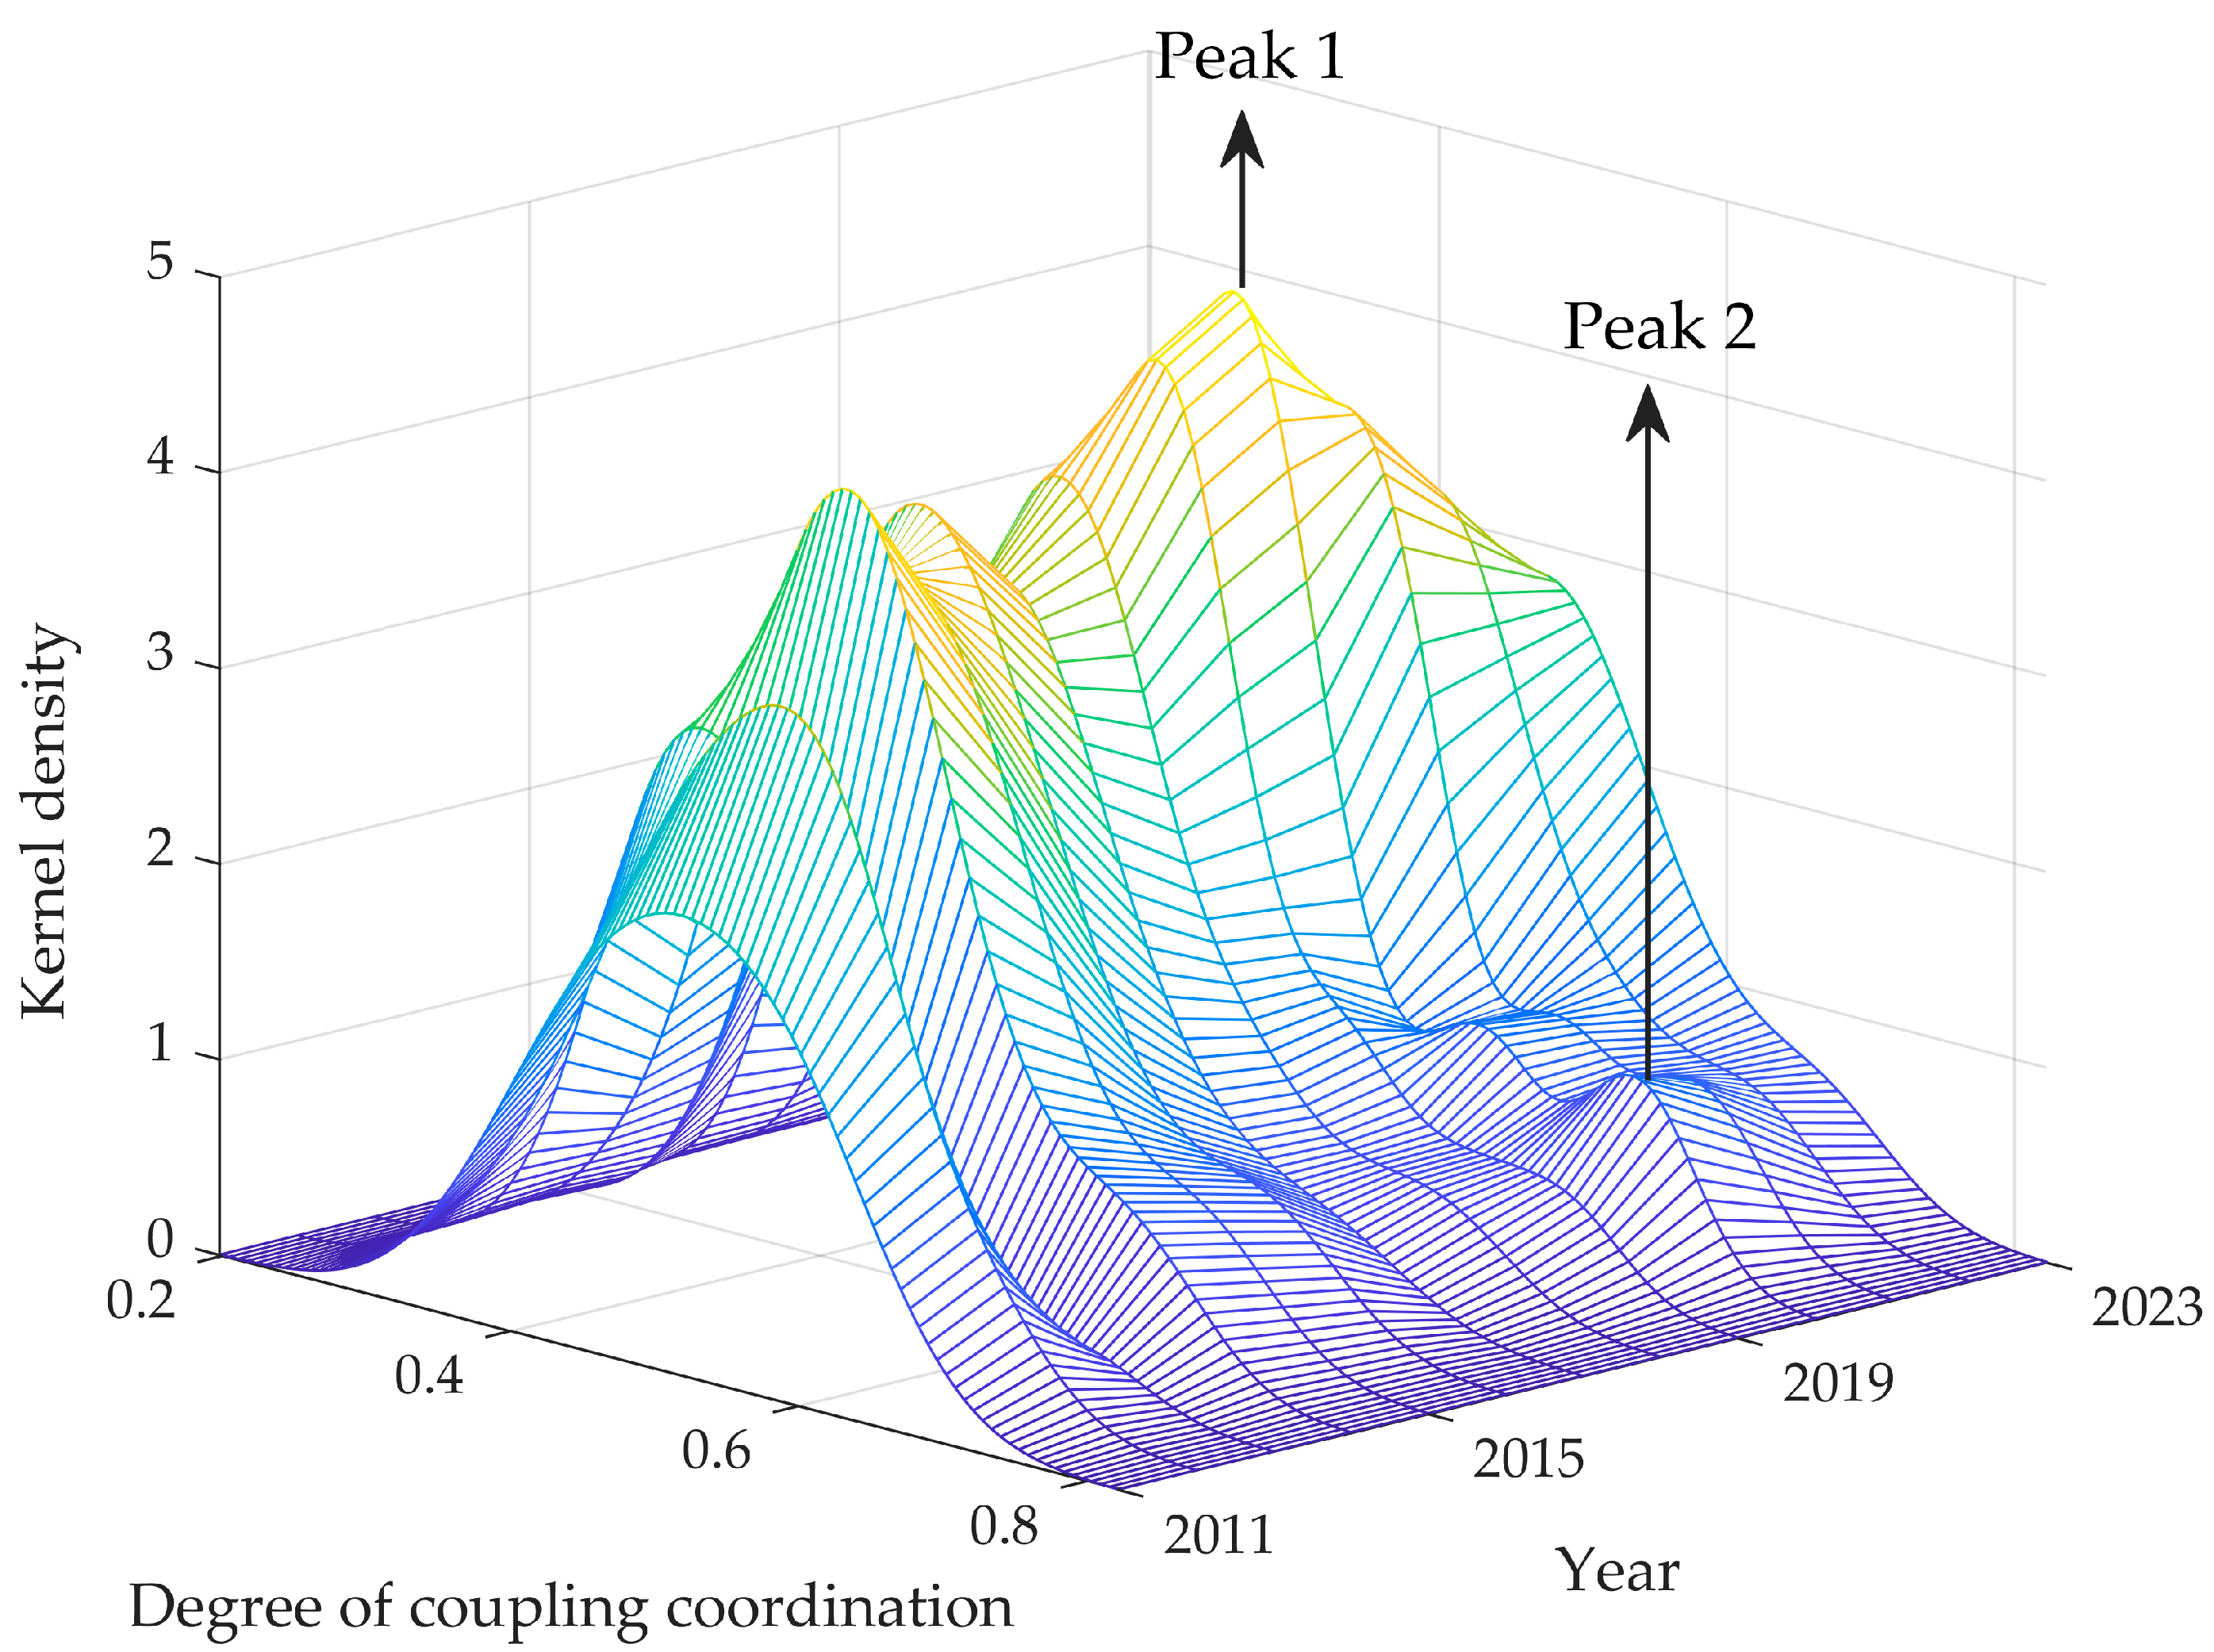
5.3.1. Characterization of Temporal Evolution

Next, this study presented the results of the degree of coupling, degree of coordination, and degree of coupling coordination calculated based on the degree of coupling coordination model (Figure 7). The trends in the degree of coupling, degree of coordination, and degree of coupling coordination from 2011 to 2023 are similar, following a pattern of “fluctuating and increasing initially, followed by steady growth”. After 2012, the degree of coupling stabilizes in the (0.8, 1.0] range, indicating a high-level coupling stage. Overall, the coupling development among the three subsystems—ISO, EEM, and SED—of the Western Taiwan Straits Economic Zone progresses from a friction stage to a high-level coupling stage, suggesting a high degree of interdependence among the three subsystems. The degree of coordination, overall much lower than the degree of coupling, dropped to 0.227 in 2013, and then steadily increased from 2015 to 2023, remaining in the medium–low-level coordination stage. The growth rate of the degree of coordination is higher than the degree of coupling, with a significant upward trend, indicating a continuous strengthening of interaction among the three subsystems. The degree of coupling coordination transitions from near disorder to barely coordinated, achieving leapfrog development.
This study compared the degrees of coupling coordination of four cities—Xiamen and Fuzhou, which rank at the top, and Meizhou and Yingtan, which rank at the bottom. The study aimed to analyze the changes in the degree of coupling coordination in these cities at depth. The degree of coupling coordination of the Western Taiwan Straits Economic Zone increased from 0.436 in 2011 to 0.546 in 2023. The period from 2011 to 2023 can be divided into two phases, as follows: 2011–2020, which represents the near-disorder stage, and 2021–2023, which represents the barely coordinated stage. The degree of coupling coordination in Fuzhou steadily increases in the overall period, progressing from barely coordinated to intermediate coordination. The degree of coupling coordination in Xiamen shows significant fluctuations. Although it achieves good coordination in 2022–2023, its growth rate slows, suggesting that the coupling coordination among the three subsystems is nearing saturation. The degree of coupling coordination in Meizhou slightly increases in the period, while the degree of coupling coordination in Yingtan soars from 0.284 to 0.624, surpassing the average degree of coupling coordination of the Western Taiwan Straits Economic Zone in 2021. This indicates strong potential for coordinated development. This “leap” was likely driven by the precise empowerment of national strategies, fundamentally characterized by institutional innovation fostering systemic restructuring. In 2019, National Development and Reform Commission issued the “Notice on Launching Pilot Zones for National Urban-Rural Integrated Development”, with Yingtan being the only city selected from Jiangxi Province. The pilot focused on establishing integrated development mechanisms for urban-rural infrastructure and creating systems to equalize basic public services between urban and rural areas. Yingtan coordinated and planned infrastructure, integrated scattered plots to construct industrial parks, reduced the cost of land for enterprises, and promoted green and intensive industrial production. Yingtan implemented the decentralization of public service resources and relied on inclusive policies in healthcare and education to attract population return and employment. Yingtan achieved coordinated restructuring of land, industry, and population factors, thereby accelerating the coupling among ISO, EEM, and SED.
In 2021, the Ministry of Industry and Information Technology of China issued the “Guidance on Strengthening Industry Integration and Cooperation to Promote Green Industrial Development”. The “Guidance” outlines the overall direction for optimizing the industrial structure and adjusting the energy structure. The release of the “Guidance” may facilitate industrial process reengineering, prioritize the development of strategic emerging industries, and encourage the conditional transfer of high-energy-consuming industries. It also aims to emphasize ecological, economic, and social benefits while fostering positive interactions between ISO, EEM, and SED.
Based on the kernel density estimation method, this study uses the Matlab R2023b software to plot a three-dimensional kernel density map of the degree of coupling coordination from 2011 to 2023 (Figure 8), aiming to further investigate the dynamic evolution of the degrees of coupling coordination in ISO, EEM, and SED over time. The centers of the kernel density curves for the degree of coupling coordination from 2011 to 2023 consistently shift to the right each year, indicating a sustained increase in the level of coupling coordination development, which aligns with the previous conclusion. The right-trailing phenomenon of the kernel density curves weakens over time, indicating that fewer cities remain in the quality coordination stage, and the differences in the level of coupling coordination development between cities are narrowing. From the perspective of polarization trends, the height of the main peak generally exhibited a fluctuating upward trajectory. In 2020, the kernel density curve displayed a slight bimodal pattern, with “Peak 1” as the primary peak and “Peak 2” as the secondary peak, indicating that cities were transitioning toward “agglomeration and synchronous development”.

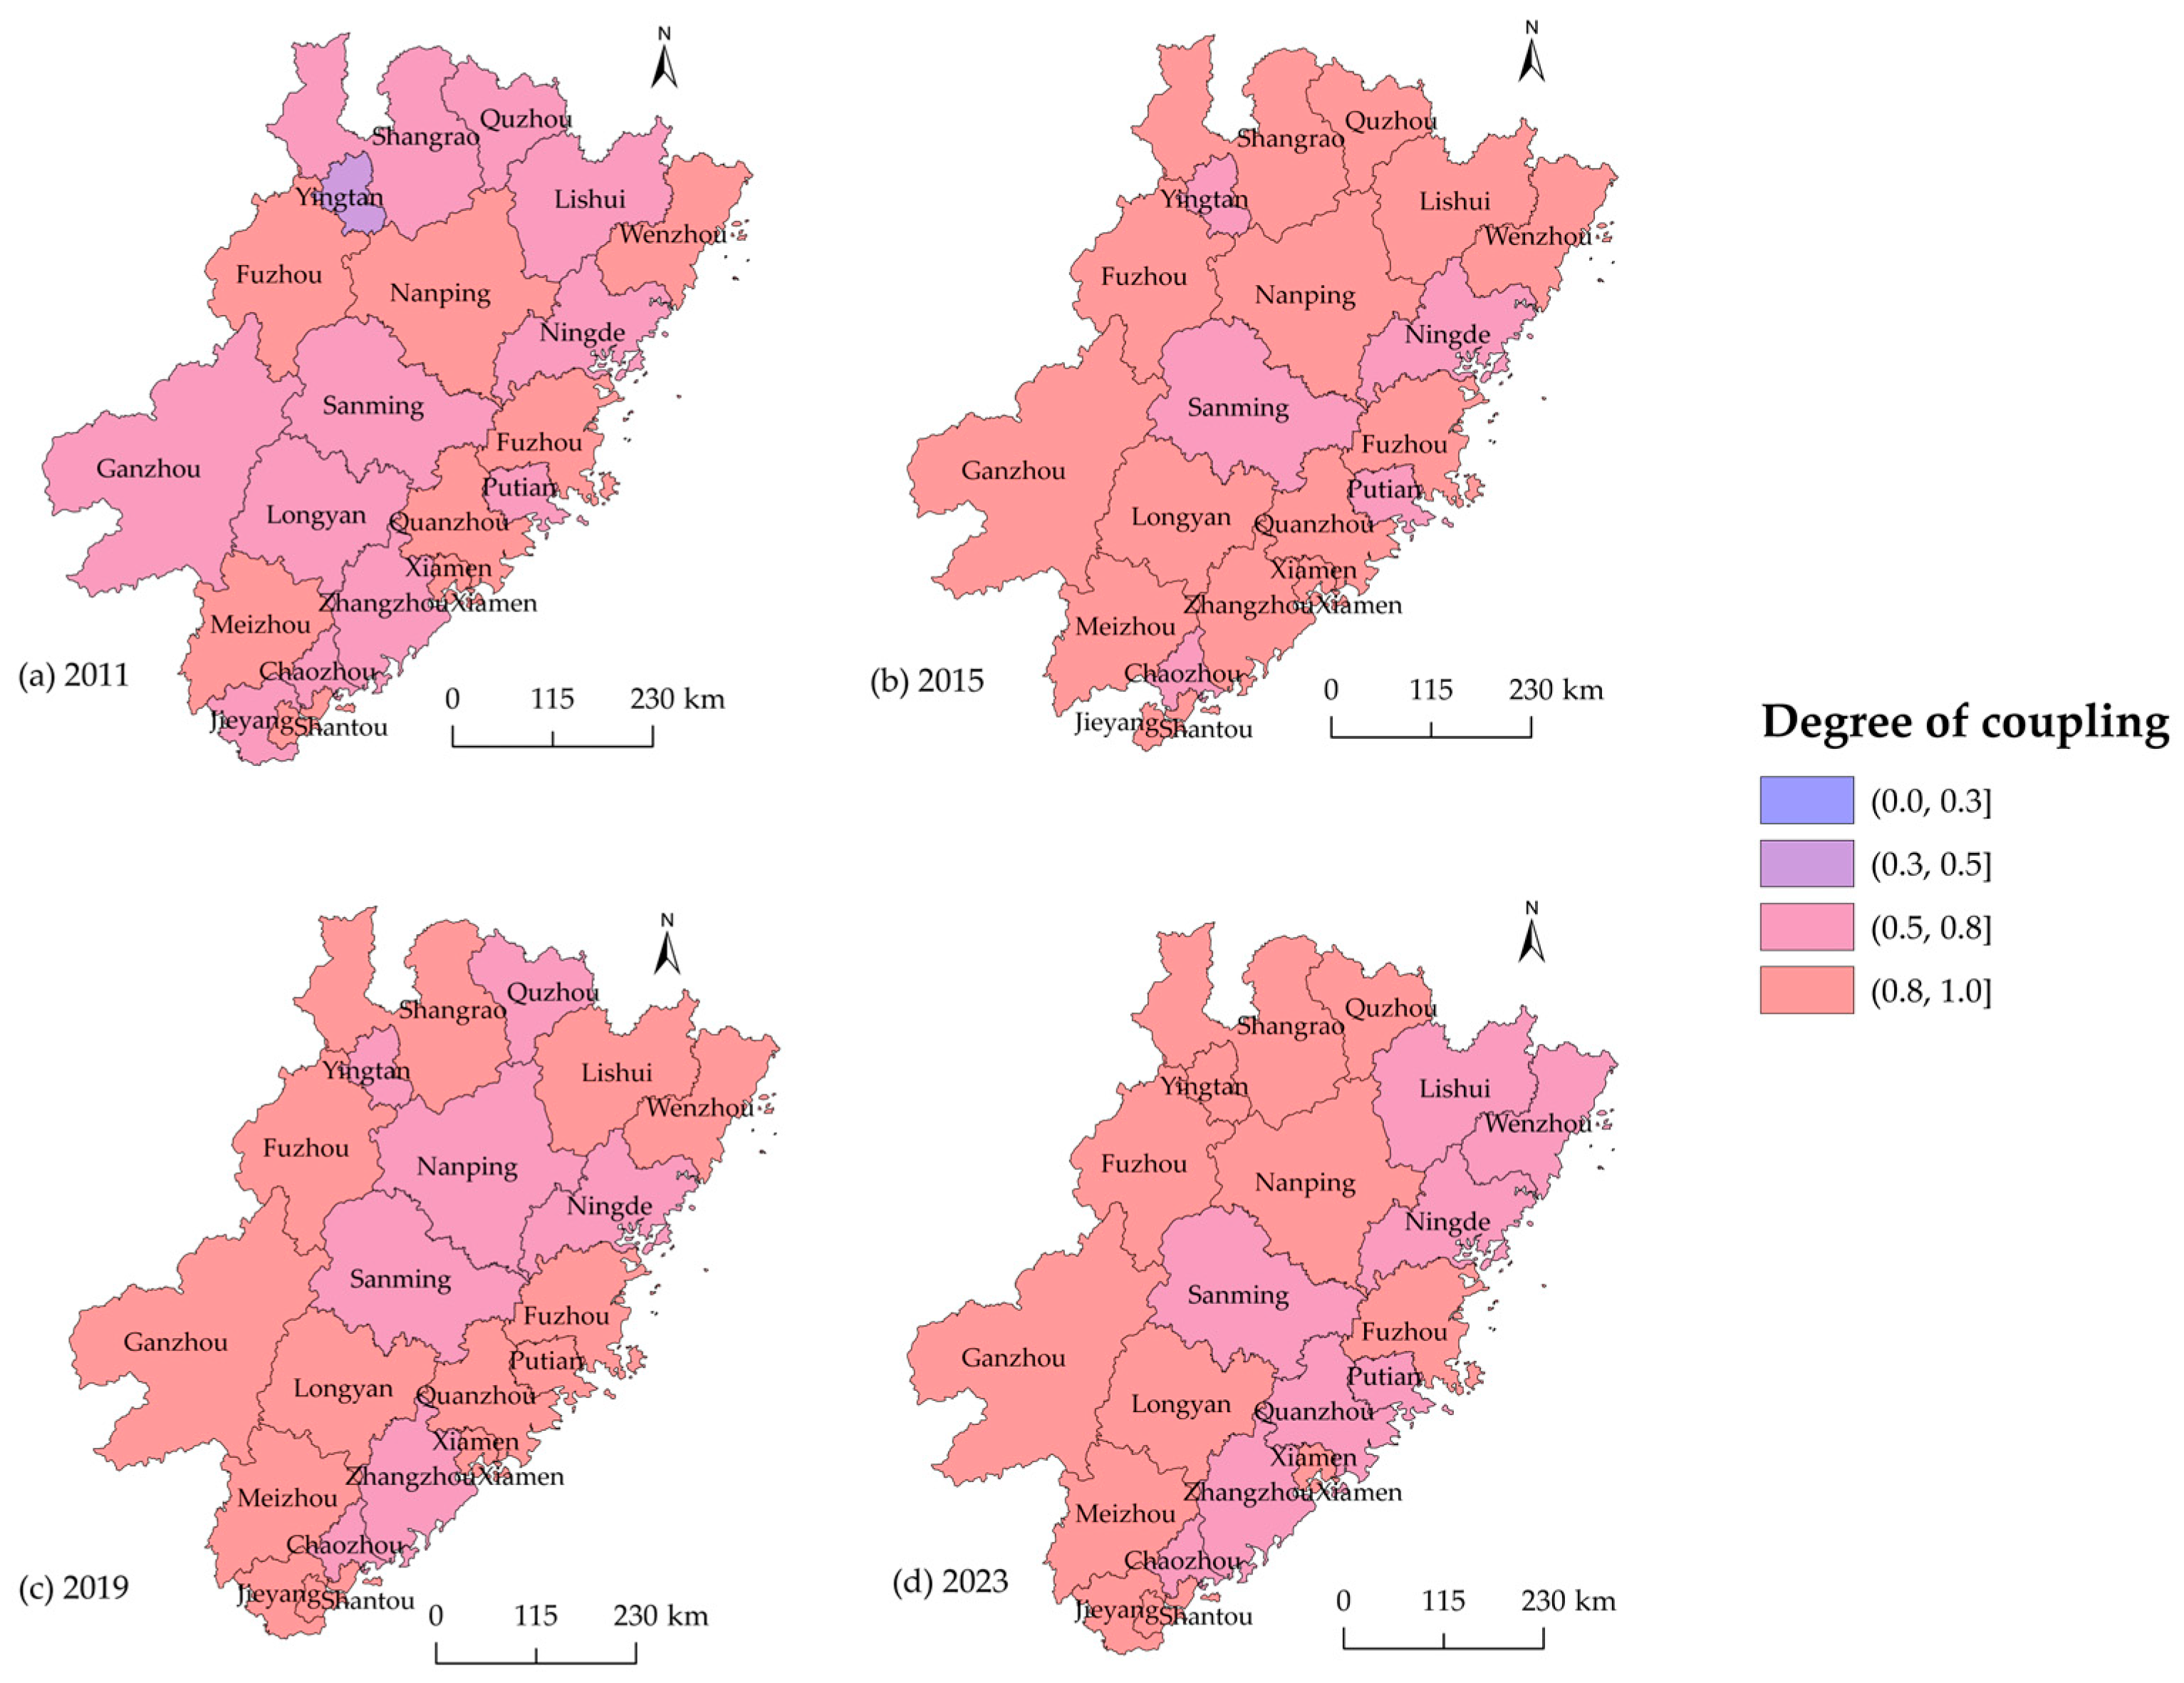
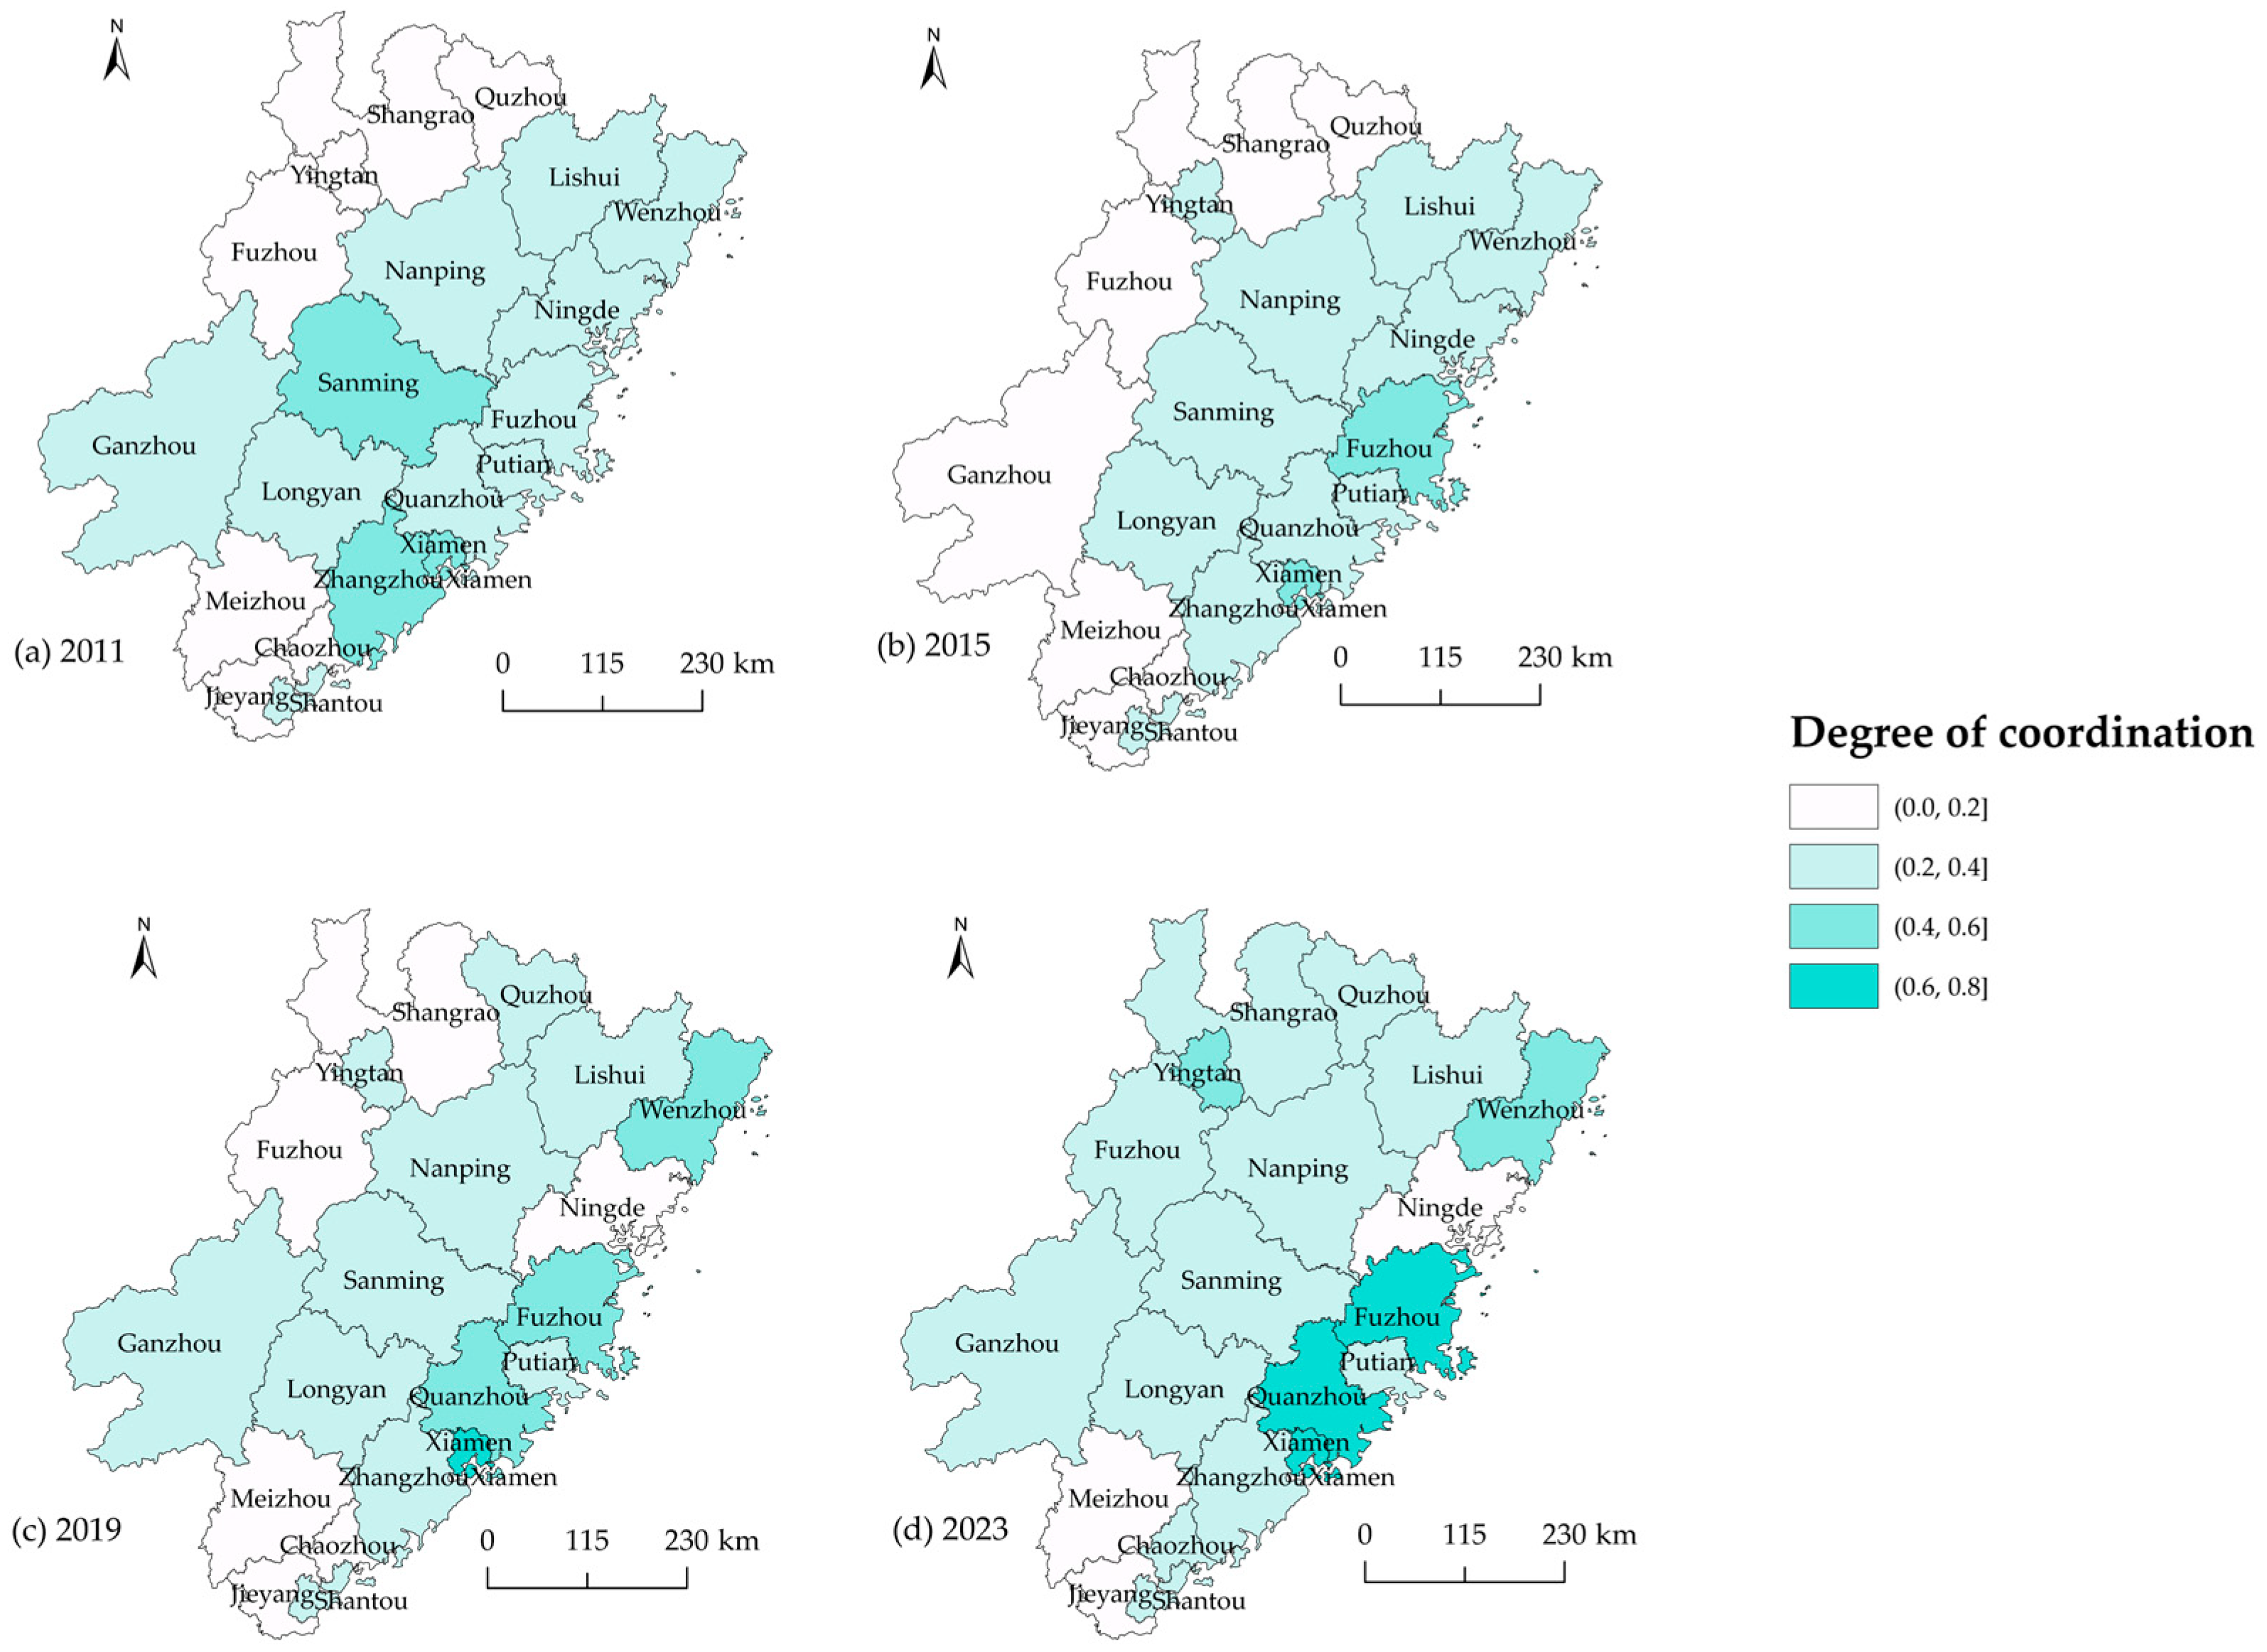
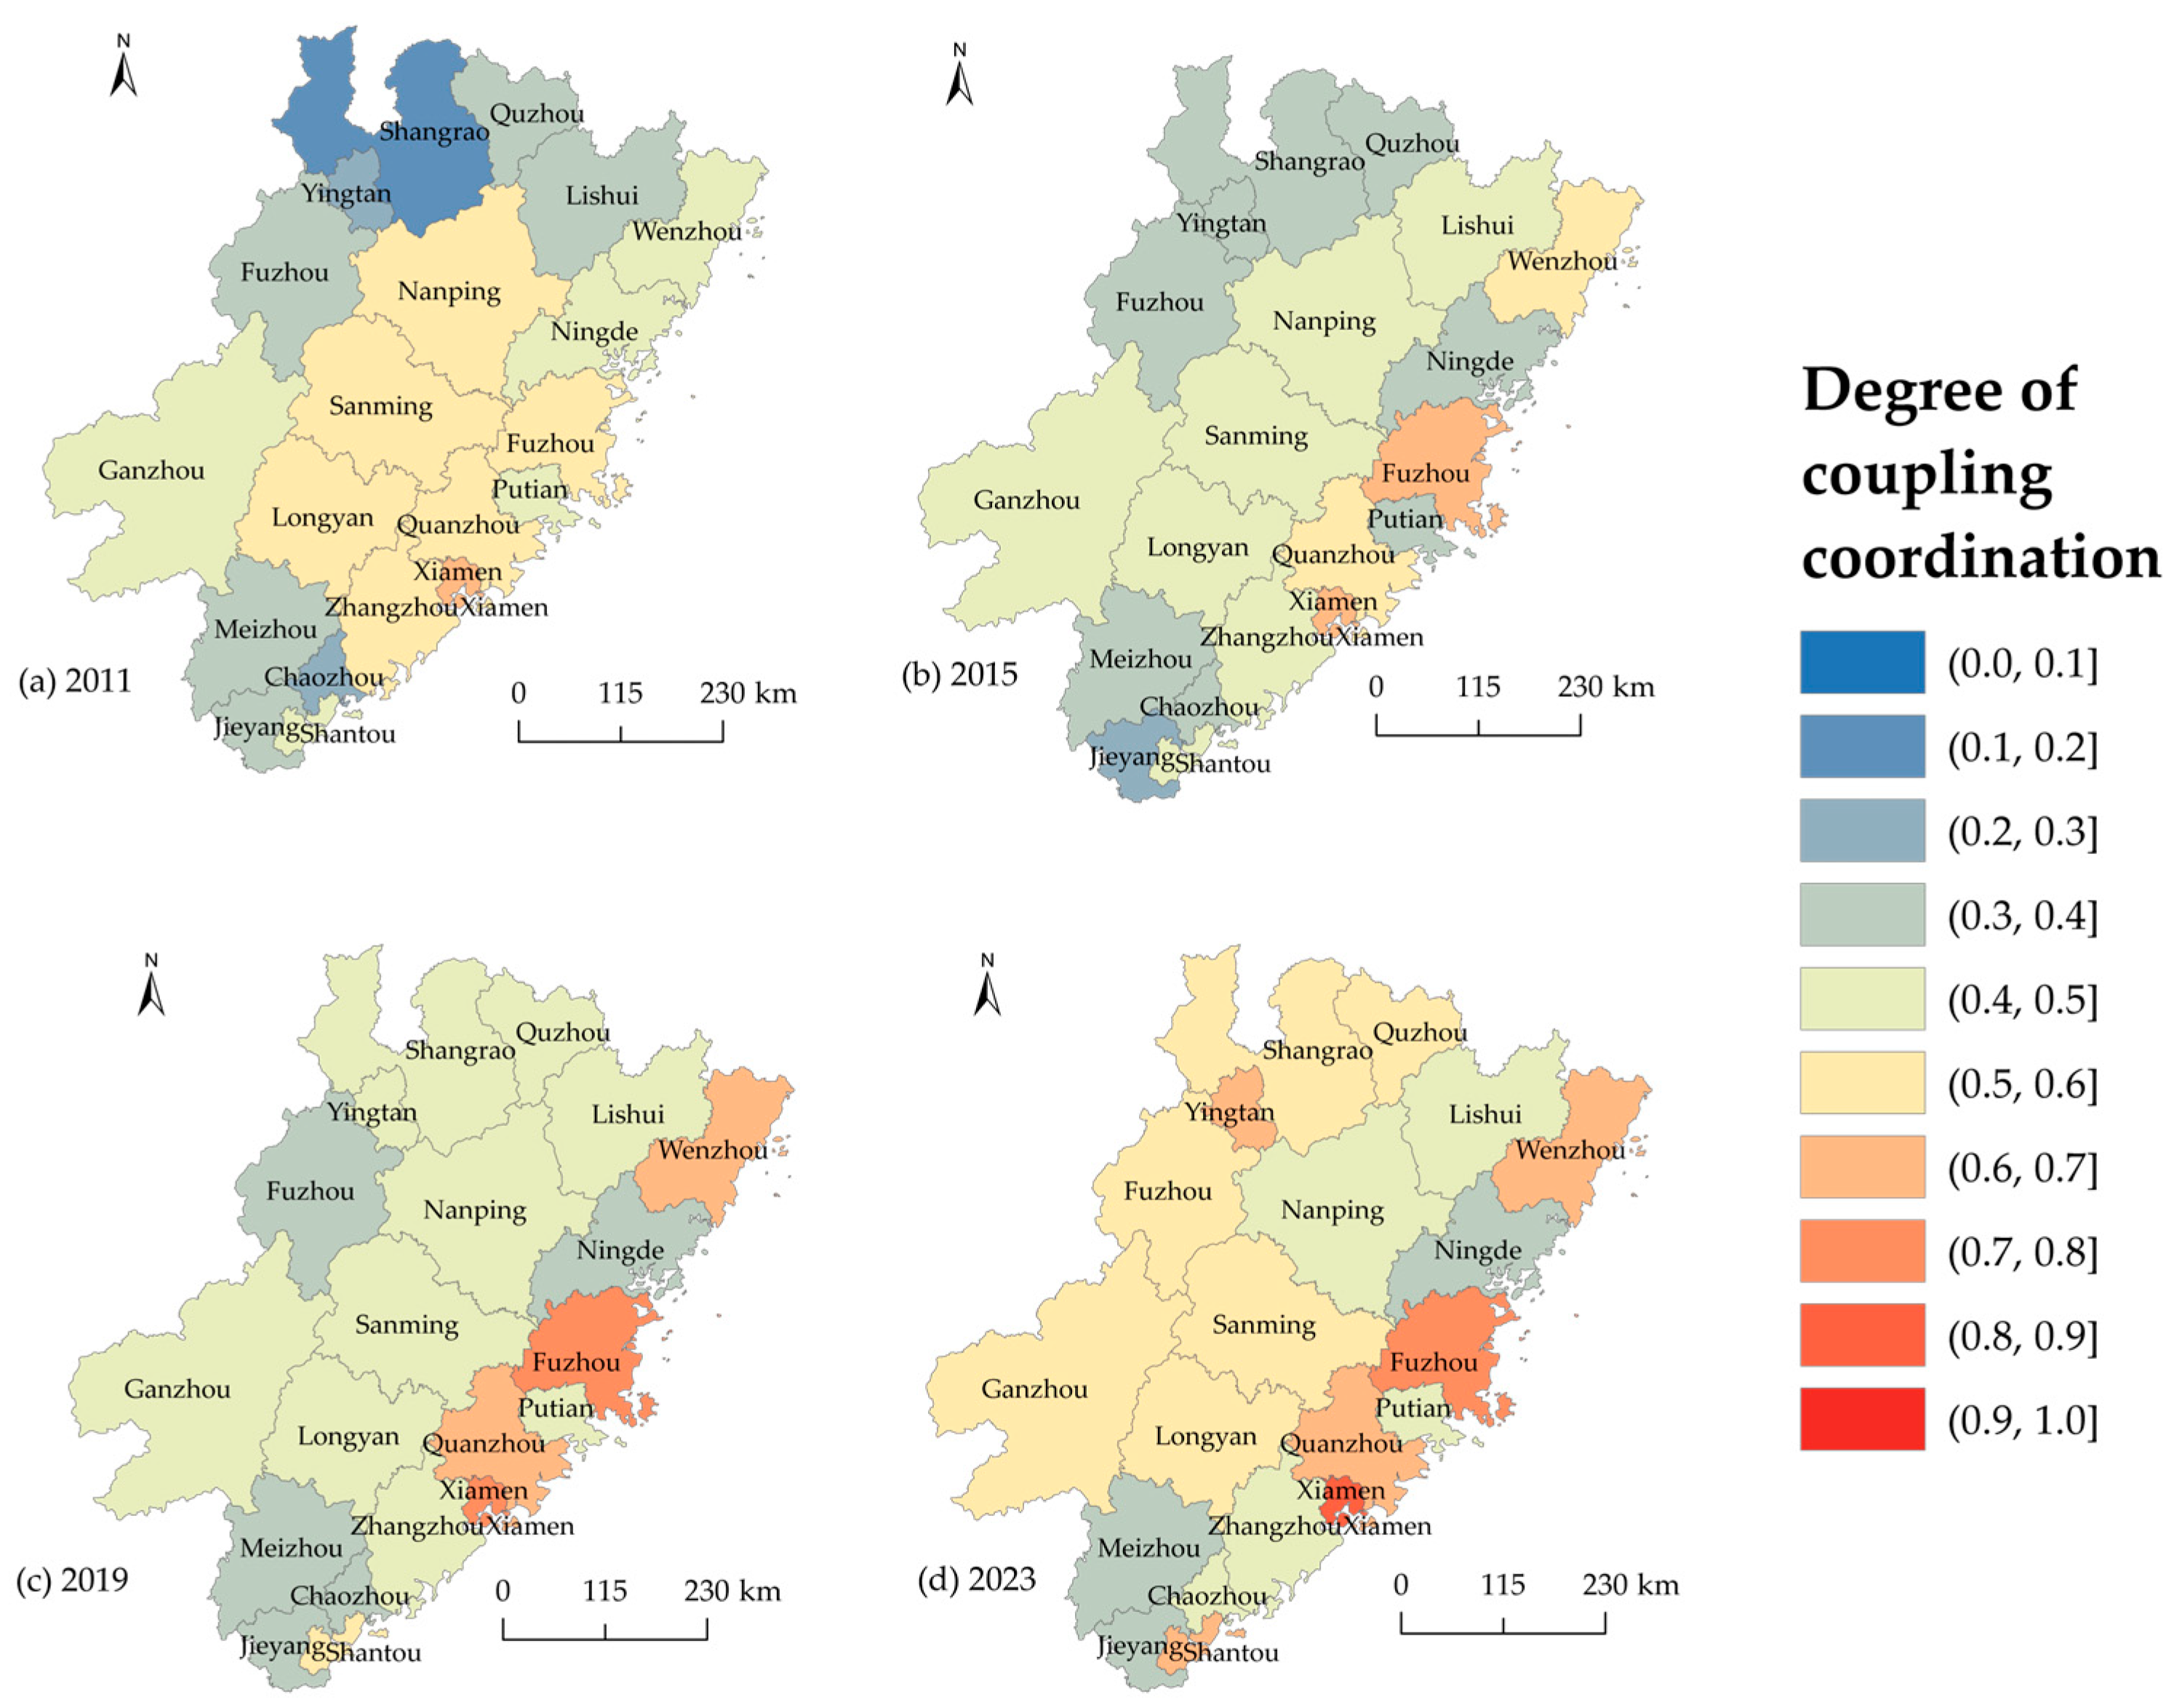
5.3.2. Characterization of Spatial Differentiation

To reveal the spatial characteristics and evolutionary patterns of the degree of coupling, degree of coordination, and degree of coupling coordination in the Western Taiwan Straits Economic Zone, spatial distribution maps of the 20 cities are created for the years 2011, 2015, 2019, and 2023 (Figure 9, Figure 10 and Figure 11). Figure 9 shows that the degree of coupling of ISO, EEM, and SED in the Western Taiwan Straits Economic Zone gradually increases, while spatial differentiation decreases. Between 2011 and 2023, the degree of coupling of the Western Taiwan Straits Economic Zone increased from 0.789 to 0.846. Based on the coupling level presented in Table 3, only Yingtan was in the antagonistic stage in 2011, while the other cities were between the friction stage and the high-level coupling stage. Eight cities were in the high-level coupling stage, primarily along the coastal areas, while most cities remained in the friction stage. In 2015, the degree of coupling of all cities increased significantly, with 14 cities reaching the high-level coupling stage. Between 2019 and 2023, the overall degree of coupling increased steadily, although the degree of coupling of coastal cities slightly declined.
The degree of coordination of ISO, EEM, and SED in the Western Taiwan Straits Economic Zone was generally low, with all values below 0.8. Figure 10 illustrates that the spatial pattern shifted from “mosaic” to “agglomeration”, showing clear signs of synergistic development. In 2011, low-level and medium-low-level areas were widely distributed in the mountainous areas. By 2015, the level of coordination development slightly decreased. In 2019, the level of coordination development steadily increased, with the study area gradually transitioning from medium-low-level to medium-level. In 2023, medium-level areas became dominant, and were widely distributed amongst mountainous areas, while medium–high-level areas were concentrated along the coastal areas, shifting from a “point-like” distribution to a “chain-like” pattern. In comparison, the spatial patterns of the degree of coupling and coordination exhibit consistent changes, both displaying characteristics of “decreasing divergence and increasing agglomeration”.
Based on the coupling coordination level in Table 5, the majority of cities in the Western Taiwan Straits Economic Zone in 2011 were transitioning from mild disorder to barely coordinated, with only Shangrao classified as being in the stage of severe disorder. By 2015, the overall coupling coordination level slightly decreased. However, cities such as Shangrao, Chaozhou, and Yingtan, which had lagged behind, entered the mild disorder stage, and Fuzhou advanced from barely coordination to elementary coordination. In 2019, most cities in the Western Taiwan Straits Economic Zone entered the stage of evolution from near disorder to elementary coordination. Quanzhou and Wenzhou advanced to elementary coordination, while Xiamen and Fuzhou upgraded to intermediate coordination. Yingtan, Shangrao, and Quzhou in Jiangxi Province transitioned from mild disorder to near disorder. In 2023, the degree of coupling coordination of various cities significantly improved. Xiamen became the first city to enter the good coordination stage, while mountainous cities such as Shangrao, Quzhou, Fuzhou (Jiangxi), Ganzhou, Sanming, and Longyan achieved leapfrog development, upgrading from near disorder to barely coordinated (Figure 11).
From spatial distribution of the degree of coupling coordination, the Western Taiwan Straits Economic Zone exhibited a spatial differentiation pattern of coastal areas surpassing mountainous areas, although inter-regional disparities showed a convergence trend. The core driver of the “coastal areas > mountainous areas” spatial pattern was likely the uneven allocation of policy resources. In 2009, “Several Opinions of the State Council on Supporting Fujian Province to Accelerate the Construction of the Western Taiwan Straits Economic Zone” explicitly emphasized the need to “strengthen coastal energy infrastructure construction, fully utilize superior port conditions, actively leverage both international and domestic resources, enhance energy security, and optimize energy structure. Coupled with the construction of coastal coal transport ports, reasonably plan the of large coastal coal-fired power plants”. This indicates that policy-driven infrastructure investments triggered spatial differentiation between coastal and mountainous areas. Coastal areas leverage advanced manufacturing systems, efficient resource recycling, and mature industrial upgrading paths, alongside stricter pollution control standards, systematic ecological restoration measures, and extensive environmental regulations. These factors enable the effective coupling coordination of ISO, EEM, and SED. Furthermore, infrastructure development and international cooperation in coastal areas have enhanced resources and technical support for technology optimization, providing these areas with a greater advantage for sustainable development. Mountainous areas had a relatively weak economic foundation and lacked sufficient policy support, leading to a strong dependence on traditional high-pollution and high-energy-consumption industries, with delays in industrial restructuring, technological upgrading, and infrastructure modernization. The growing conflict between economic development and ecological sustainability presents increasing challenges in optimizing industrial structure and managing ecological environment.
To reveal the evolutionary characteristics of the degree of coupling coordination in the spatial distribution of the Western Taiwan Straits Economic Zone, this study uses the trend surface tool in ArcGIS 10.8 for spatial visualization (Figure 12). The X-axis represents the east–west direction, the Y-axis represents the north–south direction, and the Z-axis represents the level of degree of coupling coordination, the green lines represent the development trend along the east–west direction, while the blue lines represent the development trend along the north–south direction. Overall, from 2011 to 2023, the coupling coordination development among cities in the Western Taiwan Straits Economic Zone follows the pattern of “high in the east and low in the west, high in the north and low in the south”. In the east–west direction, the degree of coupling coordination evolves from an “inverted U-shape” to a “one-letter shape”, and then back to an “inverted U-shape”, with increasing curvature and decreasing slope. This indicates a convergence in the development pace between the east and west. The development trend of coupling coordination in the north–south direction gradually evolves from an “inverted U-shape” to a “one-letter shape” pattern. This trend reflects that the central area of the Western Taiwan Straits Economic Zone experiences relatively slow coupling coordination development, while the coastal and mountainous areas at the north and south ends are in a high-speed development stage. The slope in the north–south direction is steeper than in the east–west direction, indicating that although inter-regional differences in the coupling coordination development of the Western Taiwan Straits Economic Zone have decreased, the north–south direction remains the primary source of these differences.
To identify aggregation areas and significant high-value and low-value areas in the spatial distribution of the degree of coupling coordination in the Western Taiwan Straits Economic Zone, this study used the hot spot analysis tool and Getis-Ord G i * statistic in ArcGIS 10.8 to examine the spatial distribution of cold spots and hot spots related to ISO, EEM, and SED.
As shown in Figure 13, the legend’s confidence levels indicate the probability that spatial clustering was not produced by random chance. 99% confidence level signified that the probability of this clustering pattern occurring randomly was less than 1%, representing a spatial clustering reliability greater than 99%. 95% confidence level signified that the probability of this clustering pattern occurring randomly was less than 5%, and 90% confidence level signified that the probability of this clustering pattern occurring randomly was less than 10%. Hot and cold spots were determined through Z-score tests: Z greater than 1.65 corresponded to a 90% confidence level, representing weakly significant spatial clustering; Z greater than 1.96 corresponded to a 95% confidence level, representing significant spatial clustering; Z greater than 2.58 corresponded to a 99% confidence level, representing highly significant spatial clustering.
Figure 13 shows that hot spots are concentrated in the southeastern coastal areas, while cold spots are found in the northeastern mountainous areas and southwestern coastal areas of the Western Taiwan Straits Economic Zone. In 2011, four cities were located in both the hot spots and cold spots, situated in the southeastern coastal areas and the northeastern mountainous areas, respectively. This is likely due to the higher level of urbanization in the southeastern coastal areas, where cities have led in developing green industries and effective environmental management, such as green manufacturing and clean energy, improving the region’s degree of coupling coordination. In contrast, the northeastern mountainous areas rely more on traditional industries, with later industrialization, limited capital investment and insufficient technological support, resulting in a lower degree of coupling coordination.
From 2015 to 2023, the number of cities in the hot spot zone decreased significantly, with Quanzhou and Putian consistently remaining in the hot spot zone. Meanwhile, the spatial distribution of cities in the cold spot zone shifted from the northeastern mountainous areas to the southwestern coastal areas. This may be due to the pressure of environmental management in the southeastern coastal areas during the optimization of the industrial structure, coupled with the bottleneck in the deep transformation of industries, which have together weakened the coupling and coordination development of ISO, EEM, and SED in the region. In 2012, the Jiangxi Provincial Government issued “the 12th Five-Year Plan for Jiangxi Electric Power Development”, which outlined urgent power structure adjustments and a growing demand for power. The plan aimed to establish a safe, stable, economic, and clean modern energy system, promoting the development of green energy and other emerging industries [102]. This plan may have indirectly contributed to the disappearance of cold spots in the northeastern mountainous areas between 2015 and 2023. Despite the southwestern coastal areas’ advantages in opening up to the outside world, they face bottlenecks such as underdeveloped industries, weak resource and environmental carrying capacity, and immature technologies. These challenges have hindered ISO, causing the region to gradually become a new cold spot zone.

5.3.3. Characterization of Spatial Connection

To analyze the spatial connection strength of coupling coordination among cities, this study calculated the spatial connection strength of the degrees of coupling coordination of ISO, EEM, and SED in the Western Taiwan Straits Economic Zone from 2011 to 2023, based on the gravity model described in the methods section. The spatial connection network structure was then drawn using ArcGIS 10.8 (Figure 14). Overall, the spatial connection strength of coupling coordination in the Western Taiwan Straits Economic Zone gradually improves in this period. The spatial connection among cities follows a “multi-points force, multiple-lines progress” trend, with a clear intra-provincial connection strength and a significant reduction in inter-provincial city exchanges.
In 2011, the top three city pairings in terms of spatial connection strength were Xiamen–Quanzhou, Xiamen–Zhangzhou, and Jieyang–Shantou, highlighting the strong spatial connection strength in southern Fujian. Xiamen, as the core, drives the synergistic development of the Xiamen–Zhangzhou–Quanzhou city cluster. Cities in Guangdong Province exhibit the second-highest intensity of spatial connection strength. In 2015, the top city pairings were Xiamen–Quanzhou and Xiamen–Zhangzhou, followed by Fuzhou–Putian. Between 2019 and 2023, the top three city pairings in terms of spatial connection strength were Xiamen–Quanzhou, Fuzhou–Putian, and Xiamen–Zhangzhou, followed by Shangrao–Yingtan. Over time, the spatial connection strength between Xiamen and Quanzhou increased from 0.641 in 2011 to 1.042 in 2023, becoming a key driver of the steady rise in coupling coordination in the Western Taiwan Straits Economic Zone. As the core of the Western Taiwan Straits Economic Zone, Fujian Province has seen strong inter-city connection strength. As the ISO deepens, strong synergies have developed between the industrial structures of Xiamen, Quanzhou, Fuzhou, Putian, and Zhangzhou. Fujian Province actively promotes pollution reduction and carbon synergy. Cities like Xiamen and Fuzhou, as pioneers in ISO, are effectively driving industrial optimization and energy transition in surrounding areas. The spatial connection strength between Shangrao and Yingtan has significantly increased, making them a new force in the coupling coordination development of ISO, EEM, and SED in the Western Taiwan Straits Economic Zone. In contrast, the spatial connection strength between Lishui and Wenzhou in Zhejiang Province has remained stable at the fourth tier, with weaker spatial connection to cities in other provinces due to its geographical location.

6. Discussions

6.1. Key Findings of the Study

(1) This study systematically constructs a three-dimensional evaluation index system for ISO, EEM, and SED, and presents the results regarding the comprehensive scores. The study finds that ISO has the highest overall comprehensive score, showing a significant upward trend from 2011 to 2023. The overall comprehensive score of EEM declined, with a continuous decrease from 2012 to 2016, followed by a steady increase from 2016 to 2023. The comprehensive score of SED surpassed that of EEM in 2012, showing a high growth rate after small fluctuations from 2011 to 2017. At the city level, significant imbalances in ISO, EEM, and SED are evident, with a “high in coastal areas and low in mountainous areas” distribution pattern. This spatial distribution pattern aligned with previous research findings on the distribution of urban vitality changes in the Western Taiwan Straits Economic Zone [45], further confirming the generality of regional developmental gradient differences, especially the inherent advantages of coastal areas in factor agglomeration and policy benefits.
Overall, in terms of absolute level, the comprehensive scores rank as ISO > SED > EEM. In terms of growth rate, all subsystems show a positive upward trend, with SED leading, followed by ISO and EEM. Therefore, ISO, EEM, and SED exhibit a non-synchronous development pattern. This demonstrates the first-mover advantage of ISO, the strong policy response in SED, and the path-dependent inertia of EEM [103].
(2) This study employed the PVAR model to analyze the dynamic interactions among ISO, EEM, and SED. When ISO, EEM, and SED were subjected to their respective shocks, the responses reached a positive maximum peak within the current period, after which the amplitude of the positive and negative fluctuations gradually diminished. This indicated that the subsystem possessed a strong self-reinforcing initial effect, but its persistence was limited, aligning with common patterns observed in system shock responses [104].
When shocks were imposed by EEM on ISO, SED on ISO, and SED on EEM, the response values reached a positive maximum peak within the current period, demonstrating the existence of positive transmission effects following shocks. This strongly supported the positive transmission mechanisms whereby EEM promoted industrial transformation [54], SED drove industrial transformation [56], and SED provided the material foundation for environmental management [60], all of which were significantly present in the Western Taiwan Straits Economic Zone in the short term.
When shocks were imposed by ISO on EEM, ISO on SED, and EEM on SED, the response values were zero in the current period, declined in the first period, gradually reached their positive peaks in the second to third periods, and then maintained relatively stable fluctuations. This suggested that in the short term, industrial structure optimization and upgrading might exert certain suppressive effects on EEM and SED due to costs associated with technological renewal and capacity adjustment [105], indicating that the positive effects of ISO exhibited a delay [106].
(3) This study applies a degree of coupling coordination model to quantify the degree of coupling, degree of coordination, and degree of coupling coordination of ISO, EEM, and SED. It also uses kernel density estimation to capture the temporal evolution of the degree of coupling coordination. The results of the degree of coupling coordination model show that the trends of degree of coupling, degree of coordination, and degree of coupling coordination from 2011 to 2023 are similar, following a pattern of “fluctuating and increasing initially, followed by steady growth”. The degree of coupling is shifting from the friction stage to the high-level coupling stage, indicating a high level of interdependence between the three subsystems [107]. The degree of coordination, which is much lower than the degree of coupling, has remained at a medium–low level. The degree of coupling coordination, positioned between the degree of coupling and the degree of coordination, has transitioned from near disorder to barely coordinated, achieving leapfrog development. Regarding the dynamic evolution patterns, the study found that the differences in the level of coupling coordination development between cities narrowed, with cities transitioning from “differentiated development” to “cluster synchronous development”. This finding aligned with the results of many related studies both domestically and internationally [108], highlighting that regional coordinated development strategies and integration policies had begun to demonstrate positive effects in promoting internal equilibrium [109].
(4) This study employs trend surface analysis and cold–hot spots analysis to reveal spatial differentiation characteristics, and uses a gravity model to analyze spatial connection. Regarding spatial differentiation characteristics, the study found that the spatial patterns of degree of coupling, degree of coordination, and degree of coupling coordination have shifted from “mosaic” to “agglomeration”, exhibiting clear characteristics of synergistic development and a trend of “decreasing differentiation and aggregation development”. In contrast, the degree of coupling in the coastal areas of the Western Taiwan Straits Economic Zone was slightly lower in 2023. The medium–high levels of the degree of coordination were concentrated in the coastal areas, transitioning from a “point-like” to a “chain-type” distribution. The east–west direction of degree of coupling coordination will converge. The north–south direction remains the primary axis of inter-regional differences. Hot spots in the degree of coupling coordination are concentrated in the southeastern coastal areas, while cold spots are located in the northeastern mountainous areas and southwestern coastal areas. In 2023, Xiamen became the first city to reach the good coordination stage. Meanwhile, the mountainous cities of Shangrao, Quzhou, Fuzhou (Jiangxi), Ganzhou, Sanming, and Longyan achieved leapfrog development, upgrading from near disorder to barely coordinated. Regarding spatial connection characteristics, the study found that the intensity of spatial connection strength in the Western Taiwan Straits Economic Zone gradually increased. The spatial connection strength among cities followed a trend of “multi-points force, multiple-lines progress”, with clear intra-provincial connection strength and significantly weakened inter-provincial city connection strength. Specifically, the spatial connection strength among cities in the southeastern region of Fujian Province was stronger, with Xiamen at the core driving the synergistic development of the Xiamen–Zhangzhou–Quanzhou city cluster, highlighting the engine role of the central city in promoting regional coordination [110]. The spatial connection strength of cities in Guangdong Province ranks second, while the spatial connection strength of Shangrao–Yingtan in Jiangxi Province has seen a significant increase, becoming a new force in coupling coordination development. The spatial connection strength between cities in Zhejiang Province and those in other provinces remains weaker.

6.2. Policy Recommendations

The study of the coupling coordination of ISO, EEM, and SED is crucial for the sustainable development of the Western Taiwan Straits Economic Zone. Based on this, the following suggestions are made:
(1) Addressing asynchronous development patterns by creating a dynamic and balanced promotion mechanism. Given the non-equilibrium patterns of ISO, EEM, and SED with differing growth rates, it is crucial to establish an ecological compensation mechanism to promote synergy. Referencing China’s first inter-provincial watershed ecological protection compensation mechanism, the “Xin’anjiang Model” [111], explore establishing an inter-city ecological protection compensation fund pool within the Western Taiwan Straits Economic Zone to implement compensated transfer payments that coordinated ecological protection with economic development. Efforts should be made to vigorously develop green finance, broaden financing channels, and innovate new development models oriented toward green technology research and ecological environment governance, while strengthening industrial integration. The carbon sink product trading mechanism should be optimized, and the establishment of a mutual recognition and purchase mechanism for Chinese Certified Emission Reduction (CCER) credits among cities within the Western Taiwan Straits Economic Zone should be explored. In mountainous areas, ecological demonstration bases should be created by leveraging abundant natural resources, with the establishment of clean production technology promotion centers. Emphasis should be placed on supporting key industries, such as the bamboo industry, in the development, demonstration, and large-scale application of pollution reduction and carbon reduction technologies to address technological shortcomings in mountainous areas and increase the added value of ecological resources. Meanwhile, the ecological protection compensation fund pool would provide sustainable financial support for both technology application and ecological protection. Enterprises in developed coastal cities should be encouraged to build industrial informatization management systems, with the government providing targeted subsidies to establish industrial information interconnection platforms. This would promote precise allocation and efficient management of natural resources, driving the diffusion of advanced technologies, management experience, and data elements to mountainous areas. Through the combined measures of “ecological value compensation, mountainous areas technological empowerment, and coastal areas technology diffusion”, this approach aims to alleviate the contradiction between “coastal technology polarization and mountainous ecological accumulation”.
(2) Strengthen coordinated governance and promote multidimensional linkage and upgrading. Faced with the structural characteristic of “high coupling–low coordination”, it is necessary to enhance the system’s synergy through a combination of institutional innovation and market-based policy tools. A Western Taiwan Straits Economic Zone Green Development Joint Governance Center should be established to design a joint carbon emissions control mechanism for inter-provincial adjacent areas and to allow cross-provincial trading of forestry carbon sinks. A three-dimensional transitional green subsidy fund should be set up, accompanied by the establishment of a three-dimensional evaluation mechanism encompassing industry, ecological environment, and socio-economic dimensions. This mechanism should require multiple verification processes addressing industrial chain resilience, ecological carrying capacity thresholds, and social feasibility. For instance, core quantitative indicators such as carbon emission intensity, ecological restoration rate, and local employment absorption rate should be used, with the quantitative results linked to enterprises’ eligibility for subsidy applications.
(3) Optimize the regional synergy network and build a green development community. To address weak inter-provincial connection strength, efficient resource allocation should be promoted through spatial system reconstruction. The influence of Xiamen and Fuzhou should be strengthened to drive neighboring cities in developing green corridors and establishing green intellectual corridors. The governance model of inter-provincial regions (Quzhou, Nanping, Shangrao) should be innovated by establishing an ecological and economic cooperation alliance, promoting the mutual recognition of regional environmental standards, and building a complementary industrial chain network. The Pearl River Delta–Western Taiwan Straits–Yangtze River Delta pathway should link regional factor flows, focusing on cultivating inter-provincial green industry clusters, such as lithium-ion and photovoltaic industries, in hub nodes like Shantou and Wenzhou. This will break administrative barriers, promote market-oriented transformation in factor flows, foster regional green industry communities, and establish a green development pattern of regional synergy.

6.3. Research Limitations and Future Directions

This study has the following limitations: (1) The research data in this study were sourced from publicly available datasets such as statistical yearbooks and National Economic and Social Development Statistical Bulletins of each province and city over the years. However, issues such as missing specific indicators, inconsistent statistical calibers among cities, and data update lags existed. These limitations somewhat affected the completeness and accuracy of the ISO, EEM, and SED indicator measurements and may have impacted the precision of the degree of coupling coordination assessment results. (2) This study focuses on the Western Taiwan Straits Economic Zone, while there is a lack of analysis on the coupling coordination of ISO, EEM, and SED in regions with different development models, such as the Pearl River Delta and Yangtze River Delta. Significant differences exist among regions in terms of resource endowments, development stages, and policy environments. Future research could analyze the commonalities and differences in coupling coordination pathways from a cross-regional comparative perspective, thereby enhancing the regional applicability of the theoretical framework and research findings. (3) This study focuses on the meso-level (city scale), and its conclusions provided limited guidance for precise policy making at the micro-level (county scale). Findings at the meso-level could not fully capture the substantial development heterogeneity and specific governance bottlenecks within county units. Future research could develop a multi-dimensional framework encompassing macro, meso, and micro scales, incorporating field surveys, interviews, and case studies to refine the research scale and enhance the precision and feasibility of policy implementation.

7. Conclusions

Based on the “goal synergy” and “resource integration” framework and Synergetics, this study systematically constructed a three-system evaluation index for ISO, EEM, and SED.
The “variation–genetics–selection” mechanism from evolutionary economics was innovatively incorporated into the study of “temporal evolution–spatial differentiation–spatial connection”, revealing the development dynamics of the multi-system coupling coordination of the Western Taiwan Straits Economic Zone. The main conclusions of this study are as follows: (1) A comprehensive score evaluation—From 2011 to 2023, the comprehensive score of ISO in the Western Taiwan Straits Economic Zone showed a significant upward trend. The EEM score decreased, while the SED score exhibited high growth after small fluctuations. (2) PVAR Model—ISO, EEM, and SED exhibited self-reinforcing effects; EEM’s impact on ISO, SED’s impact on ISO, and SED’s impact on EEM exhibited immediate positive transmission effects, while the transmission effects of ISO on EEM, ISO on SED, and EEM on SED displayed lagged responses. (3) The degree of coupling coordination—From 2011 to 2023, the degree of coupling, degree of coordination, and degree of coupling coordination all followed the trend of “fluctuating and increasing initially, followed by steady growth”. The degree of coupling is still progressing towards the high-level coupling stage, while the degree of coordination still remains at a medium–low level. Overall, the degree of coupling coordination is entering a barely coordinated stage, while aiming to achieve significant progress. (4) Spatial differentiation—From 2011 to 2023, the spatial patterns of the degree of coupling, degree of coordination, and degree of coupling coordination in the Western Taiwan Straits Economic Zone shifted from “decentralized” to “centralized”, with significant strengthening of the cooperation and coordination between regions. The north–south disparity in the degree in terms of coupling coordination remains the primary factor driving inter-regional differences. Regions with higher coupling coordination are concentrated in the southeastern coastal areas, while those with lower coupling coordination are located in the northeastern mountainous areas and southwestern coastal areas. (5) Spatial connection—From 2011 to 2023, the spatial connection strength in the Western Taiwan Straits Economic Zone gradually increased. The spatial connection among cities followed the trend of “multi-points force, multiple-lines progress”, with intra-provincial linkages strengthening, while inter-provincial exchanges significantly weakened.

Author Contributions

Conceptualization, Z.X.; methodology, Z.X.; software, Z.X.; validation, Z.X.; formal analysis, Z.X.; investigation, Z.X. and Z.C.; resources, Q.L. and A.H.; data curation, Z.X.; writing—original draft preparation, Z.X. and Z.C.; writing—review and editing, Z.X. and A.H.; visualization, Z.X.; supervision, Q.L. and A.H.; project administration, Q.L. and A.H.; funding acquisition, Q.L. and A.H. All authors have read and agreed to the published version of the manuscript.

Funding

This research was funded by Major Program of National Forestry and Grassland Soft Science Research of China [2025131002].

Data Availability Statement

The data presented in this study are available upon request from the corresponding author.

Acknowledgments

The authors gratefully acknowledge the financial support provided by various funding projects for this research.

Conflicts of Interest

The authors declare no conflicts of interest.

Abbreviations

The following abbreviations are used in this manuscript:
ISOIndustrial Structure Optimization
EEMEcological Environment Management
SEDSocio-economic Development
SESSocial-ecological System
STSSocio-technical Systems
PVARPanel Vector Autoregression

References

  1. Xi, P. Grasp the new development stage, implement the new development concept, and build a new development pattern. Contemp. Party Memb. 2021, 65, 3–9. [Google Scholar]
  2. Sheng, M. Green water and green mountains are the concept of golden mountains and silver mountains. Zhejiang Acad. J. 2025, 63, 145–154. [Google Scholar] [CrossRef]
  3. Liu, C. Outward Foreign Direct Investment, Green Technology Innovation and Industrial Green Transformation: Evidence from 34 Industrial Sectors. Technoecon. Manag. Res. 2025, 46, 77–83. [Google Scholar]
  4. Wang, S.; Fan, W. Does Environmental Information Disclosure Limit the Establishment of Polluting Enterprises? An Analysis of Matching Data for Prefecture-Level Cities and Chinese Industrial Enterprises. Ind. Econ. Res. 2023, 22, 31–43. [Google Scholar] [CrossRef]
  5. Hua, M.; Cui, R. System Dynamics Analysis of China’s Industrial Green Development Driven by Technological Innovation. Shandong Soc. Sci. 2024, 38, 138–145. [Google Scholar] [CrossRef]
  6. Liu, C.; Zhou, J.; Wang, X. Inter-regional Factor Flow and Industrial Cooperation in the Separation of Economic Area and Administrative Area Separation: An Example in Chengdu-Chongqing Region. Planners 2022, 38, 51–56. [Google Scholar]
  7. Fu, X. Research on the Development Status and Countermeasures of Industrial Cluster Logistics in the Economic Zone on the West Coast of the Straits. China Collect. Econ. 2010, 26, 105–106. [Google Scholar] [CrossRef]
  8. Huang, S. Study on Strategic Environmental Assessment of Key Industries Development in the Economic Zone on the West Coast of the Taiwan Straits; China Environmental Publishing House: Beijing, China, 2013. [Google Scholar]
  9. Sun, X.; Qu, Y. “Human Modernization”, A Great Theoretical Unity of Human Liberation & Human Freedom and Comprehensive Development——On the transcendence of Chinese modernization. Thinking 2025, 4, 1–7. [Google Scholar]
  10. Li, Y.; Luo, Y.; Li, Z.; Wen, C. Spatial Differentiation of Driving Factors and Spillover Effects of Urban Industrial Ecological Agglomeration: An Empirical Analysis Based on 33 Cities in the Upper Reaches of the Yangtze River. Resour. Environ. Yangtze Basin 2024, 33, 1874–1887. [Google Scholar] [CrossRef]
  11. Gu, P.; Guo, T.; Yang, J. Technology Transfer in the Combination of Industrial Civilization and Ecological Civilization. Stud. Sci. Sci. 2024, 42, 2474–2484. [Google Scholar] [CrossRef]
  12. Niu, K.; He, W.; Qiu, L. Symbiosis Coordination Between Industrial Development and Ecological Environment for Sustainable Development: Theory and Evidence. Sustain. Dev. 2023, 31, 3052–3069. [Google Scholar] [CrossRef]
  13. Fan, Y.; He, C. Spatial-Temporal Evolution and Interactive Response Relationship Between Industrial Land Expansion and Economic Growth in Central Yannan Urban Agglomeration. J. Arid. Land Resour. Environ. 2024, 38, 10–21. [Google Scholar] [CrossRef]
  14. Liu, S.; Tu, W.; Hu, W.; Zhu, Y. Decoupling Relationships Between economic Growth and Industrial Wastes in Six Provinces of Central China. J. Guilin Univ. Technol. 2024, 44, 321–329. [Google Scholar] [CrossRef]
  15. Xie, Y.; Guo, F.; Zhang, Q.; Jiang, Y.; Chen, W. Decoupling Level and Driving Factors of Fossil Energy Consumption Based Industrial Carbon Emissions and Economic Growth in Jinan. Environ. Pollut. Control 2023, 45, 1467–1472. [Google Scholar] [CrossRef]
  16. Liu, B.; Zhang, L.; Wang, W.; Sun, C.; Dong, S. Principle and Characteristic Analysis of Rank Matching Degree Between Urban Industrial Water Use Efficiency and Economic Development Level in China. Water Resour. Prot. 2024, 40, 64–71. [Google Scholar] [CrossRef]
  17. Miao, J.; Zhang, C. Characteristics and Spatial-Temporal Evolution of Industrial Water Resources Efficiency and Coordinated Economic Development in the Yellow River Basin. Res. Environ. Sci. 2024, 37, 114–121. [Google Scholar] [CrossRef]
  18. Fan, Y.; Lei, S.; He, C.; Li, W. The Coupling and Coordination Relationship between Industrial Economic Development and Environmental Pollution Level and Its Influencing Factors: A Case Study of Yunnan Province. J. Arid. Land Resour. Environ. 2025, 39, 1–13. [Google Scholar] [CrossRef]
  19. Zhang, D.; Zeng, S. Study on Coupling Coordination between High Quality Development of Industrial Economy and Ecological Environment Protection: A Case Study of Guizhou Province. Ecol. Econ. 2023, 39, 148–155. [Google Scholar]
  20. Guo, H.; Hu, C. Ecological Environmental Protection and High-quality Industrial Economic Development in the Yellow River Basin: Coupled Measurement and Spatio-temporal Evolution. Ningxia Soc. Sci. 2022, 41, 132–142. [Google Scholar] [CrossRef]
  21. Huang, C.; Pan, J.; Gao, S. Achieving a Virtuous Interaction between High-quality Development and Ecological Security. Econ. Res. J. 2024, 59, 4–18. [Google Scholar]
  22. Yu, J.; Wu, Q. Spatial-Temporal Pattern of Coordinated Development of Tourism Economy and Ecological Civilization in the Yellow River Basin. J. Arid. Land Resour. Environ. 2024, 38, 181–189. [Google Scholar] [CrossRef]
  23. Ju, C.; Li, Y. The “Ecological Modernization-Green Development” Composite Model of Ecological Civilization Economy in Tibet. Qinhai Soc. Sci. 2023, 44, 49–54. [Google Scholar] [CrossRef]
  24. Yang, X. Research on Coordinated Development of Ecological Environment and Social Economic System in Hainan Province from the Perspective of Ecological Civilization. J. Saf. Environ. 2024, 24, 2869–2878. [Google Scholar] [CrossRef]
  25. Deng, H.; Hu, J. A Comparative Analysis of the Coupling and Coordination Between the Ecological Civilization Construction and Tourism Development in Different Types of Resource-Based Cities. J. Nat. Conserv. 2024, 79, 126563. [Google Scholar] [CrossRef]
  26. Liu, X.; Lv, N.; Hou, P.; Huang, Y.; Gao, J.; Yuan, J. Quantitative Investigation of the Coupling Coordination Relationship Between Ecological Civilization Construction and Socio-Economic Development: An Empirical Study in Anji County, Zhejiang Province. Acta Ecol. Sin. 2023, 43, 8973–8984. [Google Scholar] [CrossRef]
  27. Zhou, Y. Integrated Development of Modern Agricultural Economy and Ecological Civilization Construction. China Rice 2023, 29, 122–123. [Google Scholar] [CrossRef]
  28. Zhao, F.; Han, J. Interactive Relationship and Coordinated Development of Sports Tourism and Ecological Civilization in the Yellow River Basin. Sustainability 2025, 17, 82. [Google Scholar] [CrossRef]
  29. Liu, T. Coupling Mechanism and Evolutionary Characteristics of Digital Economy and Ecological Efficiency in the Yellow River Basin. Stat. Decis. 2025, 41, 123–128. [Google Scholar] [CrossRef]
  30. Wu, W.; Hu, Y.; Zhu, X. Coupling Coordination and Spatio-Temporal Evolution of Scientific Innovation, Economic Development, and Ecological Environment in the Yangtze River Economic Belt. Stat. Decis. 2024, 40, 132–137. [Google Scholar] [CrossRef]
  31. Zhao, H.; Li, Q. Spatio-Temporal Evolution and Influence-Factors of Coupling-Coordination Among Digital-Economy, Science-Technology Innovation and Eco-Environment in China Province. Areal Res. Dev. 2025, 44, 29–36. [Google Scholar] [CrossRef]
  32. Tu, Z.; Mao, J.; Ma, G. Differentiated Synergistic Pathways for Carbon Reduction, Pollution Control, and Economic Growth in Chinese Cities—With a Discussion on Optimization Strategies for Ecological, Environmental, and Economic Goals. J. China Univ. Geosci. (Soc. Sci. Ed.) 2025, 25, 77–92. [Google Scholar] [CrossRef]
  33. Meng, Q.; Gong, Y.; Liu, X.; Tong, X.; Wang, D.; Xie, G.; Liu, T. Research and Prediction of the Degree of Coupling Coordination of Water Resources, Socioeconomic Development, and the Ecological Environment: A Case of the Inner Mongolia Section in the Yellow River Basin. Arid. Zone Res. 2025, 42, 1–13. [Google Scholar] [CrossRef]
  34. Gong, X.; Liu, J.; Yi, F.; Liu, R.; Zhao, H. Decoupling Relationship Between Water Footprint of Textile Industry and Economic Growth in Xinjiang. Wool Text. J. 2023, 51, 137–142. [Google Scholar] [CrossRef]
  35. Song, X.; Shen, P.; Xie, M.; Zhao, C.; Chen, C.; Liu, X. Analysis of the Decoupling Relationship between Industrial CO2 Emissions and Economic Development in China. Ecol. Econ. 2023, 39, 28–33. [Google Scholar]
  36. Tang, W. Factor Market Integration and the Development of China’s Urban Clusters-An Analysis Based on Micro-Firm Dataset. China Econ. Q. 2021, 21, 1–22. [Google Scholar] [CrossRef]
  37. Zhang, Z.; Xiao, X. Coupling Coordination of Water Resources-Economic Society-Ecological Environment in the Yangtze River Economic Belt. China Rural Water Hydropower 2024, 66, 30–36. [Google Scholar] [CrossRef]
  38. Li, X.; Yang, L.; Yang, Y.; Li, Y. Analysis on Coupling and Coordination of Urbanization and Ecological Resilience in Hexi Corridor Economic Belt, China. Chin. J. Appl. Ecol. 2025, 36, 547–558. [Google Scholar] [CrossRef]
  39. Li, M.; Lu, C. Coupling Coupling and Coordination Relationship Between New Urbanization, Economic Development, and Ecological Water Environment in Huaihe River Economic Belt, and Their Driving Factors. Bull. Soil Water Conserv. 2023, 43, 282–293. [Google Scholar] [CrossRef]
  40. Zhao, J.; Guo, P.; Wang, H. Research on Coupling Coordination of the Cultural Industry, the Tourism Industry, and the Ecological Environment in the Yellow River Basin. Hum. Geogr. 2024, 39, 184–192. [Google Scholar] [CrossRef]
  41. Li, Y.; Lin, J.; Wang, Q.; Zhuang, X.; Zhang, Q.; Chen, D.; Zhou, T.; Dang, N. Evolutionary Analysis of the Spatial and Temporal Patterns of Coupled Coordination Between Environmental Regulation Intensity and Net Carbon Emissions from Land Use in the Bohai Rim Region. J. Fujian Norm. Univ. (Nat. Sci. Ed.) 2024, 40, 29–39. [Google Scholar] [CrossRef]
  42. Feng, T.; Yu, X.; Dong, R.; Zhang, F.; Li, C. Spatial-Temporal Evolution and Influencing Factors of the Coordination Degree of “Production-Living-Ecological” Functions in Guangxi Beibu Gulf Economic Zone from the Coupling Perspective. J. China Agric. Univ. 2024, 29, 303–316. [Google Scholar] [CrossRef]
  43. Tong, B. Coupling Coordination Relationship Between Circulation Innovation and Green Development in Northeast Comprehensive Economic Zone. J. Commer. Econ. 2023, 42, 185–188. [Google Scholar] [CrossRef]
  44. Song, X.; Li, Y.; Ruan, W. The Mechanism and Causal Combination of the Evolution of Tourism Economic Network of Urban Agglomeration on the West Coast of the Taiwan Straits. World Reg. Stud. 2022, 31, 1321–1331. [Google Scholar] [CrossRef]
  45. Lei, Y.; Lu, C.; Su, Y.; Huang, Y. Research on the Coupling Relationship Between Urban Vitality and Urban Sprawl Based on the Multi-source Nighttime Light Data–A Case Study of the West Taiwan Strait Urban Agglomeration. Hum. Geogr. 2022, 37, 119–131. [Google Scholar] [CrossRef]
  46. Liao, J.; Peng, X.; Wang, Q.; Jian, P.; Wu, Q. Study on the Coupling and Coordination Relationship of Urban Land Use Benefit in Urban Agglomeration on the West Coast of Taiwan Strait. World Reg. Stud. 2021, 30, 556–566. [Google Scholar] [CrossRef]
  47. Xue, F.; Ma, Y.; Li, M. Urban Network Structure of the Western Taiwan Straits Economic Zone Based on Multi-dimensional Consumption Flow. Econ. Geogr. 2021, 41, 65–74. [Google Scholar] [CrossRef]
  48. Hong, S.; Zhang, Y. Study on the Coupling and Coordinative Development of Steel Industry, Ecological Environment, and Regional Economy in the Yangtze River Economic Belt. J. Cent. China Norm. Univ. (Nat. Sci.) 2019, 53, 703–714. [Google Scholar] [CrossRef]
  49. Li, R.; Li, B.; Gao, Y. The Construction and Promotion Strategy of Knowledge Collaborative Service Model of Local Think Tank Strategic Alliance. Inf. Sci. 2023, 41, 101–106. [Google Scholar] [CrossRef]
  50. Wang, Z.; Huang, Y. Connotation characteristics and path suggestions of China’s new industrialization. Theory Pract. New Ind. 2024, 1, 5–15. [Google Scholar] [CrossRef]
  51. Liu, Y.; Shan, L.; Du, J. Influence of Sustainable Development Progress on Public Satisfaction of Ecological Civilization Construction in China. Res. Environ. Sci. 2023, 36, 1042–1051. [Google Scholar] [CrossRef]
  52. Yu, B. How Does Industrial Restructuring Improve Regional Energy Efficiency? An Empirical Study Based on Two Dimensions of Magnitude and Quality. J. Financ. Econ. 2017, 43, 86–97. [Google Scholar] [CrossRef]
  53. Li, J.; Liu, J.; Wang, J. Audit Methode and Practice Research on the Cleaner Production Audit in Industrial Parks: A Case Study of An Industrial Park in Guangxi. Res. Environ. Sci. 2025, 38, 1164–1172. [Google Scholar] [CrossRef]
  54. Wang, Y.; Lian, H. Sustainability Evaluation of Constructing Eco-industry Park in Zhangchun Colliery. Coal Min. Technol. 2013, 18, 85–88. [Google Scholar] [CrossRef]
  55. Trist, E.L.; Bamforth, K.W. Some social and psychological consequences of the longwall method of coal-getting: An examination of the psychological situation and defences of a work group in relation to the social structure and technological content of the work system. Hum. Relat. 1951, 4, 3–38. [Google Scholar] [CrossRef]
  56. Liu, X. The theory and practice of work design in industrial developed countries. Bus. Manag. J. 2001, 23, 30–37. [Google Scholar] [CrossRef]
  57. Ostrom, E. A general framework for analyzing sustainability of social-ecological systems. Science 2009, 325, 419–422. [Google Scholar] [CrossRef]
  58. Wang, T.; Cheng, J.; Xiong, H. Integrated conservation and systematic management of mountain-river-forest-farmland-dam-grass based on the ecological security pattern and Nature-based Solutions. Acta Ecol. Sin. 2025, 45, 1210–1225. [Google Scholar] [CrossRef]
  59. Yang, X. Research on the path of improving farmers ‘well-being through ecological compensation-Comment on ‘Research on Poverty Reduction Mechanism of Grain for Green Project in Ecologically Fragile Areas’. World For. Res. 2023, 36, 143. [Google Scholar]
  60. Fan, M.; Li, W. Research progress and debate on the theory of payment for ecosystem services: Based on the relationship between ecology and society. China Popul. Resour. Environ. 2017, 27, 130–137. [Google Scholar] [CrossRef]
  61. Cheng, H.; Zhang, J. The evolutionary view of innovation: Philosophical basis, analytical framework and theoretical interpretation. World Philos. 2024, 71, 149–157. [Google Scholar]
  62. Deng, J. Re-identification of Evolutionary Economics: Methodological Hierarchy and Biological Metaphor. Acad. Res. 2021, 64, 102–107. [Google Scholar] [CrossRef]
  63. Jia, G.; Zhao, K. Evolutionary economics and neoliberalism have different views on economic policy. Comp. Econ. Soc. Syst. 2006, 22, 137–143. [Google Scholar] [CrossRef]
  64. Tian, J.; Li, K.; Shuai, Y. Analysis of the spatio-temporal evolution and influencing factors of the coupling and coordination between industrial intelligence and Chinese-style modernization. Stat. Decis. 2025, 41, 128–132. [Google Scholar] [CrossRef]
  65. Shang, M.; Shen, X.; Guo, D. Spatiotemporal evolution and driving factors of “energy-water-carbon”coupling coordination of provinces in China under the ”double-carbon” target. Acta Sci. Circumst. 2025, 45, 533–546. [Google Scholar] [CrossRef]
  66. Hu, X. The structural transformation and endogenous development of the spatio-temporal evolution law of new urbanization-an analytical framework of evolutionary economics. Dev. Res. 2017, 34, 49–58. [Google Scholar] [CrossRef]
  67. Yan, Y.; An, H. Evolutionary economic geography: The second bridge between economics and geography. Prog. Geogr. 2013, 32, 788–796. [Google Scholar] [CrossRef]
  68. Mi, J.; Wu, J.; Li, D. The theoretical construction of the coupling and coordinated development of digital government and new productivity. Electron. Gov. 2024, 21, 2–14. [Google Scholar] [CrossRef]
  69. Development Plan of Economic Zone on the West Coast of the Taiwan Straits. Available online: http://www.fjtb.gov.cn/law/201311/t20131104_5147311.htm (accessed on 2 July 2025).
  70. Ma, Y.; Xue, F.; Sun, W. Analysis of urban network structure of the economic zone on the West Coast of the Taiwan Strait: A study through the lens of functional networks and innovation cooperation networks. Geogr. Res. 2019, 38, 3010–3024. [Google Scholar] [CrossRef]
  71. Miao, J. Coupling and Coordination Analysis of Industrial Water Resources Efficiency and Economic Development in the Yellow River Basin. J. Ind. Technol. Econ. 2023, 42, 142–150. [Google Scholar] [CrossRef]
  72. Qiu, F.; Zhang, C.; Guo, M.; Zheng, Z.; Shan, Y. Heterogeneity of the Coupling Relationship Between the Innovation Capacity and Industrial Transformation of Renewable Resource-based Cities in China. Sci. Geogr. Sin. 2020, 40, 1092–1103. [Google Scholar] [CrossRef]
  73. Guo, C.; Zhao, S. Developing New Quality Productive Forces to promote high-quality industrial development. J. Shenyang Univ. Technol. 2025, 18, 1–8. [Google Scholar] [CrossRef]
  74. ‘14th Five-Year ‘Comprehensive Work Plan for Energy Saving and Emission Reduction. Available online: https://www.gov.cn/zhengce/content/2022-01/24/content_5670202.htm (accessed on 2 July 2025).
  75. Huang, W.; Yang, G.; Han, X. Optimizing the pathways of industrial solid waste recycling under multiple perspectives: A case study of copper smelting slag. J. Environ. Eng. Technol. 2024, 14, 1580–1588. [Google Scholar] [CrossRef]
  76. Wang, X.; Peng, Y.; Wu, X. A Comprehensive Appraisal and Spatial Variation of the Level of Ecological Civilization Construction in China. East China Econ. Manag. 2015, 29, 52–56. [Google Scholar] [CrossRef]
  77. Zhu, L. Towards a Social Protection System Compatible to a Market Economy. Stud. Labor Econ. 2014, 2, 3–20. [Google Scholar] [CrossRef]
  78. Hong, L.; Sun, J.; Liu, D.; Zhang, W.; Zhou, C. Research on the Development of Coupling Coordinated Relationship and the Affecting Factors of Eco-environment and Socio-economy in Central Urban Agglomeration of Yangtze River Delta Region. J. Ecol. Rural Environ. 2024, 40, 1155–1166. [Google Scholar] [CrossRef]
  79. Huang, X.; Li, D. Digital Economy, Scientific and Technological Innovation, and Upgrading of Industrial Structure. Econ. Rev. J. 2024, 40, 120–128. [Google Scholar] [CrossRef]
  80. Zhang, M.; Ma, Y.; Ma, Y. Influencing factors on severity of vehicle-pedestrian conflict at unsignalized intersections. China Saf. Sci. J. 2023, 33, 190–197. [Google Scholar] [CrossRef]
  81. Jalao, E.; Wu, T.; Shunk, D. A stochastic AHP decision making methodology for imprecise preferences. Inf. Sci. 2014, 47, 192–203. [Google Scholar] [CrossRef]
  82. Wang, L.; Qi, C.; Zeng, G. Evaluation and Spatiotemporal Characteristics Analysis of the Development Level of China’s Digital Village Construction. Stat. Decis. 2024, 40, 65–69. [Google Scholar] [CrossRef]
  83. Zhang, Q.; Jiang, Y. The spatial and temporal evolution and influencing factors of the coupling and coordinated development of carbon reduction-pollution reduction-green expansion-growth. Stat. Decis. 2025, 41, 90–94. [Google Scholar] [CrossRef]
  84. The Coupling Coordination and Driving Mechanism of Marine Resource Development and Utilization Efficiency and Ecological Resilience in China. Available online: https://link.cnki.net/urlid/12.1076.p.20250619.1528.004 (accessed on 2 July 2025).
  85. Holtz-Eakin, D.; Newey, W.; Rosen, H.S. Estimating vector autoregressions with panel data. Econometrica 1988, 56, 1371–1395. [Google Scholar] [CrossRef]
  86. Geng, Y.; Li, X. Dynamic evolution of territorial space resilience and interaction with urbanization from the perspective of adaptive cycling: A case study of Jiangsu province. J. Nat. Res. 2025, 40, 1969–1992. [Google Scholar] [CrossRef]
  87. Cong, X. Expression and Mathematical Property of Coupling Model, and Its Misuse in Geographical Science. Econ. Geogr. 2019, 39, 18–25. [Google Scholar] [CrossRef]
  88. Notice on the Issuance of a Number of Policies to Promote the Steady Growth of the Industrial Economy. Available online: https://www.gov.cn/zhengce/zhengceku/2022-02/18/content_5674530.htm (accessed on 2 July 2025).
  89. Zhu, Y.; Jiang, M. Study on the Coupling and Coordination of Water Resources, Economy, Ecology, and Society in Urban Agglomerations Along the Yellow River. Yellow River 2024, 46, 14–19. [Google Scholar] [CrossRef]
  90. Xue, M. Research on the Coupling and Coordination of Scientific and Technological Innovation and Green Development in the Yellow River Basin. Sci. Technol. Manag. Land Resour. 2024, 41, 116–131. [Google Scholar] [CrossRef]
  91. Jiang, X.; Wang, X.; Yang, Q. Spatio-Temporal Evolution Characteristics and Driving Mechanism of Ecological-Economic-Social System Coupling Coordination in the Bohai Rim Area. Sci. Geogr. Sin. 2024, 44, 2155–2165. [Google Scholar] [CrossRef]
  92. Fu, Y.; Wang, Z. Spatio-Temporal Pattern and Convergence of the Coupling Coordination Degrees Between Sci-tech Finance and Ecological Civilization Construction. Sci. Technol. Prog. Policy 2025, 42, 44–56. [Google Scholar] [CrossRef]
  93. Wang, K.; Dong, Z. Spatiotemporal Coupling Coordination Analysis of Pollution Reduction, Carbon Mitigation, and Efficiency Enhancement Across Chinese Provinces. Res. Environ. Sci. 2025, 38, 1–17. [Google Scholar] [CrossRef]
  94. Wang, Q.; Zhao, R.; Wang, J. Bayesian network to analyze leakage risks in LNG ship loading and unloading. Navig. China 2023, 46, 42–48. [Google Scholar] [CrossRef]
  95. Silverman, B.W. Density Estimation for Statistics and Data Analysis; CRC Press: New York, NY, USA, 1998. [Google Scholar]
  96. Zhao, X.; Shuai, H. Spatio-Temporal Evolution and Influencing Factors Analysis of Carbon Emission Intensity and New Urbanization Level Coupling Coordination in the Chengdu-Chongqing Urban Agglomeration. J. Nat. Sci. Hunan Norm. Univ. 2025, 48, 37–46. [Google Scholar] [CrossRef]
  97. Spatio-Temporal Evolution Characteristics and Driving Mechanism of Land Use Carbon Emission at County Level in Guangxi. Available online: https://link.cnki.net/urlid/11.3513.S.20250126.1757.002 (accessed on 2 July 2025).
  98. Hao, Z.; Wen, Q.; Shi, L. Spatial Network Analysis of Coupling Coordination Between Social Economy and Eco-Environment in Yellow River Basin Urban Agglomerations. Econ. Geogr. 2023, 43, 181–191. [Google Scholar] [CrossRef]
  99. Du, B. Risk measurement model based on Bootstrap method and its empirical analysis-Discussion on risk measurement methods of institutional investors. Sta. Res. 2004, 21, 49–54. [Google Scholar] [CrossRef]
  100. Coupling Coordination Analysis of Flow and Sediment Transport-Social Economy-Ecological-Environment System for Lower Reaches of the Yellow River. Available online: https://link.cnki.net/urlid/32.1356.TV.20250122.1520.006 (accessed on 2 July 2025).
  101. Zhou, C.; Ren, M.; Wu, C. Spatiotemporal evolution characteristics and influencing factors of online attention to ecotourism in the Yellow River Basin. J. Des. Res. 2025, 45, 47–58. [Google Scholar] [CrossRef]
  102. Jiangxi Electric Power Development ‘Twelfth Five-Year Plan’ Full Text. Available online: https://m.bjx.com.cn/mnews/20121205/406025.shtml (accessed on 2 July 2025).
  103. Chen, Y. Research on the Mediation and Threshold Effects of Environmental Regulation on Industrial Green Transformation. Theory Pract. Finance. Econ. 2023, 44, 130–137. [Google Scholar] [CrossRef]
  104. Cui, J.; Guo, G. Study on the Relationship between Compact Development and Urban Land Use Efficiency of China’s Megacities. Econ. Manag. 2025, 39, 51–62. [Google Scholar] [CrossRef]
  105. Wang, M. Carbon Emission Reduction in China’s Industrial Sector: Challenges and Responses. Frontiers 2025, 11, 45–51. [Google Scholar] [CrossRef]
  106. Yuan, Y.; Xie, R. Industrial Structure Adjustment, Technological Progress and Pollution Abatement. China Popul. Resour. Environ. 2012, 22, 144–147. [Google Scholar]
  107. Sun, B.; Liang, X.; Li, B.; Liu, J.; Wu, L.; Liu, Y. Spatiotemporal Evolution and Optimization of Urbanization–Water Environment Coupling in the Cheng-Yu Region. Land 2025, 14, 412. [Google Scholar] [CrossRef]
  108. Chang, J.; Ma, Y.; Su, X.; Fu, W.; Qu, C. Coupling Coordination of Land Use Recessive Form and Ecological Welfare Performance and Its Influencing Factor-A Case Study in Cities along Lower Yellow River. Bull. Soil Water Conserv. 2025, 45, 381–392. [Google Scholar] [CrossRef]
  109. Huang, W. The Economic Zone on the West Coast of the Taiwan Straits: Sail under the guidance of the scientific concept of development-Interview with Lu Zhangong, Secretary of the CPC Fujian Provincial Committee. QIUSHI 2008, 51, 35–37. [Google Scholar]
  110. Wei, J.; Wu, S. Research on the evolution of the characteristics of the urban comprehensive connection network in Fujianprovince. J. Zhejiang Univ. 2023, 50, 225–235. [Google Scholar] [CrossRef]
  111. Chen, Q.; Fang, H. The ‘Xin’anjiang model’: The nation’s first pilot cross-provincial watershed ecological compensation mechanism. J. Party Sch. Nanjing Munic. Comm. CPC 2020, 19, 100–109. [Google Scholar]
Figure 1. Coupling mechanisms of ISO, EEM, and SED. Created by the author.
Buildings 15 02469 g001
Figure 2. Research frameworks. Created by the author.
Buildings 15 02469 g002
Figure 3. Research area. Created by the author.
Buildings 15 02469 g003
Figure 4. ISO, EEM, and SED subsystem comprehensive scores in the Western Taiwan Straits Economic Zone from 2011 to 2023.
Buildings 15 02469 g004
Figure 5. ISO, EEM, and SED subsystem comprehensive scores of cities in the Western Taiwan Straits Economic Zone from 2011 to 2023.
Buildings 15 02469 g005
Figure 6. Impulse response result.
Buildings 15 02469 g006
Figure 7. Coupling coordination between ISO, EEM, and SED in the Western Taiwan Straits Economic Zone from 2011 to 2023.
Buildings 15 02469 g007
Figure 8. Kernel density estimates of degree of coupling coordination from 2011 to 2023. Created by the author.
Buildings 15 02469 g008
Figure 9. Spatial distribution of degree of coupling of ISO, EEM, and SED in the Western Taiwan Straits Economic Zone from 2011 to 2023. Created by the author.
Buildings 15 02469 g009
Figure 10. Spatial distribution of degree of coordination of ISO, EEM, and SED in the Western Taiwan Straits Economic Zone from 2011 to 2023. Created by the author.
Buildings 15 02469 g010
Figure 11. Spatial distribution of degree of coupling coordination of ISO, EEM, and SED in the Western Taiwan Straits Economic Zone from 2011 to 2023. Created by the author.
Buildings 15 02469 g011
Figure 12. Trend surface analysis of degree of coupling coordination of ISO, EEM, and SED in the Western Taiwan Straits Economic Zone from 2011 to 2023. Created by the author.
Buildings 15 02469 g012
Figure 13. Cold and hot spots in the distribution of the degree of coupling coordination of ISO, EEM, and SED in the Western Taiwan Straits Economic Zone from 2011 to 2023. Created by the author.
Buildings 15 02469 g013
Figure 14. Network structure of spatial connection in the degree of coupling coordination of ISO, EEM, and SED in the Western Taiwan Straits Economic Zone from 2011 to 2023. Created by the author.
Buildings 15 02469 g014
Table 1. Research target.
ProvincesCityNumber
Zhejiang ProvinceWenzhou, Quzhou, Lishui3
Fujian ProvinceFuzhou, Xiamen, Putian, Sanming, Quanzhou,
Zhangzhou, Nanping, Longyan, Ningde
9
Jiangxi ProvinceYingtan, Ganzhou, Fuzhou, Shangrao4
Guangdong ProvinceShantou, Meizhou, Chaozhou, Jieyang4
Table 2. ISO–EEM–SED coupling coordination evaluation indicator system.
Primary IndicatorsSecondary IndicatorsTertiary
Indicators
Criteria for SelectionUnit (of Measure)CausalityNotationWeightsTOLVIF
ISO
(X)
Industries’
industrial
scale
Number of industrial enterprises above per capita scaleQuantifying industrial cluster degreePcs/peopleForwardX10.2450.5511.816
Total industrial output value above per capita scaleQuantifying the scale effectCNY 10,000/peopleForwardX20.4160.6621.510
Industries pollution
emission
Industrial wastewater emissionsReflecting the urgent need for industrial wastewater recycling transformationTonNegative directionX30.0300.9491.054
Industrial sulfur dioxide emissionsSuppressing acid rain and major precursors of PM2.5TonNegative directionX40.0490.2144.670
Industrial smoke and dust emissionsConstraining particulate matter health risksTonNegative directionX50.0480.3962.527
Industrial nitrogen oxide emissionsReducing ozone pollutionTonNegative directionX60.0450.2214.534
Industries
resource
efficiency
Comprehensive utilization rate of general industrial solid wasteReflecting the degree of industrial resource intensification%ForwardX70.0870.9001.111
Industrial electricity consumptionControlling energy consumption intensityMillion kWhNegative directionX80.0800.5551.802
EEM
(Y)
Ecological environmentTotal water resources per capitaEnsuring the supply of basic ecological resourcesCubic meters/peopleForwardY10.4740.8821.133
Forest coverageEnhancing forest carbon sinks capacity%ForwardY20.0280.4812.079
Park green space areaImproving urban ecological resilienceHectaresForwardY30.2130.3952.532
Governance capacityCentralized treatment rate of sewage treatment plantsCharacterizing the governance capability of water pollution%ForwardY40.0110.5021.990
Non-hazardous treatment rate of domestic wasteCharacterizing the treatment capacity of domestic waste%ForwardY50.0070.5341.874
Governance
inputs
Proportion of employees in water conservancy and environmental protectionSupporting human resources for water conservancy governance%ForwardY60.0920.7821.279
Proportion of employees in the geological exploration industrySupporting human resources for geological exploration%ForwardY70.1760.7661.306
SED
(Z)
Economy
scale
Gross Domestic Product (GDP) per capitaMeasuring regional economic scale foundationCNY/peopleForwardZ10.0570.1427.066
Total investment in fixed assets per capitaMeasuring investment volumeCNY 10,000/peopleForwardZ20.0560.3342.996
Total retail sales of consumer goods per capitaReflecting consumption upgrading trendsCNY 10,000/peopleForwardZ30.0550.1695.915
Economic structureAdded value of the tertiary industryReflecting the advanced process of industrial structureCNY 10,000ForwardZ40.0980.06515.496
Social developmentUrbanization rateDriving spatial agglomeration of innovation elements%ForwardZ50.0320.2503.997
Social
services
Total collection of books in public libraries per thousand peopleBuilding an inclusive cultural service systemThousand copies/thousand peopleForwardZ60.0970.3263.067
Number of hospitals per thousand peopleEnsuring accessibility to basic medical and health servicesPcs/ten thousand peopleForwardZ70.0850.5451.835
Number of full-time teachers in higher education institutions per thousand peopleEnsuring teacher resource reservesPeople/ten thousand peopleForwardZ80.1640.2553.918
Social
security
Proportion of participants in basic endowment insurance for urban employeesClarifying social security coverage%ForwardZ90.0870.1666.035
Proportion of participants in the basic medical insurance for urban areasClarifying medical security coverage%ForwardZ100.1170.6321.582
Innovation in science and educationNumber of patents authorized per capitaCatalyzing the transformation of innovative achievementsPcs/peopleForwardZ110.1420.1735.774
Proportion of science and education in fiscal expenditureClarifying innovation input%ForwardZ120.0110.7391.353
Table 3. Coupling level.
Degree of Coupling (C)Coupling Level
(0.0, 0.3]Low-level coupling stage
(0.3, 0.5]Antagonistic stage
(0.5, 0.8]Friction stage
(0.8, 1.0]High-level coupling stage
Table 4. Coordination level.
Degree of Coordination (T)Coordination Level
(0.0, 0.2]Low-level coordination stage
(0.2, 0.4]Medium-low-level coordination stage
(0.4, 0.6]Medium-level coordination stage
(0.6, 0.8]Medium-high-level coordination stage
(0.8, 1.0]High-level coordination stage
Table 5. Coupling coordination level.
Degree of Coupling
Coordination (D)
Coupling Coordination LevelDegree of Coupling
Coordination (D)
Coupling Coordination Level
(0.0, 0.1]Extreme disorder(0.5, 0.6]Barely coordinated
(0.1, 0.2]Severe disorder(0.6, 0.7]Elementary coordination
(0.2, 0.3]Moderate disorder(0.7, 0.8]Intermediate coordination
(0.3, 0.4]Mild disorder(0.8, 0.9]Good coordination
(0.4, 0.5]Near disorder(0.9, 1.0]Quality coordination
Table 6. Robustness Test Result.
SubsystemSymbolOriginal WeightConfidence Interval WidthMean Weight After ResamplingLower Confidence LimitUpper Confidence Limit
ISO (X)X10.2450.1020.2430.1910.294
X20.4160.1200.4270.3610.481
X30.0300.0660.0300.0020.068
X40.0490.0720.0480.0240.096
X50.0480.0510.0460.0270.078
X60.0450.0550.0440.0220.077
X70.0870.1160.0850.0250.141
X80.0800.0780.0770.0430.121
EEM (Y)Y10.4740.1640.5450.4420.606
Y20.0280.0210.0220.0120.033
Y30.2130.0840.1810.1460.230
Y40.0110.0130.0090.0030.017
Y50.0070.0100.0050.0020.012
Y60.0920.0540.0800.0580.112
Y70.1760.1050.1580.1070.213
SED (Z)Z10.0570.0220.0540.0420.065
Z20.0560.0310.0550.0410.072
Z30.0550.0190.0520.0430.062
Z40.0980.0340.0970.0780.112
Z50.0320.0170.0300.0230.039
Z60.0970.0360.0990.0820.118
Z70.0850.0430.0820.0590.102
Z80.1640.0540.1730.1470.200
Z90.0870.0370.0870.0680.105
Z100.1170.0480.1170.0940.142
Z110.1420.0430.1440.1200.164
Z120.0110.0090.0100.0060.015
Table 7. Stationarity test result.
VariableP
LLCIPSHTADFPP
Inverse χ2(40)Inverse NormalInverse Logit t(99)Modified Inv. χ2Inverse χ2(40)Inverse NormalInverse Logit t(99)Modified Inv. χ2
ISO0.0000.1180.0000.0110.7660.5500.0040.0150.6820.3260.008
EEM0.0370.0000.1470.0000.0110.0020.0000.0000.0000.0000.000
SED0.0300.0000.0000.0450.2740.1430.0340.0000.0000.0000.000
D.ISO0.0000.0000.0000.0000.0000.0000.0000.0000.0000.0000.000
D.EEM0.0000.0000.0280.0000.0000.0000.0000.0000.0000.0000.000
D.SED0.0000.0000.0000.0000.0000.0000.0000.0000.0000.0000.000
Table 8. Selection of optimal lag order.
Lag OrderPVAR (1)PVAR (2)PVAR (3)PVAR (4)PVAR (5)
AIC−13.7784−14.3528−13.8395−13.3409−14.6461 *
BIC−12.6405−12.9692 *−12.1674−11.3238−12.207
HQIC−13.3179−13.7918 *−13.1605−12.5212−13.6556
* indicates the optimal lag order selected according to the AIC, BIC, and HQIC information criteria.
Disclaimer/Publisher’s Note: The statements, opinions and data contained in all publications are solely those of the individual author(s) and contributor(s) and not of MDPI and/or the editor(s). MDPI and/or the editor(s) disclaim responsibility for any injury to people or property resulting from any ideas, methods, instructions or products referred to in the content.

