
A Study on Outdoor Thermal Comfort During Military Training for College Freshmen: A Survey in a Cold Region of China


Abstract
1. Introduction
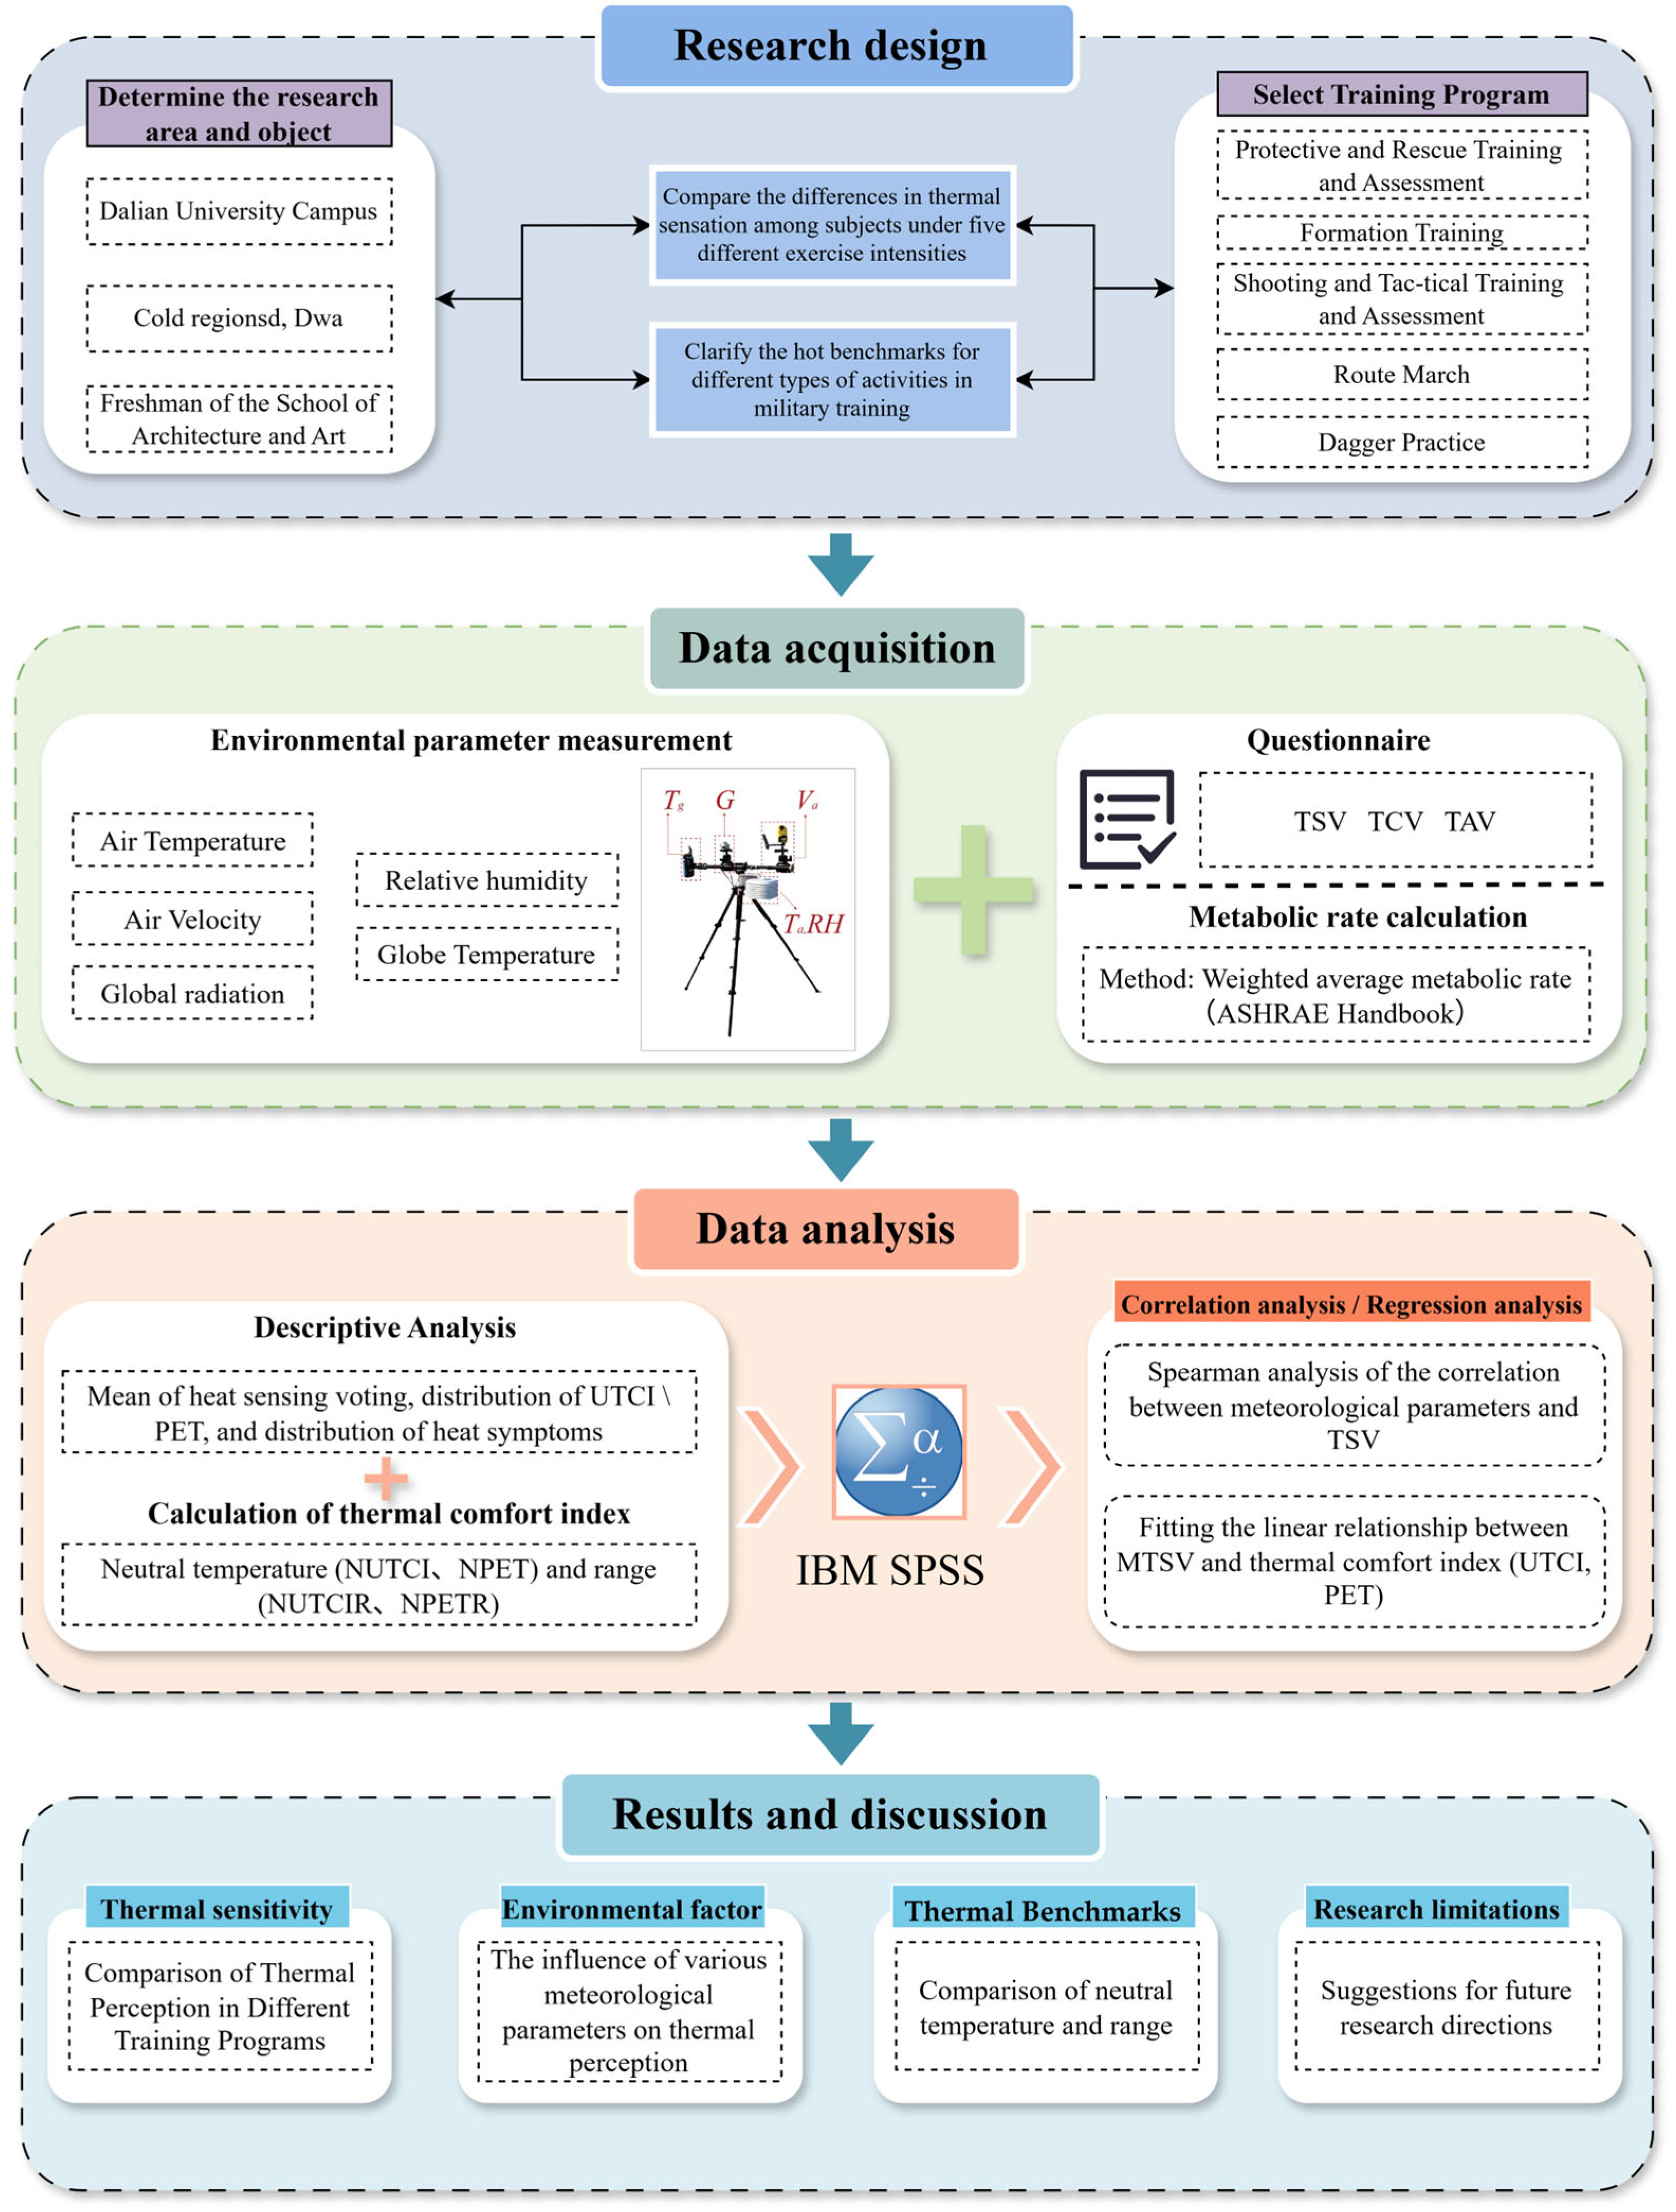
2. Methods
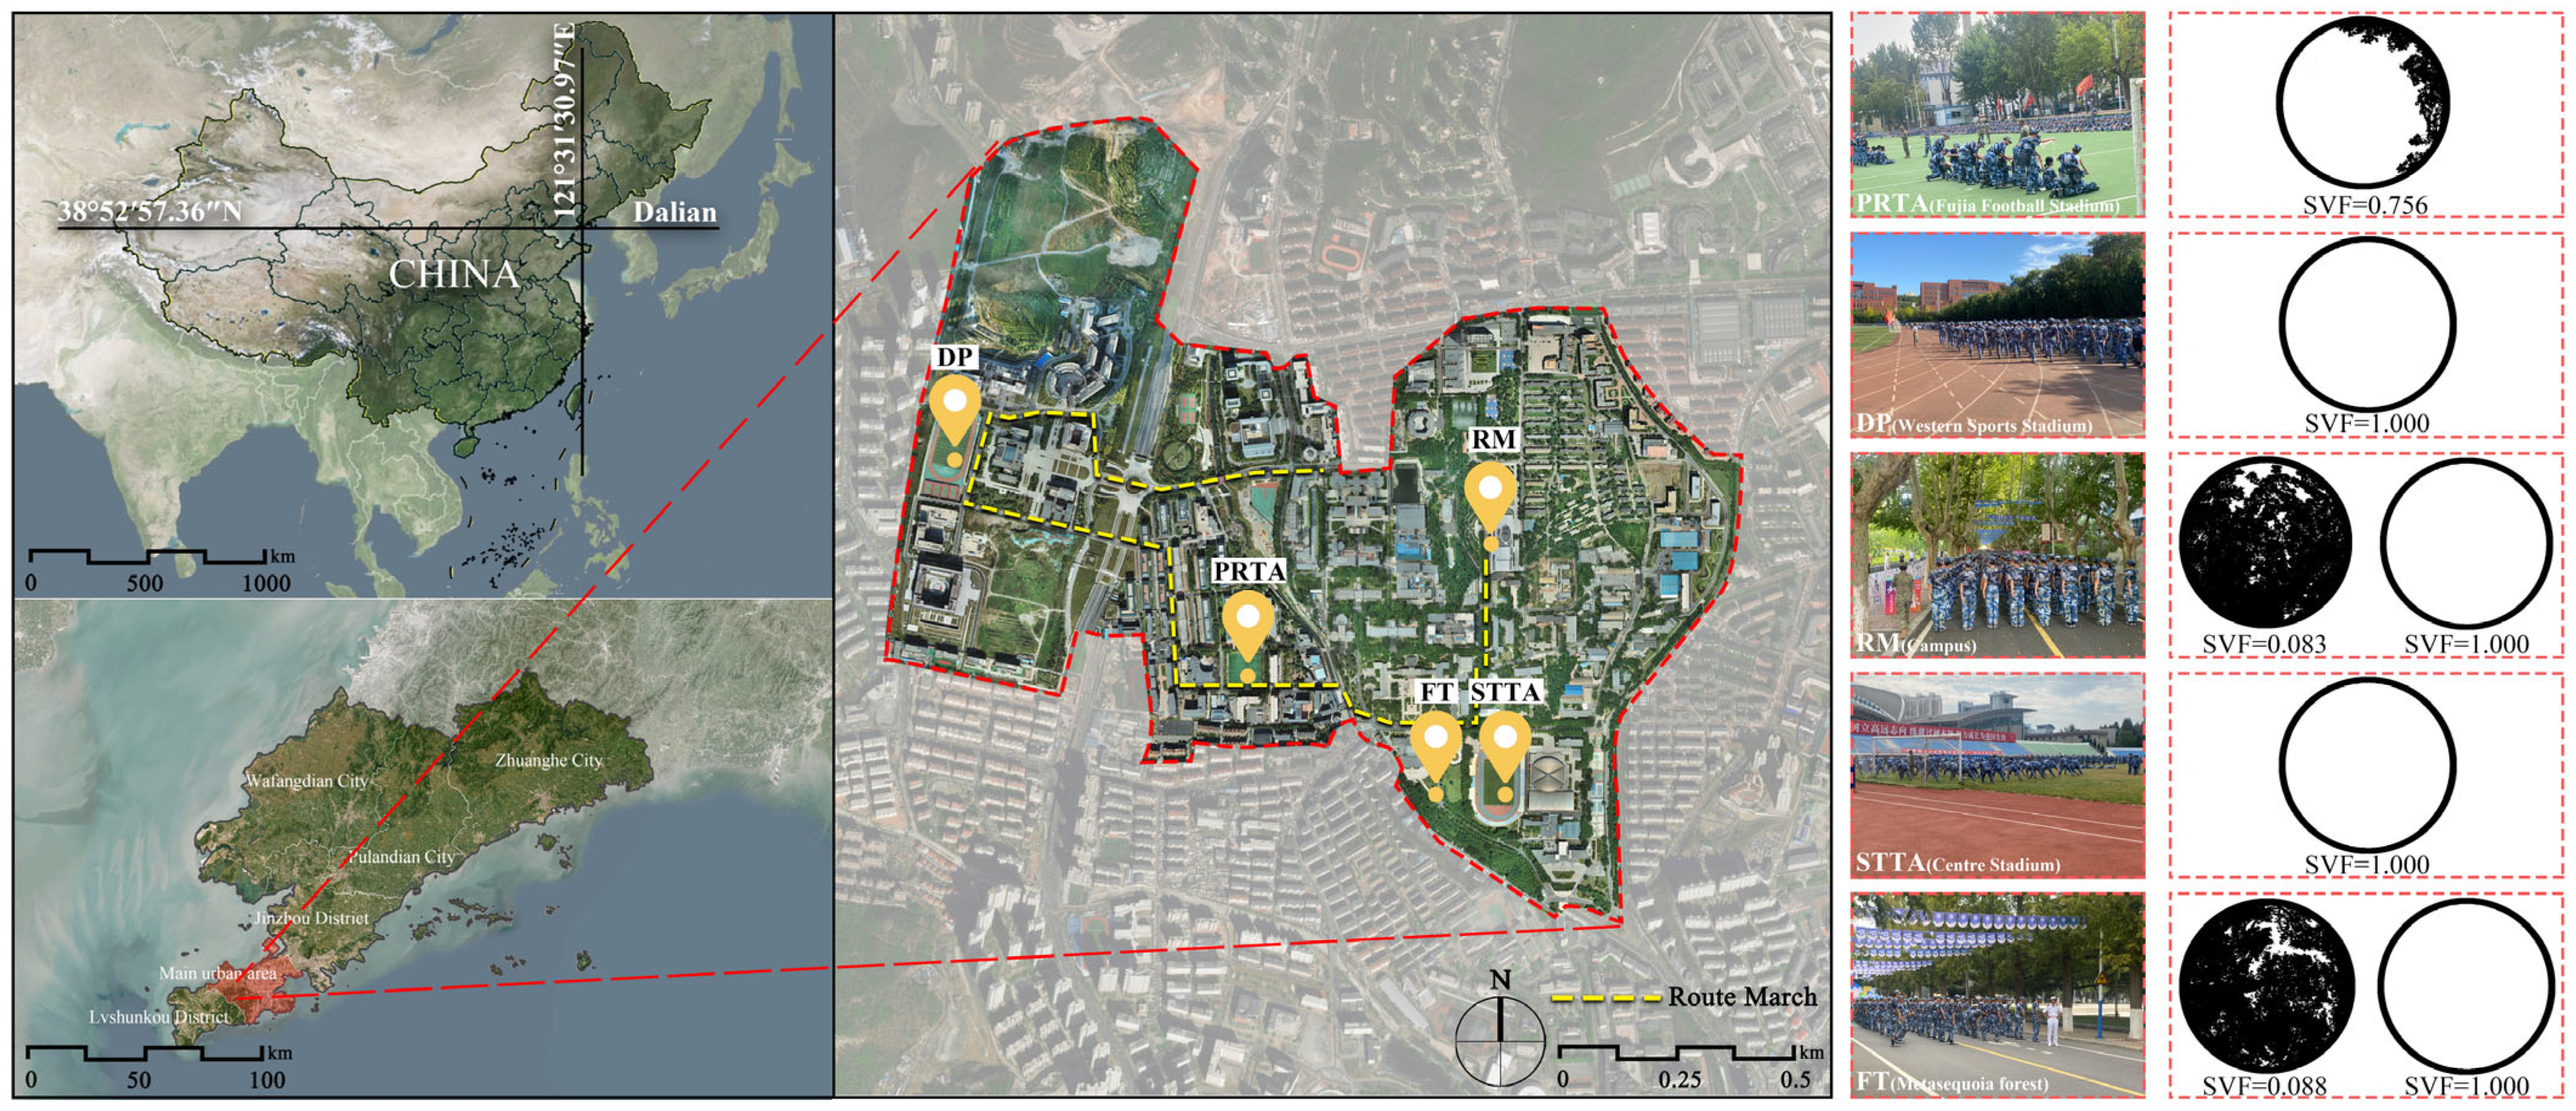
2.1. The Study Area
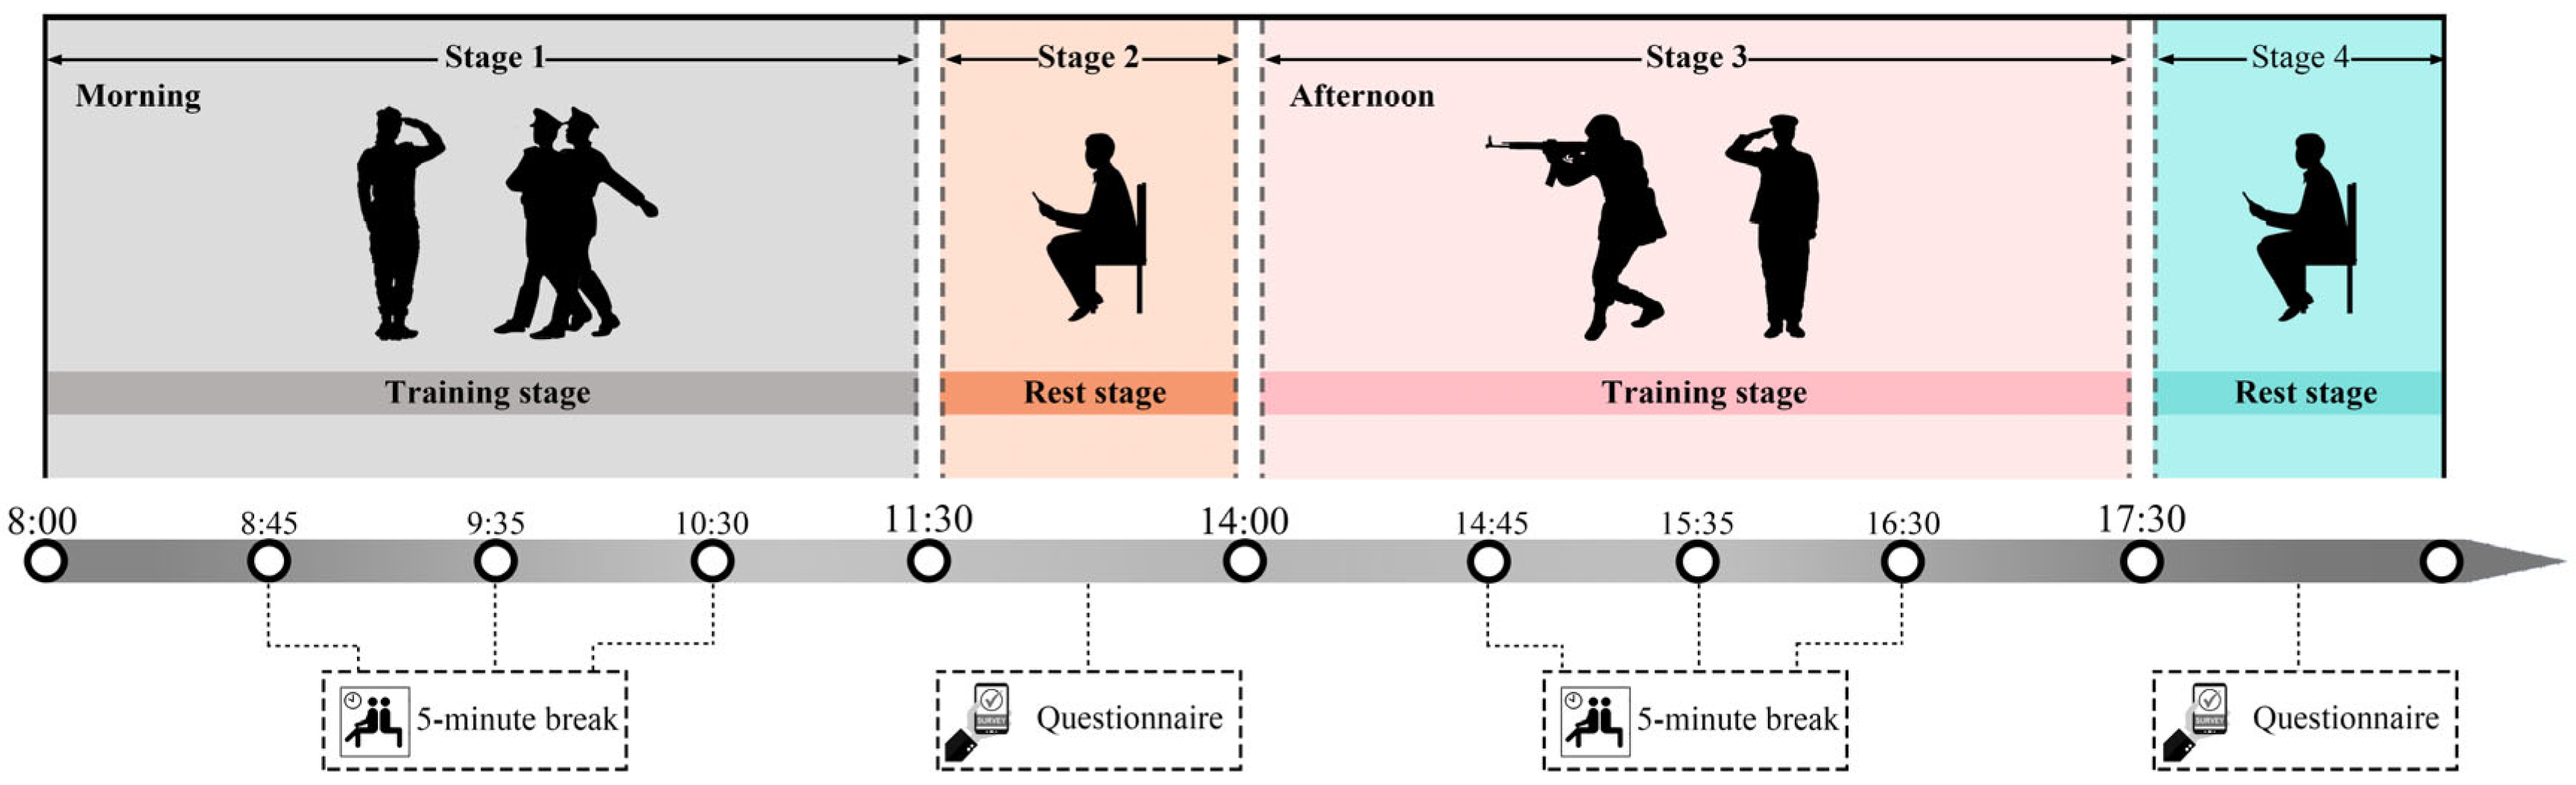
2.2. The Experimental Design
2.2.1. Physical Measurements
2.2.2. Questionnaire Surveys
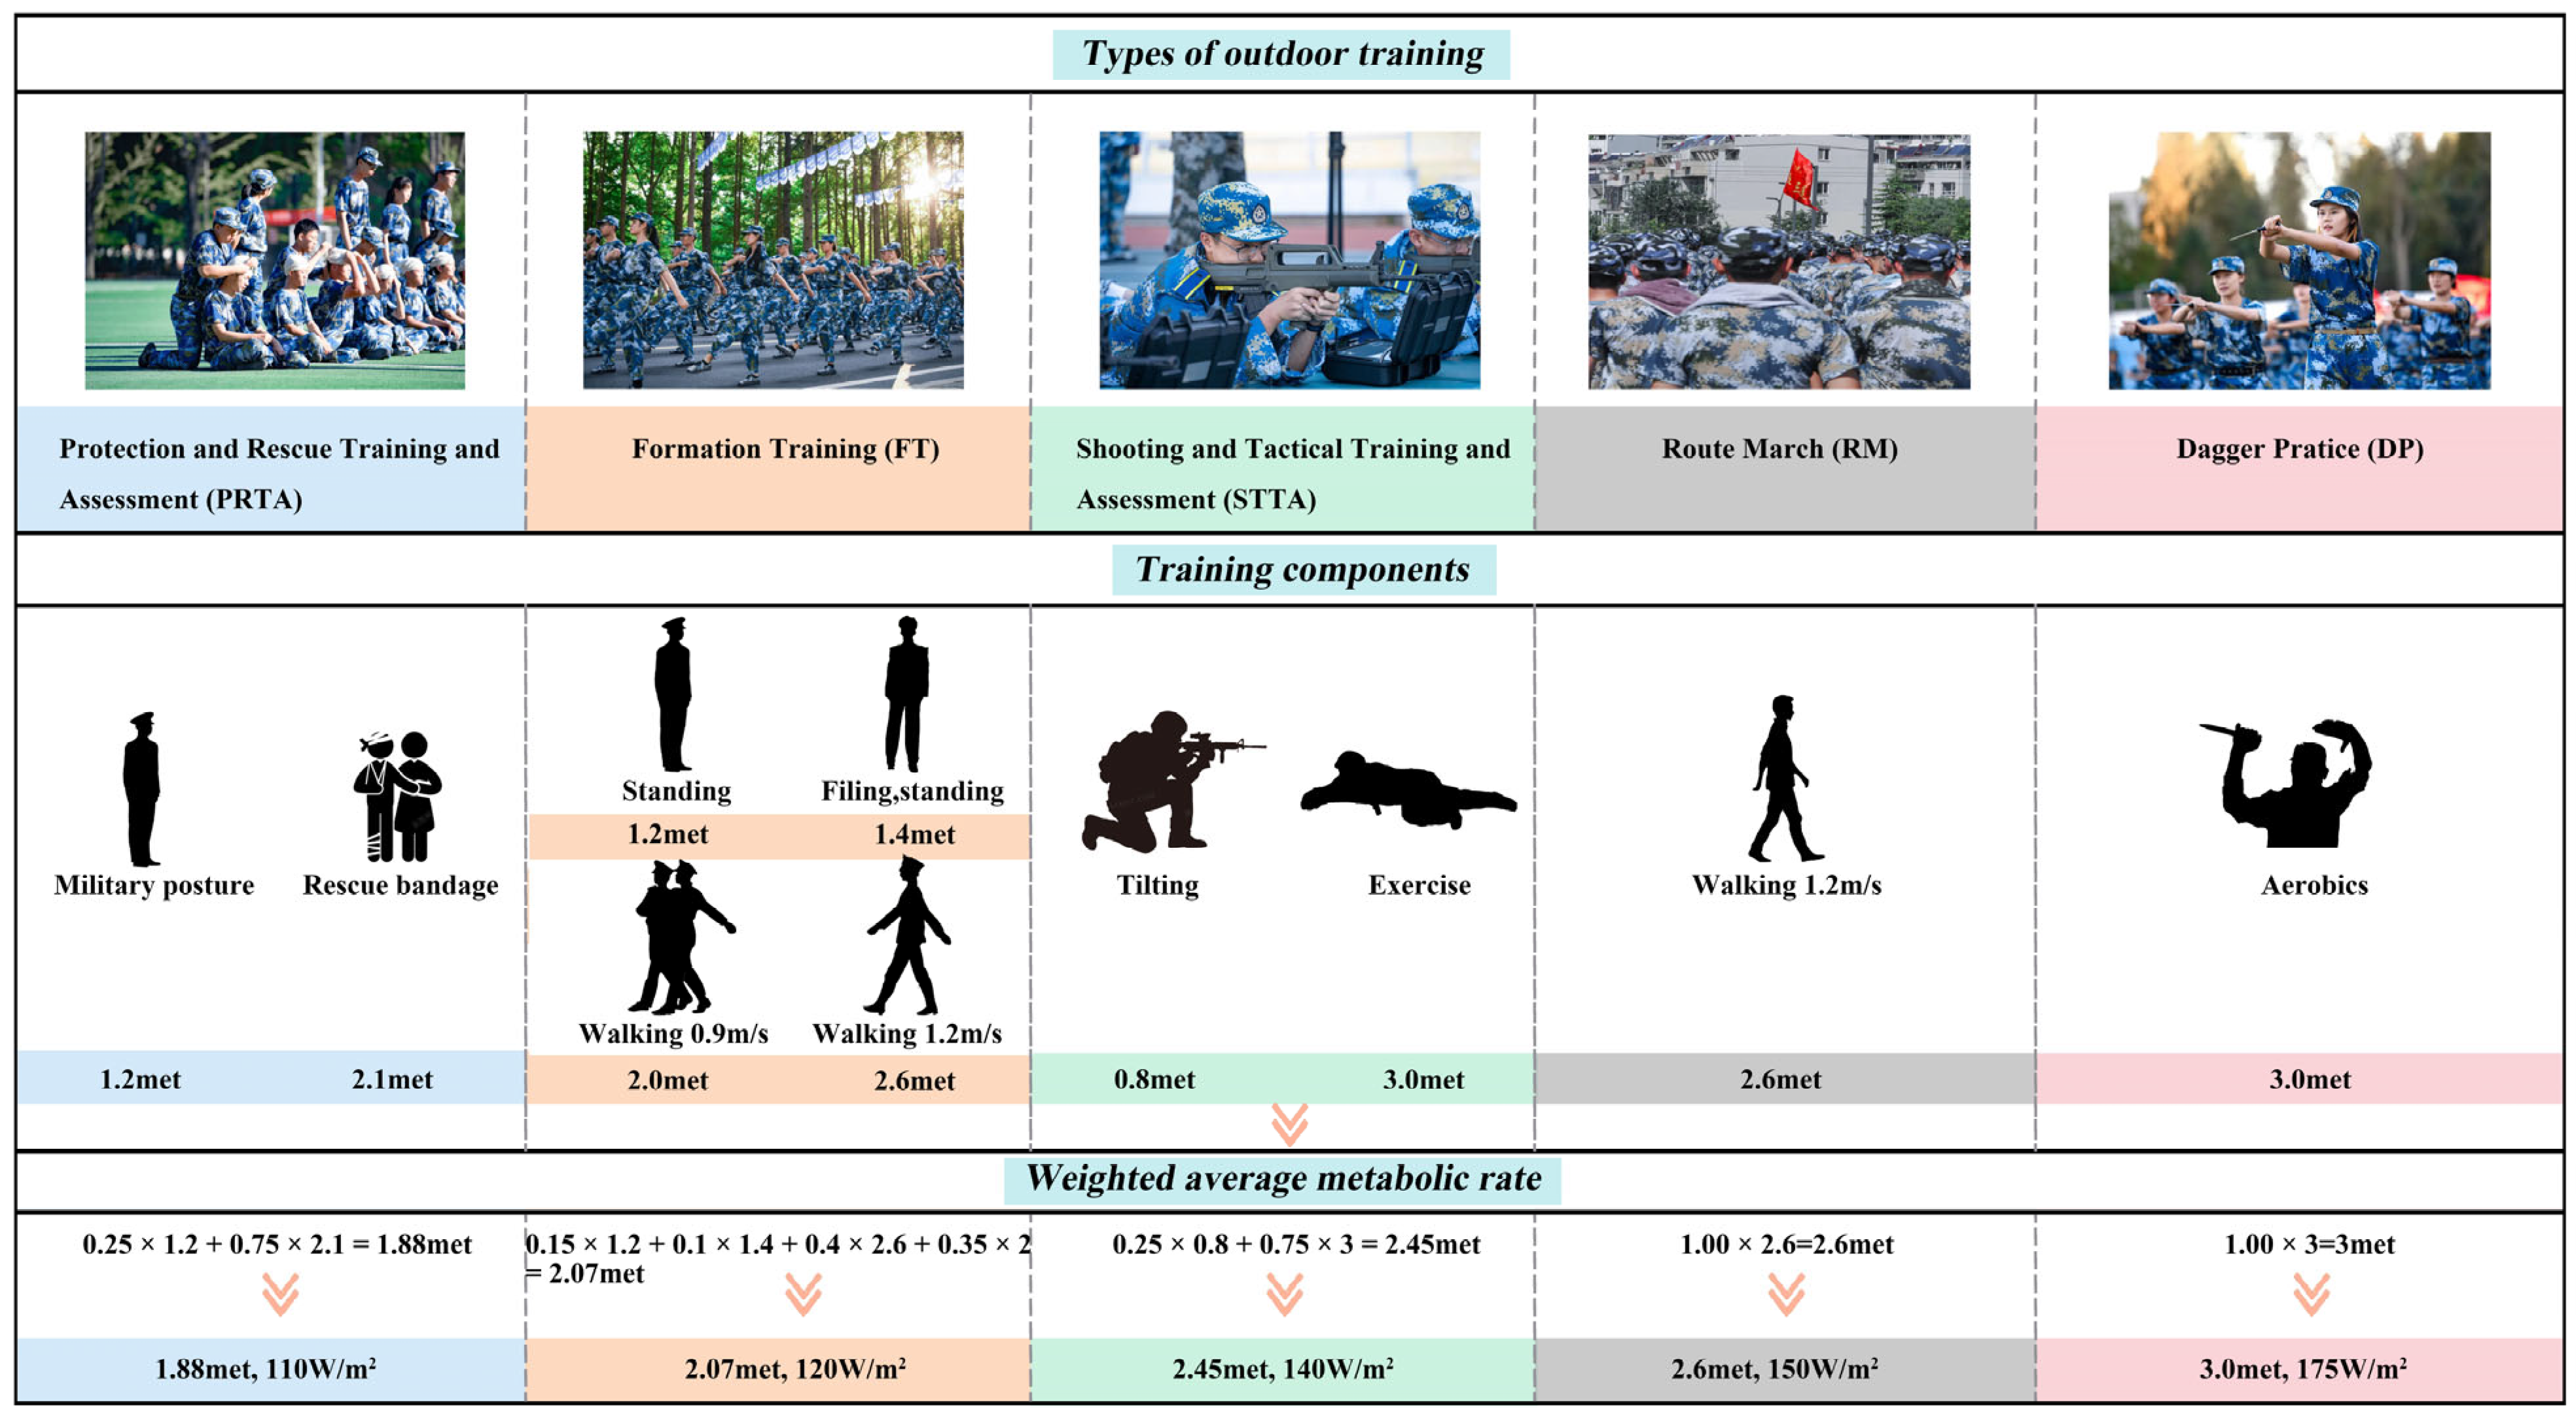
2.2.3. Types of Military Training and Metabolic Rate Calculation
2.3. The Evaluation Indices
2.4. The Statistical Analysis
3. Results
3.1. The Descriptive Analysis
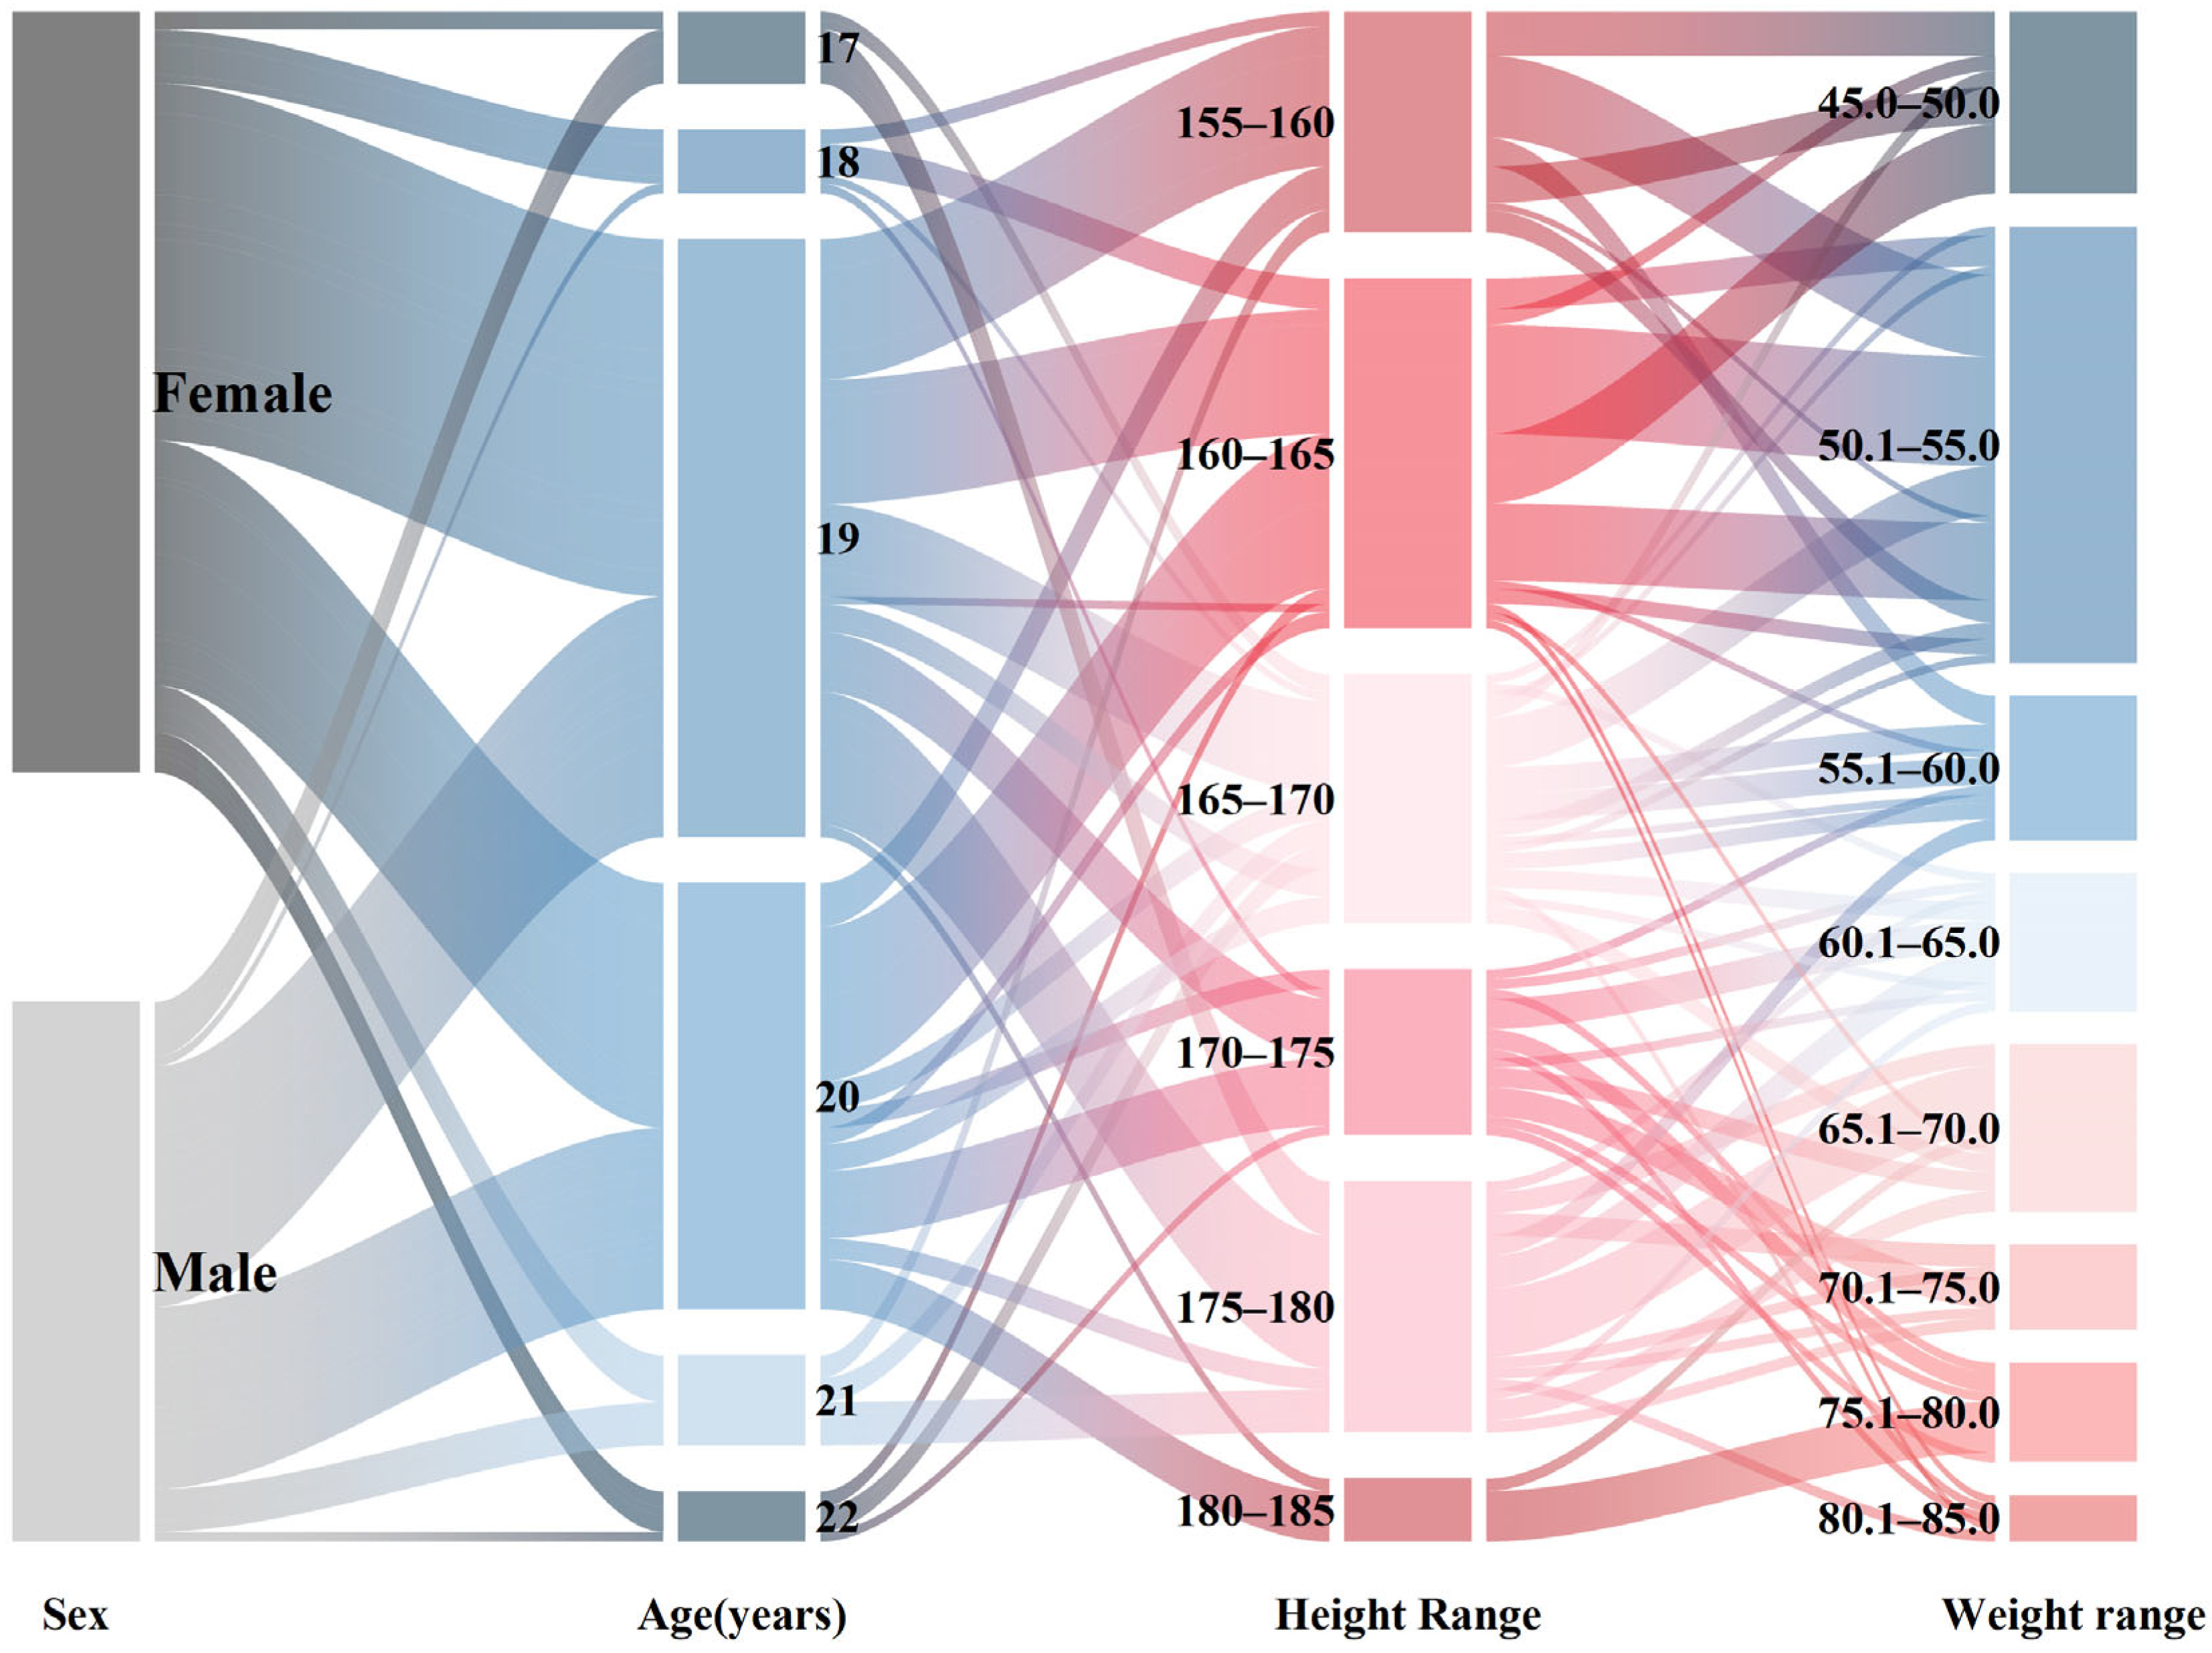
3.1.1. The Respondents’ Attributes
3.1.2. The Meteorological Parameters
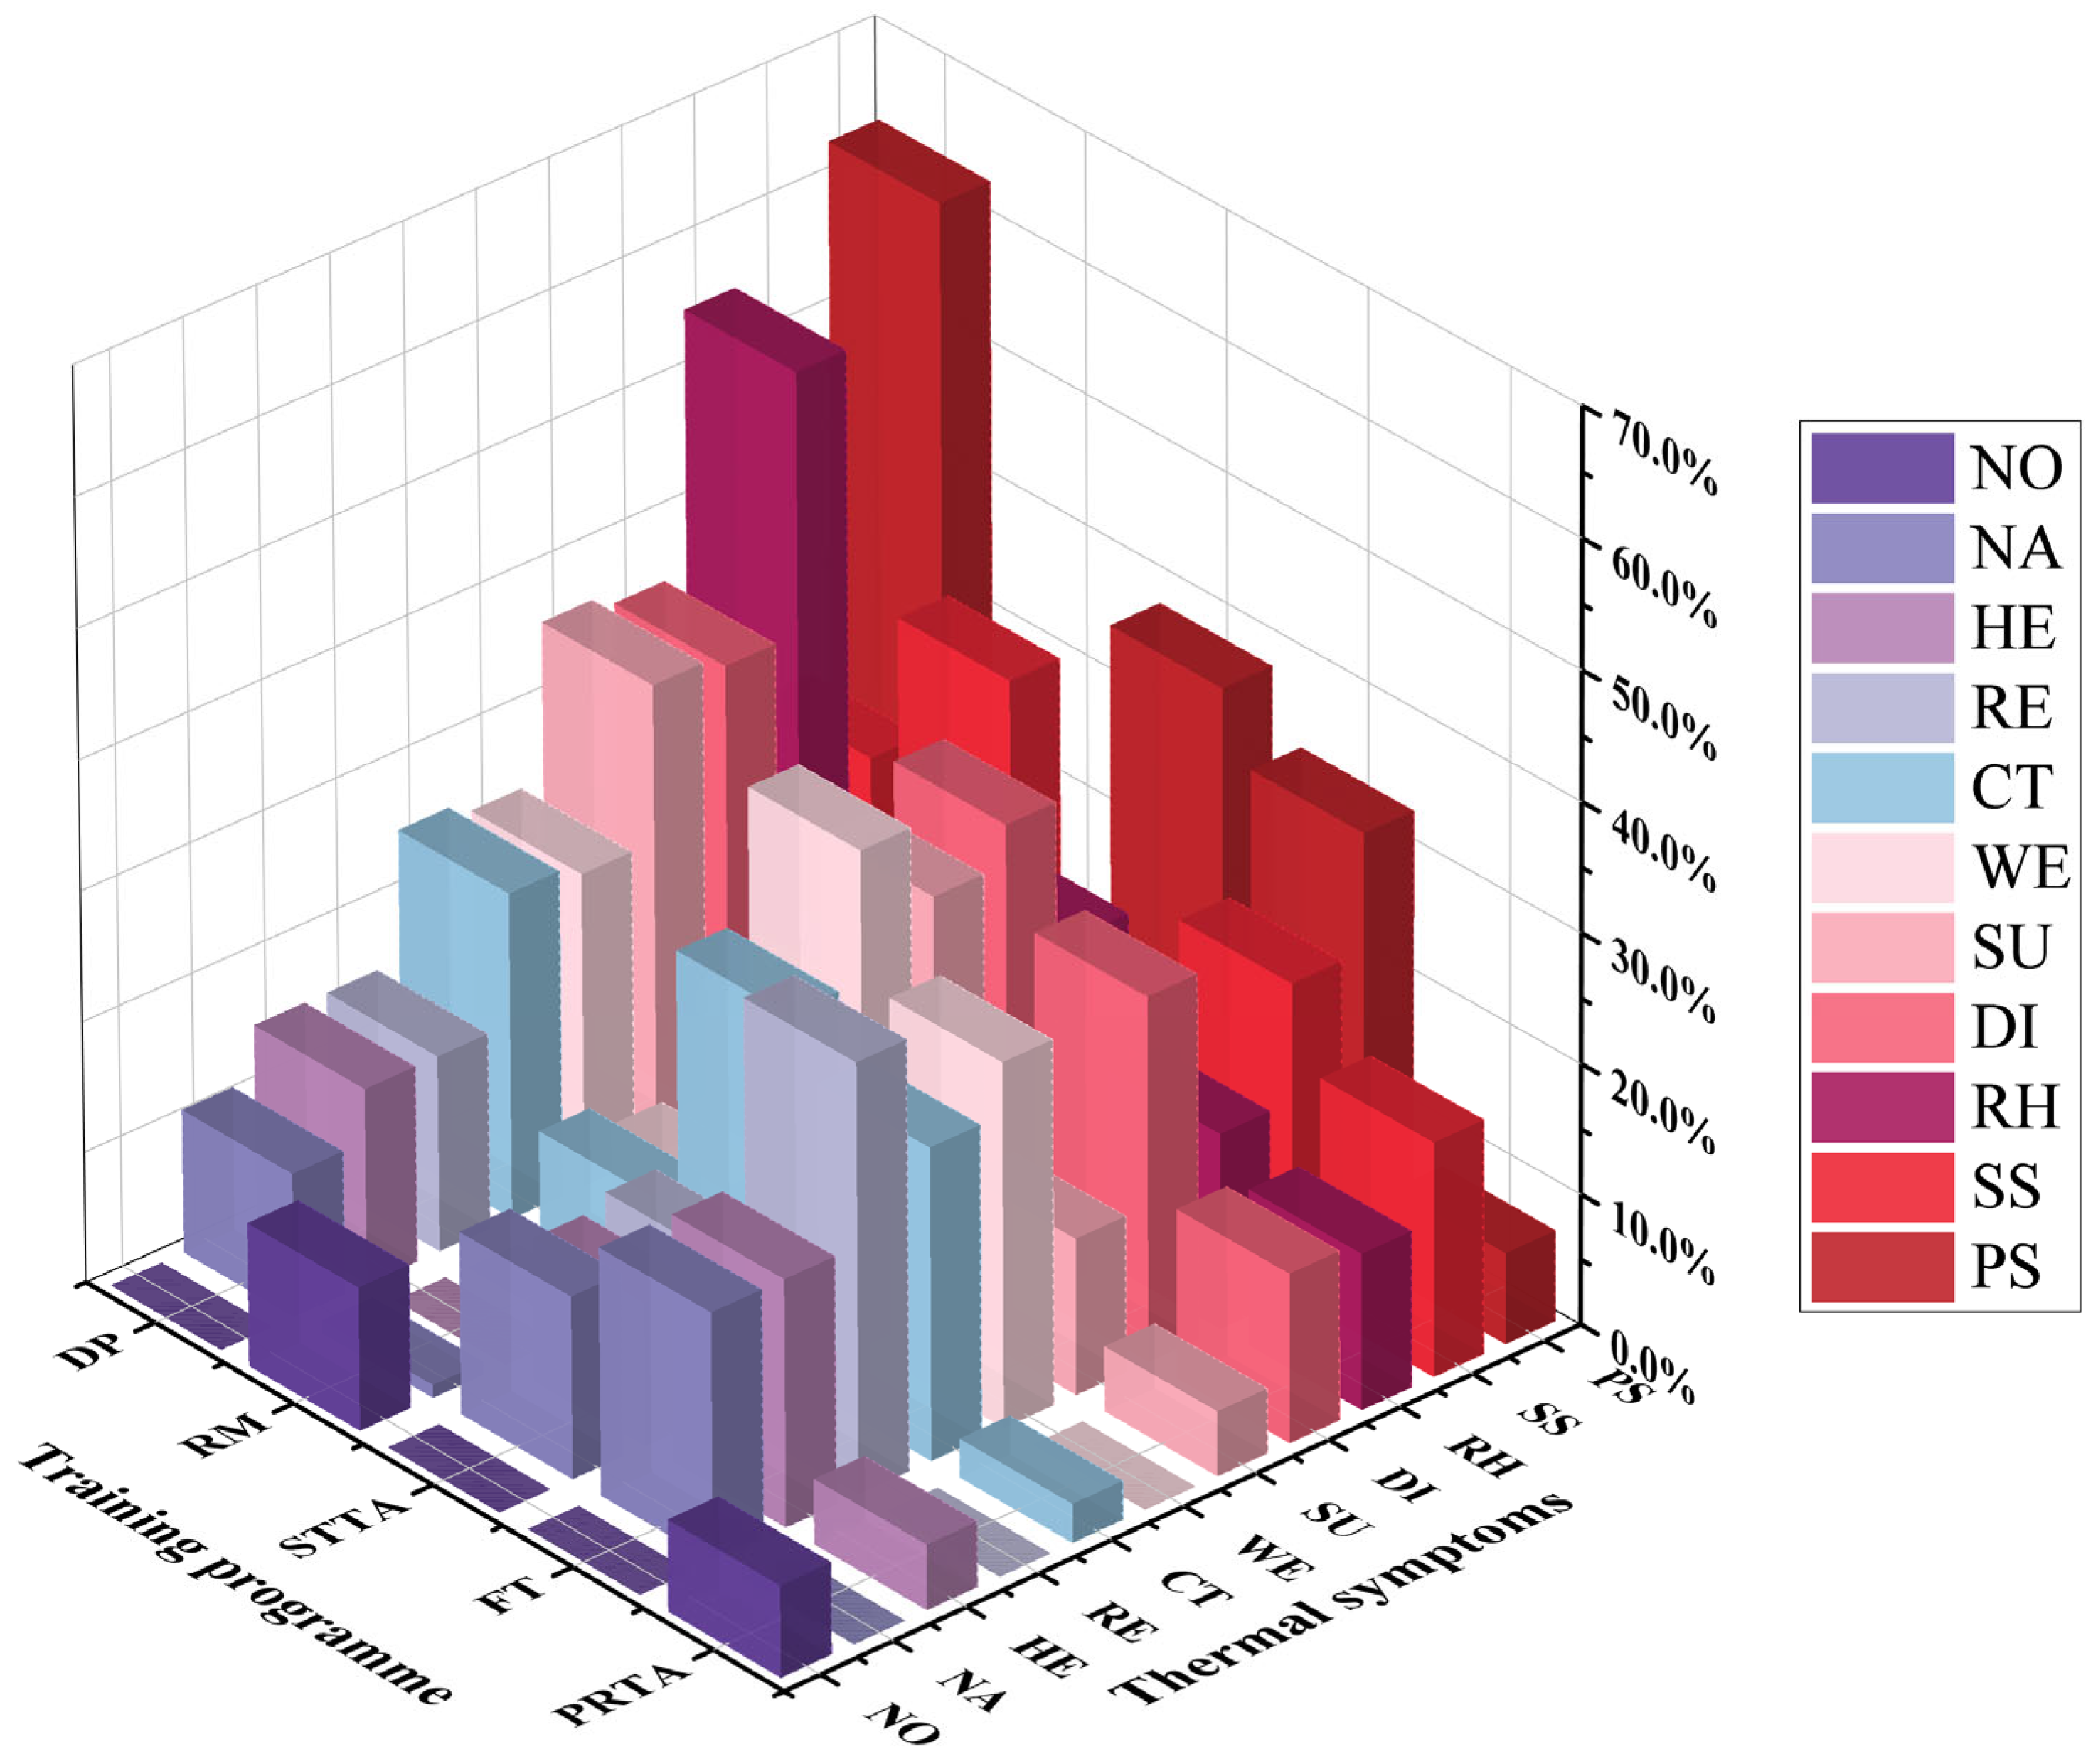
3.1.3. The Distribution of Thermal Symptoms
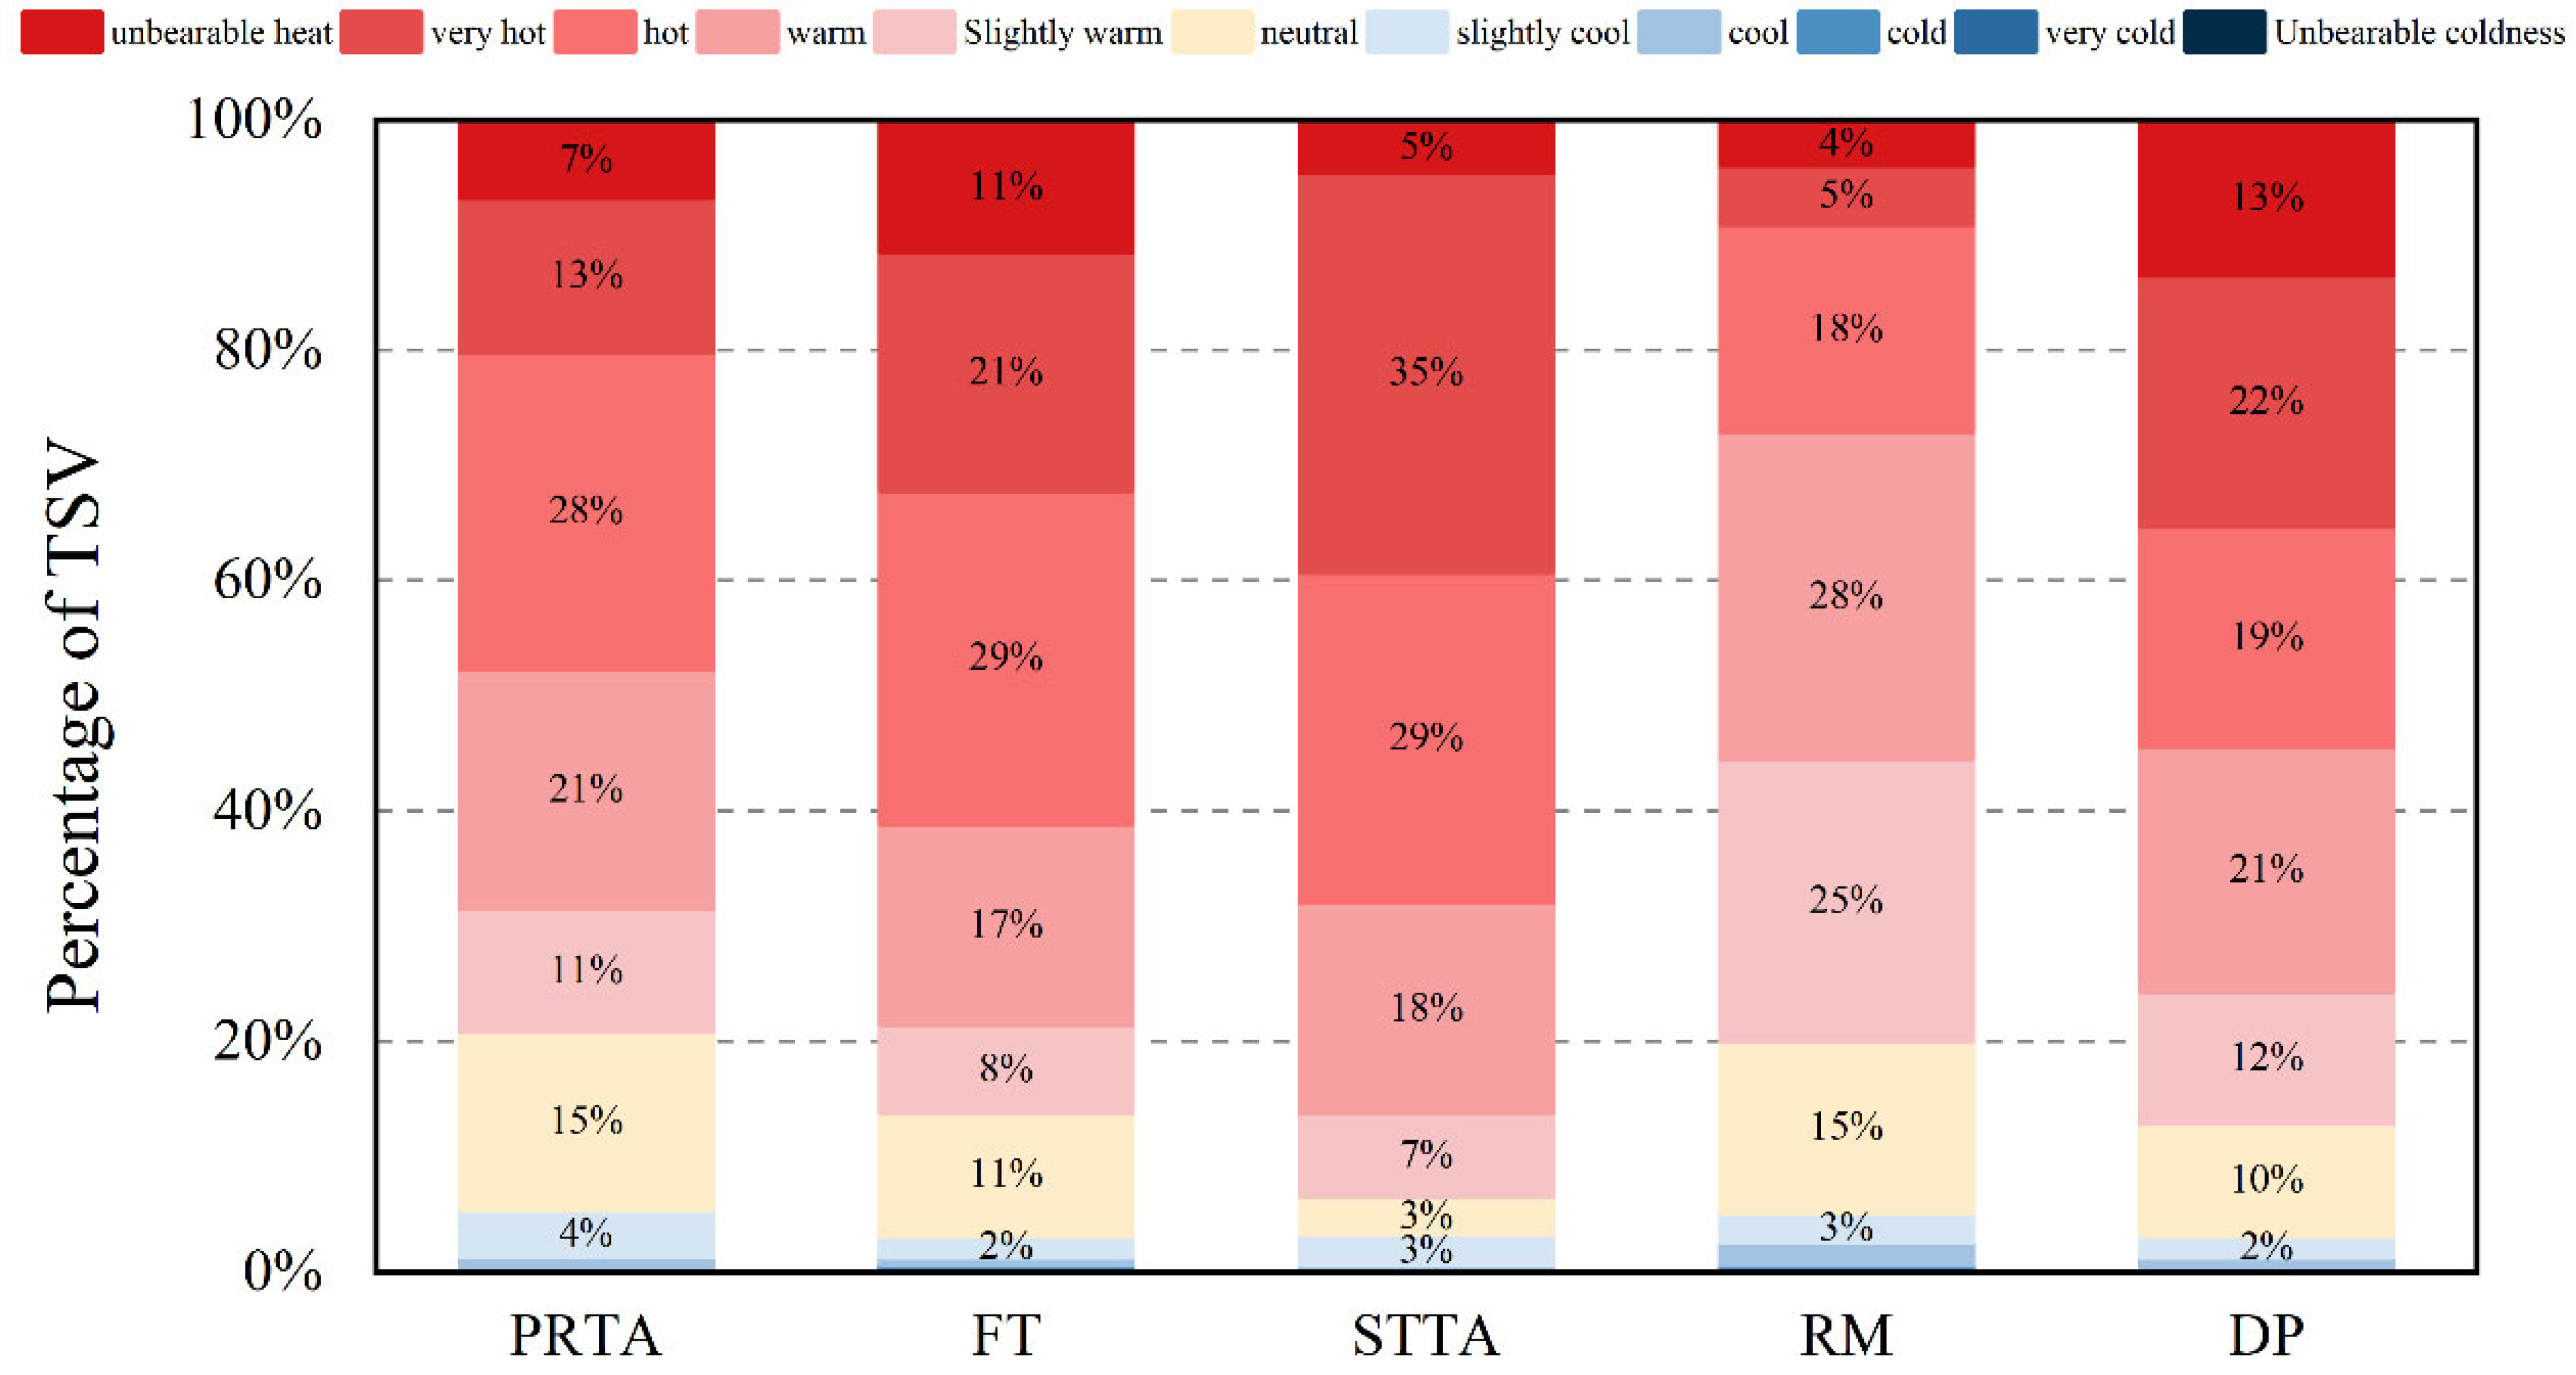
3.1.4. The Thermal Sensation Votes (TSV)
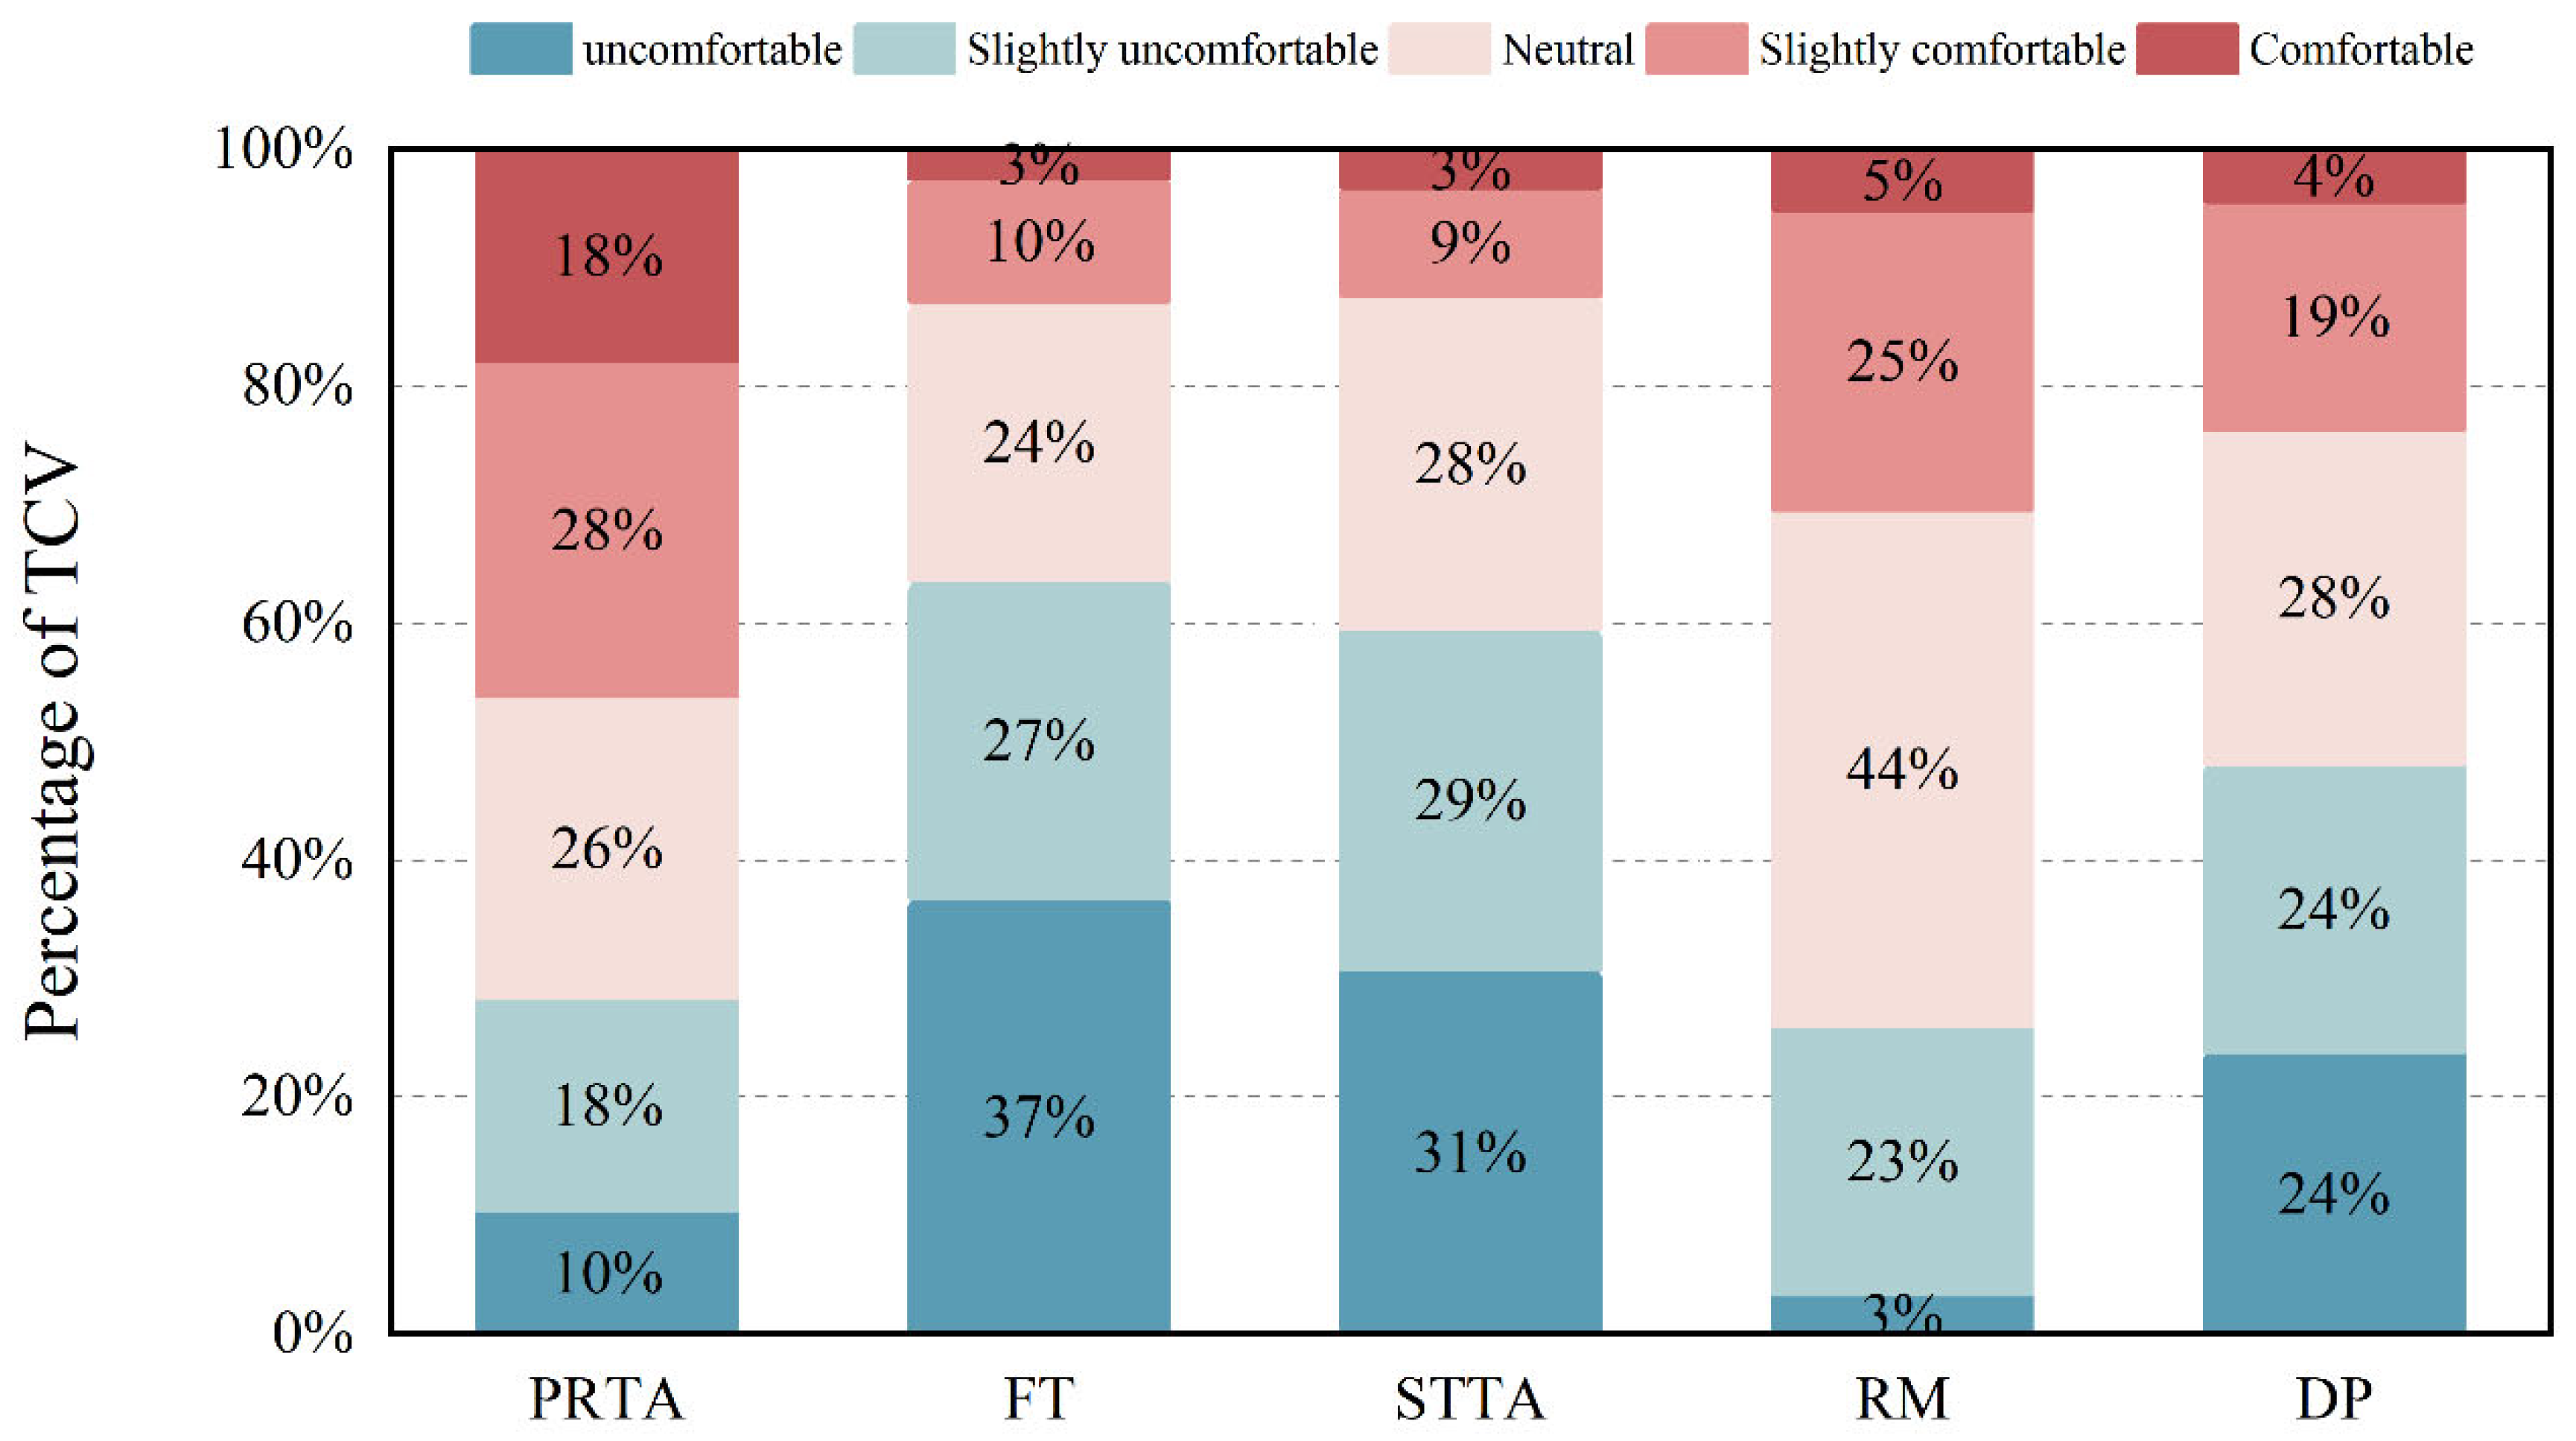
3.1.5. The Thermal Comfort Votes (TCV)
3.2. Outdoor Thermal Benchmarks
3.2.1. Neutral Temperature and Range
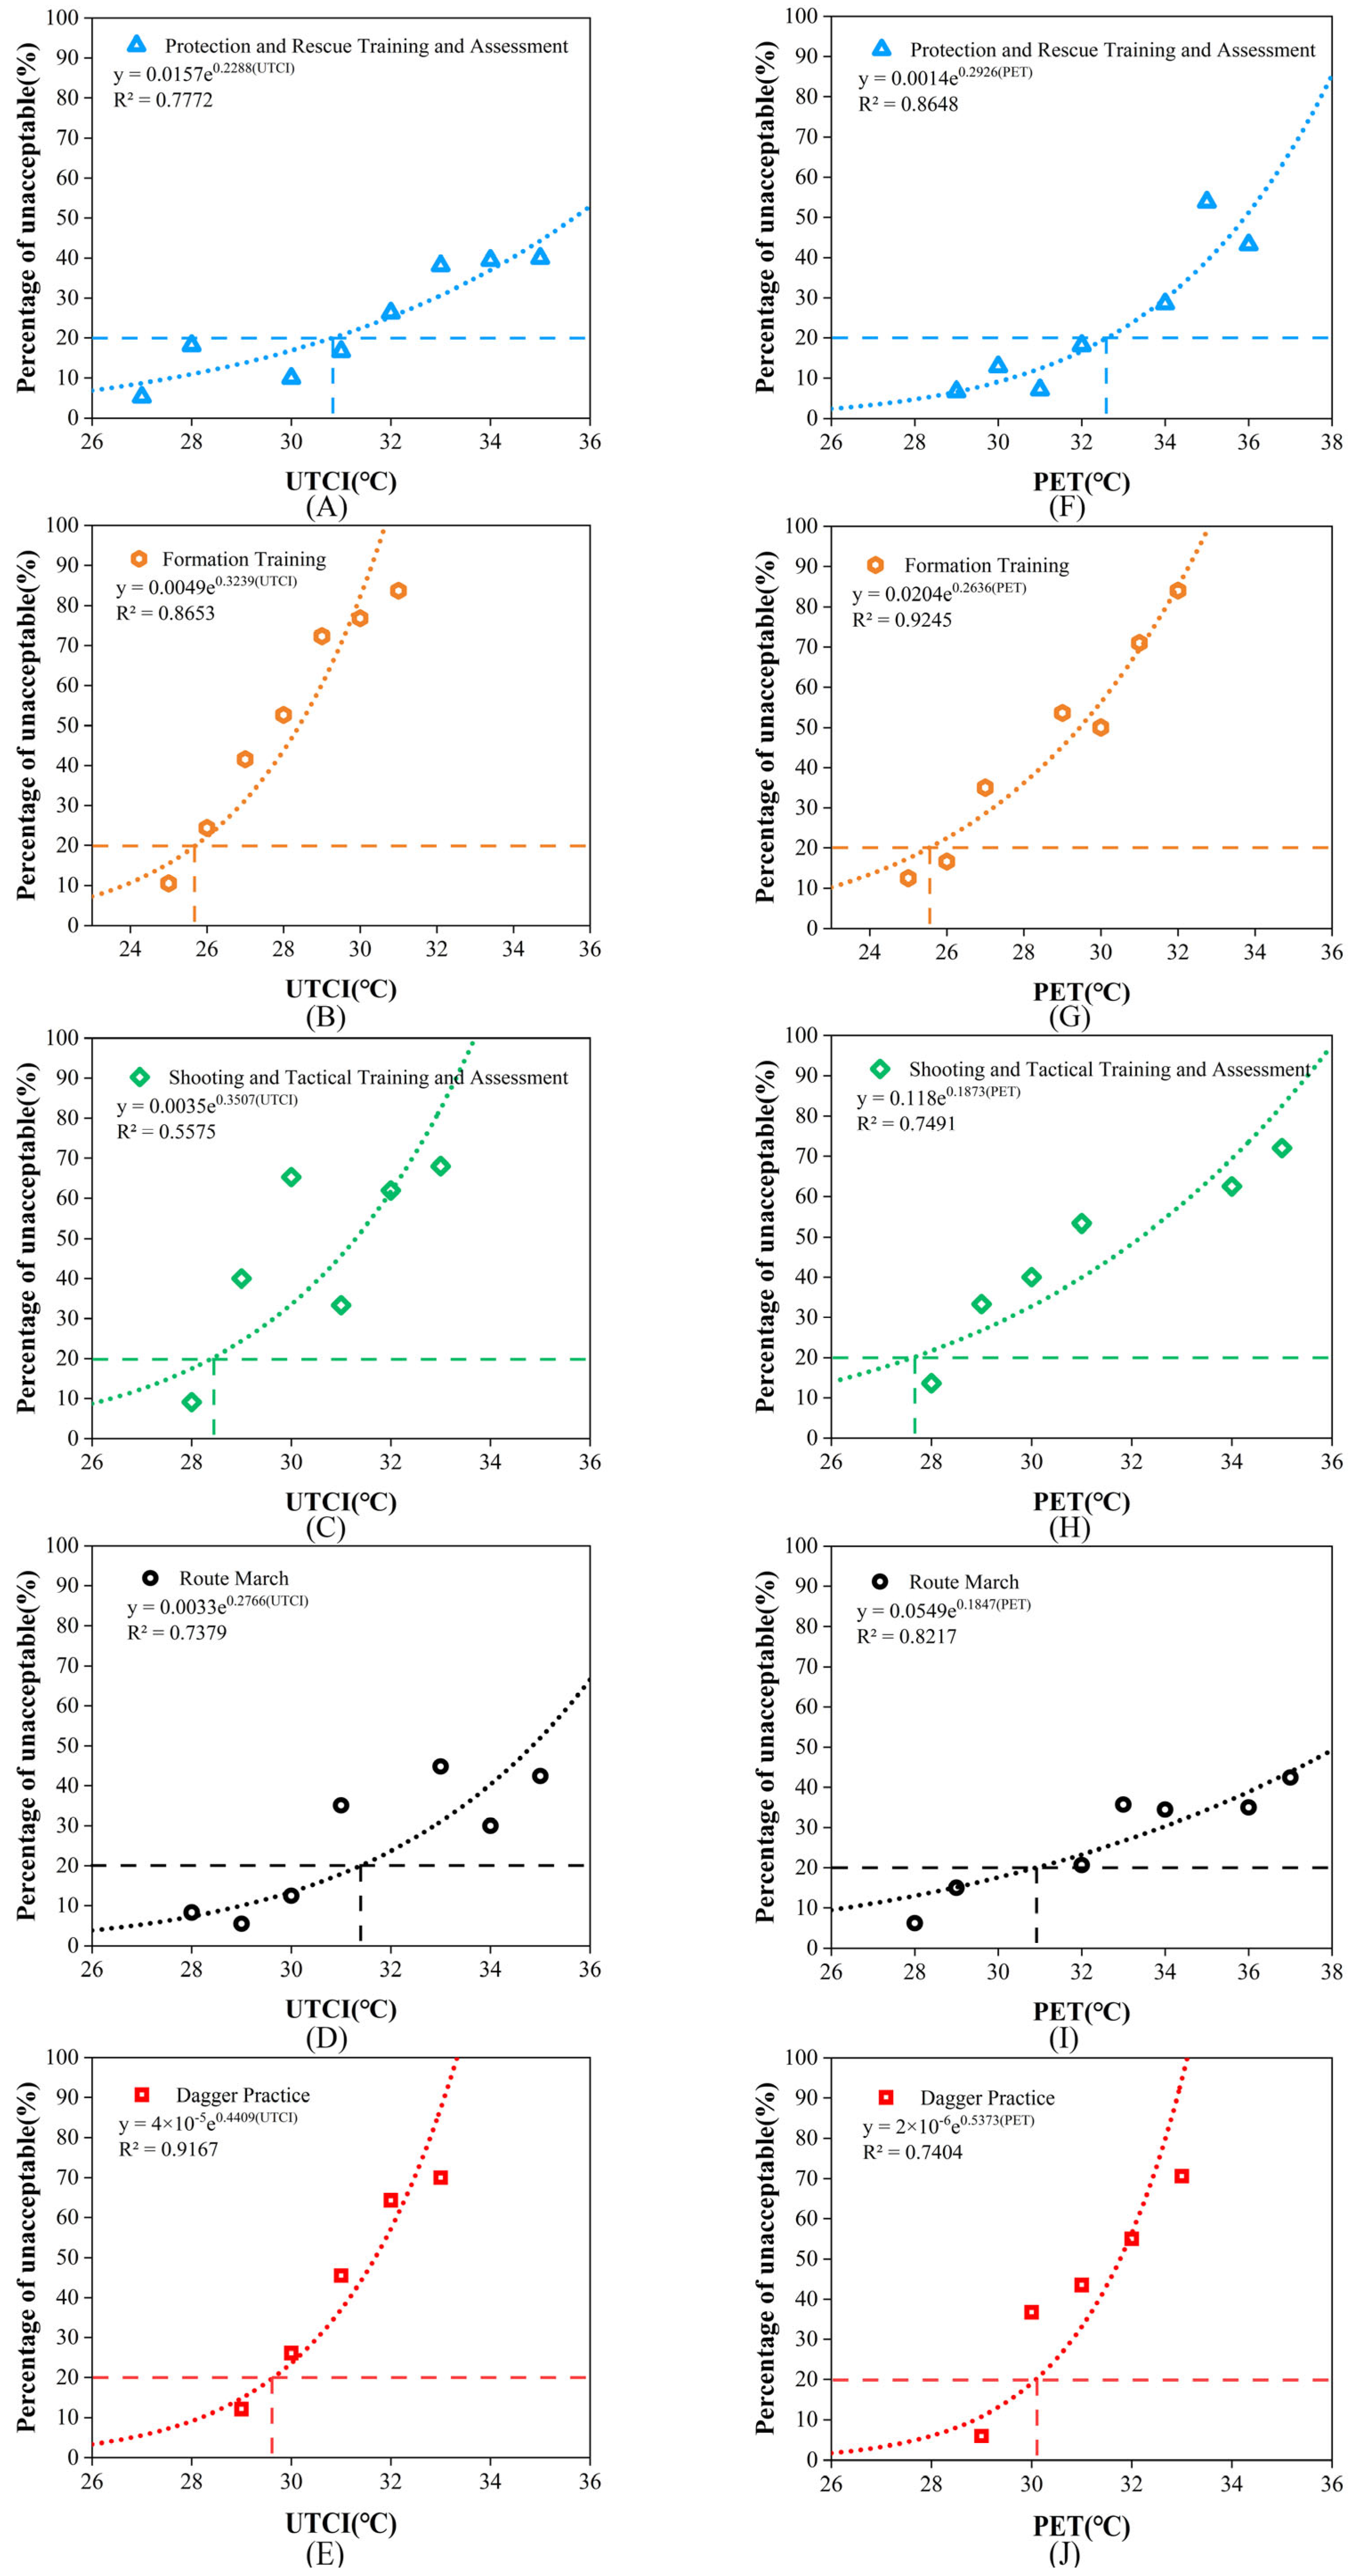
3.2.2. Thermal Sensation and Thermal Acceptability
4. Discussion
4.1. Factors Influencing Thermal Perception
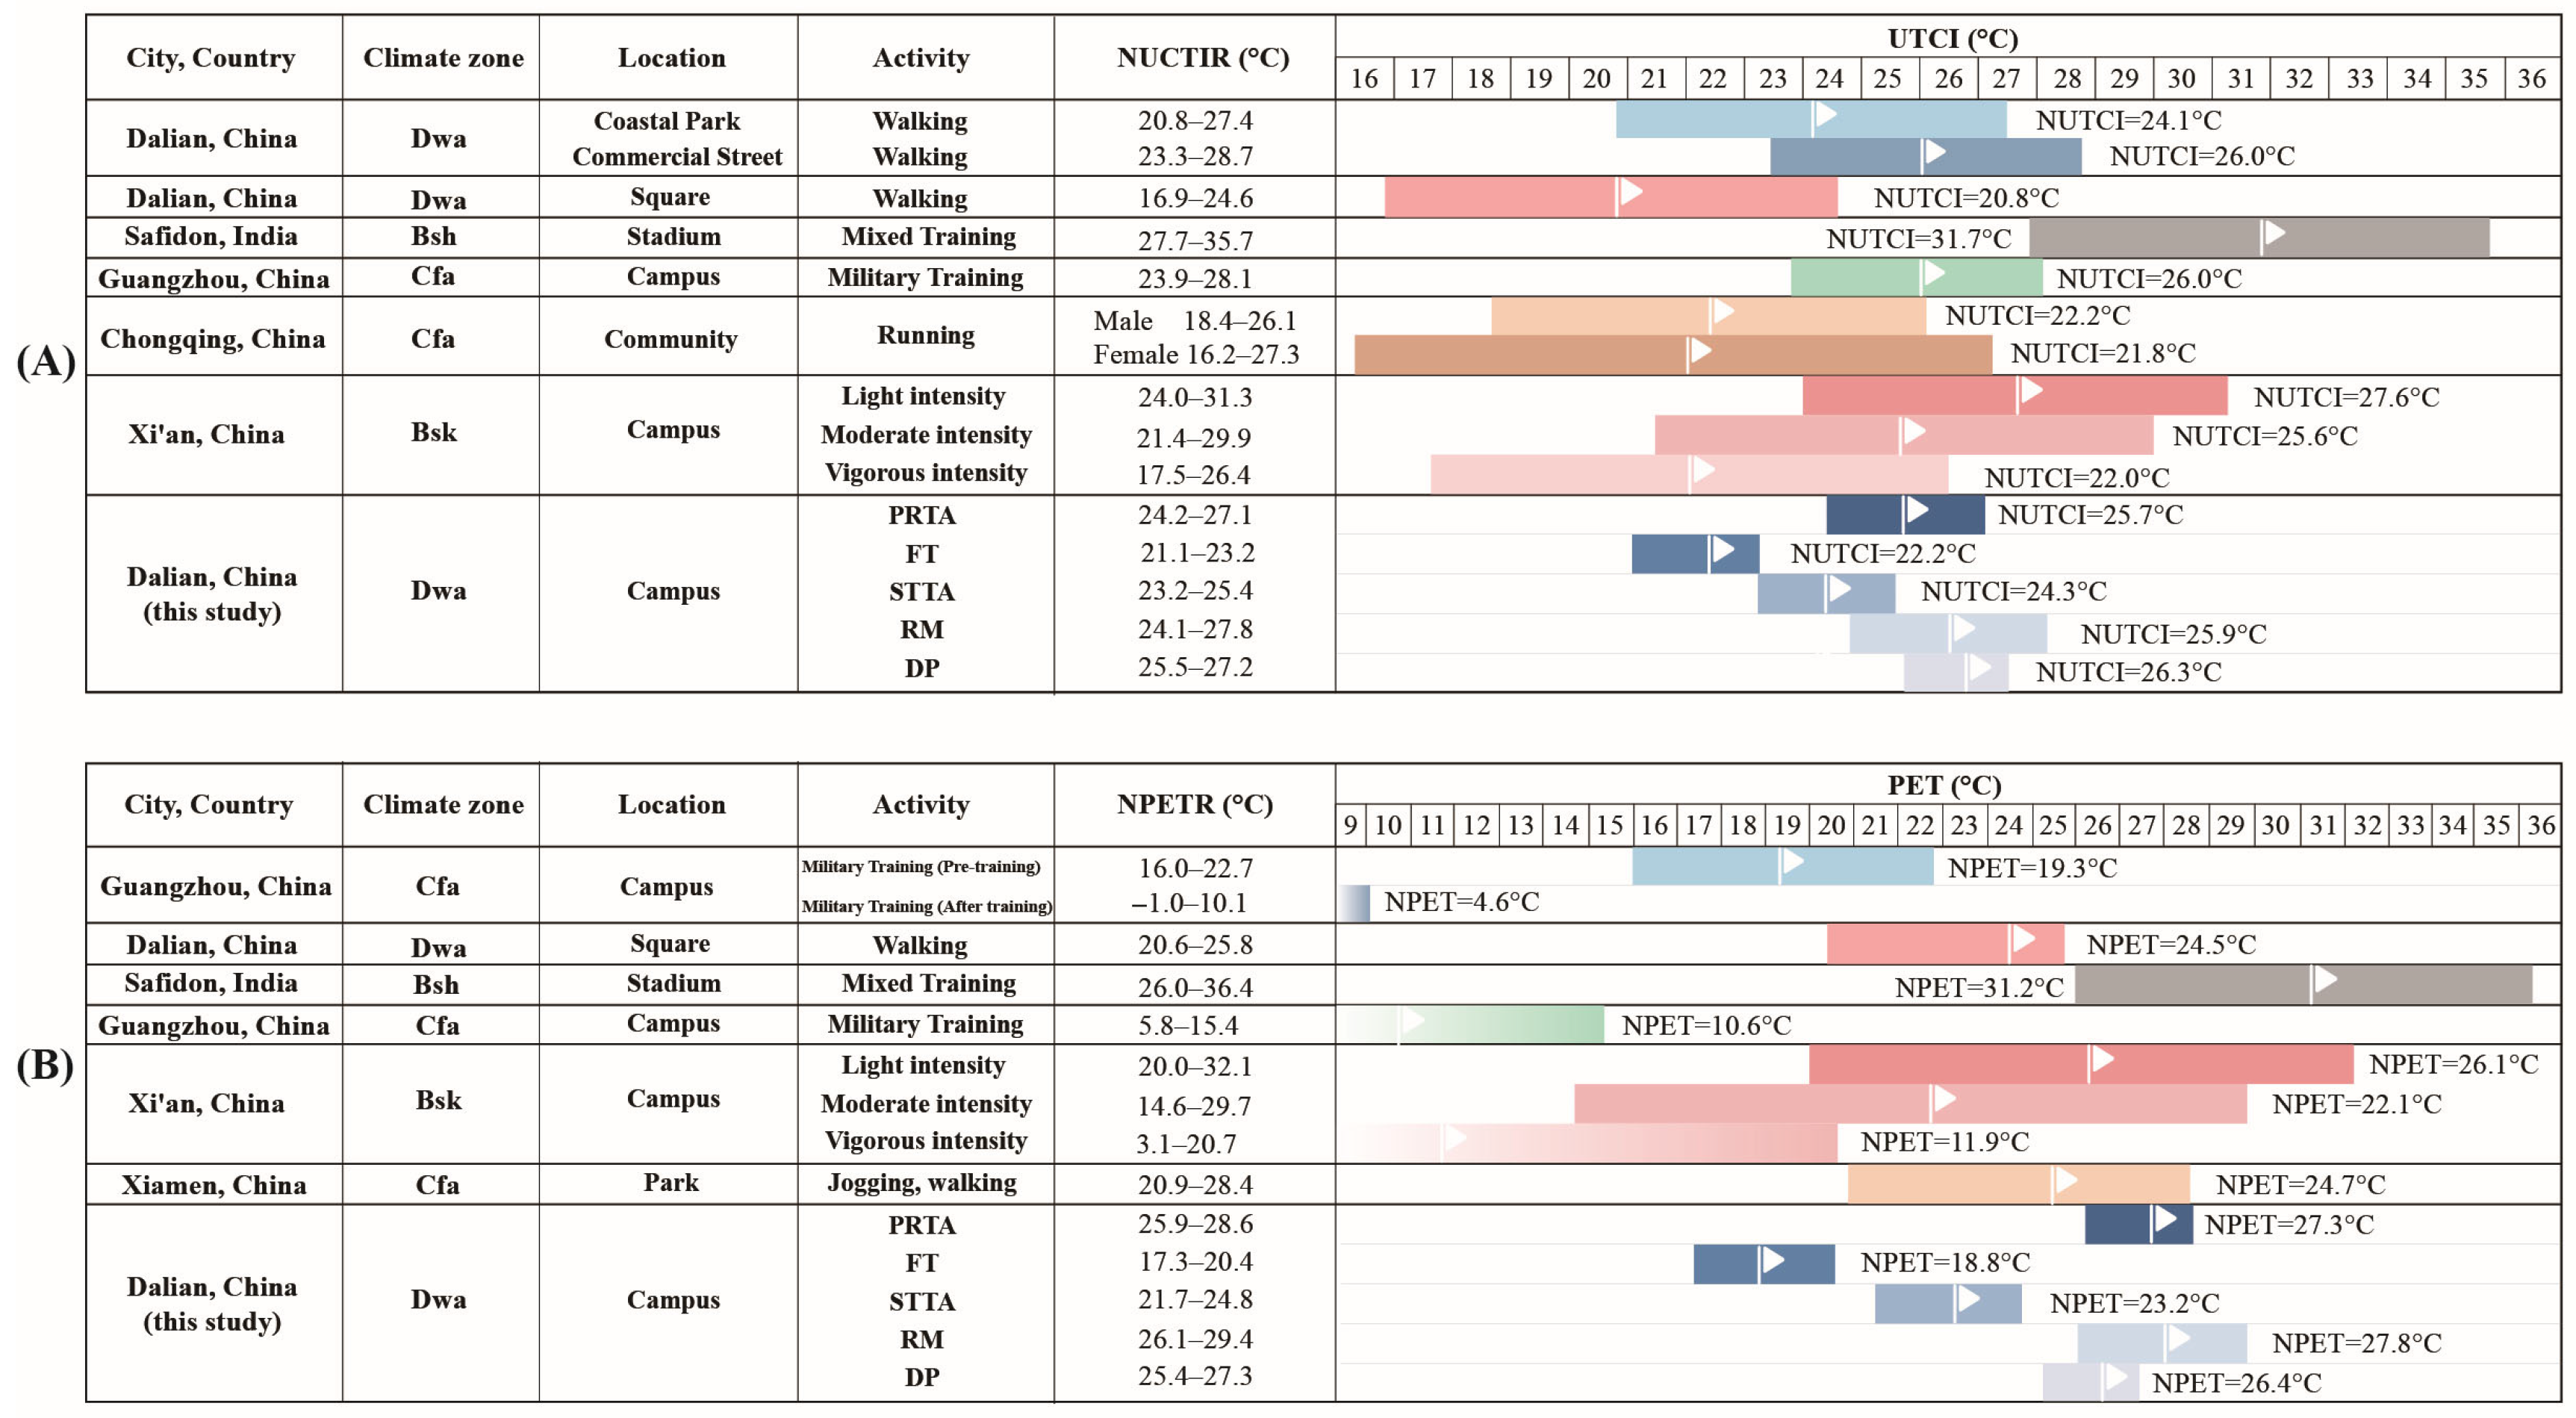
4.2. Differences in Thermal Benchmarks
4.3. Limitations and Prospects
5. Conclusions
Author Contributions
Funding
Institutional Review Board Statement
Informed Consent Statement
Data Availability Statement
Conflicts of Interest
Abbreviations
References
- IPCC. Short-Lived Climate Forcers. In Climate Change 2021—The Physical Science Basis: Working Group I Contribution to the Sixth Assessment Report of the Intergovernmental Panel on Climate Change; Cambridge University Press: Cambridge, UK, 2023; pp. 817–922. ISBN 9781009157889. [Google Scholar]
- Ogunbode, C.A.; Doran, R.; Böhm, G. Exposure to the IPCC Special Report on 1.5 °C Global Warming Is Linked to Perceived Threat and Increased Concern about Climate Change. Clim. Change 2020, 158, 361–375. [Google Scholar] [CrossRef]
- Li, Z.; Zhou, L.; Hong, X.; Qiu, S. Outdoor Thermal Comfort and Activities in Urban Parks: An Experiment Study in Humid Subtropical Climates. Build. Environ. 2024, 253, 111361. [Google Scholar] [CrossRef]
- Deng, Y.; Gan, D.; Tang, N.; Cai, Z.; Li, X.; Chen, S.; Li, X. Research on Outdoor Thermal Comfort and Activities in Residential Areas in Subtropical China. Atmosphere 2022, 13, 1357. [Google Scholar] [CrossRef]
- Nunes, A.; Vieira, M.I.; Fernandes, P.O. Is There a Gender Relationship Between Outdoor Activities and Well-Being? Empirical Study in Northern Portugal. Smart Innov. Syst. Technol. 2023, 320, 451–462. [Google Scholar] [CrossRef]
- Amorim, A.; Labaki, L.; Maia, P.; Barros, T.; Marcelo, A. Occupational Exposure to Heat in Outdoor Activities in Building Constructions in Southeastern Brazil. Adv. Intell. Syst. Comput. 2020, 969, 393–403. [Google Scholar] [CrossRef]
- Chen, Y.; Tao, M.; Liu, W. High Temperature Impairs Cognitive Performance during a Moderate Intensity Activity. Build. Environ. 2020, 186, 107372. [Google Scholar] [CrossRef]
- Niu, J.; Hong, B.; Geng, Y.; Mi, J.; He, J. Summertime Physiological and Thermal Responses among Activity Levels in Campus Outdoor Spaces in a Humid Subtropical City. Sci. Total Environ. 2020, 728, 138757. [Google Scholar] [CrossRef]
- Adam-Poupart, A.; Smargiassi, A.; Busque, M.A.; Duguay, P.; Fournier, M.; Zayed, J.; Labrèche, F. Summer Outdoor Temperature and Occupational Heat-Related Illnesses in Quebec (Canada). Environ. Res. 2014, 134, 339–344. [Google Scholar] [CrossRef]
- Wang, W.; Ding, G.; Wang, Y.; Li, J. Field Study on the Effect of Space Type, Exercise Intensity, and Wet Bulb Globe Temperature on Thermal Responses of Exercisers. Build. Environ. 2022, 225, 109555. [Google Scholar] [CrossRef]
- Yao, W.; Li, X.; Cao, W.; Li, G.; Ren, L.; Gao, W. Research on the Influence of Indoor Thermal Environment and Activity Levels on Thermal Comfort in Protective Clothing. Energy Build. 2023, 279, 112681. [Google Scholar] [CrossRef]
- Flouris, A.D.; Cheung, S.S. Thermometry and Calorimetry Assessment of Sweat Response during Exercise in the Heat. Eur. J. Appl. Physiol. 2010, 108, 905–911. [Google Scholar] [CrossRef] [PubMed]
- Lin, Y.; Jin, Y.; Jin, H. Effects of Different Exercise Types on Outdoor Thermal Comfort in a Severe Cold City. J. Therm. Biol. 2022, 109, 103330. [Google Scholar] [CrossRef] [PubMed]
- Li, S.; Jia, X.; Cao, B.; Liu, B.; Zhu, Y. Thermal Comfort Characteristics and Heating Demand of People with Different Activity Status during Extremely Cold Exposure. Build. Environ. 2023, 228, 109798. [Google Scholar] [CrossRef]
- Martin, K.; Périard, J.; Rattray, B.; Pyne, D.B. Physiological Factors Which Influence Cognitive Performance in Military Personnel. Hum. Factors 2020, 62, 93–123. [Google Scholar] [CrossRef] [PubMed]
- Yasmeen, S.; Liu, H.; Wu, Y.; Li, B. Physiological Responses of Acclimatized Construction Workers during Different Work Patterns in a Hot and Humid Subtropical Area of China. J. Build. Eng. 2020, 30, 101281. [Google Scholar] [CrossRef]
- Herdt, A.J.; Brown, R.D.; Scott-Fleming, I.; Cao, G.; MacDonald, M.; Henderson, D.; Vanos, J.K. Outdoor Thermal Comfort during Anomalous Heat at the 2015 Pan American Games in Toronto, Canada. Atmosphere 2018, 9, 321. [Google Scholar] [CrossRef]
- Liu, L.; Tu, Y.; Xu, T. Physical Training Evaluation Method for College Students Based on Analytic Hierarchy Process. In Proceedings of the 2019 4th International Conference on Mechanical, Control and Computer Engineering, ICMCCE 2019, Hohhot, China, 25–27 October 2019; pp. 715–720. [Google Scholar] [CrossRef]
- Fang, Z.; Xu, X.; Zhou, X.; Deng, S.; Wu, H.; Liu, J.; Lin, Z. Investigation into the Thermal Comfort of University Students Conducting Outdoor Training. Build. Environ. 2019, 149, 26–38. [Google Scholar] [CrossRef]
- Kreija-Gaikste, S.; Katane, I. Theoretical and Legal Basis of Young People’s Military Career in the Field of National Defence. Res. Rural. Dev. 2020, 35, 288–295. [Google Scholar] [CrossRef]
- Chai, L.Y.A.; Ong, K.C.; Kee, A.; Earnest, A.; Lim, F.C.L.; Wong, J.C.M. A Prospective Cohort Study on the Impact of a Modified Basic Military Training (MBMT) Programme Based on Pre-Enlistment Fitness Stratification amongst Asian Military Enlistees. Ann. Acad. Med. Singap. 2009, 38, 862–868. [Google Scholar] [CrossRef]
- Choi, B.O. The Future of the Korean Military Service System: Direction and Challenge for New Korean Military Service System Innovation. Korean J. Def. Anal. 2021, 33, 481–505. [Google Scholar] [CrossRef]
- Crecente, F.; Sarabia, M.; Teresa del Val, M. The Hidden Link between Entrepreneurship and Military Education. Technol. Forecast Soc. Change 2021, 163, 120429. [Google Scholar] [CrossRef]
- Rosman-Stollman, E. Military Service as Bargaining: The Case of Religious Women Soldiers in Israel. Politics Relig. Ideol. 2018, 19, 158–175. [Google Scholar] [CrossRef]
- De Pedro, K.T.; Astor, R.A.; Gilreath, T.D.; Benbenishty, R.; Berkowitz, R. School Climate, Deployment, and Mental Health Among Students in Military-Connected Schools. Youth Soc. 2015, 50, 93–115. [Google Scholar] [CrossRef]
- Kelly, D.R.; Matthews, M.D.; Bartone, P.T. Grit and Hardiness as Predictors of Performance among West Point Cadets. Mil. Psychol. 2014, 26, 327–342. [Google Scholar] [CrossRef]
- Lu, Y. Military Training Models for College Students in Yunnan Frontiers from the Perspective of Peer Education. In Proceedings of the 2021 2nd International Conference on Computers, Information Processing and Advanced Education, Ottawa, ON, Canada, 25–27 May 2021; pp. 905–907. [Google Scholar] [CrossRef]
- Ren, L.; Shi, J. A Discussion on the Incorporation of National Defense Education Factors into College Physical Education. Appl. Mech. Mater. 2011, 66–68, 1976–1981. [Google Scholar] [CrossRef]
- Zhou, B.; Jiao, B.; Chen, B.; Sun, C.; Ding, L.; Ao, Y. Physiological and Perceptual Responses of Exposure to Different Thermal Environments at Low Pressure (61.6 KPa). Build. Environ. 2022, 226, 109774. [Google Scholar] [CrossRef]
- Yang, B.; Bai, L.; Li, Z.; Guo, M.; Hong, B. Comparative Analysis of Thermal and Visual Comfort Perceptions of Outdoor Military Training of University Students. Urban Clim. 2025, 61, 102418. [Google Scholar] [CrossRef]
- Shen, Y.H.; Zheng, J.W.; Zhang, Z.B.; Li, C.M. Design and Implementation of a Wearable, Multiparameter Physiological Monitoring System for the Study of Human Heat Stress, Cold Stress, and Thermal Comfort. Instrum. Sci. Technol. 2012, 40, 290–304. [Google Scholar] [CrossRef]
- Bekele, W.W. Thermo-Physiological Comfort Property of Military Combat Boot Material for Hot and Cold Climatic Conditions. Adv. Mater. Sci. Eng. 2023, 2023, 8924583. [Google Scholar] [CrossRef]
- Wang, C. Study on the Organic Integration of High Intensity Interval Training Regime and Physical Fitness Training of Special Operation Forces. Lect. Notes Electr. Eng. 2020, 645, 857–865. [Google Scholar] [CrossRef]
- Vonkdarunee, M.; Chandarasupsang, T.; Chakpitak, N. Continuing Education for New Generation of Higher Military Education. In Proceedings of the SKIMA 2010—Proceedings of the 4th International Conference on Software, Knowledge, Information Management and Applications: “Towards Happiness and Sustainable Development”, Paro, Bhutan, 25–27 August 2010; pp. 298–304. [Google Scholar]
- Huang, C.; Que, J.; Liu, Q.; Zhang, Y. On the Gym Air Temperature Supporting Exercise and Comfort. Build. Environ. 2021, 206, 108313. [Google Scholar] [CrossRef]
- Fang, Z.; Feng, X.; Liu, J.; Lin, Z.; Mak, C.M.; Niu, J.; Tse, K.-T.; Xu, X. Investigation into the Differences among Several Outdoor Thermal Comfort Indices against Field Survey in Subtropics. Sustain. Cities Soc. 2019, 44, 676–690. [Google Scholar] [CrossRef]
- Beck, H.E.; Zimmermann, N.E.; McVicar, T.R.; Vergopolan, N.; Berg, A.; Wood, E.F. Present and Future Köppen-Geiger Climate Classification Maps at 1-Km Resolution. Sci. Data 2018, 5, 1–12. [Google Scholar] [CrossRef]
- ISO 7726:1998; Ergonomics of the Thermal Environment-Instruments for Measuring Physical Quantities. ISO: Geneva, Switzerland, 1998; pp. 1–60.
- Segal, A.D.; Klute, G.K. Residual Limb Skin Temperature and Thermal Comfort in People with Amputation during Activity in a Cold Environment. J. Rehabil. Res. Dev. 2016, 53, 619–628. [Google Scholar] [CrossRef]
- ANSI/ASHRAE Standard 55-2020; Thermal Environmental Conditions for Human Occupancy; ANSI: Washington, DC, USA; ASHRAE: Atlanta, GA, USA, 2020.
- Zare, S.; Shirvan, H.E.; Hemmatjo, R.; Nadri, F.; Jahani, Y.; Jamshidzadeh, K.; Paydar, P. A Comparison of the Correlation between Heat Stress Indices (UTCI, WBGT, WBDT, TSI) and Physiological Parameters of Workers in Iran. Weather. Clim. Extrem. 2019, 26, 100213. [Google Scholar] [CrossRef]
- Lai, D.; Lian, Z.; Liu, W.; Guo, C.; Liu, W.; Liu, K.; Chen, Q. A Comprehensive Review of Thermal Comfort Studies in Urban Open Spaces. Sci. Total Environ. 2020, 742, 140092. [Google Scholar] [CrossRef] [PubMed]
- Nie, T.; Lai, D.; Liu, K.; Lian, Z.; Yuan, Y.; Sun, L. Discussion on Inapplicability of Universal Thermal Climate Index (UTCI) for Outdoor Thermal Comfort in Cold Region. Urban Clim. 2022, 46, 101304. [Google Scholar] [CrossRef]
- Zafarmandi, S.; Matzarakis, A.; Norford, L. Effects of Clothing’s Thermal Insulation on Outdoor Thermal Comfort and Thermal Sensation: A Case Study in Tehran, Iran. Sustain. Cities Soc. 2024, 100, 104988. [Google Scholar] [CrossRef]
- Lai, D.; Guo, D.; Hou, Y.; Lin, C.; Chen, Q. Studies of Outdoor Thermal Comfort in Northern China. Build. Environ. 2014, 77, 110–118. [Google Scholar] [CrossRef]
- Lin, T.P.; Yang, S.R.; Chen, Y.C.; Matzarakis, A. The Potential of a Modified Physiologically Equivalent Temperature (MPET) Based on Local Thermal Comfort Perception in Hot and Humid Regions. Theor. Appl. Clim. 2019, 135, 873–876. [Google Scholar] [CrossRef]
- Dufour, J.S.; Reiter, A.; Cox, C.; Weston, E.B.; Markey, M.; Turner, A.; Le, P.; Aurand, A.M.; Simmons, S.; Altman, L.; et al. Motion Sickness Decreases Low Back Function and Changes Gene Expression in Military Aircrew. Clin. Biomech. 2022, 96, 105671. [Google Scholar] [CrossRef] [PubMed]
- Yang, F.; Underdahl, M.; Yang, H.; Yang, C. Effects of Vibration Intensity on Lower Limb Joint Moments during Standing. J. Biomech. 2019, 88, 18–24. [Google Scholar] [CrossRef]
- Cheung, P.K.; Jim, C.Y. Determination and Application of Outdoor Thermal Benchmarks. Build. Environ. 2017, 123, 333–350. [Google Scholar] [CrossRef]
- Krüger, E.; Drach, P.; Emmanuel, R.; Corbella, O. Assessment of Daytime Outdoor Comfort Levels in and Outside the Urban Area of Glasgow, UK. Int. J. Biometeorol. 2013, 57, 521–533. [Google Scholar] [CrossRef]
- Zhang, H.; Guo, F.; Liu, K.; Wang, J.; Dong, J.; Zhu, P. Spatial Differences in Thermal Comfort in Summer in Coastal Areas: A Study on Dalian, China. Front. Public. Health 2022, 10, 1024757. [Google Scholar] [CrossRef]
- Yin, J.F.; Zheng, Y.F.; Wu, R.J.; Tan, J.G.; Ye, D.X.; Wang, W. An Analysis of Influential Factors on Outdoor Thermal Comfort in Summer. Int. J. Biometeorol. 2012, 56, 941–948. [Google Scholar] [CrossRef] [PubMed]
- Liu, K.; Gan, T.; Liu, W.; Lai, D.; Liu, G. Influences of Different Meteorological Parameters on Outdoor Thermal Comfort in Cold Climate Regions in China. Environ. Sci. Eng. 2020, 11, 725–734. [Google Scholar] [CrossRef]
- Chen, X.; Xue, P.; Liu, L.; Gao, L.; Liu, J. Outdoor Thermal Comfort and Adaptation in Severe Cold Area: A Longitudinal Survey in Harbin, China. Build. Environ. 2018, 143, 548–560. [Google Scholar] [CrossRef]
- Gu, H.; Hu, Q.; Zhu, D.; Diao, J.; Liu, Y.; Fang, M. Research on Outdoor Thermal Comfort of Children’s Activity Space in High-Density Urban Residential Areas of Chongqing in Summer. Atmosphere 2022, 13, 2016. [Google Scholar] [CrossRef]
- Zhang, H.; Wang, Y.; Guo, F.; Zhao, J.; Dong, J.; Zhu, P. Factors Influencing Outdoor Thermal Comfort in a Coastal Park during the Transition Seasons in Cold Regions of China. Urban Clim. 2024, 55, 101856. [Google Scholar] [CrossRef]
- Simas, V.; Schram, B.; Canetti, E.F.D.; Maupin, D.; Orr, R. Factors Influencing Marksmanship in Police Officers: A Narrative Review. Int. J. Environ. Res. Public. Health 2022, 19, 14236. [Google Scholar] [CrossRef]
- Tang, T.; Zhou, X.; Zhang, Y.; Feng, X.; Liu, W.; Fang, Z.; Zheng, Z. Investigation into the Thermal Comfort and Physiological Adaptability of Outdoor Physical Training in College Students. Sci. Total Environ. 2022, 839, 155979. [Google Scholar] [CrossRef] [PubMed]
- Kumar, P.; Sharma, A. Assessing the Outdoor Thermal Comfort Conditions of Exercising People in the Semi-Arid Region of India. Sustain. Cities Soc. 2022, 76, 103366. [Google Scholar] [CrossRef]
- An, L.; Hong, B.; Cui, X.; Geng, Y.; Ma, X. Outdoor Thermal Comfort during Winter in China’s Cold Regions: A Comparative Study. Sci. Total Environ. 2021, 768, 144464. [Google Scholar] [CrossRef] [PubMed]
- Hadianpour, M.; Mahdavinejad, M.; Bemanian, M.; Haghshenas, M.; Kordjamshidi, M. Effects of Windward and Leeward Wind Directions on Outdoor Thermal and Wind Sensation in Tehran. Build. Environ. 2019, 150, 164–180. [Google Scholar] [CrossRef]
- Mi, J.; Hong, B.; Zhang, T.; Huang, B.; Niu, J. Outdoor Thermal Benchmarks and Their Application to Climate-responsive Designs of Residential Open Spaces in a Cold Region of China. Build. Environ. 2020, 169, 106592. [Google Scholar] [CrossRef]
- Qin, H.; Cheng, X.; Han, G.; Wang, Y.; Deng, J.; Yang, Y. How Thermal Conditions Affect the Spatial-Temporal Distribution of Visitors in Urban Parks: A Case Study in Chongqing, China. Urban Urban Green. 2021, 66, 127393. [Google Scholar] [CrossRef]
- Su, Y.; Wang, C.; Li, Z.; Meng, Q.; Gong, A.; Wu, Z.; Zhao, Q. Summer Outdoor Thermal Comfort Assessment in City Squares—A Case Study of Cold Dry Winter, Hot Summer Climate Zone. Sustain. Cities Soc. 2024, 101, 105062. [Google Scholar] [CrossRef]
- Yin, Q.; Cao, Y.; Sun, C. Research on Outdoor Thermal Comfort of High-Density Urban Center in Severe Cold Area. Build. Environ. 2021, 200, 107938. [Google Scholar] [CrossRef]
- Kenawy, I.; Elkadi, H. The Outdoor Thermal Benchmarks in Melbourne Urban Climate. Sustain. Cities Soc. 2018, 43, 587–600. [Google Scholar] [CrossRef]


| Parameter | Instrument | Range | Precision | Manufacturer Information |
|---|---|---|---|---|
| Air Temperature (Ta) | HOBO MX2301 | −40–0 °C 0–70 °C | ±0.25 °C ±0.2 °C | Onset HOBO, Bourne, MA, USA |
| Relative Humidity (RH) | HOBO MX2301 | 0–10% 10–90% 90–100% | ±5% RH ±2.5% RH ±5% RH | Onset HOBO, Bourne, MA, USA |
| Air Velocity (Va) | Kestrel 5500 | 0.1–9.99 m/s 10.0–20.0 m/s | +(0.05 m/s + 5% readout) +(5% readout) | Kestrel Meters, Boothwyn, PA, USA |
| Globe Temperature (Tg) | Delta OHM HD 32.3TC | −30–120 °C | ±0.1 °C | Delta OHM, Parma, Italy |
| Global Radiation (G) | Delta OHM HD2102.2 | 0.01 W/m2–199.99 × 103 W/m2 | ±5% W/m2 | Delta OHM, Parma, Italy |
| Sex | Number | Age (Years) | Height (m) | Weight (kg) | BMI (kg/m2) |
|---|---|---|---|---|---|
| Male | 52 | 19.35 | 1.75 | 70.80 | 23.12 |
| Female | 97 | 19.48 | 1.63 | 52.61 | 19.75 |
| Male + female | 149 | 19.44 | 1.67 | 58.96 | 20.92 |
| range | 17–22 | 1.55–1.85 | 47.1–86.1 | 19.11–31.07 | |
| Body Mass Index (BMI) = Mass/Height2 (kg/m2) | |||||
| Parameters | PRTA | FT | STTA | RM | DP |
|---|---|---|---|---|---|
| Ta (°C) | 29.87 | 27.27 | 27.66 | 28.75 | 28.71 |
| Tg (°C) | 33.88 | 32.71 | 33.71 | 32.86 | 37.30 |
| RH (%) | 61.82 | 47.55 | 65.01 | 68.40 | 59.27 |
| Va (m/s) | 0.50 | 1.35 | 0.58 | 0.54 | 1.44 |
| Iclo (clo) | 0.65 | 0.65 | 0.65 | 0.65 | 0.65 |
| Tmrt (°C) | 34.57 | 34.69 | 32.60 | 33.39 | 40.26 |
| G (W/m2) | 214.28 | 443.59 | 239.57 | 261.27 | 633.87 |
| UTCI (°C) | 30.82 | 27.44 | 29.60 | 31.31 | 30.42 |
| PET (°C) | 31.99 | 28.11 | 29.91 | 30.98 | 30.30 |
| Ta | RH | Va | Tg | Tmrt | G | |
|---|---|---|---|---|---|---|
| PRTA | 0.375 ** | −0.410 ** | 0.123 | 0.219 ** | 0.191 * | 0.255 ** |
| FT | 0.272 ** | −0.467 ** | 0.045 | 0.593 ** | 0.581 ** | 0.590 ** |
| STTA | 0.499 ** | −0.246 ** | 0.225 ** | 0.548 ** | 0.548 ** | 0.557 ** |
| RM | 0.649 ** | −0.421 ** | 0.090 | 0.546 ** | 0.580 ** | 0.577 ** |
| DP | 0.291 ** | −0.300 ** | 0.014 | 0.348 ** | 0.276 ** | 0.349 ** |
Disclaimer/Publisher’s Note: The statements, opinions and data contained in all publications are solely those of the individual author(s) and contributor(s) and not of MDPI and/or the editor(s). MDPI and/or the editor(s) disclaim responsibility for any injury to people or property resulting from any ideas, methods, instructions or products referred to in the content. |
© 2025 by the authors. Licensee MDPI, Basel, Switzerland. This article is an open access article distributed under the terms and conditions of the Creative Commons Attribution (CC BY) license (https://creativecommons.org/licenses/by/4.0/).
Share and Cite
Zhang, H.; You, L.; Chen, B.; Wang, Y.; Guo, F.; Zhu, P. A Study on Outdoor Thermal Comfort During Military Training for College Freshmen: A Survey in a Cold Region of China. Buildings 2025, 15, 2454. https://doi.org/10.3390/buildings15142454
Zhang H, You L, Chen B, Wang Y, Guo F, Zhu P. A Study on Outdoor Thermal Comfort During Military Training for College Freshmen: A Survey in a Cold Region of China. Buildings. 2025; 15(14):2454. https://doi.org/10.3390/buildings15142454
Chicago/Turabian StyleZhang, Hongchi, Liangshan You, Bingru Chen, Yuqiu Wang, Fei Guo, and Peisheng Zhu. 2025. "A Study on Outdoor Thermal Comfort During Military Training for College Freshmen: A Survey in a Cold Region of China" Buildings 15, no. 14: 2454. https://doi.org/10.3390/buildings15142454
APA StyleZhang, H., You, L., Chen, B., Wang, Y., Guo, F., & Zhu, P. (2025). A Study on Outdoor Thermal Comfort During Military Training for College Freshmen: A Survey in a Cold Region of China. Buildings, 15(14), 2454. https://doi.org/10.3390/buildings15142454