1. Introduction
Given the limited availability of land in China, coupled with a booming population and the swift rise of skyscrapers and massive bridges, conventional piling methods are no longer suitable for structures demanding stringent settlement control and robust load-bearing capacity. Concrete expanded-plate (CEP) piles are innovative, cast-in-place piles with variable cross-sections, which have recently been gaining traction in construction circles. Compared with traditional straight-hole cast-in-place piles, CEP piles are superior, boasting higher load-bearing capabilities, minimal and consistent settlement, and enhanced cost-effectiveness [
1,
2,
3,
4,
5]. Unlike traditional cast-in-place piles, the drilling procedure for CEP pile foundations stands out as being quite distinctive, with certain core theories and design principles still lacking full development. This is mainly because of the intricate interaction between the pile cap and the entire pile assembly. As a result, the stress distribution within CEP pile groups is considerably more complicated than that of single CEP piles. The behaviors of lateral friction and end resistance forces vary notably, emphasizing the importance of a detailed examination of the dynamic relationships among the CEP pile, soil, and cap system, which holds significant practical implications.
In recent years, a variety of studies have delved into the complex dynamics between piles, soils, and caps, as well as the collective behavior of groups of piles. Zhang [
6] examined and modeled how low-cap pile groups responded when subjected to horizontal forces, whether static or dynamic. Fu and Zhu [
7] focused on the often-overlooked relationship between caps and the surrounding soil in low-cap pile systems. Their findings indicated that incorporating soil–pile interactions into simplified models could reduce the bending stresses on the cap and the axial forces within the piles by approximately 35% to 40%. Luo and Liu [
8] developed an analytical approach that considered the load distribution beneath the cap, merging shear displacement analysis with the Boussinesq equation to better understand how lateral friction and axial forces are distributed along the length of the pile shaft.
Zhao and Yu [
9] carried out small-scale tests on single-pile foundations using a transparent soil model to observe the soil deformation around the pile. Their study revealed that the pile cap significantly enhanced the load-bearing capacity of the pile foundation. Mahmoud and Hussien [
10] performed a two-dimensional finite element analysis to explore the impact of vertical loads on the lateral displacement of free-head piles and cap-supported pile groups. The results indicated that when vertical loads were applied to free-head piles, the front pile (Pile 1) exhibited a 10% reduction in resistance to lateral forces. Conversely, the rear piles (Piles 3 and 5) showed a 14% and 35% increase in strength, respectively.
In addition, scholars have also conducted extensive research on variable cross-section piles. For instance, Zhang and Feng [
11] investigated the dynamic response and damage characteristics of variable-section single pile foundations in liquefiable soil–rock interaction strata under seismic loading. The test results showed that the pile acceleration amplification was governed by dual coupling effects of soil–pile interaction and structural stiffness. Zhang and Shi [
12] carried out a series of one-gram shaking table experiments on pile-cap systems with variable cross-sections embedded in sandy soil. Their findings revealed that employing variable piles significantly diminished the acceleration experienced at the pile cap and within the pile’s curvature. Additionally, Shi and Zhang [
13] examined how factors like steel casing length, wall thickness, mud skins, and shear rings affected the horizontal load-bearing capacity of composite steel piles. Their study demonstrated that extending the steel casing length enhanced the pile’s ability to resist horizontal forces and increased the depth at which soil resistance was transferred; it also helped in reducing displacement and shifted the maximum bending moment towards a lower position along the pile.
Cheng and Tong [
14] explored the influence of differing soil types on the compressive bearing capacity of DX piles with stepped cross-sections passing through multiple soil layers. Results showed that load-bearing plates greatly affected the load-bearing capacity of stepped variable-section DX piles. Ma and Li [
15] discussed particle image velocimetry (PIV) technology and created a visualized transparent soil model test. Their experiment indicated that when the pile featured a different cross-section and angle of inclination, the frictional resistance on both sides of the pile was enhanced. Lukpanov and Yenkebaev [
16] compared various pile types with a standard square section prismatic pile. According to the results of the investigations, the resistance values of the compared pile types in the soil were obtained, as well as the dependence of bearing capacity changes on the section dimensions and on the rotation angle.
Despite the extensive research conducted so far, there are still some gaps in the existing literature. There has been extensive research on the working characteristics, load transfer patterns, and group pile effects of straight-hole piles under the combined action of piles, soil, and pile caps. The mechanisms of action and related issues have been studied in a relatively comprehensive manner. CEP piles have greater bearing capacity than straight-hole piles with constant cross-sections, but their working characteristics and failure patterns are significantly different. Moreover, domestic and international scholars have focused their research on pile groups, such as support pile groups and DX pile groups, primarily on aspects such as operational characteristics, settlement calculation, variable stiffness design, and influencing factors. However, theoretical research on CEP piles remains insufficient, with the focus having been primarily on single piles. Therefore, this study adopted the research methods and finite element simulation techniques used in studies on pile groups with pile caps and DX pile groups to investigate CEP pile group foundations under the interaction between pile groups, soil, and pile caps.
This study used the finite element method to investigate how low-capping CEP pile foundations work, including how the piles, soil, and cap interact with each other. This study looks at how the spacing of piles affects the load-bearing capacity of pile foundations and suggests a range of values that are appropriate.
We established double-row six-pile models with pile spacing as the sole variable and employed an innovative half-section pile modeling technique. Through finite element simulation using ANSYS software (Workbench 2022 R1) [
17,
18], the pile–soil force mechanism and damage law were derived. Based on the simulation results, the optimal pile spacing configuration for low-capping CEP group pile foundation was determined, aiming to facilitate the broader adoption of CEP piles in engineering practice.
2. Finite Element Model Construction of Low-Capping CEP Six-Pile Semi-Section Pile Soil
2.1. Analytical Study of the Double Pile Model
The soil in this model acts in a highly nonlinear way, so it is important to choose the right soil constitutive model to improve the accuracy of the simulation. According to previous model tests of concrete expansion sheet piles, the Drucker–Prager (DP) yield criterion works very well. This model takes into account the effects of intermediate main stress and hydrostatic pressure; so, it accurately shows how the pile interacts with the soil and how the adjacent cohesive soil fails. In earlier studies of CEP double piles, the research team looked at how the position of the plates affected the failure of flexible concrete expansion plate piles that were under horizontal loads [
1,
2,
3].
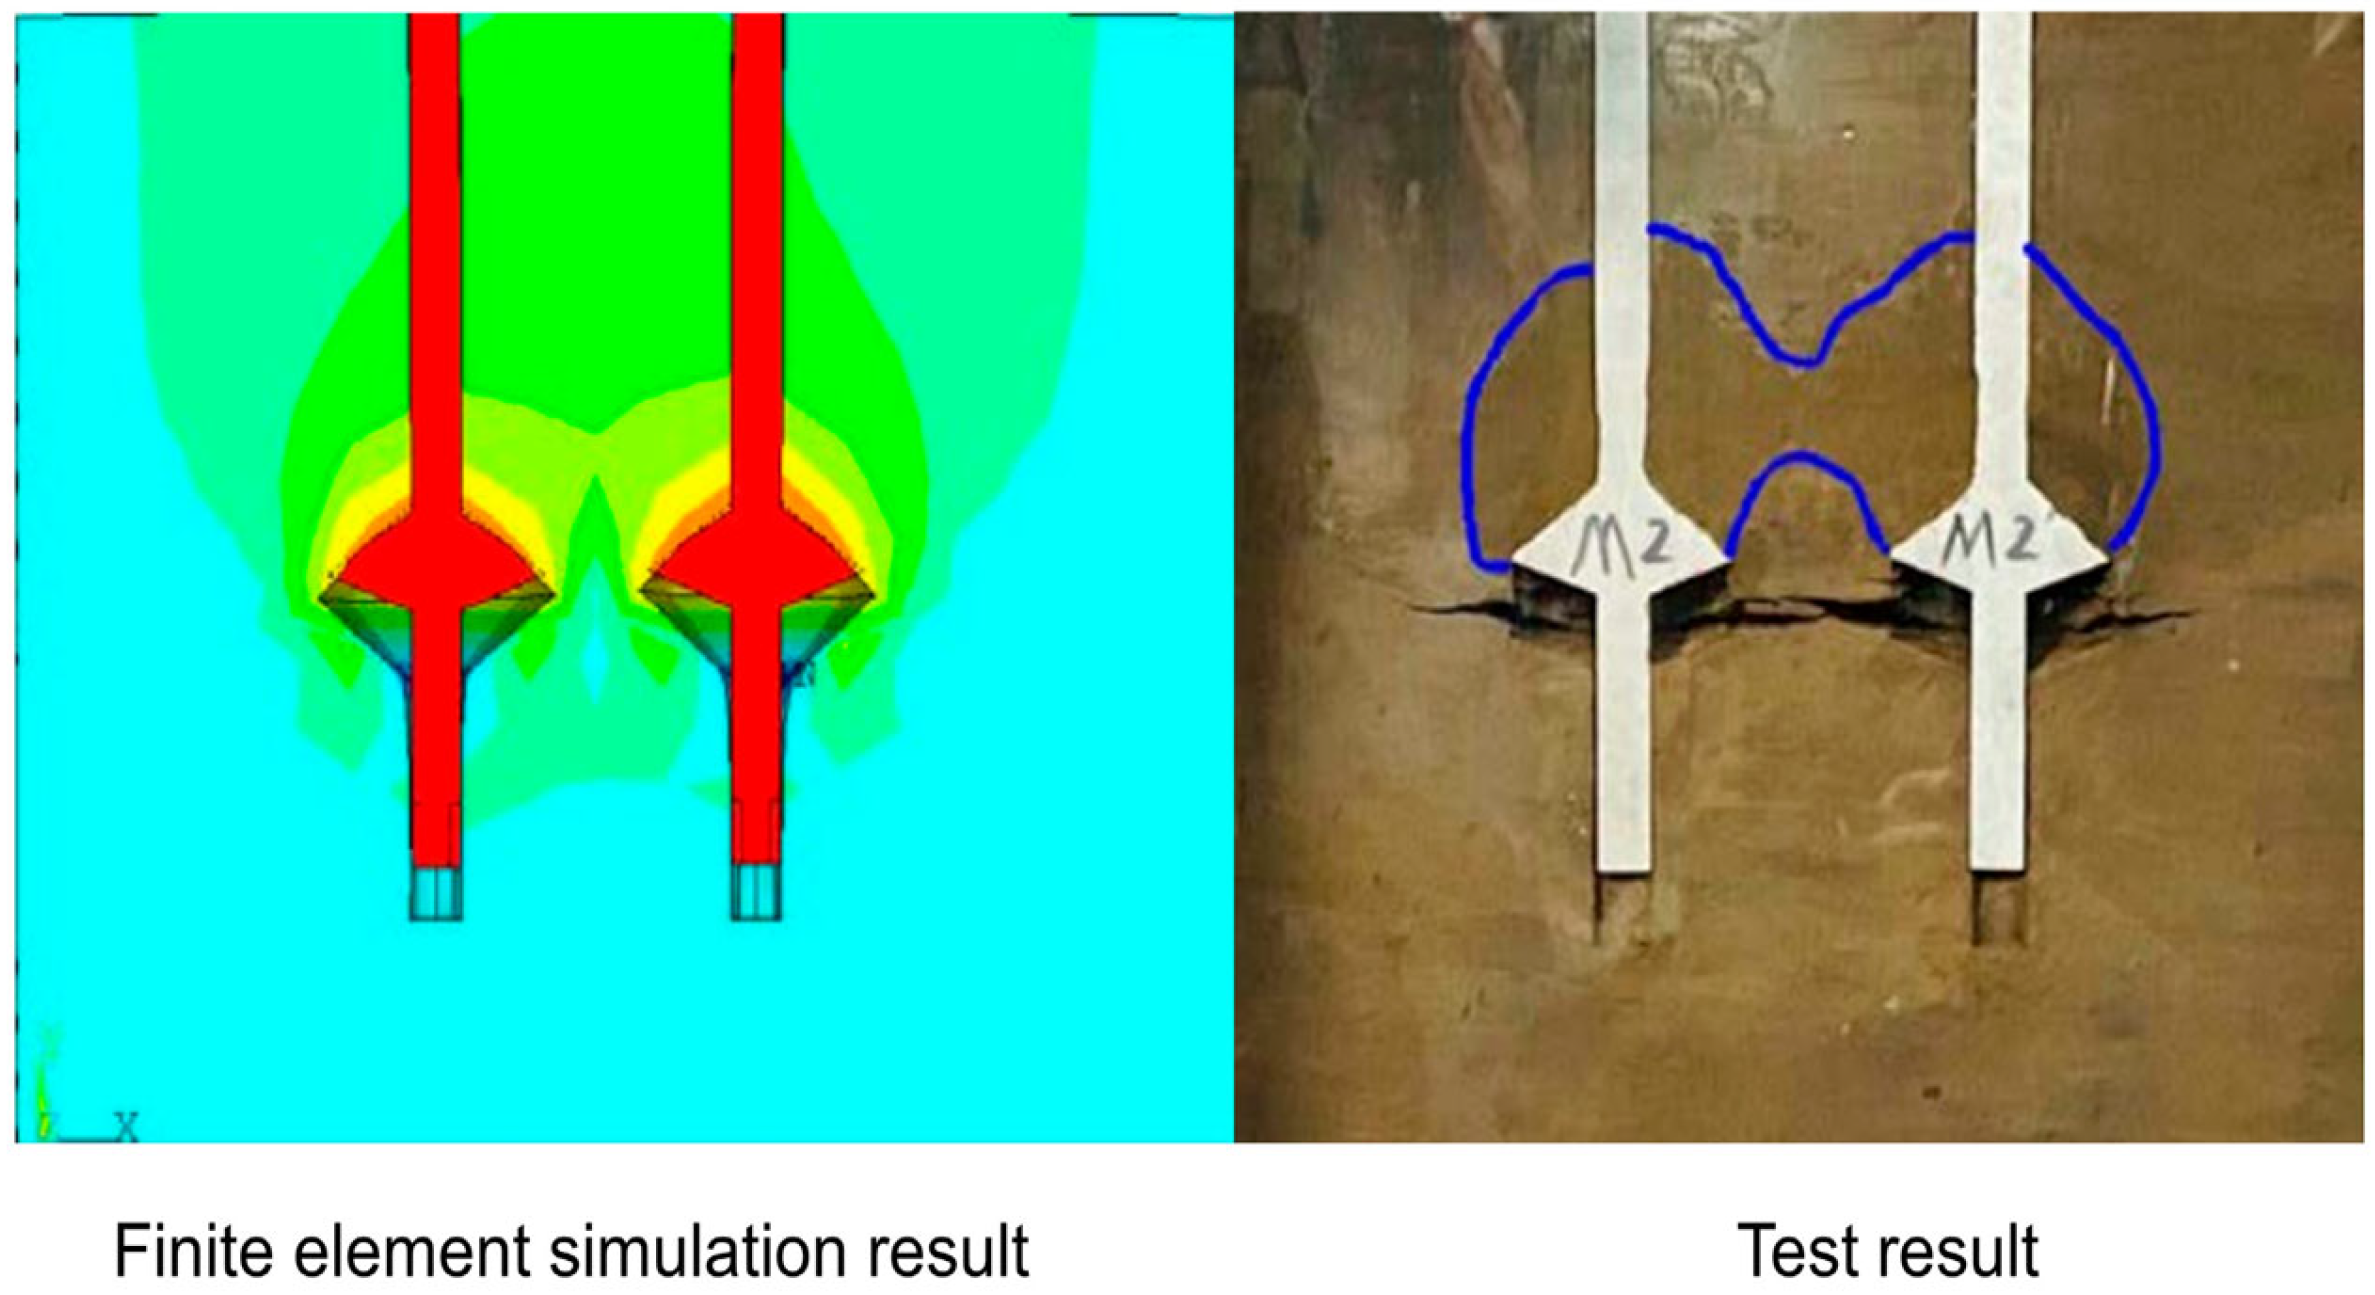
Figure 1 shows a comparison of the soil displacement under failure conditions from model tests and the displacement plots from finite element simulations.
A comparison of the above results shows that the experimental analysis and finite element simulation analysis exhibit good consistency in terms of the timing, state, and area range of the sliding zone on the two piles, as well as the displacement values at the pile tops and the separation phenomenon between the piles and soil below the piles. This validates the effectiveness of the model test results and demonstrates the scientific validity of the basic assumptions and simulation parameter settings in the simulation analysis. Based on this, further analysis of the CEP pile group model can be explored.
In actual engineering applications, CEP piles are reinforced concrete piles. In ANSYS finite element analysis, reinforced concrete models can be simulated using an integral method, in which reinforcing bars are dispersed within concrete elements, thereby neglecting the bond slip between reinforcing bars and concrete.
2.2. Model Selection of Pile and Soil
2.2.1. Fundamental Assumption
To ensure that the ANSYS simulation results are more representative of actual engineering conditions, several relevant assumptions have been introduced, as follows:
First, during the loading process, initial damage is assumed to occur in the soil surrounding the pile. To ensure that the low-capping CEP pile foundation remains undamaged, the pile body is assumed to be homogeneous [
19].
The influence of soil layering on the simulation results has been thoroughly investigated in our previous studies [
1,
2,
3,
4]. To eliminate the effects of interlayer interactions, in this simulation, the soil has been modeled as a single homogeneous layer. The Drucker–Prager (DP) constitutive model was selected to represent the soil surrounding the pile due to its favorable convergence characteristics [
20]. To accurately capture the nonlinear behavior of the soil, it has been modeled as an elastic-plastic and homogeneous material.
2.2.2. Cell Selection and Contact Attribute Setting
In this simulation, the low-capping CEP pile foundation and the surrounding soil are treated as two separate components. To accurately simulate the deformation behavior of the pile in practical engineering applications, the pile body is modeled using the SOLID65 unit, the intrinsic model of the soil is D-P material, and the SOLID45 element is utilized for the soil. This permits displacement in the x, y, and z directions and is appropriate for modeling 3D structures [
21].
To simulate the gap between the soil and the plate during settlement in the actual project, a gap of 1 mm was introduced to ensure simulation accuracy. The contact interaction was modeled using a face-to-face contact algorithm, which ensured high accuracy.
2.3. Selection of Material Parameters
Before conducting ANSYS finite element analysis, it is necessary to set the basic parameters for the CEP pile and soil model to ensure consistency between the finite element model and the actual engineering project. Based on the geological survey and testing of the in-situ soil at the construction site from the previous in-situ soil experiments conducted by the research team, the material properties of the soil model in this paper were set accordingly [
1,
2,
3]. CEP piles in actual engineering applications are all reinforced concrete structures. The material properties of the CEP pile model in this paper were set to be consistent with those of C30 concrete, referencing the previous large-scale engineering experiments conducted by the research team. The material properties of the CEP pile model were basically consistent with those of C30 concrete. Specific pile and soil parameters are shown in
Table 1.
2.4. Determination of Model Size
To ensure that the finite element analysis aligned with real-world conditions, he low-capping CEP pile foundation model was designed at a 1:1 scale, based on prior studies [
1,
2,
3,
4,
5].
According to Clause 8.5.17 of the “Code for Design of Building Foundations” GB50007-2011, the construction of pile cap foundations should not only meet the requirements for shear resistance, bending resistance, and load-bearing capacity of the superstructure but should also comply with the following provisions.
First, the width of the pile cap should not be less than 500 mm. The distance from the center of the edge pile to the edge of the pile cap should not be less than the diameter or side length of the pile, and the distance from the outer edge of the pile to the edge of the pile cap should not be less than 150 mm. For strip pile cap beams, the distance from the outer edge of the pile to the edge of the pile cap beam should not be less than 75 mm.
Second, the minimum thickness of the pile cap should not be less than 300 mm. Before determining the specific dimensions of the pile cap, it was necessary to consider the requirements of the specifications and actual application, and conduct multiple pre-simulation tests. Ultimately, the length and width of the pile cap were set to 2500 mm, and the thickness of the pile cap was set to 600 mm.
The pile had a length of 10,000 mm and a diameter of 500 mm. The bearing plate was given an asymmetrical structure on the top and bottom to suit the pile construction process using an integrated drilling–enlarging–cleaning machine. Its upslope angle was 35°, the downslope angle was 27°, and the cantilever diameter was 750 mm. The distance from the pile top to the soil surface was set at 1650 mm, in line with soil penetration depth in northern regions, while the distance from the pile tip to the soil bottom was 2000 mm.
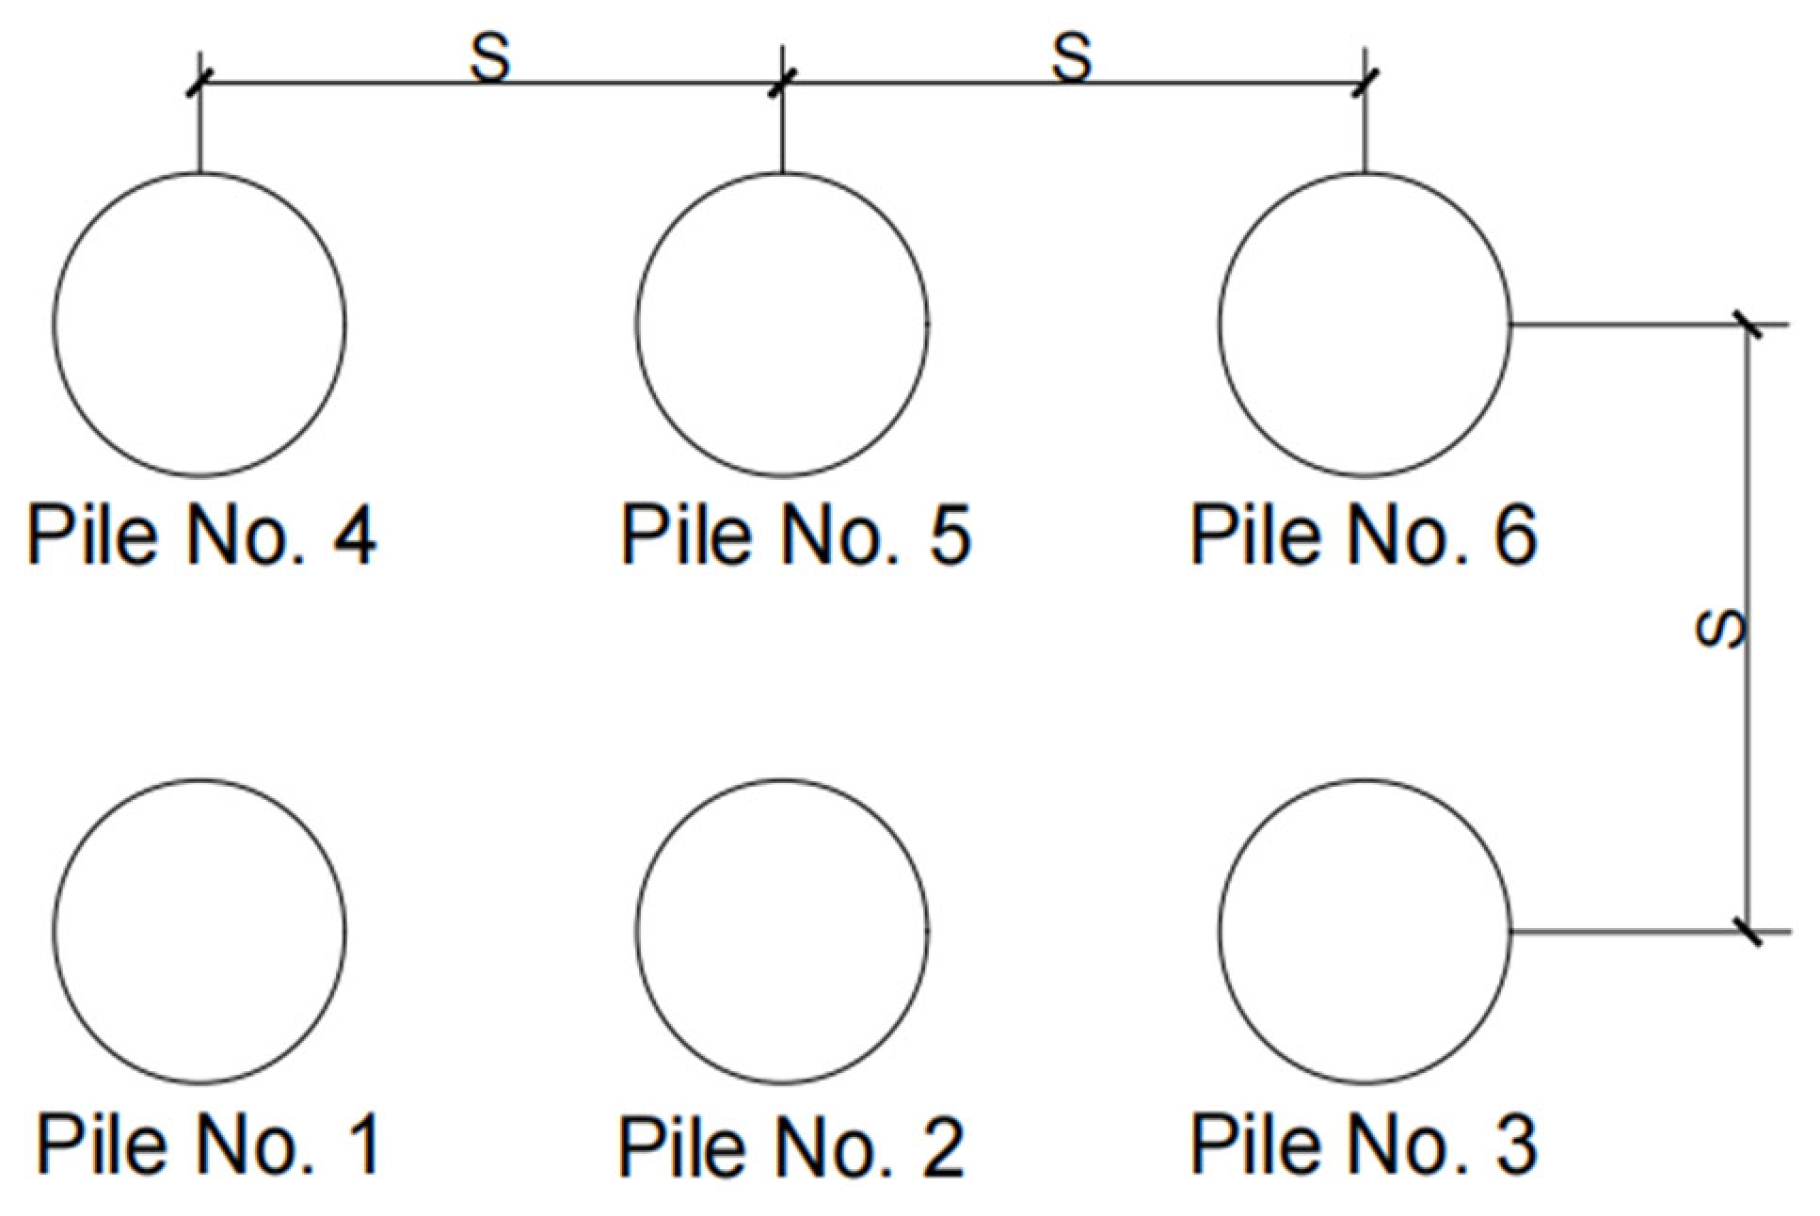
To reduce loading-induced boundary effects, the soil domain was modeled much larger than the pile body, with the pile centrally placed. This study focuses on how pile spacing affects the bearing performance of low-capping CEP group pile foundations under complex stress. In the simulation, only the pile spacing varied, with other parameters kept constant. The pile spacing was configured using the plate’s cantilever diameter as a reference. To evaluate the function of the bearing platform under varying pile spacings, the platform edge was positioned 150 mm from the pile edge, in accordance with relevant specifications. Additionally, to better represent an actual project, a loading device was placed on top of the bearing platform to apply load. The schematic diagram and layout plan of the low-capping six-pile foundation model are presented in
Figure 2 and
Figure 3, respectively.
A total of five sets of low-capping CEP six-pile foundation models were established, with pile spacing ranging from 2.5 to 4.5 times the cantilever diameter of the plate and all other parameters kept constant. Detailed size parameters are presented in
Table 2.
2.5. Model Construction Process
2.5.1. Model Construction
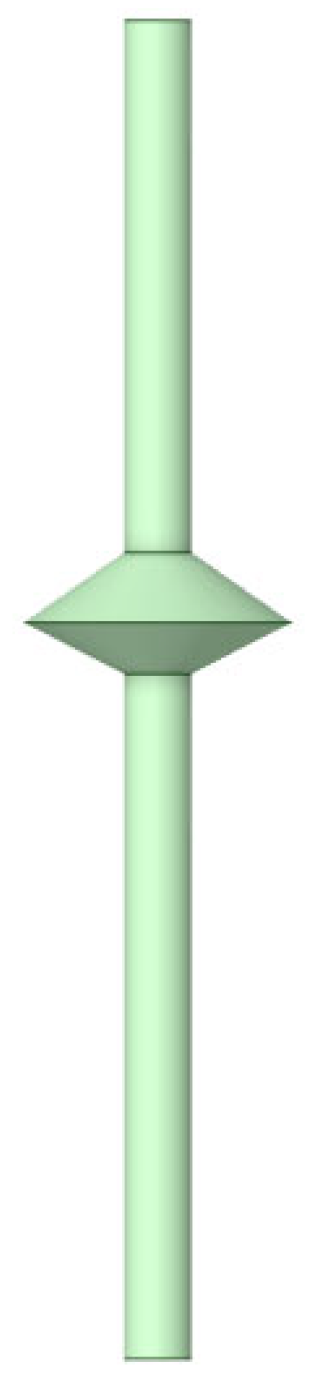
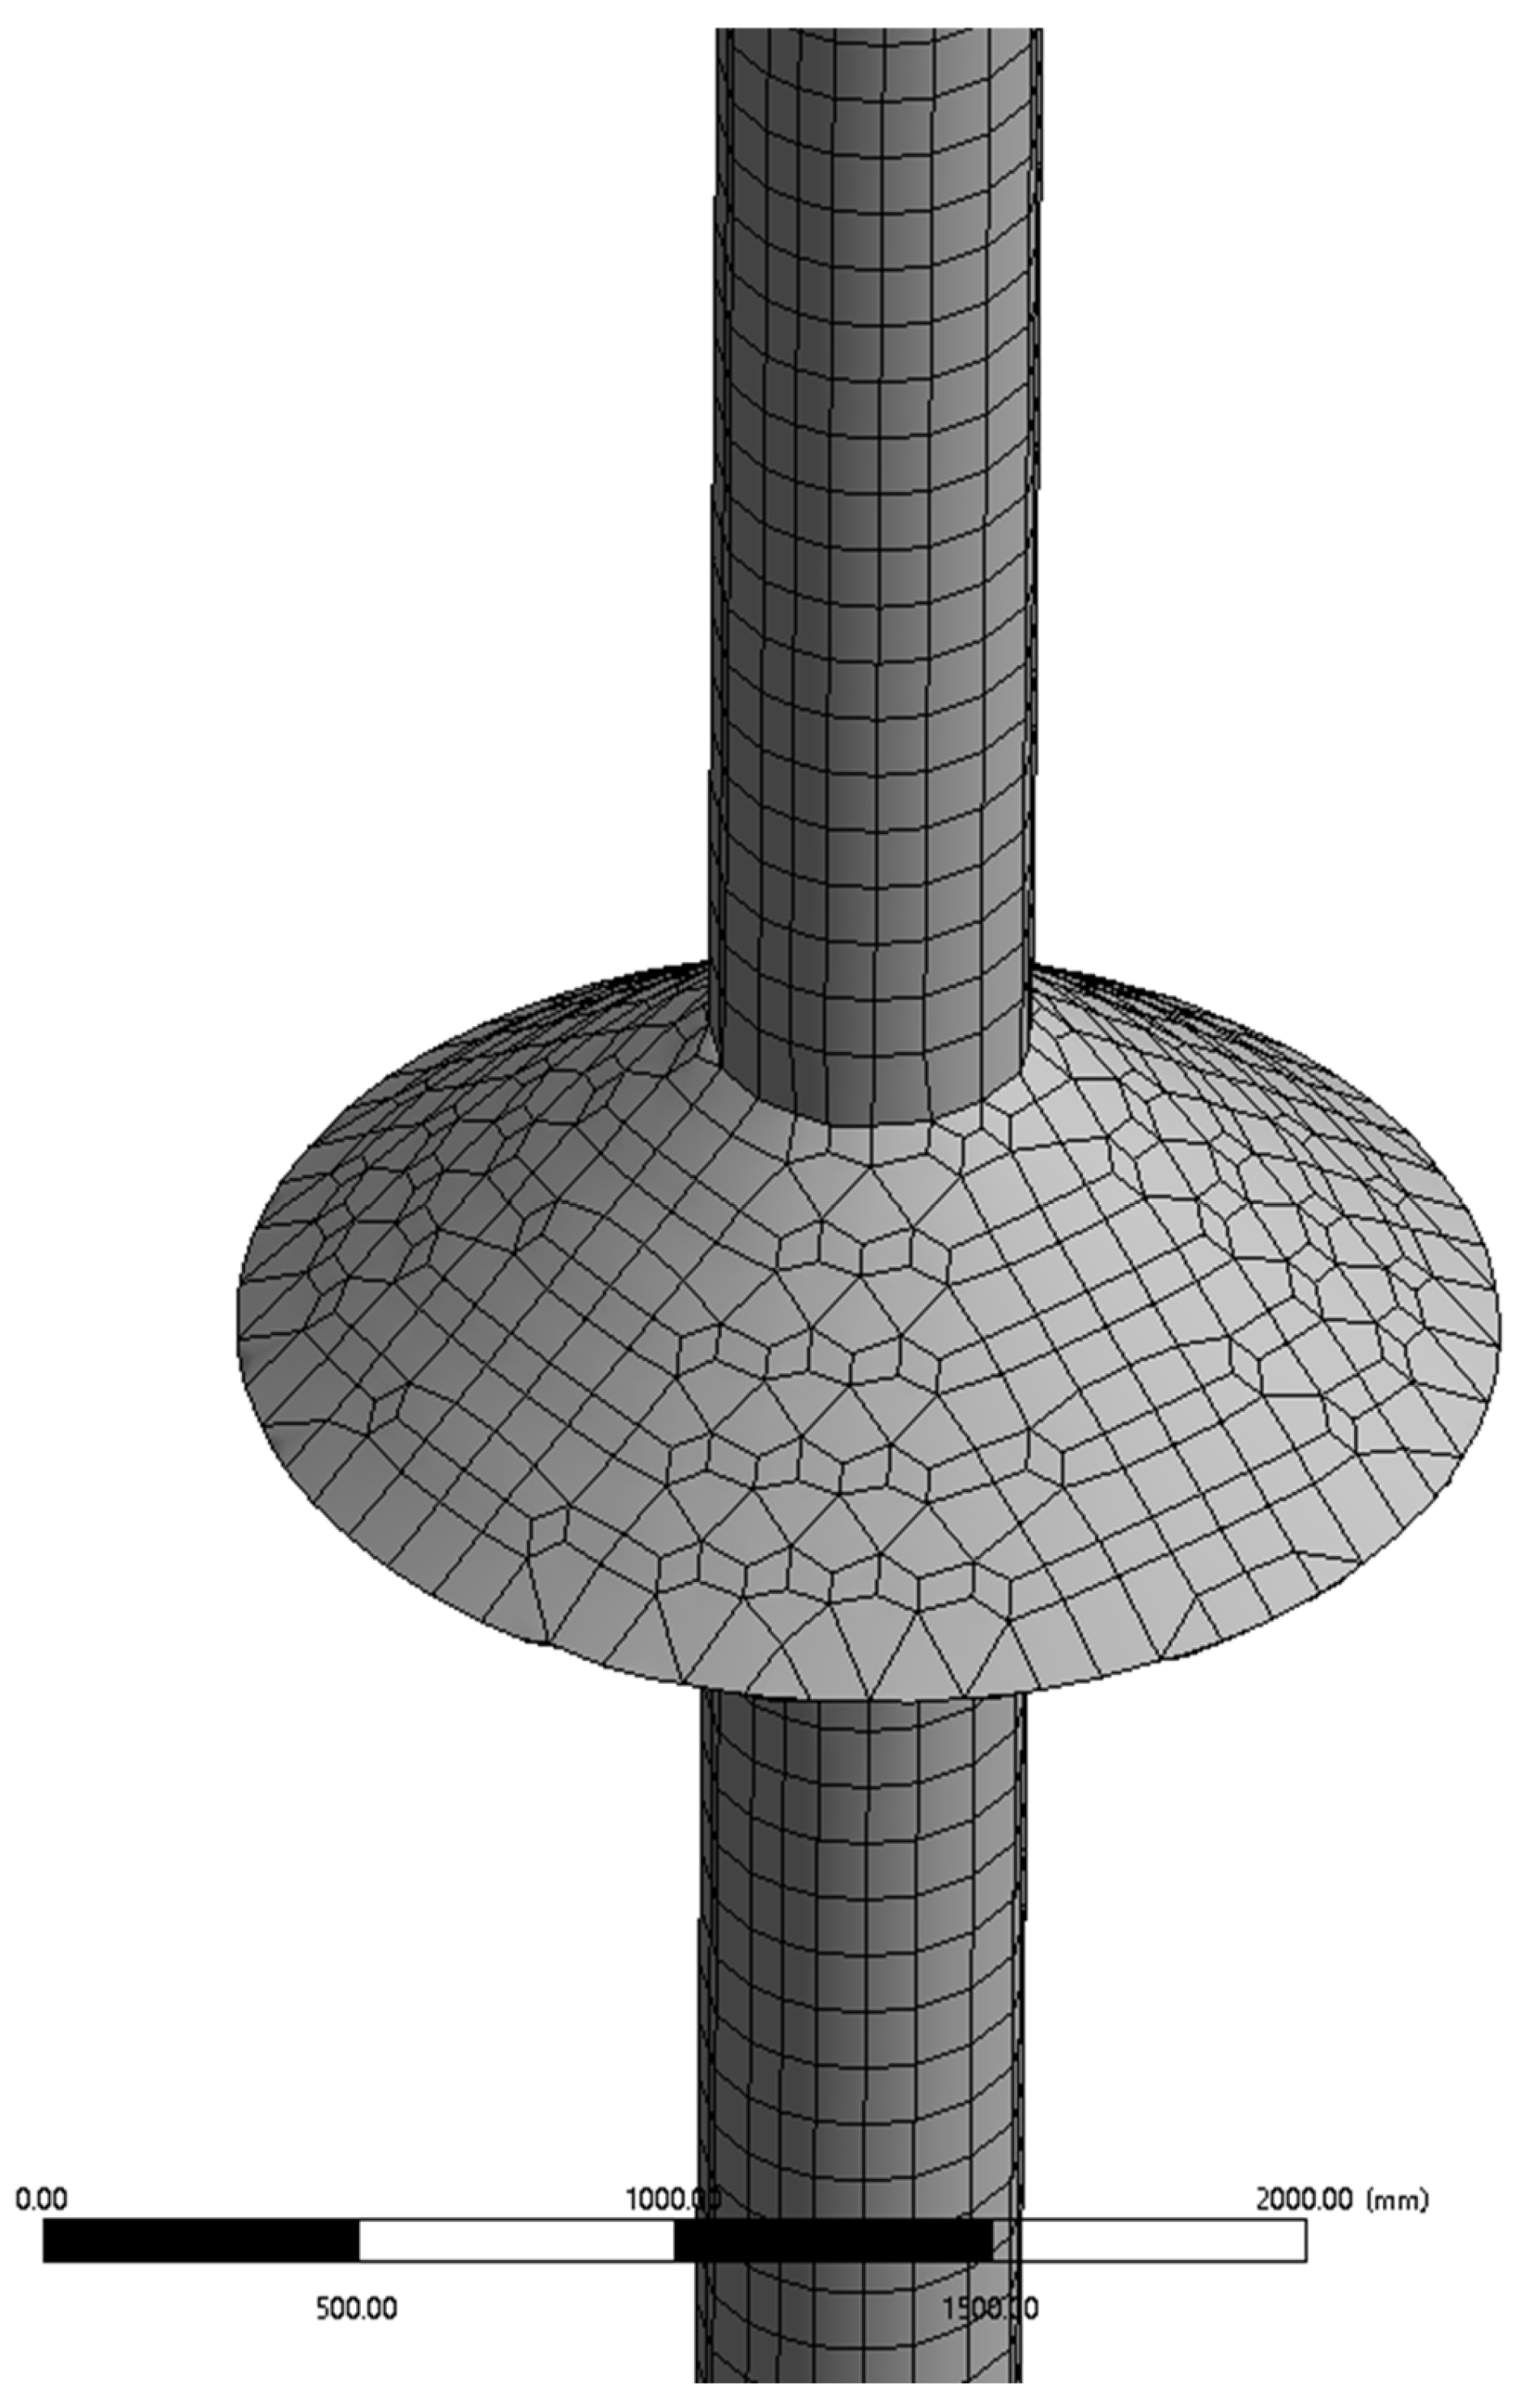
Firstly, following the bottom-up modeling principle, key points of the pile body were defined according to the data in
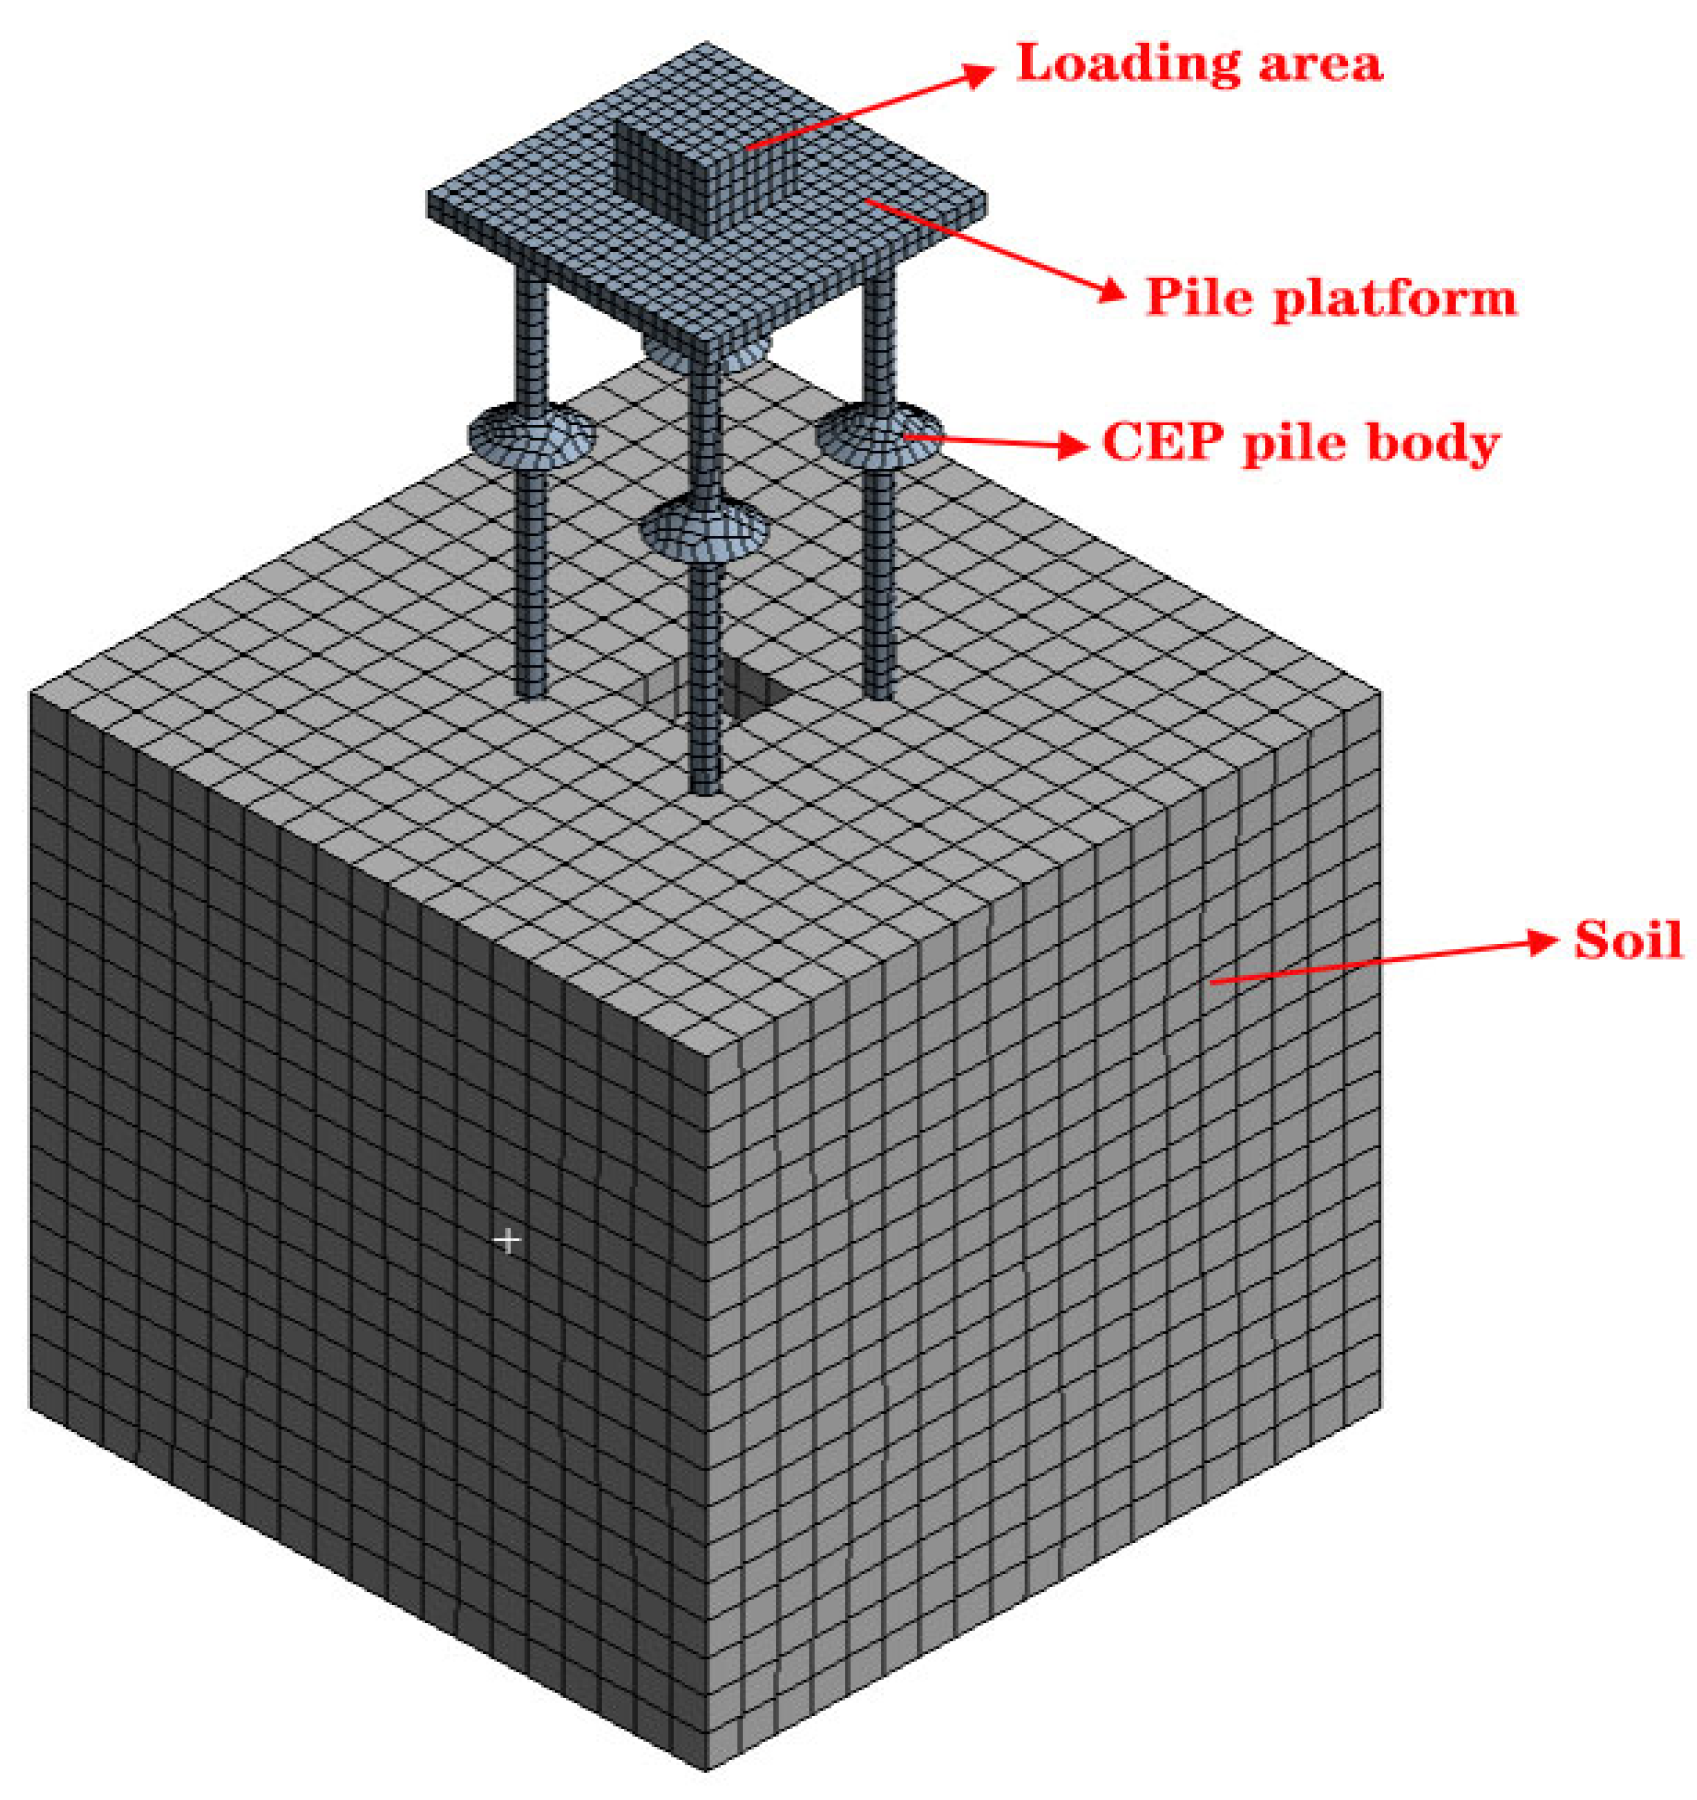
Table 2. These points were connected by straight lines to form a closed surface. The pile body’s centerline was chosen as the axis of symmetry, and the complete single-pile model was generated by rotating this profile 360° around the axis. The soil around the pile was represented by establishing a square in the plane coordinate system, followed by a stretching operation. The soil domain in the six-pile model measured 15,000 × 15,000 × 14,700 mm. After establishing the soil domain, the pile foundation was duplicated to the corresponding positions within the soil. The pile foundation was partially removed from the soil by Boolean operation in the software. The pile foundation was moved to the removed position in the soil, and finally, the pile foundation was bonded with the soil around the pile to form a whole. The rotated single pile model and the model diagram after modeling are shown in
Figure 4 and
Figure 5 [
22].
2.5.2. Mesh Division
Mesh division played a critical role in the simulation process. To enhance the efficiency and accuracy of the calculation, the mesh had to be very accurate. Common meshing methods in ANSYS include free mesh, mapping mesh, drag, sweep mesh, and hybrid mesh [
23].
Mapping mesh is suitable for models with very regular geometries. The face can only be quadrilateral after the division of the cell formed by all quadrilaterals. For volumetric bodies, only hexahedral elements are allowed, and the resulting mesh consists entirely of hexahedral cells [
24]. To meet the research requirements of this study, the mapping mesh method was employed for mesh generation in the simulation. To improve simulation accuracy, local mesh refinement was applied to critical components of the model. Since the soil model was much larger than the pile body model, only a part of the soil around the pile body needed to be carefully divided, and the rest of the soil was appropriately adjusted to the mesh size, to save calculation time, improve efficiency, and also to make the simulation results more accurate. Thus, the calculation results could more easily realize the convergence.
The early research’s first simulation results showed that the size of the soil grid had a big effect on how accurate the simulation is. If the soil grid size is less than 1200 mm, the differences in the results of the simulations are not important. As a result, the soil grid size was set at 800 mm to balance accuracy and speed, while the size of the adjacent load-bearing plate grid was reduced to 500 mm, because that area undergoes a lot of stress. The size of the grid on the pile body was set at 300 mm. Before making the grid, the model was cut up along feature boundaries to make hexahedral grids. Pile–soil mesh division is shown in
Figure 6, and plate location mesh division is shown in
Figure 7.
2.5.3. Setting of Friction Coefficient
According to
Table 2, it can be seen that the modulus of elasticity of concrete is much larger than the modulus of elasticity of soil around the pile; that is, the modulus of elasticity of the pile body is much larger than the modulus of elasticity of the soil. Therefore, the contact between the pile body and the soil was modeled as a rigid–flexural interface [
25]. To make the simulation results consistent with the actual project, the friction resistance had to be matched with the actual project, so the friction coefficient between the target surface and the contact surface was set to 0.3.
2.5.4. Imposing Boundary Constraints
After modeling, it became clear that the pile body model was much smaller than the soil model. Because of this, the effects of boundary limits on the simulation results can be ignored in this case. However, to enhance accuracy and prevent irregular soil deformation during loading, which could compromise the simulation results, boundary constraints were imposed on the soil body. In this simulation analysis, the constraints were applied to the bottom and the surrounding area of the soil in the X, Y, and Z directions of the degrees of freedom, and constraints were not applied to the top of the soil.
2.5.5. Imposed Load
The loading method used in this simulation was face load loading. The pile foundation in this project is complicated, so the vertical load was first applied to the top of the pile. Once all the vertical loads were in place, the horizontal load was applied. To look at how the pile body and soil changed at each node and make it easier for the simulation results to come together, the load was added gradually during the loading process. The automatic time step was turned on, the number of steps was set to 2, the initial sub-step was set to 100, the smallest sub-step was set to 100, and the largest sub-step was set to 10,000. In this simulation, the pile top was considered to be in the state of reaching the ultimate capacity when the horizontal displacement of the pile top was more than 15 mm.
3. Analysis of Simulation Results of Low-Capping CEP Six-Pile
3.1. Comparative Analysis of Displacement Cloud Maps
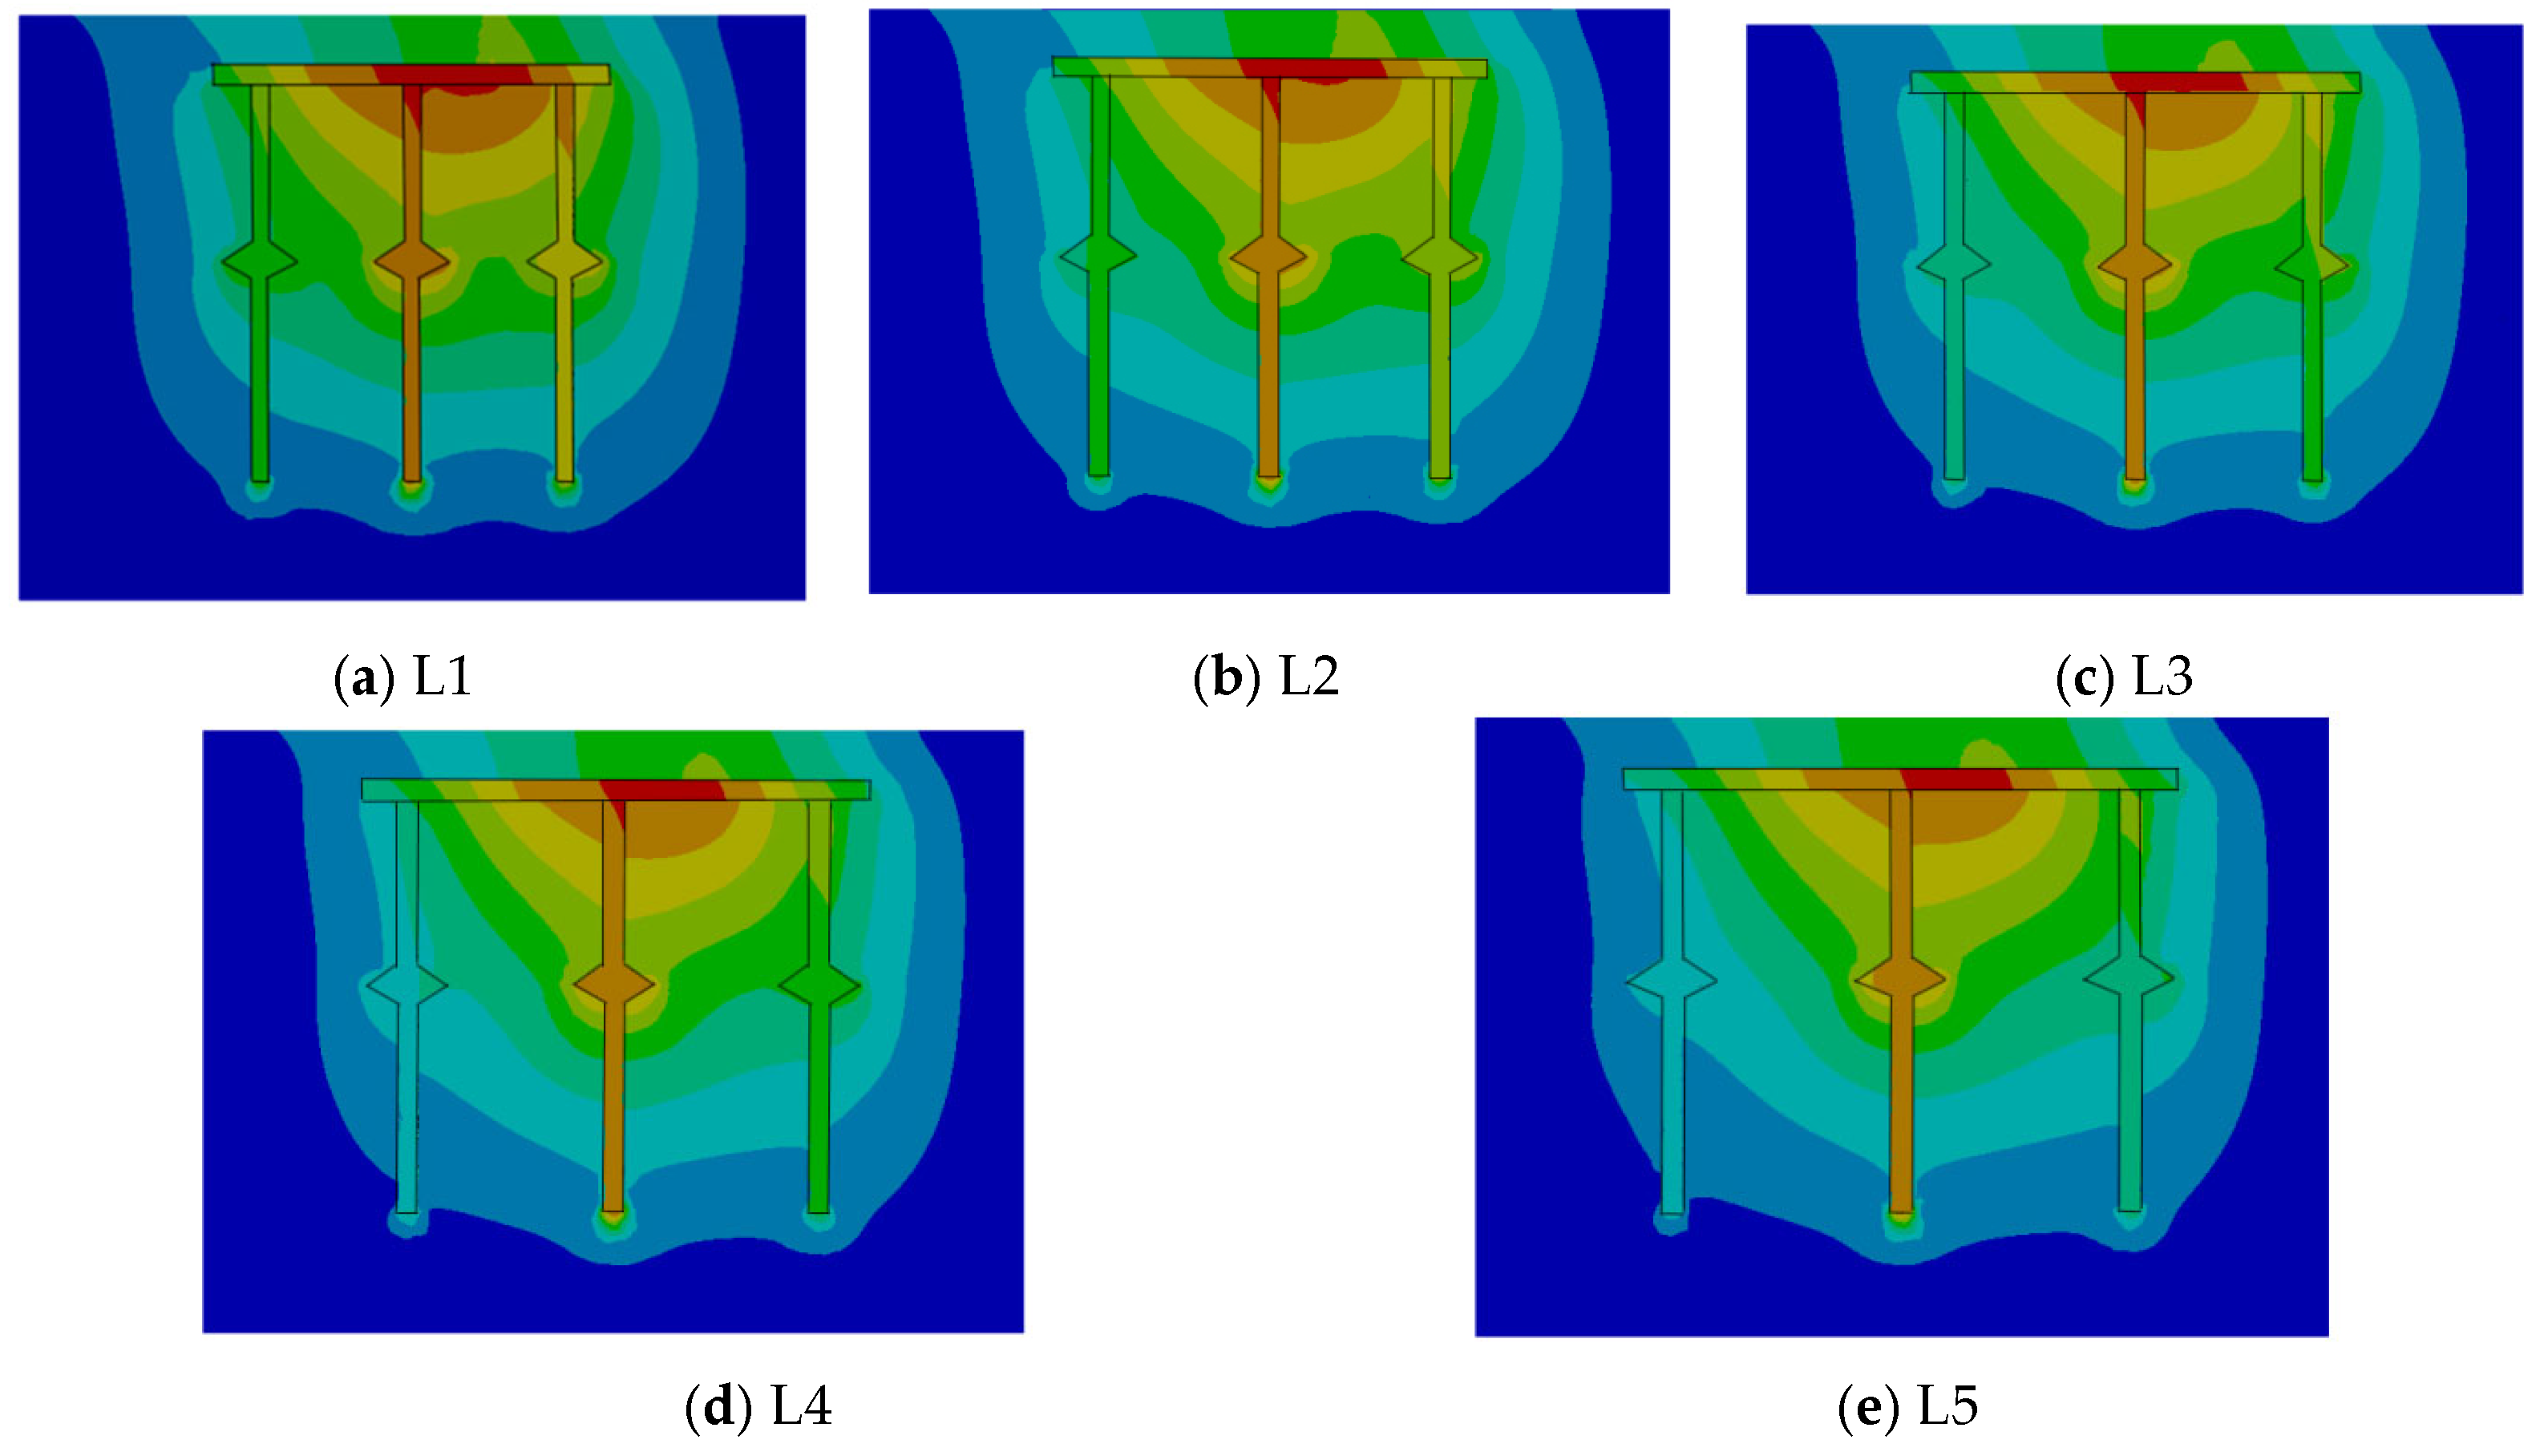
The displacement cloud maps of piles No. 4 to No. 6 when five groups of piles were extracted at the time of reaching the failure state are shown in
Figure 8.
The following can be derived by analyzing
Figure 8. Firstly, when the low-capping CEP six-pile foundation is subjected to horizontal load, the overall displacement trend is consistent, and the pile body is tilted to the right as a whole. Under the horizontal load, the bearing platform transfers forces to pile bodies and surrounding soil, the friction between bearing platform and the soil leads to a slip phenomenon in the bearing platform. Simultaneously, the bearing platform resists deformation in the process of bearing force, which also leads to a slip phenomenon near the bearing plate.
Secondly, the maximum displacement across the five simulation groups occurs at the bearing platform. This signifies that during the loading phase, the bearing platform bears a significant portion of the load.
When the pile spacing increases, the displacement difference between the bearing platform and the adjacent pile becomes smaller. This is due to the combined effect of the pile, soil, and bearing platform, and it shows that increasing pile spacing is vital for boosting the pile foundation’s strength.
A comparison of the five displacement maps reveals that the soil displacement range beneath the bearing platform decreases over time. This is due to the increased pile spacing, which enlarges the bearing platform and boosts the contact area between the platform and soil. Under horizontal loading, interaction forces emerge between the bearing platform and soil. As pile spacing increases, the displacement variation between them decreases. This implies that the collaborative action of the pile-soil-bearing platform greatly enhances the pile foundation’s load-bearing capacity.
3.2. Analysis of Load-Displacement Curve
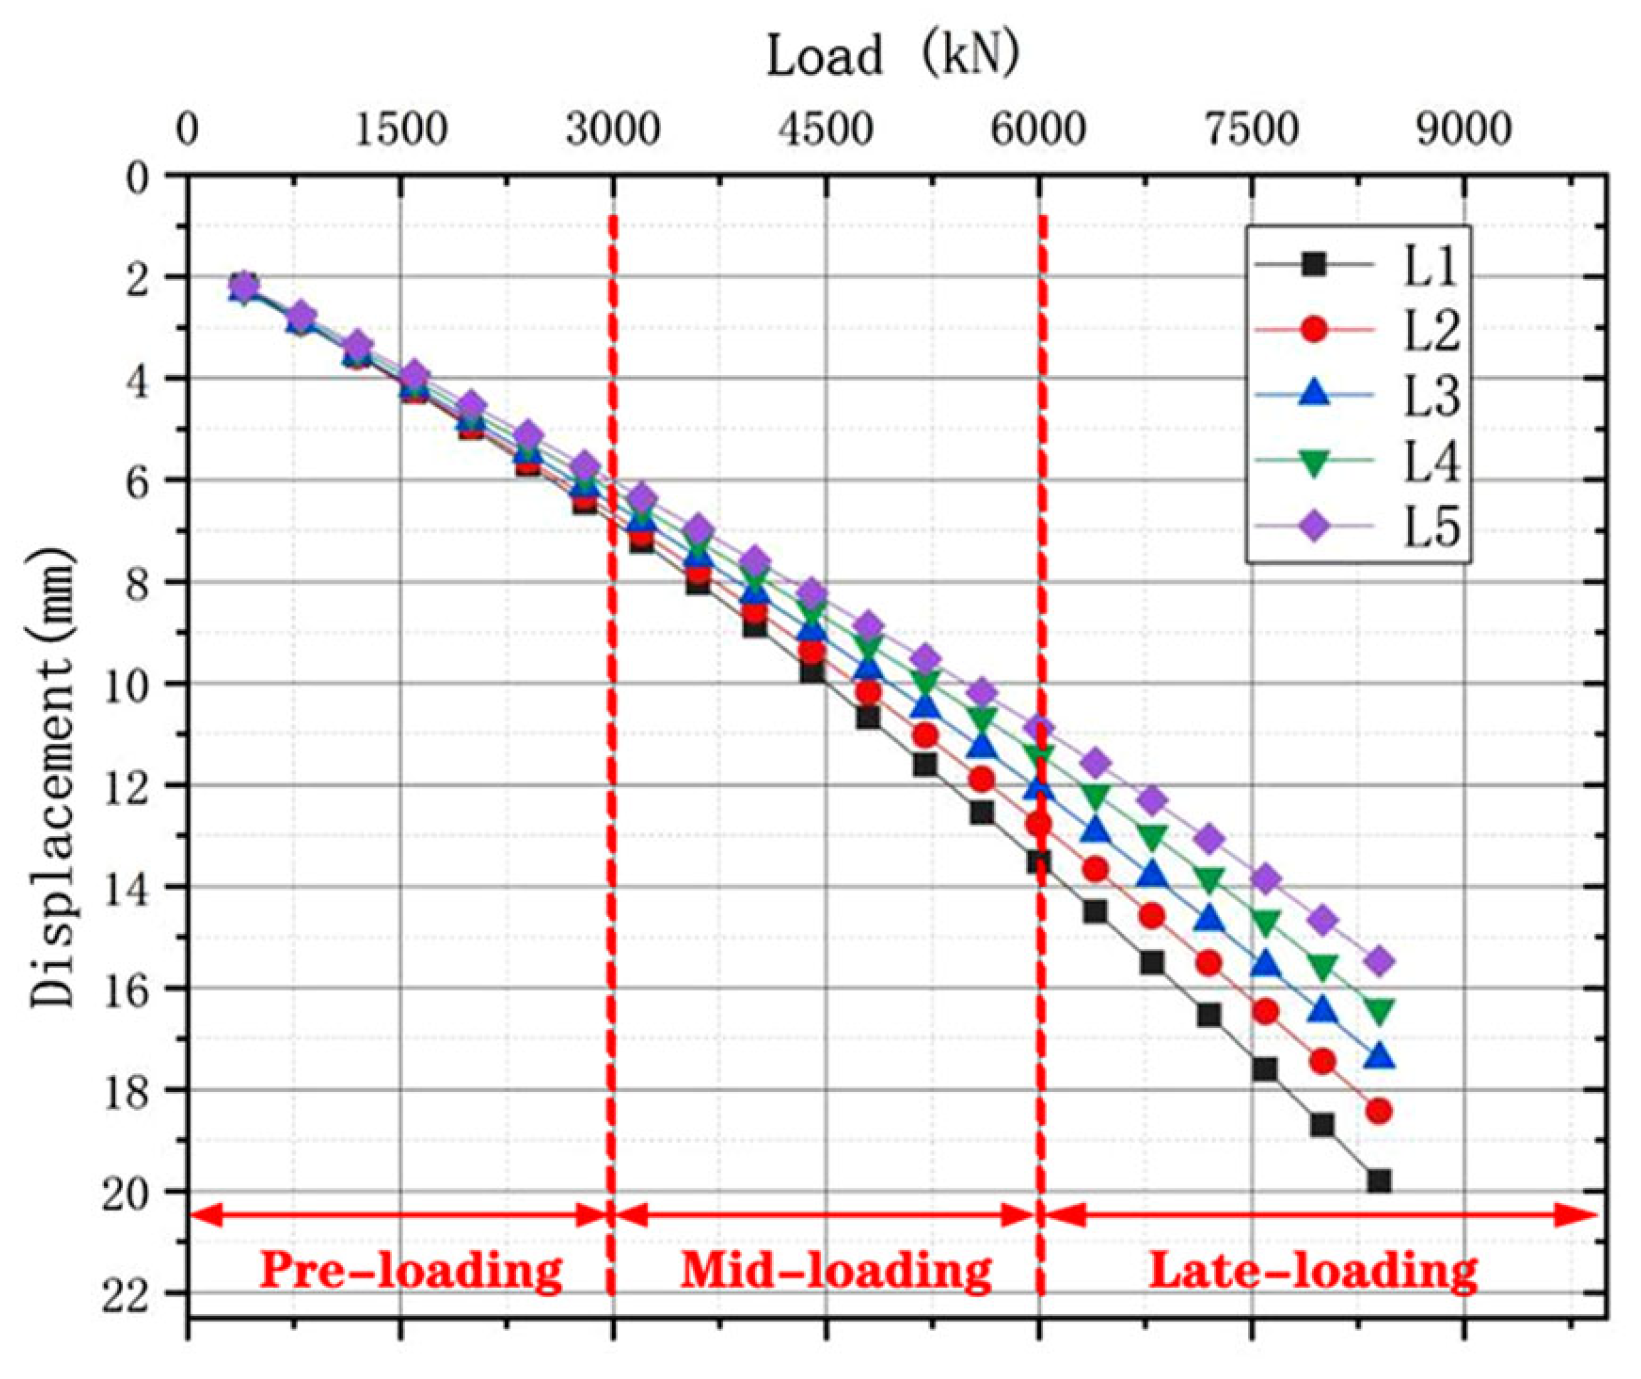
The pile-tip displacement data under various forces were extracted for each group. The displacement data at each load step and load-displacement curves for the pile tips are shown in
Figure 9.
From
Figure 9, it can be seen that the load-displacement curves of the five sets of low-capping CEP six-pile foundations share the same pattern of change. The displacement values gradually increase as the horizontal load becomes larger.
The damage values of five groups of low-capping CEP six-pile foundation with varying pile spacings were 6800 kN, 7200 kN, 7600 kN, 8000 kN, and 8400 kN, respectively, indicating a progressive increase in bearing capacity with increasing pile spacing. Notably, the difference in bearing capacity between the L4 and L5 pile groups was minimal, suggesting that the pile spacing at this stage was approaching the optimal range. Beyond this point, further increases in pile spacing yielded negligible improvements in bearing capacity.
Finally, at the early stage of loading, the displacement data at the pile tips across all groups were relatively similar, indicating that pile spacing had limited influence on the bearing performance of low-capping CEP pile foundation under small loads; in the middle stage, the first three groups exhibited greater increases in displacement compared with the latter two, and the overlapping range of the soil around the piles was larger at this time so that the soil’s bearing capacity decreased; in the late stage of loading, the displacement differences between the L4 and L5 groups under the same load were minimal. This suggests that once the pile spacing exceeds a certain threshold, further increases result in only marginal improvements in the bearing capacity of low-capping CEP pile foundations.
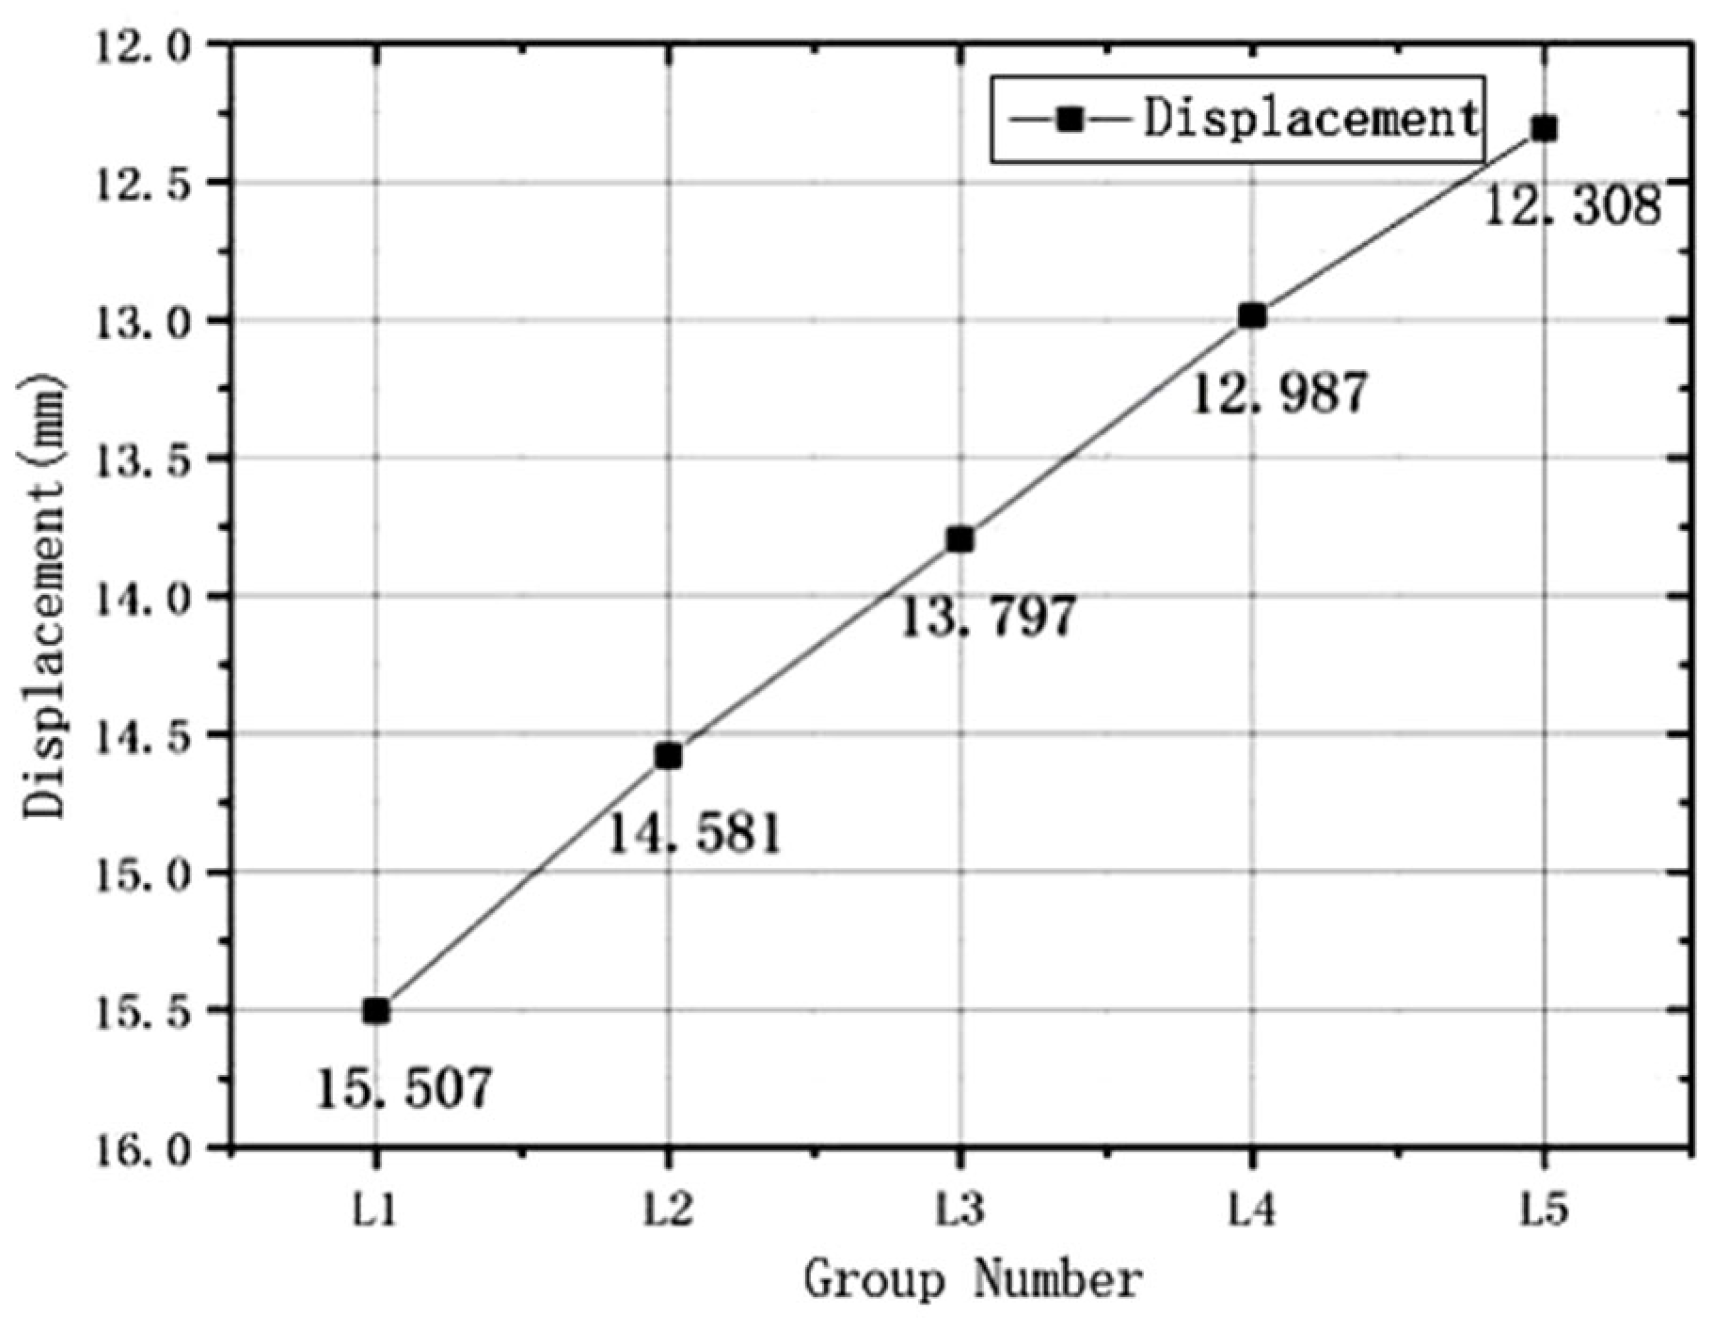
This study considered how different pile spacing affects the load-bearing capacity of a low-capping CEP six-pile foundations under uniform horizontal load. The L1 group in the damage state was used as a control for comparison.
Figure 10 and
Figure 11 show five groups of horizontal displacement comparison diagrams for L1–L5.
From
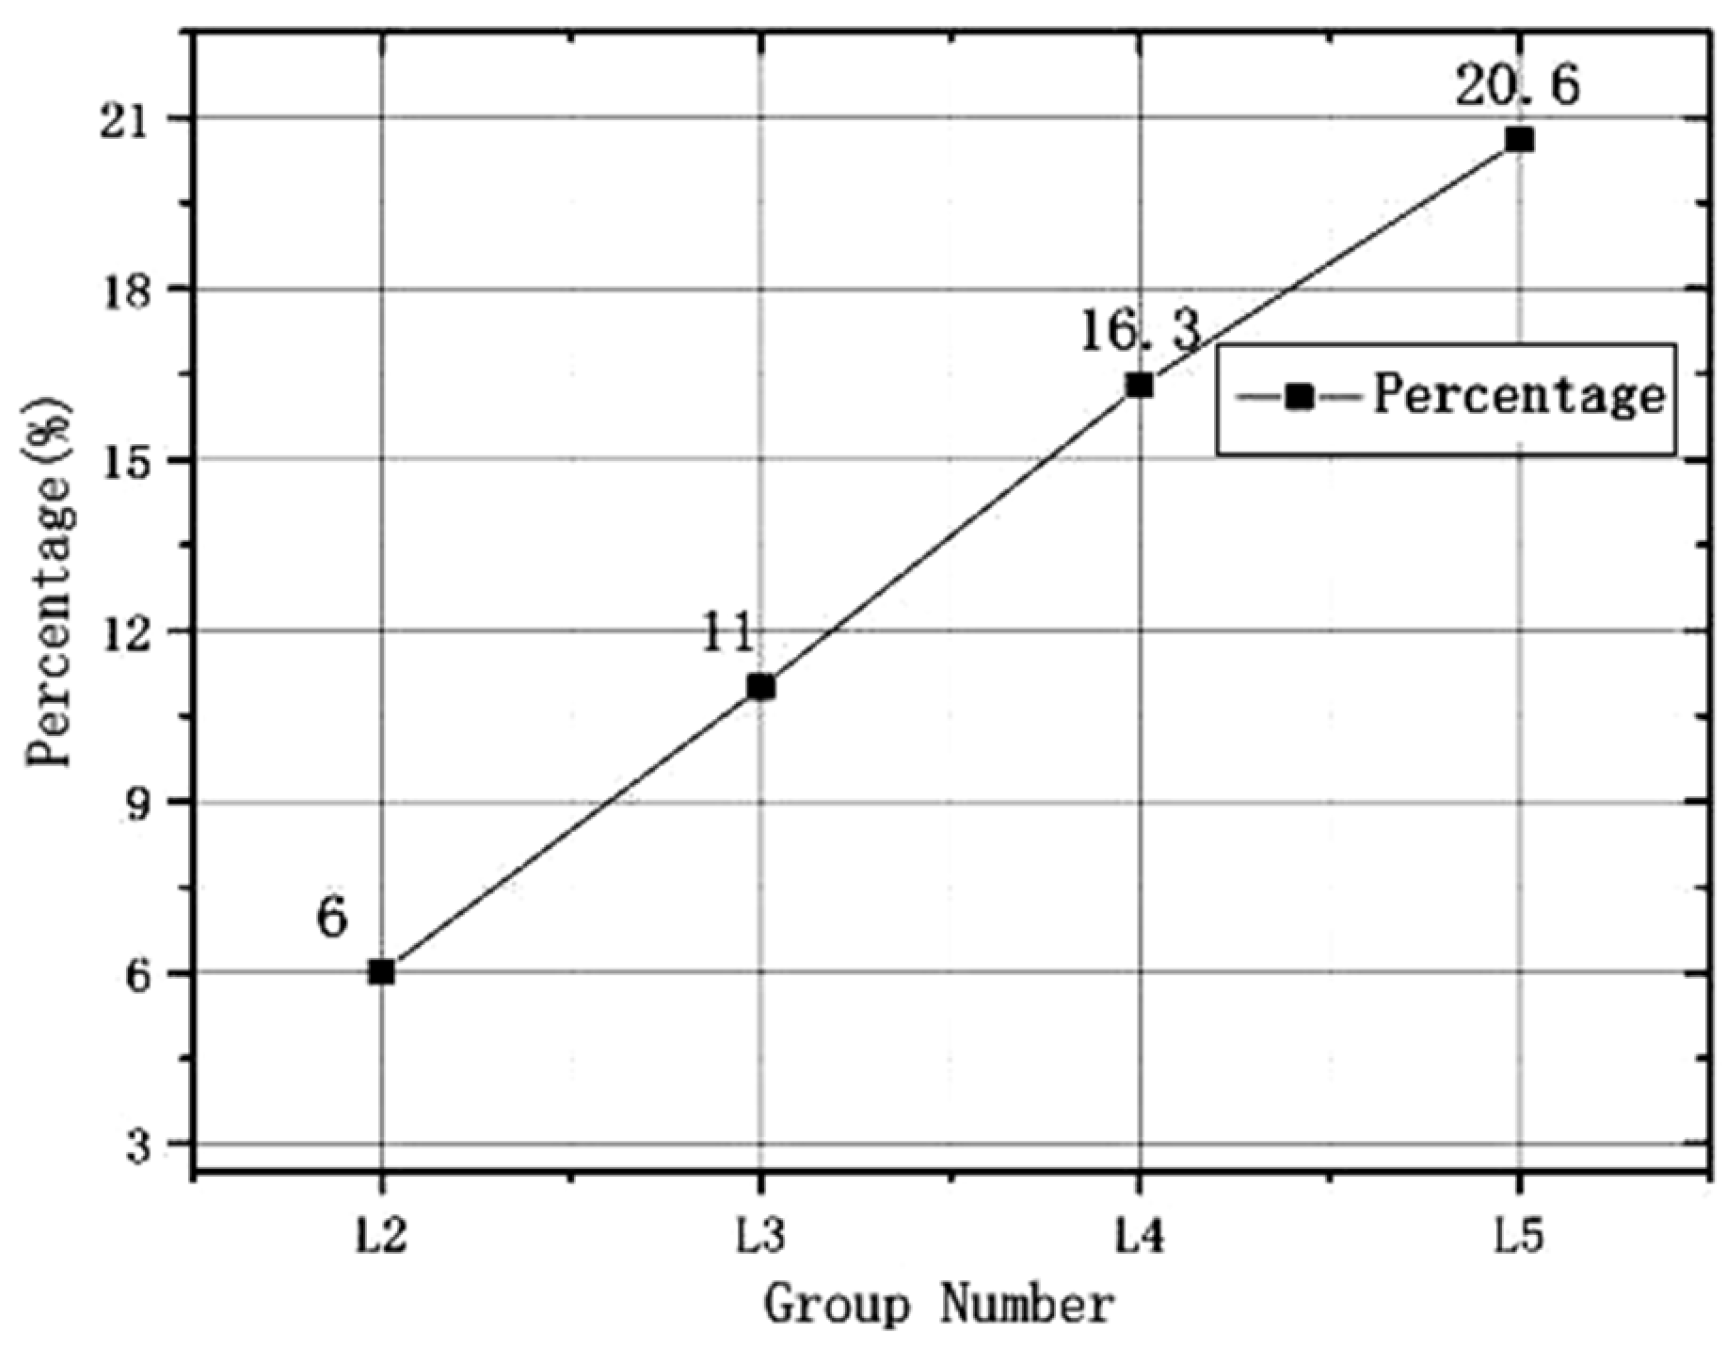
Figure 10 and
Figure 11, it can be observed that the maximum horizontal displacement of pile tips in group L1 is 15.507 mm, while that of group L5 is 12.308 mm under the same condition. According to the analysis, when group L1 reaches the failure state, the maximum horizontal displacements of pile tips in groups L2 to L5 decrease by 6%, 11%, 16.3%, and 20.6%, respectively, compared with group L1. When the pile spacing increases to 4.5 times the cantilever diameter (group L5), the rate of displacement reduction slows down, and the difference in maximum horizontal displacement at the pile top becomes less significant compared to other groups. Based on this, the following conclusions can be drawn.
Firstly, increasing the pile spacing beyond 4.5 times the cantilever diameter of the plate results in little further improvement in horizontal bearing capacity.
Secondly, the optimal pile spacing for low-capping CEP six-pile foundations was found to be between 3.5 and 4 times the cantilever diameter of the plate.
3.3. Comparative Analysis of Displacement Cloud Maps of the Same Group
Group L3 of the low-capping CEP six-pile foundations was selected as the reference group for analysis. The displacement cloud diagrams of Group L3 under horizontal loads of 0 kN, 1500 kN, 3000 kN, 4500 kN, 6000 kN, and 7600 kN were extracted accordingly, as shown in
Figure 12.
Firstly,
Figure 12a shows the displacement cloud diagram of low-capping CEP six-pile foundation subjected to a vertical load. The range of displacement influence on the left and right sides of the pile body is nearly symmetrical, and the displacement of the center pile is more pronounced than that of the side piles on both ends. The soil under the bearing platform and around the bearing plate shows clear displacement effects, which are most active around the central pile. The pile end has minimal displacement. This indicates that the bearing platform and plate primarily support the vertical load, limiting the pile end’s contribution. Hence, the pile end’s displacement effect is smaller than that near the bearing platform and plate.
Secondly, as shown in
Figure 12b,c, the overall displacement of the pile body begins to tilt to the right in the early loading phase. The soil displacement adjacent to the bearing plate on the right side is more significant than that on the left side. Additionally, the displacement of the upper half of the pile body on the right side exceeds that of the lower half, with greater displacement observed closer to the bearing platform. This is because, when subjected to horizontal load, the pile body begins rotating toward the right, causing compression of the adjacent right-side soil and resulting in a reaction force between the soil and the pile body. The bearing platform, the upper half of the pile body, and the bearing plate withstand most of the horizontal load. Hence, the lower half of the pile body experiences relatively less movement. This highlights the crucial role of the bearing platform and bearing plate in resisting the applied horizontal load.
From
Figure 12d–f, it is evident that as the horizontal force increases, the soil beneath the support platform experiences a steady increase in displacement, with the greatest movement still centered on the platform itself. This underscores the crucial function of the bearing platform throughout the entire loading phase. Additionally, the soil close to the bearing plate shows a gradual rise in displacement, highlighting the plate’s vital role in preserving the integrity of the pile. When the horizontal load hits 7600 kN, the system reaches its maximum capacity. At this point, the surrounding soil exhibits significant torsion, and substantial displacements can be observed on both sides of the pile, indicating that the soil can no longer effectively carry the load. Consequently, the testing was halted to prevent further failure.
3.4. Comparative Analysis of Soil Displacement Between Left and Right Sides of Pile Under Horizontal Damage Condition
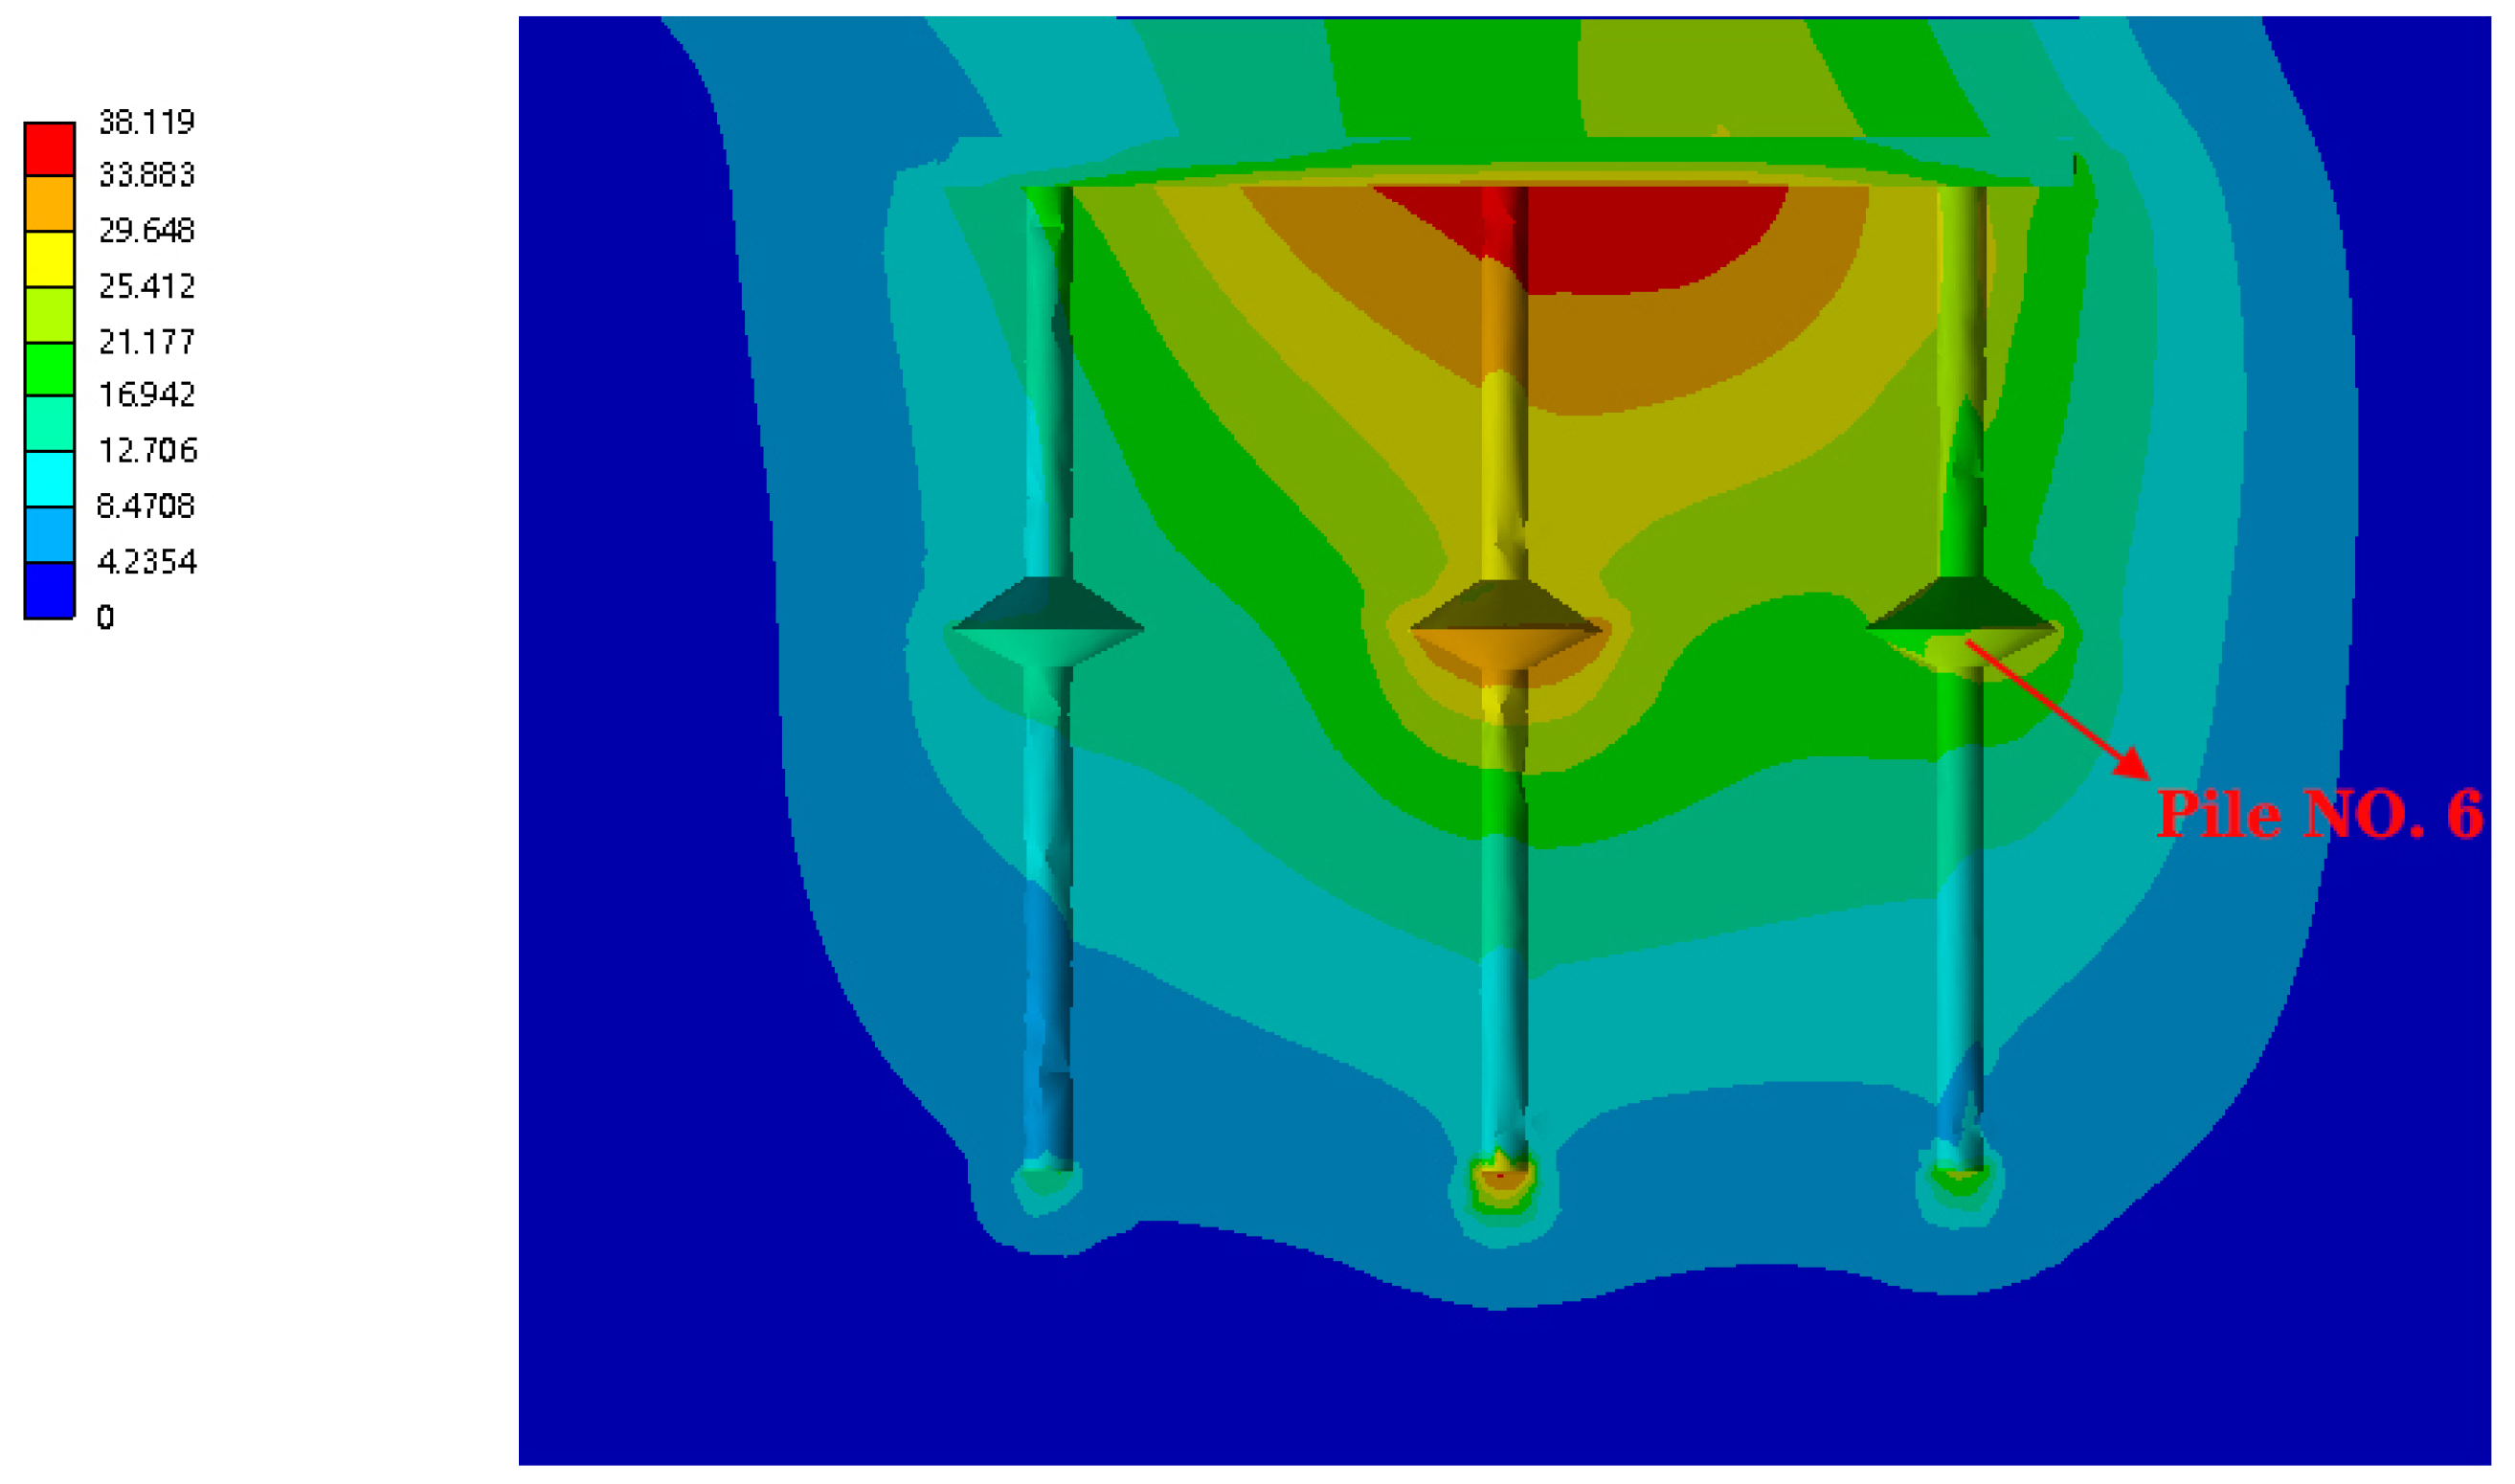
Using group L3 as a benchmark, pile No. 6 was chosen for analysis, with its contact surface with the surrounding soil divided into 16 evenly spaced points labeled 1 through 16, arranged from top to bottom. Points 1 to 3 were situated near the lower section of the load-bearing platform, points 4 to 7 occupied the upper portion of the pile shaft, points 8 to 9 were positioned in the top part of the bearing plate, points 10 to 11 beneath the bearing plate, and points 12 to 16 were located towards the bottom of the pile shaft. The nodal diagram illustrating the pile structure is presented in
Figure 13, while
Figure 14 displays the soil displacement distribution during failure in group L3. Additionally,
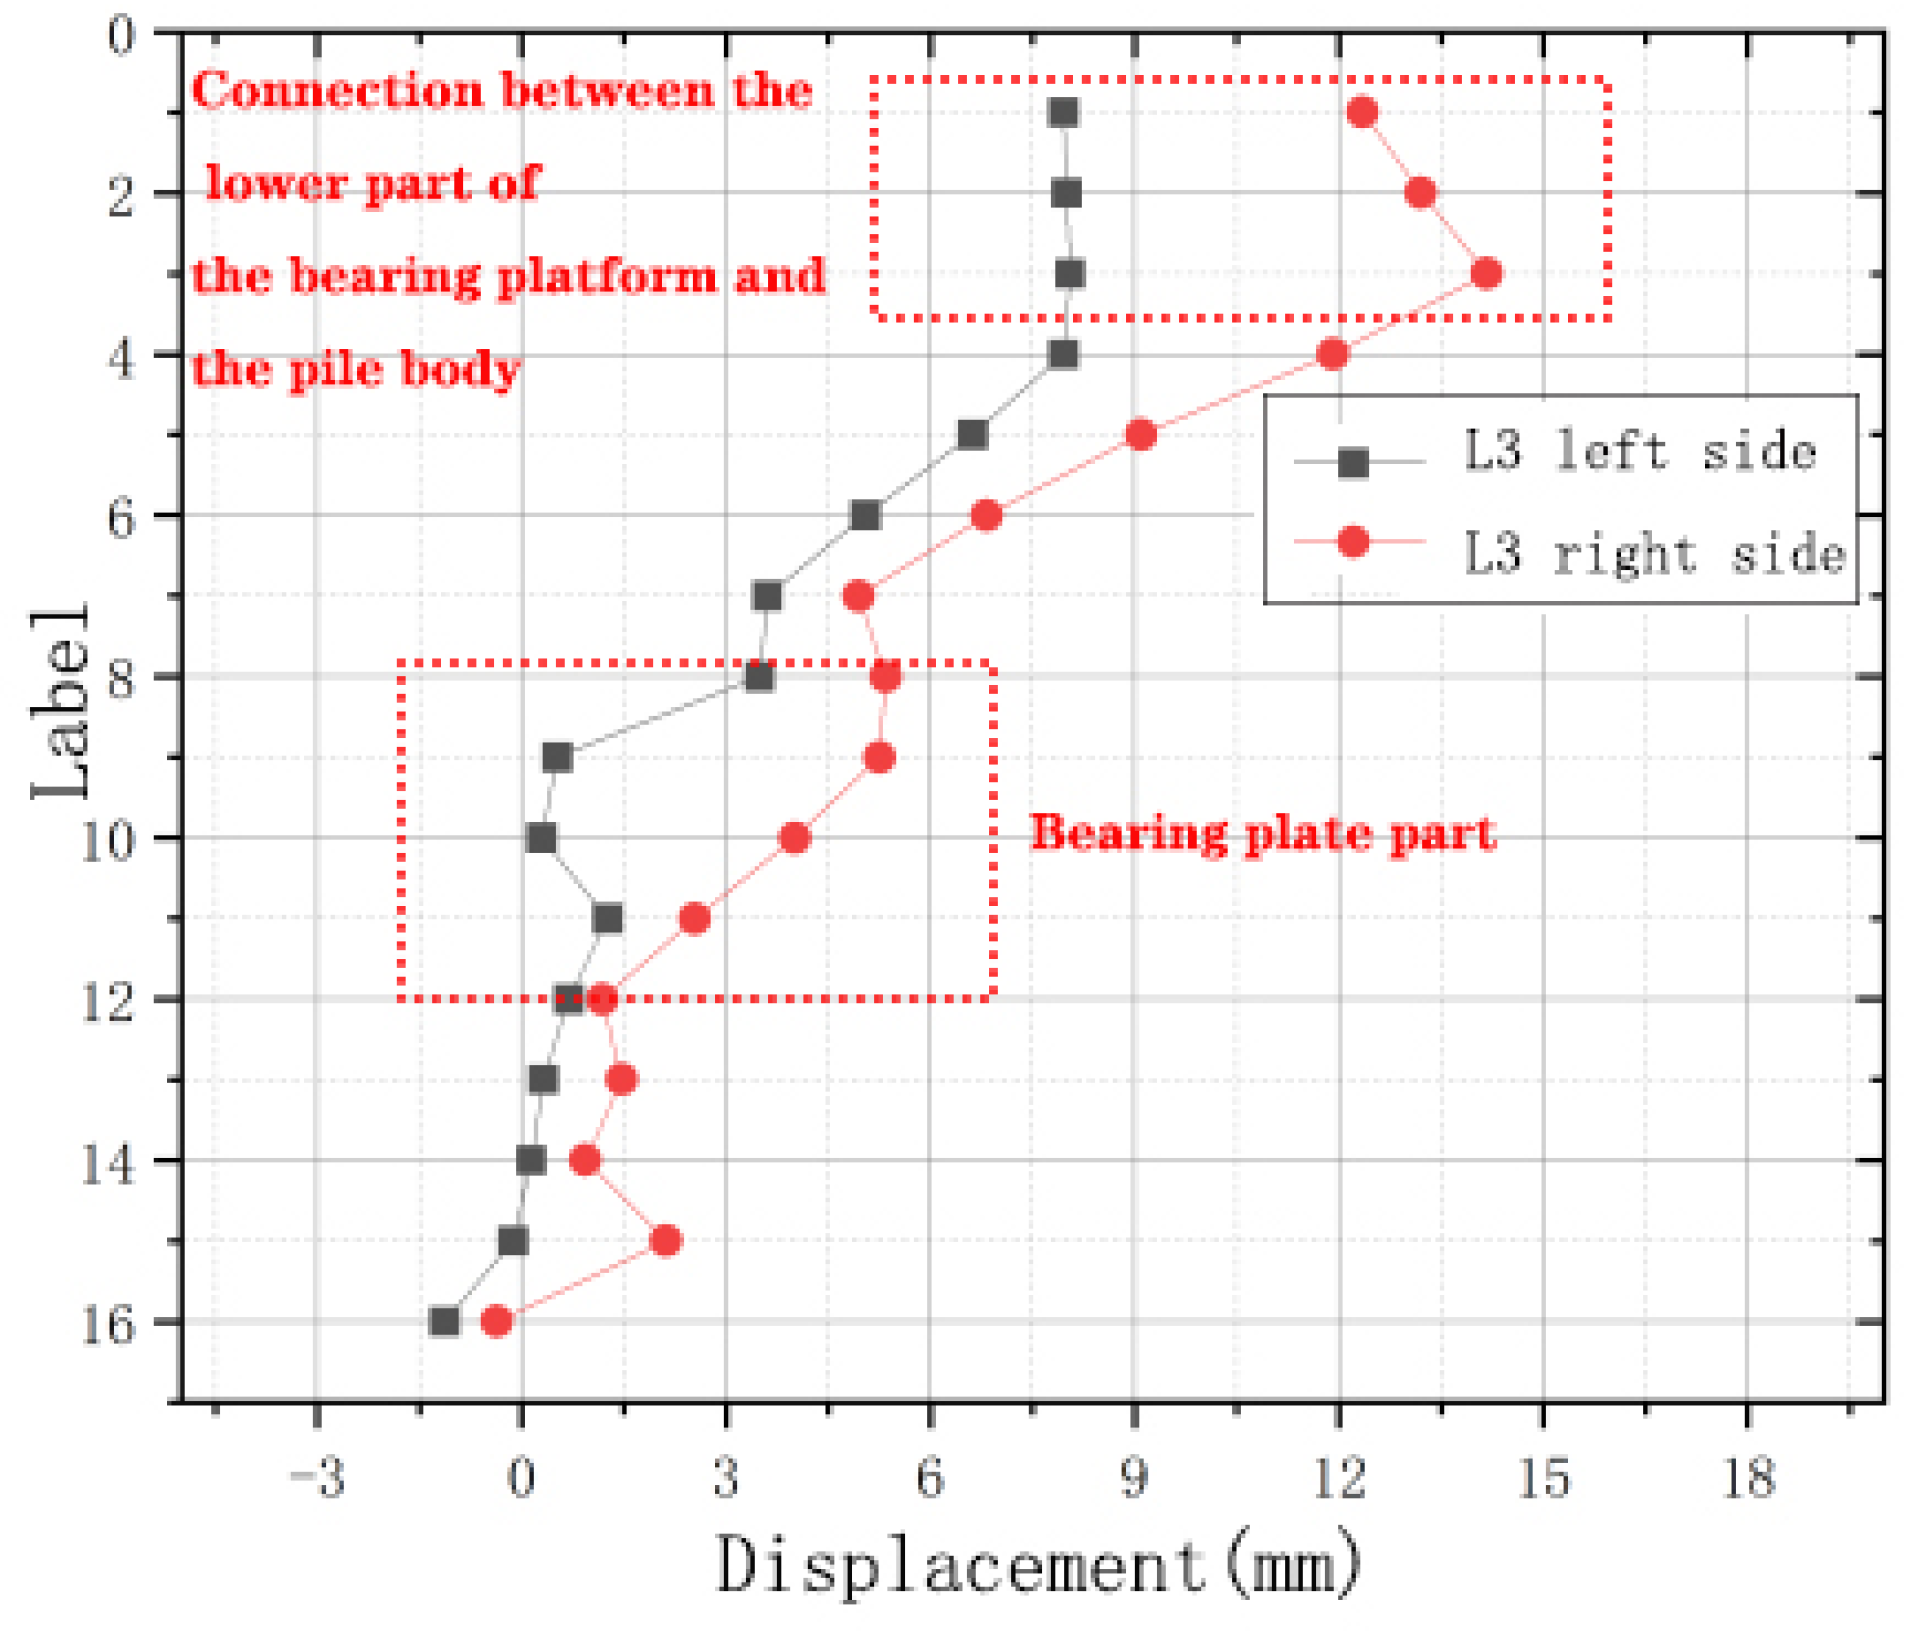
Figure 15 charts the horizontal movement of soil nodes on both sides of pile No. 6 within the same group.
As in
Figure 9, first of all, the load–displacement curves of the five sets of low-capping CEP six-pile foundations all follow the same pattern. When the load is the same, the soil displacement of pile No.6 in group L3 tilts overall to the right. The soil displacement curves on the left and right of the pile body of pile No.6 differ more in the upper half of the pile body. Under lateral loading, the pile’s top half starts rotating around a pivot within the pile body. This generates friction between the pile and surrounding soil, causing the soil on the right side of the pile to produce a reactive force. This interaction makes the right-side soil displacement larger than that on the left. Notably, the soil under the load-bearing platform displaces the most. For instance, at nodes 1–3, the soil displacement on the left side of the pile in group L3 is 7.9581 mm, 8.001 mm, and 8.0521 mm, respectively, while on the right side, it’s higher at 12.353 mm, 13.206 mm, and 14.173 mm. From node 4 onwards, soil displacement surges dramatically, showing that the load-bearing platform is vital for enhancing the pile’s overall stability.
Secondly, starting from node 4 (the upper half of the pile), the horizontal soil displacements on both sides of the pile decrease significantly, with a sharper drop on the right. Taking the bearing plate as a benchmark, soil movement near the pile within the plate, the upper pile segment, and the bearing platform is more pronounced than around the lower pile. This suggests these components bear most horizontal forces, reducing the lower pile’s tendency to rotate.
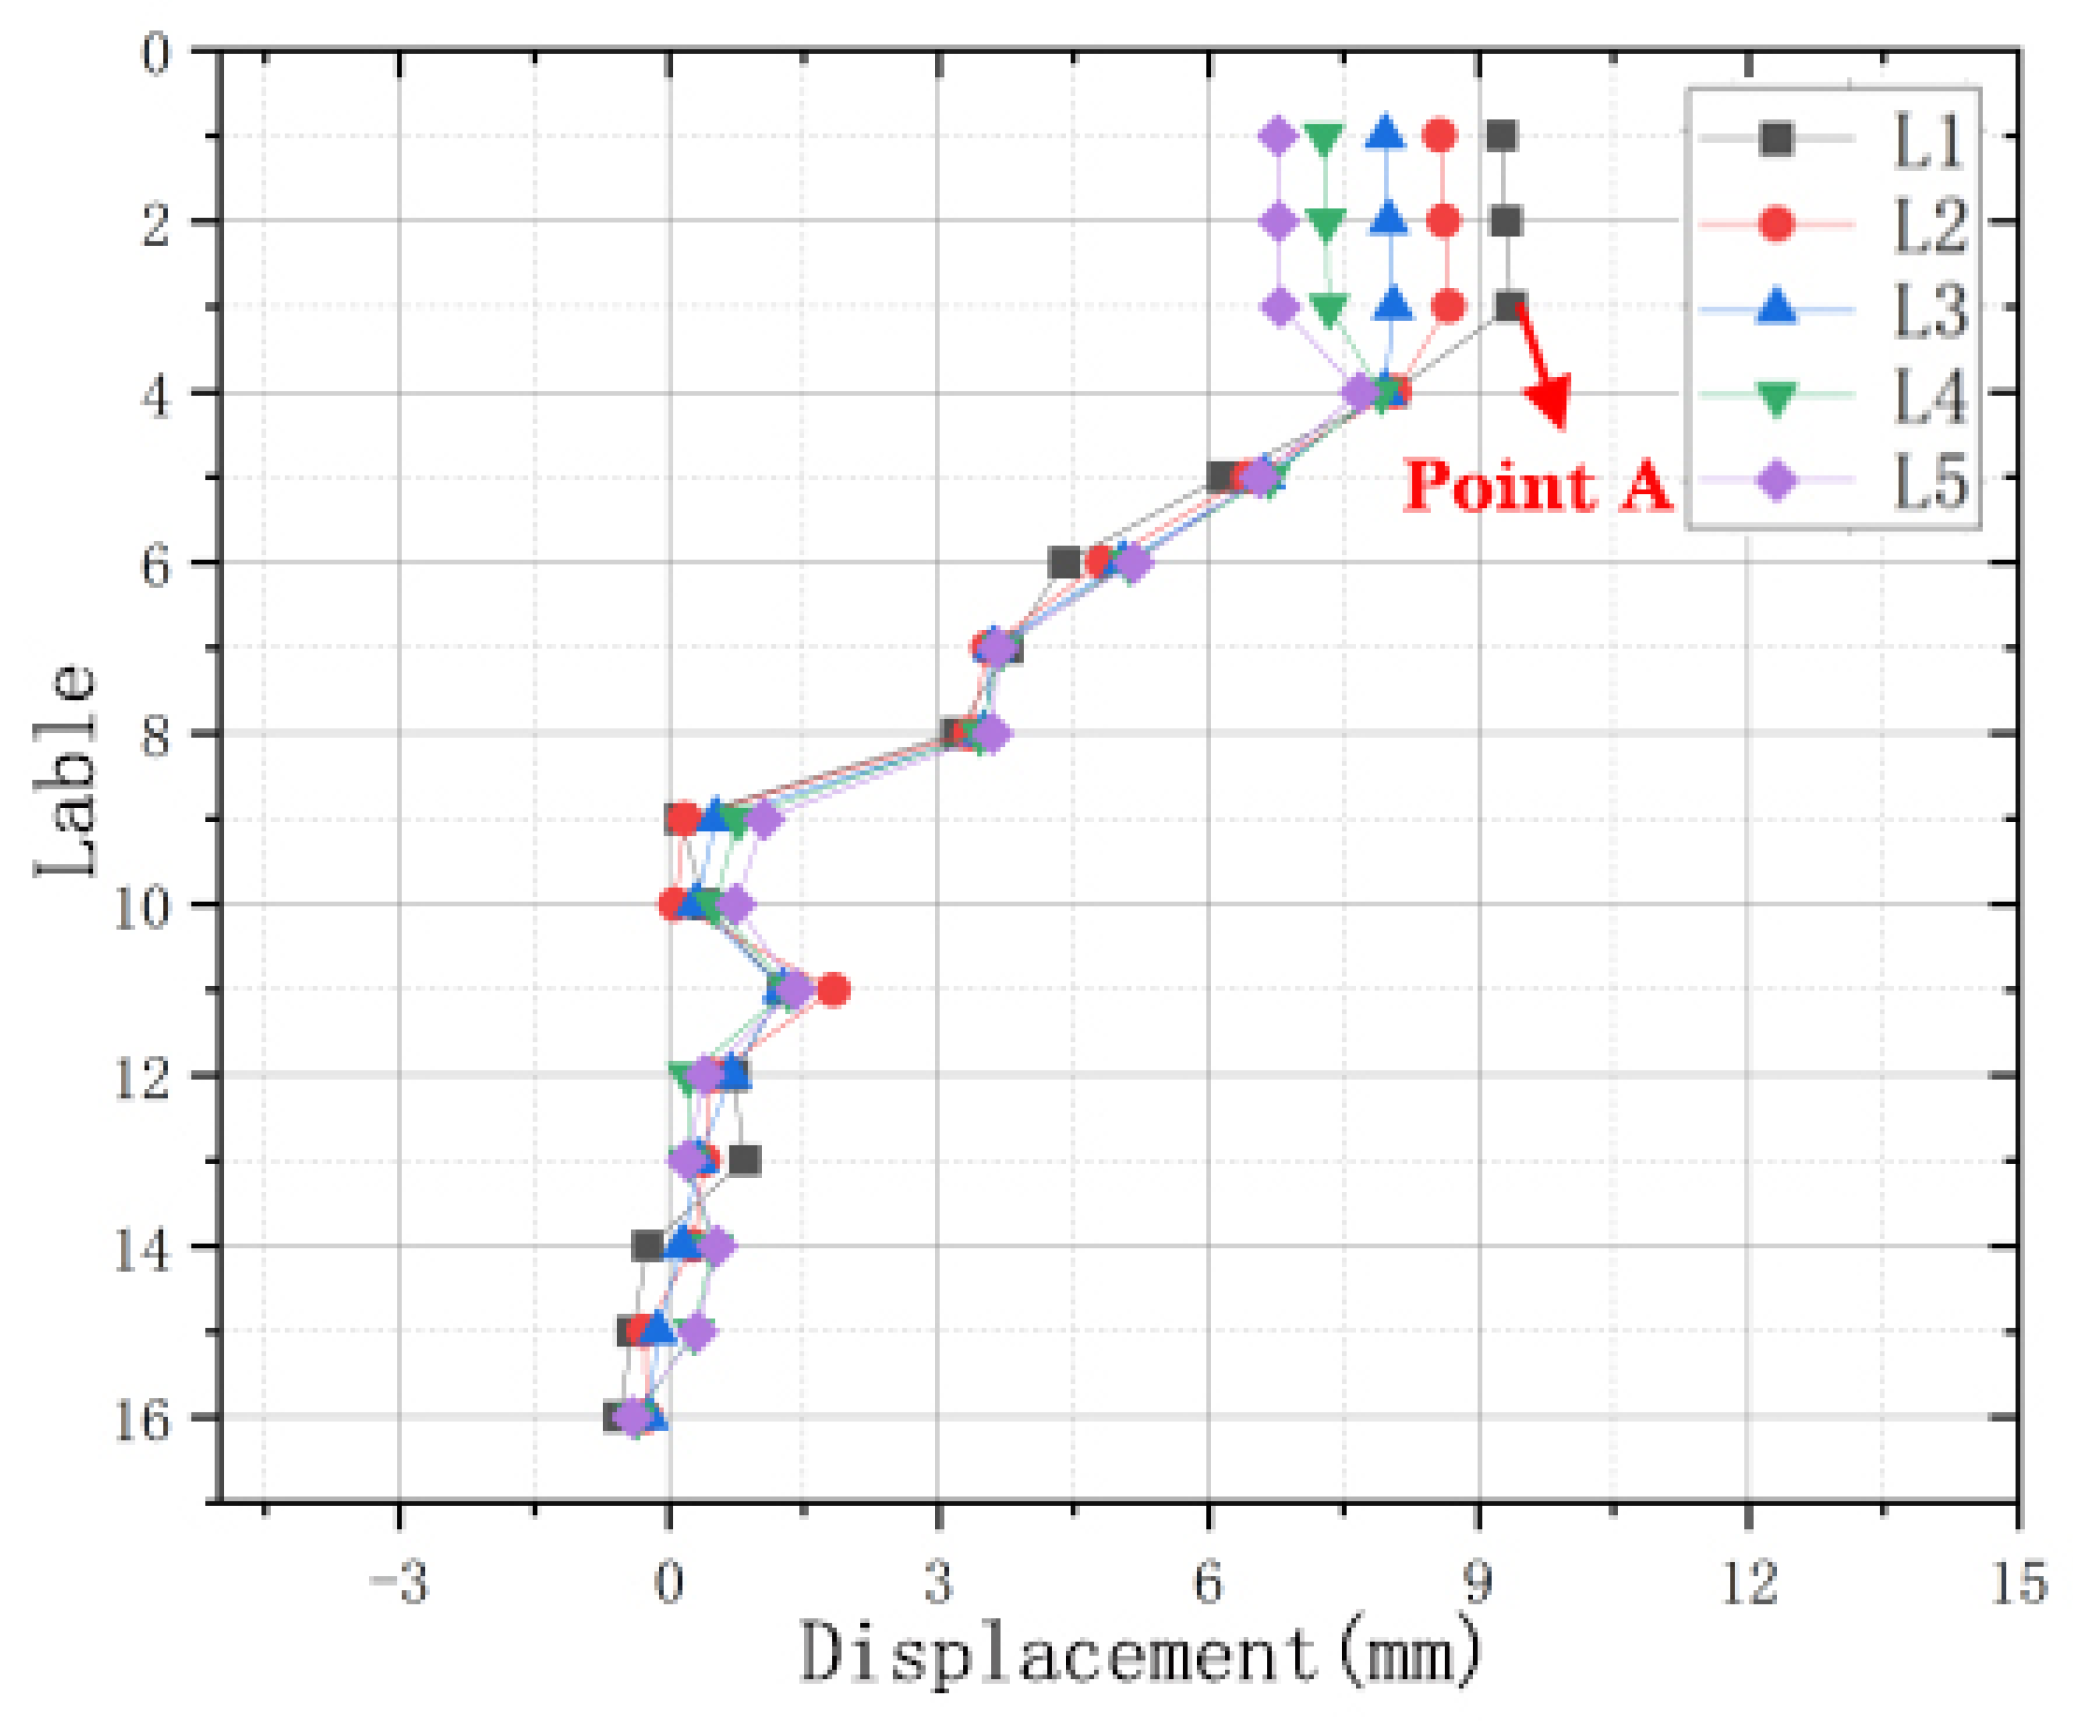
Considering the failure load of group L1, 6800 kN, as a benchmark, at this load level, the displacement of the soil on both sides of pile No. 6 in groups L1 to L5 was measured. These values were used to plot the deformation curves on each side of the pile, as shown in
Figure 16 and
Figure 17.
Figure 16 and
Figure 17 reveal several key insights. First, once the L1 group reaches the point of horizontal failure, the soil displacement patterns surrounding the pile in all five groups—L1 through L5—show remarkable similarity. The curve diagrams illustrate that as the pile begins to pivot around a specific point under lateral load, the soil on the right side exerts a reactive force on the pile. This interaction causes the soil on the right to consistently experience greater horizontal movement compared to the soil on the left.
Secondly, in group L1, the soil’s maximum left-side horizontal displacement appears at node 3, labeled as point A in the drawing. Node 3 is situated at the soil bottom where the support platform meets the pile body. Here, the displacement measures 9.3578 mm. In contrast, the other four groups have corresponding displacements of 8.6659 mm, 8.0521 mm, 7.3365 mm, and 6.7946 mm. Similarly, the soil’s maximum right-side displacement also occurs at group L1′s node 3 (point B in the drawing), reaching 14.438 mm. The other groups’ displacements at node 3 are 14.335 mm, 14.308 mm, 14.186 mm, and 14.173 mm. Comparing the maximum displacements on both sides of the pile reveals they both happen below the support platform. This underlines the key part the support platform plays in withstanding horizontal loads.
Finally, during the gradual reduction of soil horizontal displacement, there is a sudden change in the upper part of the bearing plate (nodes 7–9), and the displacement appears to increase, indicating that the bearing plate resists part of the horizontal load and contributes to enhancing the horizontal bearing capacity. More pronounced displacements appear in the bearing platform, the upper half of the pile body, and the bearing plate. This shows these parts take on most of the horizontal load and effectively reduce its impact on the lower half of the pile body.
3.5. Analysis of Stress Results for Low-Capping CEP Six-Pile Foundation
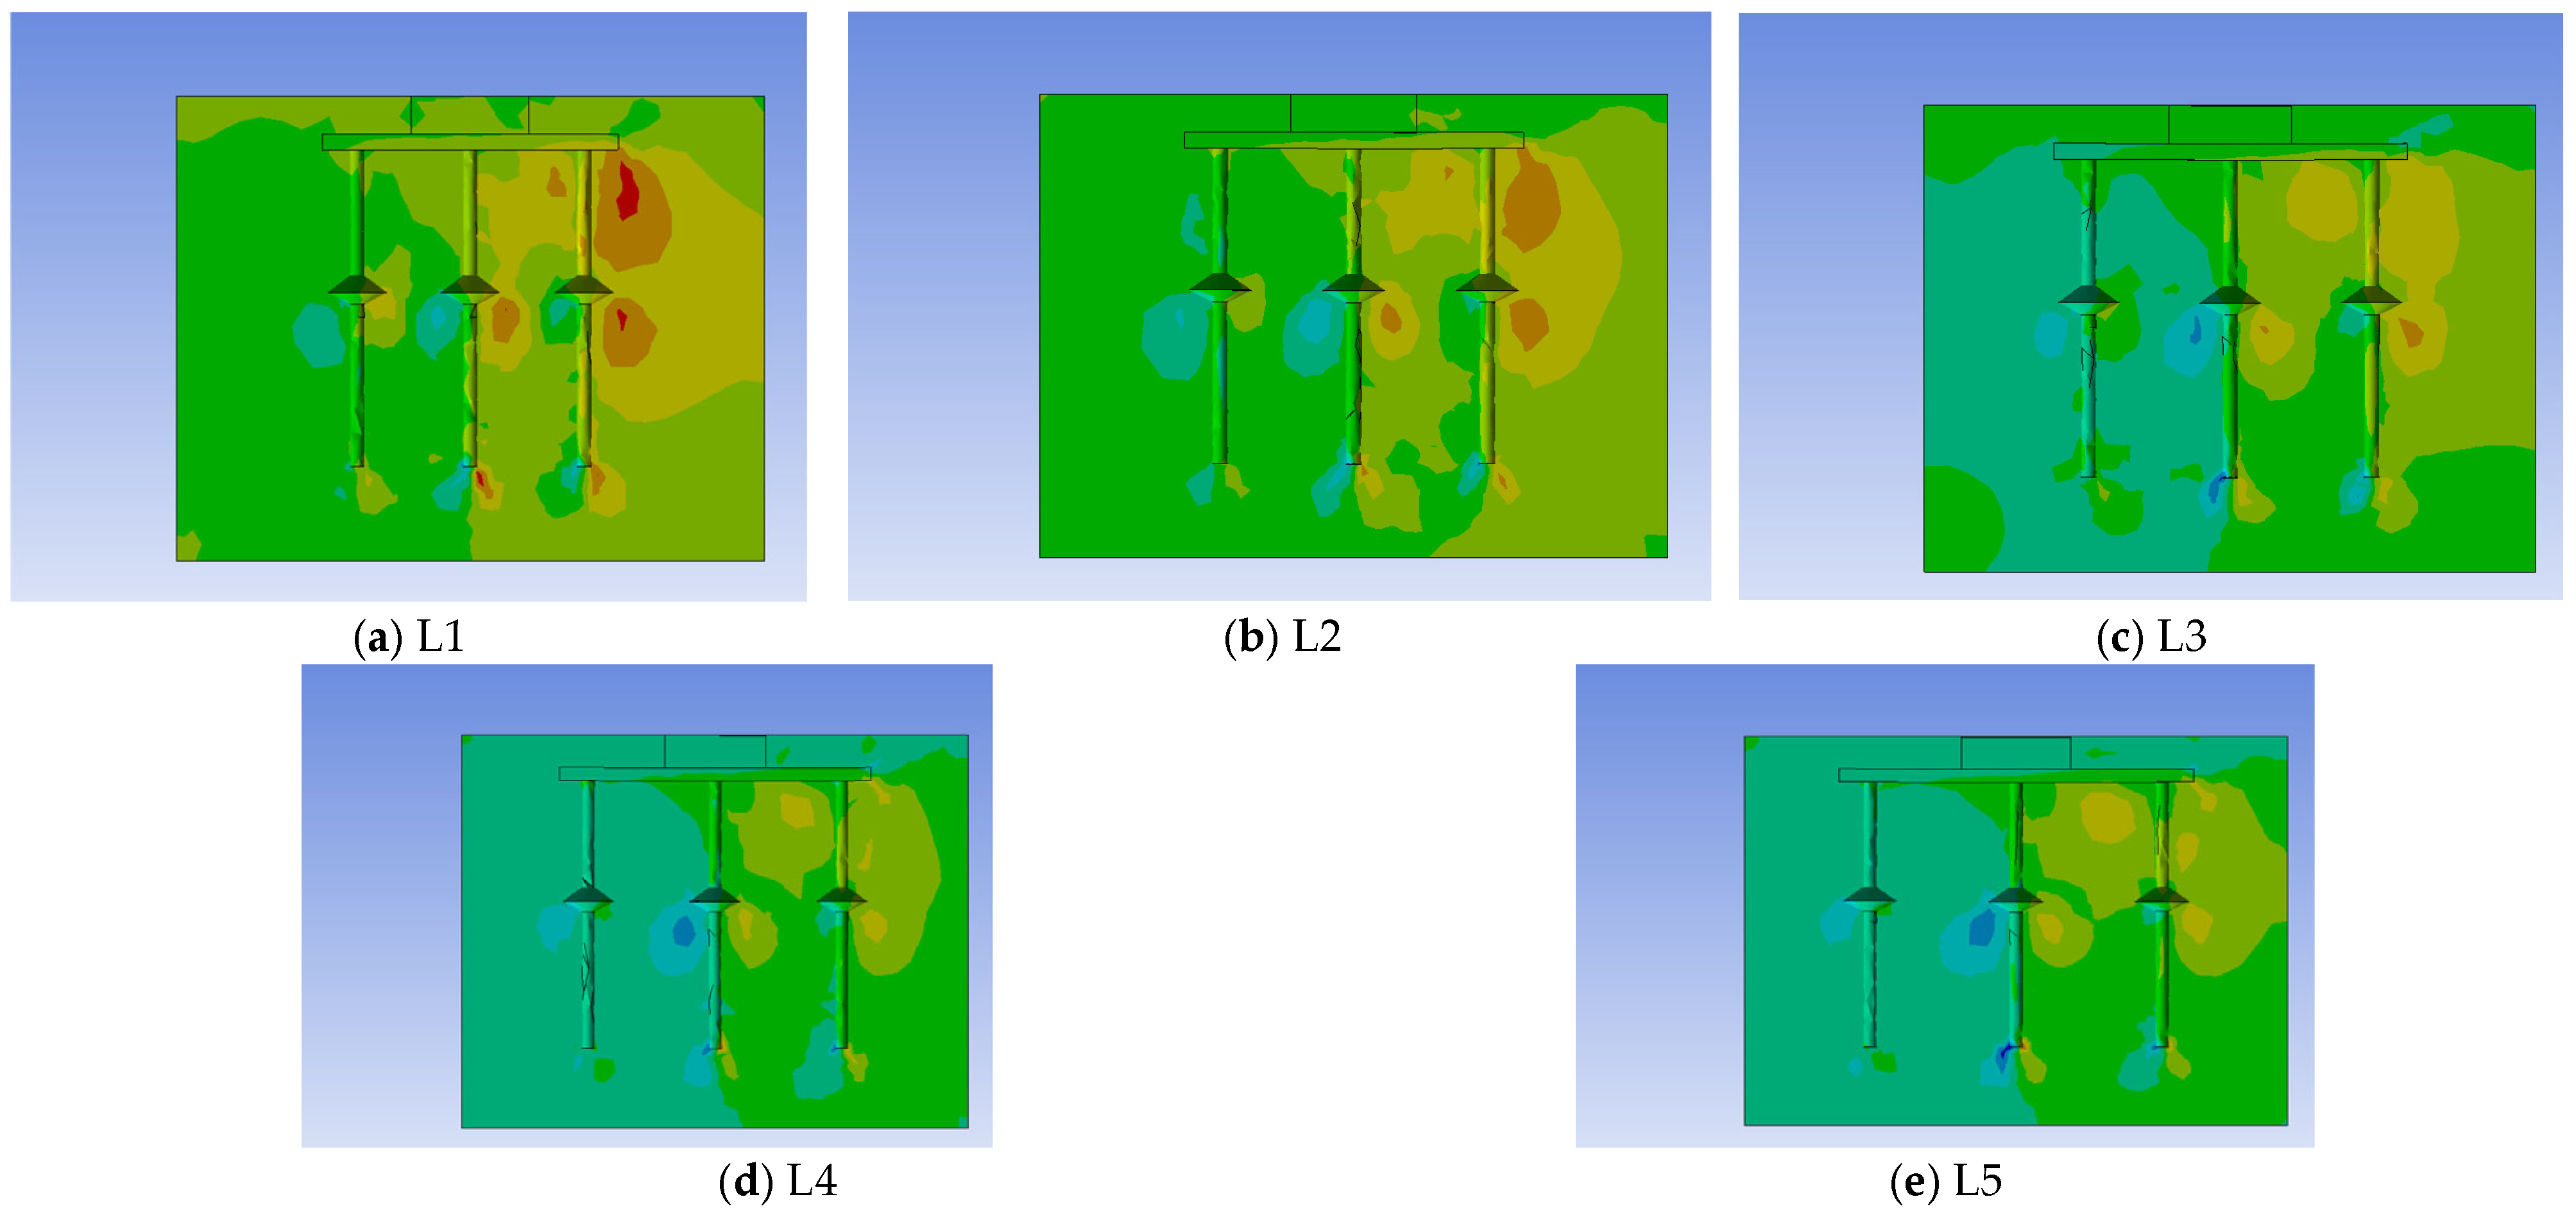
When the internal shear stress is greater than the shear strength of the soil itself, the shear damage is caused, which makes it no longer able to withstand the load. In the process of low cap CEP six pile foundation, the interaction between the support platform, the pile body and the surrounding soil is intensified, which leads to collapse of the soil. In order to make a more intuitive observation of the damage condition of the soil, the XY-Z stress distribution cloud of the soil surrounding the piles in groups L1 to L5 was extracted, as illustrated in
Figure 18.
The following can be seen from
Figure 18. First of all, as shown in
Figure 18a–e, under horizontal loading, the stress-affected zone around the pile in the soil is mainly on the right side of the low-capping CEP six-pile foundation. This zone is primarily concentrated at the lower parts of the bearing platform and bearing plate, as well as the pile end. These findings indicate that both the bearing platform and bearing plate are crucial for resisting horizontal loads.
Next, the comparison between
Figure 18d,e shows that there is no apparent decreasing tendency in the area of stress affecting the surrounding soil. This is because with increased pile spacing, under the joint action of the pile-soil-bearing platform, the range of stress on the soil around the pile increases, which may induce soil shear failure. Therefore, there exists an optimal range for pile spacing, and increasing spacing beyond this range does not necessarily improve performance.
Finally, in the XY shear stress cloud diagram, the stress effect area is reduced as the distance between the pile and the pile increases. The reason for this is that as the distance between piles increases, the area of horizontal load on the soil decreases, and the possibility of shear damage is reduced. Therefore, boosting pile spacing can enhance the soil’s inherent load-bearing capacity. Meanwhile, as the pile spacing increases, the stress concentration phenomenon at the bottom of the right support plate gradually diminishes, due to the expanded interaction area between the support platform and the soil, so that a portion of the horizontal load is shared, the effect of the horizontal load on the supporting plate is reduced, and the influence of the soil near the support plate is reduced. The soil surrounding the support platform and the support plate is subjected to high stress. When the shear stress is higher than the critical threshold, it causes failure of the soil shear, which affects the stability of the structure. For this reason, the shear strength of the soil near the support platform and the support board should be in accordance with the relevant criterion.
4. Conclusions
Based on finite element simulation analysis of low-capping CEP six-pile foundations under composite loading with varying pile spacing, the following conclusions are drawn.
First of all, it was found that the bearing capacity of the low cap CEP group increased with the increase in the distance between the piles, but the increase in carrying capacity was not proportional. Hence, when the pile spacing exceeded four times the plate’s diameter, the low-cap CEP pile’s bearing performance was not significantly enhanced. In practical engineering, the ideal pile spacing should be between three and four times the cantilever diameter.
Moreover, the shear strength of the soil near the support platform and the support board should meet the related specifications, thus guaranteeing the integrity of the group pile.


