Article

Proactive and Data-Driven Decision-Making Using Earned Value Analysis in Infrastructure Projects

by
Bayram Ateş
and
Mohammad Azim Eirgash
*
Civil Engineering Department, Karadeniz Technical University, Trabzon 61080, Türkiye
*
Author to whom correspondence should be addressed.
Buildings 2025, 15(14), 2388; https://doi.org/10.3390/buildings15142388
Submission received: 22 June 2025 / Revised: 3 July 2025 / Accepted: 5 July 2025 / Published: 8 July 2025
(This article belongs to the Section Construction Management, and Computers & Digitization)

Abstract

Timely and informed decision-making is essential for the successful execution of construction projects, where delays and cost overruns frequently pose significant risks. Earned value analysis (EVA) provides a robust, integrated framework that combines scope, schedule, and cost performance to support proactive project control. This study investigates the effectiveness of EVA as a decision-support tool by applying it to two real-life construction case studies. Key performance indicators, including Cost Performance Index (CPI), Schedule Performance Index (SPI), Estimate at Completion (EAC), and Estimate to Complete (ETC), are calculated and analyzed over a specific monitoring period. The analysis revealed a 15.36% cost savings and a 10.42% schedule improvement during the monitored period. By comparing planned and actual performance data, the study demonstrates how EVA enables early detection of deviations, thereby empowering project managers to implement timely corrective actions. The findings highlight EVA’s practical utility in improving project transparency, enhancing cost and schedule control, and supporting strategic decision-making in real-world construction environments.

1. Introduction

The foundational principles of earned value analysis (EVA) emerged as a comprehensive project management technique integrating scope, schedule, and cost metrics. Initial applications demonstrated EVA’s ability to provide objective performance measurements through indices like CPI and SPI, offering project managers valuable tools for deviation detection and cost forecasting. These early implementations, however, relied heavily on manual data collection processes that limited their effectiveness in dynamic project environments [1].
As infrastructure projects grew in scale and complexity, researchers began documenting the constraints of traditional EVA approaches. Studies highlighted how periodic manual reporting cycles created responsiveness gaps, particularly in projects characterized by long durations, large resource requirements, and intricate activity interdependencies [2]. This period saw increased recognition of EVA’s potential as a proactive decision-making tool, though its effectiveness as an early warning system remained constrained by data latency issues.
Ippakayal et al. [3] reviewed project management practices involving EVA, outlining its development, core terminology, and effective application. They highlighted that EVM not only evaluates project performance but also measures schedule progress, serving as a forecasting tool that provides early warnings related to cost and schedule deviations. In the conclusion of their article, they noted that Primavera is a reliable software capable of quickly and accurately calculating earned value and its associated parameters.
Lipke et al. [4] made significant contributions by developing systematic approaches to determine total project costs and durations using EVA principles. Their work provided project managers with more structured decision-making frameworks, enhancing EVA’s practical application in construction projects.
In the study conducted by Bahar [5], the EVM method was applied to the Marmaray Project using MS Project software. The study began with a general introduction to the implementation project, followed by time and resource planning within the scope of project management. Earned value calculations were carried out in three phases, analyzing schedule and cost variances, and performance indices were computed to make forward-looking forecasts. Additionally, the study explored precautionary measures that should be taken to mitigate the negative impacts of these variances.
Borrmann et al. [6] pioneered the integration of smart sensor technologies with EVA systems. Their research demonstrated how automated progress measurements could dramatically improve data accuracy and update frequency. This work marked a crucial transition from manual to automated data capture, significantly enhancing EVA’s timeliness and reliability for infrastructure projects.
Gürbüzer [7] applied the EVM method to a shipyard project with the help of MS Project software. The study concluded that, in Turkey, planning and control are not given adequate importance in both public and private sector projects, leading to a significant waste of financial and other resources. As a recommendation, the study emphasized that the transformation in project management understanding should be a shared responsibility among all project stakeholders, particularly the managers. It was highlighted that achieving the expected outcomes from public or private sector projects, often carried out under limited conditions, is only possible if all parties act with a strong sense of this shared responsibility.
Similarly, Oesterreich and Teuteberg [8] emphasized the role of digital technologies in transforming construction project management. The integration of real-time data streams with EVA metrics became a focal point, enabling continuous performance monitoring and more proactive control frameworks.
Zhang et al. [9] conducted a study in China to identify the causes of delays in tunnel construction projects by surveying 91 companies, including 87 tunnel consultants and contractors, through questionnaires. As a result of this study, they identified a total of 49 delay causes, with the main ones being complex geological conditions, delayed payments by the project owner, awarding the project to the lowest bidder, shortages of construction materials, lack of equipment efficiency, low labor productivity, project postponement, delays in the supply of construction materials, late handover of the site by the landowner to the contractor, and ineffective project scheduling by the contractor.
Kaplan [10] illustrated that how project planning and control methods can be utilized to minimize costs. A simulated construction project was developed for this purpose, where CPM, PERT, and EVM techniques were implemented. The project was initially planned to achieve the lowest possible costs. Throughout the project’s execution, EVM was employed to monitor whether the actual costs aligned with the planned figures. Additionally, the projected final cost was estimated, highlighting any discrepancies between the planned and actual performance.
The late 2010s witnessed a surge in research combining EVA with artificial intelligence. Love et al. [11] conducted comprehensive reviews of AI applications in construction.
Shaik et al. [12] focused on EVA’s role in ensuring timely project completion, providing empirical evidence of its monitoring and control capabilities throughout project lifecycles. Their work helped bridge the gap between theoretical EVA models and practical construction applications.
Eirgash and Baltacı [13] conducted important work in validating EVA as a comprehensive project management method. Their research confirmed EVA’s effectiveness in combining cost, schedule, and scope metrics to estimate project completion dates, while also highlighting proper implementation requirements.
In the study conducted by Eirgash et al. [14], the aim was to demonstrate how performance measurement using the EVM method is applied both theoretically and practically in a small-scale construction project, thereby contributing to broader practical implementation. Additionally, the study provided a detailed explanation of how project performance can be analyzed through EVM in project management, highlighting the meaning of indices such as the BCWP and the BCWS, as well as the use of the relationship between the CPI and the SPI.
Long Chen [15] proposed innovative methodologies to enhance planned value (PV) predictions through advanced modeling techniques. His work addressed some of EVA’s forecasting limitations, particularly in complex infrastructure environments.
Subramani et al. [16] emphasized that the Earned Value Management (EVM) method holds significant value, offering unique features that can benefit clients, consultants, and the industry. They analyzed two projects using software tools such as MS Project and Primavera P6. The results showed a strong correlation between the outputs of each software, with final outcomes achieving over 99.5% accuracy. Another key finding of the study was that, when a new parameter, SV(t) (schedule variance over time), which is not available in MS Project 2007 or Primavera 6, was defined and integrated into the developed software, the final result achieved nearly 100% accuracy.
Koçak [17] applied the EVM method using Primavera P6 software to a shopping mall construction project carried out in the Russian Federation between 2016 and 2018. Additionally, in the Section 4 of the study, it was emphasized that, despite the widespread use of Primavera P6 as a “cost control tool with EVM” in the construction industry, particularly in international projects, there is a noticeable lack of academic reviews or case studies in this area, while Liu et al. [18] developed sophisticated fuzzy neural network models to handle uncertainty in large-scale projects.
Din et al. [19] investigated the causes of construction delays in Pakistan through a survey study involving employers, consultants, and contractors from 20 residential projects. The results revealed that the main causes of delays were an inefficient decision-making process, client interference, unsafe working conditions, change in orders, a lack of skilled subcontractors, poor financial management, and design errors.
Ottaviani et al. [20] propose progress-based performance factors (PFs) to enhance EVA and earned schedule (ES) forecasts without added complexity. By dynamically adjusting PFs based on project progress, their method improves the accuracy of cost and duration EAC. Testing on 65 construction projects demonstrated superior forecasting performance compared to standard EVM/ES approaches, offering practitioners adaptable tools to refine predictions.
Yalçın et al. [21] evaluate machine learning (ML) techniques to enhance EVA-based cost estimation in construction projects. By comparing traditional EVA with ML models (e.g., regression, neural networks), the study demonstrates that ML improves cost forecasting accuracy, particularly in complex projects. The findings support integrating data-driven approaches with EVM for more reliable project controls.
Nejatyan et al. [22] employ a Delphi survey to identify critical success factors for improving construction project performance through an EVM-based value engineering (VE) strategy. The study highlights key managerial and operational drivers, such as stakeholder alignment, integrated cost-schedule control, and risk-aware decision-making, that enhance EVM-VE synergy. The findings provide a structured framework for implementing value-driven performance optimization in construction projects.
Similarly, Barrientos-Orellana et al. [23] compare the stability and accuracy of deterministic cost prediction methods in EVA. The study evaluates traditional and modified EVM forecasting formulas, identifying conditions under which certain methods (e.g., hybrid or weighted approaches) outperform standard techniques in terms of reliability and precision. The findings help practitioners select optimal cost prediction strategies based on project phase and uncertainty levels.
Most recently, Tukundane and Yang [24] examine how project control practices (e.g., EVM and scheduling) enhance performance in Ugandan construction firms. Their Kampala case study shows formalized controls improve cost efficiency, schedule adherence, and client satisfaction, highlighting the value of adaptable systems in resource-limited settings. Thus, the literature on EVA application to industrial sectors is given in Table 1.
This study’s novelty stems from its empirical validation of EVA through real-world case studies, demonstrating its cost-saving and schedule-recovery potential and providing a framework for proactive decision-making in infrastructure projects. The findings offer both theoretical advancements and practical tools for project managers, making it a valuable contribution to construction management literature. The highlight of this study is as follows:
  • A tool to monitor and control the cost, time, and work conducted of a construction project.
  • Provides an “Early Warning” signal for immediate corrective action.
  • Forecasting the total project cost.
  • It compares the planned amount of work with what has actually been completed to determine if cost, schedule, and work accomplished are progressing as planned.
  • The present study aims to show the theoretical dimension of performance measurement on construction projects and thereby contribute to its wider practical application.
  • The coding and implementation of these analyses were performed using MATLAB and Excel.
The paper arrangement is as follows: Firstly, the basic concept; straightaway, the importance of the construction project relevant to the earned value analysis is given in well-figured explanations. Two case example problems are considered to exhibit the effectiveness of earned value analysis in construction projects. Ultimately, the discussion and conclusion are presented in order.

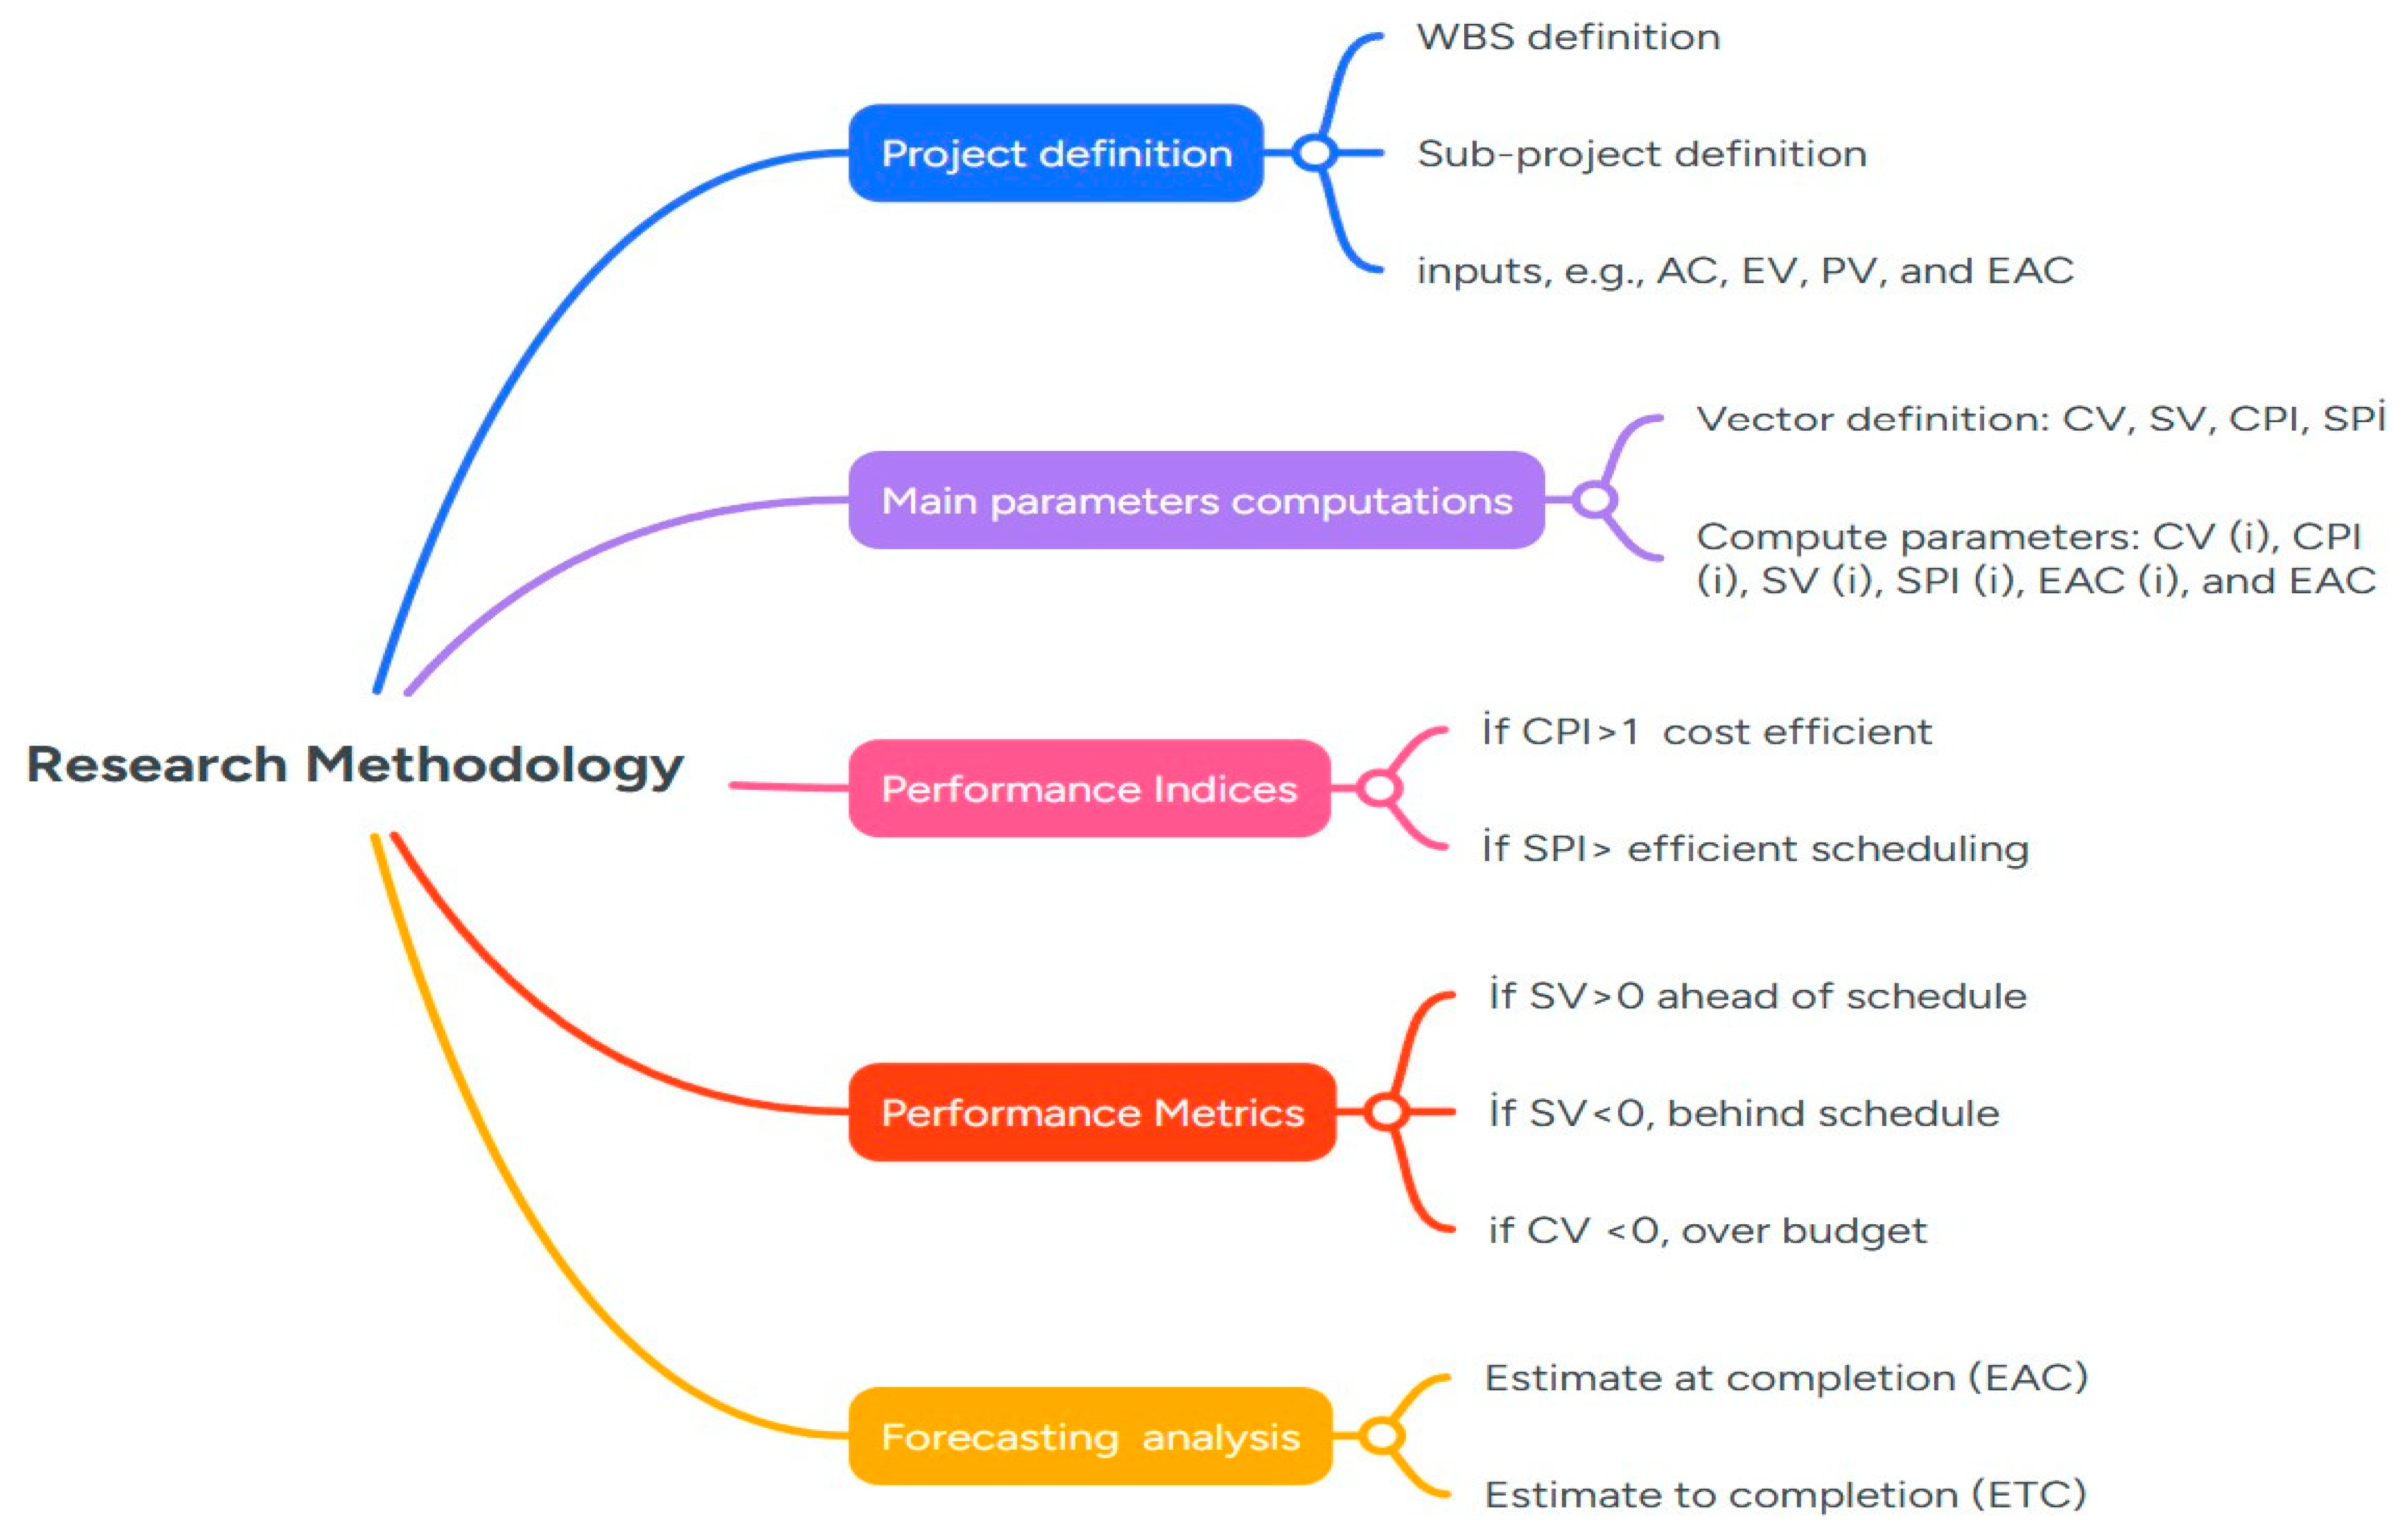
2. Visual Methodology Map

Earned value analysis (EVA) is a structured project management technique that integrates scope, schedule, and cost to measure performance and forecast outcomes. It begins with baseline establishment (WBS, budget, and schedule), followed by data collection (planned value, earned value, and actual cost). These metrics feed into performance analysis (variances and efficiency indices) to detect deviations. EVA then enables predictive forecasting (EAC and VAC) to estimate final project results. Based on insights, managers implement corrective actions. The methodology followed to perform the EVA method is depicted in Figure 1.

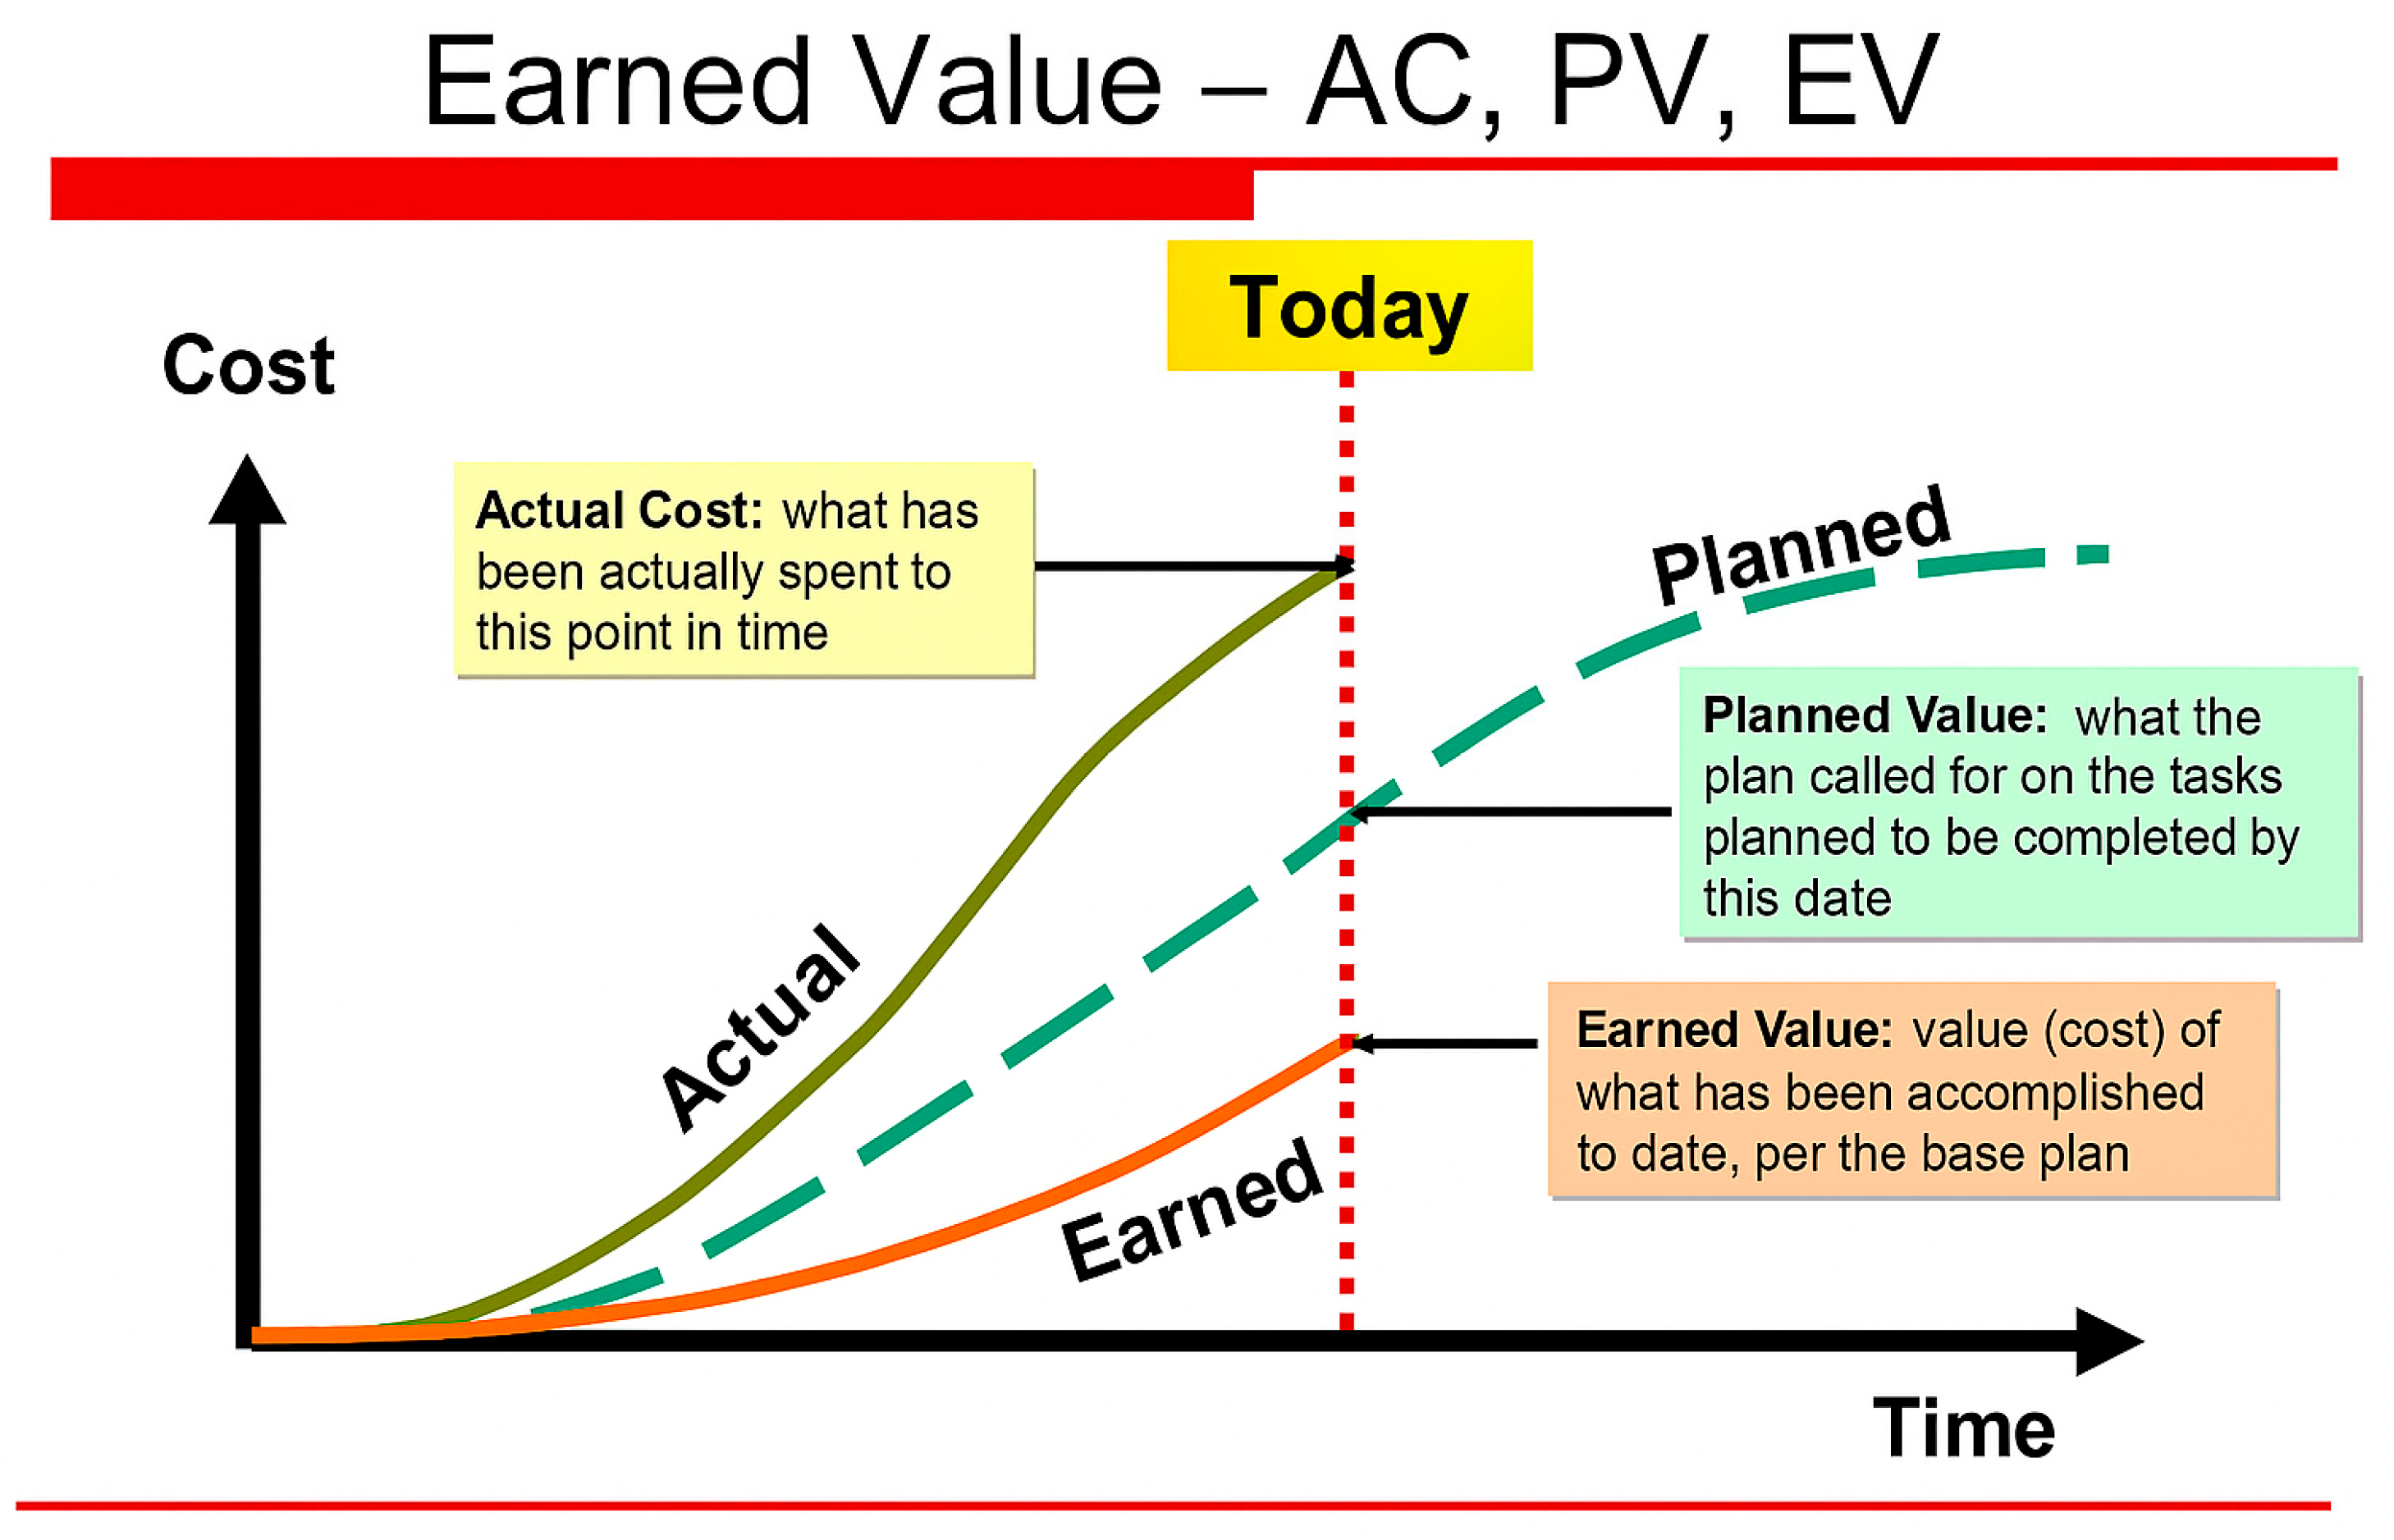
2.1. The Earned Value Management

EVM integrates a project’s scope, schedule, and cost into a unified set of metrics to track and predict project performance. Most key EVM terms are detailed in Table 2.

Basic Concepts of Earned Value Method

Figure 2 presents a project performance evaluation framework based on two key earned value management (EVM) metrics: the Cost Performance Index (CPI) and the Schedule Performance Index (SPI). CPI measures how efficiently the project is using its budget by comparing the budgeted cost of work performed to the actual cost. SPI measures schedule efficiency by comparing the budgeted cost of work performed to the budgeted cost of work scheduled.
The framework categorizes project performance into four zones based on whether CPI and SPI values are above or below 1.
Zone I (Ahead-Losses) occurs when the project is ahead of schedule (SPI > 1) but over budget (CPI < 1). This often results from accelerating work with additional resources, increasing costs. Cost control is essential in this zone.
Zone II (Behind-Profit) describes projects that are under budget (CPI > 1) but behind schedule (SPI < 1). In this case, delays exist despite cost savings, so schedule recovery is critical.
Zone III (Behind-Losses) represents poor performance in both cost and schedule (CPI < 1 and SPI < 1), indicating serious issues that require urgent corrective actions to avoid project failure.
Zone IV (Ahead-Profit) is the ideal scenario where the project is both ahead of schedule and under budget (CPI > 1 and SPI > 1). This reflects effective planning and execution, though it is rare in practice.
Similarly, Figure 3 clearly describes the earned value analysis chart. The BCWS values for each project activity form the foundation for comparing BCWP and ACWP throughout the project lifecycle. The gap between planned and actual values is assessed using two types of variances, offering a clear indication, positive or negative of the project’s financial performance. Cost variance (CV) measures how well the actual costs align with the budget and is determined by subtracting the actual cost from the earned value (CV = EV − ACWP). Schedule variance (SV), on the other hand, is the difference between the earned value and the planned value (SV = EV − BCWS). In general, positive variance values indicate that the project is progressing within budget and on schedule, whereas negative values suggest budget overruns and schedule delays.

3. Numerical Simulations Application

This study examines two construction projects analyzed through EVA. The EVA model was implemented using MATLAB (R2024b) and executed on a system powered by an Intel® Core™ i3 processor (2.40 GHz) with 3 GB of RAM.

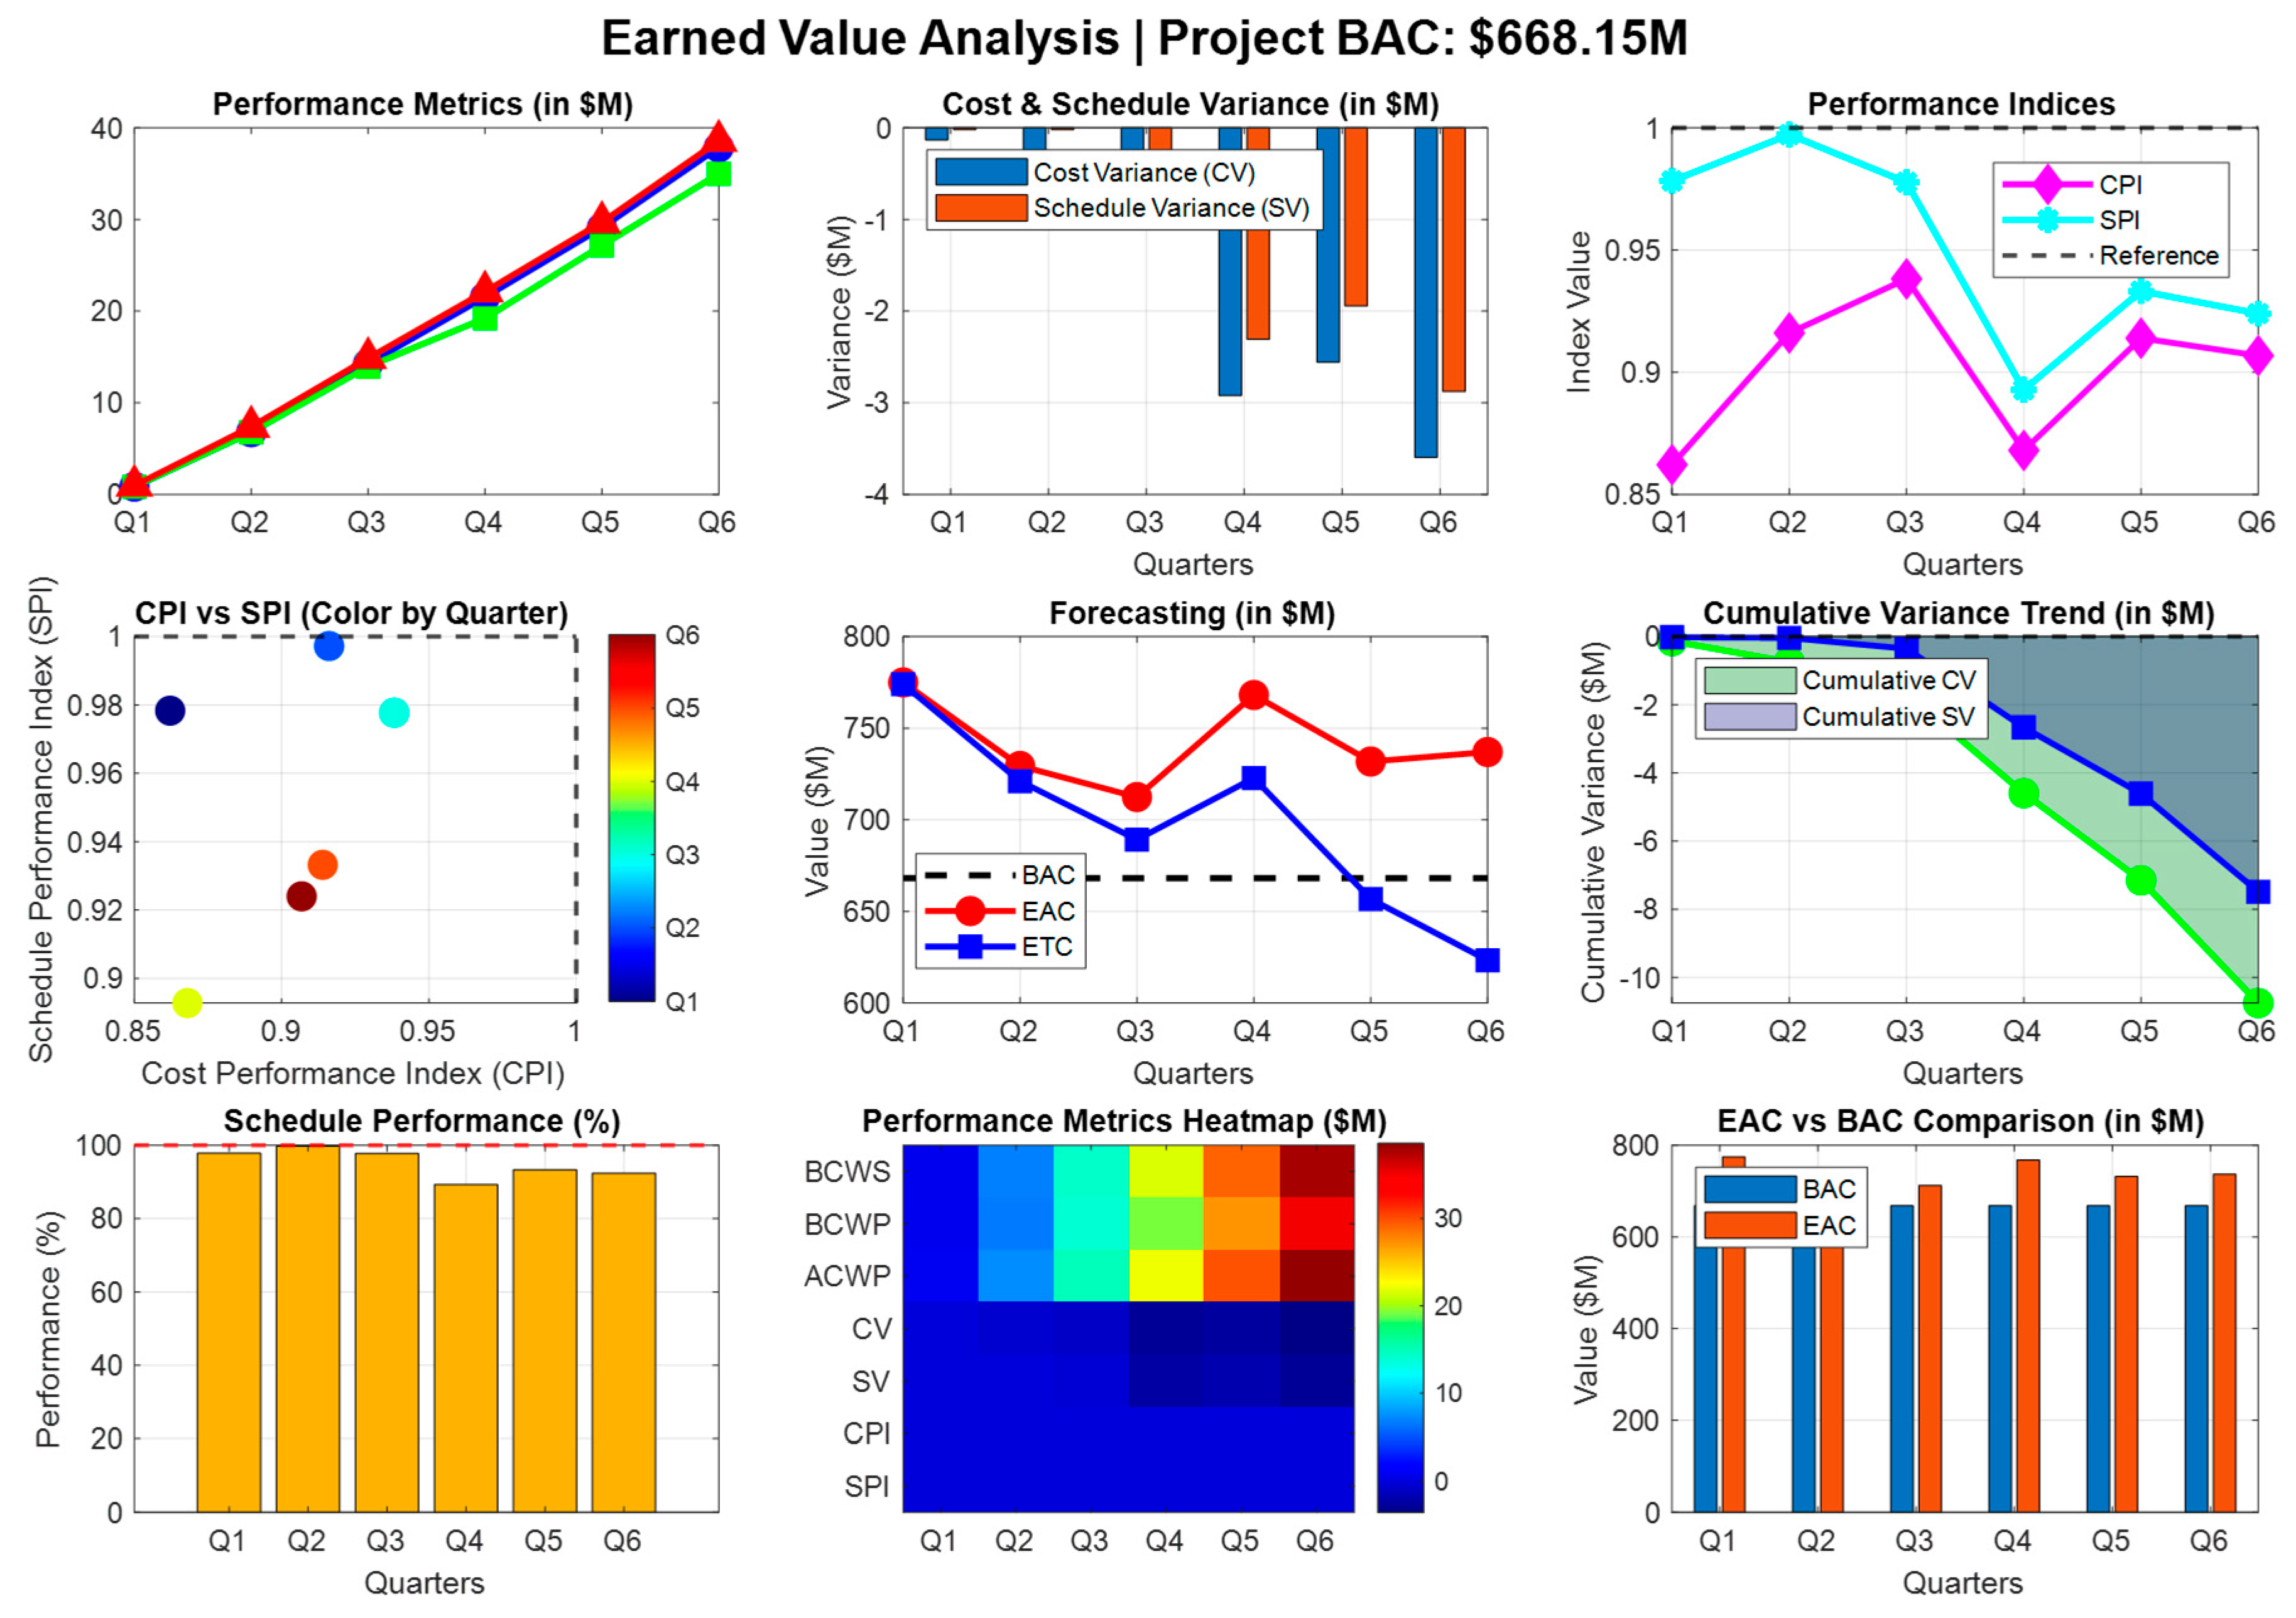
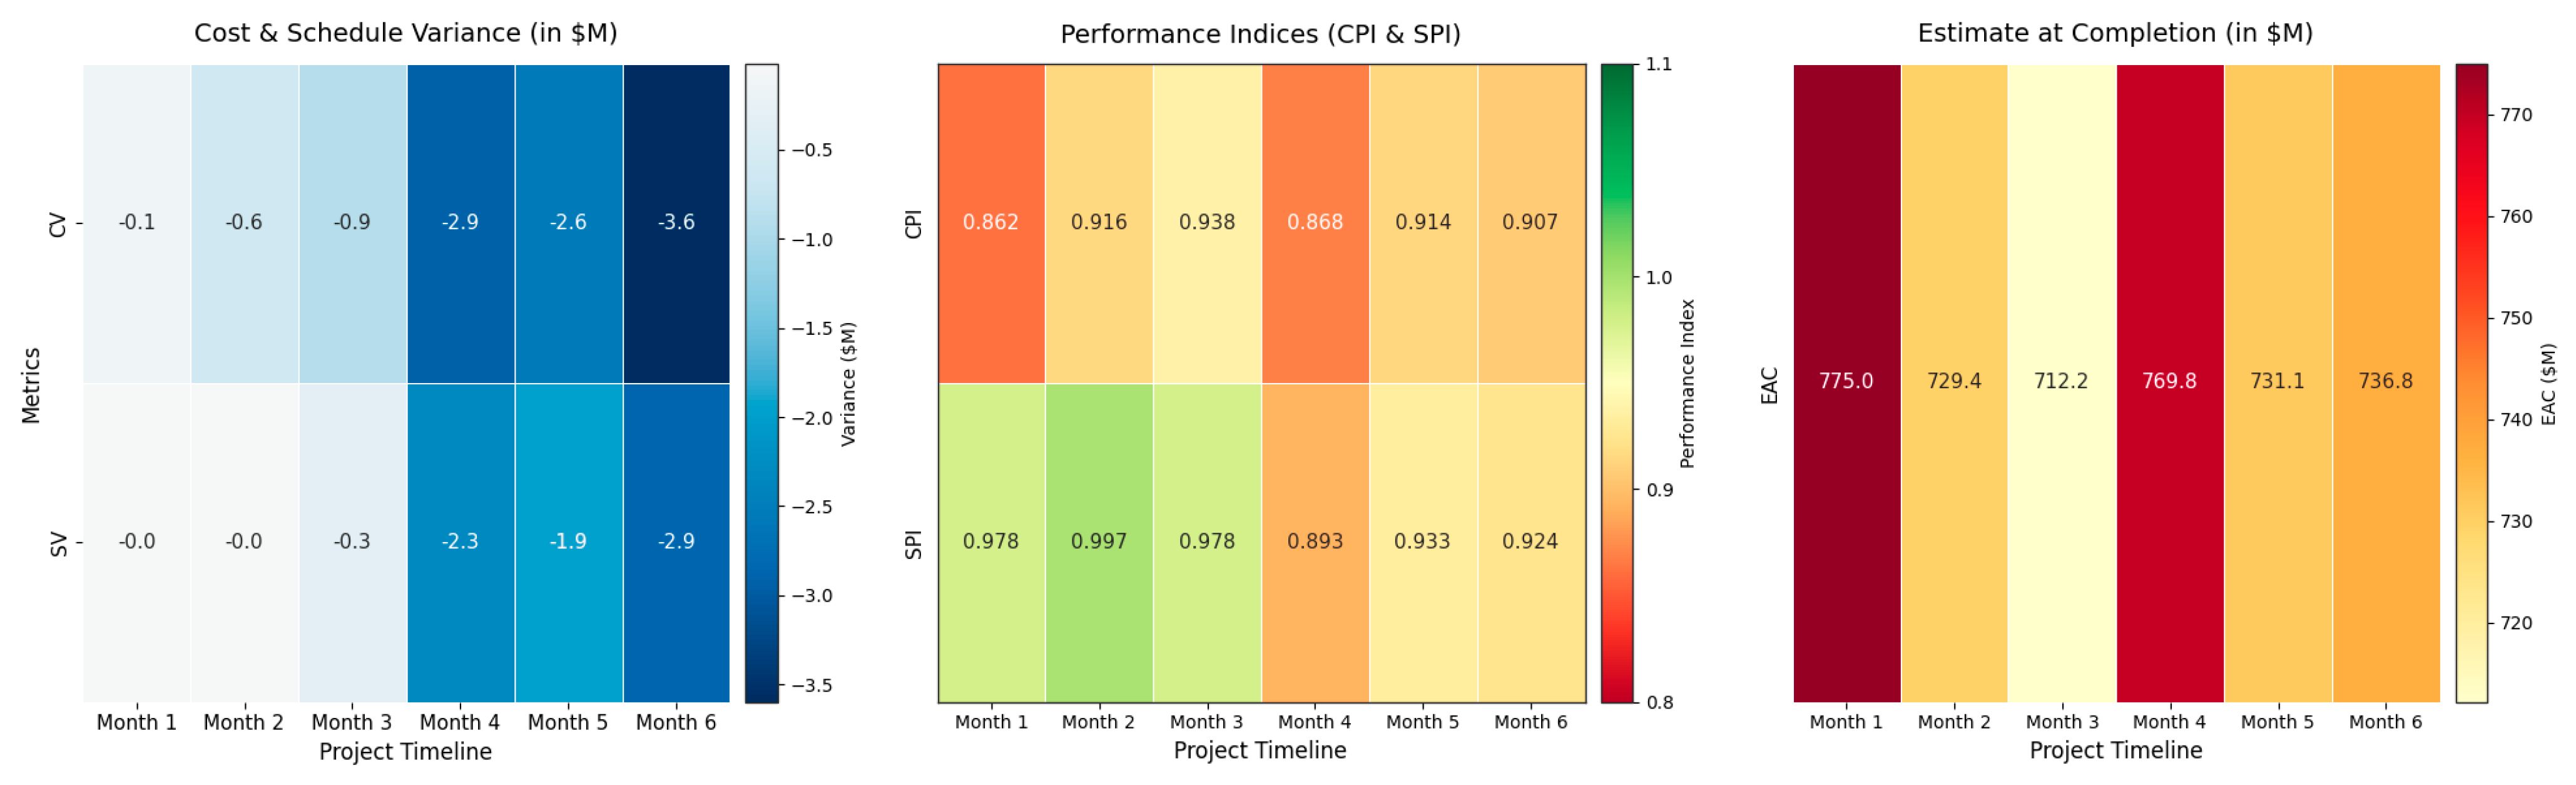
3.1. Real-Life Project (Case 1)

This case study demonstrates the practical application of EVA in real-world scenarios, highlighting how this method effectively supports cost monitoring in construction projects. It enables project teams to objectively assess their performance compared to traditional approaches. The study focuses on infrastructure projects in Iskandar, Malaysia, conducted under the Ninth Malaysian Plan. This government-funded project, awarded in 2008, has a total budget of MYR 61 million and involves upgrading an existing highway. The planned completion date is March 2011. Table 3 presents the planned value (PV), actual cost (AC), and earned value (EV) calculated on a quarterly basis. The data indicates that, during the first six reporting periods, the EV consistently exceeded the PV, implying that the project was progressing well and that work packages were being completed on time and within budget.
Table 3 presents a comprehensive evaluation of project performance across six reporting periods using core EVA metrics: CV, SV, CPI, SPI, and EAC. Across all six periods, both CV and SV values are negative, indicating the project has consistently experienced cost overruns and schedule delays. For instance, in the final reporting period, the project recorded a CV of −3,597,365 and an SV of −2,877,768. These figures confirm that the actual cost of the project exceeded the value of the work performed and that progress lagged behind the planned schedule.
Despite these unfavorable variances, the performance indices offer deeper insights. The CPI values range from 0.862 to 0.938, which are all below the ideal benchmark of 1.0. This indicates that the project is not operating cost-efficiently; it is spending more money than the value it is earning. Similarly, the SPI values fluctuate between 0.893 and 0.997, remaining under 1.0 throughout the timeline. This suggests that the project has been behind schedule in every reporting period, although the degree of delay varies. Notably, SPI was close to 1.0 in the early periods (0.997 in the second period), indicating near on-schedule performance, but it deteriorated to 0.924 by the sixth period, highlighting a decline in schedule efficiency.
The EAC shows how these inefficiencies affect the project’s cost. The EAC varies between about 712 million and 775 million over the different periods, meaning the project will likely end up costing more than planned. Although the third period has a lower EAC near 712 million, the cost estimate increases again in later periods, going above 736 million by the end. This rise indicates growing cost challenges despite some early stability. Table 4 depicts the status report of the relevant project.
Figure 4 demonstrates that the project’s EVA metrics indicate that, although there are negative cost and schedule variances (CV and SV), the CPI and SPI remain close to 1. This suggests the project is slightly over budget but still nearly on schedule. The forecasted EAC values show large budgets but, overall, the project status comments describe it as being under budget and ahead of schedule or with strong efficiency. This mixed picture implies some challenges but generally positive progress in cost and schedule control. This helps project managers make informed decision during the implementation of the project. Overall, the data illustrates that, despite some fluctuations, the project struggles to maintain financial discipline and timely progress, underscoring the need for ongoing monitoring and intervention.
Different colors in the Figure 4 are used to distinctly represent variables, enabling better visual discrimination and intuitive understanding:
Red is used to represent the ETC (Estimate to Complete) forecast line in the forecasting subplot. It is also used for performance markers (triangles) in the top-left and for the CPI dimension in the CPI vs SPI scatter plot.
Blue signifies multiple items: it represents EAC (Estimate at Completion) in forecasting, Cost Variance (CV) in bar charts, and Cumulative CV in the cumulative trend plot. It is also used for Actual Cost (AC) in the performance metrics plot.
Green is assigned to Schedule Variance (SV) in bar charts, and to Cumulative SV in the variance trend subplot. It also represents Planned Value (PV) in the top-left metrics plot.
Orange is used for BAC (Budget at Completion) bars in the BAC vs EAC comparison, and for Schedule Performance (%) in the respective subplot.
Magenta (pink-purple) is used to plot the SPI (Schedule Performance Index) line, helping distinguish it from the CPI trend.
Cyan is used for the CPI (Cost Performance Index) line, creating a clear visual contrast with SPI.
Multicolored dots in the CPI vs SPI scatter plot represent performance points per quarter, with a color gradient mapped to quarters using the accompanying colorbar (ranging from blue for early quarters to red for later quarters).
Gradient heatmap colors (from yellow to blue) in the performance metrics heatmap reflect normalized performance intensities, where yellow indicates higher values and dark blue indicates lower values or underperformance.
Figure 5 clearly illustrates the results. The summary of the project’s cost and schedule deviations is expressed in terms of percentage losses, calculated as follows:
  • Cost losss:
    Final EAC = MYR 774,992,828;
    Estimated BAC (based on trends) ≈ MYR 700,000,000;
    Cost overrun = 774,992,828 − 700,000,000 = MYR 74,992,828;
    Percentage cost overrun = (74,992,828/700,000,000) × 100 ≈ 10.71%.
  • Schedule loss:
    Best SPI = 0.997, final SPI = 0.924;
    Percentage schedule inefficiency = (1 − 0.924) × 100 = 7.6%.
This means the project was performing 7.6% slower than planned in the final period.

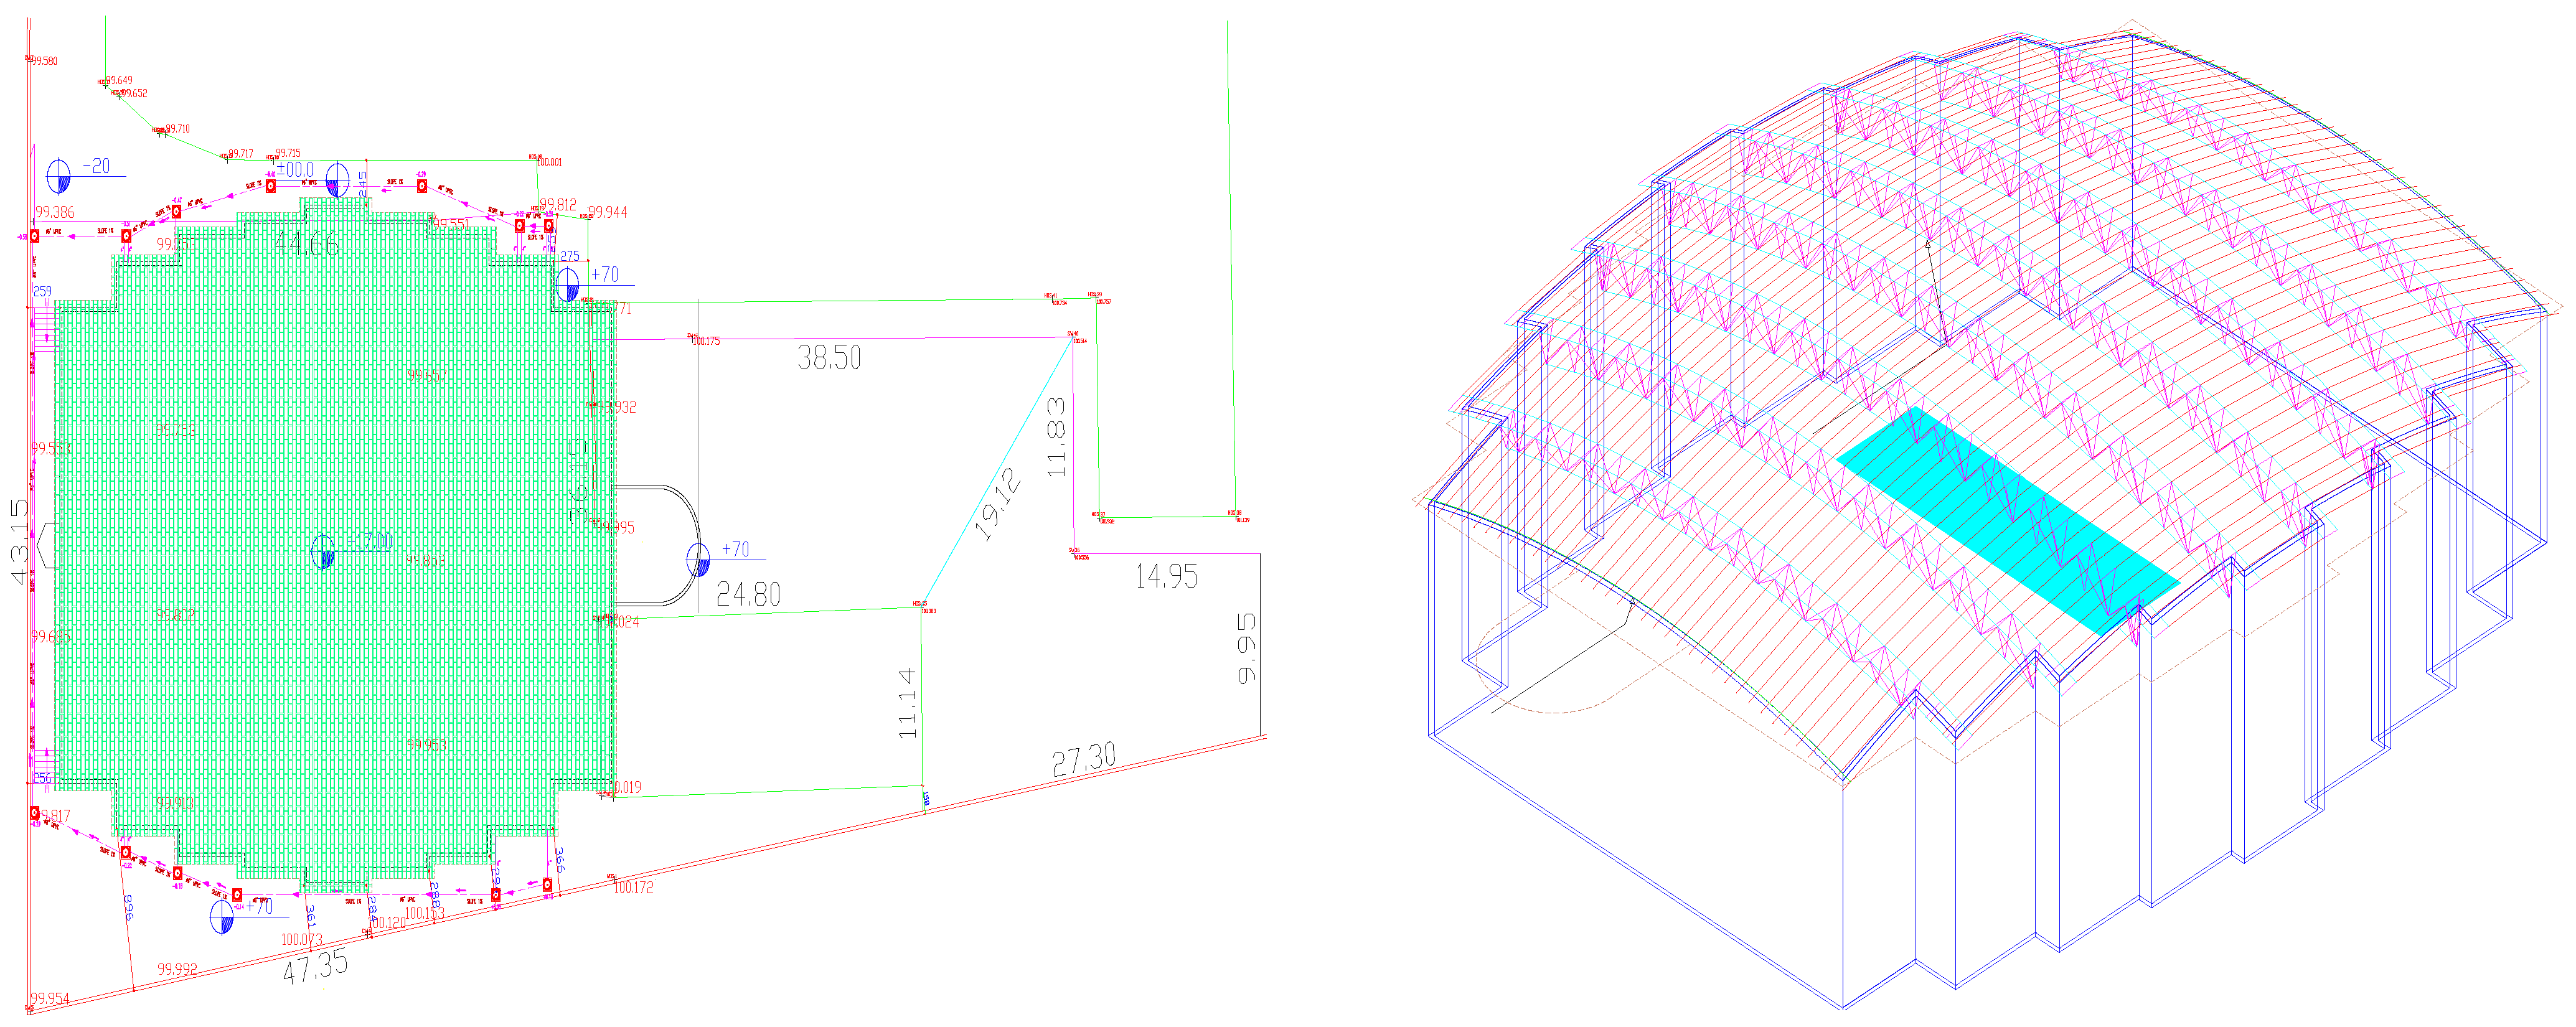
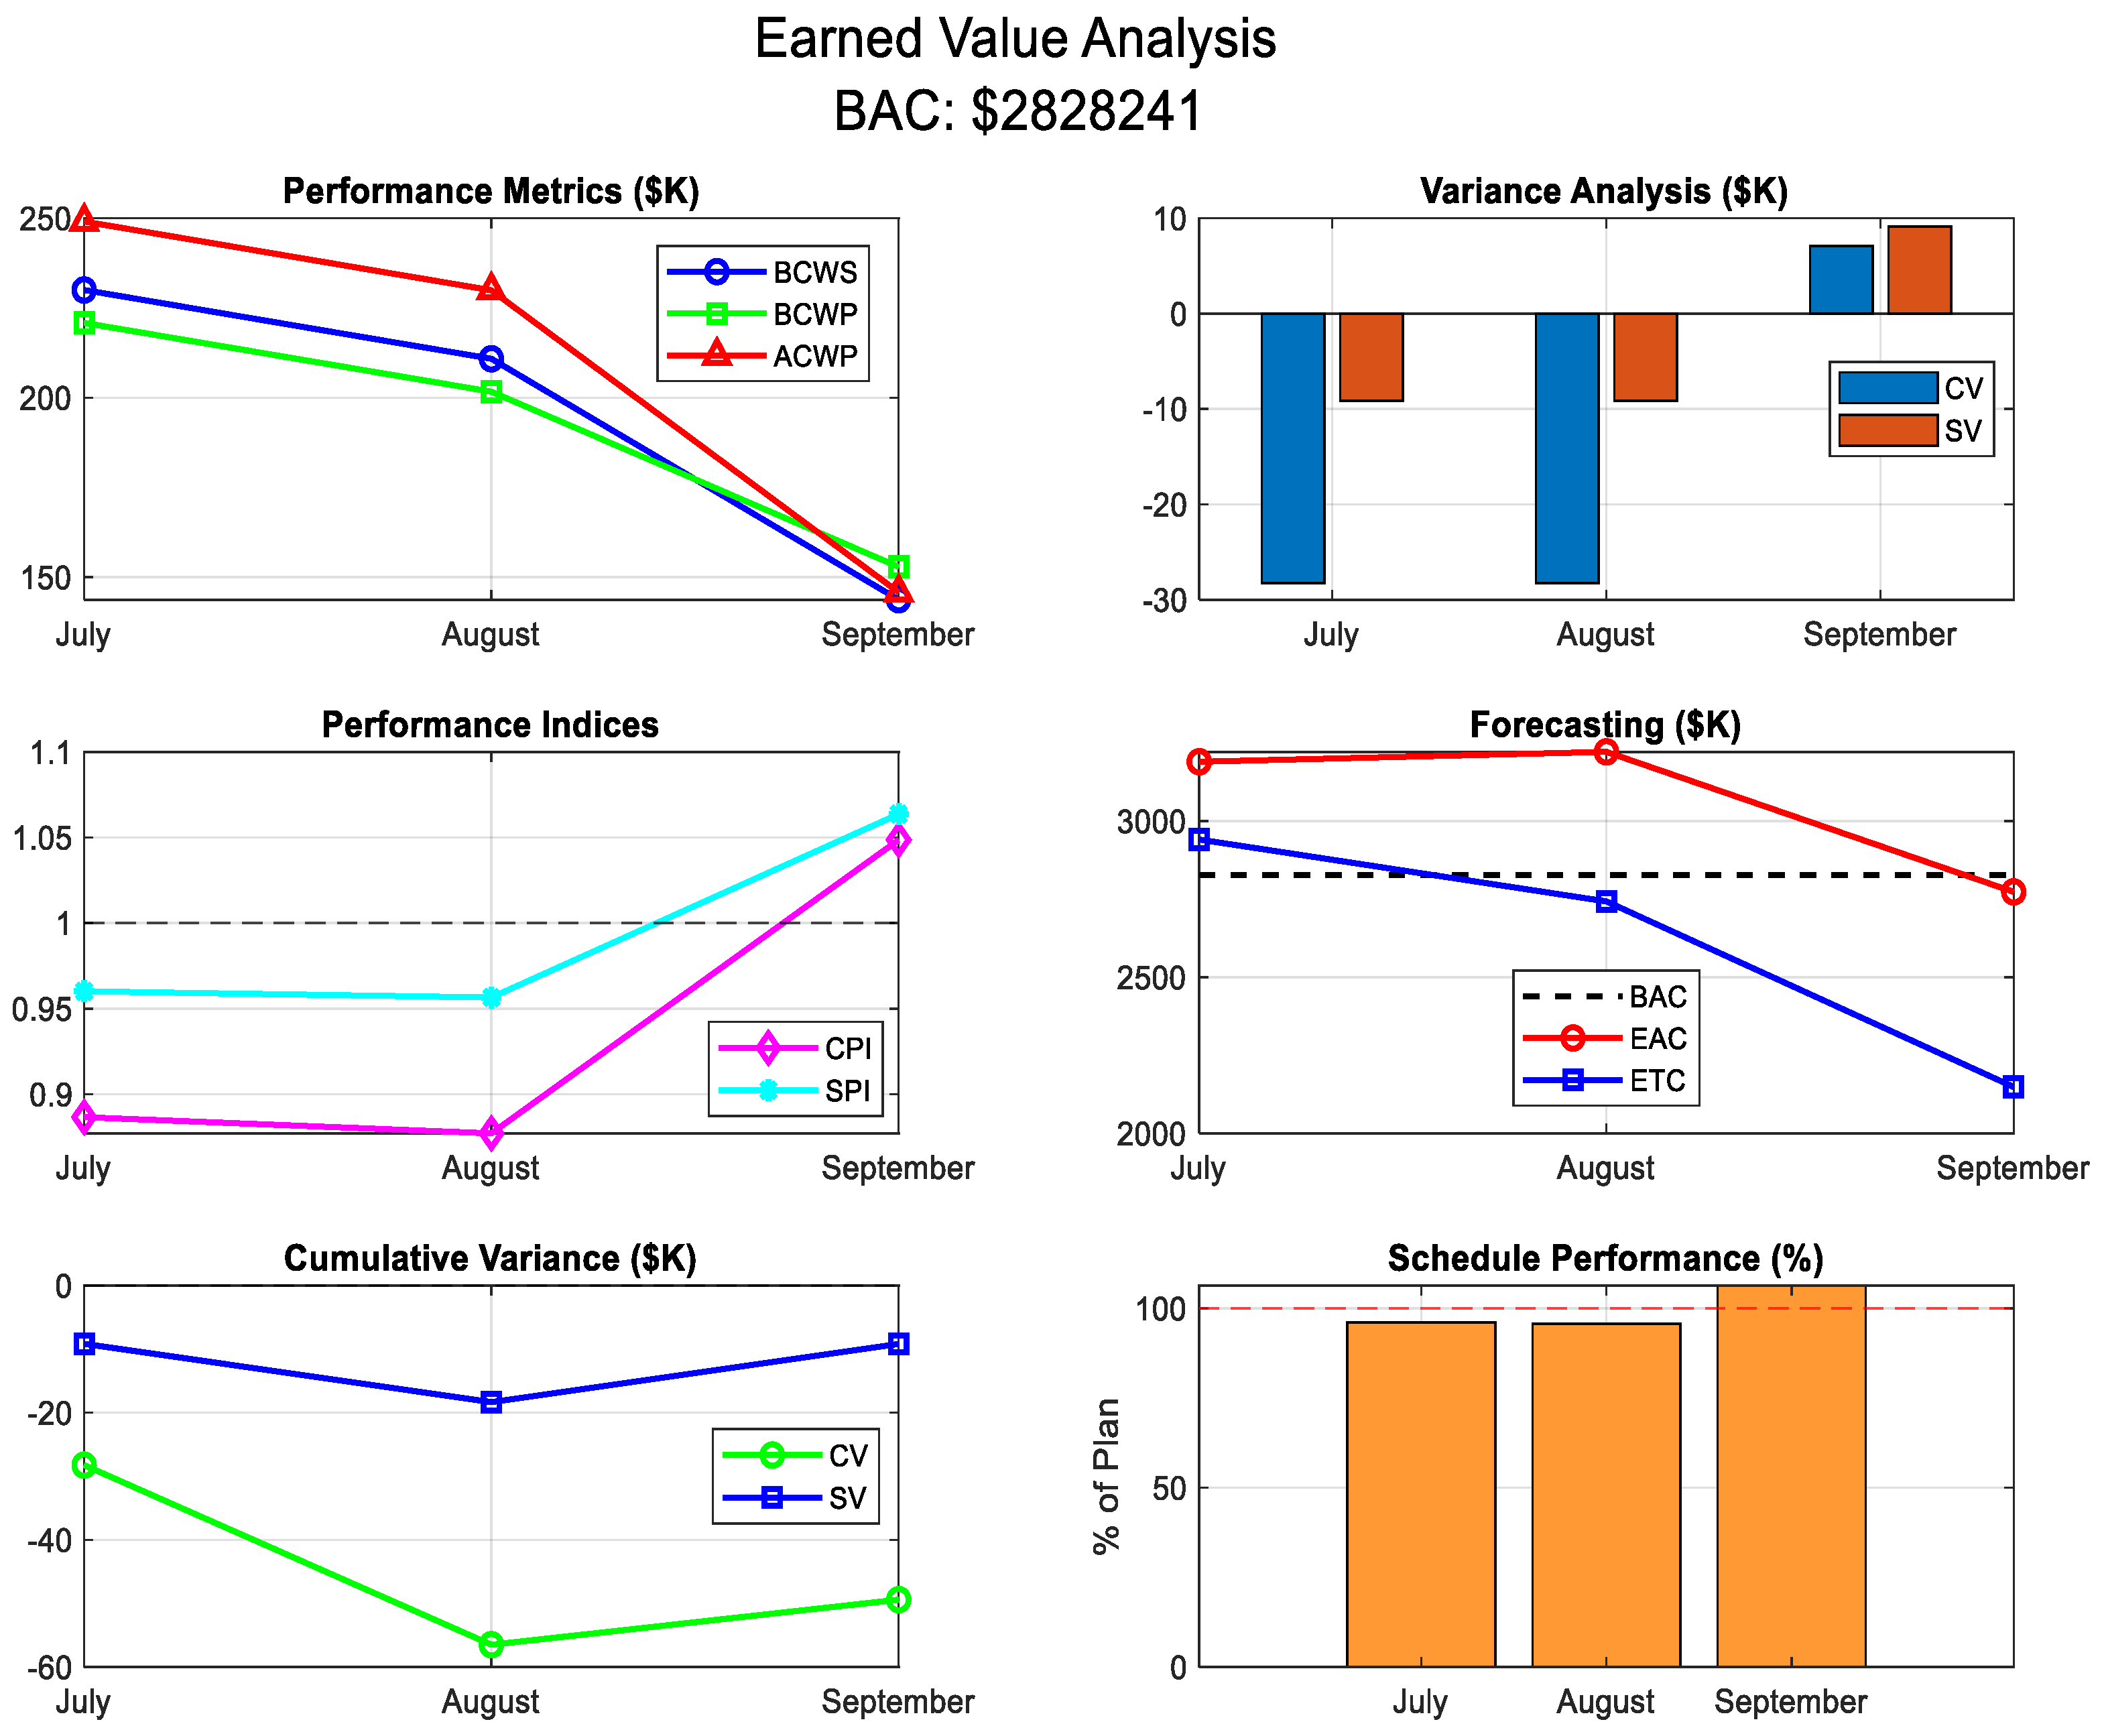
3.2. Real-Life Project (Case 2)

During the summer of 2009, the building of the closed sports hall faced a big problem in the construction phase and, specifically, the problem was in the rebar. This problem was discovered later on, after the completion of the process of pouring the foundations and ground beams. The project area was 1744 m2 and, according to the contract for Project 340 day, every day of delay will be paid MYR 600. In the initial planning phase, a timetable for the project using Primavera 6.0 was created (330 days), but the maximum duration of the contract was 340 days. The cost of the project was MYR 2,828,241. Figure 6 shows the project drawing and Table 4 represents the status report of the project. Table 5 indicates the status report of the relevant project.
To keep a project on track, it is important to regularly compare actual progress with the original plan. For example, a MYR 2.8 million project was monitored over three months (July to September). The team implemented corrective actions, bringing costs under control (CPI = 1.05) and speeding up progress (SPI = 1.06). As a result, the expected final cost (EAC) dropped from MYR 3.19 million in July (which was over budget) to MYR 2.70 million in September (now under budget). The schedule performance also improved, jumping from 96% to 106%, meaning the project finished ahead of schedule. Table 6 represents the status report of the project.
Moreover, Figure 7 provides a comprehensive quantitative assessment of project performance for a project with a BAC of MYR 2,828,241 over a three-month period from July to September. The performance metrics demonstrate an initial period of difficulty in July, where both cost and schedule variances were negative, indicating the project was over budget and behind schedule at that time. The CV of −MYR 28,246 and SV of −MYR 9168 for July reflect these challenges, with the BCWP lagging behind both the BCWS and ACWP. This early underperformance served as a crucial warning signal that prompted corrective actions from the project team. The performance indices provide further evidence of this recovery. The cost CPI improved from 0.89 in July to 1.05 in September, crossing the critical threshold of 1.0 that indicates cost efficiency. Similarly, the SPI increased from 0.96 to 1.06 over the same period, demonstrating that the project not only recovered from initial delays but actually moved ahead of schedule by September. Forecasting metrics tell a compelling story of project recovery. The initial EAC in July of MYR 3.19 million significantly exceeding the BAC and would have raised serious concerns about the project’s financial viability. However, the improvement from 96% of planned progress in July to 106% in September indicates not just recovery but actual acceleration of work. This level of performance exceeds typical project expectations and suggests either exceptional productivity improvements or potentially conservative initial scheduling. The consistency between this metric and the SPI values strengthens confidence in the reliability of these performance indicators.
Similarly, Figure 8 provides project managers with a clear, easy-to-understand snapshot of how their project is performing. It tracks three important numbers: whether work is on schedule (SV), whether costs are under control (CPI), and what future costs might be (ETC and EAC). The first two months show warning signs—the project was running late and costing more than planned. But Month 3 shows things turned around, with work catching up and costs coming back in line. A summary of the of the project for cost and schedule savings in percentages are obtained as follows:
  • Cost Savings:
    Initial EAC (July) = MYR 3.19 million;
    Final EAC (September) ≈ MYR 2.70 million;
    Savings = 3.19M − 2.70M = MYR 490,000;
    Percentage cost savings = (490,000/3.19M) × 100 ≈ 15.36%.
  • Schedule Savings:
    SPI improved from 0.96 to 1.06;
    Percentage schedule improvement = (1.06 − 0.96) × 100 = 10.42%.
This means the project became 10.42% more time-efficient, finishing ahead of schedule.

4. Conclusions and Discussion

Infrastructure projects are often characterized by their complexity, long durations, and high levels of uncertainty. These projects frequently encounter challenges related to cost overruns, schedule delays, and scope variations, making effective project monitoring and control essential for achieving success. In this context, traditional project tracking methods often fall short in providing timely, actionable insights for management. To address these limitations, the integration of data-driven techniques into project performance evaluation has become increasingly important.
In Case 1, the project consistently experienced cost overruns and schedule delays throughout all six reporting periods. By the final period, the estimate at completion (EAC) reached approximately MYR 774.99 million, while the assumed original budget (BAC) was around MYR 700 million. This indicates a cost overrun of about MYR 74.99 million, which corresponds to a 10.71% increase over the planned budget. This substantial overrun shows the project was financially inefficient, spending much more than originally estimated.
From a scheduling perspective, the SPI steadily declined over the course of the project. It started close to 1.0 (on track) but dropped to 0.924 by the final period. This value indicates the project was 7.6% behind schedule at the end, compared to its planned progress. Despite some periods of near-schedule performance, the project’s timing efficiency steadily worsened. Therefore, Case 1 resulted in no cost or schedule savings; instead, it experienced a significant 10.71% cost overrun and a 7.6% schedule delay.
However, Case 2 demonstrates a successful recovery, both in terms of cost and time. Initially, in July, the project was over budget, with an EAC of MYR 3.19 million, which was significantly higher than the project’s BAC of MYR 2.83 million. However, by September, thanks to corrective actions and improved performance, the EAC dropped to around MYR 2.70 million. This reduction implies a cost saving of MYR 490,000, which equals a 15.36% improvement from the initial cost forecast. The project not only avoided the overrun but also finished under the initially planned cost.
In terms of schedule, the project’s SPI improved from 0.96 in July to 1.06 in September. This means the project transitioned from being slightly behind to significantly ahead of schedule. The SPI increase of 0.10 indicates a 10.42% improvement in schedule efficiency. The project ended up delivering 106% of the planned work by the end of the reporting period, 6% more than scheduled, completing the work faster than expected. These gains reflect strong project control and successful implementation of recovery strategies. For project-driven organizations, these percentage improvements represent substantial financial and operational benefits. The cases provide conclusive evidence that EVM is not merely a compliance exercise but rather a strategic tool that delivers measurable improvements in project outcomes, financial performance, and client satisfaction.
One limitation of EVA is its dependence on precise data and the assumption of linear project progress, which may not accurately capture the complexities of real-world construction environments. Our study also relies on the premise of consistent data reporting and dependable baseline figures. Moreover, factors such as project scope, available resources, and management approaches can influence the broader applicability of the findings. To enhance EVA’s effectiveness, the integration of technologies like Building Information Modeling (BIM) and IoT sensors can automate progress tracking, reduce manual errors, and improve data reliability. Additionally, advanced computer vision techniques offer promising solutions for real-time monitoring on construction sites. By analyzing images or video to assess work progress, these methods can enhance the precision and timeliness of EVA indicators. In particular, models such as EfficientNet [44] for image classification and DeepLab [45] for semantic segmentation show great potential for automating project tracking and boosting overall performance evaluation. Finally, comparison with CPM, PERT, and S-curve analysis was not included in this study but is planned for investigation in future work

Author Contributions

Conceptualization, M.A.E.; Methodology, B.A.; Software, M.A.E.; Validation, M.A.E.; Writing—original draft, B.A. and M.A.E.; Visualization, B.A. and M.A.E.; Supervision, B.A. All authors have read and agreed to the published version of the manuscript.

Funding

This research received no external funding.

Data Availability Statement

Conflicts of Interest

The authors declare no conflicts of interest.

References

  1. Eirgash, M.A.; Toğan, V.; Kazaz, A. Application Earned Value Based Metrics to Enhance the Performance Measurement of Engineering Project Management. Nevşehir J. Sci. Technol. 2017, 6, 431–439. [Google Scholar]
  2. Anbari, F.T. Earned Value Project Management Method and Extensions. Proj. Manag. J. 2003, 34, 12–23. [Google Scholar] [CrossRef]
  3. Ippakayal, P.D.; Kumthekar, M.B. A Review on Earned Value Management Analysis in Construction Industry. Int. Res. J. Eng. Technol. 2021, 8, 855–857. [Google Scholar]
  4. Lipke, W.; Zwikael, O.; Henderson, K.; Anbari, F. Prediction of Project Outcome: The Application of Statistical Methods to Earned Value Management and Earned Schedule Performance Indexes. Int. J. Proj. Manag. 2009, 27, 400–407. [Google Scholar] [CrossRef]
  5. Bahar, M. Hizmet Alımlı Tipi Sözleşmelerde KDA Modeli ve Bir Uygulama. Master’s Thesis, Fen Bilimleri Enstitüsü, İstanbul Üniversitesi, İstanbul, Turkey, 2008. [Google Scholar]
  6. Borrmann, A.; König, M.; Koch, C.; Beetz, J. Building Information Modeling: Technology Foundations and Industry Practice; Springer: Berlin, Germany, 2015. [Google Scholar]
  7. Gürbüzer, A. KDA Metodunun Bir Tersane Projesine Uygulanması. Master’s Thesis, Sosyal Bilimler Enstitüsü, Gebze İleri Teknoloji Enstitüsü, Gebze, Turkey, 2010. [Google Scholar]
  8. Oesterreich, T.D.; Teuteberg, F. Understanding the Implications of Digitization and Automation in the Context of Industry 4.0: A Triangulation Approach and Elements of a Research Agenda for the Construction Industry. Comput. Ind. 2016, 83, 121–139. [Google Scholar] [CrossRef]
  9. Zhang, D.; Zhang, H.; Cheng, T. Causes of Delay in the Construction Projects of Subway Tunnel. Adv. Math. Risk Anal. Civ. Eng. 2020, 1, 45–60. [Google Scholar] [CrossRef]
  10. Kaplan, O. Proje Yönetiminde Maliyetlerin Optimizasyonu ve İnşaat Sektöründe Uygulanması. Master’s Thesis, Sosyal Bilimler Enstitüsü, Yıldız Teknik Üniversitesi, İstanbul, Turkey, 2012. [Google Scholar]
  11. Love, P.E.; Edwards, D.J.; Irani, Z.; Walker, D.H. Project Risks and AI: Identification, Assessment and Mitigation Strategies. Int. J. Proj. Manag. 2020, 38, 403–416. [Google Scholar] [CrossRef]
  12. Shaik, M.M.; Devanand, R.; Harsha, H.N. An Analysis on Resource Planning, Cost Estimation & Tracking of Project by Earned Value Management. Int. J. Eng. Innov. Technol. 2014, 4, 42–48. [Google Scholar]
  13. Eirgash, M.A.; Baltaci, Y. Project Monitoring and Early Warning of Time-Cost Overruns in Earned Value Management. Curr. Trends Civ. Struct. Eng. 2021, 7, CTCSE.MS.ID.000673. [Google Scholar] [CrossRef]
  14. Eirgash, M.A. Earned Value Analysis for Construction Projects Using Project Management Scheduling Engine. Am. J. Civ. Eng. 2019, 7, 121–125. [Google Scholar] [CrossRef]
  15. Chen, H.L.; Chen, W.T.; Lin, Y.L. Earned Value Project Management: Improving the Predictive Power of Planned Value. Int. J. Proj. Manag. 2016, 34, 22–29. [Google Scholar] [CrossRef]
  16. Subramani, T.; Jabasingh, D.S.S.; Jayalakshmi, J. Analysis of Cost Controlling in Construction Industries by Earned Value Method Using Primavera. Int. J. Eng. Res. Appl. 2014, 4, 145–153. [Google Scholar]
  17. Koçak, S. İnşaat Projelerinde KDA İle Primavera P6 Destekli Maliyet Kontrolü ve Bir Uygulama. Master’s Thesis, Fen Bilimleri Enstitüsü, Akdeniz Üniversitesi, Antalya, Turkey, 2018. [Google Scholar]
  18. Liu, J.; Zhang, G.; Lee, W.B. Fuzzy Neural Network-Based Project Performance Prediction Approach. Expert Syst. Appl. 2017, 72, 256–268. [Google Scholar] [CrossRef]
  19. Din, Z.U.; Raza, A.; Khan, M.B. Comparative Analysis of Factors Causing Delay in Residential Construction Projects in Pakistan. In Proceedings of the Construction Research Congress, Tempe, AZ, USA, 8–10 March 2020. [Google Scholar]
  20. Ottaviani, F.M.; De Marco, A.; Narbaev, T.; Rebuglio, M. Improving Project Estimates at Completion Through Progress-Based Performance Factors. Buildings 2024, 14, 643. [Google Scholar] [CrossRef]
  21. Yalçın, G.; Bayram, S.; Çıtakoğlu, H. Evaluation of Earned Value Management-Based Cost Estimation via Machine Learning. Buildings 2024, 14, 3772. [Google Scholar] [CrossRef]
  22. Nejatyan, E.; Sarvari, H.; Hosseini, S.A.; Javanshir, H. Determining the Factors Influencing Construction Project Management Performance Improvement Through Earned Value-Based Value Engineering Strategy: A Delphi-Based Survey. Buildings 2023, 13, 1964. [Google Scholar] [CrossRef]
  23. Barrientos-Orellana, A.; Ballesteros-Pérez, P.; Mora-Melià, D.; Cerezo-Narváez, A.; Gutiérrez-Bahamondes, J.H. Comparison of the Stability and Accuracy of Deterministic Project Cost Prediction Methods in Earned Value Management. Buildings 2023, 13, 1206. [Google Scholar] [CrossRef]
  24. Tukundane, H.; Yang, Y. Effect of Project Control Practices on the Performance of Building Construction Companies in Uganda: A Case Study of the City of Kampala. Buildings 2024, 14, 1818. [Google Scholar] [CrossRef]
  25. López Pascual, J.; Meléndez Rodríguez, J.C.; Cruz Rambaud, S. The Enhanced-Earned Value Management (E-EVM) Model: A Proposal for the Aerospace Industry. Symmetry 2021, 13, 232. [Google Scholar] [CrossRef]
  26. Mahdi, I.; Abd-Elrashed, I.; Ahmed, S.; Lamisse, R. Difficulties of Implementing Earned Value Management in Construction Sector in Egypt. Int. J. Eng. Res. Stud. 2018, 5, 15–25. [Google Scholar]
  27. Khesal, T.; Abbas, S.; Mohammad, K.; Masoud, G.; Soltani, R. Integrated Cost, Quality, Risk and Schedule Control Through Earned Value Management. J. Eng. Des. Technol. 2019, 17, 183–203. [Google Scholar] [CrossRef]
  28. Sackey, S.; Lee, D.; Kim, B. Duration Estimate at Completion: Improving Earned Value Management Forecasting Accuracy. KSCE J. Civ. Eng. 2020, 24, 693–702. [Google Scholar] [CrossRef]
  29. Guerras, L.A.; Navas, J.E. La Dirección Estratégica de la Empresa. Teoría y Aplicaciones, 4th ed.; Thomson-Civitas Editorial: Roma, Italy, 2007. [Google Scholar]
  30. Colin, J.; Vanhoucke, M. A Comparison of the Performance of Various Project Control Methods Using Earned Value Management Systems. Expert Syst. Appl. 2015, 42, 3159–3175. [Google Scholar] [CrossRef]
  31. Dibert, J.C.; Velez, J.C. An Analysis of Earned Value Management Implementation Within the F-22 System Program Office’s Software Development; Naval Postgraduate School: Monterey, CA, USA, 2006. [Google Scholar]
  32. Acebes, F.; Pajares, J.; Galán, J.M.; López-Paredes, A. A New Approach for Project Control Under Uncertainty. Going Back Basics. Int. J. Proj. Manag. 2014, 32, 423–434. [Google Scholar] [CrossRef]
  33. Khodakarami, V.; Abdi, A. Project Cost Risk Analysis: A Bayesian Networks Approach for Modeling Dependencies Between Cost Items. Int. J. Proj. Manag. 2014, 32, 1233–1245. [Google Scholar] [CrossRef]
  34. Hendiani, S.; Bagherpour, M.; Mahmoudi, A.; Liao, H. Z-Number Based Earned Value Management (ZEVM): A Novel Pragmatic Contribution Towards a Possibilistic Cost-Duration Assessment. Comput. Ind. Eng. 2020, 143, 106430. [Google Scholar] [CrossRef]
  35. Khamooshi, H.; Golafshani, H. Earned Duration Management, a New Approach to Schedule Performance Management and Measurement. Int. J. Proj. Manag. 2014, 32, 1019–1041. [Google Scholar] [CrossRef]
  36. Araszkiewicz, K.; Bochenek, M. Control of Construction Projects Using the Earned Value Method—Case Study. Gruyter Open Civ. Eng. 2019, 9, 186–195. [Google Scholar] [CrossRef]
  37. Atkins, K.L.; Martin, B.D.; Vellinga, J.M.; Rick, A.P. STARDUST: Implementing a New Manage-to-Budget Paradigm. Acta Astronaut. 2003, 52, 87–97. [Google Scholar] [CrossRef]
  38. Koke, B.; Moehler, R.C. Earned Green Value Management for Project Management: A Systematic Review. J. Clean. Prod. 2019, 230, 189–197. [Google Scholar] [CrossRef]
  39. TEDAE. Spanish Association of Technological Defence, Aeronautical and Space Companies; Activities Report; TEDAE: Madrid, Spain, 2018. [Google Scholar]
  40. Antvik, S. Earned Value Management in Sweden—Experiences and Examples: The Gripen Project. In Proceedings of the Project Management Institute Annual Seminars & Symposium, San Antonio, TX, USA, 3–10 October 2002. [Google Scholar]
  41. Chin Keng, T.; Shahdan, N. The Application of Earned Value Management (EVM) in Construction Project Management. J. Technol. Manag. Bus. 2015, 2, 1–12. [Google Scholar]
  42. Sruthi, M.D.; Aravindan, A. Performance Measurement of Schedule and Cost Analysis by Using Earned Value Management for a Residential Building. Mater. Today Proc. 2020, 33, 524–532. [Google Scholar] [CrossRef]
  43. Meléndez-Rodríguez, J.C.; López-Pascual, J.; Cañamero, P.; García, F.P. An Overview of Earned Value Management in Aerospace Industry. In Proceedings of the Tenth International Conference on Management Science and Engineering Management; Springer: Berlin/Heidelberg, Germany, 2017; pp. 1465–1477. [Google Scholar]
  44. Kabir, H.; Wu, J.; Dahal, S.; Joo, T.; Garg, N. Automated Estimation of Cementitious Sorptivity via Computer Vision. Nat. Commun. 2024, 15, 9935. [Google Scholar] [CrossRef] [PubMed]
  45. Song, Z.; Zou, S.; Zhou, W.; Huang, Y.; Shao, L.; Yuan, J.; Gou, X.; Jin, W.; Wang, Z.; Chen, X.; et al. Clinically Applicable Histopathological Diagnosis System for Gastric Cancer Detection Using Deep Learning. Nat. Commun. 2020, 11, 4294. [Google Scholar] [CrossRef]
Figure 1. Depiction of EVA methodology.
Buildings 15 02388 g001
Figure 2. SPI and CPI analysis matrix of a project.
Buildings 15 02388 g002
Figure 3. Diagram of S-Curve in the project [38].
Buildings 15 02388 g003
Figure 4. Plots of the quarters. Holistic view of project progress and efficiency.
Buildings 15 02388 g004
Figure 5. Overall EVA performance.
Buildings 15 02388 g005
Figure 6. Depiction of the project drawings.
Buildings 15 02388 g006
Figure 7. Plot depictions of the variances, schedule performance, and performance metrics.
Buildings 15 02388 g007
Figure 8. EVM performance overview.
Buildings 15 02388 g008
Table 1. The literature on EVM application to industrial sectors. Source [25].
SectorReferencesMain TopicsPublication
Aerospace[15,26,27,28]Supplier and Contractor Oversight, Aircraft Production and Integration,
Space Vehicle Fabrication,
Aviation Performance Testing
2016, 2018, 2019, 2020
Software development and computational research[29,30,31,32,33]Computational Modeling,
Quantitative Analysis Techniques,
Schedule Optimization Implementation,
Performance Motivation Indicators
2006, 2007, 2014, 2015
Products[34]Advanced Technology Systems, Industrial Manufacturing Apparatus, Production Machinery and Tooling2020
Army forces[35]Modernized Scheduling Methodology, integrated into USCG Command Structures2014
Miscellaneous[36,37]EVM methodology revision2003, 2019
Chemical[38]Improving forecasting models2016
Building construction[39,40,41,42]Financial risk evaluation in project budgeting, holistic project management methodology combining financial, quality and risk parameters2002, 2015, 2018, 2020
Cement factory[27]Time-cost–quality trade-off method1999
Construction[1,13,14]Project scheduling model2017, 2021
Environment[43]Quantitative assessment of project sustainability indicators and operational performance metrics2017
Table 2. Earned value terms.
TermsAbbreviationDescription
Planned ValuePV(BCWS)The budgeted cost of work scheduled to be completed by a specific date.
Earned ValueEV (BCWP)The budgeted cost of work actually completed by a specific date.
Actual CostAC (ACWP)The actual cost incurred for the work performed by a specific date.
Cost VarianceCVEV − AC, shows if you are over or under budget.
Schedule VarianceSVEV − PV, shows if you are ahead or behind schedule.
Cost Performance IndexCPIEV ÷ AC, indicates cost efficiency.
SchedulePerformance IndexSPIEV ÷ PV, indicates schedule efficiency.
Estimate at CompletionEACForecast of total cost at project completion, based on current performance.
Estimate to CompleteETCThe expected cost to finish all remaining work.
Budget at CompletionBACThe total budgeted cost for the entire project.
Table 3. The PV, AC, and EV analysis (AMOUNT IN MYR).
BACMYR 668,153,392
DurationBCWS (Planned) PVBCWP (Earned) EVACWP (Actual) AC
Quarter 1839,184821,000952,280
Quarter 26,789,6836,771,0007,391,301
Quarter 314,268,63913,951,00014,870,257
Quarter 421,528,47819,220,07422,142,755
Quarter 529,102,45227,159,07429,716,702
Quarter 637,867,84234,990,07438,587,439
Table 4. Obtained values of status report of the project.
VarianceIndicesForecastingStatus
CVSVCPISPIEAC
−131,280−18,1840.8620.978774,992,828,421Slightly delayed and over budget
−620,301−18,6830.9160.997729,363,880,438Still over budget but improving
−919,257−317,6390.9380.978712,179,245,535Delayed but better cost control
−292,2681−2,308,4040.8680.893769,755,457,834Severely over budget
−2,557,628−1,943,3780.9140.933731,074,823,845Still over budget but improving
−3,597,365−2,877,7680.9070.924736,846,919,971High risk of budget overrun
Table 5. The status report of the project.
BACMYR 2,828,241
MonthsBCWS (Planned)BCWP (Earned)ACWP (Actual)
July229.999220.831249.077
August210.840201.672229.918
September143.731152.878145.791
Table 6. Obtained values of status report of the project.
VarianceIndicesForecastingStatus
CVSVCPISPIEAC
−28.2−9.20.8860.9603,189,994Cost overrun, behind schedule
−28.2−9.20.8770.9563,224,362Cost overrun, behind schedule
7.19.11.0481.0642,697,132Under budget, ahead of schedule
Disclaimer/Publisher’s Note: The statements, opinions and data contained in all publications are solely those of the individual author(s) and contributor(s) and not of MDPI and/or the editor(s). MDPI and/or the editor(s) disclaim responsibility for any injury to people or property resulting from any ideas, methods, instructions or products referred to in the content.

