Article

Evaluating the Stacked Economic Value of Load Shifting and Microgrid Control

The Polytechnic School, Ira A. Fulton Schools of Engineering, Arizona State University, Mesa, AZ 85212, USA
*
Author to whom correspondence should be addressed.
Buildings 2025, 15(13), 2378; https://doi.org/10.3390/buildings15132378
Submission received: 26 May 2025 / Revised: 27 June 2025 / Accepted: 28 June 2025 / Published: 7 July 2025
(This article belongs to the Section Building Energy, Physics, Environment, and Systems)

Abstract

Microgrids and load shifting can improve resilience and lower costs for electricity customers. The costs to deploy each have decreased and helped accelerate their deployment in the U.S. and globally. However, previous research has focused minimally on the combined benefit or “stacked economic value” that these assets could provide jointly. This article evaluates the financial value when those assets are combined and optimized jointly. The methods are demonstrated for a U.S. government facility with an existing microgrid and building automation system, with optimizations that vary the percentage load shifted and the duration of time the load can be shifted. The economic benefits of load shifting are greater when combined with a microgrid and coordinated dispatch of loads and microgrid assets. The methods and case study results illustrate “stacked economic value” showing energy charge reductions are 56–252% greater and demand charge reductions are 96–226% greater when load shifting is combined with a microgrid as compared to load shifting without a microgrid. Increasing the amount and duration of load shifting improves the stacked economic value as more loads are scheduled coincident with on-site generation to offset or completely avoid utility purchases during peak pricing periods, an underlying behavior that enables stacked economic value and increased financial savings. The percentage reduction in demand charges is greater than energy charges—a generalizable finding—but the relative impact on utility expenditures is dependent on the utility tariff structure and composition of demand charges and energy charges in the utility bill. In this case study, demand charge reductions were four times greater than energy charge reductions, but the financial savings of demand charges are less due to their smaller proportion of utility charges. This suggests that the stacked economic value of microgrids and load control may be even more significant in locations with electricity tariffs that more heavily weight billing towards demand charges than energy charges.

1. Introduction

Microgrid deployments have grown rapidly due to increased interest in energy security [1], resilience [2], greater renewables penetration [3], reduced utility costs [4], reduced carbon emissions [5], and improved power quality [6]. Microgrids can often meet all these goals by acting as “a group of interconnected loads and distributed energy resources within clearly defined electrical boundaries that acts as a single controllable entity to operate in both grid-connected or island-mode” [7].
Microgrid assets are typically sized to meet critical load requirements at the lowest cost [8,9,10]. Microgrid assets are commonly diesel or natural gas generators and a combination of solar photovoltaics (PV), energy storage, and sometimes wind to power critical loads in the event of a grid outage, and such systems can also reduce electricity costs from utility purchases while being grid-connected [11,12]. Additional improvements to energy security, resilience, economic, and environmental metrics can be attained when microgrid dispatch is coordinated with load control, such as building automation systems [13]. Early studies have shown that supervisory systems managing both microgrid and building automation systems can yield up to a 9% reduction in energy in an experimental setup [8]. Further, demand response can reduce peak load by nearly 13% and improve load factor by nearly 15% [14]. Other examples have found that the joint coordination of energy management and distributed energy resources (DERs) can reduce carbon emissions by up to 7% [15]. Including thermal energy storage also reduces peak loads by shifting cooling loads to times of day when energy costs less [16,17,18]. The benefits of co-optimizing microgrid operation and building automation systems operation have been discussed in other studies, but there is much yet to evaluate with the topic as technology and energy markets evolve [19,20,21].
In looking to microgrid design optimization, common approaches seek to minimize net present value (NPV), annualized costs, or another financial metric through methods such as rolling-horizon optimization [22], the modified shuffled frog leaping algorithm [23], MILP-scheduling and EA sizing algorithms [24], reinforcement learning [25], multi-objective functions [26], the mixed-integer quadratic programming problem [27], particle swarm optimization [28], the crow and greedy search algorithm [29], and generative adversarial networks and stochastic optimization [30]. Other studies focus on achieving similar objectives with control algorithms of microgrid assets with fixed sizes and determining how to incorporate day-ahead resource forecasts to dispatch energy from resources [31] or employ price monitoring to determine the typical times of day to dispatch the battery [32]. MILP optimization is particularly useful for its guarantee of a global optimum and wide choice of commercially available solvers [33].
Load management can be similarly optimized to alter energy consumption and improve economic, power quality, or environmental metrics [34]. Sub-classifications of load management include demand-side management, demand response, curtailment, and load shifting. Demand-side management occurs when a utility initiates active controls or establishes long-term incentive programs for customers who are willing to have loads interrupted [34] or curtailed [35]. Demand response is a related approach in which customers dynamically change consumption patterns in response to real-time rates or dispatches [36]. Curtailment is an action that directly reduces a customer’s load by shutting off individual loads or entire circuits due to a power quality event, resource adequacy concerns, or a price spike [37], whereas load shifting reduces energy consumption in one part of the day by shifting it to a different time of day when time-of-use (TOU) energy pricing is lower [38].
In looking to load shifting more specifically, common devices shifted from peak to non-peak TOU hours include space heating, air conditioning, and certain appliances [39,40,41,42,43,44,45]. Load shifting can also be used to improve utilization of renewables or moderate system-wide load spikes or overloading of distribution circuits, including managed charging of electric vehicles as market penetration increases [46,47,48]. Load shifting provides further benefit by shifting loads to periods in a day with excess energy from renewables [49,50], thereby reducing renewable curtailment, and even shifting energy across seasons to take advantage of less expensive rates [51] or mitigate solar and wind “droughts.” Such techniques are [47] yielding savings across the residential, commercial, and industrial sectors with more opportunities on the horizon through technology innovation and policy change [52,53,54,55,56].
While there are many studies evaluating the benefits of microgrid dispatch and load control separately, there are far fewer studies that evaluate the “stacked economic value” when those techniques are combined and optimized jointly [57,58,59]. Such studies are invaluable as the installation of DERs and microgrids is rapidly increasing and motivates more scientific study and applied engineering practice to maximize benefits to the grid and energy markets [60].
This work is unique in its consideration of how much load can be shifted and how long it can be shifted, and how the benefits of that load control are increased or decreased by generation and storage assets on-site. This work provides the following contributions to the literature:
  • Develop a generalized control strategy that jointly optimizes microgrid operation and load shifting techniques to create “stacked economic value.”
  • Demonstrate how load shifting improves the technical and financial value of existing microgrid investments for a client with critical loads.
  • Evaluate how the amount of load shifting and duration of load shifting affect the limits to which optimization algorithms can minimize microgrid operating costs.

2. Materials and Methods

Optimal load shifting and optimal microgrid control are first calculated separately, and then jointly, to evaluate the potential stacked economic value of these capabilities under one supervisory controller.

2.1. Optimization Platform

The microgrid optimization platform Xendee is used to identify the cost-optimal on-grid dispatch [61]. Xendee is a cloud computing software that jointly performs techno-economic optimization and power systems analysis. Xendee’s economic optimization tool selects, sizes, places, and dispatches energy assets within a microgrid portfolio using a mixed-integer linear programming (MILP) approach. The optimization objective function seeks to minimize total annualized system costs of the project period [57]. These costs are comprised of utility purchases, technology investments, operation and maintenance costs, carbon taxes, sales to the utility, and incentives/tax credits [61]. Equation (1) shows the cost function with sales to the utility, technology investments, carbon taxes, and incentives/tax credits removed, as those are not applicable to the case study. In particular, exports are removed as they are not allowed. Furthermore, investments, incentives, and taxes are not included because the existing infrastructure is currently in place. Equation (2) provides the primary system-wide energy balance as an example of the approximately 576,000 constraints used by Xendee to fully describe the problem space of the microgrid and building automation simulation [61].
C t = t C t u t i l + t C t O & M
where:
C t is the system cost ($) at time t .
C t u t i l is the cost ($) to purchase electricity from the utility at time t .
C t O & M is the operations and maintenance cost of the microgrid asset ($) at time t .
t is a discrete time-step of one hour.
P t = P t g r i d + D E R P t D E R
where:
P t is the electricity load required (kW) at time t .
P t g r i d is the electricity purchased (kW) at time t .
P t D E R is the electricity supplied (kW) from on-site generation sources at time t .
D E R is the technology type that sources the electricity.
t is a discrete time-step of one hour.

2.2. Scenarios and Optimizations

Four scenarios are explored to generate data and conduct a sensitivity analysis to assess the stacked economic value of microgrid control and building automation.
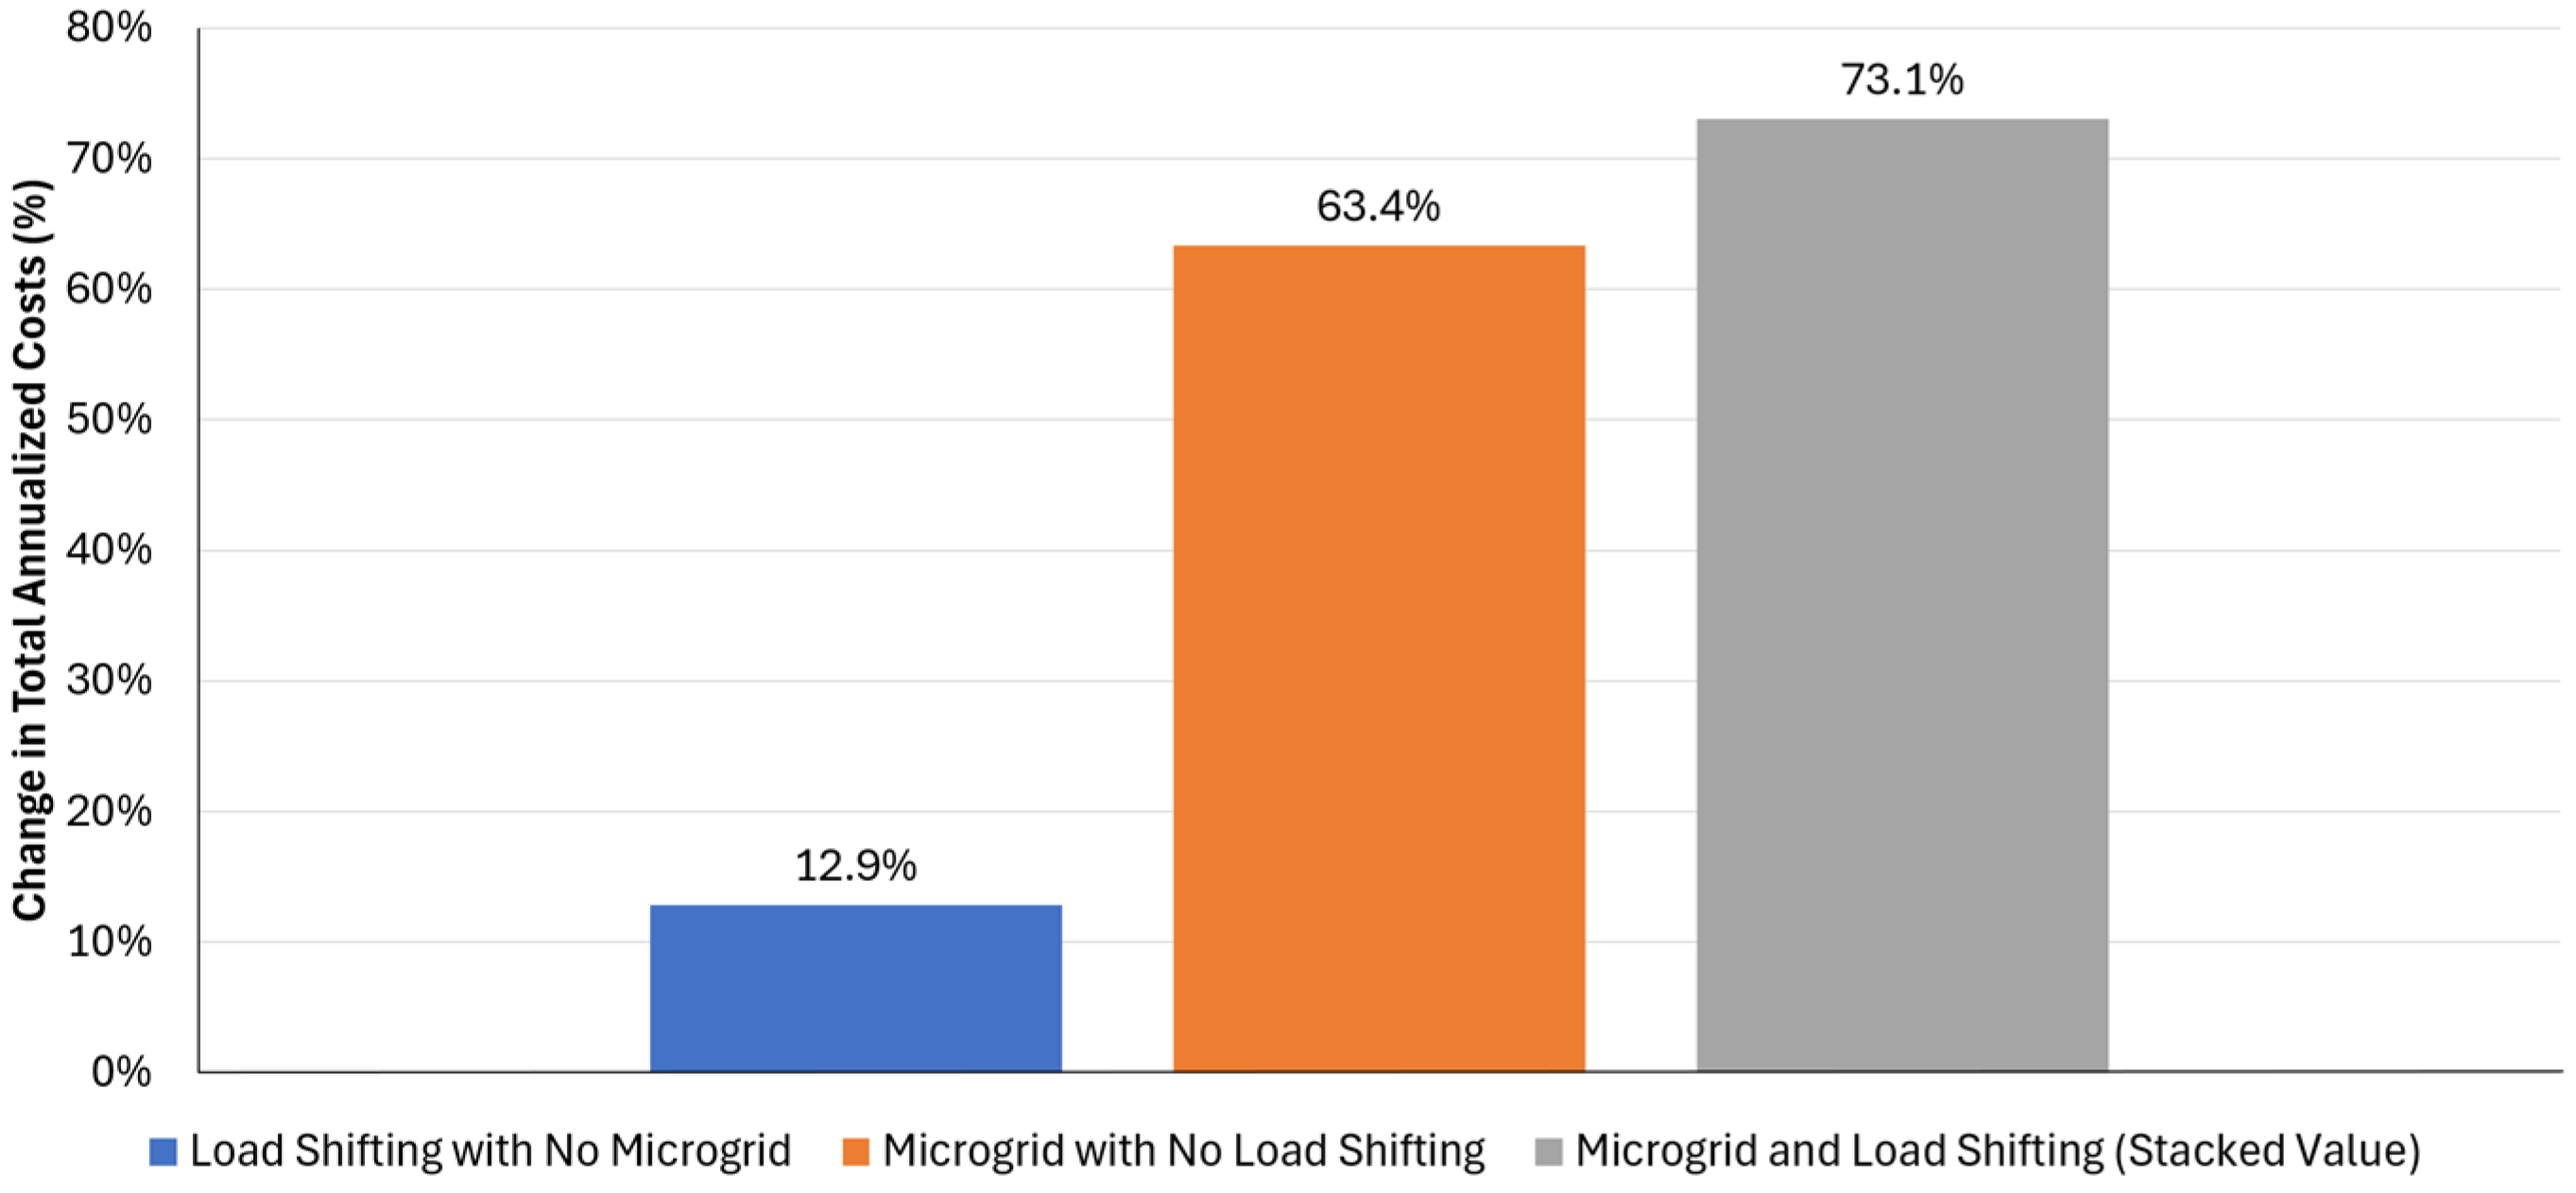
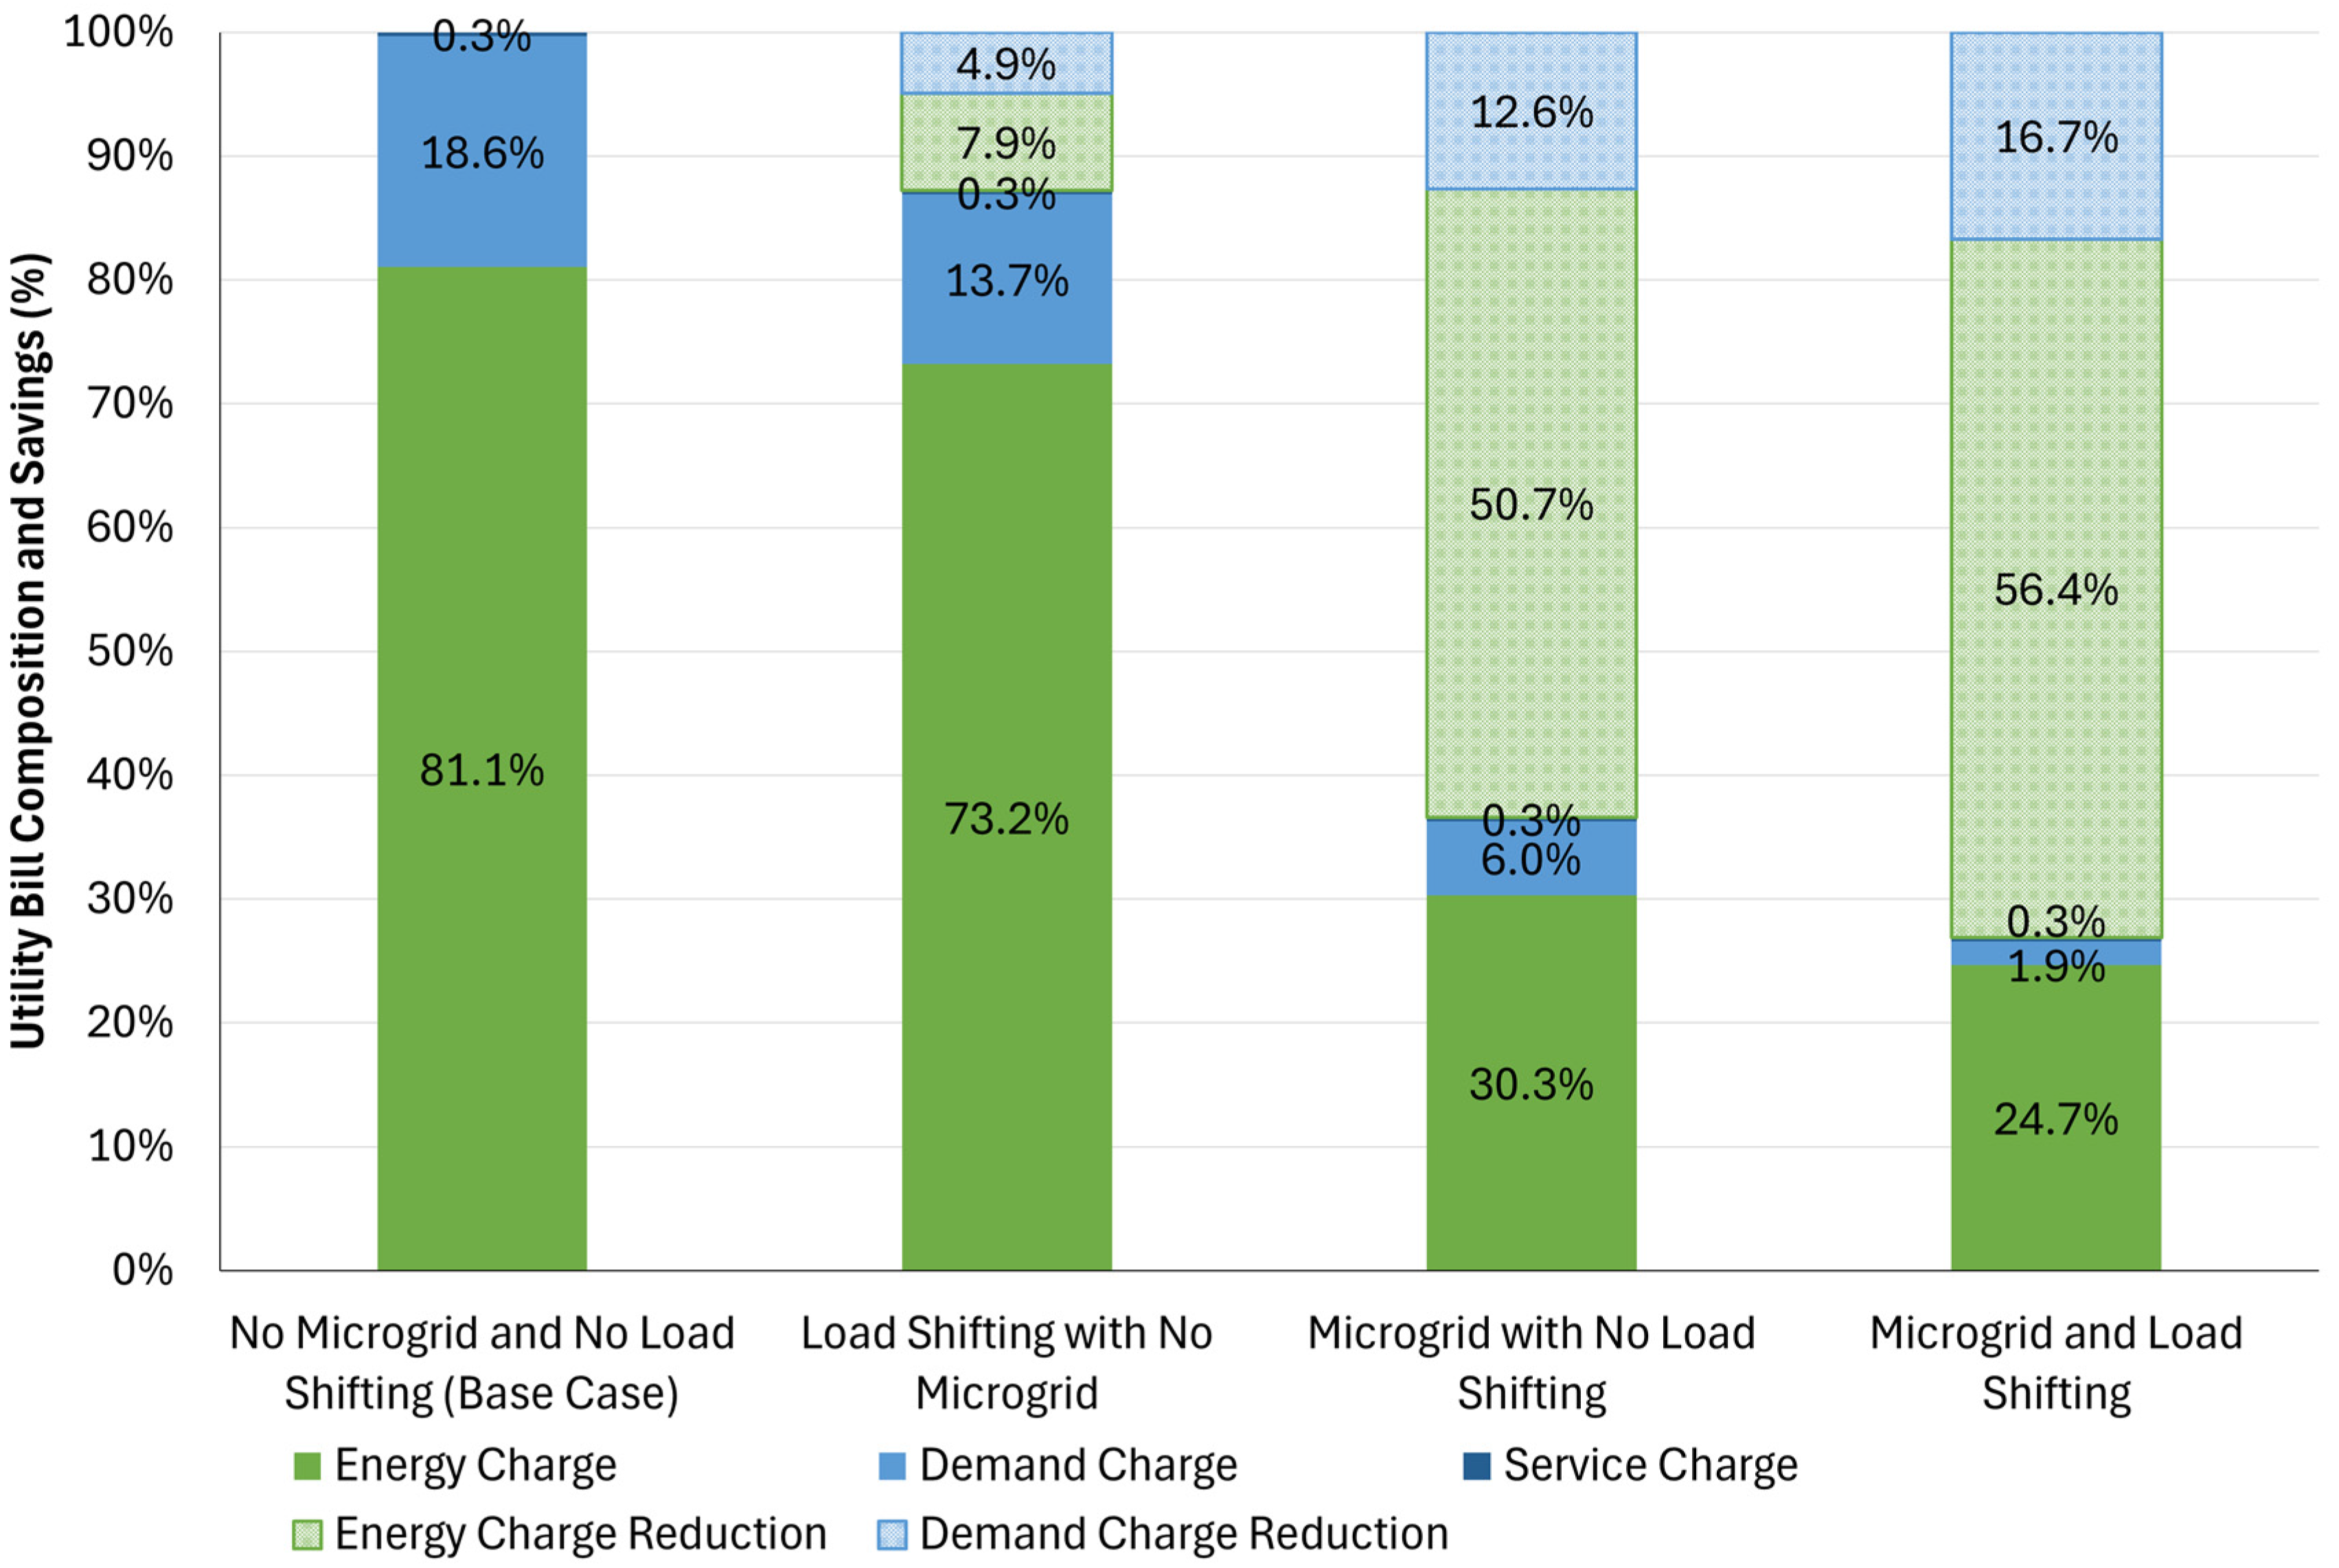
  • No microgrid and no load shifting (base case)—No microgrid assets are installed, and no load shifting is available. Loads are served only by utility purchases. There are no features available to the customer to control or reduce the load.
  • Load shifting with no microgrid—No microgrid assets are installed. Loads are served only by utility purchases. A site controller employs load shifting, which can reschedule the load to meet its demand at a time different from the originally scheduled time.
  • Microgrid with no load shifting—Microgrid assets are installed, such as solar PV and battery energy storage. Load can be met through on-site generation and storage or through utility purchases. There is no ability for the customer to control the timing of load consumption.
  • Microgrid and load shifting—Microgrid assets are installed, and the load can be met through on-site generation, storage, or utility purchases. Purchases from the utility grid or microgrid assets such as PV or battery energy storage could supply the energy as scheduled, or load shifting could reschedule the load to meet its demand at a time different than originally scheduled. Furthermore, if load shifting reschedules the load, the purchases from the utility grid or energy generated by microgrid assets could supply this energy.
The base case and microgrid with no load shifting scenarios run only one optimization each. The base case and the microgrid with no load shifting utilize the sizes of existing DER assets and calculate the resulting dispatch routines, providing a comparison point. The scenarios with load shifting include more optimization runs that explore the effect of load shifting control parameters on output parameters, with each combination of input parameters creating a new optimization with unique annual system costs and load dispatches. The two scenarios with load shifting each include 15 optimizations that are a result of combinations of the following parameters:
  • Maximum duration of load shifting: 1, 2, or 3 h.
  • Maximum percentage of daily load that can be load shifted: 5%, 10%, 15%, 20%, or 25%.
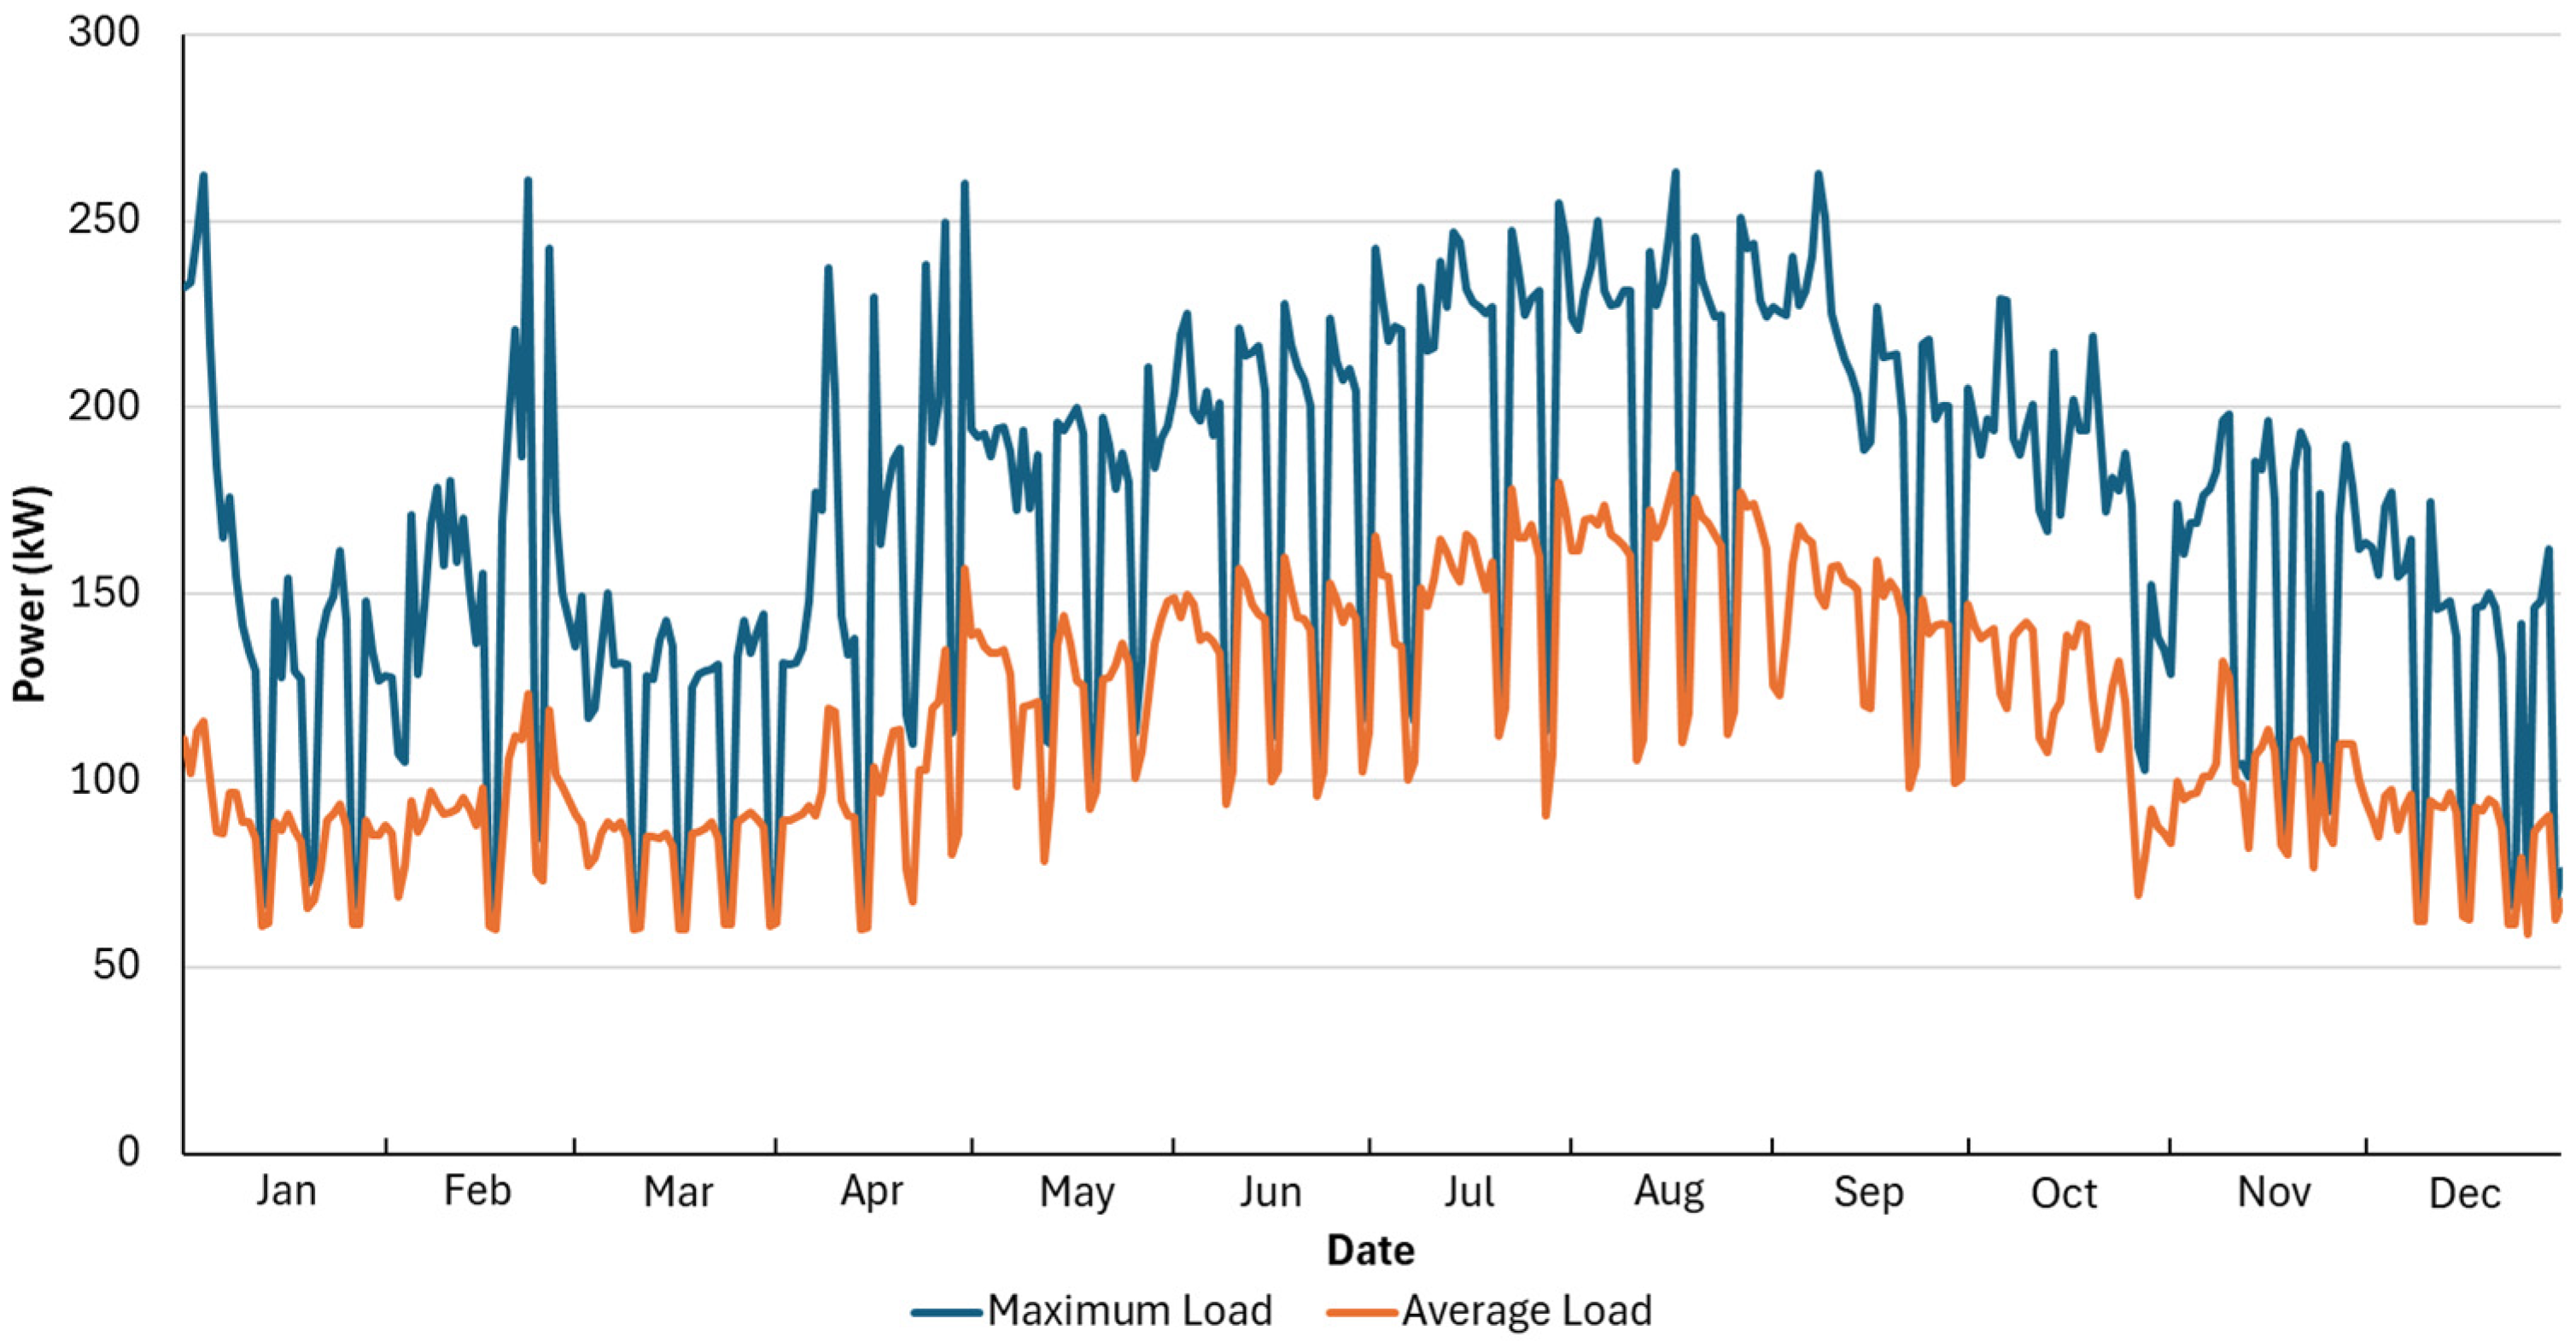
Three hours was chosen as the longest duration to allow energy shifting based on heating and cooling loads [62], and 25% is an example maximum percentage of daily load for HVAC electrical requirements [63].
Optimal load shifting and optimal microgrid control are first calculated separately, and then jointly, to evaluate the potential stacked economic value of these capabilities under one supervisory controller. The stacked economic value is equated as in Equation (3).
S = A B
where:
S is the stacked economic value ($).
A is the annualized costs ($) of the base case (Scenario 1).
B is the annualized costs ($) of the microgrid and load shifting case (Scenario 4).
Case study data is used for a government facility located in the United States. This microgrid was selected due to the increasing interest from the U.S. Office of the Secretary of Defense (OSD) in maintaining resilience and powering critical loads during an islanding event. Sensitive information about the installation has been anonymized [57].

2.3. Loads

The installation has electrical loads, which include thermal conditioning units and auxiliary infrastructure (chiller, fan coil units, pumps, and water heater), exterior and internal lighting, process equipment, and plug loads. Figure 1 displays the daily maximum and average load consumed by the base over all days of the year in 2019.
Loads can be divided into two categories: (i) critical loads that must be served at the time of their demand and (ii) non-critical loads that could be adjusted through load shifting or curtailment. Heating and cooling are common non-critical loads that can be shifted earlier or later in the day to take advantage of TOU rates and to enhance renewables utilization [53,54,57,58]. Non-critical loads are modeled as a percentage of the total load to evaluate potential benefits of increasing sophistication in building automation.

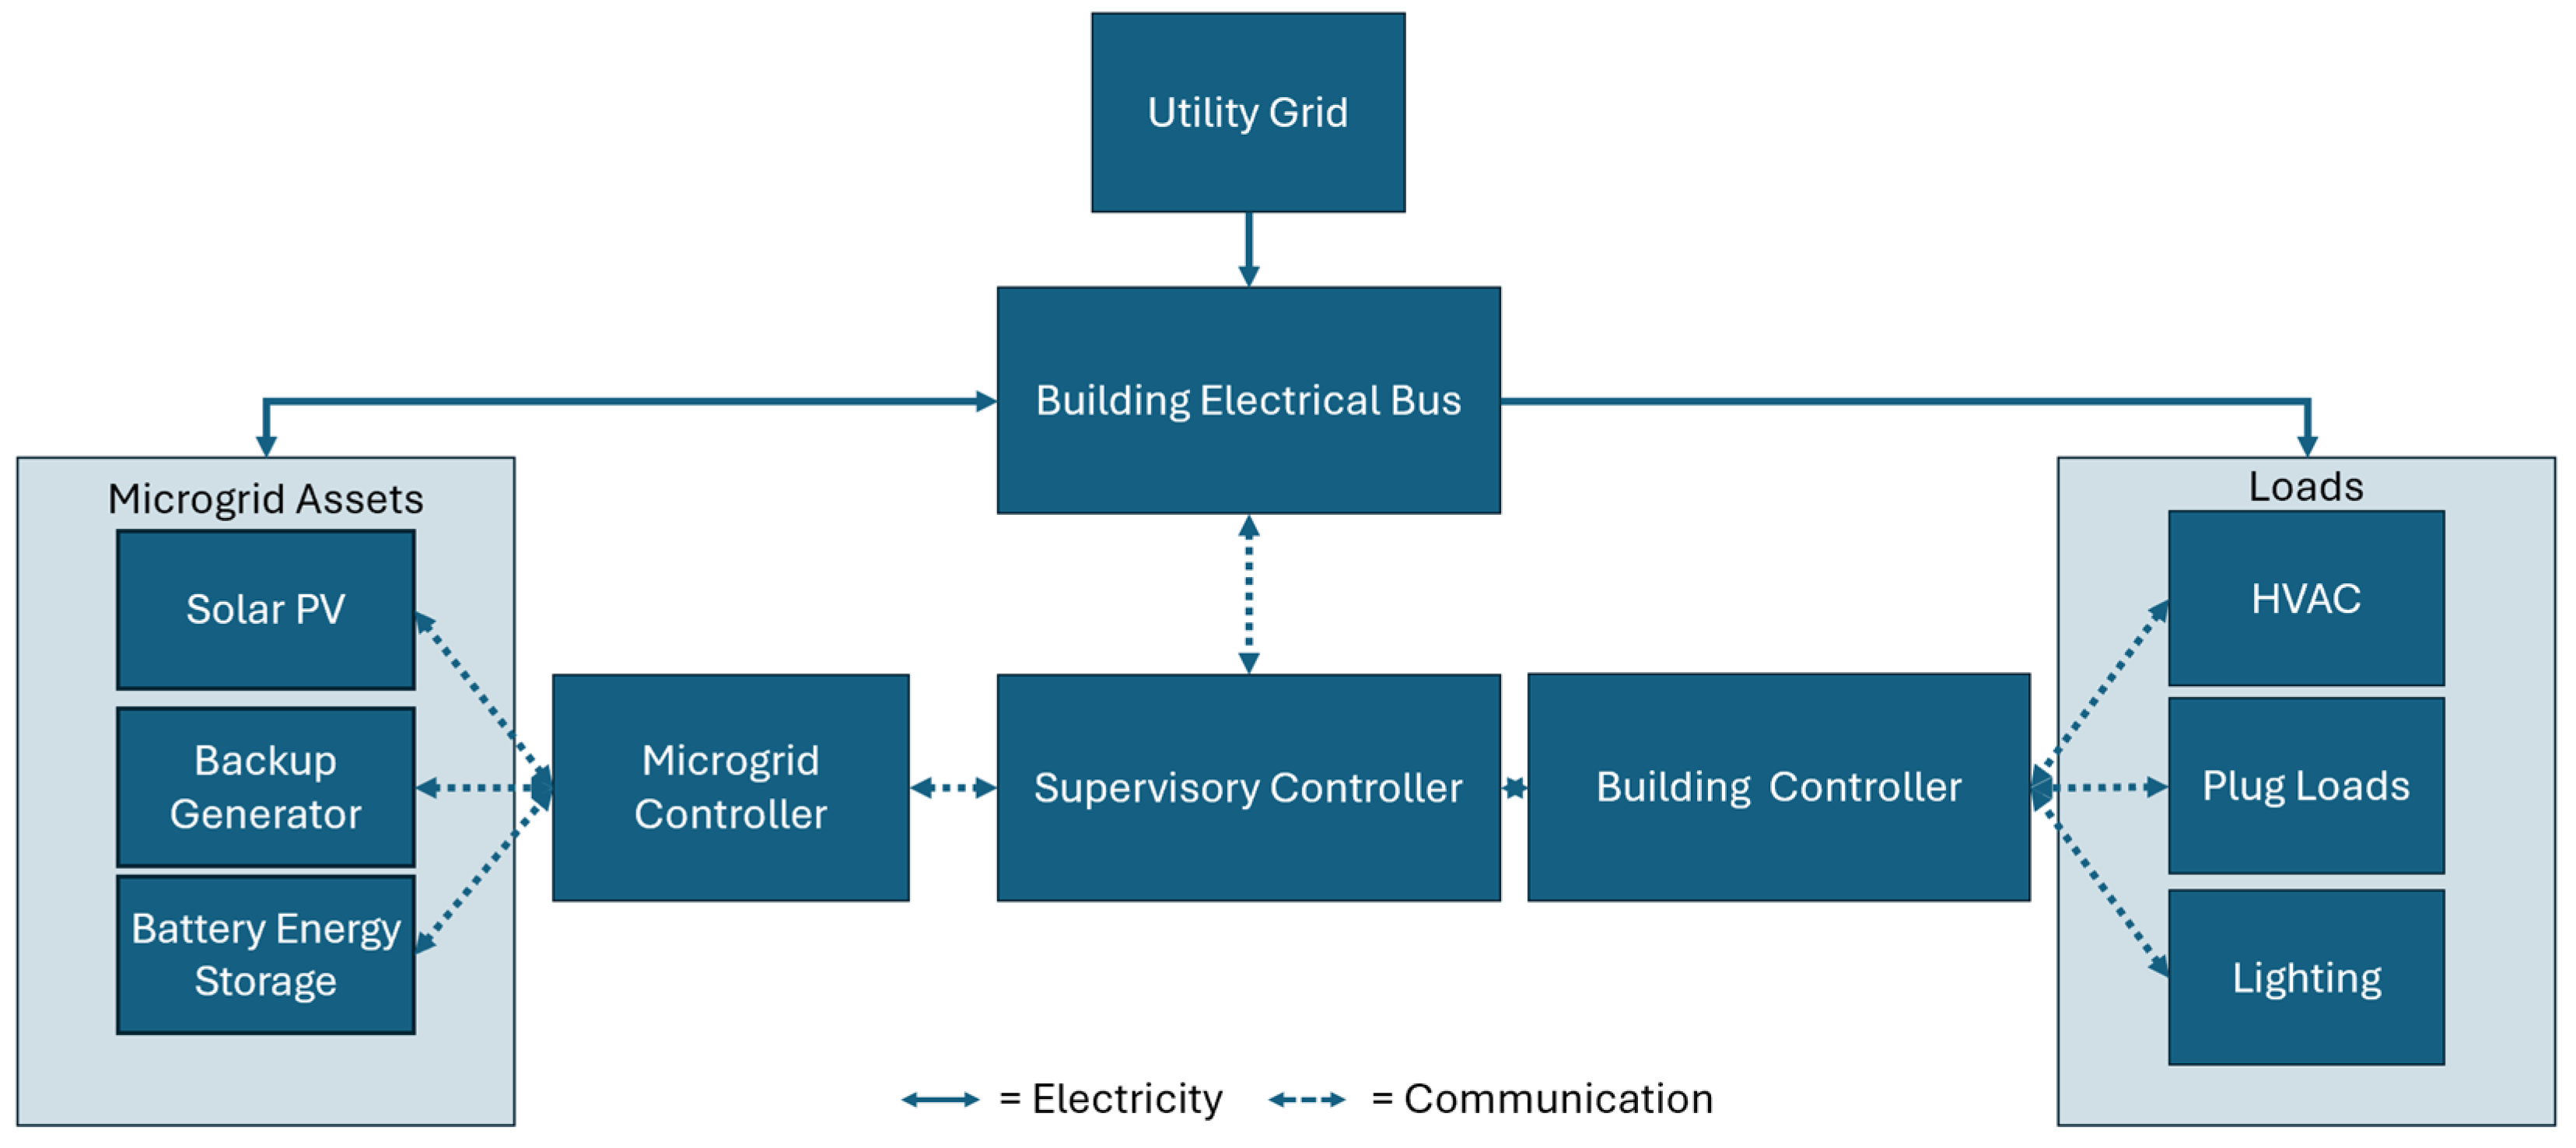
2.4. Microgrid Assets

The installation has an existing microgrid to improve resilience in the event of a grid outage and reduce operating costs by minimizing energy purchases and demand charges from the utility. Figure 2 shows how a supervisory controller can integrate the dispatch of building automation systems (load shifting) and microgrid assets to address the primary questions of this work. Namely, how might a supervisory controller integrate legacy investments and create an additional, stacked value by dispatching assets to better reduce utility expenditures? The utility agreement in this case study does not permit power export; hence, this arrow is unidirectional and not bidirectional.
The specific microgrid assets present at the site are described in Table 1. The solar inverter doubles as the inverter for the battery energy storage system with dual DC inputs. There is also an on-site backup generator, but it cannot be used during grid-connected operation and is therefore excluded from this analysis of on-grid economics. All loads are AC; hence, this is an AC microgrid.

2.5. Utility Rate Structure

Table 2 summarizes electric utility charges and shows how rates change during the time of year, day of the week, and time of day. Over the course of one month, energy charges and demand charges are in effect during weekdays while only energy charges apply on weekends. The utility interconnection agreement does not allow electricity export, and therefore any energy generated from on-site solar PV must be consumed at the time of generation, stored in the battery for consumption later, or curtailed.

3. Results and Analysis
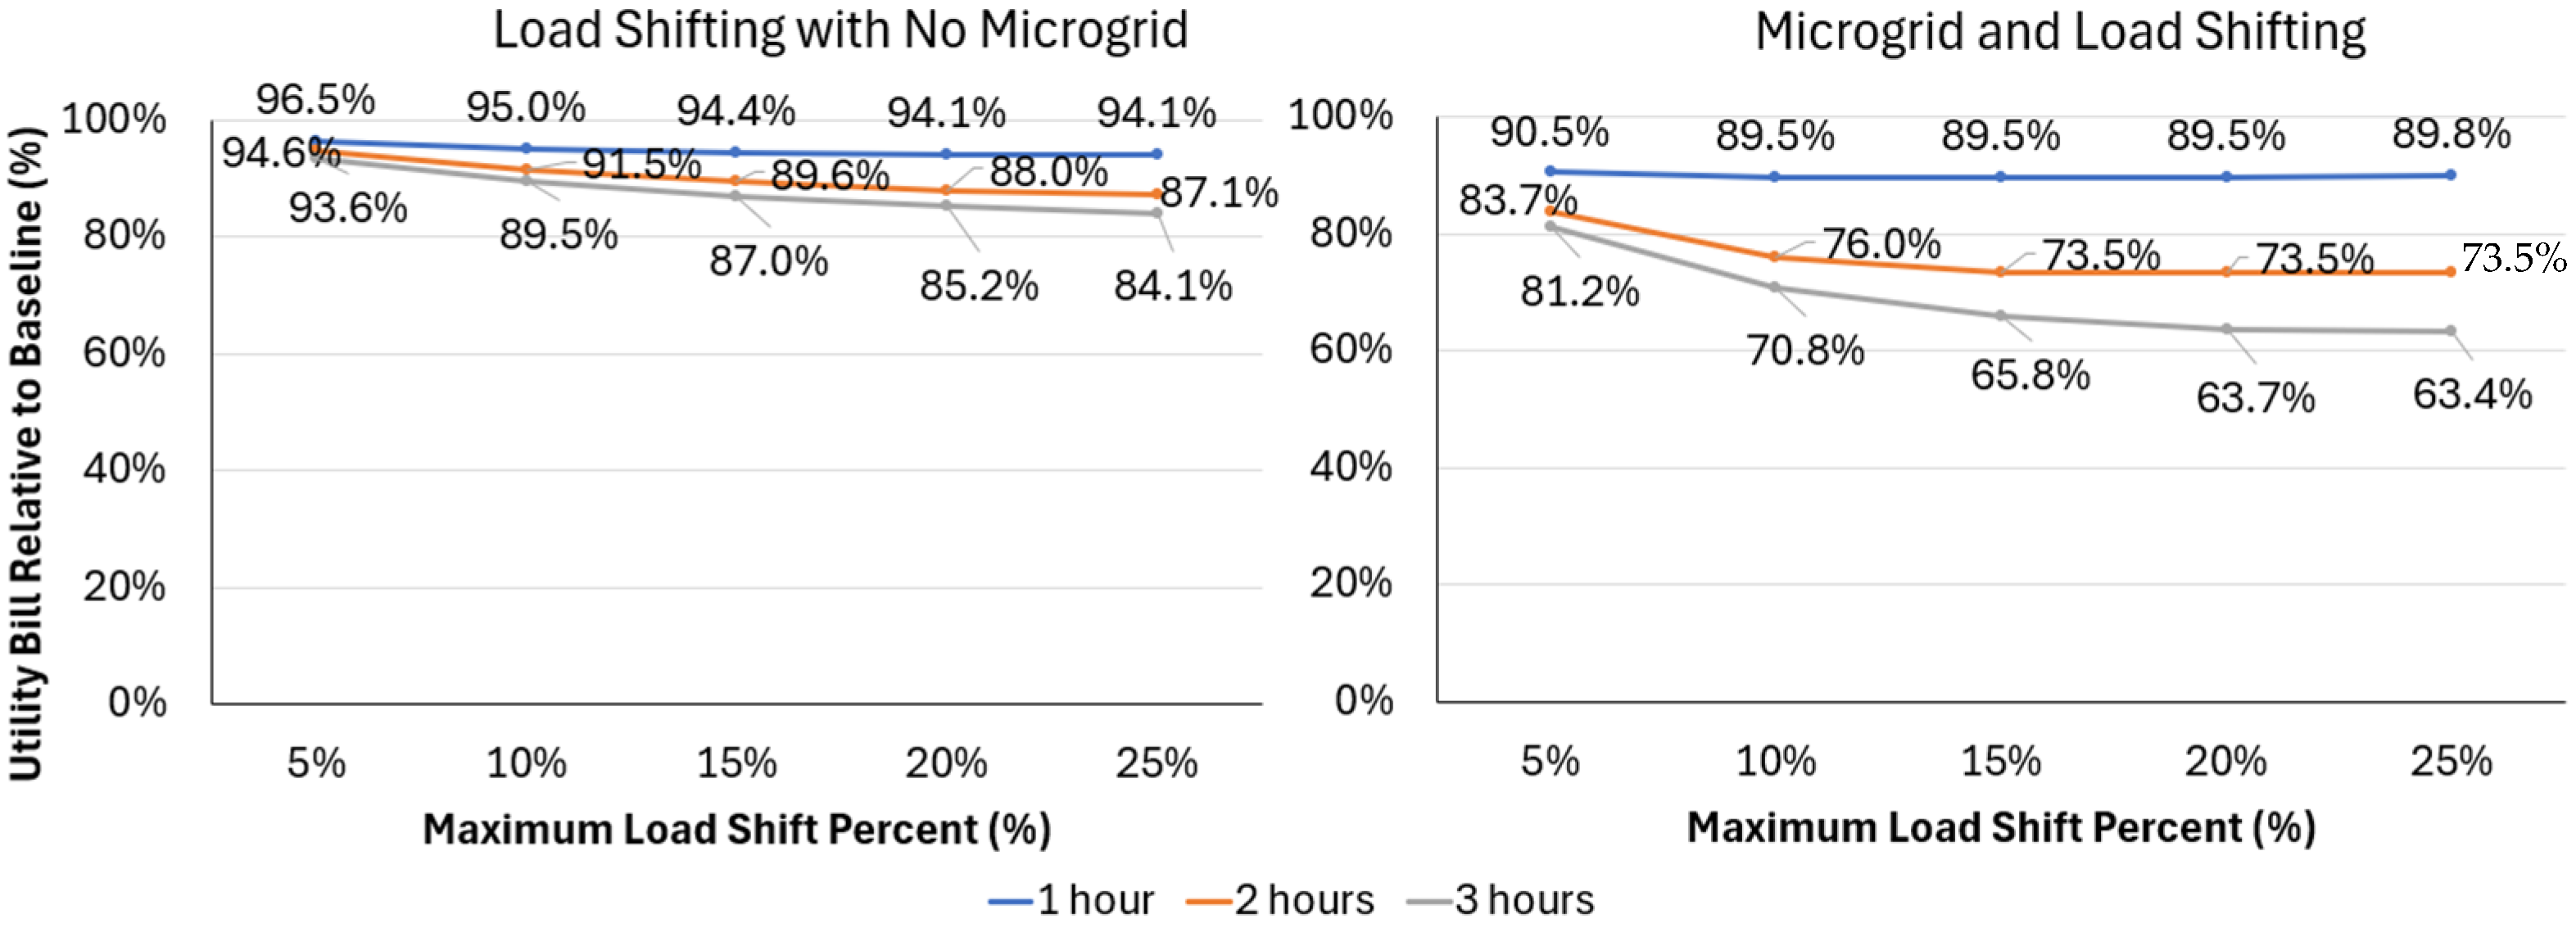
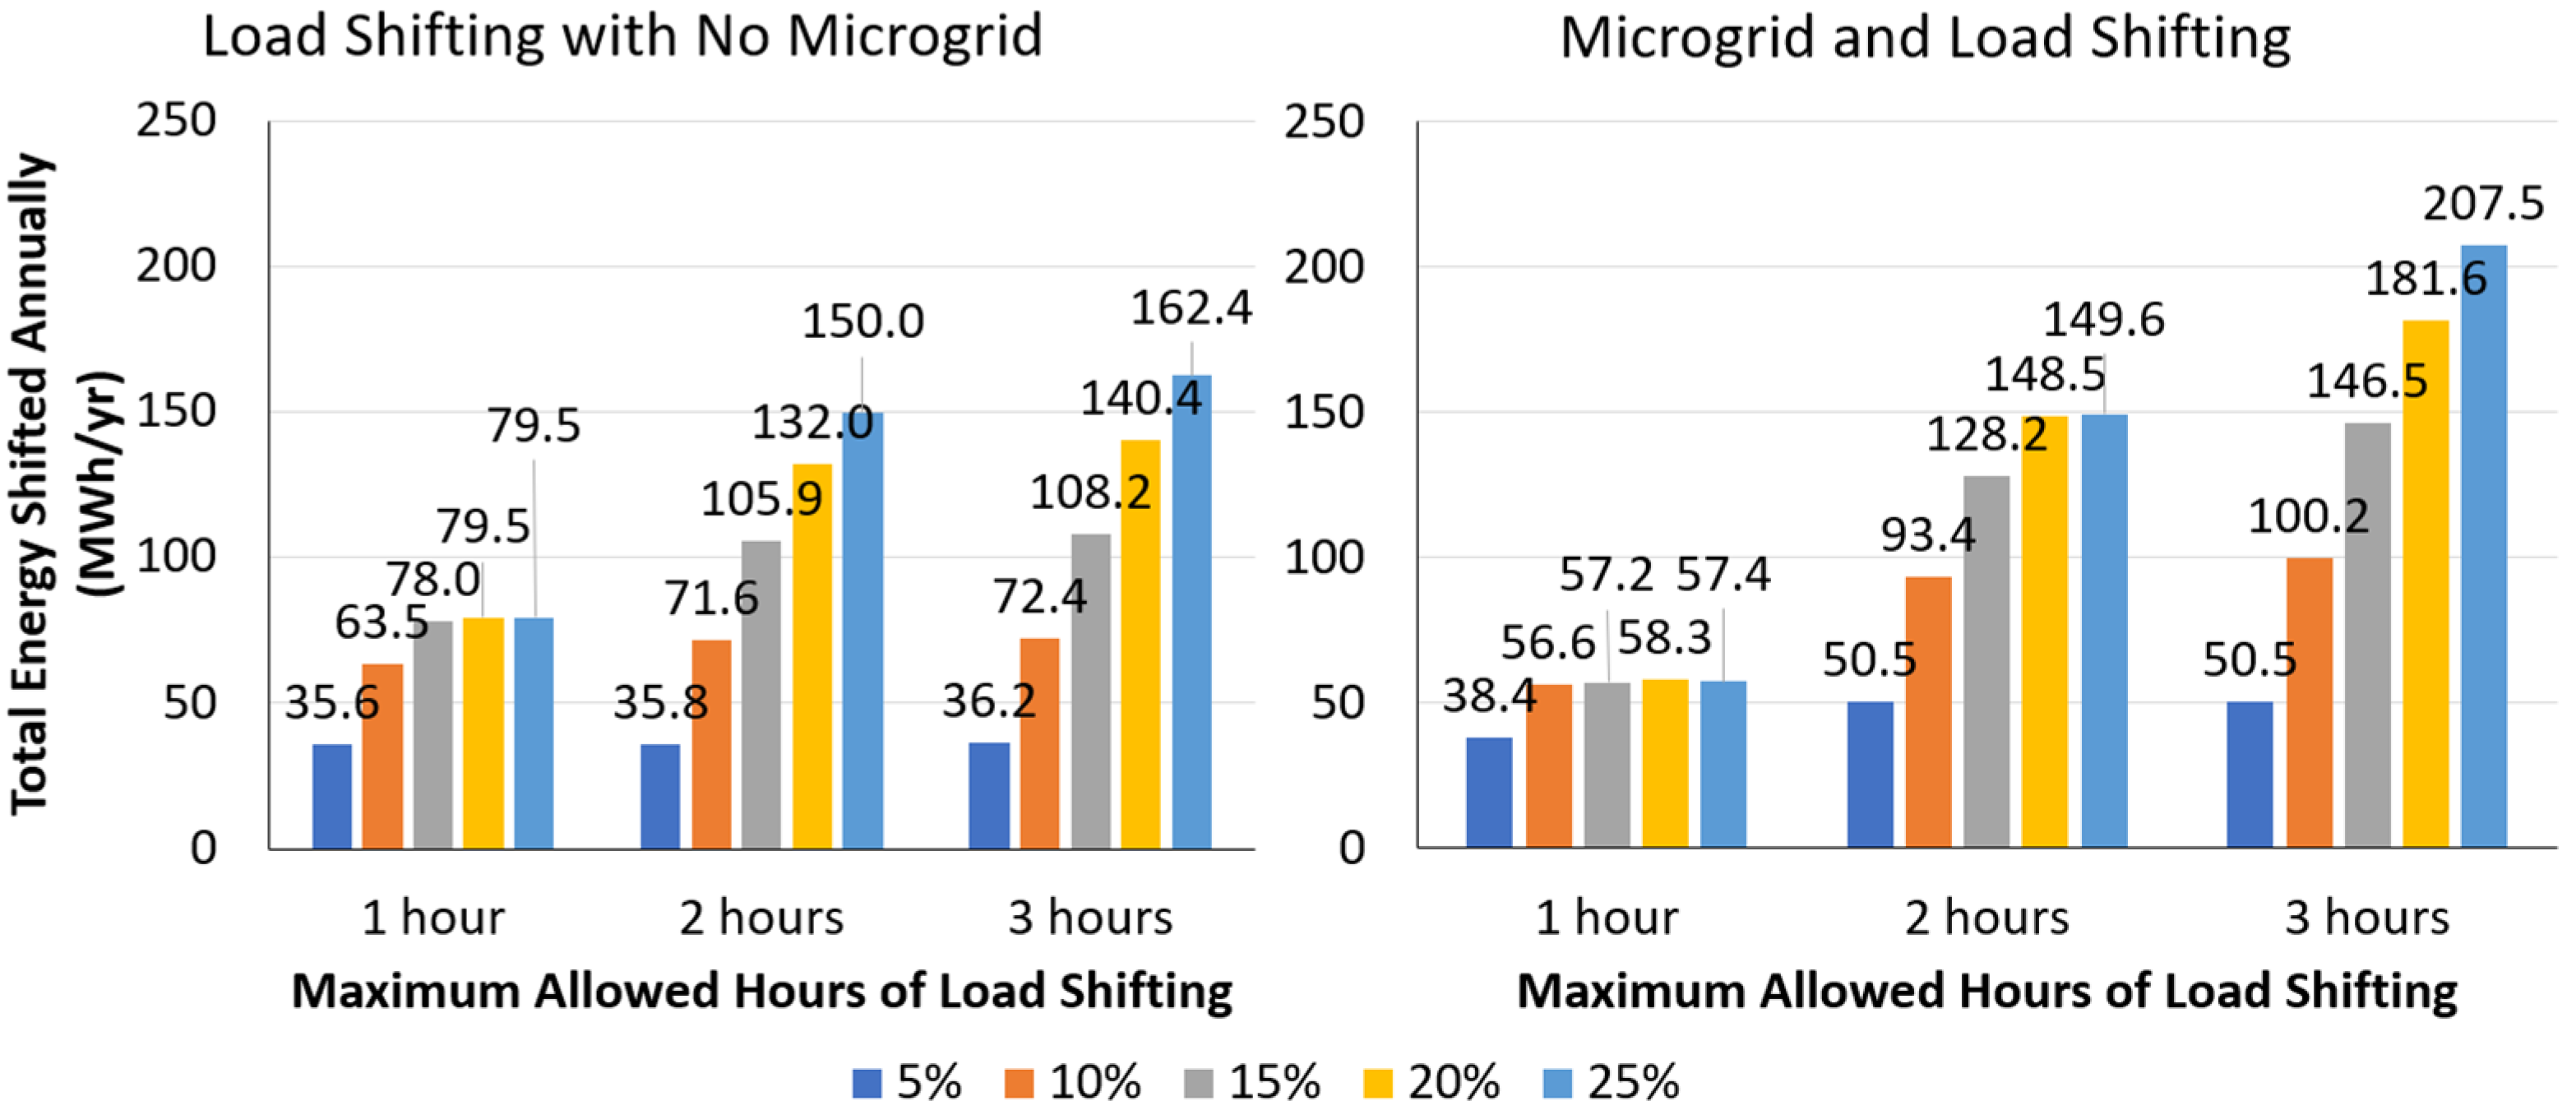
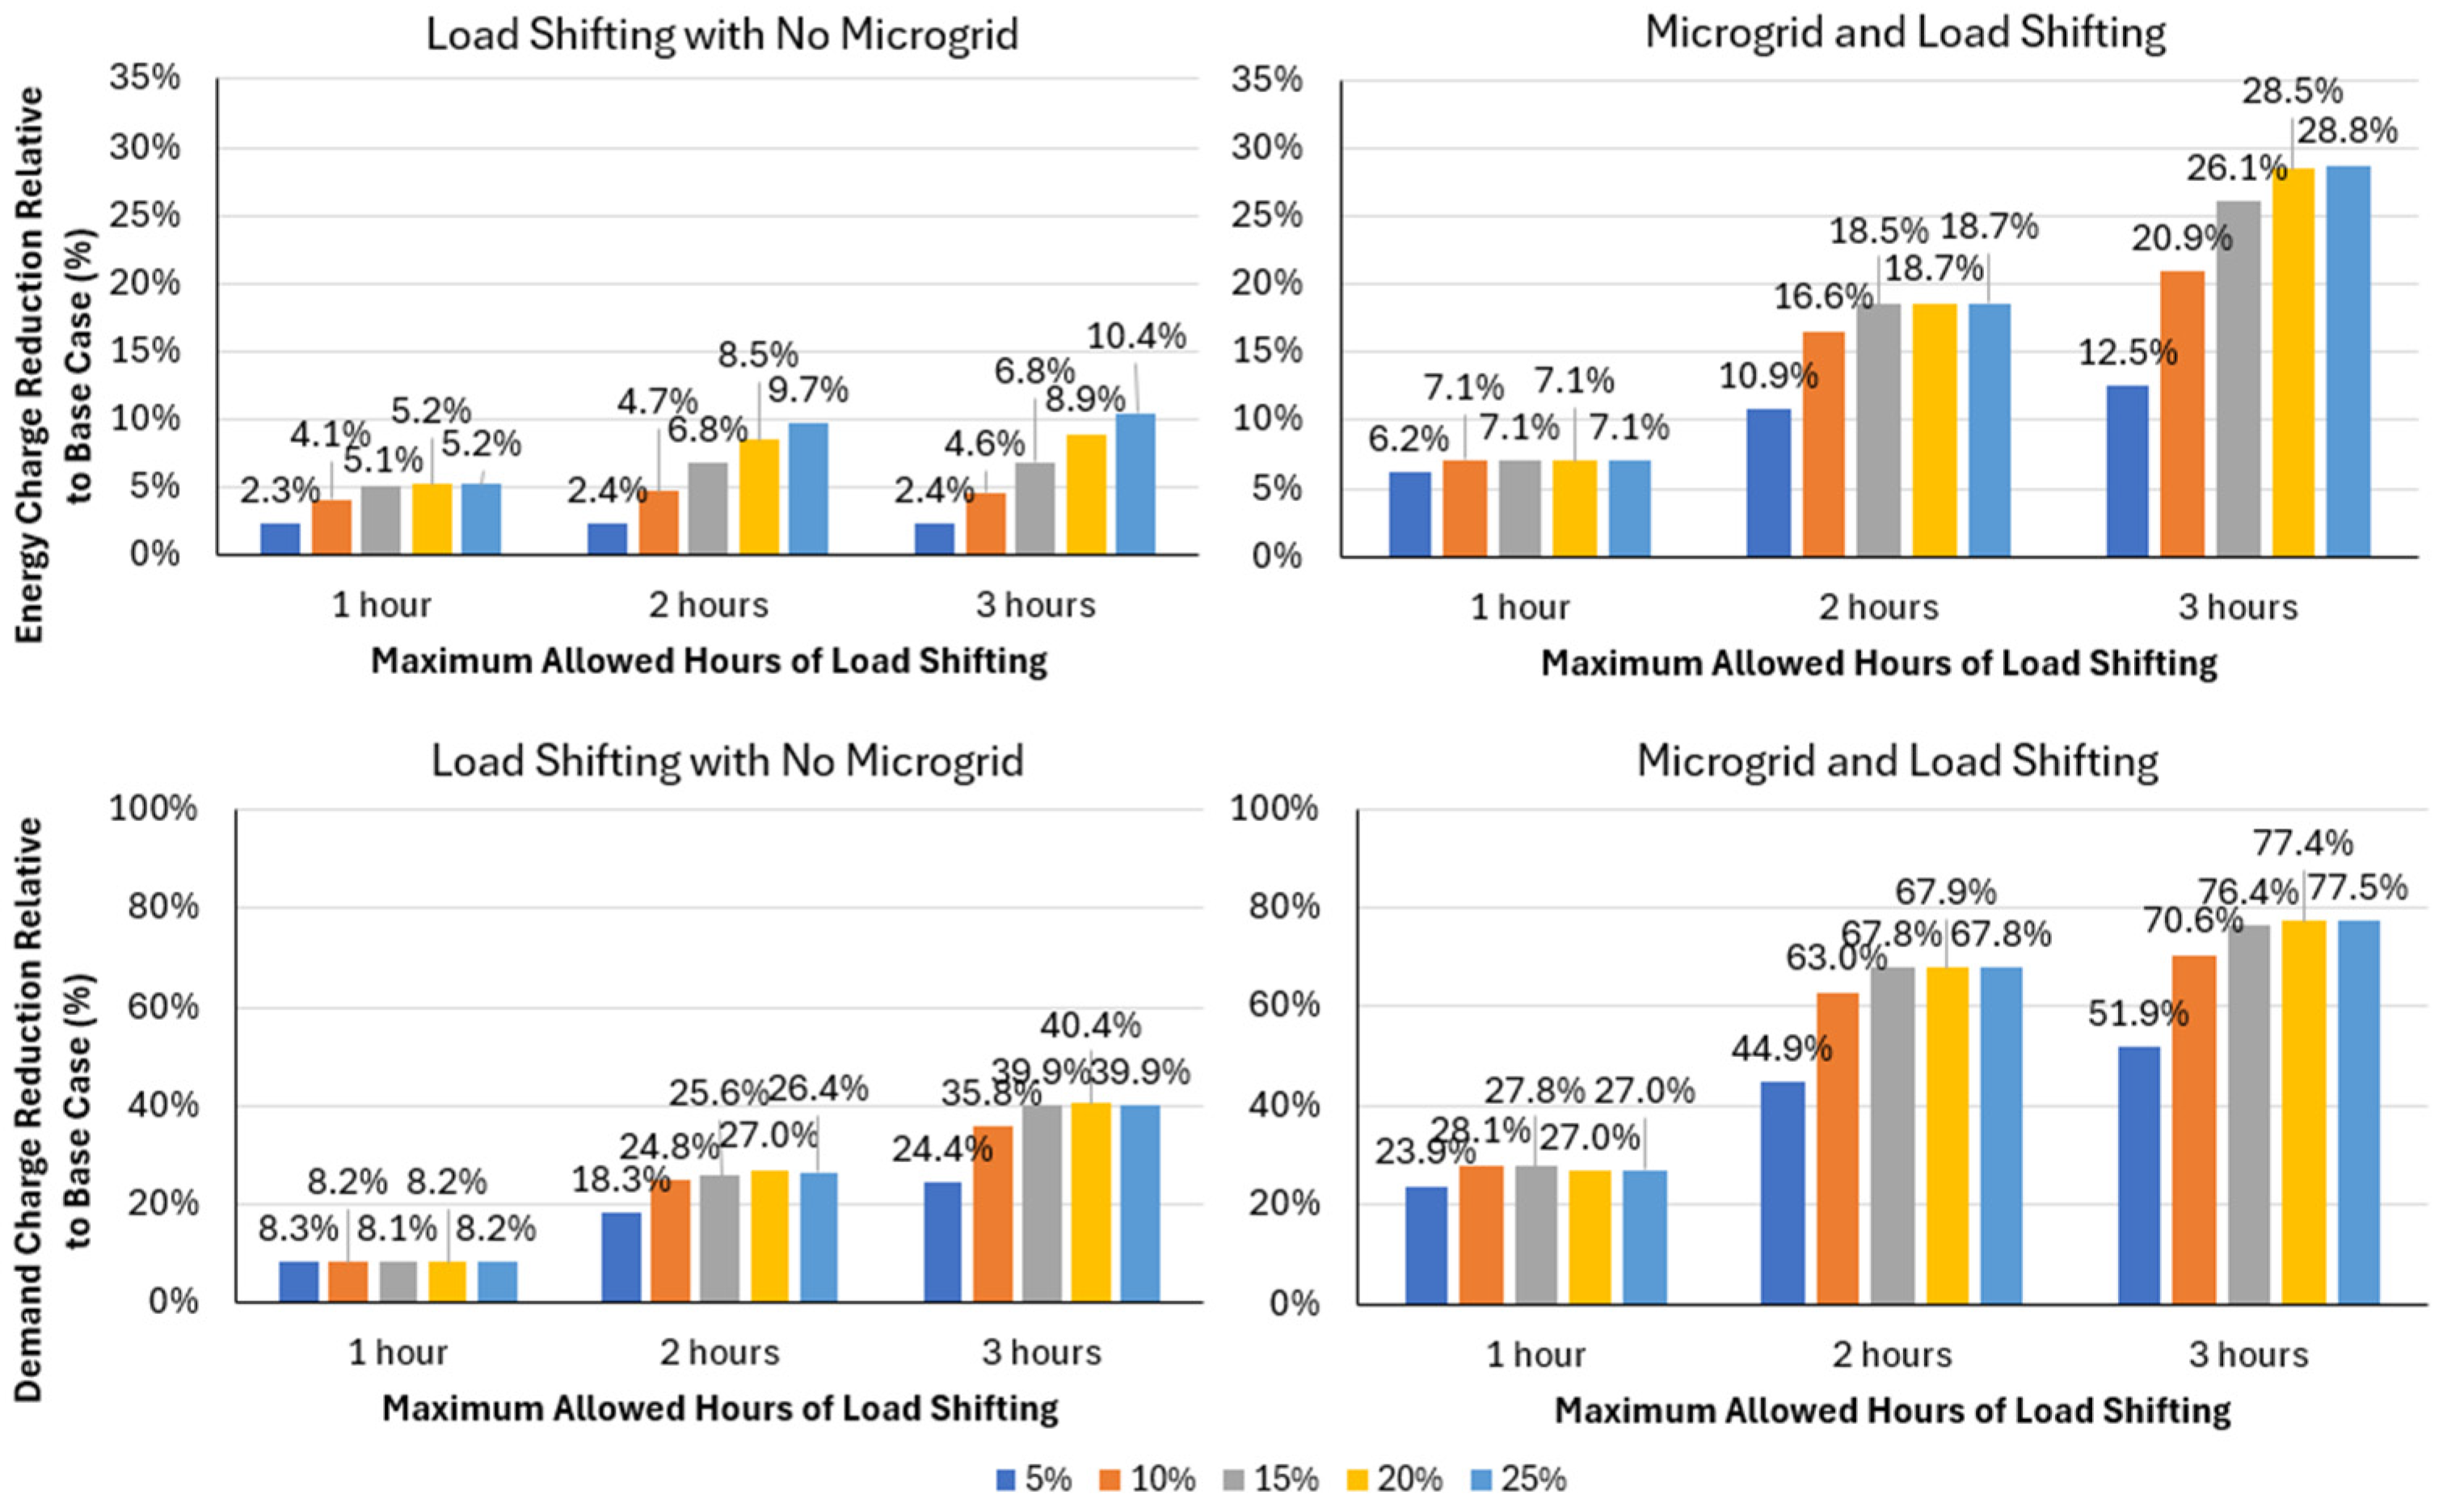
The results are presented in three sections: annual results, which provide summary statistics of stacked economic value; monthly results, which highlight seasonal variations; and daily results, which display the intraday behaviors of the supervisory controller. These results are simulated outcomes from the Xendee optimization engine when jointly optimizing microgrid operation and load shifting techniques for the identified use case.

3.1. Annual Results

Figure 3 displays the total annual costs for the cost-optimal dispatch across the four scenarios when maximum allowed hours of load shifting is two hours and the maximum allowable percentage of daily load that can be shifted is 25%. Load shifting yields greater relative savings when added to a microgrid (26%) compared to load shifting alone without a microgrid at 15%.
Figure 4 displays the change in annualized costs compared to the base case across the other three scenarios. Just using the microgrid alone provides an annualized cost reduction of 63% compared to the base case. The economic value can be increased to 73% with load shifting by coordinating microgrid assets with building automation systems.
Figure 5 shows where these cost reductions occur through both decreases in energy charges and demand charges. With a base case result showing energy charges at 81% and demand charges at 19%, load shifting provides a far greater relative impact on demand charge reduction at 26.3% of demand charges (5%/19%) compared to 9.9% of energy charges (8%/81%), with demand charges accounting for 38.5% of total annual savings. This is explained by the rate structure, which has more significant cost reductions in demand charges than energy charges for mid-peak and off-peak times (where demand charges go to zero). When including microgrid assets in the optimization with load control, the energy charges decrease by 70.3% and demand charges decrease by 89.5%, with demand charges only comprising 8% of the annual costs (2%/25%) as compared to 19% in the base case. When looking at just the microgrid case with no load shifting, it is apparent that the microgrid provides significant energy charge savings that contribute to 79.7% of the total cost reduction, compared to load control, in which energy charge savings were only 61.5% of the total cost reduction. These results indicate that, for this case study, the microgrid enables a significant reduction in energy charges, whereas load shifting prioritizes demand charge reduction, and the two approaches offer complementary benefits that create stacked economic value for improved economics at the site.
The marginal benefit of load shifting can be explored through a sensitivity analysis by varying the maximum allowable hours for load shifting and the maximum allowable percentage of daily load that can be shifted. Figure 6 provides this comparison with and without a microgrid, with the results shown relative to the base case and microgrid with no load shifting, respectively. Utility expenditures decrease as the maximum hours of load shifting increase. Importantly, the percent change is higher when adding load shifting with a microgrid than without. When the maximum allowable hours for load shifting is one hour, the average cost savings is 5.2% when there is no microgrid and 10.2% when there is a microgrid. This is a relative change of 97.8%. This relative change increases when increasing the maximum allowable hours for load shifting—it is 144.1% for 2 h and 156.2% for 3 h. This indicates that the savings potential of load shifting increases as the maximum allowable hours for load shifting increase.
The total amount of energy shifted throughout the year (Figure 7) increases as either the load shifting percentage or the maximum allowable hours of load shifting increases. It is notable that the benefit of load control plateauing at lower hour durations but steadily increases if loads can be shifted for longer durations, illustrating the linked benefits of load shifting penetration and duration. For example, for a maximum penetration of 25% load control, the energy shifted increases by 160.7% with a microgrid versus 88.8% without a microgrid, as loads can be shifted up to two hours instead of just one hour. This is a relative difference of 81.1%. The relative difference between two hours and three hours is 367%, which highlights the stacked economic value of being able to shift more energy with a microgrid.
The financial benefit of this behavior is articulated in Figure 8, which shows how energy charge reductions and demand charge reductions are greater for a microgrid as load shifting duration and penetration increase. Energy charge reductions are 56–252% greater and demand charge reductions are 96–226% greater for cases with a microgrid as compared to cases without a microgrid. The increase in load shifting enables loads to be scheduled coincident with periods of on-site generation to offset or completely avoid utility purchases during peak pricing periods, an underlying behavior that enables stacked economic value and financial savings. If only load shifting was available, the consumer pays reduced charges by shifting into less expensive hours, but must still purchase all power from the utility.
While the extent of demand charge reduction is up to four times greater than the reduction in energy charges, the financial savings of demand charges are less due to their smaller proportion of overall electricity charges, as shown in Figure 5. This suggests that the stacked economic value of microgrids and load control may be even more significant in locations with electricity tariffs that more heavily weight billing towards demand charges than energy charges. It is also notable that the stacked economic value for energy charge reductions increases as the maximum hours of load shifting increase, but the trend reverses for demand charge reductions. Stated differently, most of the financial savings for microgrids and load control result from demand charge reductions when only small amounts of load can be shifted, but as more load can be shifted, the marginal improvements to energy charge reductions are greater than that of the demand charge reduction. This occurs as utility purchases are spread across more of the day and demand charge reductions reach their limits.

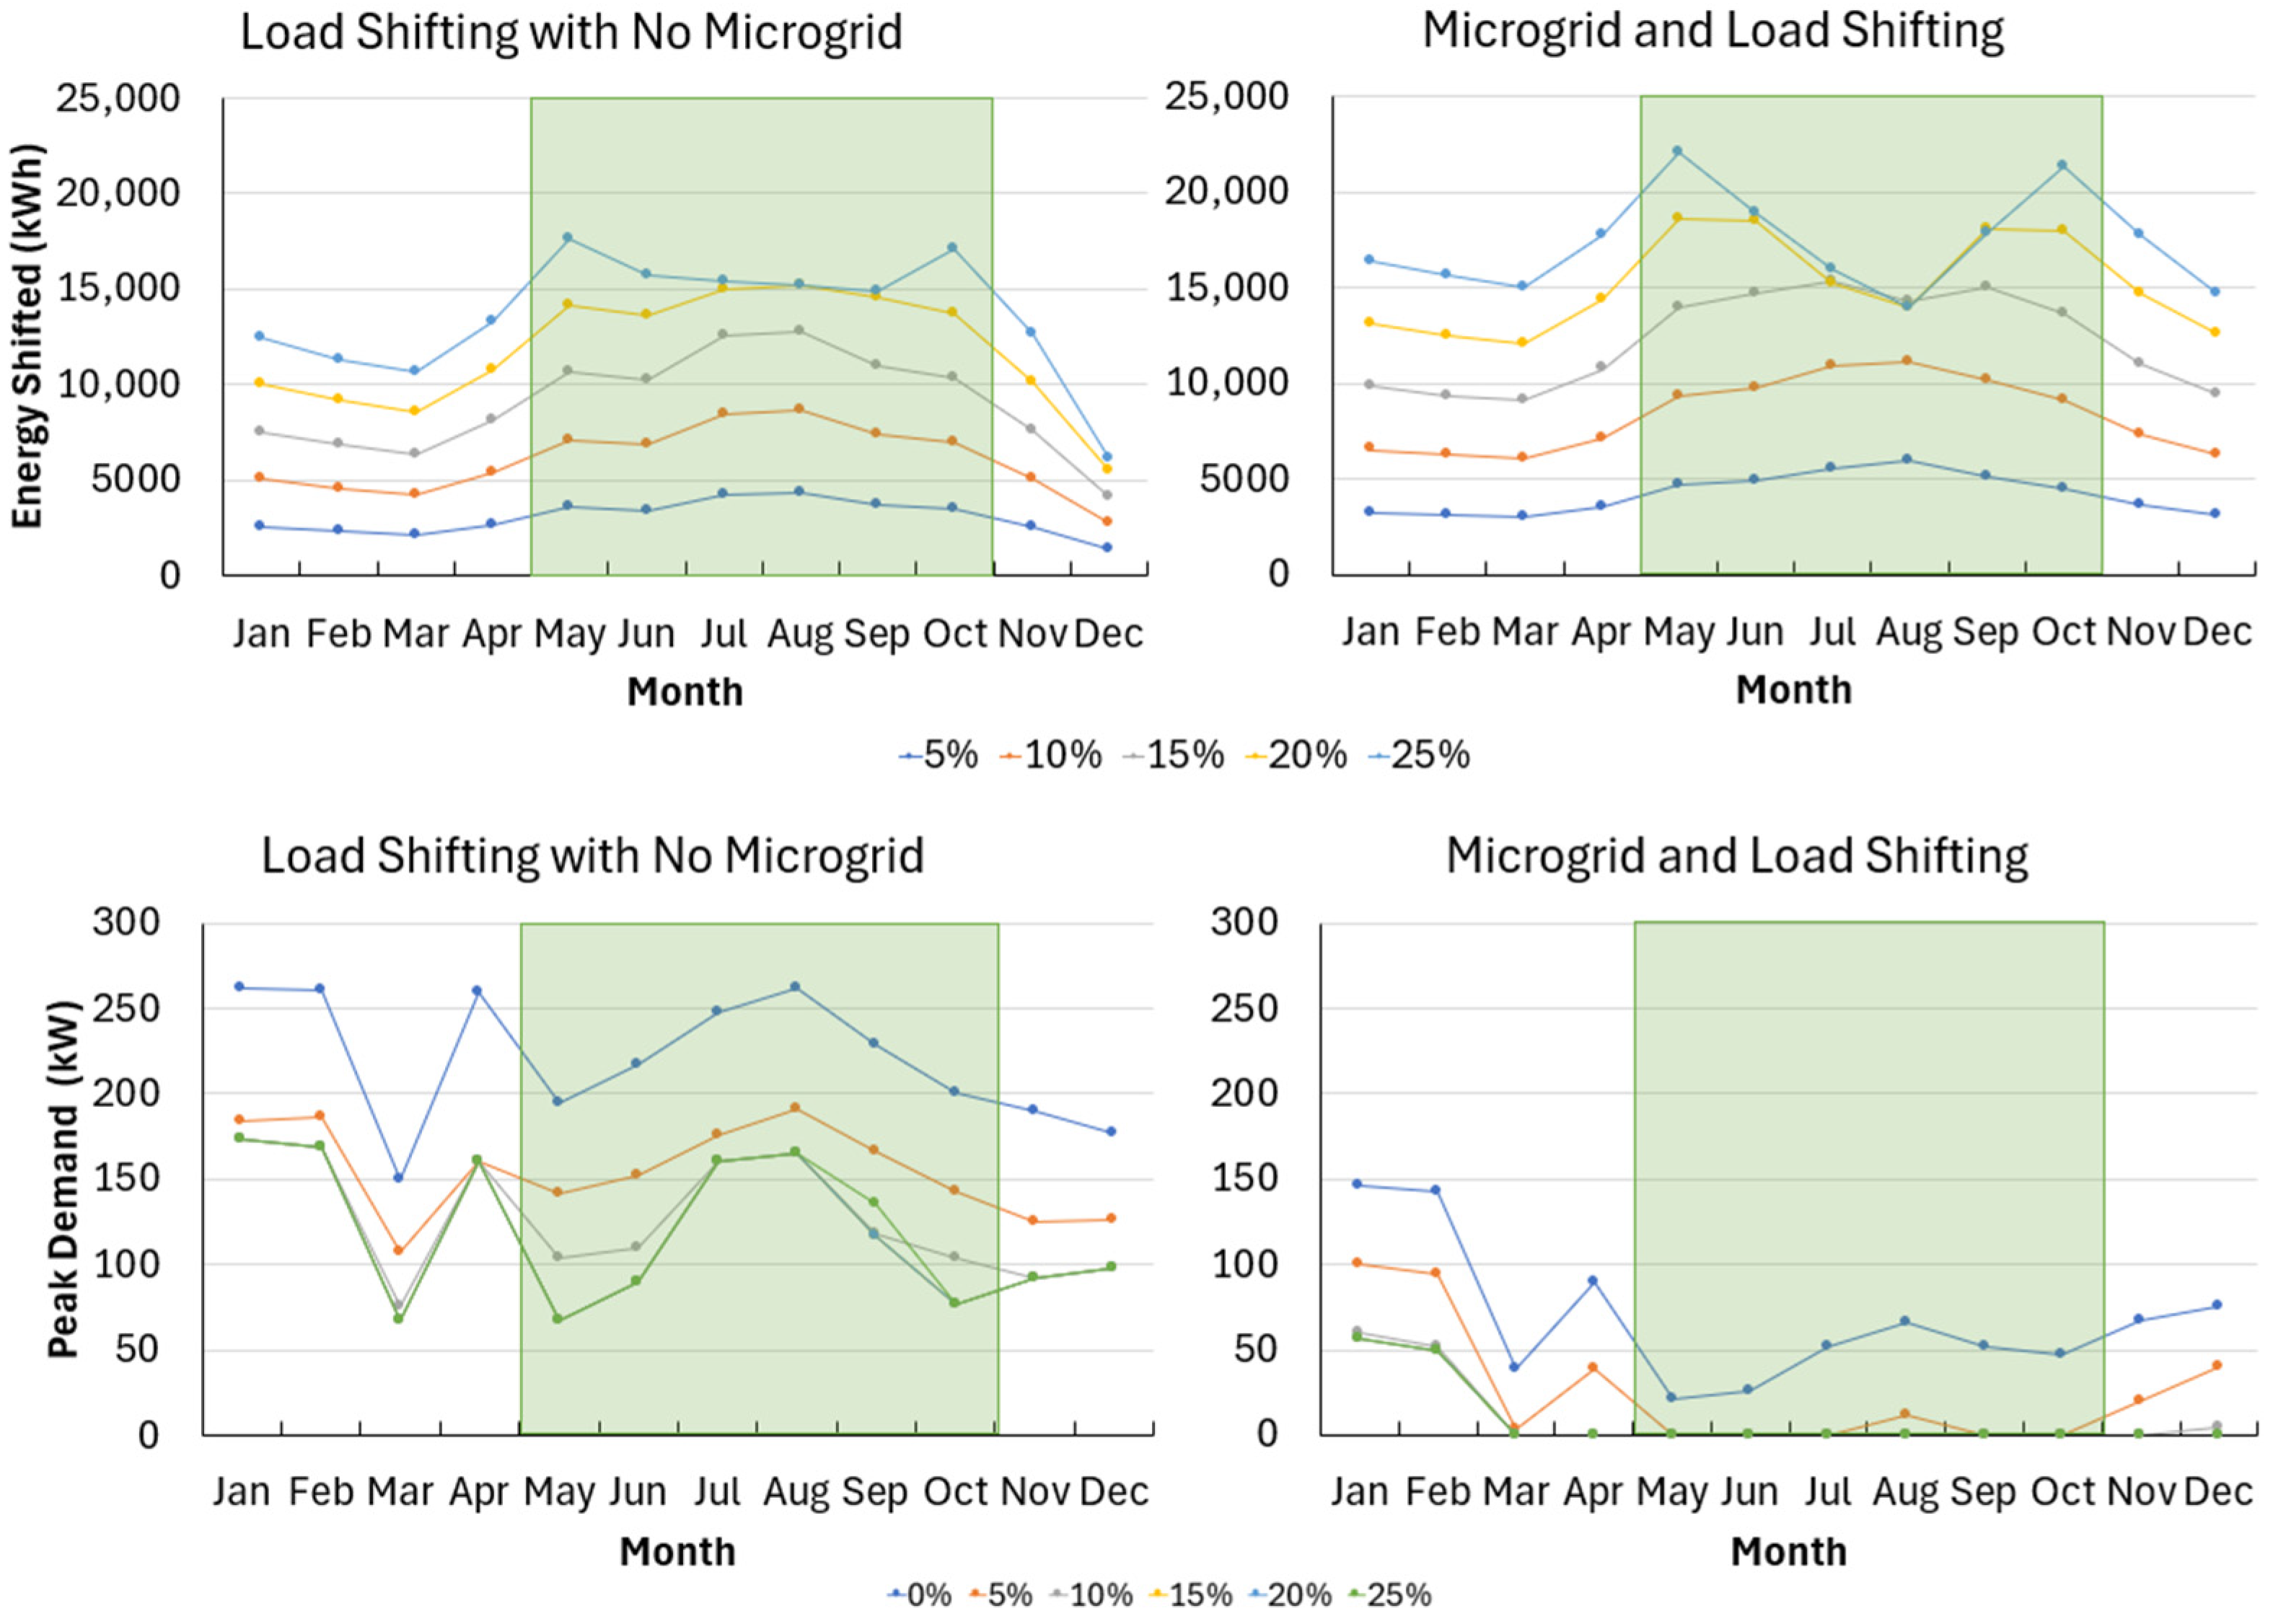
3.2. Monthly Results

Figure 9 shows how the amount of energy shifted in each month varies across the year, with varying maximum allowed load shifting percentages (a maximum load shifting duration of three hours is shown for brevity). Load shifting is greater during the summer billing period, when the price difference between on-peak and off-peak billing rates is larger, providing a greater incentive to shift power between periods of the day. Further, the summer billing period has weekday-only on-peak rates between 2 and 7 p.m., whereas the winter billing period has weekday-only on-peak rates between 5 and 9 a.m., and it is more beneficial to shift energy in the summer months to the afternoon on-peak period, as it coincides with high solar PV production relative to the morning hours of the on-peak period in the winter months. Load shifting is highest in May and October, the first and last months of the summer billing period, because both months maximize solar PV production and minimize total energy purchases from the utility to meet relatively lower load requirements in summer months. In comparing systems with and without a microgrid, November and December show the greatest stacked economic value for energy shifting because shifting load to times of day with on-site generation provides greater impact for the winter months when less solar is available. August sees relatively low amounts of energy shifted because there is lower load shifting on weekend days and weekday mornings, because the site has high load requirements during August when it is not advantageous to shift.
Our examination of the peak demand in each month provides further insights into the stacked economic value and gives more specific evidence for the findings in Figure 9. Demand charge reductions achieved with a microgrid are significantly greater than those obtained through load shifting alone. At only 10% load shifting, demand charges can be zeroed out for 9 of the 12 months of the year when combined with a microgrid, with the exception of the winter months. Solar PV generation is greatest during summer months, and while load also peaks during that time, the provision for load shifting allows all demand charges to be avoided by shifting load to coincide with solar PV generation.

3.3. Daily Results

Daily dispatch is illustrated using a day in August and January due to its high load requirements. An illustration of utility demand levels is shown in Figure 10. In August, a summer month, the on-peak period occurs between the hours of 2 and 7 p.m., and within that period, for a site without a microgrid, the lowest peak demand is 165 kW for a maximum load shifting percentage of 10% or higher. When load shifting is combined with a microgrid, the peak demand can be reduced to zero when the maximum allowed load shifting is at least 10%. The contrast between the two scenarios, particularly with the similar 165 kW peak demand at a maximum load shifting percentage of 10% and higher without a microgrid, reinforces how the constraint of maximum load shifted in any one hour limits the effectiveness of load shifting without a microgrid. For the scenario with a microgrid, there is a high utility demand in the 12 a.m.–1 a.m. hour because purchased power is used to recharge the battery during the period of the day when there is no demand charge. This rapidly recharges the battery after its discharge during the previous afternoon and evening. The spike in demand for a scenario with a microgrid is approximately 40% higher than the peak demand when there is no microgrid, with the former occurring in the early hours and the latter during midday hours. This behavior could be changed to spread battery charging across the off-peak period to reduce battery C-rates, keep within utility tariff and interconnection limits, and avoid potential changes to tariff structures if the annual peak demand exceeds that allowed by the current tariff structure.
In January, a winter month, the on-peak period occurs between the hours of 5 and 9 a.m., and within that period, for a site without a microgrid, the lowest peak demand is 114 kW for a maximum load shifting percentage of 25%. When any load shifting is combined with a microgrid, the peak demand can be reduced to below 114 kW. Furthermore, there is much less load consumed during the mid-peak and off-peak hours with a microgrid than without one. Instead, 9 p.m. has a much higher demand with a microgrid than without because of load shifting’s proclivity in reducing consumption and charges during the mid-peak period.

4. Discussion

The economic benefits of load shifting are greater when combined with a microgrid and coordinated dispatch of loads and microgrid assets. The methods and case study results illustrate “stacked economic value”, showing energy charge reductions are 56–252% greater and demand charge reductions are 96–226% greater when load shifting is combined with a microgrid as compared to load shifting without a microgrid. Increasing the amount and duration of load shifting improves the stacked economic value when combined with a microgrid. Loads can be shifted to coincide with periods of on-site generation to offset or completely avoid utility purchases during peak pricing periods, an underlying behavior that enables stacked economic value and increased financial savings. This behavior is similar to other leading studies in the literature [46,47,48] in which load shifting increases renewables utilization and hence reduces purchases during peak pricing periods. The percentage reduction in demand charges is greater than energy charges—a generalizable finding—but the relative impact on utility expenditures is dependent on the utility tariff structure and composition of demand charges and energy charges in the utility bill. In this case study, demand charge reductions were four times greater than energy charge reductions, but the financial savings of demand charges are less due to their smaller proportion of utility charges. This suggests that the stacked economic value of microgrids and load control may be even more significant in locations with electricity tariffs that more heavily weight billing towards demand charges than energy charges—a finding important for commercial and industrial settings where demand charges are often present and are a large share of the utility bill [34,35]. It is also notable that most of the financial savings from demand charge reductions occur when only small amounts of load can be shifted, but as more load can be shifted, the marginal improvements to energy charge reductions are greater than those of demand charge reductions. Adding load shifting to a site with a microgrid allows more load to be coincident with on-site generation and reduces overall utility purchases. Nevertheless, the high magnitude of reductions in both the demand and energy charges compared to the base case is among the highest of those reported in the literature [8,14,16,17,18]. This highlights the combined benefits of supervisory controls that jointly optimize and dispatch load shifting and microgrid assets. Even further benefits could be achieved by aggregating the demand response potential of many such consumers into a virtual power plant to create a sufficiently large amount of dispatchable power to displace the costs of centralized generation upgrades and dispatch [60].
This study motivates increased scientific study, engineering, and co-investment in microgrids and building automation systems. The demonstrated use case is representative of the many situations in which there are legacy building automation systems and microgrid investments. Hence, only operating costs, and not capital costs, are considered. Subsequent research and development could investigate system sizing and the associated capital costs and life cycle costs of microgrids and load shifting to complement this study of system operations. Automation could further improve life cycle costs through the application of cloud computing algorithms, adaptive control, coordinated networks, and reduced asset downtime.

Author Contributions

Conceptualization, A.G., N.G.J. and J.N.; methodology, A.G., N.G.J. and J.N.; software, A.G. and J.N.; validation, A.G., N.G.J. and J.N.; formal analysis, A.G.; investigation, A.G.; resources, N.G.J. and J.N.; data curation, A.G.; writing—original draft, A.G.; writing—review and editing, A.G., N.G.J. and J.N.; visualization, A.G.; supervision, N.G.J.; project administration, N.G.J. and J.N.; funding acquisition, N.G.J. and J.N. All authors have read and agreed to the published version of the manuscript.

Funding

This research was funded by the US Department of Defense Environmental Security Technology Certification Program (ESTCP) under contract number W912HQ22C0032/ESTCP and Project Number EW20-5195.

Data Availability Statement

The datasets presented in this article are not readily available because of privacy concerns from the client of the end load being modeled.

Acknowledgments

Thank you to Vishal Kanwar for assistance in developing graphics for this work. Thank you to Ryan Sparks and Vera Von Esse for providing feedback during the drafting process.

Conflicts of Interest

The authors declare no conflicts of interest.

Abbreviations

The following abbreviations are used in this manuscript:
DERdistributed energy resource
kWkilowatt
MILPmixed-integer linear programming
PVphotovoltaic

References

  1. Lu, X.; Wang, J.; Guo, L. Using microgrids to enhance energy security and resilience. Electr. J. 2016, 29, 8–15. [Google Scholar] [CrossRef]
  2. Carvalho, D.B.; Bortoni, E.D.C. Proposed model with weighted parameters for microgrid management: Incorporating diverse load profiles, assorted tariff policies, and energy storage devices. Energy 2024, 296, 130976. [Google Scholar] [CrossRef]
  3. Rengasamy, M.; Gangatharan, S.; Elavarasan, R.M.; Mihet-Popa, L. The motivation for incorporation of microgrid technology in rooftop solar photovoltaic deployment to enhance energy economics. Sustainability 2020, 12, 10365. [Google Scholar] [CrossRef]
  4. Mandal, S.; Mandal, K.K. Optimal energy management of microgrids under environmental constraints using chaos enhanced differential evolution. Renew. Energy Focus 2020, 34, 129–141. [Google Scholar] [CrossRef]
  5. Markov, K.; Rajaković, N. Multi-energy microgrids with ecotourism purposes: The impact of the power market and the connection line. Energy Convers. Manag. 2019, 196, 1105–1112. [Google Scholar] [CrossRef]
  6. Jackson, R.; Zulkifli, S.A.; Benbouzid, M.; Salimin, S.; Khan, M.H.; Elhassan, G.; Pathan, E. A comprehensive motivation of multilayer control levels for microgrids: Synchronization, voltage and frequency restoration perspective. Appl. Sci. 2020, 10, 8355. [Google Scholar] [CrossRef]
  7. Hosseinnia, H.; Nazarpour, D.; Talavat, V. Utilising reliability-constrained optimisation approach to model microgrid operator and private investor participation in a planning horizon. IET Gener. Transm. Distrib. 2018, 12, 5798–5810. [Google Scholar] [CrossRef]
  8. Gheouany, S.; Ouadi, H.; Giri, F.; El Bakali, S. Experimental validation of multi-stage optimal energy management for a smart microgrid system under forecasting uncertainties. Energy Convers. Manag. 2023, 291, 117309. [Google Scholar] [CrossRef]
  9. Liu, Z.; Chen, Y.; Zhuo, R.; Jia, H. Energy storage capacity optimization for autonomy microgrid considering CHP and EV scheduling. Appl. Energy 2018, 210, 1113–1125. [Google Scholar] [CrossRef]
  10. Keskin, I.; Soykan, G. Reduction of peak power consumption by using photovoltaic panels in Turkey. In Proceedings of the 2017 IEEE 6th International Conference on Renewable Energy Research and Applications (ICRERA), San Diego, CA, USA, 5–8 November 2017. [Google Scholar] [CrossRef]
  11. Ma, Y.-W.; Ding, S.-Q.; Jing, Q.-M.; Tang, X.-L. Economic dispatch of household PV-BS-EV microgrid under TOU tariffs. J. Phys. Conf. Ser. 2021, 1754, 012015. [Google Scholar] [CrossRef]
  12. Ross, M.; Abbey, C.; Bouffard, F.; Joos, G. Microgrid Economic Dispatch with Energy Storage Systems. IEEE Trans. Smart Grid 2018, 9, 3039–3047. [Google Scholar] [CrossRef]
  13. Tripathy, S.K. Stacked-Value of Battery Storage: Effect of Battery Storage Penetration on Power Dispatch. Master’s Thesis, Arizona State University, Tempe, AZ, USA, 2020. [Google Scholar]
  14. Karimi, H.; Gharehpetian, G.B.; Ahmadiahangar, R.; Rosin, A. Optimal energy management of grid-connected multi-microgrid systems considering demand-side flexibility: A two-stage multi-objective approach. Electr. Power Syst. Res. 2023, 214, 108902. [Google Scholar] [CrossRef]
  15. Zheng, S.; Jin, X.; Huang, G.; Lai, A.C. Coordination of commercial prosumers with distributed demand-side flexibility in energy sharing and management system. Energy 2022, 248, 123634. [Google Scholar] [CrossRef]
  16. Jung, S.; Yoon, Y.; Im, P.; Salonvaara, M.; Dong, J.; Cui, B.; Lapsa, M. Peak cooling load shift capability of a thermal energy storage system integrated with an active insulation system in US climate zones. Energy Build. 2022, 277, 112484. [Google Scholar] [CrossRef]
  17. Whitcraft, D.S.; Sullivan, K.; Okamura, P.; Slife, C. Implementing Load Shifting Using Thermal Energy Ice Storage; Arizona State University: Tempe, AZ, USA, 2016. [Google Scholar]
  18. Tang, C.; Li, N.; Bao, L. Predictive Control Modeling of Regional Cooling Systems Incorporating Ice Storage Technology. Buildings 2024, 14, 2488. [Google Scholar] [CrossRef]
  19. Zhang, K.; Yu, J.; Ren, Y. Demand side management of energy consumption in a photovoltaic integrated greenhouse. Int. J. Electr. Power Energy Syst. 2022, 134, 107433. [Google Scholar] [CrossRef]
  20. Alzola, J.A.; Vechiu, I.; Camblong, H.; Santos, M.; Sall, M.; Sow, G. Microgrids project, Part 2: Design of an electrification kit with high content of renewable energy sources in Senegal. Renew. Energy 2009, 34, 2151–2159. [Google Scholar] [CrossRef]
  21. Ribeiro, F.; Ferreira, P.; Araújo, M. Evaluating future scenarios for the power generation sector using a Multi-Criteria Decision Analysis (MCDA) tool: The Portuguese case. Energy 2013, 52, 126–136. [Google Scholar] [CrossRef]
  22. Puradbhat, S.; Doolla, S.; Bhavaraju, V. A Framework for Considering Capital Cost Limit in Sizing Microgrid Distributed Energy Resources—Application to Industrial Microgrids. IEEE Trans. Ind. Appl. 2021, 57, 6688–6699. [Google Scholar] [CrossRef]
  23. Quynh, N.V.; Ali, Z.M.; Alhaider, M.M.; Rezvani, A.; Suzuki, K. Optimal energy management strategy for a renewable-based microgrid considering sizing of battery energy storage with control policies. Int. J. Energy Res. 2021, 45, 5766–5780. [Google Scholar] [CrossRef]
  24. Li, B.; Roche, R.; Miraoui, A. Microgrid sizing with combined evolutionary algorithm and MILP unit commitment. Appl. Energy 2017, 188, 547–562. [Google Scholar] [CrossRef]
  25. Ghaffari, M.; Afsharchi, M. Learning to shift load under uncertain production in the smart grid. Int. Trans. Electr. Energy Syst. 2021, 31, e12748. [Google Scholar] [CrossRef]
  26. Yu, N.; Kang, J.S.; Chang, C.C.; Lee, T.Y.; Lee, D.Y. Robust economic optimization and environmental policy analysis for microgrid planning: An application to Taichung Industrial Park, Taiwan. Energy 2016, 113, 671–682. [Google Scholar] [CrossRef]
  27. Jin, M.; Feng, W.; Liu, P.; Marnay, C.; Spanos, C. MOD-DR: Microgrid optimal dispatch with demand response. Appl. Energy 2017, 187, 758–776. [Google Scholar] [CrossRef]
  28. Wynn, S.L.L.; Boonraksa, T.; Boonraksa, P.; Pinthurat, W.; Marungsri, B. Decentralized Energy Management System in Microgrid Considering Uncertainty and Demand Response. Electronics 2023, 12, 237. [Google Scholar] [CrossRef]
  29. Dey, B.; Basak, S.; Pal, A. Demand-side management based optimal scheduling of distributed generators for clean and economic operation of a microgrid system. Int. J. Energy Res. 2022, 46, 8817–8837. [Google Scholar] [CrossRef]
  30. Bagheri, F.; Dagdougui, H.; Gendreau, M. Stochastic optimization and scenario generation for peak load shaving in Smart District microgrid: Sizing and operation. Energy Build. 2022, 275, 112426. [Google Scholar] [CrossRef]
  31. Morsali, R.; Kowalczyk, R. Demand response based day-ahead scheduling and battery sizing in microgrid management in rural areas. IET Renew. Power Gener. 2018, 12, 1651–1658. [Google Scholar] [CrossRef]
  32. Mahmoud, T.S.; Ahmed, B.S.; Hassan, M.Y. The role of intelligent generation control algorithms in optimizing battery energy storage systems size in microgrids: A case study from Western Australia. Energy Convers. Manag. 2019, 196, 1335–1352. [Google Scholar] [CrossRef]
  33. Urbanucci, L. Limits and potentials of Mixed Integer Linear Programming methods for optimization of polygeneration energy systems. In Energy Procedia; Elsevier Ltd.: Amsterdam, The Netherlands, 2018; pp. 1199–1205. [Google Scholar] [CrossRef]
  34. Strbac, G. Demand side management: Benefits and challenges. Energy Policy 2008, 36, 4419–4426. [Google Scholar] [CrossRef]
  35. Alasseri, R.; Tripathi, A.; Rao, T.J.; Sreekanth, K.J. A review on implementation strategies for demand side management (DSM) in Kuwait through incentive-based demand response programs. Renew. Sustain. Energy Rev. 2017, 77, 617–635. [Google Scholar] [CrossRef]
  36. Huang, W.; Zhang, N.; Kang, C.; Li, M.; Huo, M. From demand response to integrated demand response: Review and prospect of research and application. Prot. Control. Mod. Power Syst. 2019, 4, 1–13. [Google Scholar] [CrossRef]
  37. Sithole, S.M.; Gous, A.G.S.; Schutte, C.S.L. A dynamic simulation model for optimal deep-level mine cooling management and operational decision-making for Eskom’s load curtailment. S. Afr. J. Ind. Eng. 2023, 34, 68–83. [Google Scholar] [CrossRef]
  38. Katz, J.; Andersen, F.M.; Morthorst, P.E. Load-shift incentives for household demand response: Evaluation of hourly dynamic pricing and rebate schemes in a wind-based electricity system. Energy 2016, 115, 1602–1616. [Google Scholar] [CrossRef]
  39. Jasim, A.M.; Jasim, B.H.; Mohseni, S.; Brent, A.C. Energy Internet-Based Load Shifting in Smart Microgrids: An Experimental Study. Energies 2023, 16, 4957. [Google Scholar] [CrossRef]
  40. Philipo, G.H.; Kakande, J.N.; Krauter, S. Neural Network-Based Demand-Side Management in a Stand-Alone Solar PV-Battery Microgrid Using Load-Shifting and Peak-Clipping. Energies 2022, 15, 5215. [Google Scholar] [CrossRef]
  41. Teamah, H.M.; Lightstone, M.F. Numerical study of the electrical load shift capability of a ground source heat pump system with phase change thermal storage. Energy Build. 2019, 199, 235–246. [Google Scholar] [CrossRef]
  42. Arababadi, R.; Parrish, K.; Reddy, A.; Jackson, R. Operational and Technological Peak Load Shifting Strategies for Residential Buildings; Arizona State University: Tempe, AZ, USA, 2016. [Google Scholar]
  43. Belaid, F.; Youssef, A.B.; Omrani, N. Investigating the factors shaping residential energy consumption patterns in France: Evidence form quantile regression. Eur. J. Comp. Econ. 2020, 17, 127–151. [Google Scholar] [CrossRef]
  44. Wang, R.; Li, P.; Han, Z.; Zhou, Z.; Cao, J.; Wang, X. Bi-Level Design Optimization for Demand-Side Interval Temperature Control in District Heating Systems. Buildings 2025, 15, 365. [Google Scholar] [CrossRef]
  45. Zhang, Y.; Ling, Z.; Liu, M.; Gang, W.; Su, L. An Energy Portrait-Based Identification Method of Building Users for Demand Response. Buildings 2024, 14, 2534. [Google Scholar] [CrossRef]
  46. Nogueira, T.; Sousa, E.; Alves, G.R. Electric vehicles growth until 2030: Impact on the distribution network power. Energy Rep. 2022, 8, 145–152. [Google Scholar] [CrossRef]
  47. Gnann, T.; Klingler, A.L.; Kühnbach, M. The load shift potential of plug-in electric vehicles with different amounts of charging infrastructure. J. Power Sources 2018, 390, 20–29. [Google Scholar] [CrossRef]
  48. Babrowski, S.; Heinrichs, H.; Jochem, P.; Fichtner, W. Load shift potential of electric vehicles in Europe. J. Power Sources 2014, 255, 283–293. [Google Scholar] [CrossRef]
  49. Wang, W.; Wang, D.; Zhao, Y.; Yu, Y.; Wang, Y. Research on capacity optimization and real-time control of island microgrid considering time-shifting load. Energy Rep. 2022, 8, 990–997. [Google Scholar] [CrossRef]
  50. Hanzala, M.; Memon, Z.; Hussain, M.I.; Azeem, F.; Shahzad, N.; J.-Kim, T. Fuzzy-Logic-Based Cascaded Decentralized Control and Power Quantification of Residential Buildings for Effective Energy Load Management. Buildings 2024, 14, 2896. [Google Scholar] [CrossRef]
  51. Yang, Y.; DeFrain, J.; Faruqui, A. Conceptual discussion on a potential hidden cross-seasonal storage: Cross-seasonal load shift in industrial sectors. Electr. J. 2020, 33, 106846. [Google Scholar] [CrossRef]
  52. Lebedeva, K.; Borodinecs, A.; Krumins, A.; Tamane, A.; Dzelzitis, E. Potential of End-User Electricity Peak Load Shift in Latvia. Latv. J. Phys. Tech. Sci. 2021, 58, 32–44. [Google Scholar] [CrossRef]
  53. Rivers, N.; Shaffer, B. Stretching the duck: How rising temperatures will change the level and shape of future electricity consumption. Energy J. 2020, 41, 55–88. [Google Scholar] [CrossRef]
  54. Middelberg, A.; Zhang, J.; Xia, X. An optimal control model for load shifting—With application in the energy management of a colliery. Appl. Energy 2009, 86, 1266–1273. [Google Scholar] [CrossRef]
  55. Hu, M.; Xiao, F.; Jørgensen, J.B.; Li, R. Price-responsive model predictive control of floor heating systems for demand response using building thermal mass. Appl. Therm. Eng. 2019, 153, 316–329. [Google Scholar] [CrossRef]
  56. Talami, R.; Dawoodjee, I.; Ghahramani, A. Quantifying Energy Savings from Optimal Selection of HVAC Temperature Setpoints and Setbacks across Diverse Occupancy Rates and Patterns. Buildings 2023, 13, 2998. [Google Scholar] [CrossRef]
  57. Nelson, J.; Johnson, N.G.; Fahy, K.; Hansen, T.A. Statistical development of microgrid resilience during islanding operations. Appl. Energy 2020, 279, 115724. [Google Scholar] [CrossRef]
  58. Nelson, J.; Johnson, N.G.; Chinimilli, P.T.; Zhang, W. Residential cooling using separated and coupled precooling and thermal energy storage strategies. Appl. Energy 2019, 252, 113414. [Google Scholar] [CrossRef]
  59. Pothireddy, K.M.R.; Vuddanti, S.; Salkuti, S.R. Impact of demand response on optimal sizing of distributed generation and customer tariff. Energies 2022, 15, 190. [Google Scholar] [CrossRef]
  60. Grant, C.; Rizzo, C.; Hardin, K.; Amon, C. Households Transforming the Grid: Distributed Energy Resources Are Key to Affordable Clean Power. 2024. Available online: https://www.deloitte.com/us/en/insights/industry/power-and-utilities/der-grid-modernization.html (accessed on 15 May 2025).
  61. XENDEE. Objective Function. Available online: https://asu.xendee.com/Home/Documentation/objectivefunction (accessed on 26 April 2025).
  62. Clauß, J.; Brozovsky, J.; Georges, L. Demonstrating the load-shifting potential of a schedule-based control in a real-life educational building. Energy Build. 2024, 316, 114321. [Google Scholar] [CrossRef]
  63. Agarwal, Y.; Balaji, B.; Dutta, S.; Gupta, R.K.; Weng, T. Duty-Cycling Buildings Aggressively: The Next Frontier in HVAC Control. In Proceedings of the 10th ACM/IEEE International Conference on Information Processing in Sensor Networks, Chicago, IL, USA, 12–14 April 2011. [Google Scholar]
Figure 1. Case study load data for maximum and average daily load for one calendar year.
Buildings 15 02378 g001
Figure 2. Supervisory controller managing communication and power flow between microgrid and building assets.
Buildings 15 02378 g002
Figure 3. Total annual costs for each of the four scenarios.
Buildings 15 02378 g003
Figure 4. Change in annualized costs versus base case for each of the four scenarios.
Buildings 15 02378 g004
Figure 5. Energy and demand charges, with savings as compared to the base case scenario.
Buildings 15 02378 g005
Figure 6. Annual costs of scenarios relative to the base case and microgrid with no load shifting, respectively, with sensitivities shown for various maximum hours of load shifting and maximum load shift percent.
Buildings 15 02378 g006
Figure 7. Total energy use shifted by maximum allowed hours of load shifting and maximum load shifting percentage.
Buildings 15 02378 g007
Figure 8. Percent change in energy and demand charges with and without a microgrid across load shifting combinations.
Buildings 15 02378 g008
Figure 9. Total energy use shift and peak demand in each month of the year by varying the maximum load shifting percentage for a maximum duration of load shifting of three hours, with and without a microgrid. Months in the summer billing period are in green.
Buildings 15 02378 g009
Figure 10. Load from the utility at each hour of the day with the highest load in August (top) and January (bottom), with the on-peak period shown in orange and the mid-peak period shown in purple.
Buildings 15 02378 g010
Table 1. Technical parameters of microgrid assets.
AssetVariableValueUnit
Solar PVArray Rated Capacity331kW DC
Solar PVPanel Efficiency19%
Dual-port InverterInverter Output Capacity250kW AC
Dual-port InverterInverter Efficiency96%
Battery StorageRated Capacity275kWh
Battery StorageCharging Efficiency97%
Battery StorageDischarging Efficiency97%
Battery StorageMinimum State of Charge5%
Battery StorageMaximum State of Charge100%
Table 2. Utility rate structure summary.
Charge CategoryMonthsToU PeriodApplicable Days and TimesValueUnits
Energy PriceNovember–AprilOff-PeakWeekdays: 12 a.m.–5 a.m., 9 a.m.–5 p.m., 9 p.m.–12 a.m.
Weekends: All Day
0.0488$/kWh
Energy PriceNovember–AprilMid-PeakWeekdays: 5 p.m.–9 p.m.0.0945$/kWh
Energy PriceNovember–AprilOn-PeakWeekdays: 5 a.m.–9 a.m.0.1010$/kWh
Energy PriceMay–OctoberOff-PeakWeekdays: 12 a.m.–11 a.m.
Weekends: All Day
0.0529$/kWh
Energy PriceMay–OctoberMid-PeakWeekdays: 11 a.m.–2 p.m., 7 p.m.–12 a.m.0.0965$/kWh
Energy PriceMay–OctoberOn-PeakWeekdays: 2 p.m.–7 p.m.0.1357$/kWh
Demand ChargeNovember–AprilOff-PeakWeekdays: 12 a.m.–5 a.m., 9 a.m.–5 p.m., 9 p.m.–12 a.m.
Weekends: All Day
0$/kW
Demand ChargeNovember–AprilMid-PeakWeekdays: 5 p.m.–9 p.m.1.05$/kW
Demand ChargeNovember–AprilOn-PeakWeekdays: 5 a.m.–9 a.m.4.69$/kW
Demand ChargeMay–OctoberOff-PeakWeekdays: 12 a.m.–11 a.m.
Weekends: All Day
0$/kW
Demand ChargeMay–OctoberMid-PeakWeekdays: 11 a.m.–2 p.m., 7 p.m.–12 a.m.1.05$/kW
Demand ChargeMay–OctoberOn-PeakWeekdays: 2 p.m.–7 p.m.4.69$/kW
Service ChargeJanuary–December 22.72$/month
Disclaimer/Publisher’s Note: The statements, opinions and data contained in all publications are solely those of the individual author(s) and contributor(s) and not of MDPI and/or the editor(s). MDPI and/or the editor(s) disclaim responsibility for any injury to people or property resulting from any ideas, methods, instructions or products referred to in the content.

