Article

The Subjective and Objective Evaluation of the Efficacy of Public Spaces in University Complexes: A Case Study of the Center for Balance Architecture at Zhejiang University

1
The Architectural Design & Research Institute of Zhejiang University Co., Ltd., Hangzhou 310058, China
2
Center for Balance Architecture, Zhejiang University, Hangzhou 310058, China
3
College of Civil Engineering and Architecture, Zhejiang University, Hangzhou 310058, China
*
Author to whom correspondence should be addressed.
Buildings 2025, 15(13), 2377; https://doi.org/10.3390/buildings15132377
Submission received: 11 June 2025 / Revised: 30 June 2025 / Accepted: 3 July 2025 / Published: 7 July 2025
(This article belongs to the Section Architectural Design, Urban Science, and Real Estate)

Abstract

This study aims to address the understudied evaluation of public space performance in renovated multi-functional university buildings, with a special focus on university complexes based on integrated industry–research–education models. While existing literature emphasizes outdoor campus environments, few studies have systematically assessed the internal public spaces that support interdisciplinary collaboration. Using the Center for Balanced Architecture at Zhejiang University as a case study, we employed a mixed-methods approach that combined Depthmap software for spatial integration and visual integration analyses with user satisfaction surveys. Our results reveal significant post-renovation improvements in spatial accessibility, particularly in terms of First Floor Plan connectivity. However, they also uncover persistent issues: despite high objective integration scores, user satisfaction with wayfinding systems remains low, pointing to a cognitive efficiency gap. Furthermore, disparities in satisfaction with acoustics, privacy, and social spaces across different user groups highlight the importance of balancing openness with individual needs. These findings provide empirical evidence to help optimize future renovation designs and enhance spatial experience and performance.

1. Introduction

As urbanization continues to accelerate, an increasing number of Chinese universities are opting to construct new campuses on the urban periphery. This strategic move is primarily motivated by the necessity to accommodate the expanding student population and to fulfill the growing demands for modern educational facilities [1]. However, this trend has also brought about certain challenges. In particular, older campuses located in city centers often face problems such as outdated facilities, obsolete spatial functions, and insufficient interaction between the campus and the city [2,3,4]. With the construction of new campuses on the urban periphery, the functions and values of older campuses are often overlooked. This has led to an urgent need for renovation and revitalization in many historically significant universities. While new campuses can provide more space and modern facilities, older campuses in urban areas still possess unique geographical advantages and cultural significance. Typically located in the urban core, these campuses have higher accessibility and stronger integration with social and cultural contexts [5]. Therefore, the renovation of older campuses is not to be viewed as a physical renewal and replacement of buildings; it should be regarded as an essential component of the urban renewal system. In this process, architectural transformation needs to be integrated into a broader urban planning context. Specifically, it is crucial to focus on the intensive use of land resources and the sustainable development of the ecological environment, as well as the enhancement of spatial and efficiency of spaces [6,7]. By coordinating the adjustment of building functions, the reorganization of spatial layouts, and the improvement of urban public facilities, the renovation of campuses can activate the development potential of surrounding areas and contribute to the overall enhancement of urban spatial value [8,9]. This type of urban renewal practice, based on the redevelopment of existing spaces, is not only an important means to improve the environmental quality of campuses, but also a key strategy for optimizing urban functions and enhance spatial efficiency.
Global studies of older university campuses reveal that many have developed incremental yet meaningful interactions with urban areas during new construction or renovation phases, often catalyzing positive synergies between urban and academic development. Notable examples include the Tsai Center at Yale University, which emphasizes interdisciplinary collaboration [10]; MIT’s Infinite Corridor, which fosters academic exchange; and the Donnelly Centre at the University of Toronto, advancing life sciences research. Other exemplary projects, such as Stanford’s Highland Hall and RMIT’s New Academic Street, enhance campus vibrancy and urban integration [11], while Deakin University’s Institute for Physical Activity and Nutrition exemplifies spatial adaptability. In terms of industry–academia–research integration, Columbia Business School, Boston University’s Center for Computing & Data Sciences, and UCL’s Marshgate Building demonstrate the potential of multifunctional academic spaces. Comprehensive campus developments, like NYU Shanghai’s Qianhai Campus, Cornell Tech in New York City, and Copenhagen’s Maersk Laboratory, further highlight the capacity of campuses to drive urban innovation [12]. Despite the proliferation of built projects worldwide, there remains a paucity of comprehensive assessments validating the functional performance and long-term impact of these complex university complexes. Future research should prioritize evaluations that focus on their sustainability metrics and overall effectiveness in fostering urban–academic integration.
Current research on university campus architecture predominantly focuses on the thermal comfort and subjective satisfaction of indoor spaces. For instance, Wang Xue and Yang Liu assessed classroom satisfaction by measuring temperature, humidity, and CO2 levels [13]. Hoz-Torres et al. evaluated indoor air quality using ventilation data from university classrooms [14]. Gao Lizhen and Wang Shidong applied DeST 2.0 software to analyze campus building energy consumption [15]. On the other hand, Dong Zhao and Zhao Kang conducted surveys on dormitory spaces, identifying key factors influencing satisfaction through a regression analysis [16]. Azzazy et al. examined the determinants of indoor thermal comfort via questionnaires and direct observation [17]. In recent years, an increasing number of studies have shifted focus to users’ perceptions. However, research on university campus public spaces continues to concentrate primarily on outdoor environments, exploring aspects such as spatial perception, user behavior, and pedestrian-friendliness [18], while largely neglecting the potential of internal public spaces to foster interdisciplinary collaboration and academic exchange. Furthermore, investigations into the spatial performance of public spaces within university complexes integrated in “industry–academia–research” remain relatively scarce.
In the realm of public space research, space syntax has emerged as a widely used tool for spatial quantification [19,20], with applications spanning several key areas. In healthcare facilities, it is employed to study wayfinding systems, patient waiting times, and staff interactions and visibility [21,22]. In museums, it focuses on visitor pathways, the locations where visitors pause to view exhibits, and the layout of exhibition spaces [23]. In commercial buildings, it examines indoor traffic organization, spatial form, and the arrangement of business formats [24,25]. In campus architecture research, Marinelli et al. employed space syntax to simulate and evaluate the accessibility of outdoor spaces and the effectiveness of wayfinding systems [26]. El-Darwish et al. applied space syntax to assess classroom spatial perception and navigability [27], while Kim et al. used it to analyze the efficiency of spatial utilization in classrooms from a visual performance perspective [28]. Taken together, these studies have primarily focused on aspects such as outdoor accessibility, classroom layout, and visual permeability. However, research remains limited on the functional performance of interior public spaces within university complexes that integrate education, research, and industry. This gap highlights the need for more comprehensive investigations into the spatial efficacy of such multifunctional academic environments.
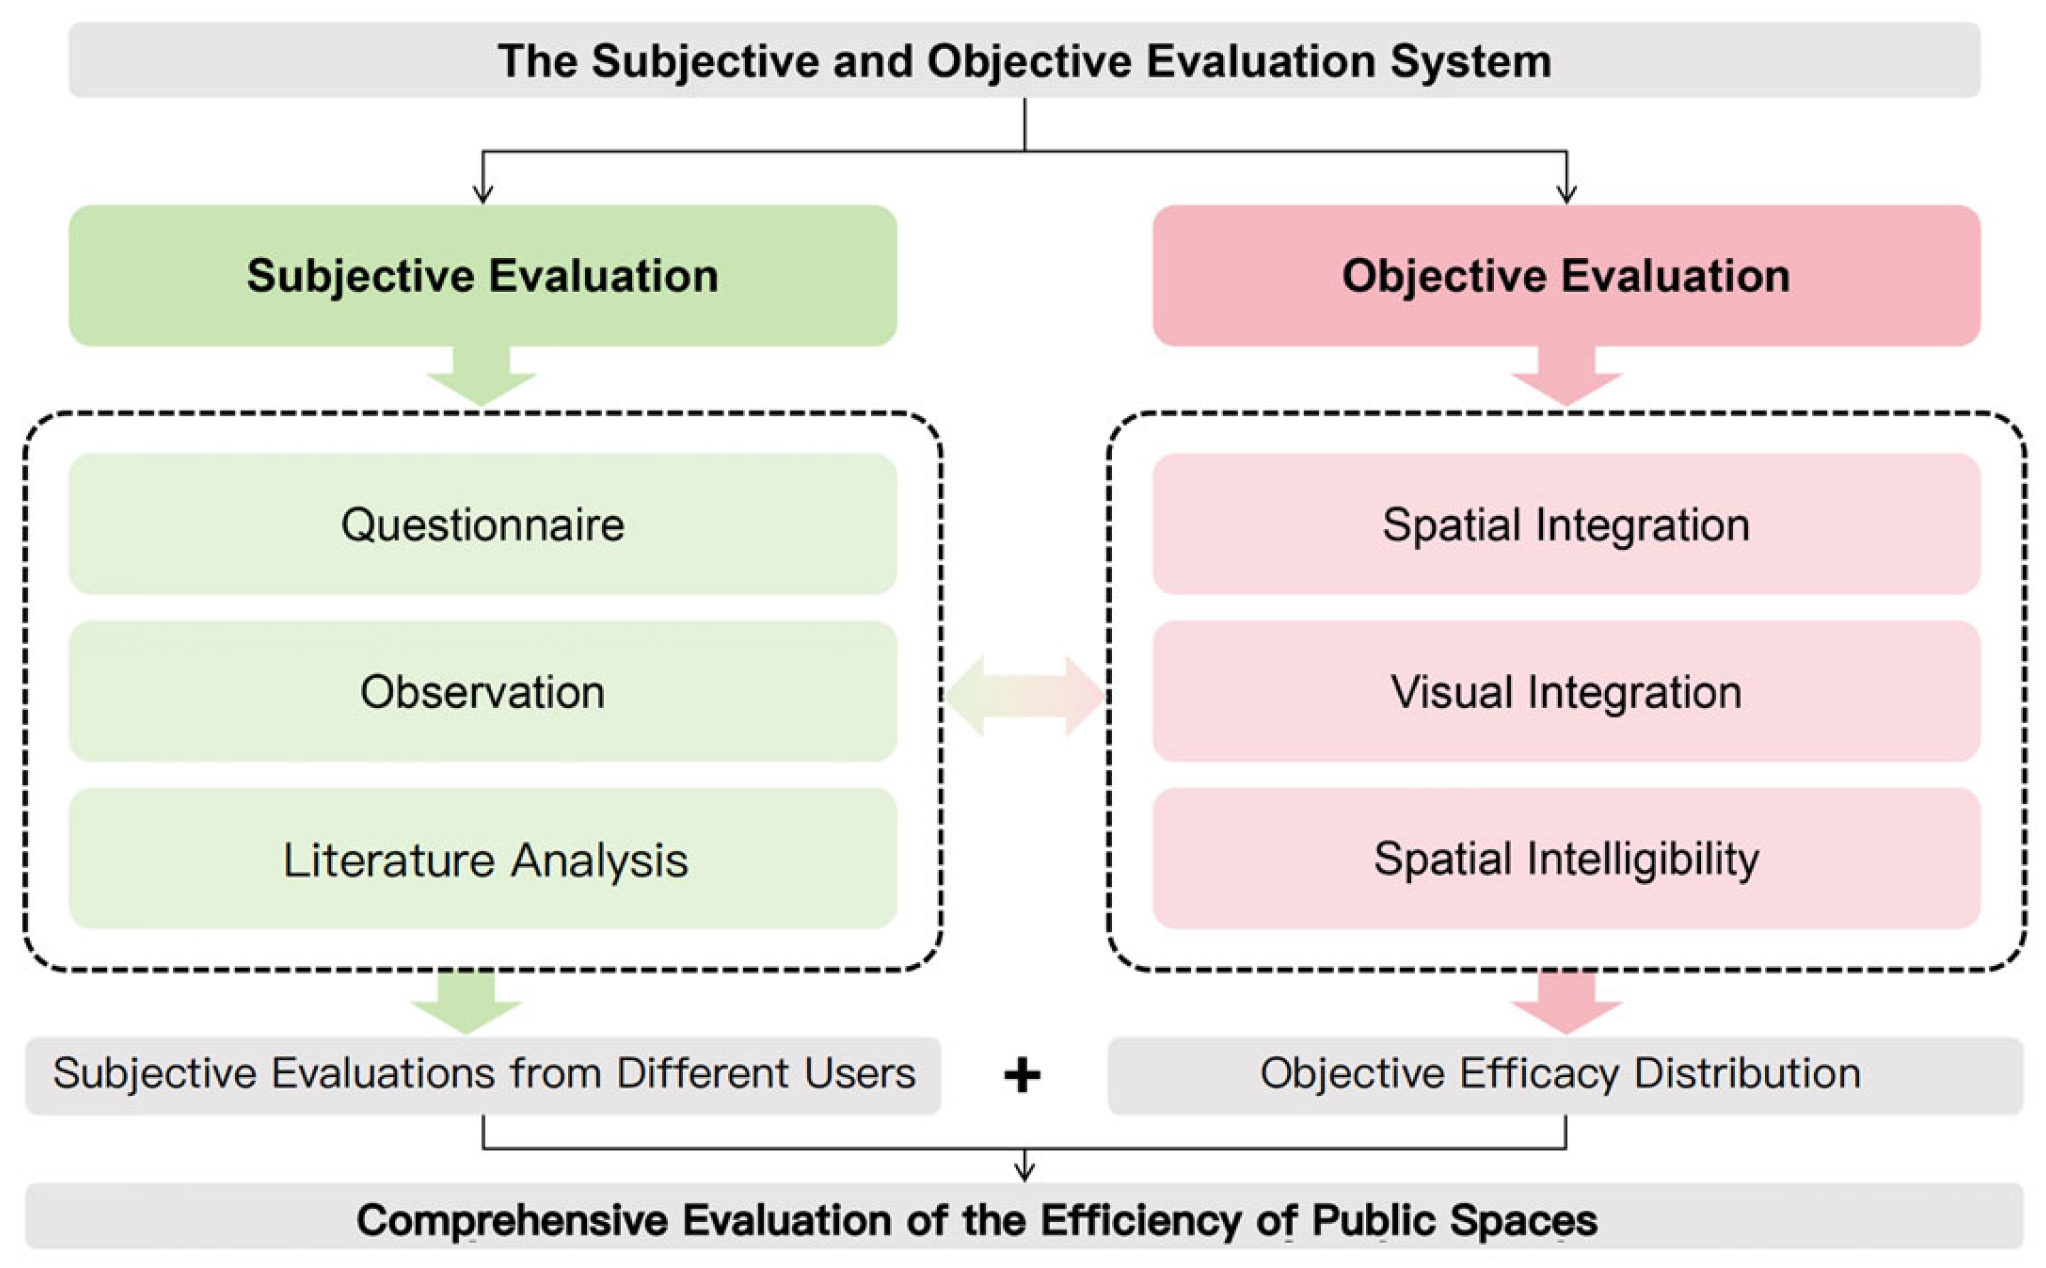
The present study aims to develop a comprehensive evaluation system for assessing the efficiency of public spaces within university building complexes. In addressing the limitations of existing studies that predominantly focus on single-perspective evaluations, this paper attempts to establish a space evaluation method integrating both subjective and objective approaches. The study employs the Center for Balance Architecture at Zhejiang University (BAC) as a case study for in-depth analysis. A mixed-method approach combining spatial syntax and subjective questionnaires is adopted in this research. Through the use of DepthmapX simulation (https://www.spacesyntax.online/software-and-manuals/, accessed on 10 June 2025), the study analyzes pre- and post-renovation metrics, such as spatial integration, visual integration, and spatial intelligibility. Coupled with user satisfaction evaluations, the assessment evaluates the efficiency of public spaces. This not only validates the design’s rationality but also provides practical guidelines for future campus architectural design and renovation efforts.

2. Methods

2.1. The Studied Building

The studied building is the Center for Balanced Architecture at Zhejiang University (BAC), located in the southeast cluster of Zhejiang University’s Xixi Campus in Hangzhou, Zhejiang Province. As a research institution affiliated with Zhejiang University, the BAC serves as a key platform for university–enterprise collaboration. Originally constructed in the 1990s through a donation by Mr. Run Run Shaw, the building, known as the Shaw Science and Education Building, primarily functioned as an instruction office and electronic teaching center, offering relatively limited functionality. In response to evolving academic needs and the passage of time, the building underwent significant renovation in 2022 and was subsequently renamed the Balance Center (see photos in Table 1).
The renovated building covers an area of 9085 square meters, consisting of a four-story main structure along with a mezzanine level (see plans in Table 2). The renovation has transformed the previously enclosed interior layout into an open, interconnected spatial system that engages more directly with the surrounding campus environment, breaking away from its previously closed-off layout. The building now accommodates a diverse range of functions, including graduate teaching classrooms, research offices, master studios, and architectural design production spaces. The redeveloped Balance Center is committed to fostering interdisciplinary collaboration and advancing the integration of industry, research, and education within a unified university complex interdisciplinary interaction and the integration of industry, research, and education.

2.2. Research Methods

The space syntax theory is a method for describing and analyzing spatial relationships. Its fundamental principle involves the segmentation of space into different scales and the division of space into discrete units, using mathematical topological relationships to quantify the connections between spaces [29]. This approach allows for the exploration of the relationship between human activity patterns and spatial configurations, and provides metrics for spatial utilization, legibility, and communicability, collectively referred to as spatial efficacy [30]. Initially proposed in the 1970s by Bill Hillier and Julienne Hanson at the University of London’s Bartlett School of Architecture [31], space syntax has since developed into a comprehensive theoretical framework and methodological system, supported by specialized software for spatial analysis. Depthmap is one of the principal software tools for analyzing space syntax. Developed by University College London [32], Depthmap applies convex space analysis and visual field modeling to provide a multi-scale analysis, quantifying spatial relationships and ultimately enabling visualization. In this study, Depthmap was used to derive three key metrics: spatial integration (reflecting spatial utilization), visual integration (reflecting spatial legibility), and spatial intelligibility (reflecting spatial communicability). These metrics were employed to evaluate the efficacy of the simulated spaces.

2.2.1. Spatial Integration

Spatial integration serves as a key indicator of space utilization. As a fundamental parameter in convex space analysis, spatial integration reflects the extent to which a space is interconnected with other spaces within the same system [33]. By analyzing elements such as the connectivity paths and nodes between spaces, it determines the degree of connectivity between a given space and all other spaces within the system. The higher the integration of a space, the greater the accessibility, the stronger the potential to attract human traffic, the more central its position is within the spatial system, and the higher the likelihood is of its utilization [34]. In The Social Logic of Space, Hillier presents the derivation of the formula for integration as follows [35]:
R A i = 2 ( M D i 1 ) n 2
Relative Asymmetry (RAi) is a key metric for evaluating the accessibility of network topological structures. n denotes the total number of nodes in the topological relationship graph, i denotes node i, and Mean Depth (MDi) is the mean depth value of node i.
M D i = i n D i j n 1
MDi is defined as the average of the shortest path lengths from node to all other nodes in the network. It represents the ease of accessibility from node i to all other nodes. Dij denotes the number of transitions required to move from space to space, rather than the actual physical distance. A higher MDi value indicates lower accessibility.
I n t e r g r a t i o n = 1 R R A i
R R A i = R A i R A   o f   D i a m o n d
R A   o f   D i a m o n d = n l o g 2 n 3 1 + 1 ( n 1 ) ( n 2 ) 2
The Relativized RAi uses a standard topological structure known as the RA of Diamond to eliminate the influence of network topology. In the RA of Diamond, all elements have identical depth values, mean depth values, and asymmetry values, with uniform characteristics [36].

2.2.2. Visual Integration

Visual integration is a key indicator in visibility graph analysis (VGA). It is derived through multiple simulations and analyses from various vantage points, resulting in a comprehensive measure of visual integration for each space [37]. Spaces with higher visual integration are more likely to attract attention and recognition, thereby playing a role in drawing human traffic [38].

2.2.3. Spatial Intelligibility

Spatial intelligibility can also be understood as cognitive efficiency. This indicator is the coefficient of determination of the linear regression equation between global integration and local integration [39]. By analyzing the connectivity and hierarchical relationships of spaces and incorporating behavioral data, such as walking and observing within the space, the indicator is derived. The higher the intelligibility, the greater the ability to infer the overall structural relationships based on local spatial conditions [40]. Consequently, users are more likely to navigate and communicate effectively within the space. The formula for Intelligibility is as follows:
R 2 = 1 i = 1 n ( y i y i ^ ) 2 i = 1 n ( y i y ¯ ) 2
In this formula, y i represents the observed value (actual value), y i ^ is the predicted value, and y ¯ is the mean value. The value of coefficient of determination (R2) ranges between 0 and 1, with values closer to 1 indicating a higher degree of spatial intelligibility [41].
Currently, space syntax primarily models objective spatial metrics—such as spatial integration, visual integration, and intelligibility—but lacks the capacity to capture differentiated experiences across diverse user groups [42,43]. Conversely, sole reliance on questionnaire data can introduce subjective bias, compromising the objectivity of evaluations [44,45,46]. To address these limitations, this study adopts an integrated methodological framework that combines online satisfaction surveys with a space syntax analysis, enabling a comprehensive subjective–objective assessment of public space performance [39].
As illustrated in Figure 1, the approach unfolds in three stages. First, an initial assessment of overall user satisfaction was conducted using the Analytic Hierarchy Process (AHP) and a five-point Likert scale [47,48], informed by questionnaires, field observations, and a literature review. Second, Depthmap software was employed to simulate spatial performance before and after renovation, yielding quantifiable data on spatial efficiency. Finally, by triangulating subjective perceptions with objective spatial indicators, the study evaluates whether the renovated campus public spaces fulfill their intended functions in terms of utilization, legibility, and communicability.

2.3. Participants

A total of approximately 200 individuals regularly use the renovated building, with the questionnaire survey targeting 20% to 50% of this population [49]. Sixty questionnaires were distributed and, after eliminating invalid responses, 51 valid samples were collected. As Figure 2 shows, the user composition of the public space primarily consisted of faculty members, students (both undergraduate and postgraduate), and designers from the Design Institute, with the student population accounting for 60% of the total. The gender ratio was balanced (1:1), and the age distribution was concentrated between 19 and 40 years (80%). Spatially, users’ working and learning locations were mainly distributed on the third floor (50%), while the remaining floors (2nd, 4th, and 5th) showed a relatively even distribution. Notably, the first floor exhibited relatively low actual usage, despite its strong public attributes. Regarding transportation mode selection, approximately 67% of respondents preferred using elevators. The duration of space usage demonstrated a uniform distribution pattern: user groups spending less than 4 h, 4–8 h, and over 8 h each accounted for approximately one-third of the total. In terms of office space typology, categorized as small (≤4 persons), medium (4–12 persons), and large (>12 persons) offices, users of large offices constituted 50% of the total.
Figure 3 and Figure 4 demonstrate that users of public spaces exhibited a stronger preference for discussion/exchange areas and resting zones, followed by learning/research spaces, dining/socializing areas, and meeting rooms. In contrast, exhibition spaces attracted the least engagement, accounting for only 5% of usage. Regarding frequency, users showed limited utilization of the centrally central public spaces, with most individuals accessing each public space no more than once or twice per month. Notably, the third-floor fitness facilities registered the lowest usage frequency, with over 60% of respondents reporting never having used this public space.

3. Analysis & Results

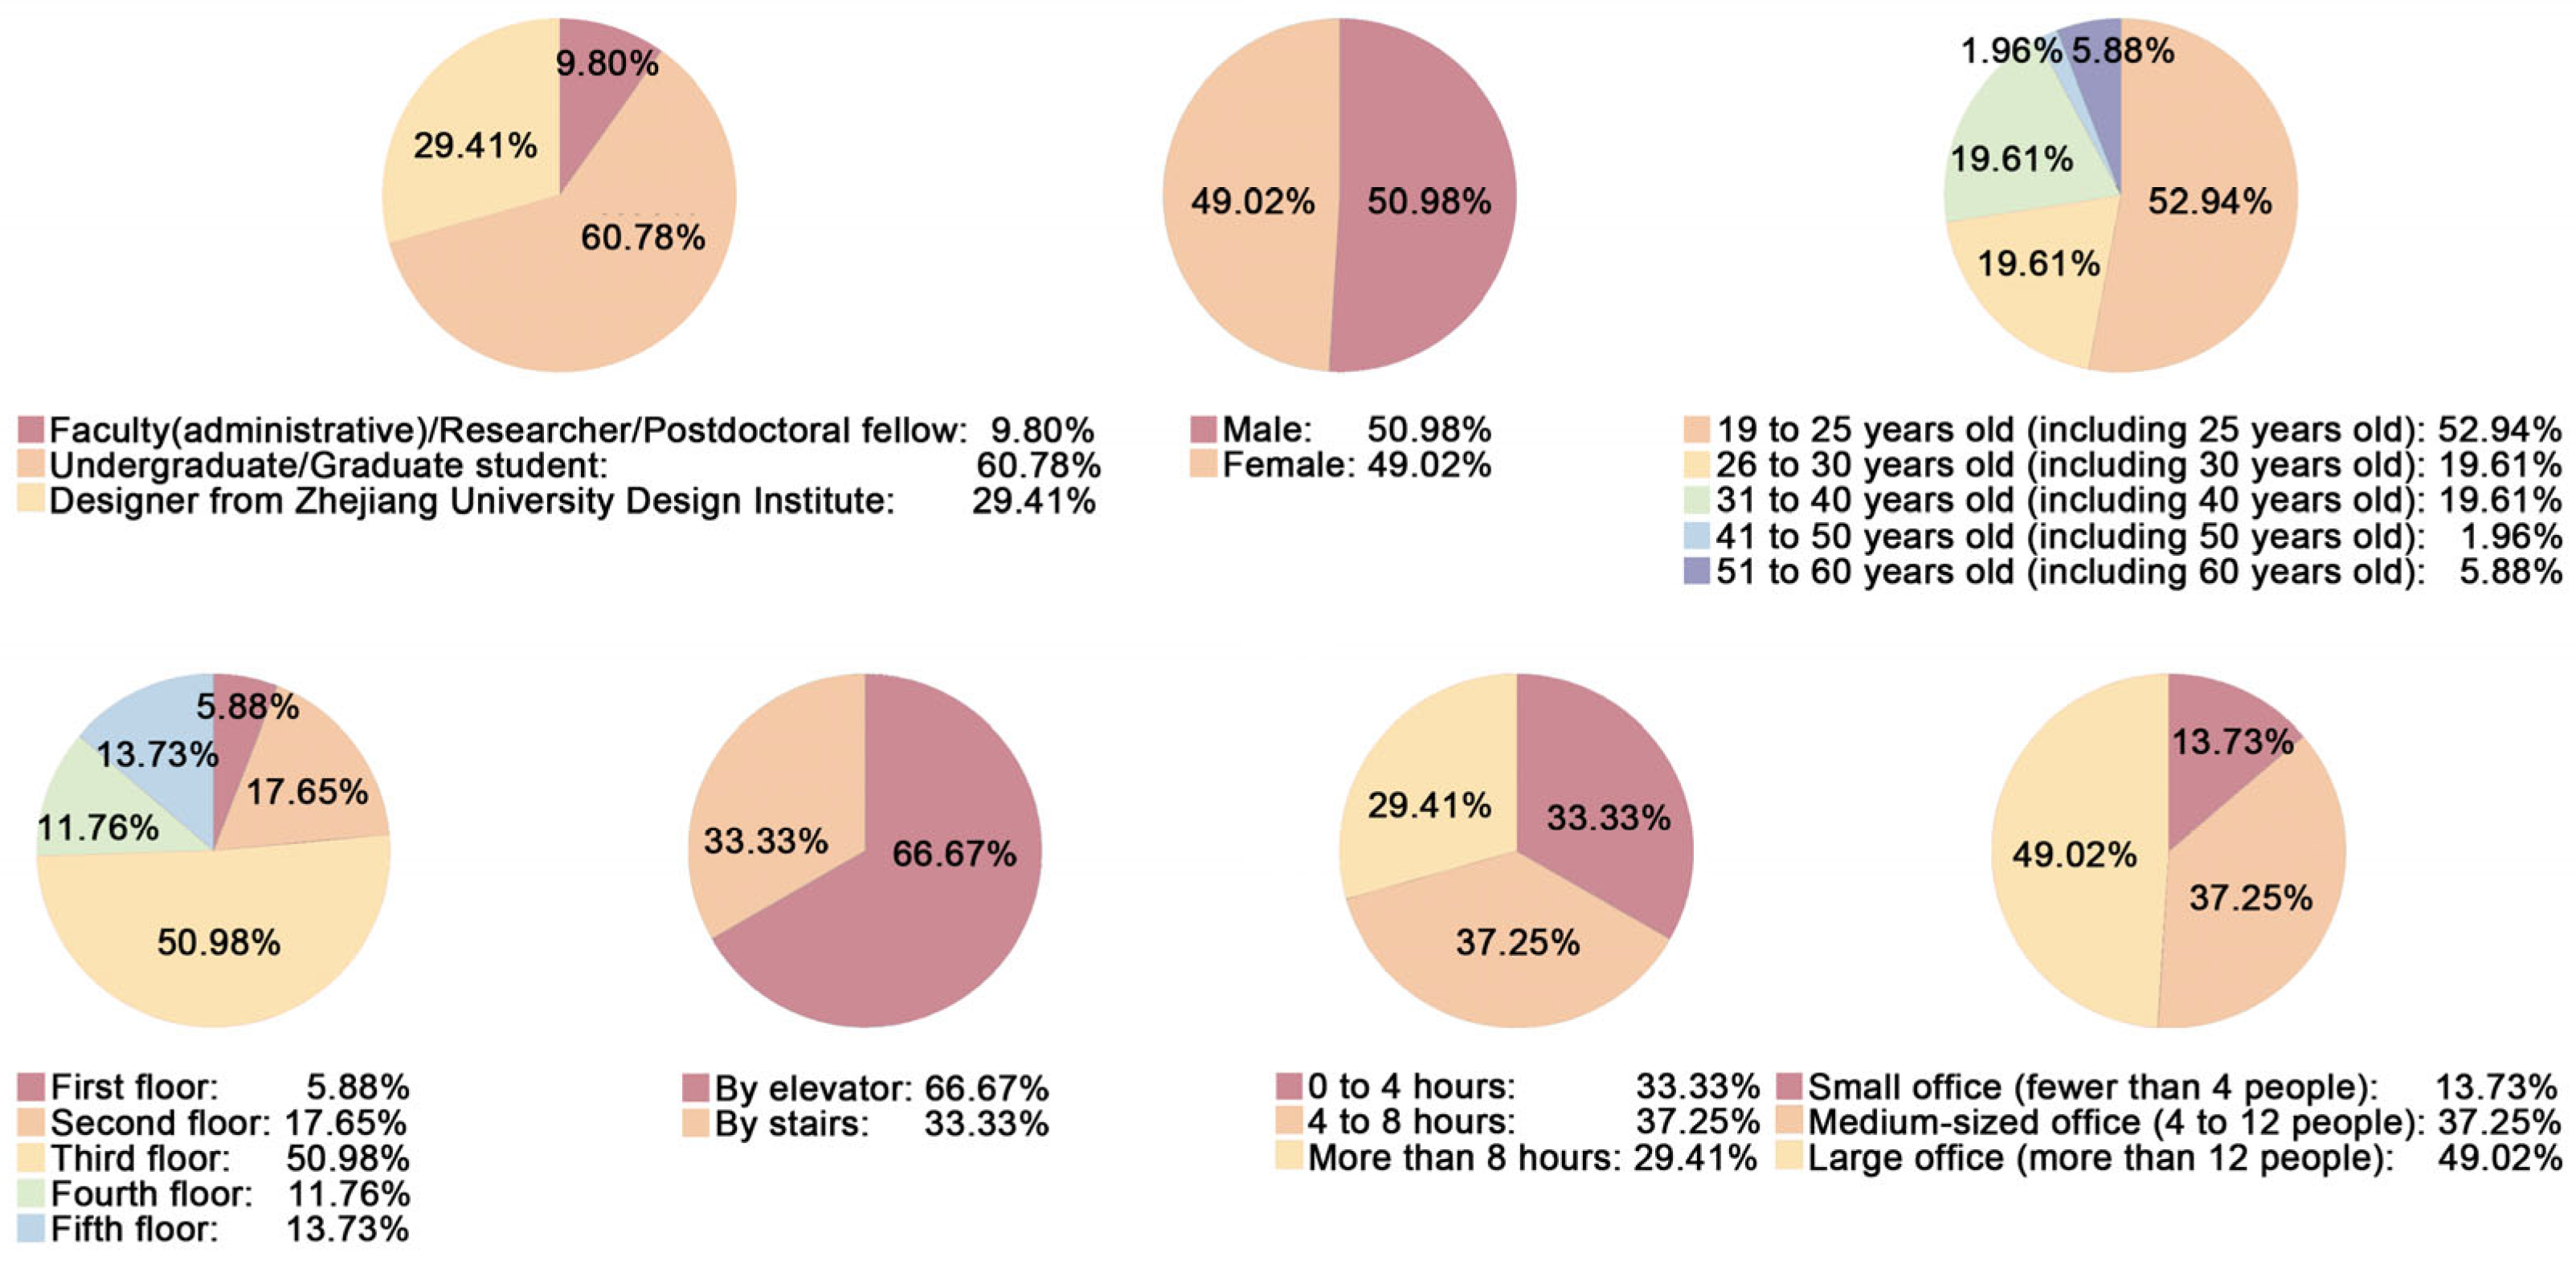
The questionnaire was administered online and integrated space syntax principles with practical usage assessments, comprising a total of 26 items (Appendix A). Among these, nine questions collected demographic background statistics, fifteen employed Likert-scale items measuring user satisfaction across various aspects of public space utilization, and two were non-scale, open-ended questions. The scaled questions were organized around six evaluation indicators, with multiple satisfaction-related assessment items designed to quantify each indicator’s performance. As presented in Table 3, responses were graded using a five-point Likert scale, ranging from “poor” (1 point) to “excellent” (5 points), with intermediate ratings of “fair” (2), “average” (3), and “good” (4). This methodological framework was applied within an architectural research context to systematically evaluate the effectiveness of spatial configuration through user perception metrics.
The overall satisfaction score of the surveyed population regarding the balanced center’s public space was 4.41, indicating that users’ satisfaction with the renovated space fell between “good” and “excellent”. Notably, specific metrics, including the rationality of the wayfinding system placement (3.9), the convenience of wayfinding systems (3.98), spatial interactivity (3.96), privacy (3.47), as well as dining and social areas (3.9), scored between “neutral” and “good”, suggesting that these spatial attributes require further optimization.
Key spatial nodes demonstrated significantly higher satisfaction levels: entrance spaciousness (4.63), resting area comfort (4.63), atrium transparency (4.61), and corridor width (4.61) all exceeded the overall satisfaction level. Other public space indicators ranged between 4.0 and 4.5 (“good” to “excellent”).
In the evaluation of spatial details, only two factors—pedestrian accessibility within the same floor and the comfort level of the indoor physical environment (temperature and humidity)—scored above the average satisfaction level, while all other metrics fell below the overall satisfaction rating of the balance center. This indicates that, although users were generally satisfied with the overall utilization of public spaces in the balance center, their satisfaction with certain spatial details remained relatively low.

4. Discussion

This study employed SPSS 27.0 statistical software to analyze the correlation matrix between personal background characteristics (including user identity, gender, age group, mode of arrival, and the size of the usage venue) and satisfaction across multiple spatial dimensions, thereby obtaining significance values. As shown in Table 4, the analysis revealed the following significant differences:
  • Users with different identities exhibited significant variations in satisfaction regarding wayfinding system responsiveness, the adequacy of public spaces, cultural attributes of decorative styles, acoustic comfort, and satisfaction with learning/research versus dining/social spaces;
  • Age groups differed significantly in satisfaction with dining/social spaces;
  • Modes of arrival significantly influenced user evaluations of spatial permeability (inter-floor/atrium), rest area comfort, vertical elevator accessibility, and overall ratings;
  • Venue scale variations systematically affected wayfinding in interior spaces, cultural attributes of public spaces, entrance/corridor spaciousness, atrium permeability, furniture comfort, and satisfaction with exhibition/activity spaces.
Based on these findings, the subsequent analysis focuses on six dimensions: spatial accessibility, comprehensibility, cultural communication, nodal spaces, comfort, and type-specific space satisfaction.

4.1. Spatial Accessibility

Analysis of the accessibility metrics (E1) presented in Table 3 reveals that users’ overall satisfaction with public space accessibility falls between “good” and “very good”. Specifically, satisfaction levels for walkability within the same floor, walkability between floors, visual permeability on the same floor, visual permeability between floors, and the sense of direction within internal space were 4.43, 4.22, 4.35, 4.27, and 4.08, respectively. Except for walkability within the same floor, all other factors were below the overall average satisfaction score of 4.41 (Table 3).
Notably, significant differences were observed in two key areas: the effect of different arrival methods on visual permeability between floors (p = 0.031, Table 4) and the influence of varying usage space scales on the sense of direction within the internal space (p = 0.042, 
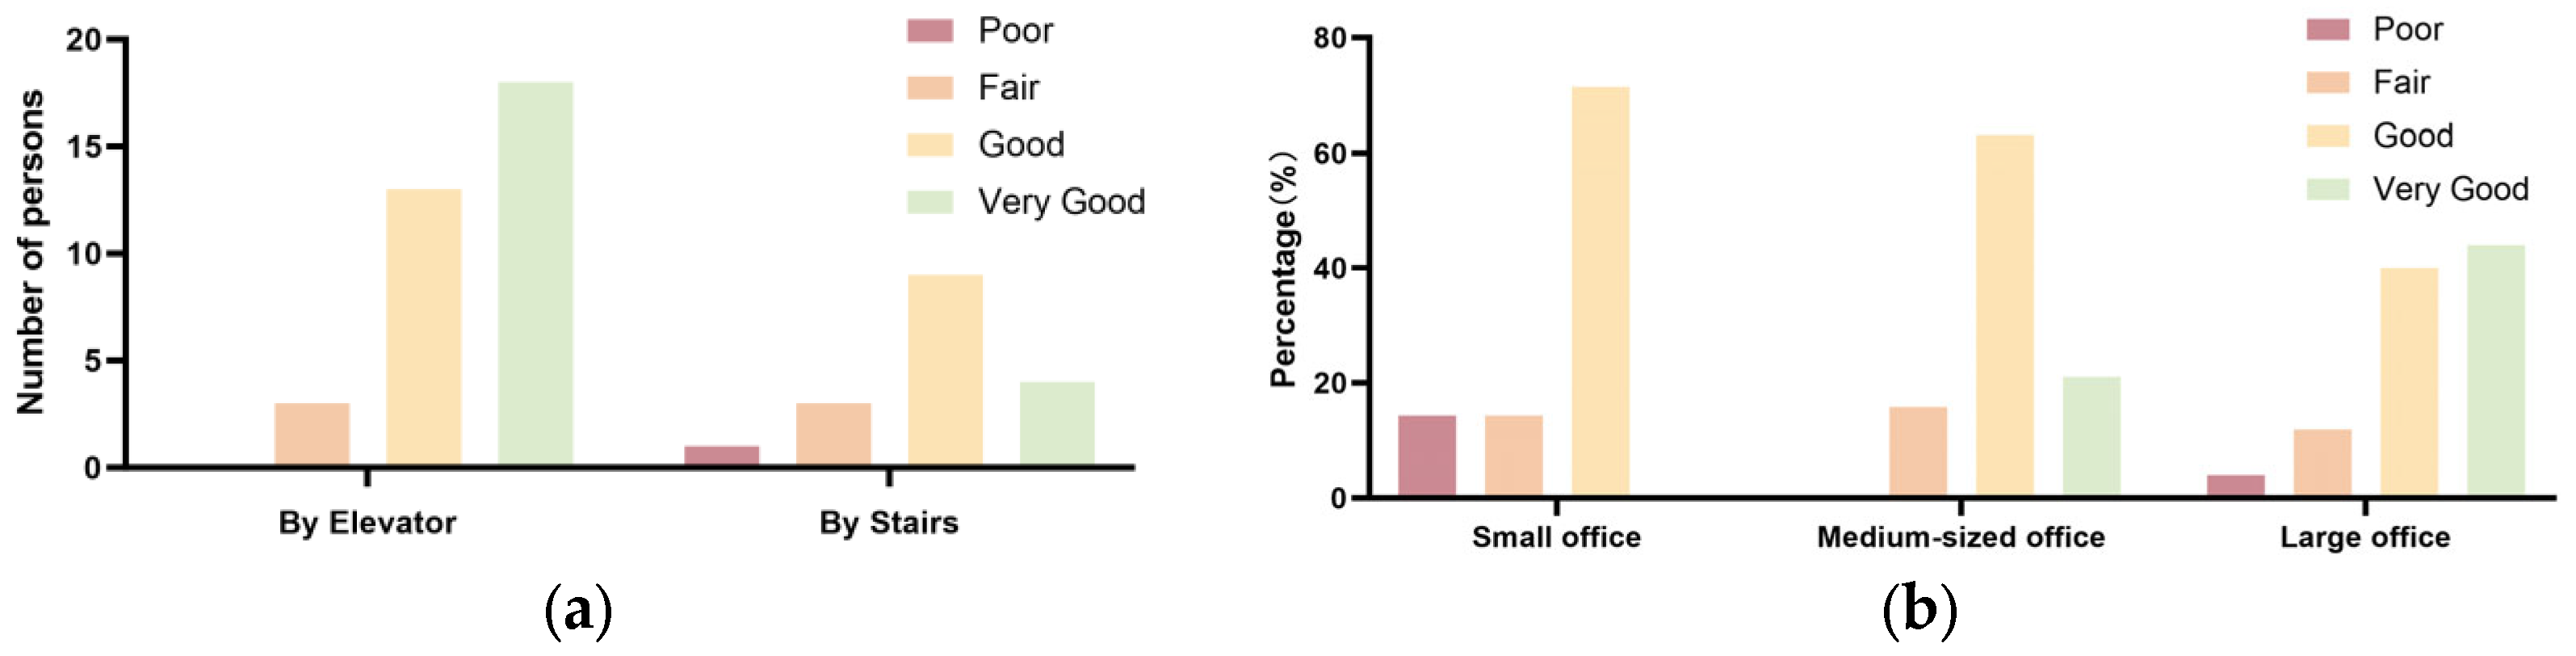
Table 4). As illustrated in Figure 4, users who accessed office or study areas via stairs reported lower satisfaction with inter-floor visual permeability compared to those using elevators (Figure 5a). Furthermore, the majority of users in large offices (>12 people) expressed satisfaction with the sense of direction within public spaces, rating it between “good” and “very good” (Figure 5b). In contrast, users in medium and small offices reported lower satisfaction with their internal sense of direction in public spaces, with some users in small offices specifically indicating “poor” and “average” ratings.
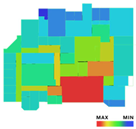
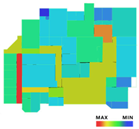
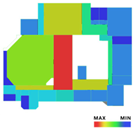
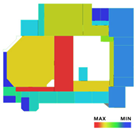
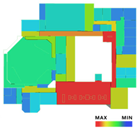
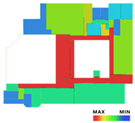
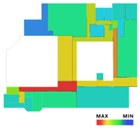
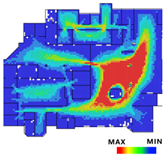
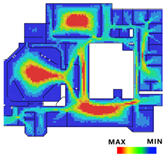
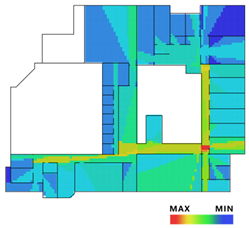
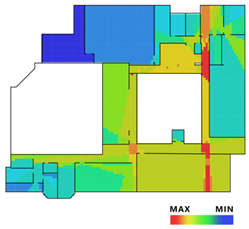
Using DepthmapX software, we analyzed the spatial integration and simulated pedestrian flow in public areas before and after renovation. As shown in Table 5 and 
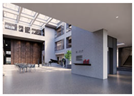
Table 6, post-renovation public spaces, including the entrance, atrium walkways, and resting areas, exhibited a significant increase in integration. Notably, the entrance space on the First Floor Plan showed the most substantial improvement, with its local integration value increasing by 0.7 compared to pre-renovation levels.
The observed alignment between subjective satisfaction with spatial accessibility and the objective integration values provides preliminary empirical evidence of a strong correspondence between post-renovation functional zoning and spatial configuration. The clear differentiation between primary public spaces and secondary office/ancillary spaces, coupled with improved accessibility and connectivity within public areas, allows them to effectively serve as central hubs for pedestrian circulation and activities. Moreover, the renovated layout provides users with more convenient and efficient pathways for movement and interaction.
The satisfaction analysis of public space node indicators (E4), as detailed in Table 3, reveals that user satisfaction with entrance spaces, resting areas, atrium spaces, and corridor spaces all exceeded the overall average satisfaction score. Specifically, these values were 4.63, 4.65, 4.61, and 4.61, respectively. These results further support the rationality and effectiveness of the renovated public spaces in terms of their functional layout and enhanced spatial integration.
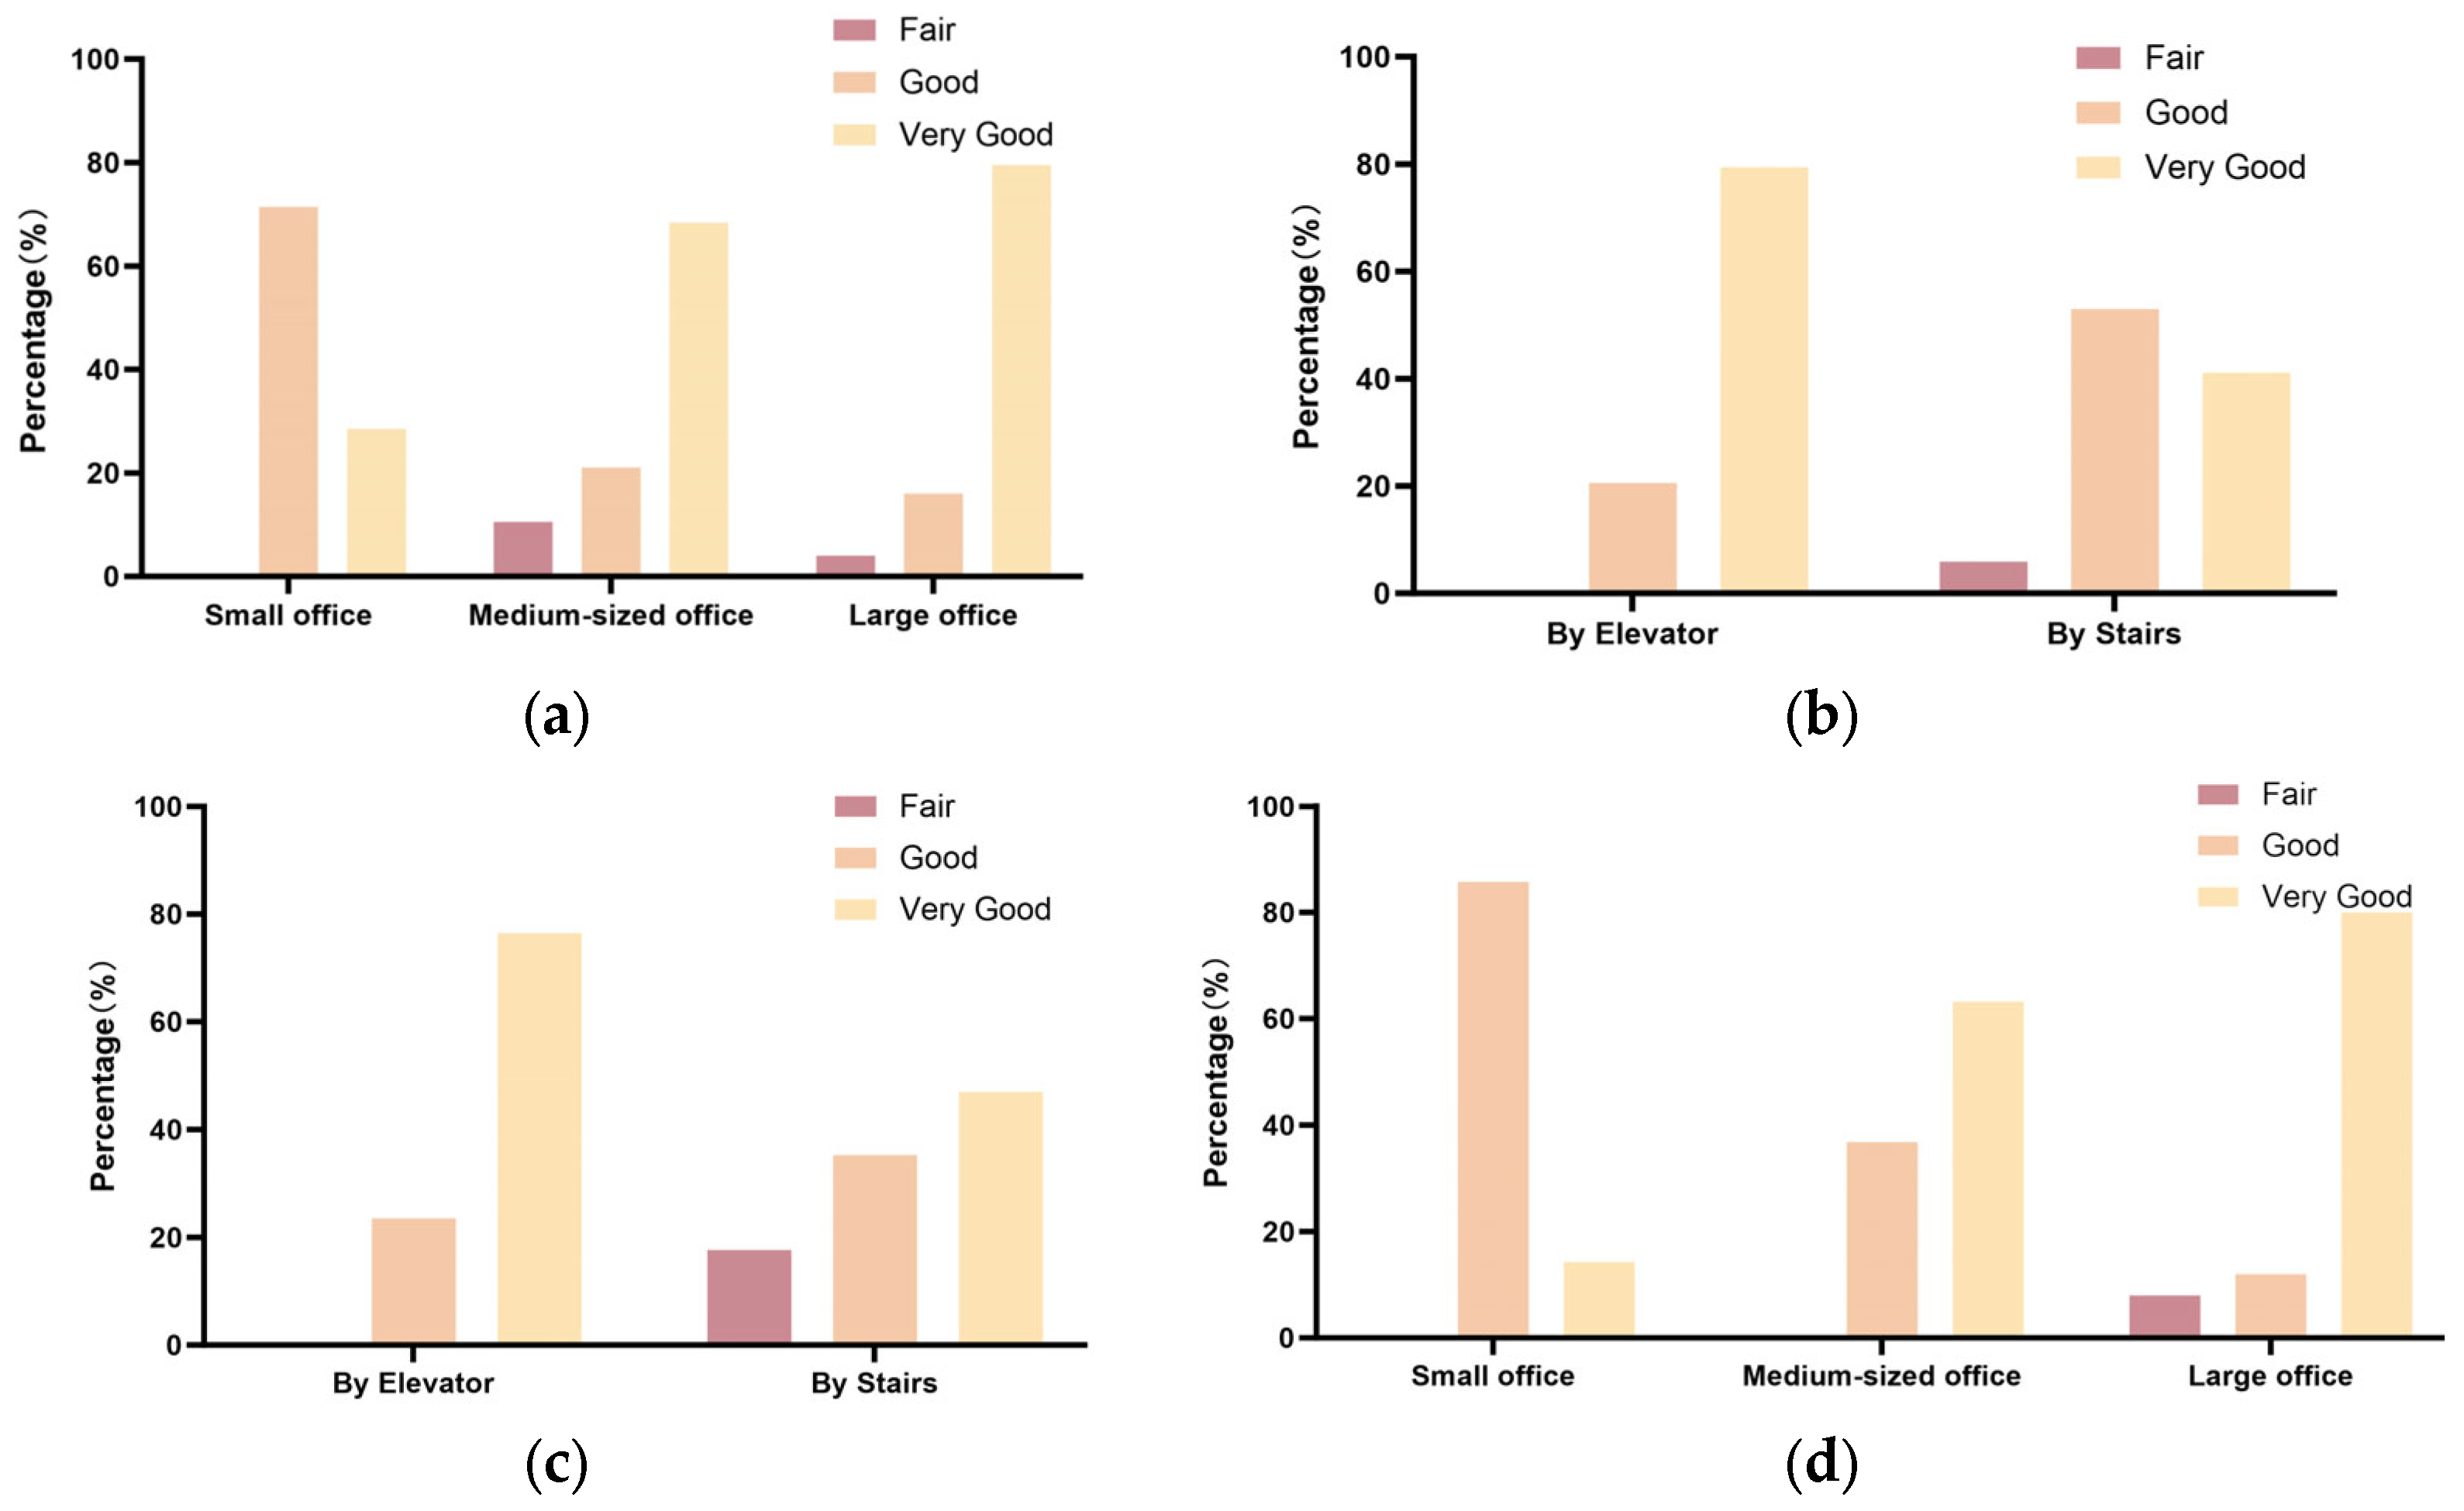
However, user satisfaction with public spaces varied depending on both the type of office space and the mode of arrival. As depicted in Figure 6, users from large offices reported higher satisfaction with entrance and corridor spaces compared to those from medium and small offices. Furthermore, users who arrived via elevators expressed greater satisfaction with public resting and atrium spaces than those who used stairs.
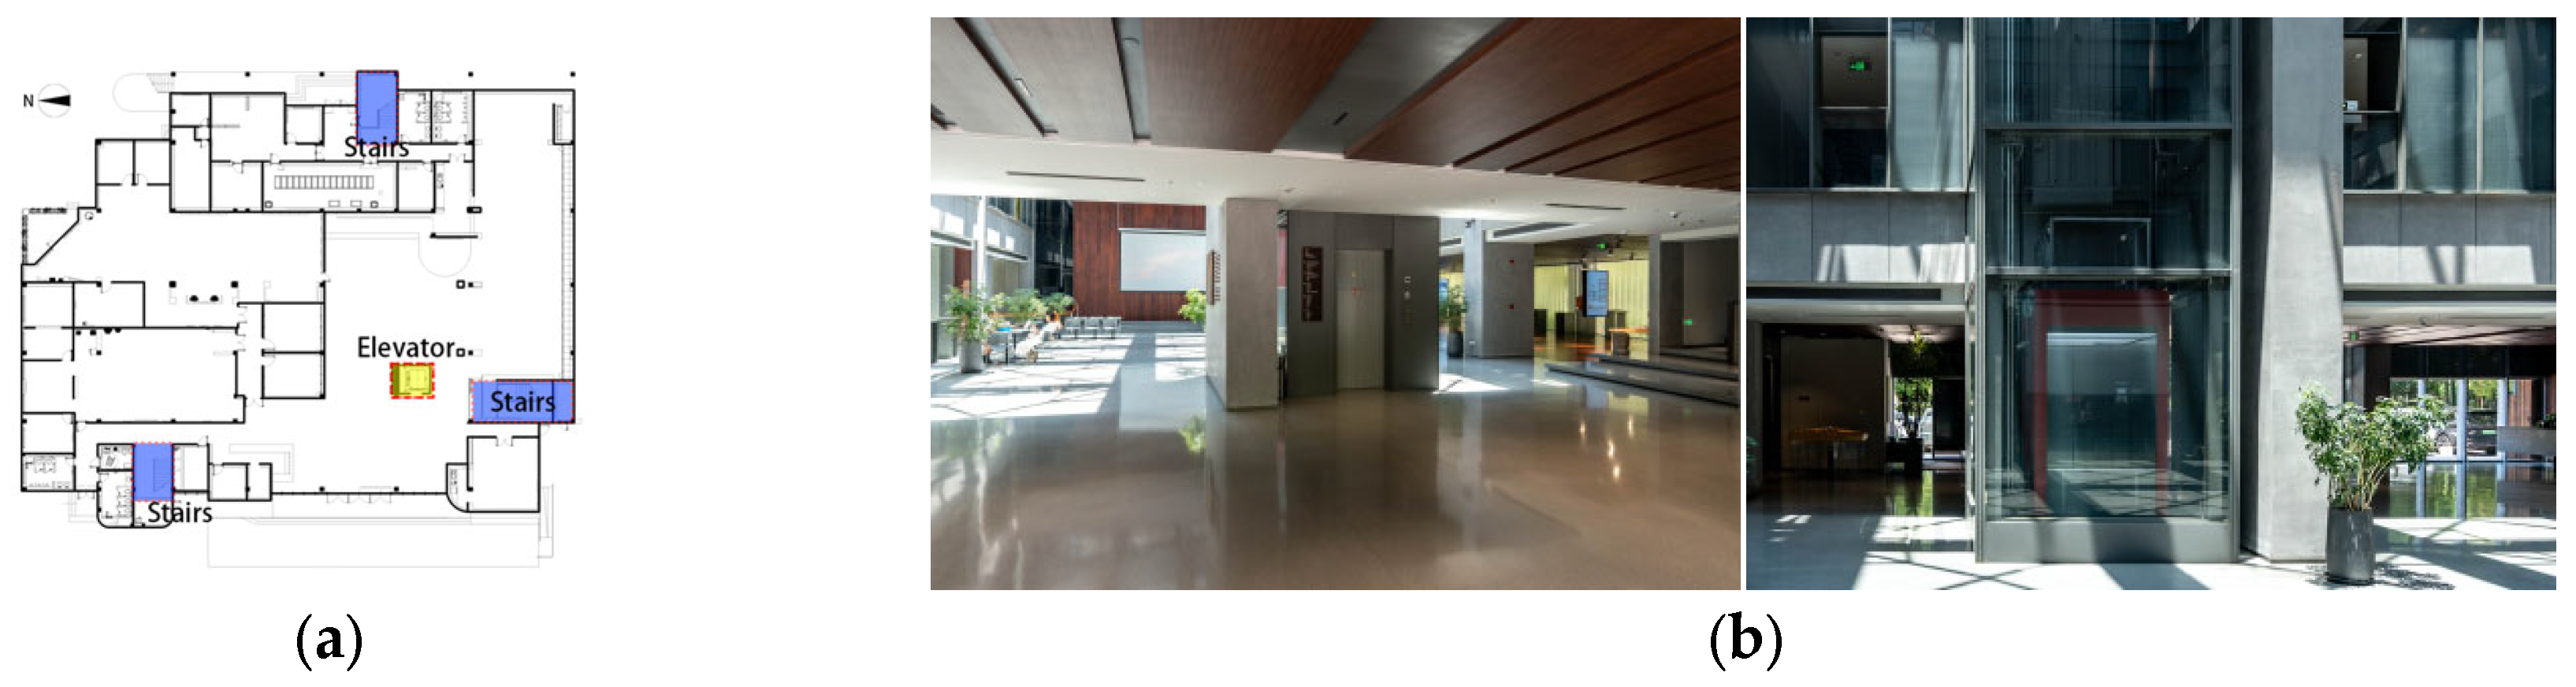
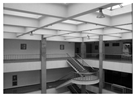
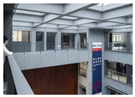
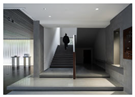
As illustrated in Figure 7, the elevator’s central and transparent design—unlike the more enclosed and peripheral placement of the staircase—likely contributes to this difference by allowing users to observe and experience the entire atrium and surrounding public space. It can, therefore, be inferred that large-scale office spaces and centrally located, transparent circulation spaces significantly contribute to an enhanced public space experience.

4.2. Spatial Comprehensibility

Regarding the metrics for spatial comprehensibility (E2) and spatial communication culture (E3), overall satisfaction scores were notably lower than the general average satisfaction score (
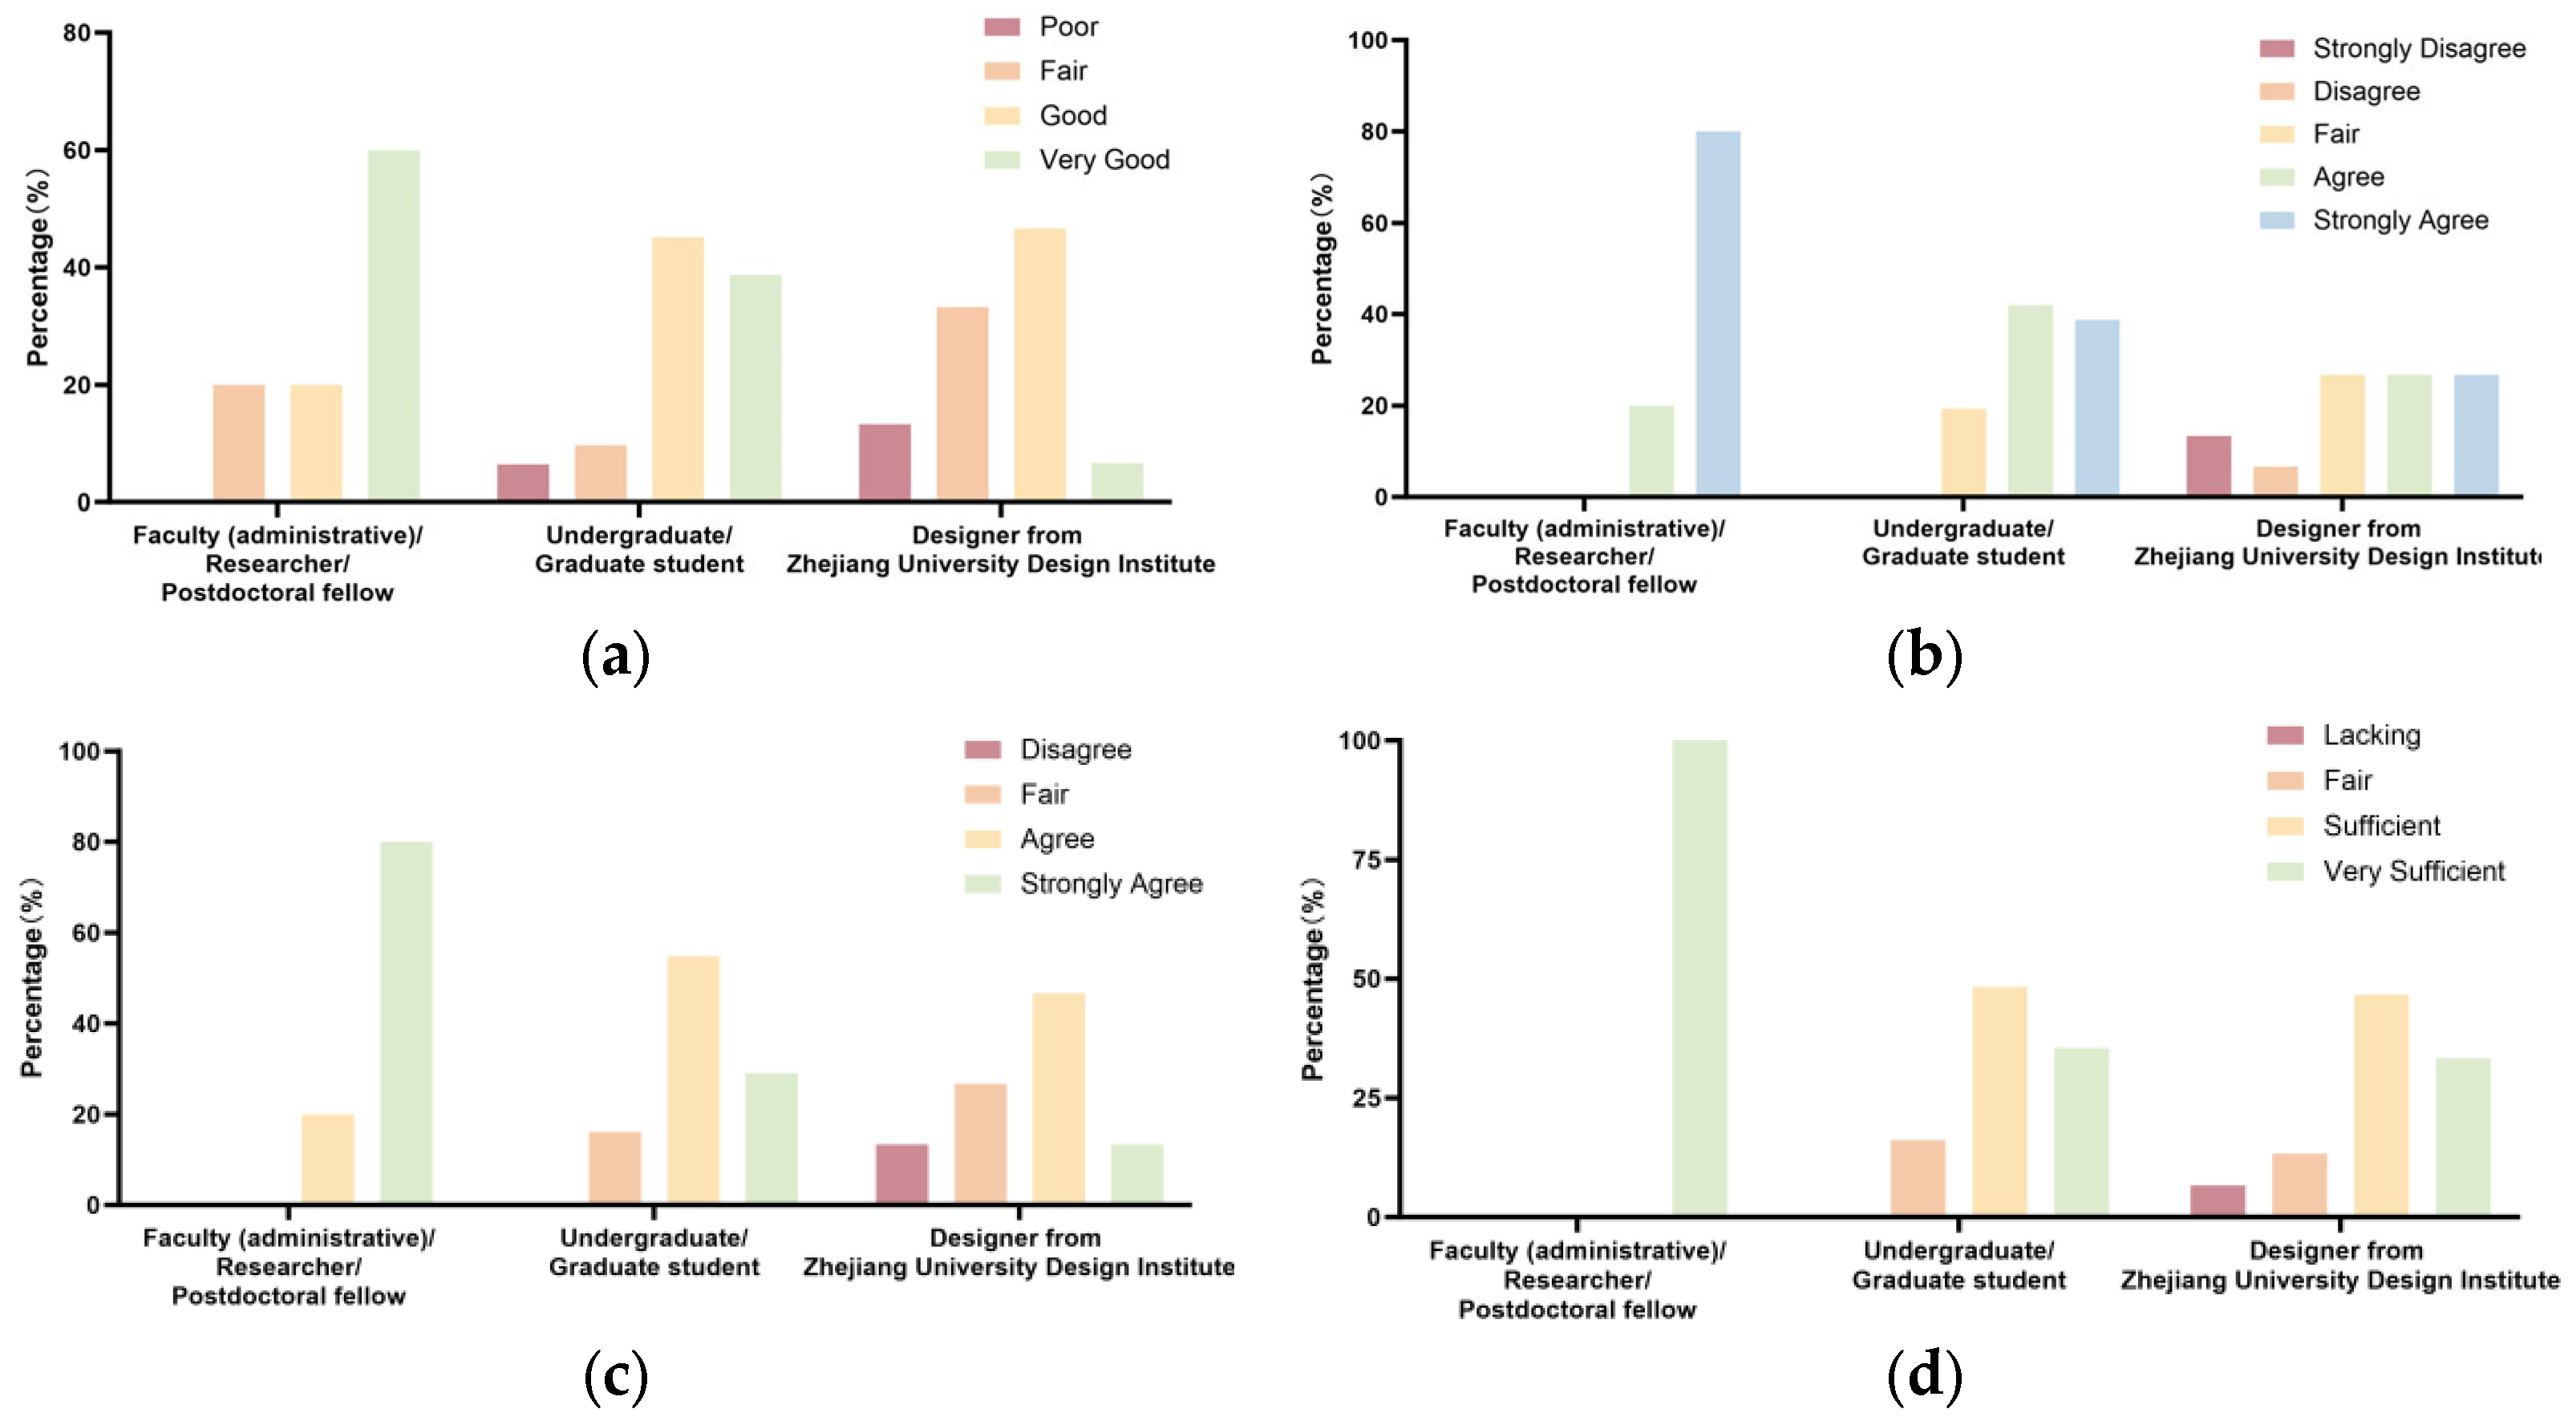
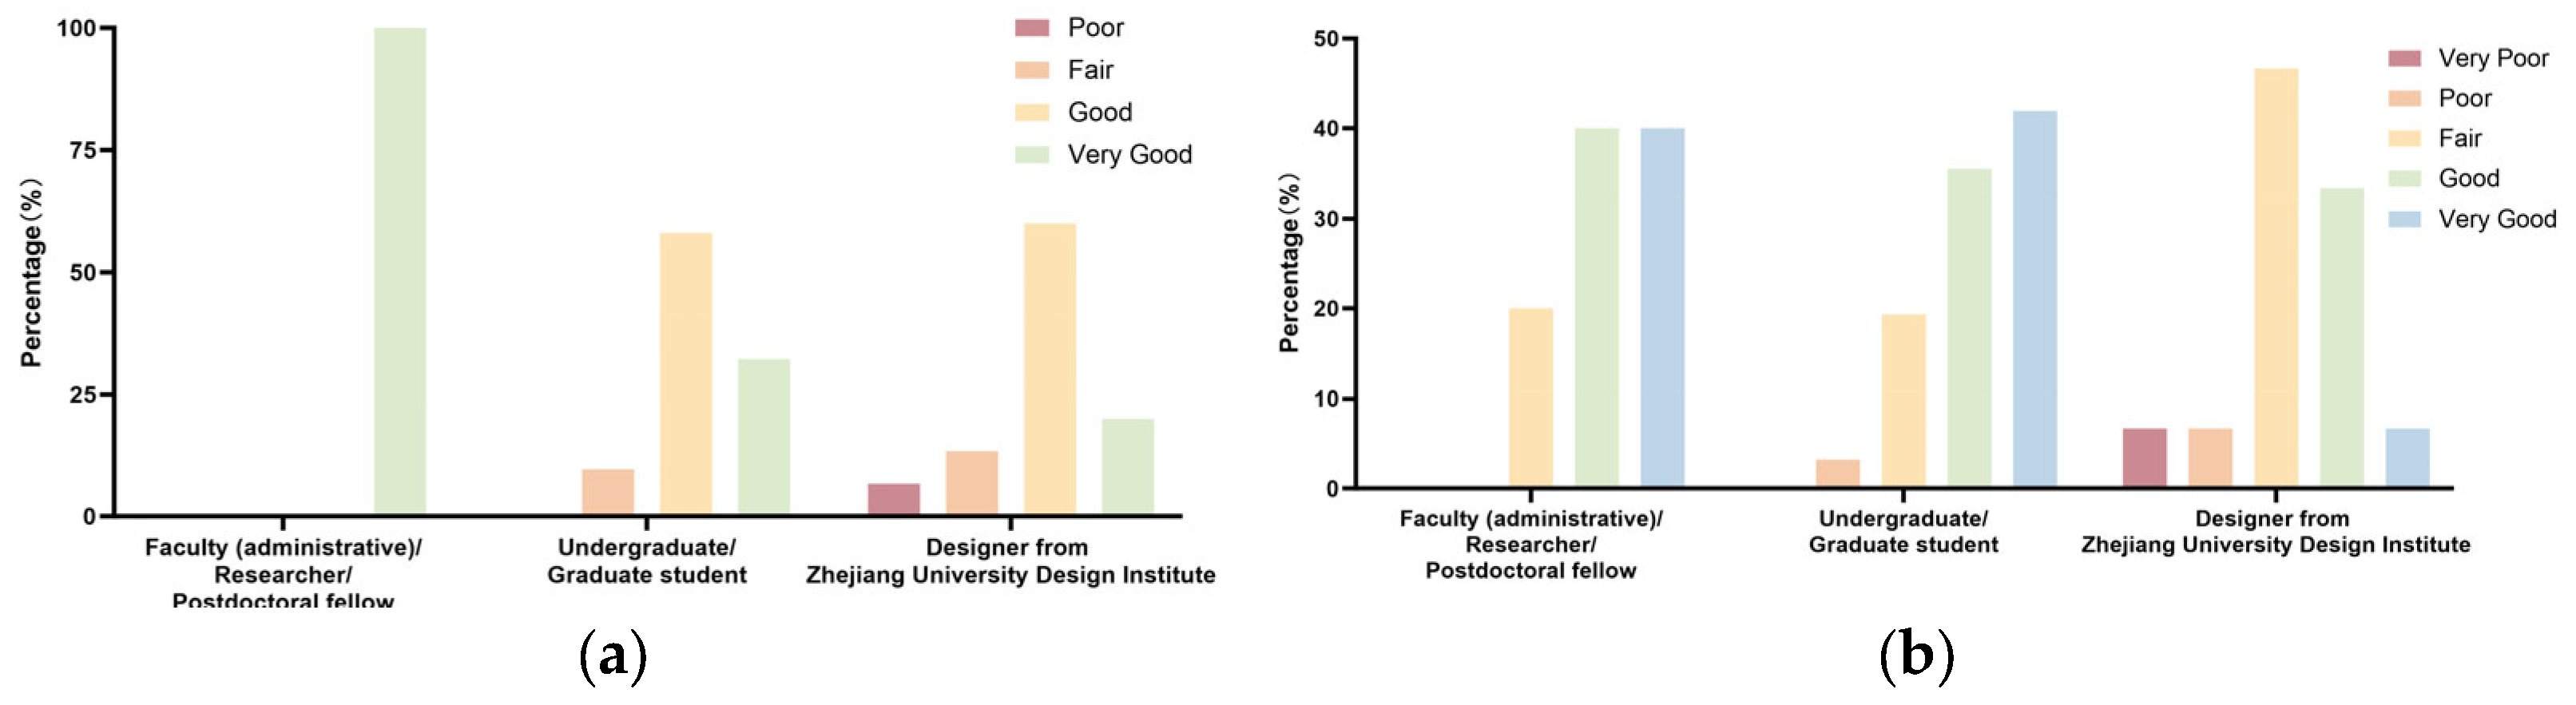
Table 3). Specifically, satisfaction with the reasonableness and convenience of the wayfinding system, as well as the interactivity of the public space registered, were 3.9, 3.98, and 3.96, respectively. These values, which fall between “average” and “good”, indicate a relatively low level of satisfaction in these dimensions. Furthermore, significant differences in user satisfaction were observed in relation to the cultural quality of public space areas and the convenience of the wayfinding system based on user identity. As depicted in Figure 8, the survey revealed that administrative and research staff expressed higher satisfaction with the communicability and cultural aspects of public spaces compared to students and design office personnel. Among these groups, design office personnel reported the lowest levels of satisfaction.
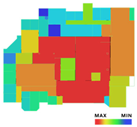
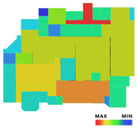
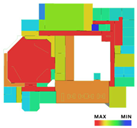
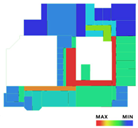
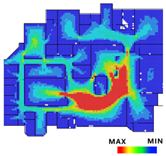
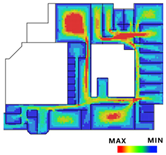
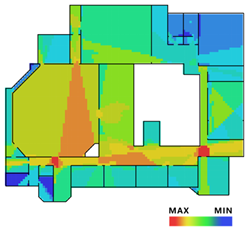
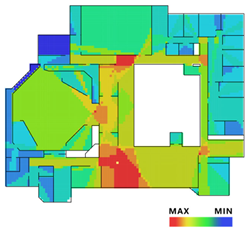
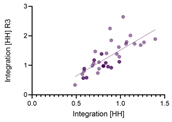
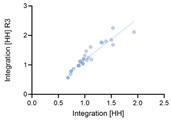
Further analysis using Depthmap software, as presented in 
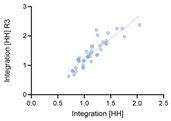
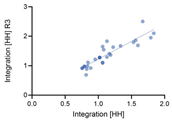
Table 7, demonstrates a marked improvement in the visual integration of the First Floor Plan public space following renovation, particularly in comparison to the second and third floors. The average visual integration value for the First Floor Plan was 6.6529. Moreover, a linear regression analysis was performed to determine the coefficient of determination (R2) between the overall and local integration within the public space (Table 8). This analysis revealed a significant correlation between these two metrics. Notably, the R2 values for the second and third floors were close to 1.0, indicating a high degree of spatial predictability, which is theoretically conducive to improved user comprehension and wayfinding.
However, subjective user evaluations indicated generally low satisfaction with spatial legibility, particularly in relation to the wayfinding system. This disparity suggests that, despite objective improvements in spatial integration, an inadequate wayfinding system may hinder users’ cognitive efficiency in navigating the overall environment. Therefore, in public space design, optimizing wayfinding systems must be synergistically integrated with spatial syntax analysis. Beyond focusing on the physical layout’s spatial integration, it is essential to conduct rigorous user experience experiments to precisely identify design shortcomings in signage systems, thereby enhancing users’ spatial perception and cognitive efficiency.

4.3. Satisfaction and Comfort of Nodal Spaces

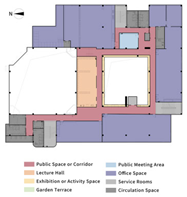
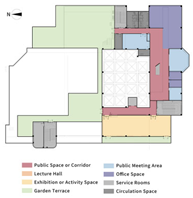
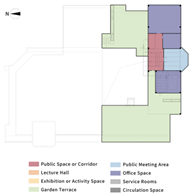
The renovated Balance Center features six main functional areas: learning/research, communication/discussion, activity/exhibition, meeting/negotiation, leisure/entertainment, and dining/social spaces. User satisfaction scores for these areas were 4.22, 4.2, 4.33, 4.35, 4.0, and 3.9, respectively (Table 3). All values fell below the overall average satisfaction score of 4.41, with leisure/entertainment and dining/social spaces showing the greatest deviation. Significant differences in satisfaction were observed based on user identity for learning/research (p = 0.008) and dining/social spaces (p = 0.012). User age had a statistically significant effort on satisfaction with dining/social spaces (p = 0.050). Furthermore, office size significantly influenced satisfaction with activity/exhibition spaces (p = 0.020).
As illustrated in 
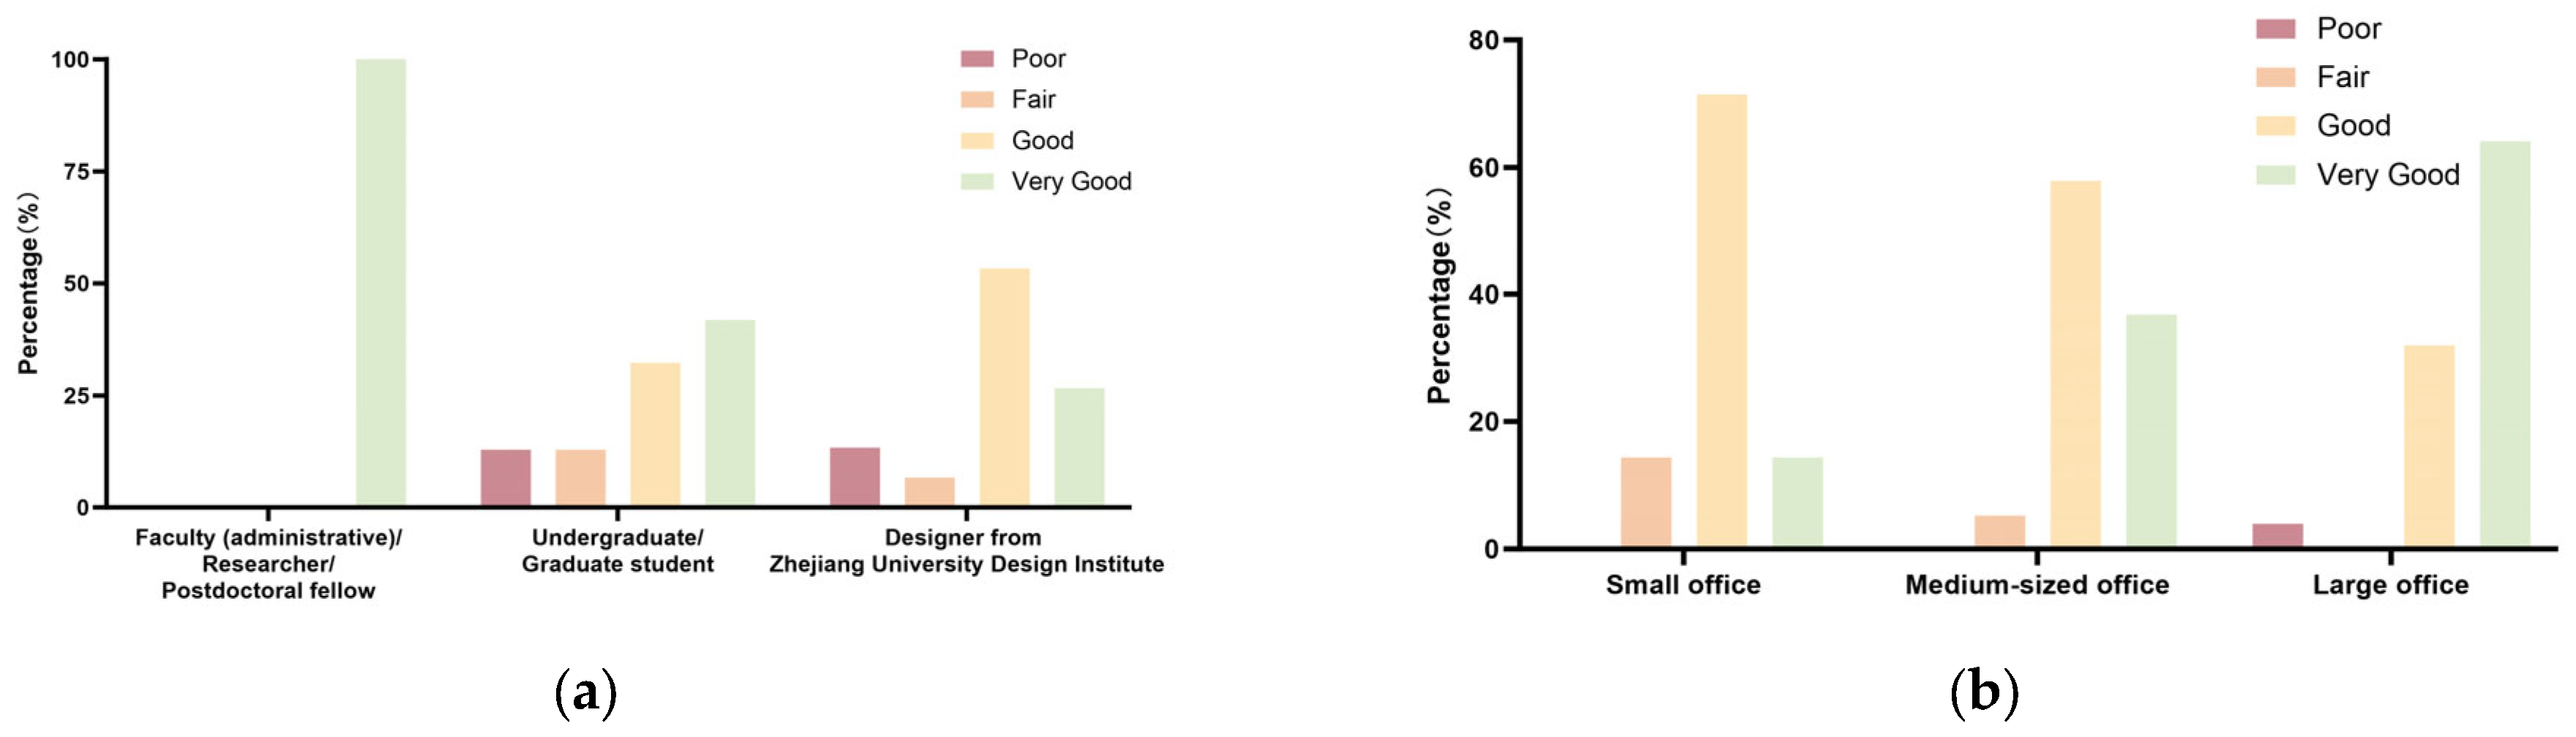
Figure 9a, faculty members reported higher satisfaction with learning and research spaces compared to both students and designers. A small subset of designers expressed low satisfaction with these areas. Faculty members exhibited higher satisfaction with the learning and research spaces, likely reflecting their greater need for quiet, privacy, and functional environments inherent to their professional roles. In contrast, students and designers reported lower satisfaction, which may be attributed to their stronger preference for spatial diversity and flexibility. Figure 9b indicates that both faculty and students generally approved of the dining and social spaces, with faculty members expressing slightly higher satisfaction than students. However, designers held a neutral stance, with some even strongly dissatisfied with the comfort level of these spaces, leading to overall lower approval from this group.
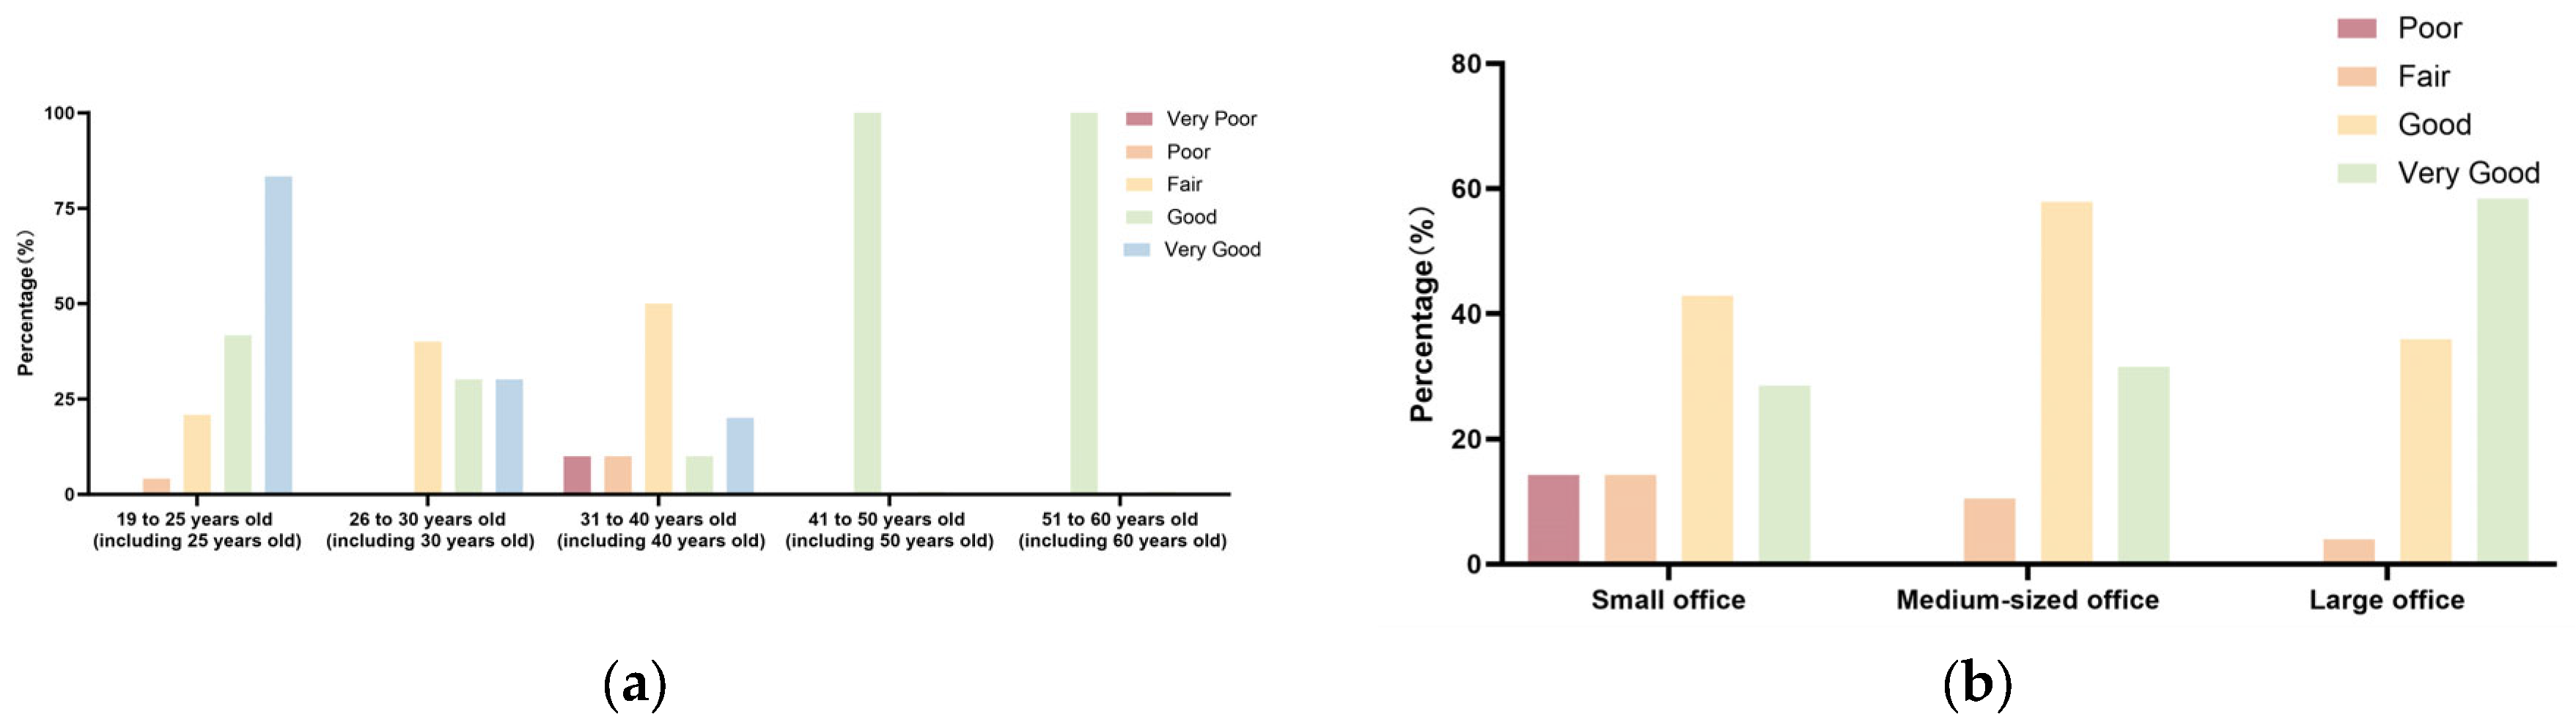
Cross-analysis by age group (Figure 10a) revealed that individuals aged 41–60 showed the highest satisfaction with dining and social spaces, followed by the 19–25 age group demographic. Conversely, the 26–40 age group reported lower satisfaction, with the 31–40 subgroup expressing the least satisfaction. Age-related differences in satisfaction reflect distinct social and leisure needs across life stages: the 41–60 age group favors stable, comfortable environments, while the 26–40 cohort’s transitional phase drives higher demands for spatial versatility and innovation. Furthermore, users from medium and large offices demonstrated higher satisfaction with public activity and exhibition spaces, with large office users reporting the highest satisfaction, while small office users indicated relatively low average satisfaction (Figure 10b). Office size influences users’ perceptions and needs for activity and exhibition spaces; larger offices tend to require more open, display-oriented areas to facilitate team collaboration and external communication.
Collectively, these findings underscore that office users exhibit high expectations for public spaces, particularly for dining/social and learning/research functions. Future design improvements should, therefore, carefully consider differences in user identity, age characteristics, and office environment. Refined spatial functional planning and enhanced environmental quality are essential to meet the diverse and personalized needs of different user groups.
Spatial comfort encompasses indoor physical environmental quality (temperature/humidity), indoor lighting comfort, acoustic comfort, furniture/seating comfort, and spatial privacy. As shown in Table 3, satisfaction scores were 4.43, 4.29, 4.1, 4.39, and 3.47, respectively. While the score for indoor physical environmental quality exceeded the overall mean (4.41), the other four aspects fell below it, with spatial privacy showing the largest deviation from the mean.
User identity had a statistically significant effect on indoor acoustic comfort (p = 0.042), and office size significantly influenced furniture/seating comfort (p = 0.011). As illustrated in Figure 11a, faculty and staff reported higher satisfaction with the public space’s acoustic environment, whereas students and designers generally reported lower satisfaction. This suggests that, while transparency and openness promote interaction, they can compromise acoustic quality, negatively impacting certain user groups. These differences likely stem from varying spatial usage patterns and differing requirements for quietness among faculty/staff, students, and designers. Figure 11b demonstrates a progressive increase in spatial privacy satisfaction with larger office sizes. This may be attributed to large office users typically having greater resources and spatial control, enabling them to better define personal or team work boundaries and enhance perceived privacy. However, a minority of users in large offices still reported dissatisfaction with spatial privacy. Based on the above analysis, the relatively low satisfaction with spatial privacy likely stems from the inherent tension between openness and privacy in public space design. While open layouts foster communication and sharing, they also introduce noise disturbances and visual exposure, disproportionately affecting users with heightened needs for quiet and privacy, such as students and designers. Although occupants of larger offices benefit from greater spatial control, negative feedback on privacy suggests that current designs insufficiently address the diverse needs of team activities and flexible private spaces. Future designs should balance openness and privacy through acoustic treatments, visual barriers, and adaptable layouts to enhance overall comfort and accommodate diverse user demands.

4.4. Limitations and Perspectives

(1)
Although the selected case study offers valuable representativeness, the inherent limitations of single-case analysis and subjectivity in evaluation cannot be entirely eliminated. Future research should address these limitations by expanding the sample size and incorporating a broader spectrum of user groups with varied backgrounds and spatial behaviors. This more comprehensive research foundation will facilitate the development of generalizable conclusions and enable deeper exploration of both the shared characteristics and contextual differences in public space performance across diverse educational settings.
(2)
At present, the Depthmap software employed in the space syntax analysis lacks the functionality to distinguish between different user groups. To address this technical constraint, future studies should explore more advanced analytical tools or consider enhancing the current software to support user-specific modeling. These efforts aim to improve the precision and relevance of behavioral and spatial interaction analyses across heterogeneous populations.

5. Conclusions

This study investigated the Balanced Architecture Research Center at Zhejiang University, a representative example of an integrated university complex that combines education, research, and industry. It introduces a hybrid evaluation framework for assessing the effectiveness of interior public spaces by integrating quantitative space syntax metrics with subjective user satisfaction data. The proposed framework addresses the limitations of conventional space syntax models in capturing user needs and human-centered experiences, while also mitigating the subjectivity inherent in perceptual evaluations through the inclusion of objective spatial data. Using Depthmap software, the study quantifies key indicators—namely, spatial integration, visual integration, and spatial intelligibility—before and after the building’s renovation. These metrics are then correlated with multidimensional user survey data to establish a comprehensive, evidence-based understanding of spatial performance across three dimensions: accessibility, legibility, and comfort. This integrative approach constitutes a methodological advancement in evaluating public space efficiency within university complexes and offers actionable insights for both theoretical development and practical renovation of aging campus facilities. Based on the findings, the key conclusions and recommended design strategies are outlined as follows:
(1)
The post-renovation analysis revealed a significant increase in overall spatial integration, with local integration in the ground-floor entrance zone rising by 0.7, empirically validating the effectiveness of open layouts in facilitating pedestrian flow and enhancing spatial accessibility. Future design strategies for similar renovations should prioritize the spatial connectivity of key circulation hubs (e.g., entrance lobbies) by incorporating open atrium configurations to reduce travel distances. In high-traffic areas, modular seating arrangements are recommended to balance movement efficiency with opportunities for spontaneous social interaction.
(2)
Although visual integration values objectively improved on the upper floors, user feedback indicated persistent dissatisfaction with the wayfinding system. A dual-layered approach is recommended: (a) reinforce physical signage at key nodes (e.g., elevator halls, stairwells, and entrances) using illuminated floor directories and color-coded functional zones; and (b) develop digital navigation tools—such as augmented reality (AR)-based wayfinding applications—that provide real-time spatial orientation through mobile scanning, thereby compensating for the cognitive limitations of conventional signage.
(3)
Statistically significant differences in spatial preferences were observed across user demographics, including faculty, students, visitors, older adults (≥45 years, who are more sensitive to acoustic conditions), and occupants of small-scale office units (who prioritize privacy). Accordingly, targeted spatial interventions are recommended: (a) for acoustic optimization, install perforated gypsum acoustic ceilings and integrate plant-based sound barriers in open communication zones; and (b) for privacy enhancement, introduce semi-enclosed seating pods near circulation cores, delineated with frosted glass partitions to reinforce territoriality and reduce sensory intrusion.
(4)
The centrally located panoramic elevator functions as a visual and navigational anchor, markedly improving spatial legibility. To further enhance vertical spatial hierarchy and cognitive mapping, thematic art installations should be placed at elevator landings on each floor, serving both as orientation cues and mnemonic spatial identifiers.
This study not only highlights the respective strengths of space syntax and user surveys but also demonstrates their methodological complementarity. On the one hand, the objective spatial metrics derived from space syntax closely align with the subjective patterns identified in user feedback. On the other hand, the user surveys effectively compensated for space syntax’s limitations in capturing individual behavioral and perceptual variations. This integrated subjective–objective approach significantly enhances the accuracy and robustness of spatial performance evaluations, offering an innovative methodological framework for the comprehensive assessment of public space effectiveness.
In the future, research should build upon the present findings through multi-case comparative analyses that systematically examine both the divergences and commonalities in spatial usage patterns across varied educational settings. Such investigations will further evaluate the generalizability and robustness of the proposed hybrid framework for assessing the performance of interior public spaces. On the objective evaluation front, it is recommended to incorporate spatial analysis tools that support user clustering or to enhance the functionality of Depthmap plugins, thereby enabling more refined modeling of behavioral patterns. Collectively, these advancements will contribute to the development of a more comprehensive and scalable methodological system. The outcomes of this study not only offer a data-driven design paradigm for the renovation of aging academic buildings, but also establish a theoretical foundation for promoting precision-oriented, human-centered, and intelligent spatial governance in university complexes.

Author Contributions

Conceptualization, D.D. and L.Y.; architectural design, D.D.; methodology, L.Y.; software, L.Y.; data curation, L.Y.; writing—original draft preparation, L.Y. and Y.H.; writing—review and editing, L.Y.; visualization, L.Y. and Y.H.; supervision, J.W. All authors have read and agreed to the published version of the manuscript.

Funding

This research was funded by the Center for Balance Architecture of Zhejiang University (grant no. 281410-I5220C) and the Zhejiang Provincial Social Science Federation of China (grant no. 2025B041). And the APC was funded by the Center for Balance Architecture of Zhejiang University.

Institutional Review Board Statement

Based on the relevant ethical review guidelines and standards, our study meets the criteria for exemption from ethical approval. The reasons are as follows: (1) Research Nature: This study is a survey conducted through anonymous questionnaires, without any direct intervention or exposure to risks for the participants. All data have been anonymized to ensure that they cannot be traced back to individual participants. (2) Risk Assessment: After a thorough risk assessment, we have determined that this study poses no potential risks to participants, including physical, psychological, or privacy-related risks. The research process will not have any negative impacts on the daily life, work, or health of the participants. (3) Privacy Protection: We strictly adhere to the principles of privacy protection. The collection, storage, and analysis of all data comply with the relevant laws, regulations, and ethical requirements. All members of our research team have been trained in privacy protection to ensure the personal information security of the participants.

Informed Consent Statement

Informed consent was obtained from all subjects involved in the study.

Data Availability Statement

The original contributions presented in this study are included in the article. Further inquiries can be directed to the corresponding author.

Acknowledgments

We appreciate the cooperation of the BAC in the questionnaire.

Conflicts of Interest

Authors Linfeng Yao, Danshen Dong, Yuxi He and Jing Wang were employed by the company The Architectural Design & Research Institute of Zhejiang University Co., Ltd. The authors declare that they have no known competing financial interests or personal relation-ships that could have appeared to influence the work reported in this paper.

Appendix A. The Questionnaire

Appendix A.1. Basic Information

  • What is your primary identity? ☐Faculty (administrative)/Researcher/Postdoctoral fellow, ☐Undergraduate/Graduate student, ☐Designer from Zhejiang University Design Institute
  • What is your gender? ☐Male, ☐Female
  • What is your age range? ☐Under 18 years old (including 18 years old), ☐19 to 25 years old (including 25 years old), ☐26 to 30 years old (including 30 years old), ☐31 to 40 years old (including 40 years old), ☐41 to 50 years old (including 50 years old), ☐51 to 60 years old (including 60 years old)
  • Which floor do you mainly work or study on? ☐First floor, ☐Second floor, ☐Third floor, ☐Fourth floor, ☐Fifth floor
  • How do you usually get to your office or public space? ☐By elevator, ☐By stairs
  • How long do you usually spend in the Center for Balanced Architecture each day? ☐ 0 to 4 h, ☐4 to 8 h, ☐More than 8 h
  • What is the size of your office or study space? ☐Small office (fewer than 4 people), ☐Medium-sized office (4 to 12 people), ☐Large office (more than 12 people)
  • How frequently do you use the public spaces in the Center for Balanced Architecture?
Table A1. The usage frequency of public spaces.
SpaceDaily Use>3 Times a Week1 to 2 Times a Week1 to 2 Times a Month<Once a Month
First-floor atrium public space
First-floor exhibition space
Second-floor elevator lobby public rest area
Second-floor dining bar/coffee counter
Second-floor auditorium
Second-floor tea break area adjacent to the discussion zone
Third-floor library reading room
Third-floor coffee counter
Third-floor fitness facilities
First-floor public meeting room
Second-floor public meeting room
Third-floor public meeting room
Fourth-floor terrace space
Fifth-floor rooftop terrace
9.
What are the main types of activities you engage in within the public spaces? ☐ Study/Research, ☐Communication/Discussion, ☐Exhibition/Display, ☐Relaxation/Rest, ☐Dining/Socializing, ☐Meeting/Consultation

Appendix A.2. Overall Use Perception of Public Spaces in the Center for Balanced Architecture

  • How satisfied are you with the various nodes of public spaces in the Center for Balanced Architecture?
Table A2. The satisfaction of each node.
AspectVery PoorPoorFairGoodVery Good
Width of entrance spaces
Comfort of rest areas
Transparency of atrium spaces
Width of corridors
Convenience of vertical elevator distribution
Convenience of staircase distribution
2.
How easy do you find it to locate the functional areas you need in the Center for Balanced Architecture? ☐Very difficult, ☐Difficult, ☐Fair, ☐Easy, ☐Very easy
3.
How satisfied are you with the wayfinding system in the Center for Balanced Architecture?
Table A3. The satisfaction of the way-finding system.
AspectVery PoorPoorFairGoodVery Good
Reasonableness of wayfinding system locations
Understandability of wayfinding system content
Convenience of wayfinding system
4.
How do you evaluate the accessibility (convenient or inconvenient) and transparency (transparent or obstructed) of the public spaces in the Center for Balanced Architecture?
Table A4. The satisfaction of the accessibility and transparency in the public spaces.
AspectVery PoorPoorFairGoodVery Good
Accessibility of public spaces on the same floor
Accessibility of public spaces on different floors
Transparency of public spaces on the same floor
Transparency of public spaces on different floors
5.
How do you evaluate the comfort of the public spaces in the Center for Balanced Architecture?
Table A5. Comfort assessment.
AspectVery PoorPoorFairGoodVery Good
Comfort of temperature, humidity, and air quality
Comfort of lighting
Comfort of acoustic environment (noise)
Comfort of seating furniture
Privacy of public spaces
6.
Do you think the current public spaces encourage interaction among people? ☐, ☐Strongly disagree, ☐Disagree, ☐Fair, ☐Agree, ☐Strongly agree
7.
Do you think there are enough public seats or gathering areas for communication in the current public spaces? ☐Very lacking, ☐Lacking, ☐Fair, ☐Sufficient, ☐Very sufficient
8.
Do you think the current overall design and interior decoration of the public spaces are attractive and pleasant? ☐Strongly disagree, ☐Disagree, ☐Fair, ☐Agree, ☐Strongly agree
9.
Do you think the current interior layout of the public spaces reflects certain cultural characteristics? ☐Strongly disagree, ☐Disagree, ☐Fair, ☐Agree, ☐Strongly agree
10.
Do you think the current layout of the public spaces meets your usage needs? ☐Very poor, ☐Poor, ☐Fair, ☐Good, ☐Very good
11.
Do you think the functional areas are clearly divided and easy to use? ☐Very poor, ☐Poor, ☐Fair, ☐Good, ☐Very good
12.
Do you think the current public spaces can flexibly adapt to different activities? ☐Very poor, ☐Poor, ☐Fair, ☐Good, ☐Very good
13.
How satisfied are you with the functionality of the public spaces?
Table A6. The satisfaction of the functionality in the public spaces.
AspectVery PoorPoorFairGoodVery Good
Learning and research space
Communication and discussion space
Activity and display space
Meeting and consultation space
Rest and entertainment space
Dining and socializing space
14.
How do you evaluate the sufficiency of the public spaces in terms of functionality?
Table A7. The assessment of the functionality in the public spaces.
AspectVery InsufficientInsufficientFairSufficientVery Sufficient
Learning and research space
Communication and discussion space
Activity and display space
Meeting and consultation space
Rest and entertainment space
Dining and socializing space
15.
What other types of functions do you think the public spaces in the Center for Balanced Architecture could have besides the existing ones? ☐Public spaces for various event promotions and displays, ☐Private spaces with stronger privacy (for interviews, study, etc.), ☐Other
16.
How satisfied are you with the public spaces in the Center for Balanced Architecture? ☐Very dissatisfied, ☐Dissatisfied, ☐Fair, ☐Satisfied, ☐Very satisfied

References

  1. Wei, H.; Qi, W.; Liu, S.; Liu, Z. Progress and prospect of suburbanization research in China under thebackground of new-type urbanization. Prog. Geogr. 2022, 41, 2152–2164. [Google Scholar] [CrossRef]
  2. Guo, W.; Ding, Y.; Yang, G.; Liu, X. Research on the Indicators of Sustainable Campus Renewal and Reconstruction in Pursuit of Continuous Historical and Regional Context. Buildings 2022, 12, 1508. [Google Scholar] [CrossRef]
  3. Wang, J.; Chen, J.; Wang, C. A New Research on Campus Renewal Design Strategy from the Perspective of “Campus—City Symbiosis. In ICCEA 2023, Proceedings of the 6th International Conference on Civil Engineering and Architecture, Hong Kong, 20–23 March 2023; Springer: Singapore, 2024; pp. 24–35. [Google Scholar] [CrossRef]
  4. Huo, Y.; Ye, T.; Fan, Y. Research on the Transformation Strategy of Urban Open Old Community Under the Micro-Renewal Concept. Prax. Urban Morphol. 2022, 12, 29–33. [Google Scholar] [CrossRef]
  5. Mohammed, A.M.S.; Ukai, T.; Hall, M. Towards a Sustainable Campus-City Relationship: A Systematic Review of the Literature. Reg. Sustain. 2022, 3, 53–67. [Google Scholar] [CrossRef]
  6. Mohammed, A.M.S.; Ukai, T. University Campuses as Agents for Urban Change. Environ. Socio-Econ. Stud. 2022, 10, 22–37. [Google Scholar] [CrossRef]
  7. Skalaban, I.A.; Debrenne, M.; Kolesova, O.V.; Pogorelskaya, A.M. Strategic University-City Cooperation: The Role of Campus in Higher Education Internationalization. Tomsk. State Univ. 2021, 59, 180–188. [Google Scholar] [CrossRef]
  8. Mohammed, A.M.S.; Ukai, T.; Hall, M.W. University campuses’ role in accelerating the natural urban transformation process. Bull. Geogr.-Socio-Econ. Ser. 2022, 58, 75–96. [Google Scholar] [CrossRef]
  9. Abdelaal, M.S.; Abdelaal, D. Towards an Innovative Community: Rethinking the Urban Configuration of the University Campus Within New Cities. In New Cities and Community Extensions in Egypt and the Middle East; Springer: Cham, Switzerland, 2018; pp. 237–256. [Google Scholar] [CrossRef]
  10. Wilczynski, V. Designing the Yale Center for Engineering Innovation and Design. In Proceedings of the National Collegiate Innovators and Inventors 18th Annual Conference–Open 2014 Proceedings, San Jose, CA, USA, 21–22 March 2014; Volume 3. [Google Scholar]
  11. Safizadeh, M. Simulation of the Circulation Complexity in Student Residence Buildings Using Space Syntax Analyses (Case Studies: Highland Hall, Rita Atkinson, Rutgers University and Tooker Residences, USA). Archit. Eng. Des. Manag. 2024, 20, 741–760. [Google Scholar]
  12. Mulas, V.; Gastelu-Iturri, M. New York City: Transforming a City into a Tech Innovation Leader; World Bank: Washington, DC, USA, 2016. [Google Scholar]
  13. Wang, X.; Yang, L.; Gao, S.; Zhao, S.; Zhai, Y. Thermal Comfort in Naturally Ventilated University Classrooms: A Seasonal Field Study in Xi’an, China. Energy Build. 2021, 247, 111126. [Google Scholar] [CrossRef]
  14. de la Hoz-Torres, M.L.; Aguilar, A.J.; Ruiz, D.P.; Martínez-Aires, M.D. Analysis of Impact of Natural Ventilation Strategies in Ventilation Rates and Indoor Environmental Acoustics Using Sensor Measurement Data in Educational Buildings. Sensors 2021, 21, 6122. [Google Scholar] [CrossRef]
  15. Gao, L.; Wang, S.; Mao, M.; Liu, C.; Li, T. Study on the Energy Consumption Characteristics and the Self-Sufficiency Rate of Rooftop Photovoltaic of University Campus Buildings. Energies 2024, 17, 3535. [Google Scholar] [CrossRef]
  16. Dong, Z.; Zhao, K.; Ren, M.; Ge, J.; Chan, I.Y.S. The Impact of Space Design on Occupants’ Satisfaction with Indoor Environment in University Dormitories. Build. Environ. 2022, 218, 109143. [Google Scholar] [CrossRef]
  17. Azzazy, S.; Ghaffarianhoseini, A.; Naismith, N.; Doan, D.T.; Hollander, J.B. The Significance of Indoor Thermal Comfort on Occupants’ Perception: In University Buildings in Auckland, New Zealand. Build. Res. Inf. 2024, 53, 19–39. [Google Scholar] [CrossRef]
  18. Dong, W.; Wu, J.; Chen, Y.; Zhou, X. A Bibliometric Review of Research on the Perceptions of Campus Public Spaces. Buildings 2023, 13, 501. [Google Scholar] [CrossRef]
  19. Askarizad, R.; Daudén, P.J.L.; Garau, C. The Application of Space Syntax to Enhance Sociability in Public Urban Spaces: A Systematic Review. ISPRS Int. J. Geo-Inf. 2024, 13, 227. [Google Scholar] [CrossRef]
  20. Mohamed, A.A.; van der Laag Yamu, C. Space Syntax has Come of Age: A Bibliometric Review from 1976 to 2023. J. Plan. Lit. 2023, 39, 203–217. [Google Scholar] [CrossRef]
  21. Sari, A.O.B.; Jabi, W. Architectural Spatial Layout Design for Hospitals: A Review. J. Build. Eng. 2024, 97, 110835. [Google Scholar] [CrossRef]
  22. Chen, M.-S.; Ko, Y.-T.; Hsieh, W.-C. Exploring the Planning and Configuration of the Hospital Wayfinding System by Space Syntax: A Case Study of Cheng Ching Hospital, Chung Kang Branch in Taiwan. ISPRS Int. J. Geo-Inf. 2021, 10, 570. [Google Scholar] [CrossRef]
  23. Li, Y.; Huang, J.; Yang, L. From Functional Space to Experience Space: Applying Space Syntax Analysis to a Museum in China. Int. Rev. Spat. Plan. Sustain. Dev. 2020, 8, 86–99. [Google Scholar] [CrossRef]
  24. Zhou, W.; Guo, H.; Hou, X.; Lai, W.; Yao, L. A Statistical Study of the Pedestrian Distribution in a Commercial Wholesale Centre Based on the Traffic Spatial Structure. Buildings 2024, 14, 1782. [Google Scholar] [CrossRef]
  25. Lian, H.; Li, G. Correlation Analysis of Retail Space and Shopping Behavior in a Commercial Street Based on Space Syntax: A Case of Shijiazhuang, China. Buildings 2023, 13, 2674. [Google Scholar] [CrossRef]
  26. Marinelli, L.J.; Annunziata, A.; Caselli, B.; Desogus, G.; Torrisi, V.; Garau, C. Accessibility and Polarities of Pedestrian Network in University Campuses. A Space Syntax Application; Springer International Publishing: Cham, Switzerland, 2023; Volume 14111, pp. 382–399. [Google Scholar]
  27. El-Darwish, I.I. Enhancing Outdoor Campus Design by Utilizing Space Syntax Theory for Social Interaction Locations. Ain Shams Eng. J. 2022, 13, 101524. [Google Scholar] [CrossRef]
  28. Kim, L.M. Research on the Relationship Between Interaction Performance with Barrier and Seating Layouts in the Classroom: Using the Spatial Syntax Visual Access and Exposure Model. Arch. Des. Res. 2022, 35, 35–50. [Google Scholar] [CrossRef]
  29. Dursun, P. Space Syntax in Architectural Design. In Proceedings of the 6th International Space Syntax Symposium, Istanbul, Turkey, 12–15 June 2007; pp. 1–56. [Google Scholar]
  30. Hammadamin, A.B.; Nordin, J.; Mustafa, F.A. Interpretation of Space Syntax in Higher Education: A Study of Functional Efficiency in Architecture Schools in Erbil. Sustainability 2025, 16, 11237. [Google Scholar] [CrossRef]
  31. Hillier, B. Space Is the Machine: A Configurational Theory of Architecture; Space Syntax: London, UK, 2007; pp. 287–343. [Google Scholar]
  32. Gil, J.; Varoudis, T.; Karimi, K.; Penn, A. The Space Syntax Toolkit: Integrating depthmapX and Exploratory Spatial Analysis Workflows in QGIS. In Proceedings of the SSS 2015-10th International Space Syntax Symposium, London, UK, 13–17 July 2015; Space Syntax Laboratory, The Bartlett School of Architecture: London, UK; Volume 10. [Google Scholar]
  33. Jeong, S.-K.; Ban, Y.-U. Developing a Topological Information Extraction Model for Space Syntax Analysis. Build. Environ. 2011, 46, 2442–2453. [Google Scholar] [CrossRef]
  34. Duan, J. Spatial Syntax Tutoria; China Architecture Industry Press: Beijing, China, 2019; pp. 59–61. [Google Scholar]
  35. Hiller, B. The Social Logic of Space; Cambridge University Press: Cambridge, UK, 2008. [Google Scholar]
  36. Hu, C.; Qi, Y.; Wang, C. An Analysis of the Spatial Characteristics of Jin Ancestral Temple Based on Space Syntax. Buildings 2024, 15, 85. [Google Scholar] [CrossRef]
  37. Hegazi, Y.S.; Tahoon, D.; Abdel-Fattah, N.A.; El-Alfi, M.F. Socio-Spatial Vulnerability Assessment of Heritage Buildings through Using Space Syntax. Heliyon 2022, 8, e09133. [Google Scholar] [CrossRef]
  38. Yunitsyna, A.; Shtepani, E. Investigating the Socio-Spatial Relations of the Built Environment Using the Space Syntax Analysis—A Case Study of Tirana City. Cities 2022, 133, 104147. [Google Scholar] [CrossRef]
  39. Xie, X.; Ni, Y.; Zhang, X. Analysis of Public Transformation of Spaces in Traditional Lingnan Gardens. South Archit. 2024, 9, 47–57. [Google Scholar]
  40. Kim, O.Y. Spatial Configuration, Spatial Cognition and Spatial Behaviour: The Role of Architectural Intelligibility in Shaping Spatial Experience. Ph.D. Thesis, University College London, London, UK, 1999; pp. 200–215. [Google Scholar]
  41. Yao, Y.; Shi, W.; Zhang, A.; Liu, Z.; Luo, S. Examining the Diffusion of Coronavirus Disease 2019 Cases in a Metropolis: A Space Syntax Approach. Int. J. Health Geogr. 2021, 20, 17. [Google Scholar] [CrossRef]
  42. Soares, I.; Venhorst, V.; Weitkamp, G.; Yamu, C. The Impact of the Built Environment on Creativity in Public Spaces of Dutch University Campuses and Science Parks. J. Urban Des. 2021, 27, 91–109. [Google Scholar] [CrossRef]
  43. Prandi, C.; Barricelli, B.R.; Mirri, S.; Fogli, D. Accessible Wayfinding and Navigation: A Systematic Mapping Study. Univers. Access Inf. Soc. 2021, 22, 185–212. [Google Scholar] [CrossRef]
  44. Lin, H.; Juan, Y.K.; Castro-Lacouture, D. Guiding Campus Building Design and Renovation through Design Quality Indicators and Post-Occupancy Evaluations. Ain Shams Eng. J. 2025, 16, 103457. [Google Scholar] [CrossRef]
  45. Pan, C.; Feng, X.; Wang, L.; Wu, M.; Wang, M. The Utilization and Accessibility of Campus Open Space: A Case Study of the West Campus of CAU. J. Asian Arch. Build. Eng. 2025, 1–12. [Google Scholar] [CrossRef]
  46. Ye, Z.; Ouyang, S.; Gao, X.; Ren, Y. Micro-Renovation Method of Old Residential Areas Based on Parametric Energy Simulation: An Aging Community in Middle China as an Example. Buildings 2025, 15, 758. [Google Scholar] [CrossRef]
  47. Darko, A.; Chan, A.P.; Ameyaw, E.E.; Owusu, E.K.; Pärn, E.; Edwards, D.J. Review of Application of Analytic Hierarchy Process (AHP) in Construction. Int. J. Constr. Manag. 2019, 19, 436–452. [Google Scholar] [CrossRef]
  48. Chakrabartty, S.N.; Chakrabartty, S.N. Scoring and Analysis of Likert Scale: Few Approaches. J. Knowl. Manag. Inf. Technol. 2014, 1, 31–44. [Google Scholar]
  49. Dai, F.; Zhang, J. The Survey Methods in Planning and Design 1-Questionnaire Survey (Theory Par). Chin. Landsc. Archit. 2008, 154, 82–87. [Google Scholar]
Figure 1. Design method flow chart.
Buildings 15 02377 g001
Figure 2. Background of 51 participants.
Buildings 15 02377 g002
Figure 3. Main types of activities users engage in within the public spaces.
Buildings 15 02377 g003
Figure 4. Use frequency of different public spaces.
Buildings 15 02377 g004
Figure 5. Survey results on spatial accessibility: (a) cross-analysis of arrival modes and upper–lower line of sights; and (b) evaluation of the sense of direction of interior space by users of different office sizes.
Buildings 15 02377 g005
Figure 6. Survey results on spatial accessibility: (a) evaluation of spaciousness of entrance spaces by users in different office; (b) evaluation of comfort of rest areas by users with different arrival modes; (c) evaluation of transparency of atrium spaces by users with different arrival modes; and (d) evaluation of spaciousness of corridor spaces by users in different office.
Buildings 15 02377 g006
Figure 7. Survey results on spatial accessibility: (a) stairs and elevators in the floor plan; and (b) the transparent elevator located at the entrance transportation center.
Buildings 15 02377 g007
Figure 8. Survey results on spatial accessibility: (a) evaluation of the convenience of the wayfinding system by users with different identities; (b) evaluation of satisfaction with the cultural attributes of public spaces by users with different identities; (c) evaluation of satisfaction with the decorative style of public spaces by users of different identities; and (d) evaluation of the sufficiency of public seating and gathering areas by users with different identities.
Buildings 15 02377 g008
Figure 9. Survey results on the satisfaction of nodal spaces: (a) evaluation of space for study and research by users with different identities; and (b) evaluation of space for dining and social by users with different identities.
Buildings 15 02377 g009
Figure 10. Survey results on the satisfaction of nodal spaces: (a) evaluation of space for study and research by users with different identities; and (b) evaluation of space for events and display by users in different offices.
Buildings 15 02377 g010
Figure 11. Survey results on the comfort of nodal spaces: (a) evaluation of the comfort of indoor acoustic environment by users with different identities; and (b) evaluation of the privacy of spaces by users in different offices.
Buildings 15 02377 g011
Table 1. Pre- and Post-renovation of Public Spaces.
BeforeBuildings 15 02377 i001Buildings 15 02377 i002Buildings 15 02377 i003Buildings 15 02377 i004
AfterBuildings 15 02377 i005Buildings 15 02377 i006Buildings 15 02377 i007Buildings 15 02377 i008
Entrance SpacesAtrium SpacesTraffic SpaceCorridor and Rest Spaces
Table 2. Floor Plan of The Center for Balance Architecture.
Buildings 15 02377 i009Buildings 15 02377 i010Buildings 15 02377 i011
Interior First Floor Plan LobbyFirst Floor PlanSecond Floor Plan
Buildings 15 02377 i012Buildings 15 02377 i013Buildings 15 02377 i014
Third Floor PlanFourth Floor PlanFifth Floor Plan
Table 3. Descriptive statistics of users’ satisfaction in public spaces.
Evaluation IndicatorsNo.FactorsMeanVariance
Accessibility (E1)F1Horizontal accessibility at different locations on the same floor4.430.330
F2Vertical accessibility between floors4.220.453
F3Visual permeability within the same floor4.350.393
F4Visual permeability between floors4.270.563
F5Connectivity of different spaces on the same floor4.080.594
Comprehensibility (E2)F6Rationality of the location of the wayfinding system3.900.970
F7Comprehensibility of the content of the wayfinding system4.100.730
F8Convenience of the wayfinding system3.980.820
Interaction and Culturality (E3)F9Interactivity of spaces3.960.718
F10Sufficiency of public seating and gathering areas4.240.584
F11Satisfaction with the decorative style of public spaces4.040.638
F12Satisfaction with the cultural attributes of public spaces4.041.038
Space Node (E4)F13Spaciousness of entrance spaces4.630.358
F14Comfort of rest areas4.650.273
F15Transparency of atrium spaces4.610.363
F16Spaciousness of corridor spaces4.610.323
F17Convenience of vertical elevator distribution4.390.683
F18Convenience of staircase distribution4.390.483
Comfort (E5)F19Comfort of indoor physical environment4.430.410
F20Comfort of indoor light environment4.290.532
F21Comfort of indoor acoustic environment4.101.010
F22Comfort of indoor furniture and seating4.390.443
F23Privacy of spaces3.470.974
Functionality (E6)F24Space for study and research4.220.493
F25Space for communication and discussion4.200.601
F26Space for event and display4.330.507
F27Space for meeting and negotiation4.350.673
F28Space for rest and recreation4.000.760
F29Space for dining and social3.900.930
General satisfaction (F30)4.410.287
Table 4. Correlation matrix between personal background and satisfaction in each dimension of space.
Evaluation IndicatorsNo.FactorsIdentityGenderAgeFloorArrival MethodUsage TimeSpace Size
Accessibility (E1)F1Horizontal accessibility at different locations on the same floor0.2780.5220.2770.3160.1440.3270.063
F2Vertical accessibility between floors0.2920.7320.8360.9980.3320.9550.179
F3Visual permeability within the same floor0.2300.5560.2690.7230.1500.7950.172
F4Visual permeability between floors0.6500.6960.4890.3510.031 *0.5930.089
F5Connectivity of different spaces on the same floor0.2240.8760.1800.6740.1520.2750.042 *
Comprehensibility (E2)F6Rationality of the location of the wayfinding system0.1130.3990.4460.4910.2580.7270.072
F7Comprehensibility of the content of the wayfinding system0.0630.6120.0870.6020.0640.3550.848
F8Convenience of the wayfinding system0.019 *0.8880.1660.6940.0560.2460.881
Interaction & Culturality (E3)F9Interactivity of spaces0.4000.0650.6480.7420.4150.2670.966
F10Sufficiency of public seating and gathering areas0.034 *0.5320.7960.4080.2780.2440.798
F11Satisfaction with the decorative style of public spaces0.010 **0.2060.3350.2700.3350.8200.994
F12Satisfaction with the cultural attributes of public spaces0.035 *0.3030.3530.9961.0000.5240.027 *
Space Node (E4)F13Spaciousness of entrance spaces0.1590.2660.5610.7680.2380.9000.035 *
F14Comfort of rest areas0.1440.9270.8140.0570.005 **0.5290.237
F15Transparency of atrium spaces0.2510.6650.2130.2290.019 *0.0600.022 *
F16Spaciousness of corridor spaces0.0620.9190.4920.0990.1450.2470.012 *
F17Convenience of vertical elevator distribution0.0680.3930.1180.381<0.001 ***0.6300.062
F18Convenience of staircase distribution0.7150.3830.8220.2380.1500.0920.097
Comfort (E5)F19Comfort of indoor physical environment0.8270.3580.9690.2470.2720.5290.132
F20Comfort of indoor light environment0.4440.6860.8600.3230.2580.6550.294
F21Comfort of indoor acoustic environment0.042 *0.4930.9070.9420.4420.9770.923
F22Comfort of indoor furniture and seating0.5600.7910.5030.1570.9910.6830.011 *
F23Privacy of spaces0.4060.9370.5650.4350.7390.1880.747
Functionality (E6)F24Space for study and research0.008 **0.8090.7320.9290.6890.5170.163
F25Space for communication and discussion0.1840.1570.5660.6820.2520.9550.264
F26Space for event and display0.0700.0820.4070.7950.1360.5530.020 *
F27Space for meeting and negotiation0.1070.1340.8190.3810.6730.7160.115
F28Space for rest and recreation0.0690.4890.7310.7980.1910.1660.318
F29Space for dining and social0.012 *0.2890.050 *0.9660.0650.2320.291
General satisfaction (F30)0.0660.4160.0760.1270.017 *0.2560.277
p-values are asymptotically significant and when p-value < 0.01, it indicates a significant difference. * Indicates a significant correlation (i.e., p value < 0.05) at the 0.05 level (two-tailed). ** Indicates a highly significant correlation (i.e., p-value <0.01) at the 0.01 level (two-tailed). *** Indicates a highly significant correlation (i.e., p-value < 0.001) at the 0.001 level (two-tailed).
Table 5. Simulation results of spatial integration degree on different floors.
FloorBefore RenovationAfter Renovation
First Floor Plan Global Integration Local Integration Global Integration Local Integration
Buildings 15 02377 i015Buildings 15 02377 i016Buildings 15 02377 i017Buildings 15 02377 i018
MeanMaxMinMeanMaxMinMeanMaxMinMeanMaxMin
0.8331.3940.4861.2262.6470.3330.9911.6290.5741.3513.3620.333
Second Floor PlanGlobal IntegrationLocal IntegrationGlobal IntegrationLocal Integration
Buildings 15 02377 i019Buildings 15 02377 i020Buildings 15 02377 i021Buildings 15 02377 i022
MeanMaxMinMeanMaxMinMeanMaxMinMeanMaxMin
1.0431.9300.6811.2312.2500.5661.1652.1060.8131.4712.4000.682
Third Floor Plan Global IntegrationLocal IntegrationGlobal IntegrationLocal Integration
Buildings 15 02377 i023Buildings 15 02377 i024Buildings 15 02377 i025Buildings 15 02377 i026
MeanMaxMinMeanMaxMinMeanMaxMinMeanMaxMin
0.9371.5730.6481.3012.6720.3331.1201.8360.7571.4212.6930.670
Table 6. Simulation results of the flow of people on different floors.
FloorFirst Floor PlanSecond Floor PlanThird Floor Plan
Before
Renovation
Buildings 15 02377 i027Buildings 15 02377 i028Buildings 15 02377 i029
After RenovationBuildings 15 02377 i030Buildings 15 02377 i031Buildings 15 02377 i032
Table 7. Simulation results of the degree of visual integration on different floors.
FloorBefore RenovationAfter Renovation
First Floor PlanBuildings 15 02377 i033Buildings 15 02377 i034
MeanMaxMinMeanMaxMin
5.60109.78522.18496.652910.72002.5472
Second Floor PlanBuildings 15 02377 i035Buildings 15 02377 i036
MeanMaxMinMeanMaxMin
5.75019.11972.50654.66327.76781.8245
Third Floor PlanBuildings 15 02377 i037Buildings 15 02377 i038
MeanMaxMinMeanMaxMin
3.84797.66672.14423.03894.79691.5701
Table 8. Linear regression analysis results of the degree of spatial dissociation on different floors.
FloorFirst Floor PlanSecond Floor PlanThird Floor Plan
BeforeBuildings 15 02377 i039Buildings 15 02377 i040Buildings 15 02377 i041
R2 = 0.5299R2 = 0.8833R2 = 0.6250
Y = 1.757*X − 0.2376Y = 1.395*X − 0.2250Y = 1.799*X − 0.3851
After Buildings 15 02377 i042Buildings 15 02377 i043Buildings 15 02377 i044
R2 = 0.4730R2 = 0.8048R2 = 0.8117
Y = 1.387*X − 0.02356Y = 1.398*X − 0.1826Y = 1.206*X + 0.01365
Disclaimer/Publisher’s Note: The statements, opinions and data contained in all publications are solely those of the individual author(s) and contributor(s) and not of MDPI and/or the editor(s). MDPI and/or the editor(s) disclaim responsibility for any injury to people or property resulting from any ideas, methods, instructions or products referred to in the content.

