
Flexible Behavior of Transverse Joints in Full-Scale Precast Concrete Slabs with Open-Type Joint Method


Abstract
1. Introduction
2. Materials and Methods
2.1. Fabrication
2.2. Experimental Result
3. Finite Element Analysis
3.1. 3D Modeling
3.2. FEA Result
4. Property Prediction Models
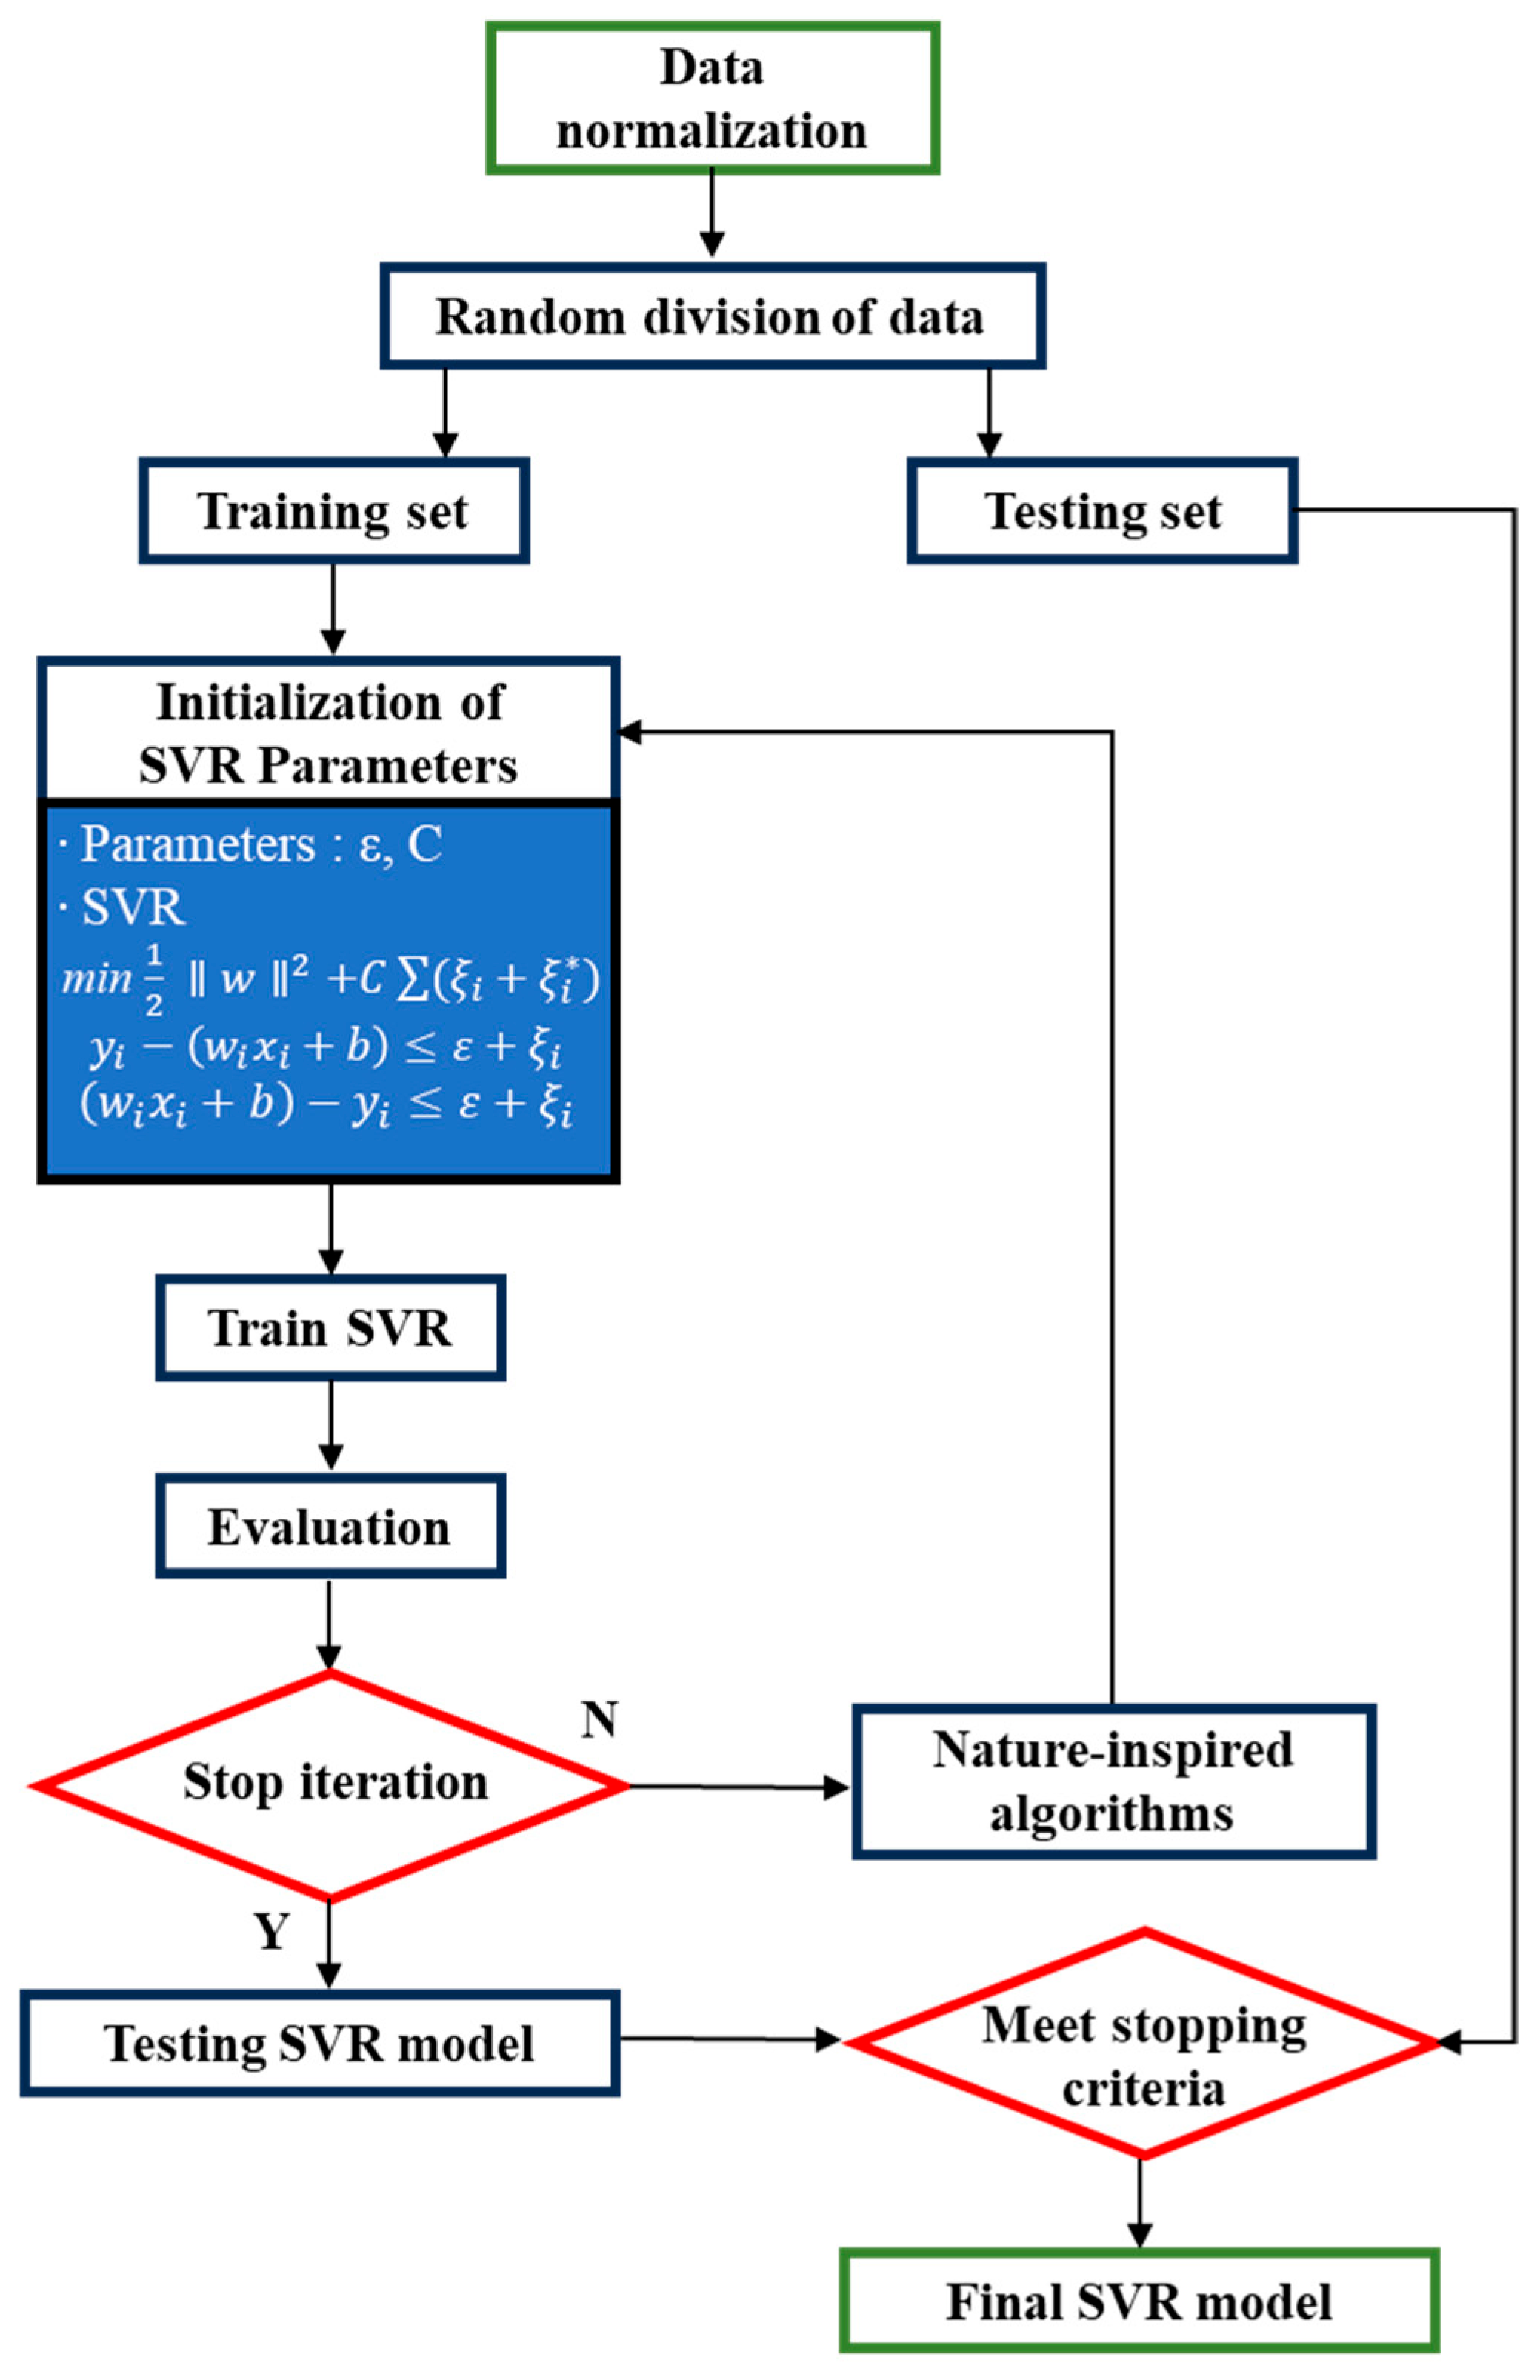
4.1. Support Vector Regression (SVR) Model
4.2. Model Training
4.3. Prediction Result
5. Conclusions
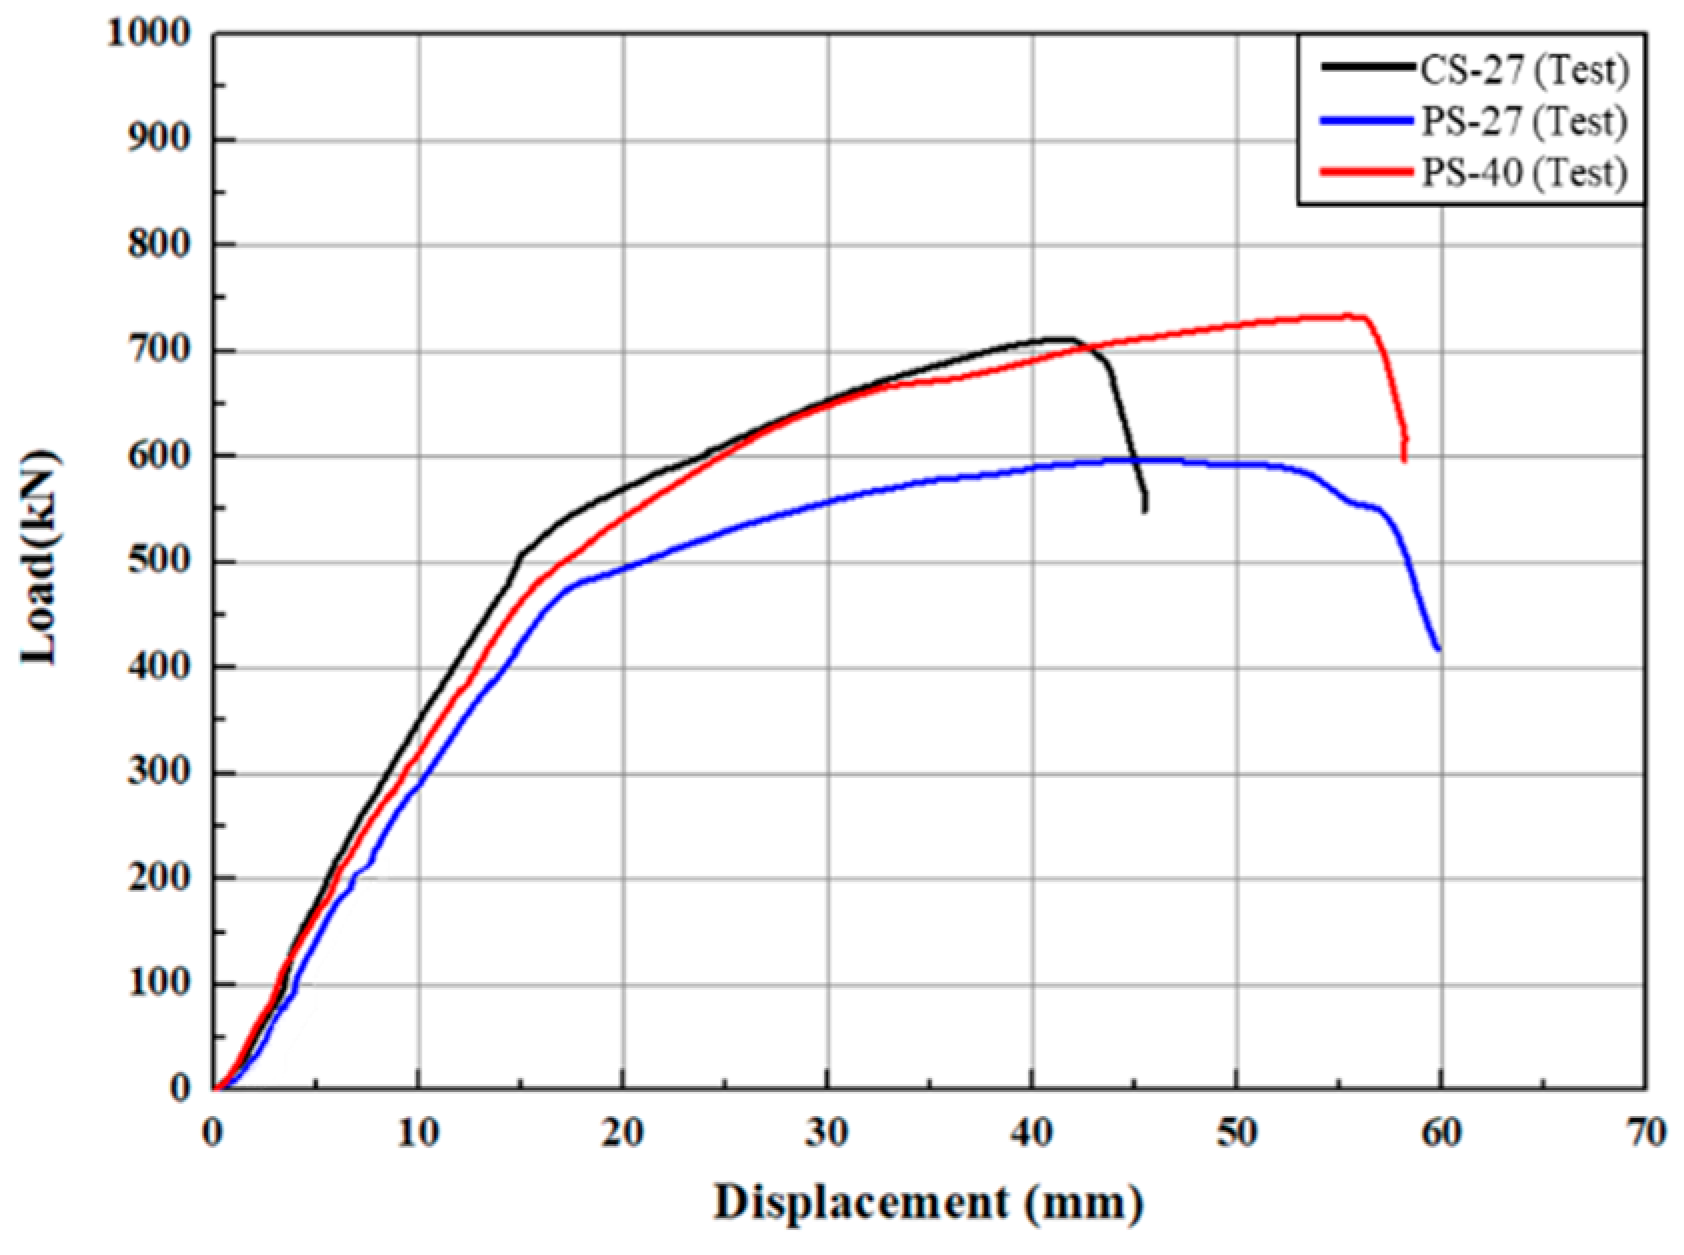
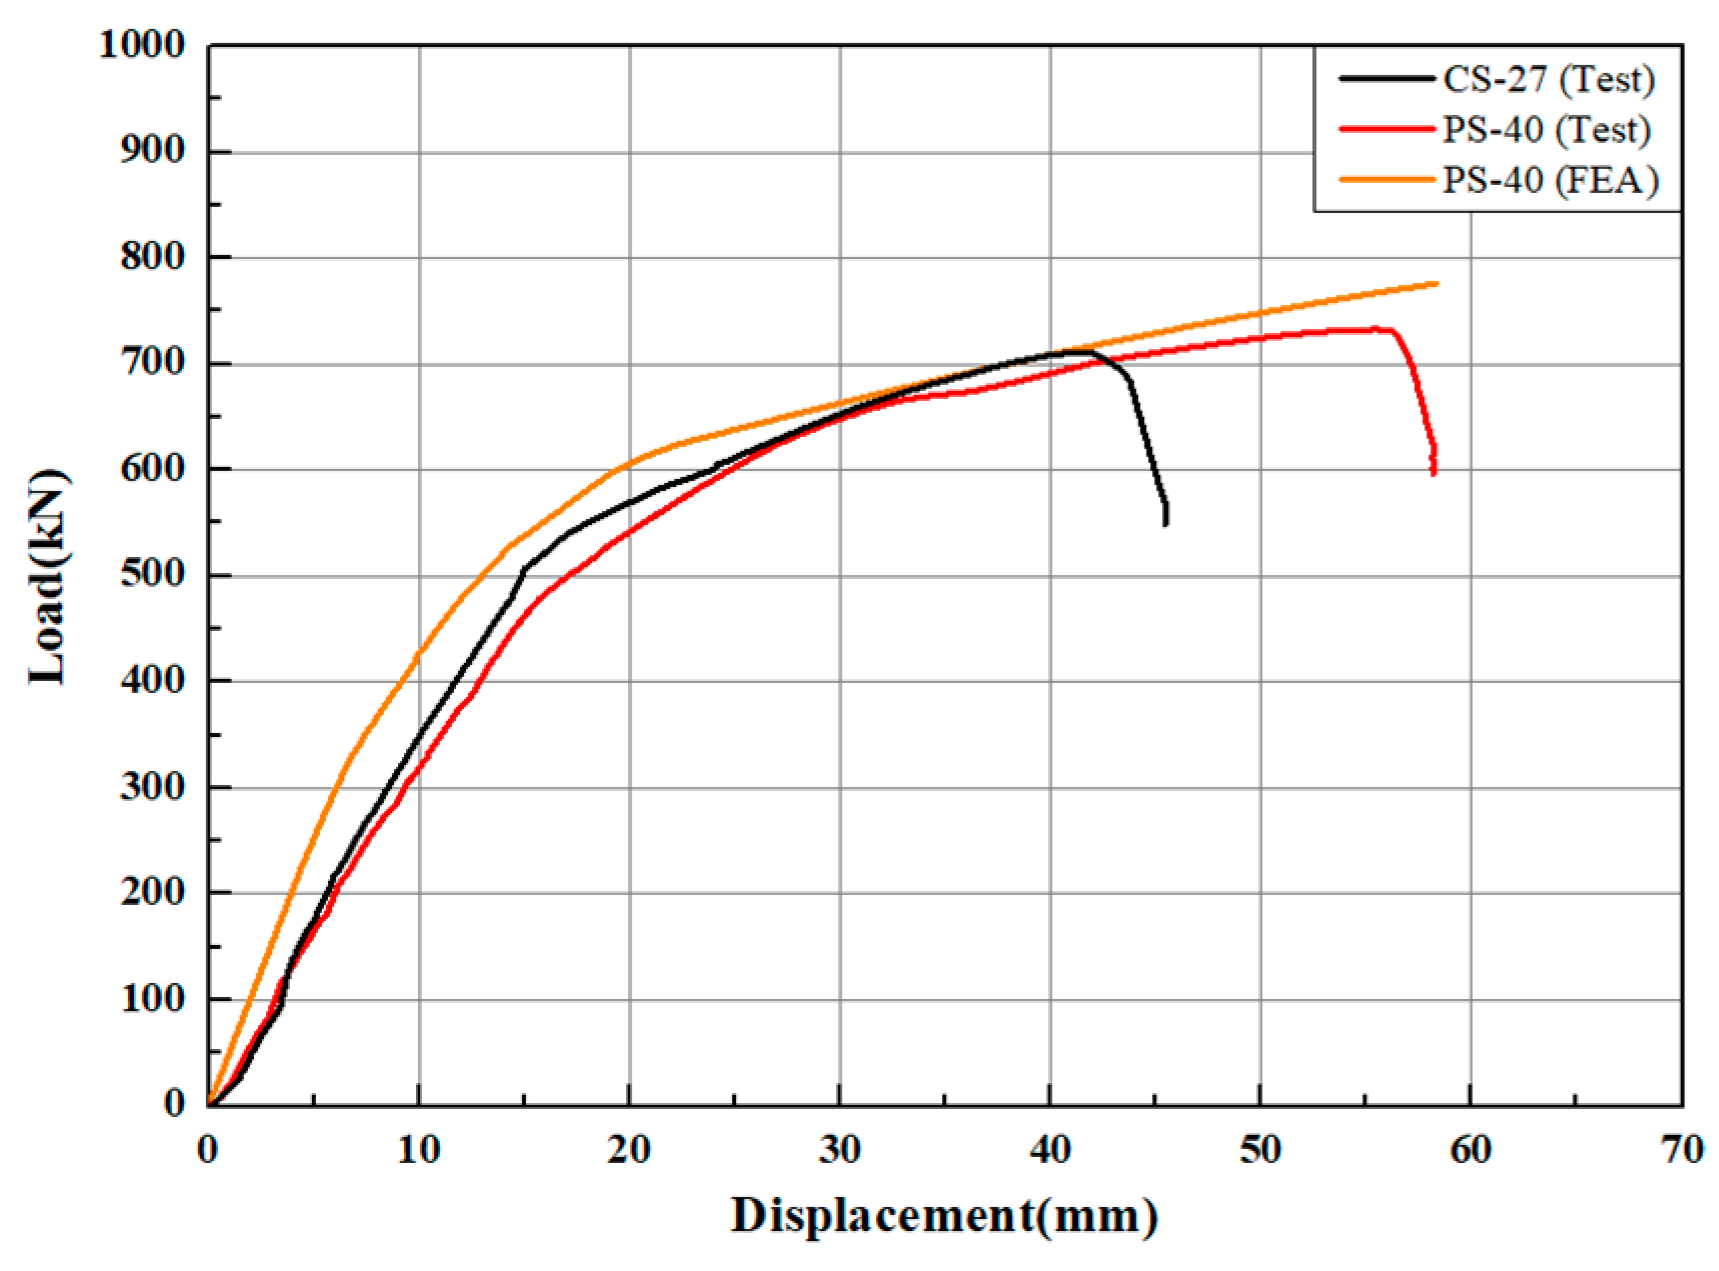
- PS-27 had a yield load measured at 480 kN and a maximum load of 600 kN, showing the lowest structural performance among the specimens. The yield load and the maximum load of CS-27 were measured at 500 kN and 710 kN, respectively. The yield load of PS-40 was 550 kN, and the maximum load was measured at 730 kN. PS-40 experienced relatively more deflection, but the structural behavior in the maximum load interval was similar to that of CS-27. Therefore, if the strength of the non-shrinkage concrete is 40 MPa or higher, the PS joint using the open-type joint method can achieve a structural performance level similar to that of the slab joint using the CIP method.
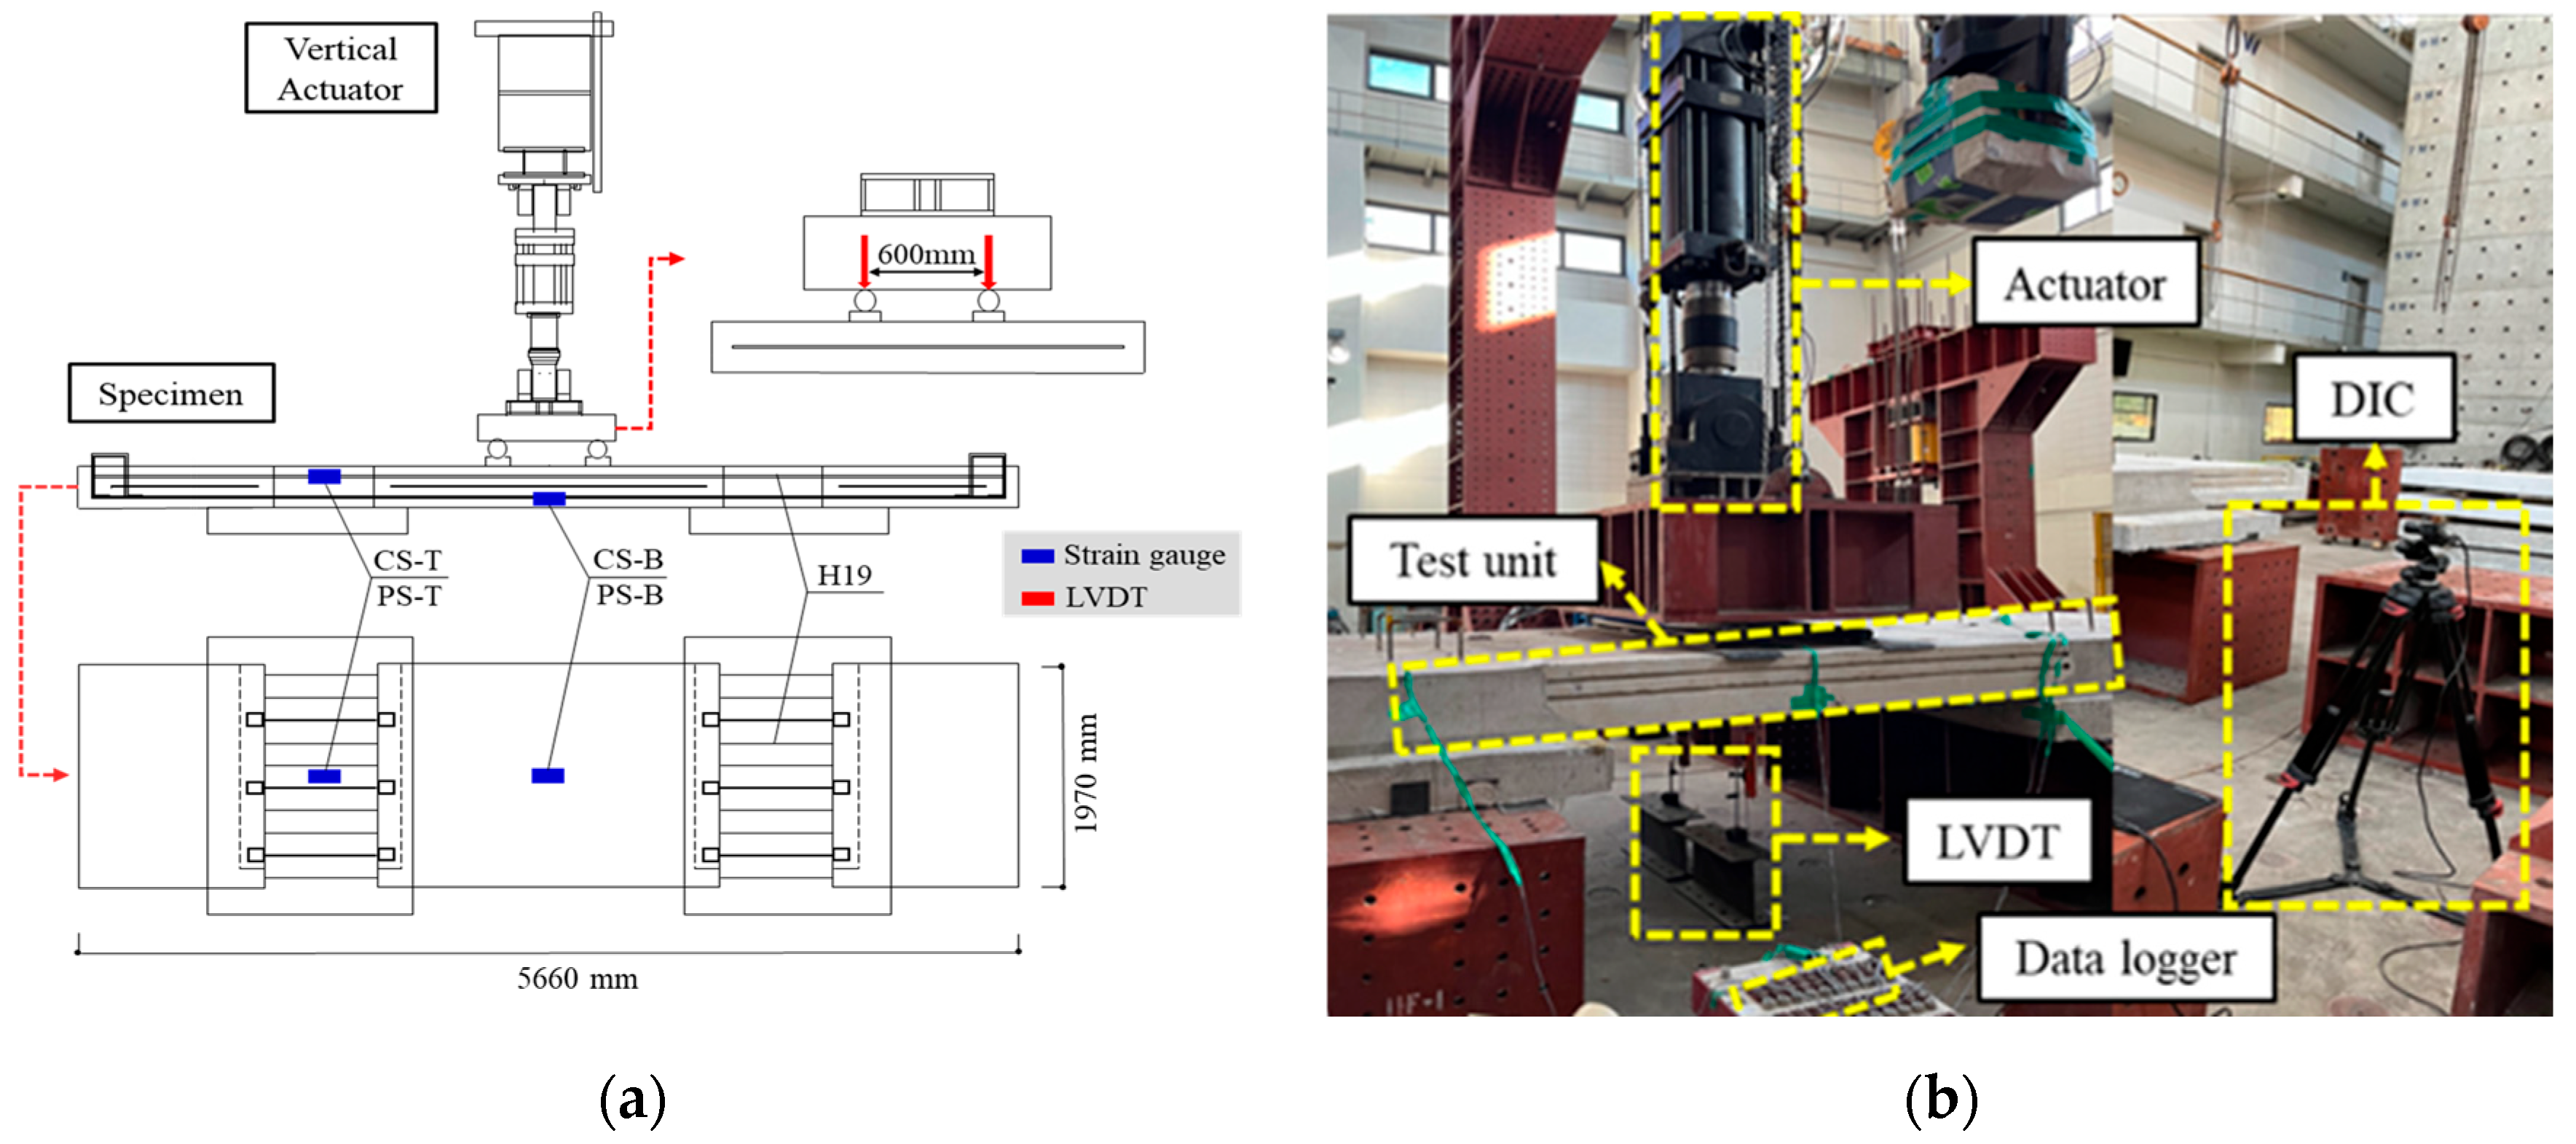
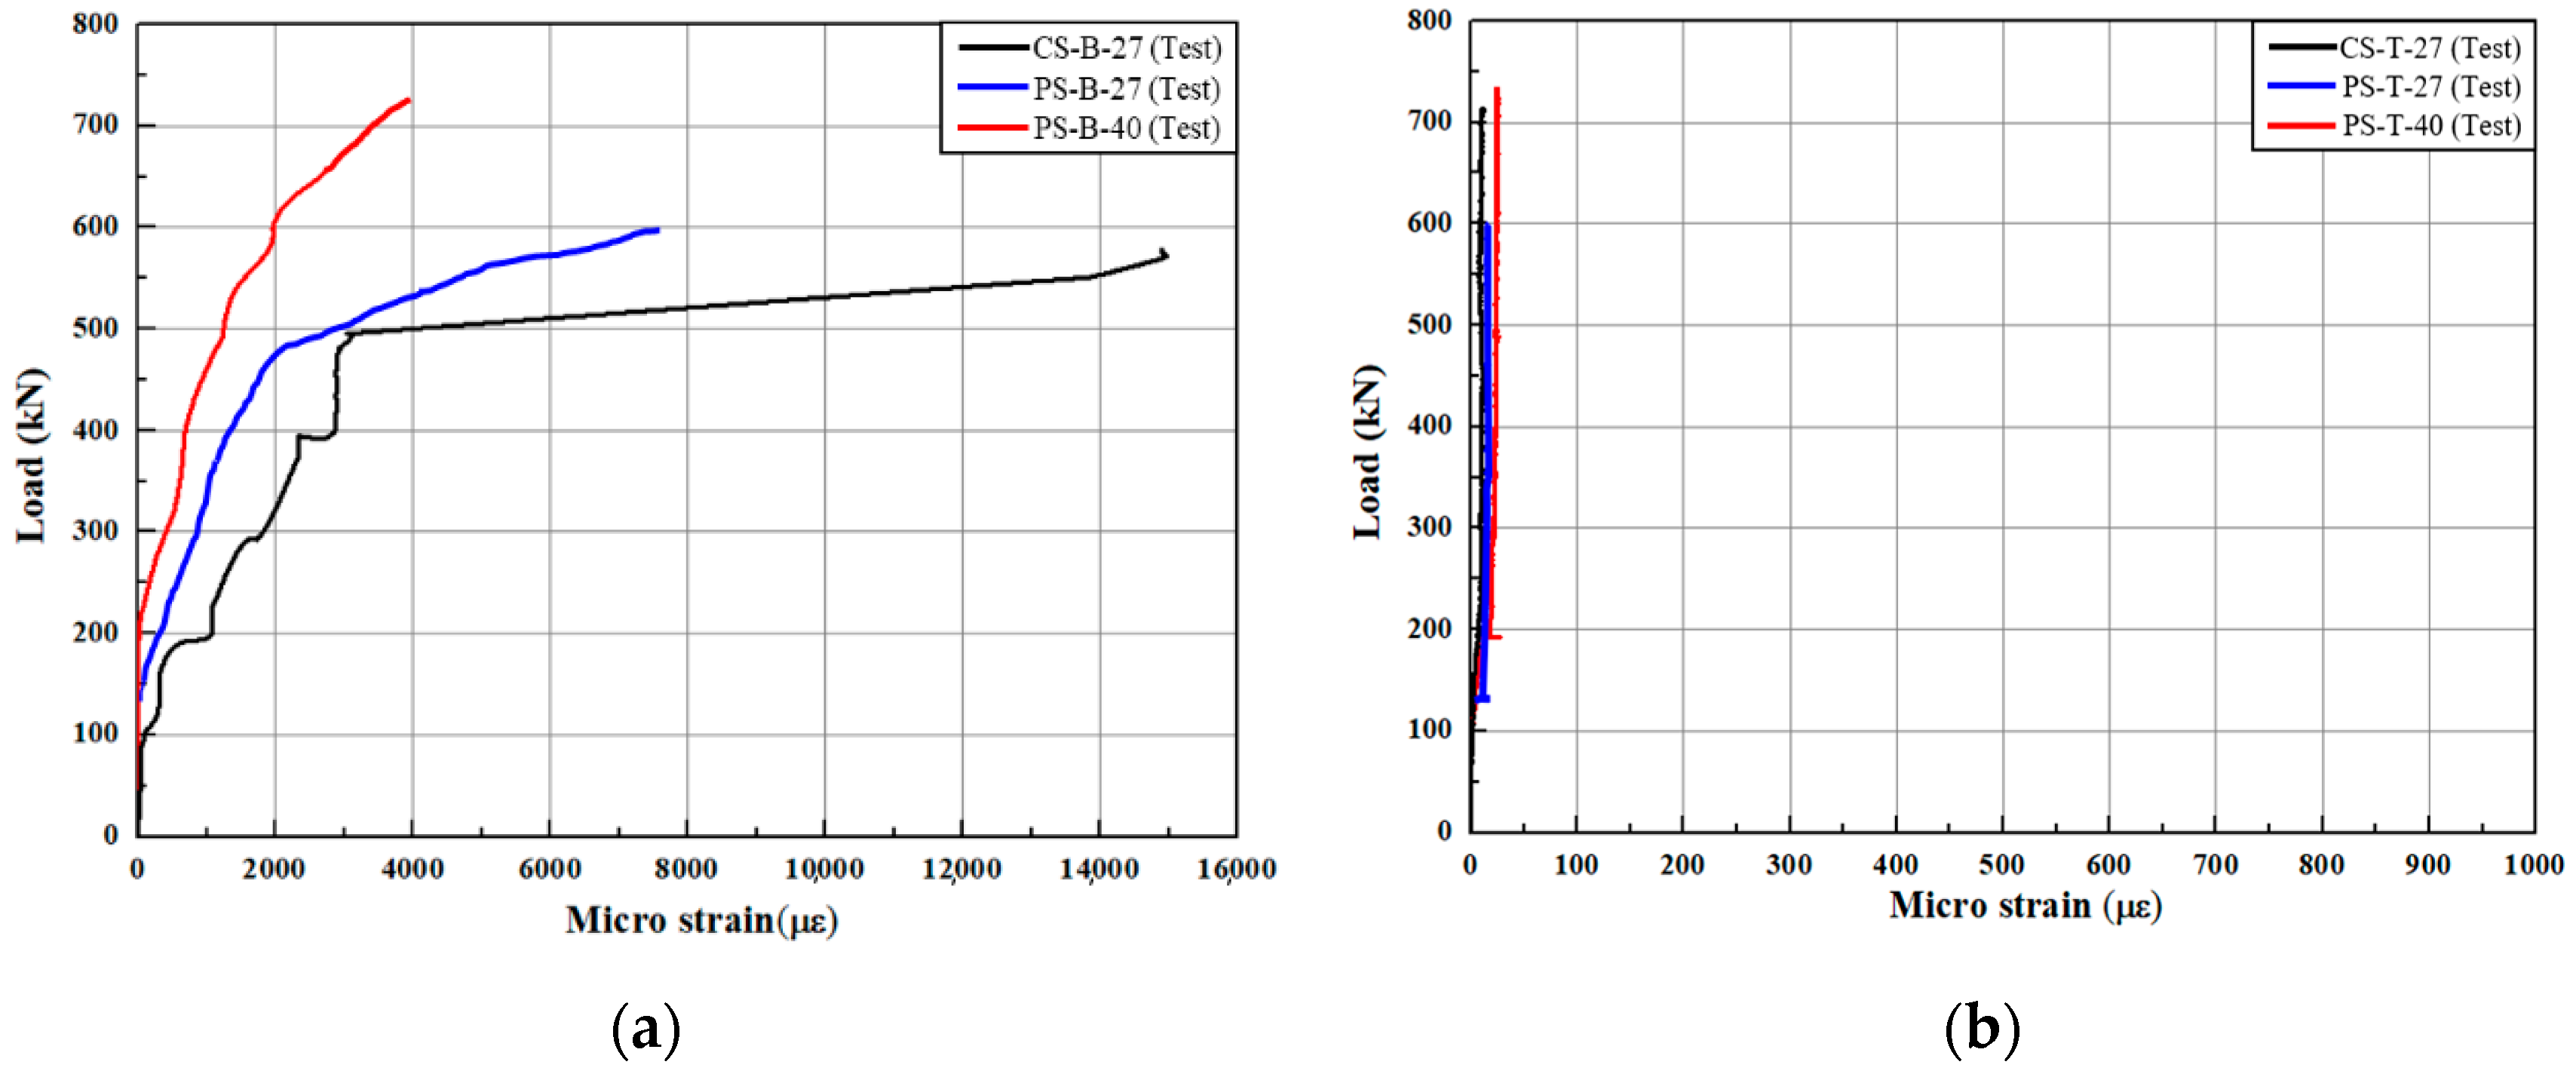
- CS-B-27 (test) showed the highest strain of approximately 3000 με when the load was 480 kN. After the rebar yielded, the strain increased sharply, resulting in somewhat unfavorable behavior in terms of structural stability. In contrast, PS-B-40 (test) showed the lowest strain of approximately 1100 με when the load was 480 kN, indicating relatively excellent deformation resistance performance under load. The strain measured at the top of the joint of the PS was found to be a maximum of 25 με or less in all specimens, confirming that the joint behaves structurally as a single entity. Therefore, PS-40, which applies the open-type joint method, can achieve structural performance similar to CS-27 in terms of structural and joint performance.
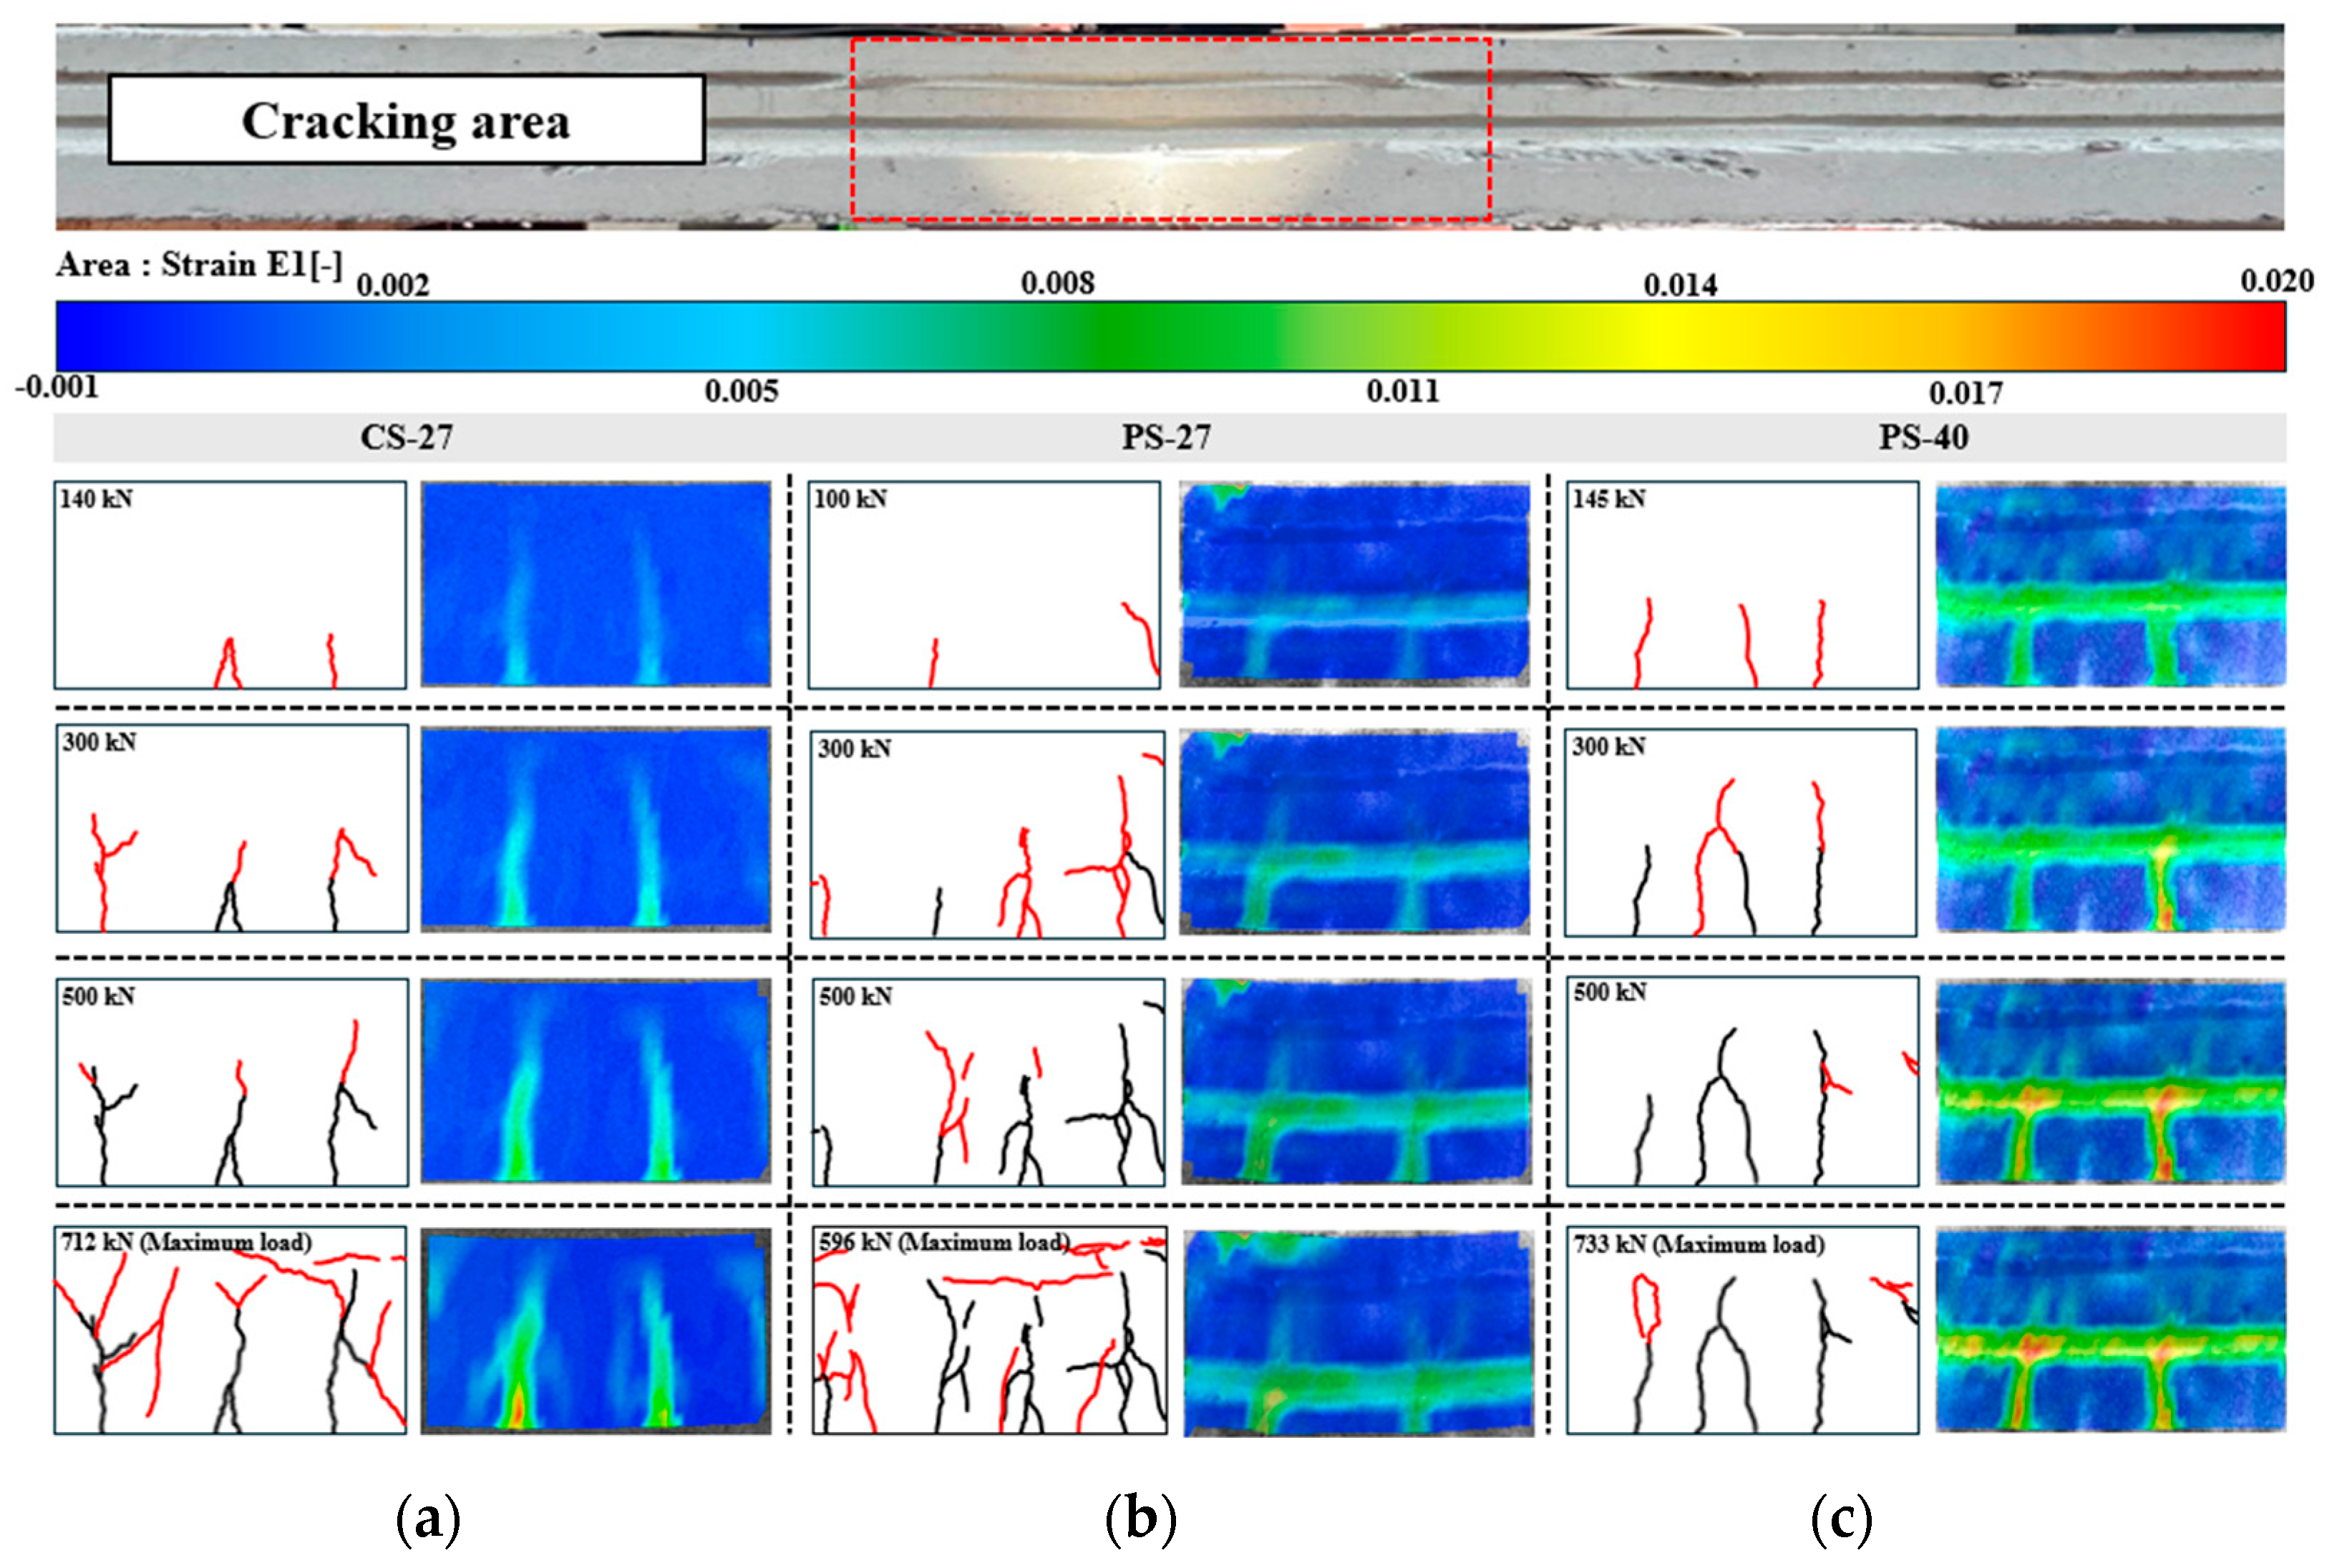
- As a result of the DIC analysis, the strain of PS-40 was evenly distributed across the slab. In contrast, in CS-27, the strain was locally concentrated in the center and increased sharply. Furthermore, in the final failure mode, PS-40 exhibited relatively fewer cracks compared to CS-27. Therefore, the PS-40, which applies the open-type joint method, has superior load distribution capability compared to the CS-27 and can secure better performance in terms of structural stability.
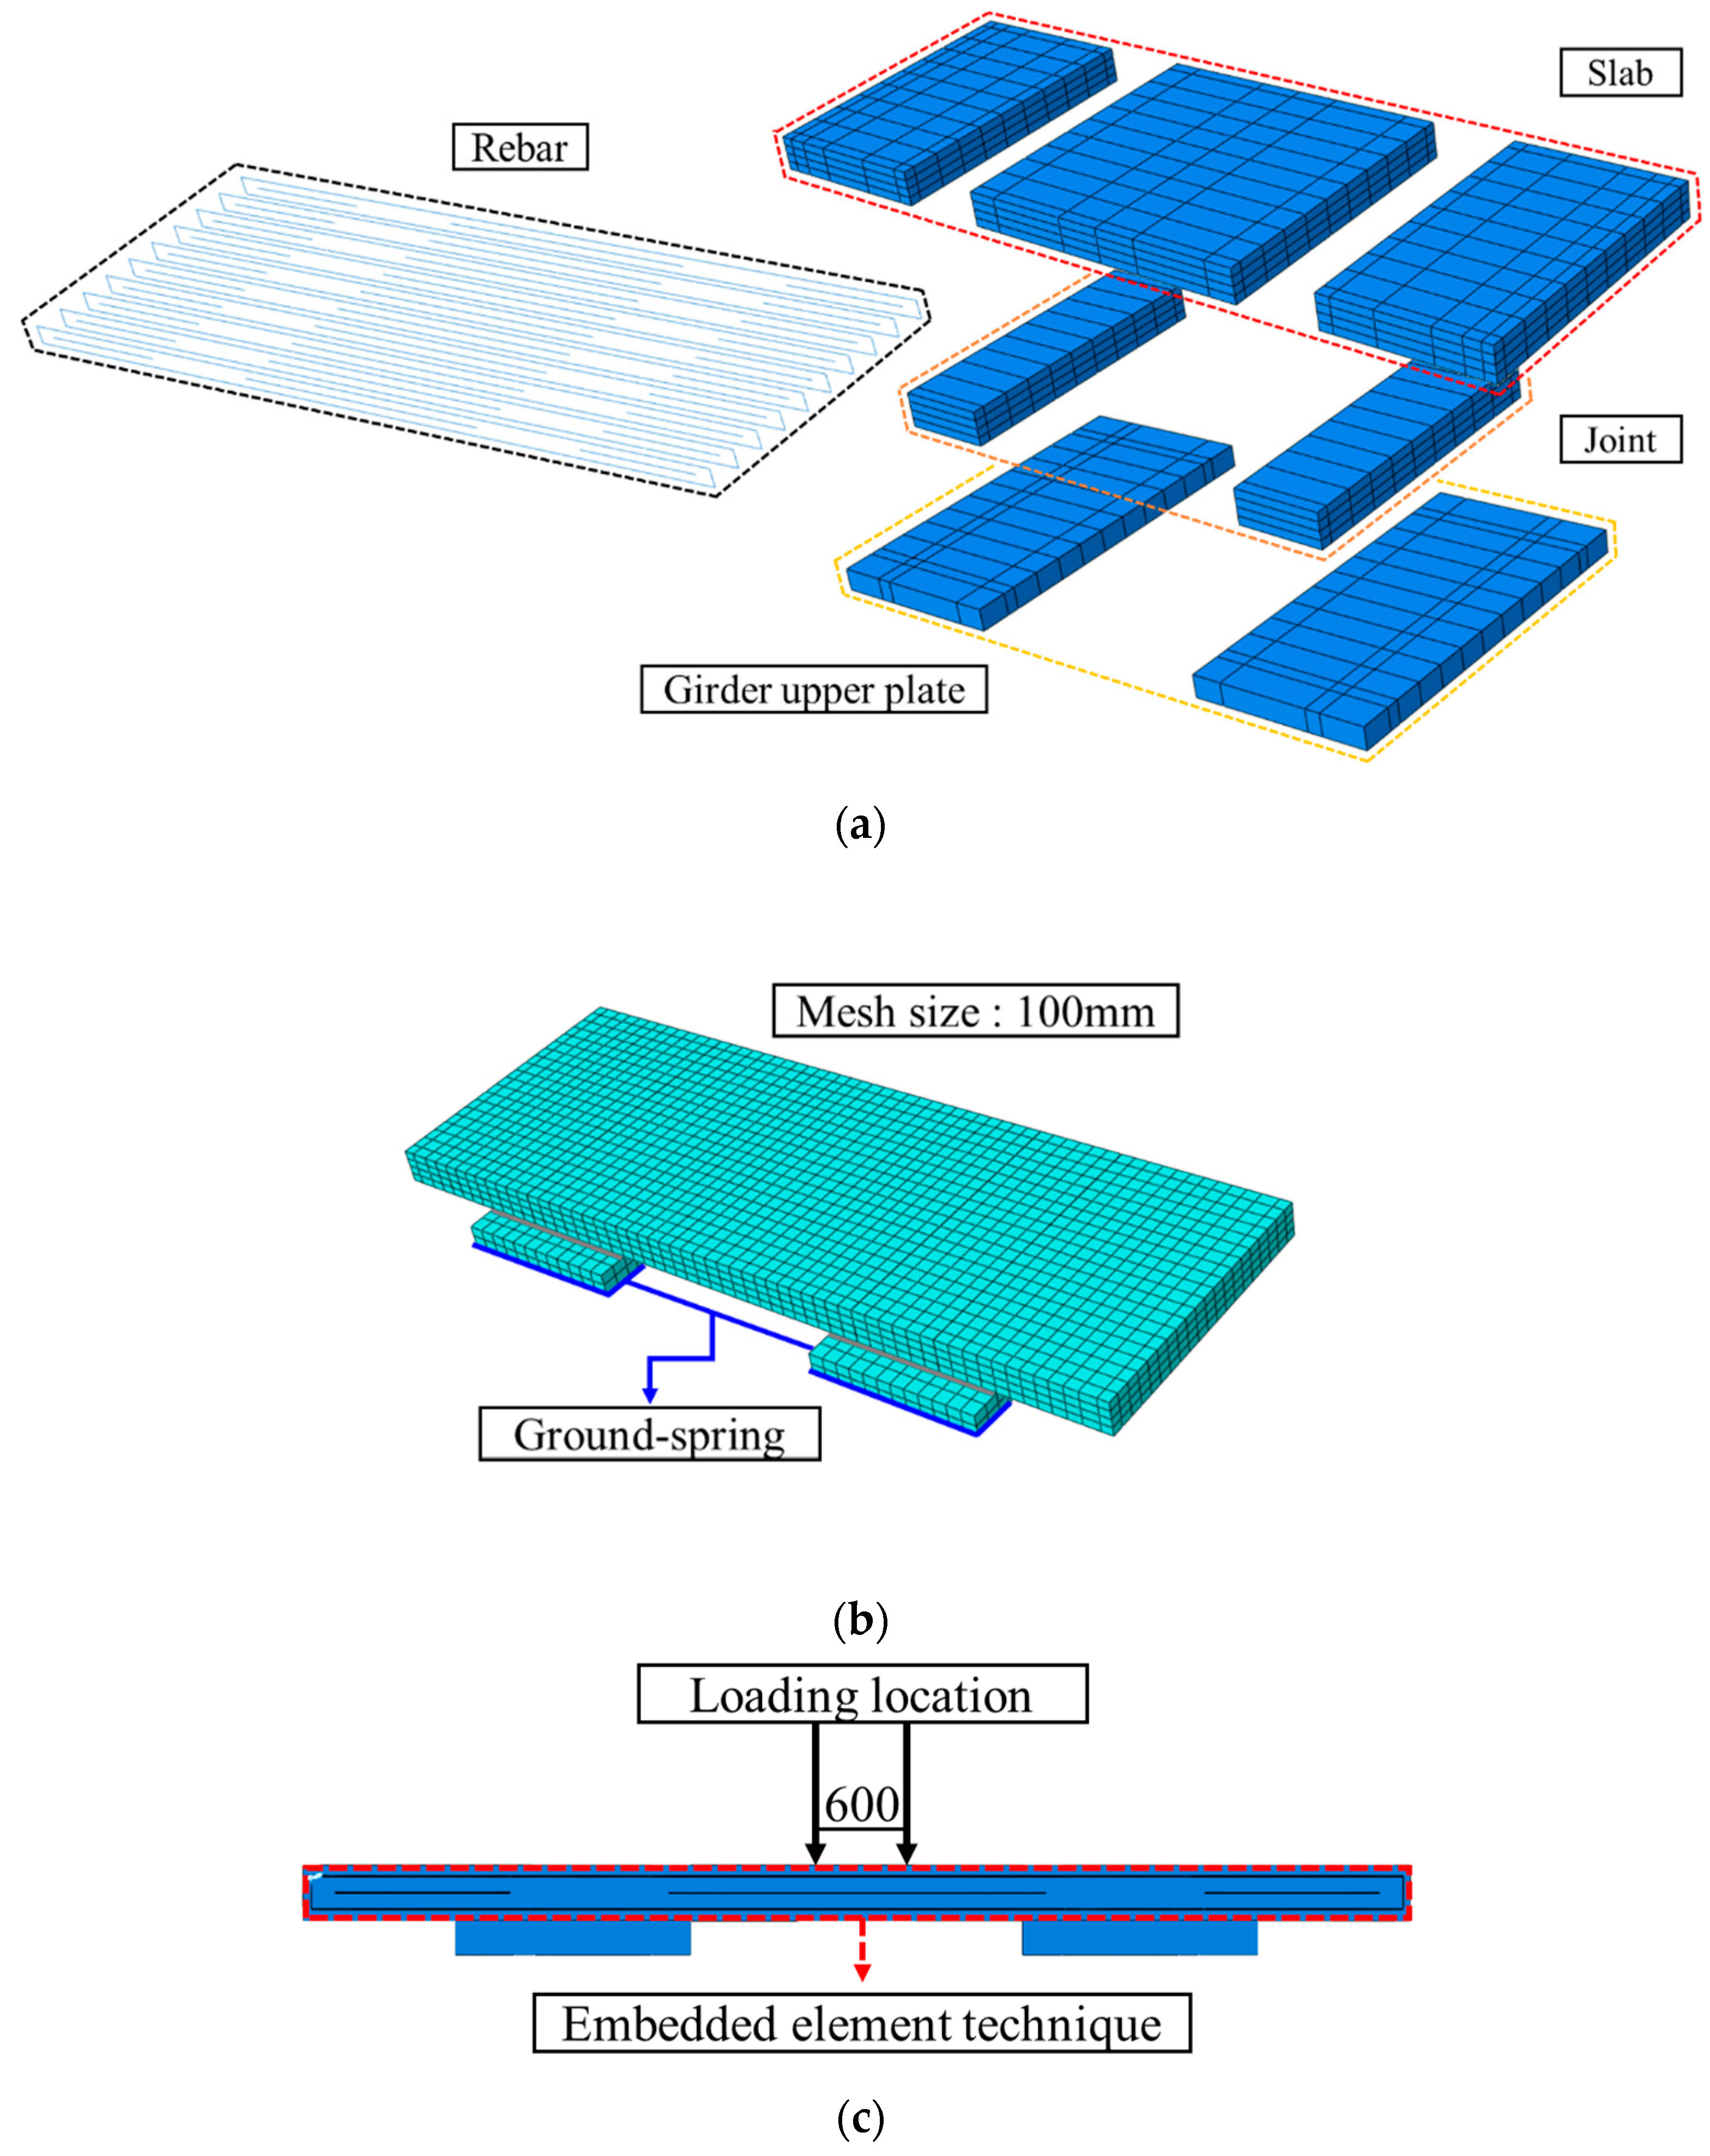
- The load-relative displacement curve of PS-40 (FEA) and the overall crack pattern of PS-40 (FEA) were similar to the results of the four-point loading test, with a relative error in displacement within 5%. Therefore, FEA is a useful method for verifying structural designs because it can accurately predict the structural behavior of the transverse joint of a PS.
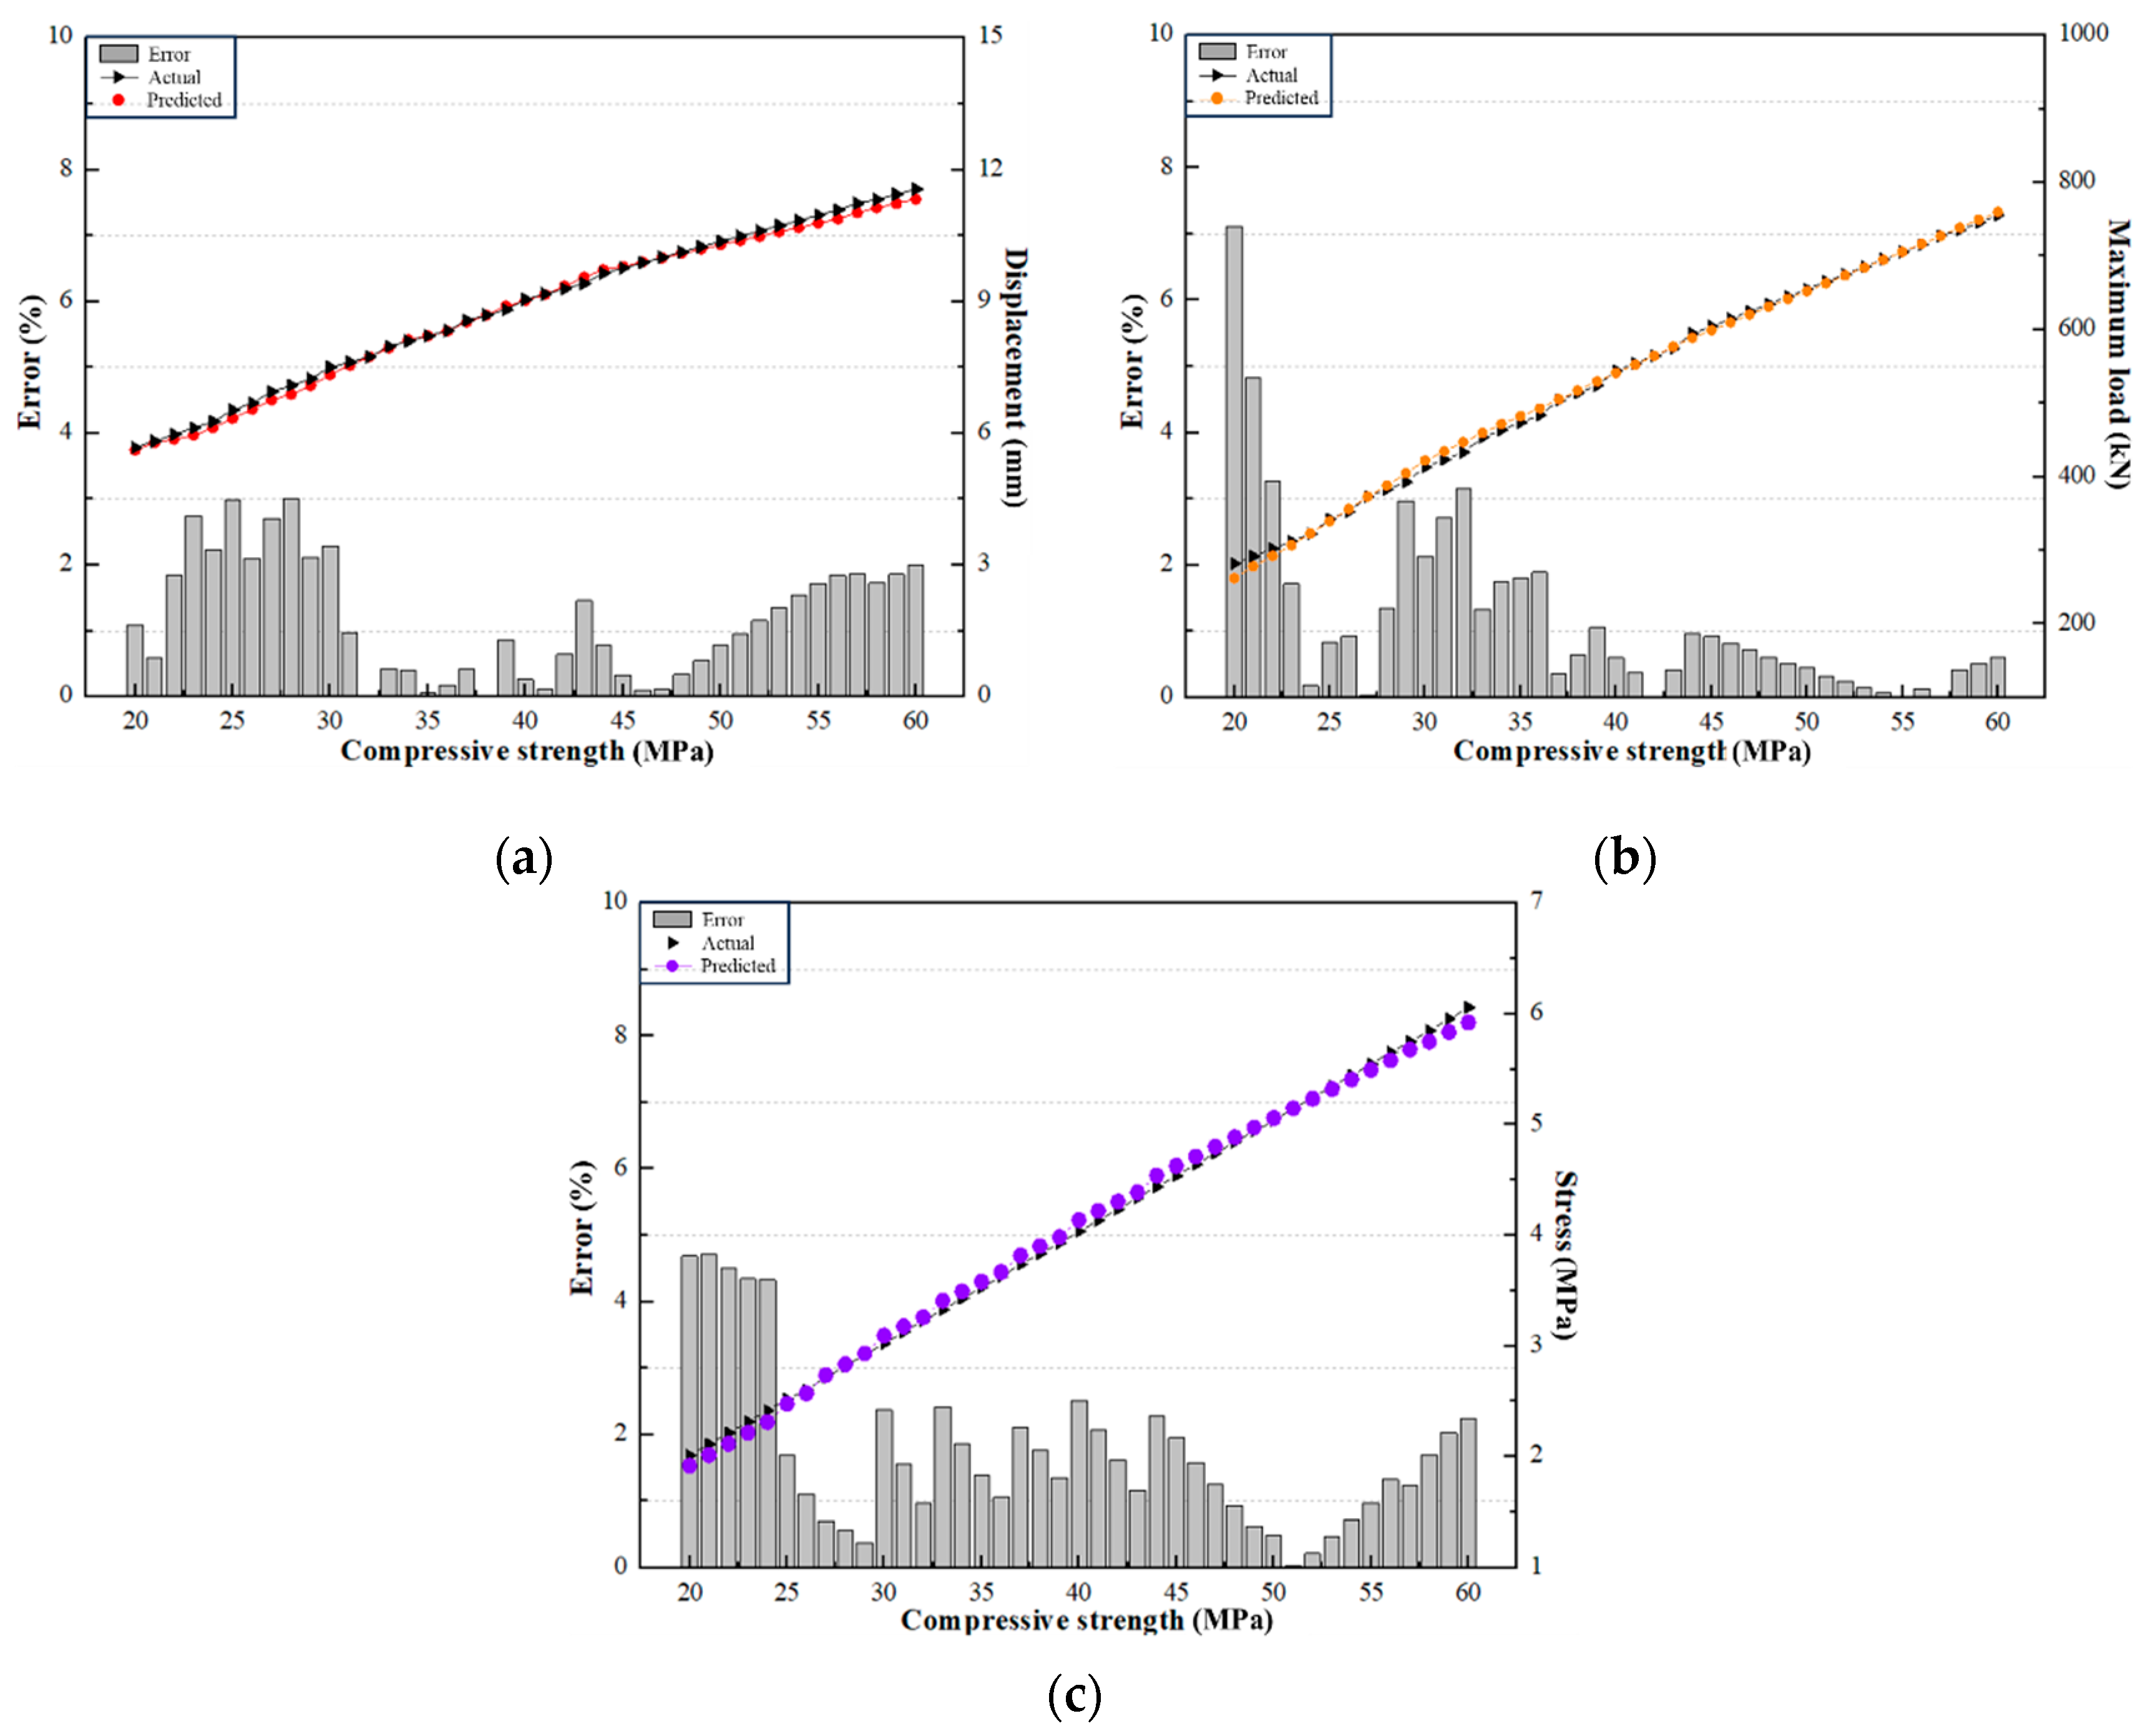
- The SVR-based two-stage prediction model was confirmed to predict displacement, maximum load, and stress values with high accuracy using minimal data. In addition, the error rate was reduced to around 3% in the interval beyond 25 MPa. Therefore, SVR can be used as a method to provide material properties during the structural design phase, thereby saving time and costs.
Author Contributions
Funding
Data Availability Statement
Conflicts of Interest
Abbreviations
| FEA | Finite element analysis |
| CIP | Cast in place |
| ML | Machine learning |
| 1ELM | Extreme learning machine |
| ANN | Artificial neural network |
| SVM | Support vector machine |
| EA | Evolutionary algorithm |
| SVR | Support vector regression |
| DIC | Digital image correlation |
| LVDT | Linear variable displacement transducer |
| MSE | Mean squared error |
References
- Jang, J.; Jeong, E.; Cho, J.; Kim, T.W. Exploring simultaneous effects of delay factors in precast concrete installation. Buildings 2024, 14, 3894. [Google Scholar] [CrossRef]
- Wang, C.; Liu, M.; Hsiang, S.M.; Leming, M.L. Causes and penalties of variation: Case study of a precast concrete slab production facility. J. Constr. Eng. Manag. 2012, 138, 775–785. [Google Scholar] [CrossRef]
- Kim, Y.B.; Kim, S.M. In situ experimental analysis and performance evaluation of airport precast concrete pavement system subjected to environmental and moving airplane loads. Materials 2024, 17, 5316. [Google Scholar] [CrossRef]
- Sayed Ahmed, M.; Sennah, K.; Afefy, H.M. Fatigue and ultimate strength evaluation of GFRP-reinforced, laterally-restrained, full-depth precast deck panels with developed UHPFRC-filled transverse closure strips. Appl. Sci. 2024, 14, 8806. [Google Scholar] [CrossRef]
- Chang, R.; Zhang, N.; Gu, Q. A review on mechanical and structural performances of precast concrete buildings. Buildings 2023, 13, 1575. [Google Scholar] [CrossRef]
- Shi, X.; Rong, X.; Nan, L.; Wang, L.; Zhang, J. A new steel-joint precast concrete frame structure: The design, key construction techniques, and building energy efficiency. Buildings 2022, 12, 1974. [Google Scholar] [CrossRef]
- Vella, J.P.; Vollum, R.L.; Jackson, A. Investigation of headed bar joints between precast concrete panels. Eng. Struct. 2017, 138, 351–366. [Google Scholar] [CrossRef]
- Zou, Y.; Gao, Q.; Wang, S. Optimization of the stacking plans for precast concrete slab based on assembly sequence. Buildings 2022, 12, 1538. [Google Scholar] [CrossRef]
- Polat, G. Factors affecting the use of precast concrete systems in the United States. J. Constr. Eng. Manag. 2008, 134, 169–178. [Google Scholar] [CrossRef]
- Choi, H.K. Parametric analysis on seismic performance of hybrid precast concrete beam-column joint. Adv. Civ. Eng. 2020, 2020, 8856327. [Google Scholar] [CrossRef]
- Vasishta, T.; Hashem Mehany, M.; Killingsworth, J. Comparative life cycle assessment and cost analysis of precast and cast–in–place buildings in the United States. J. Build. Eng. 2023, 67, 105921. [Google Scholar] [CrossRef]
- Wang, Y.H.; Yu, J.; Liu, J.P.; Zhou, B.X.; Chen, Y.F. Experimental study on assembled monolithic steel-prestressed concrete composite beam in negative moment. J. Constr. Steel Res. 2020, 167, 105667. [Google Scholar] [CrossRef]
- Liu, H.; Kong, P.; Ye, T. Influence of precast member corbels on seismic performance of Precast Beam-Slab-Column Joints. Adv. Civ. Eng. 2021, 2021, 7107569. [Google Scholar] [CrossRef]
- Shen, C.; Song, Y.; Yan, L.; Li, Y.; Ma, X.; He, S.; Han, X. the Bearing Behavior of Curved Continuous Twin I-Girder Composite Bridge with Precast Concrete Slab. Adv. Civ. Eng. 2021, 2021, 8872092. [Google Scholar] [CrossRef]
- Charron, J.P.; Niamba, E.; Massicotte, B. Static and Dynamic Behavior of High- and Ultrahigh-Performance Fiber-Reinforced Concrete precast bridge parapets. J. Bridge Eng. 2011, 16, 413–421. [Google Scholar] [CrossRef]
- Rueda-García, L.; Senach, J.L.B.; Sosa, P.F.M.; Prada, M.Á.F. Analysis of the shear strength mechanism of slender precast concrete beams with cast-in-place slab and web reinforcement. Eng. Struct. 2021, 246, 113043. [Google Scholar] [CrossRef]
- Yee, A.A.; Eng, P.H.D. Social and environmental benefits of precast concrete Technology. PCI J. 2001, 46, 14–19. [Google Scholar] [CrossRef]
- Di, J.; Han, B.; Qin, F. Investigation of U-bar joints between precast bridge decks loaded in combined bending and shear. Structures 2020, 27, 37–45. [Google Scholar] [CrossRef]
- Leblouba, M.; Barakat, S.; Ahmed, M.S.A.; Al-Toubat, S. Shear strength at the interface of precast bridge concrete decks and girders subjected to cyclic loading with varying speeds. Eng. Struct. 2019, 196, 109296. [Google Scholar] [CrossRef]
- Hu, M.; Jia, Z.; Han, Q.; Ni, Y.; Jiao, C.; Long, P. Shear behavior of innovative high performance joints for precast concrete deck panels. Eng. Struct. 2022, 261, 114307. [Google Scholar] [CrossRef]
- Abo El-Khier, M.A.; Morcous, G. Precast concrete deck-to-girder connection using Ultra-High Performance Concrete (UHPC)shear pockets. Eng. Struct. 2021, 248, 113082. [Google Scholar] [CrossRef]
- Li, Q.; Song, Z. Ensemble-learning-based prediction of steel bridge deck defect condition. Appl. Sci. 2022, 12, 5442. [Google Scholar] [CrossRef]
- Park, J.S.; Kim, Y.J.; Cho, J.R.; Jeon, S.J. Early-age strength of ultra-high performance concrete in various curing conditions. Materials 2015, 8, 5537–5553. [Google Scholar] [CrossRef] [PubMed]
- Trentini, E.V.W.; Parsekian, G.A.; Bittencourt, T.N. A method for considering the influence of distinct casting stages in the flexural design of prestressed concrete cross sections. Rev. IBRACON Estrut. Mater. 2022, 15, e15410. [Google Scholar] [CrossRef]
- Nguyen, Q.T.; Maki, T.; Mutsuyoshi, H.; Ishihara, Y. Flexural behavior of precast concrete slab connections using loop Steel bars and mortar. J. Adv. Concr. Technol. 2023, 21, 436–449. [Google Scholar] [CrossRef]
- Brunesi, E.; Peloso, S.; Pinho, R.; Nascimbene, R. Cyclic tensile testing of a three-way panel connection for precast wall-slab-wall structures. Struct. Concr. 2019, 20, 1307–1315. [Google Scholar] [CrossRef]
- Zhang, W.; Feng, Y.; Zeng, X.; Xu, M.; Gong, L.; Rui, L. Flexural Performances of Novel Wet Joints with Sleeve Connections in Precast Composite Floor System. Buildings 2024, 14, 822. [Google Scholar] [CrossRef]
- Chen, X.; Luo, B.; Lou, F.; Chen, Z. Experimental and numerical investigation on the flexural behavior of a novel composite slab with a joint. Adv. Struct. Eng. 2024, 27, 2429–2443. [Google Scholar] [CrossRef]
- Kang, S.; Cho, S.; Na, H.; Han, J.; Lee, H. Tension Performance of Precast Bridge Deck Longitudinal Joints with Different Configurations. Appl. Sci. 2022, 12, 12892. [Google Scholar] [CrossRef]
- Wang, Y.; Hu, L.; Li, W.; Zhang, G.; Han, B.; Di, J.; Fei, P.; Duan, X.; Dong, J.; Qin, F. Study on the Bending and Shear Behavior of a New Type of Wet Joint in Precast Concrete Deck for Composite Bridges. Materials 2024, 17, 6252. [Google Scholar] [CrossRef]
- Abdel-Qader, I.; Abu-Amara, F.; Abudayyeh, O. Fractals and Independent Component Analysis for Defect Detection in Bridge Decks. Adv. Civ. Eng. 2011, 2011, 506464. [Google Scholar] [CrossRef]
- Al-Fakher, U.; Manalo, A.; Ferdous, W.; Aravinthan, T.; Zhuge, Y.; Bai, Y.; Edoo, A. Bending behaviour of precast concrete slab with externally flanged hollow FRP tubes. Eng. Struct. 2021, 241, 112433. [Google Scholar] [CrossRef]
- Mander, T.J.; Henley, M.D.; Scott, R.M.; Head, M.H.; Mander, J.B.; Trejo, D. Experimental Performance of Full-Depth Precast, Prestressed Concrete Overhang, Bridge Deck Panels. J. Bridge Eng. 2010, 15, 503–510. [Google Scholar] [CrossRef]
- Mohd Radzi, N.A.; Hamid, R.; Mutalib, A.A.; Kaish, A.B.M.A. A Review of Precast Concrete Beam-to-Column Connections Subjected to Severe Fire Conditions. Adv. Civ. Eng. 2020, 2020, 8831120. [Google Scholar] [CrossRef]
- Mander, T.J.; Mander, J.B.; Hite Head, M. Modified Yield Line Theory for Full-Depth Precast Concrete Bridge Deck Overhang Panels. J. Bridge Eng. 2011, 16, 12–20. [Google Scholar] [CrossRef]
- Wells, Z.G.; Barr, P.J.; James, P.H. Performance of Posttensioned Curved-Strand Connections in Transverse Joints of Precast Deck Panels. J. Bridge Eng. 2013, 18, 1062–1073. [Google Scholar] [CrossRef]
- Li, J.; Wang, Y.; Lu, Z.; Li, J. Experimental Study and Numerical Simulation of a Laminated Reinforced Concrete Shear Wall with a Vertical Seam. Appl. Sci. 2017, 7, 629. [Google Scholar] [CrossRef]
- Lu, Z.; Wang, Z.; Li, J.; Huang, B. Studies on Seismic Performance of Precast Concrete Columns with Grouted Splice Sleeve. Appl. Sci. 2021, 7, 571. [Google Scholar] [CrossRef]
- Kataoka, M.N.; Ferreira, M.A.; de Cresce El Debs, A.L.H. Nonlinear FE analysis of slab-beam-column connection in precast concrete structures. Eng. Struct. 2017, 143, 306–315. [Google Scholar] [CrossRef]
- Jiang, H.; Shao, T.; Fang, Z.; Xiao, J.; Hu, Z. Shear-friction behavior of grooved construction joints between a precast UHPC girder and a cast-in-place concrete slab. Eng. Struct. 2021, 228, 111610. [Google Scholar] [CrossRef]
- Abdullah, M.D.; Mosheer, K.A.M. Effect of Stirrups on the Behavior of Semi-Precast Concrete Slabs. Civ. Eng. J. 2022, 8, 1653–1664. [Google Scholar] [CrossRef]
- Hillebrand, M.; Sinning, A.; Hegger, J. Shear and interface shear fatigue of semi-precast slabs with lattice girders under cyclic loading. Struct. Concr. 2024, 25, 4895–4917. [Google Scholar] [CrossRef]
- Phillips, D.; Zienkiewicz, O. Finite element non-linear analysis of concrete structures. Proc. Inst. Civ. Eng. 1976, 61, 59–88. [Google Scholar] [CrossRef]
- Ottosen, N.S. Nonlinear Finite Element Analysis of Concrete Structures; Risø National Laboratory: Roskilde, Denmark, 1980. [Google Scholar]
- Meyer, C.; Okamura, H. Finite Element Analysis of Reinforced Concrete Structures; ASCE: Reston, VA, USA, 1985. [Google Scholar]
- Cao, L.; Song, X. Stress analysis of assembled concrete structures with application of finite element modeling. Appl. Math. Nonlinear Sci. 2023, 10, 20220201. [Google Scholar] [CrossRef]
- Al-Kheetan, M.J.; Al-Tarawneh, M.A.; Ghaffar, S.H.; Chougan, M.; Jweihan, Y.S.; Rahman, M.M. Resistance of hydrophobic concrete with different moisture contents to advanced freeze-thaw cycles. Struct. Concr. 2021, 22, E1050–E1061. [Google Scholar] [CrossRef]
- Xue, W.; Chen, S.; Bai, H.S. Pseudo-static tests on top joints of hybrid precast utility tunnel. Buildings 2023, 13, 2567. [Google Scholar] [CrossRef]
- Haruna, S.I.; Ibrahim, Y.E.; Adamu, M.; Ahmed, O.S. Determination of Final Strand Slips of Prestressed Precast Hollow-Core Slabs Subjected to Flexural Load Using Machine Learning Algorithms. Buildings 2023, 13, 2013. [Google Scholar] [CrossRef]
- Li, F.; Thedja, J.P.P.; Sim, S.H.; Seo, J.O.; Kim, M.K. Range Image-Aided Edge Line Estimation for Dimensional Inspection of Precast Bridge Slab Using Point Cloud Data. Sustainability 2023, 15, 12243. [Google Scholar] [CrossRef]
- Wu, Y.; Chen, J.; Zhu, P.; Zhi, P. Finite element analysis of perforated prestressed concrete frame enhanced by artificial neural networks. Buildings 2024, 14, 3215. [Google Scholar] [CrossRef]
- Zhang, J.; Xu, J.; Liu, C.; Zheng, J.M. Prediction of rubber fiber concrete strength using extreme learning machine. Front. Mater 2021, 7, 582635. [Google Scholar] [CrossRef]
- Ahmad, M.M.; Elahi, A.; Barbhuiya, S. Comparative Analysis of Reinforced Concrete Beam Behaviour: Conventional Model vs. Artificial Neural Network Predictions. Materials 2023, 16, 7642. [Google Scholar] [CrossRef] [PubMed]
- Ben Chaabene, W.; Flah, M.; Nehdi, M.L. Machine learning prediction of mechanical properties of concrete: Critical review. Constr. Build Mater. 2020, 260, 119889. [Google Scholar] [CrossRef]
- ABAQUS. Abaqus In Dassault Systèmes; Simulia Corporation: Providence, RI, USA, 2021. [Google Scholar]
- KDS 14 20 62; Concrete Structure Design Standard. Ministry of Land, Infrastructure and Transport. Korea Agency for Infrastructure Technology Advancement: Sejong, Republic of Korea, 2021. (In Korean)
- KDS 24 14 21; Design Standard for Concrete Bridges (Limit State Design Method). Ministry of Land, Infrastructure and Transport. Korea Agency for Infrastructure Technology Advancement: Sejong, Republic of Korea, 2021. (In Korean)
- American Association of State Highway and Transportation Officials. AASHTO LRFD Bridge Design Specifications, 4th ed.; AASHTO: Washington, DC, USA, 2007. [Google Scholar]
- Al-Mawed, L.K.; Hamad, B.S. Experimental and numerical assessments of slab-column connections strengthened using bonded hemp fiber fabric sheets. Int. J. Concr. Struct. Mater. 2023, 17, 8. [Google Scholar] [CrossRef]
- Makhlouf, M.H.; El-Azab, I.A.; Mansour, M.H. Flexural improvement of RC slabs by FRP or steel using different strengthening systems and novel anchoring techniques. Int. J. Concr. Struct. Mater 2024, 18, 45. [Google Scholar] [CrossRef]
- Mamesh, Z.; Sailauova, D.; Zhang, D.; Ju, H.; Lee, D.; Kim, J. Slab reinforcement contributions to negative moment strength of reinforced concrete T-beam with high strength steel at exterior beam-column joints. Int. J. Concr. Struct. Mater. 2023, 17, 69. [Google Scholar] [CrossRef]
- Neupane, B.; Sahani, K.; Khadka, S.S. Experimental testing and numerical simulation of recycled concrete aggregate in a concrete mix. Int. J. Concr. Struct. Mater. 2025, 19, 5. [Google Scholar] [CrossRef]
- Yahia, A.; Tayel, M.; Heiza, K.; Hekal, G. Optimizing reinforcement strategies for improved flexural behavior in reinforced concrete walls. Int. J. Concr. Struct. Mater. 2025, 19, 24. [Google Scholar] [CrossRef]
- Cho, S.; Chung, W.; Jung, W.T.; Park, J.S.; Lee, H. Assessment of shear capacity in NSM prestressed FRP strengthening with anchorage conditions. Case Stud. Constr. Mater. 2024, 20, e02743. [Google Scholar] [CrossRef]


| Test Specimen | Specifies | Compressive Strength of Concrete |
|---|---|---|
| CS-27 (test) | Cast-in-place slab (CS) | 27 MPa |
| PS-27 (test) | Precast concrete slab (PS) | 27 MPa |
| PS-40 (test) | Precast concrete slab (PS) | 40 MPa |
| Gauge Name | Slab Types | Gauge Locations | Gauge Locations |
|---|---|---|---|
| CS-T-27 | Cast in place (CS) | Strain gauge top (T) | 27 MPa |
| CS-B-27 | Strain gauge bottom (B) | ||
| PS-T-27 | Precast concrete slab (PS) | Strain gauge top (T) | 27 MPa |
| PS-T-40 | 40 MPa | ||
| PS-B-27 | Precast concrete slab (PS) | Strain gauge bottom (B) | 27 MPa |
| PS-B-40 | 40 MPa |
| Test Specimen | Specifies | Compressive Strength |
|---|---|---|
| CS-27 (test) | Cast in place (CS) | 27 MPa |
| PS-40 (test) | Precast concrete slab (PS) | 40 MPa |
| PS-40 (FEA) | Precast concrete slab (PS) | 40 MPa |
| Steel | |||
| Elastic | Plastic | ||
| Young’ modulus | Poisson’s ratio | Yield stress | Plastic strain |
| 200,000 | 0.300 | 275 | 0 |
| 410 | 0.027 | ||
| Concrete | |||
| Elastic | |||
| Young’ modulus | Poisson’s ratio | ||
| 200,000 | 0.300 | ||
| Compressive Behavior | Compression Damage | ||
| Yield Stress | Inelastic Strain | Damage Parameter | Inelastic Strain |
| 20.4 | 0 | 0 | 0 |
| 25.6 | 0.00003 | 0 | 0.00003 |
| 30.0 | 0.00005 | 0 | 0.00005 |
| 33.6 | 0.00016 | 0 | 0.00016 |
| 36.4 | 0.00027 | 0 | 0.00027 |
| 38.4 | 0.00040 | 0 | 0.00040 |
| 39.6 | 0.00056 | 0 | 0.00056 |
| 40.0 | 0.00075 | 0 | 0.00075 |
| 39.6 | 0.00096 | 0.01 | 0.00096 |
| 38.4 | 0.00120 | 0.04 | 0.00120 |
| 36.4 | 0.00147 | 0.09 | 0.00147 |
| 33.6 | 0.00176 | 0.16 | 0.00176 |
| 30.0 | 0.00208 | 0.25 | 0.00208 |
| 25.6 | 0.00243 | 0.36 | 0.00243 |
| 20.4 | 0.00280 | 0.49 | 0.00280 |
| 14.4 | 0.00320 | 0.64 | 0.00320 |
| 7.6 | 0.00363 | 0.81 | 0.00363 |
| Tensile behavior | Compression damage | ||
| Yield stress | Cracking strain | Yield stress | Cracking strain |
| 4 | 0 | ||
| 0.04 | 0.0013333 | ||
| Compressive Strength | Young’s Modulus | Yield Stress | Cracking Strain |
|---|---|---|---|
| 20 | 21,200 | 0.020 | 0.000943396 |
| 21 | 21,740 | 0.021 | 0.000965788 |
| 22 | 22,280 | 0.022 | 0.000988180 |
| 23 | 22,820 | 0.023 | 0.001010572 |
| 24 | 23,360 | 0.024 | 0.001032964 |
| 25 | 23,900 | 0.025 | 0.001055356 |
| 26 | 24,440 | 0.026 | 0.001077747 |
| 27 | 24,980 | 0.027 | 0.001100139 |
| 28 | 25,520 | 0.028 | 0.001122531 |
| 29 | 26,060 | 0.029 | 0.001144923 |
| 30 | 26,600 | 0.030 | 0.001167315 |
| 31 | 26,940 | 0.031 | 0.001183917 |
| 32 | 27,280 | 0.032 | 0.001200519 |
| 33 | 27,620 | 0.033 | 0.001217121 |
| 34 | 27,960 | 0.034 | 0.001233723 |
| 35 | 28,300 | 0.035 | 0.001250324 |
| 36 | 28,640 | 0.036 | 0.001266926 |
| 37 | 28,980 | 0.037 | 0.001283528 |
| 38 | 29,320 | 0.038 | 0.001300130 |
| 39 | 29,660 | 0.039 | 0.001316732 |
| 40 | 30,000 | 0.040 | 0.001333333 |
| 41 | 30,340 | 0.041 | 0.001349432 |
| 42 | 30,680 | 0.042 | 0.001365531 |
| 43 | 31,020 | 0.043 | 0.001381630 |
| 44 | 31,360 | 0.044 | 0.001397729 |
| 45 | 31,700 | 0.045 | 0.001413828 |
| 46 | 32,040 | 0.046 | 0.001429927 |
| 47 | 32,380 | 0.047 | 0.001446026 |
| 48 | 32,720 | 0.048 | 0.001462125 |
| 49 | 33,060 | 0.049 | 0.001478223 |
| 50 | 33,400 | 0.050 | 0.001494322 |
| 51 | 33,740 | 0.051 | 0.001509918 |
| 52 | 34,080 | 0.052 | 0.001525514 |
| 53 | 34,420 | 0.053 | 0.001541111 |
| 54 | 34,760 | 0.054 | 0.001556707 |
| 55 | 35,100 | 0.055 | 0.001572303 |
| 56 | 35,440 | 0.056 | 0.001587899 |
| 57 | 35,780 | 0.057 | 0.001603495 |
| 58 | 36,120 | 0.058 | 0.001619092 |
| 59 | 36,460 | 0.059 | 0.001634688 |
| 60 | 36,800 | 0.060 | 0.001650282 |
| Compressive Strength | Displacement | Maximum Load | Stress |
|---|---|---|---|
| 20 | 5.61 | 282.24 | 2.01155 |
| 21 | 5.79 | 292.32 | 2.11429 |
| 22 | 5.86 | 302.40 | 2.21578 |
| 23 | 5.95 | 312.48 | 2.31714 |
| 24 | 6.12 | 322.56 | 2.41853 |
| 25 | 6.34 | 342.72 | 2.51992 |
| 26 | 6.55 | 352.80 | 2.60209 |
| 27 | 6.76 | 372.96 | 2.71764 |
| 28 | 6.88 | 383.04 | 2.8199 |
| 29 | 7.09 | 393.12 | 2.92143 |
| 30 | 7.33 | 413.28 | 3.02286 |
| 31 | 7.55 | 423.36 | 3.12806 |
| 32 | 7.74 | 433.44 | 3.22887 |
| 33 | 7.94 | 453.60 | 3.32969 |
| 34 | 8.13 | 463.68 | 3.42968 |
| 35 | 8.22 | 473.76 | 3.53135 |
| 36 | 8.32 | 483.84 | 3.62869 |
| 37 | 8.53 | 504.00 | 3.73805 |
| 38 | 8.69 | 514.08 | 3.83383 |
| 39 | 8.89 | 524.16 | 3.93109 |
| 40 | 9.02 | 544.32 | 4.03547 |
| 41 | 9.16 | 554.40 | 4.1363 |
| 42 | 9.35 | 564.48 | 4.23713 |
| 43 | 9.55 | 574.56 | 4.33795 |
| 44 | 9.72 | 594.72 | 4.43878 |
| 45 | 9.80 | 604.80 | 4.53845 |
| 46 | 9.89 | 614.88 | 4.64042 |
| 47 | 9.99 | 624.96 | 4.74124 |
| 48 | 10.09 | 635.04 | 4.84205 |
| 49 | 10.19 | 645.12 | 4.94285 |
| 50 | 10.29 | 655.20 | 5.03554 |
| 51 | 10.39 | 665.28 | 5.14568 |
| 52 | 10.48 | 675.36 | 5.24521 |
| 53 | 10.58 | 685.44 | 5.34599 |
| 54 | 10.68 | 695.52 | 5.44675 |
| 55 | 10.78 | 705.60 | 5.54749 |
| 56 | 10.88 | 715.50 | 5.65422 |
| 57 | 11.02 | 727.65 | 5.74868 |
| 58 | 11.13 | 734.23 | 5.84888 |
| 59 | 11.23 | 745.50 | 5.95644 |
| 60 | 11.33 | 756.30 | 6.05788 |
Disclaimer/Publisher’s Note: The statements, opinions and data contained in all publications are solely those of the individual author(s) and contributor(s) and not of MDPI and/or the editor(s). MDPI and/or the editor(s) disclaim responsibility for any injury to people or property resulting from any ideas, methods, instructions or products referred to in the content. |
© 2025 by the authors. Licensee MDPI, Basel, Switzerland. This article is an open access article distributed under the terms and conditions of the Creative Commons Attribution (CC BY) license (https://creativecommons.org/licenses/by/4.0/).
Share and Cite
Jang, J.; Mun, D.; Jo, B.; Lee, H. Flexible Behavior of Transverse Joints in Full-Scale Precast Concrete Slabs with Open-Type Joint Method. Buildings 2025, 15, 2337. https://doi.org/10.3390/buildings15132337
Jang J, Mun D, Jo B, Lee H. Flexible Behavior of Transverse Joints in Full-Scale Precast Concrete Slabs with Open-Type Joint Method. Buildings. 2025; 15(13):2337. https://doi.org/10.3390/buildings15132337
Chicago/Turabian StyleJang, Jinuk, Dain Mun, Byungkyu Jo, and Heeyoung Lee. 2025. "Flexible Behavior of Transverse Joints in Full-Scale Precast Concrete Slabs with Open-Type Joint Method" Buildings 15, no. 13: 2337. https://doi.org/10.3390/buildings15132337
APA StyleJang, J., Mun, D., Jo, B., & Lee, H. (2025). Flexible Behavior of Transverse Joints in Full-Scale Precast Concrete Slabs with Open-Type Joint Method. Buildings, 15(13), 2337. https://doi.org/10.3390/buildings15132337