
Modified Constitutive Model and Practical Calibration Method for Constructional 7075-T6 Aluminum Alloy

Abstract
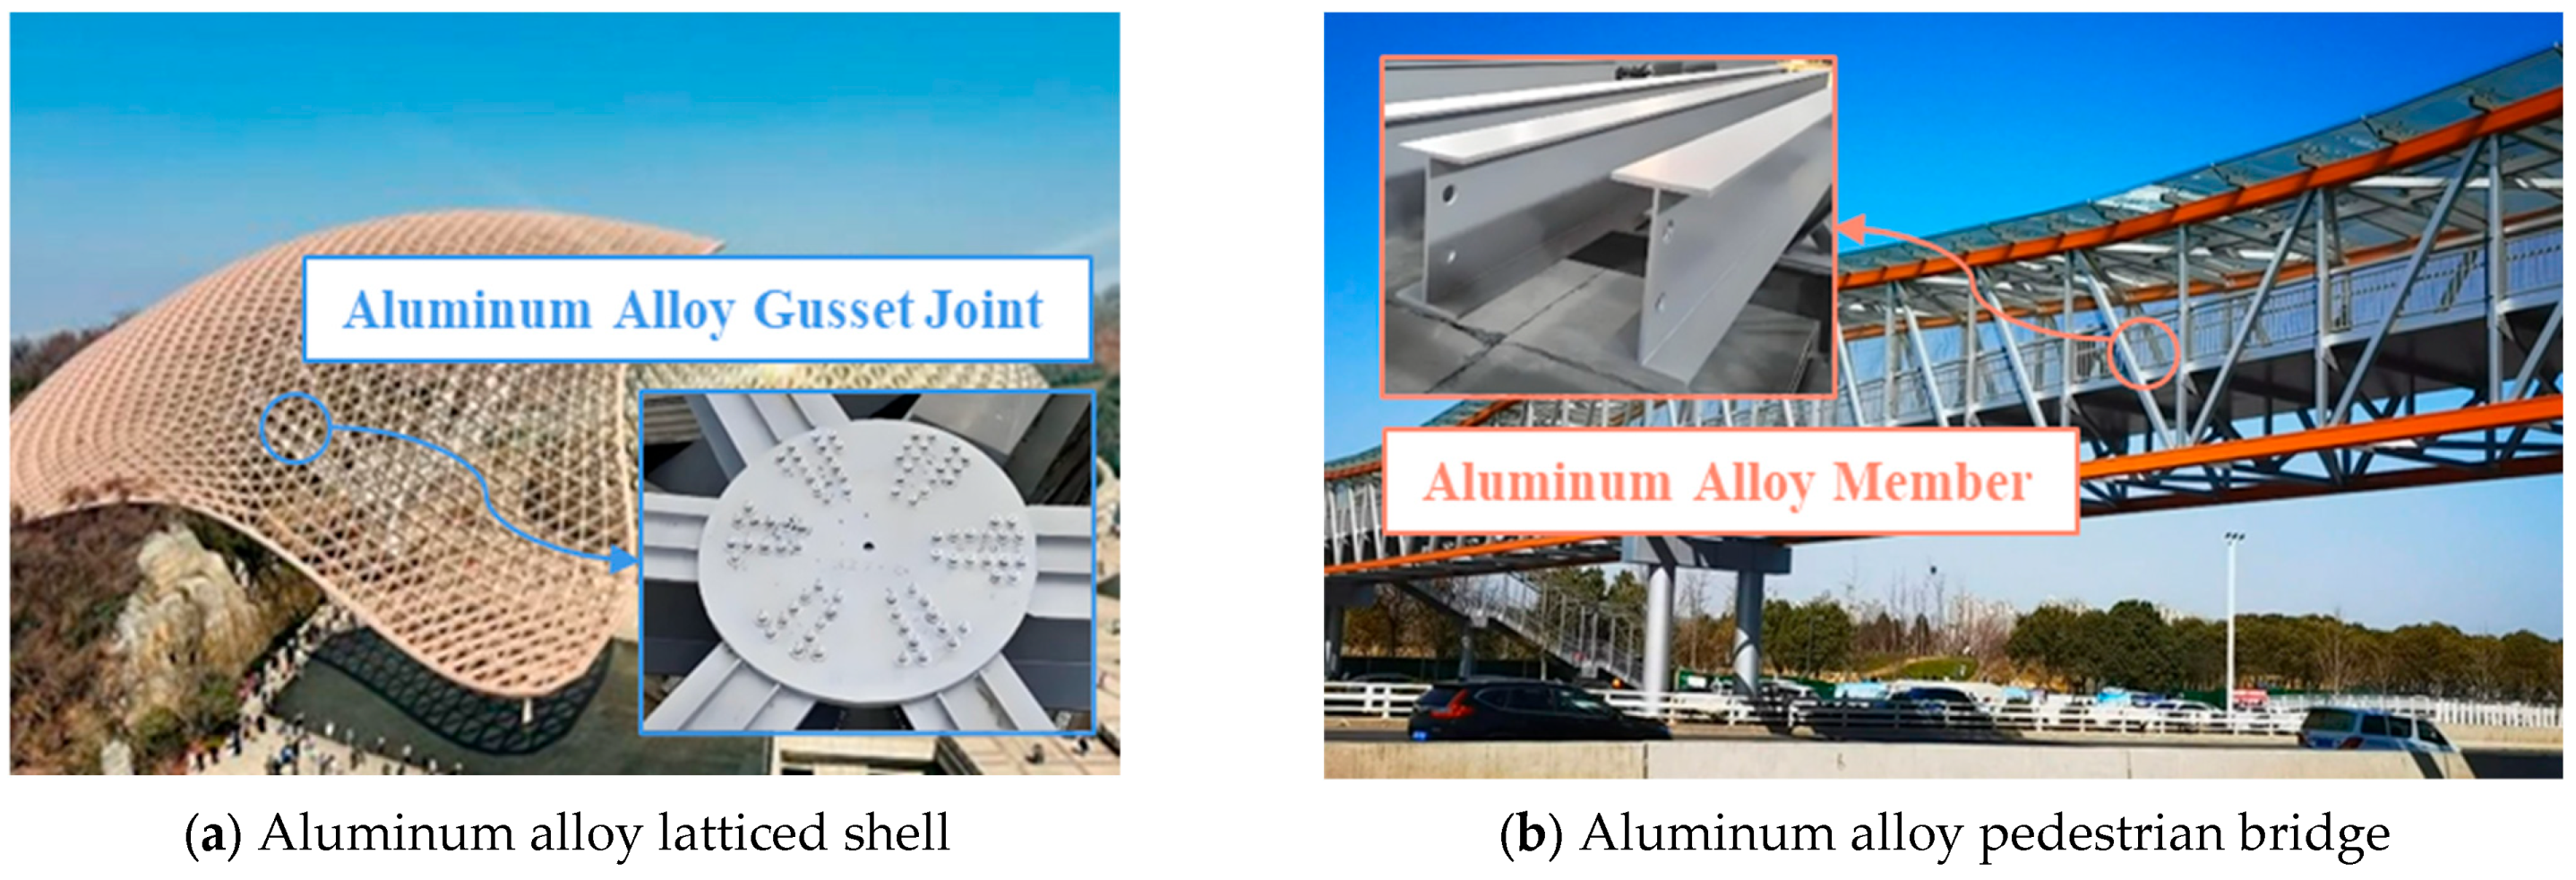
1. Introduction
2. Tensile Tests of 7075-T6 Aluminum Alloy Specimens
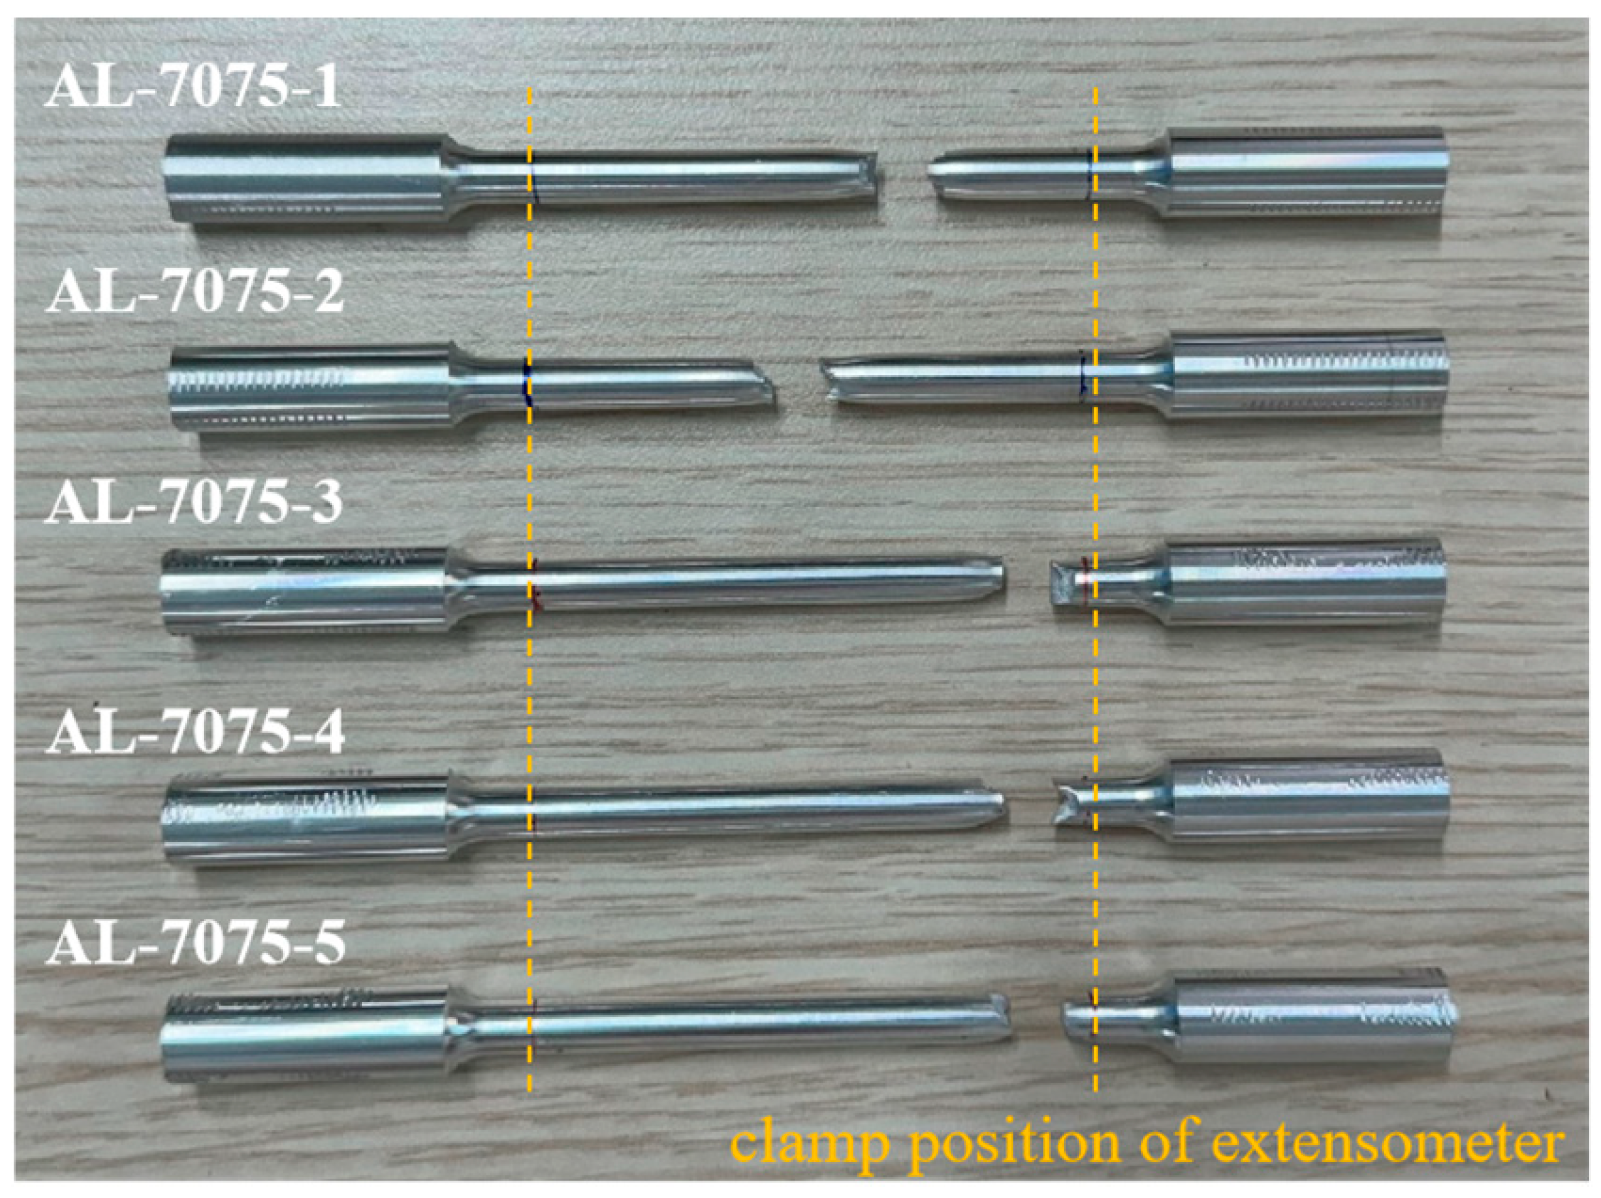
2.1. Test Setup and Procedure
2.2. Experimental Phenomena and Results Analysis
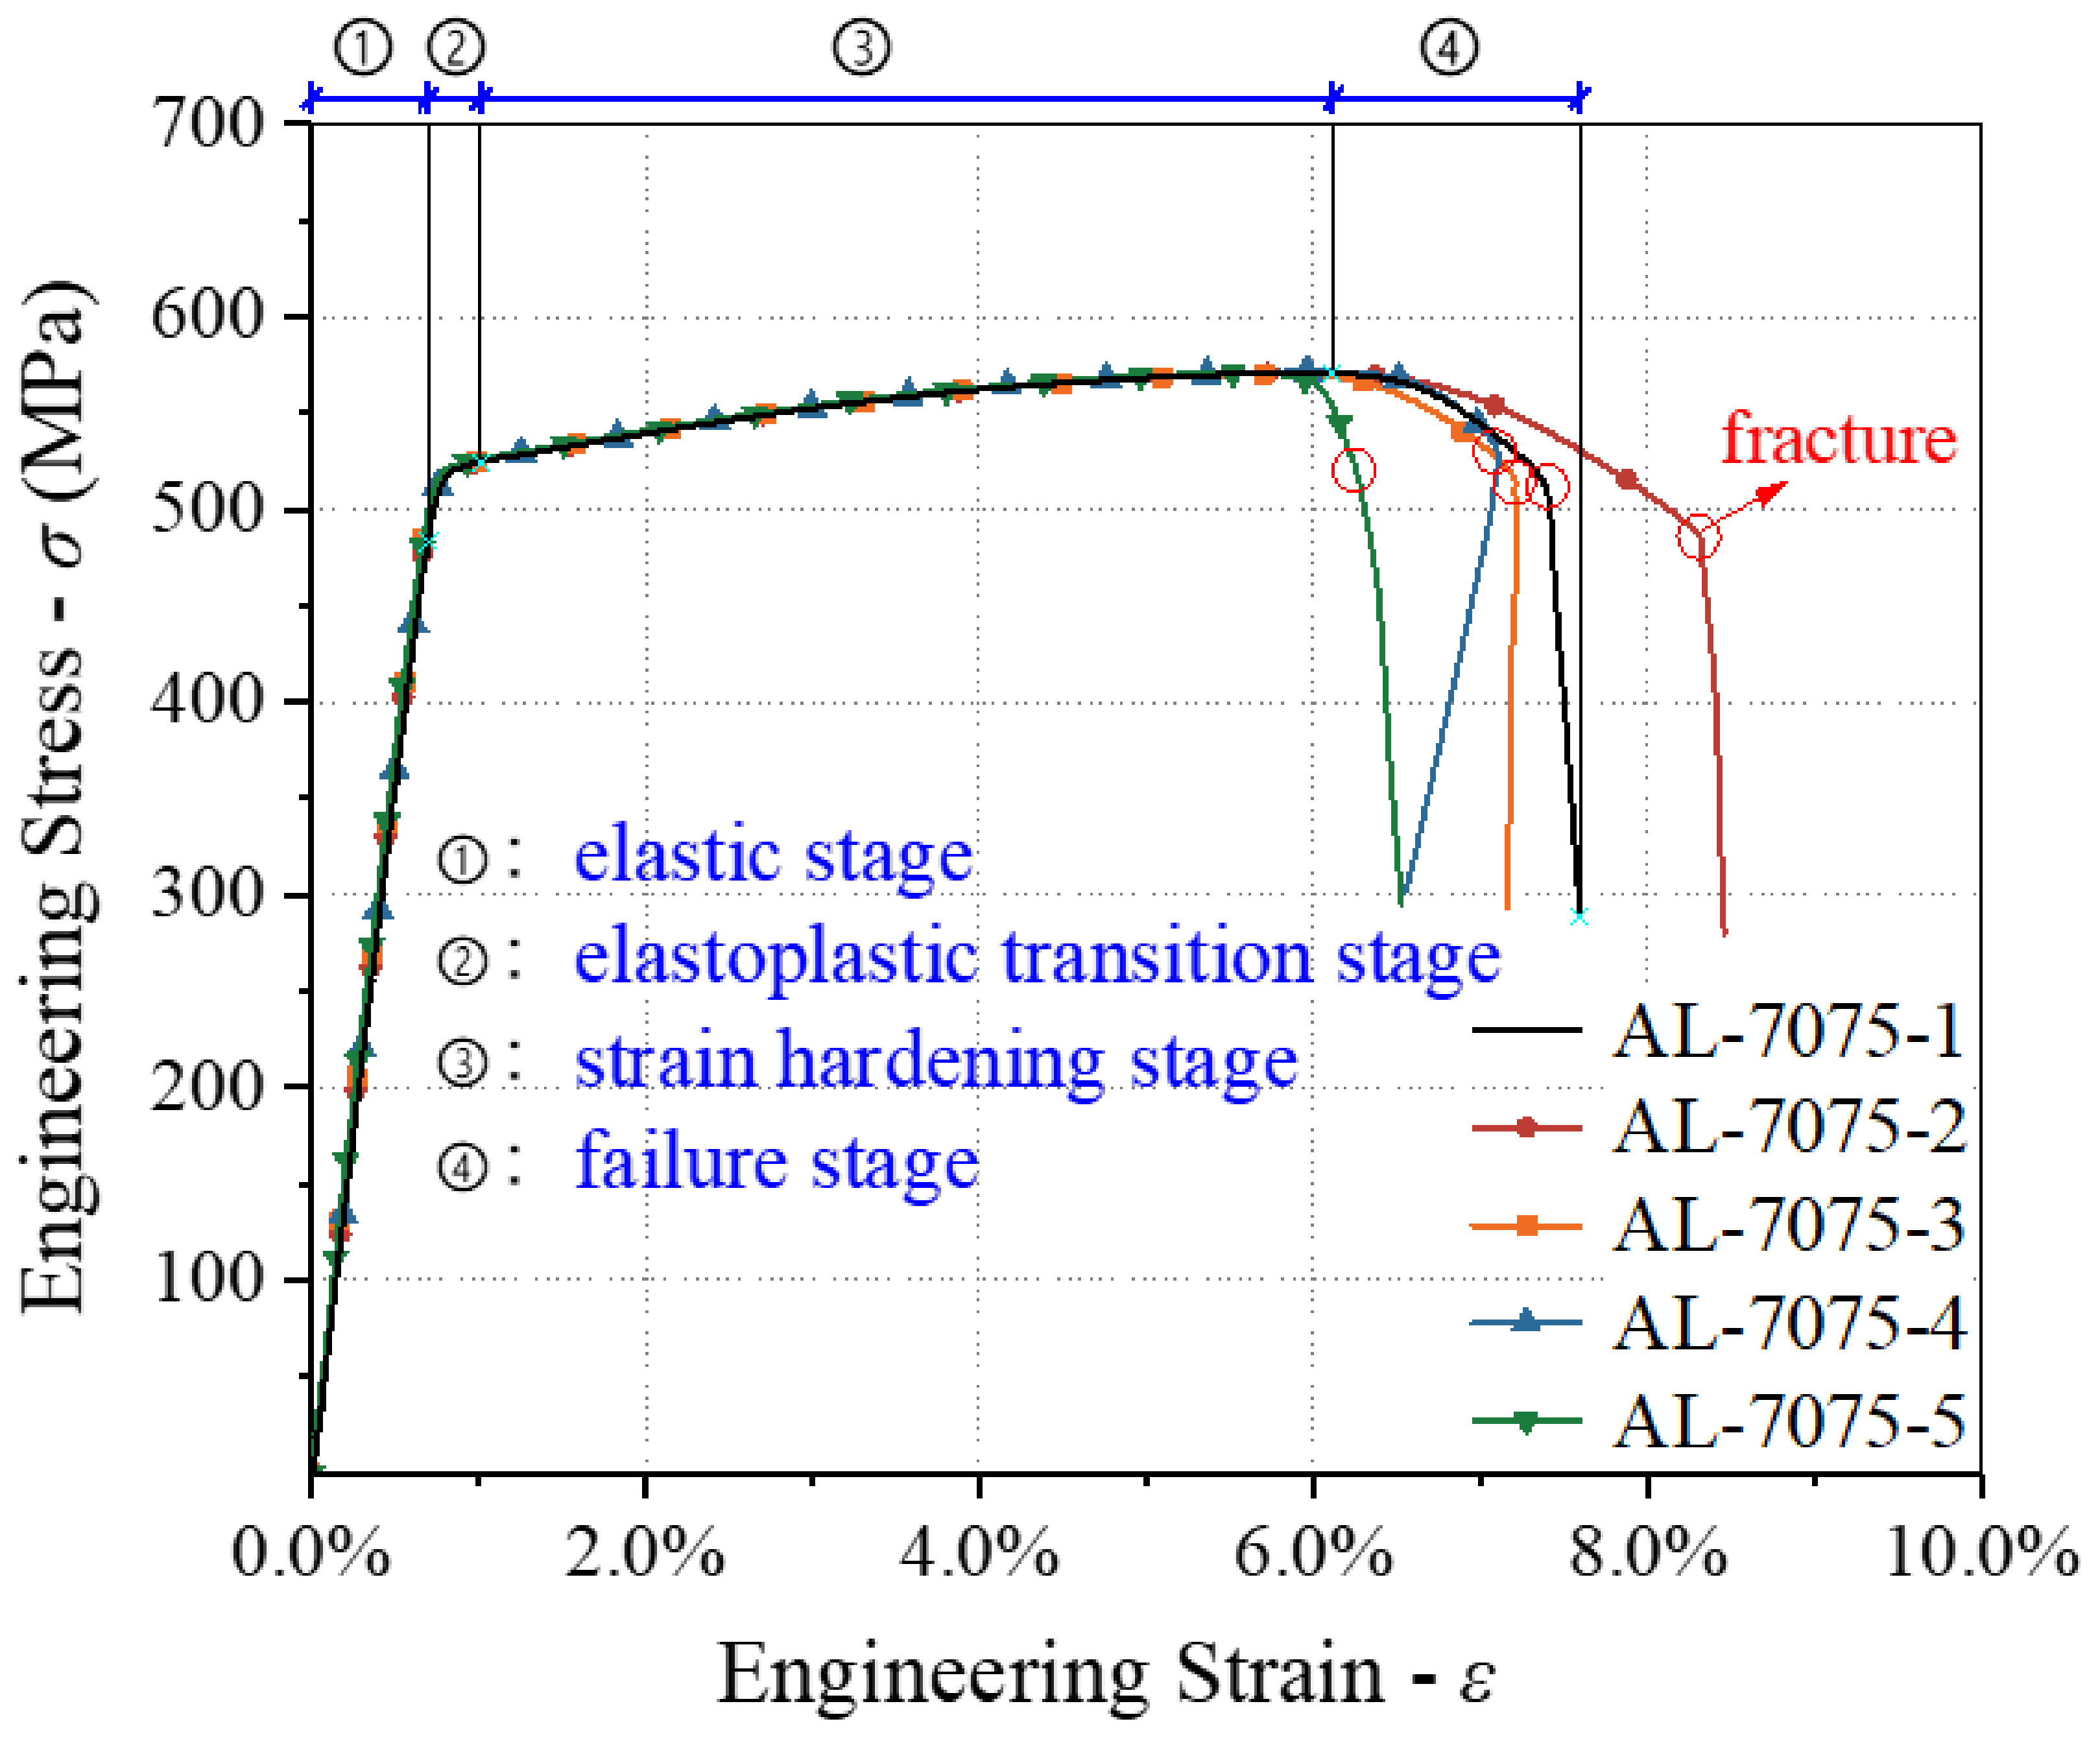
2.2.1. Tensile Failure and Engineering Stress–Engineering Strain Curve
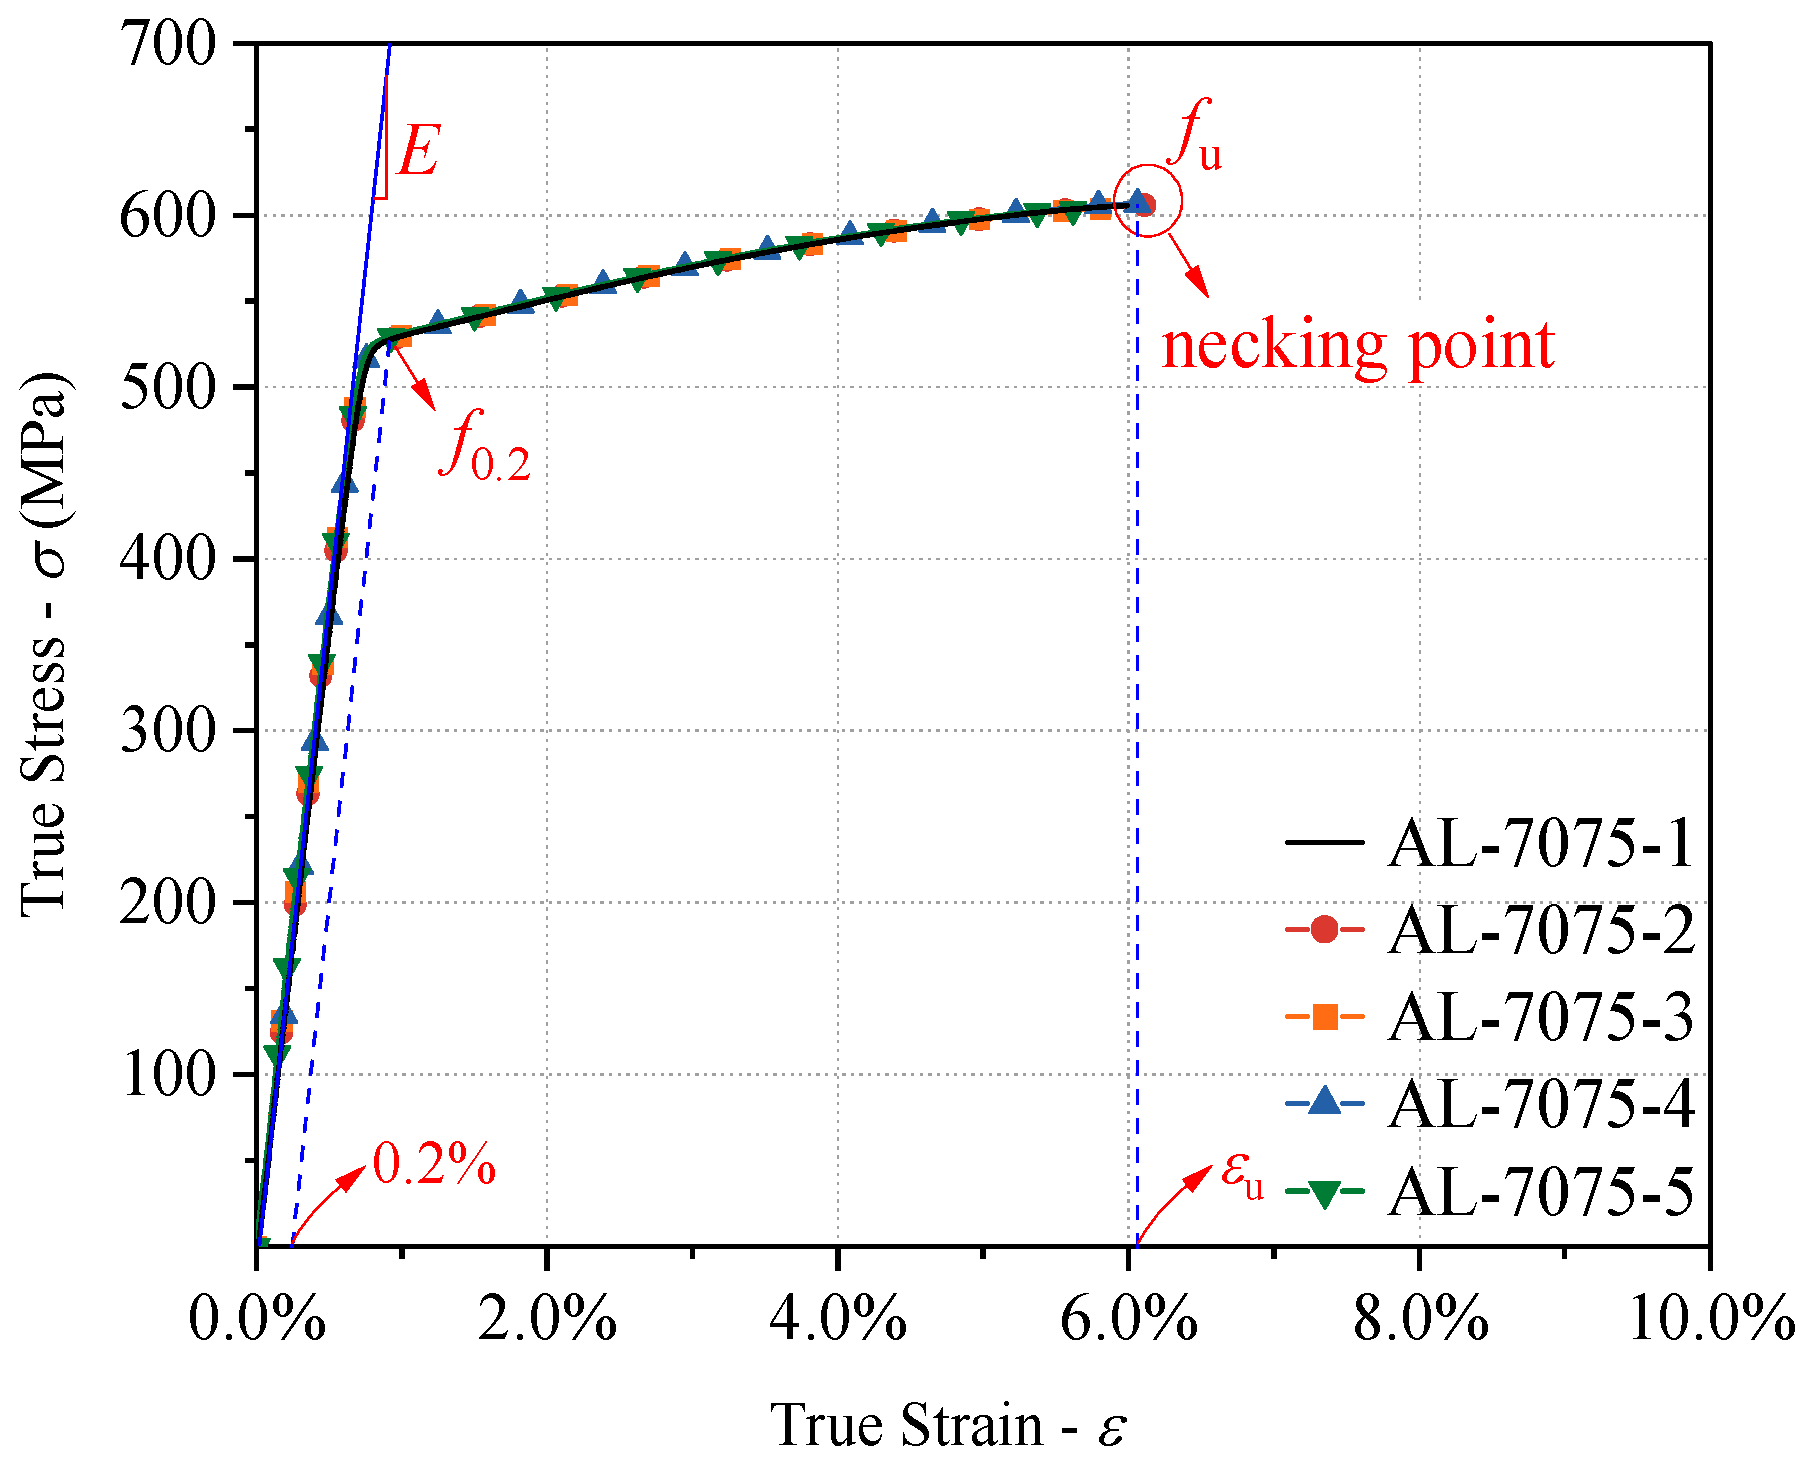
2.2.2. Mechanical Properties of 7075-T6 Aluminum Alloy
3. Classical R–O Constitutive Model and Calibration
3.1. Power-Law Hardening Constitutive Model
3.2. Constitutive Model Parameter Calculation Methods
3.2.1. LLS Method
3.2.2. Traditional TP Method
3.2.3. STE Method
3.3. Constitutive Model Calibration and Result Analysis
4. Modified R–O Constitutive Model and Calibration
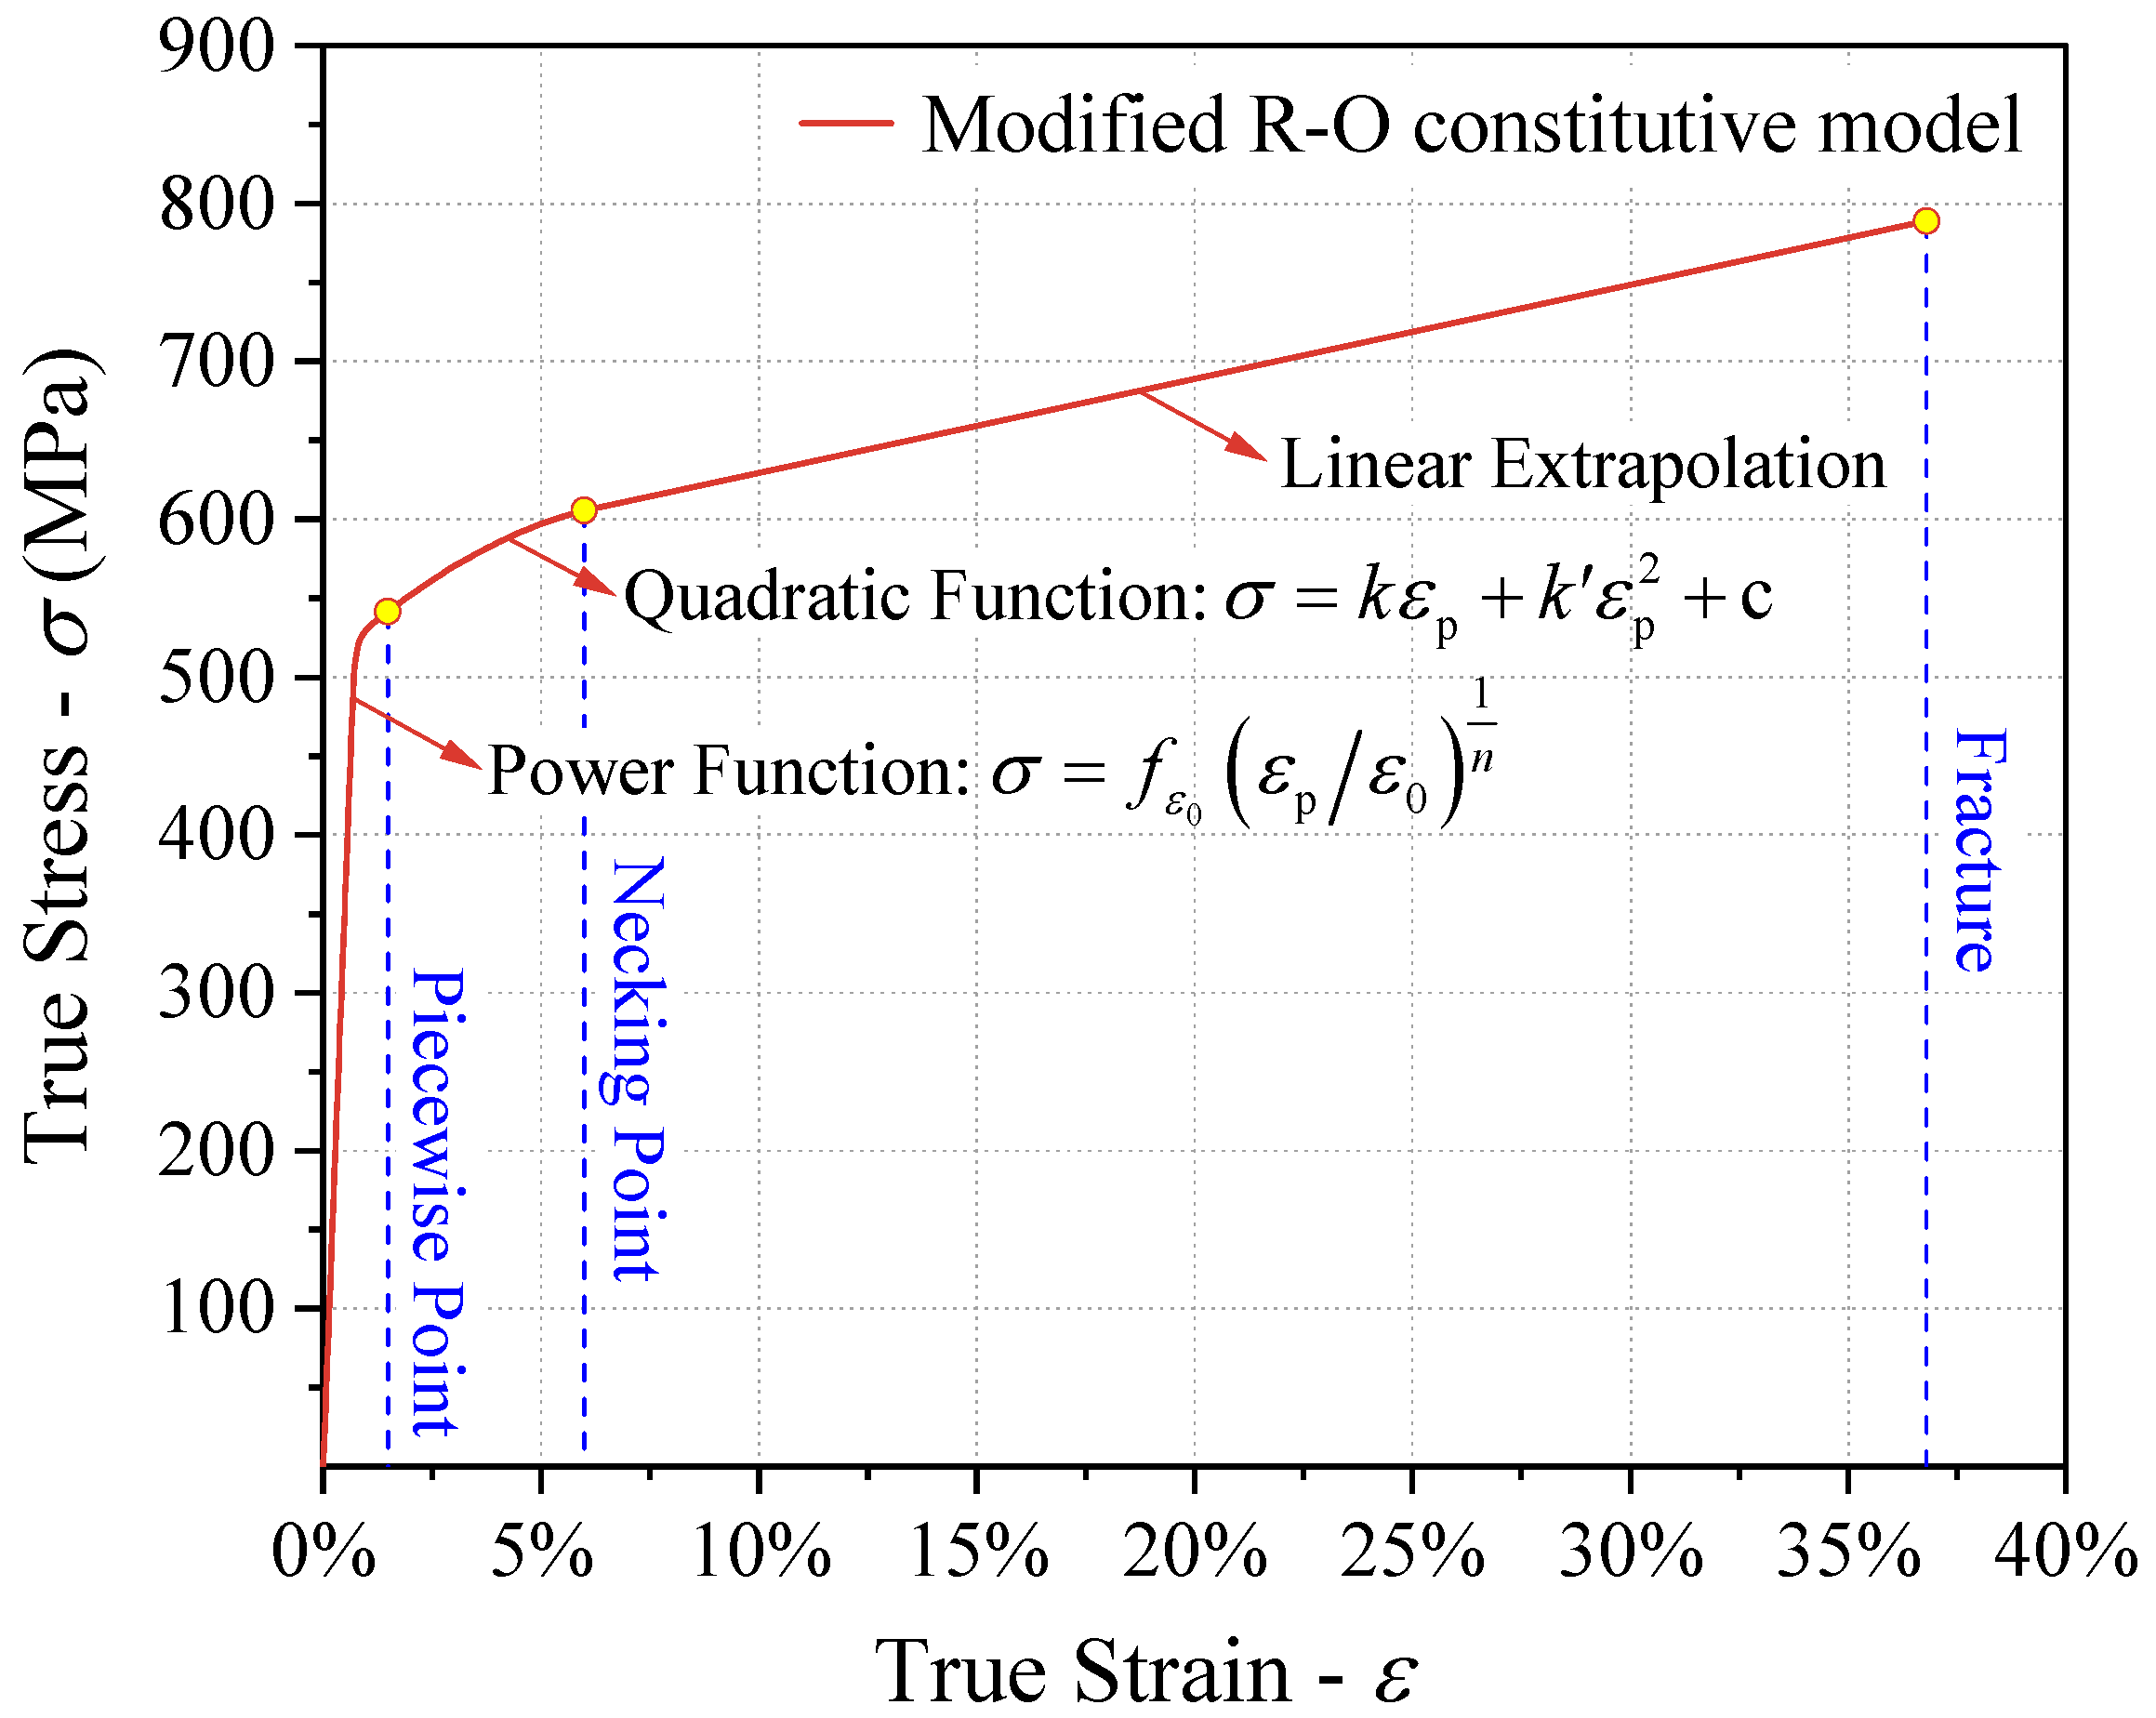
4.1. Piecewise Constitutive Model Establishment
4.2. Modified Constitutive Model Calibration and Result Analysis
4.2.1. LLS Method
4.2.2. Approximate Value Method
4.2.3. Analysis of Calibration Results
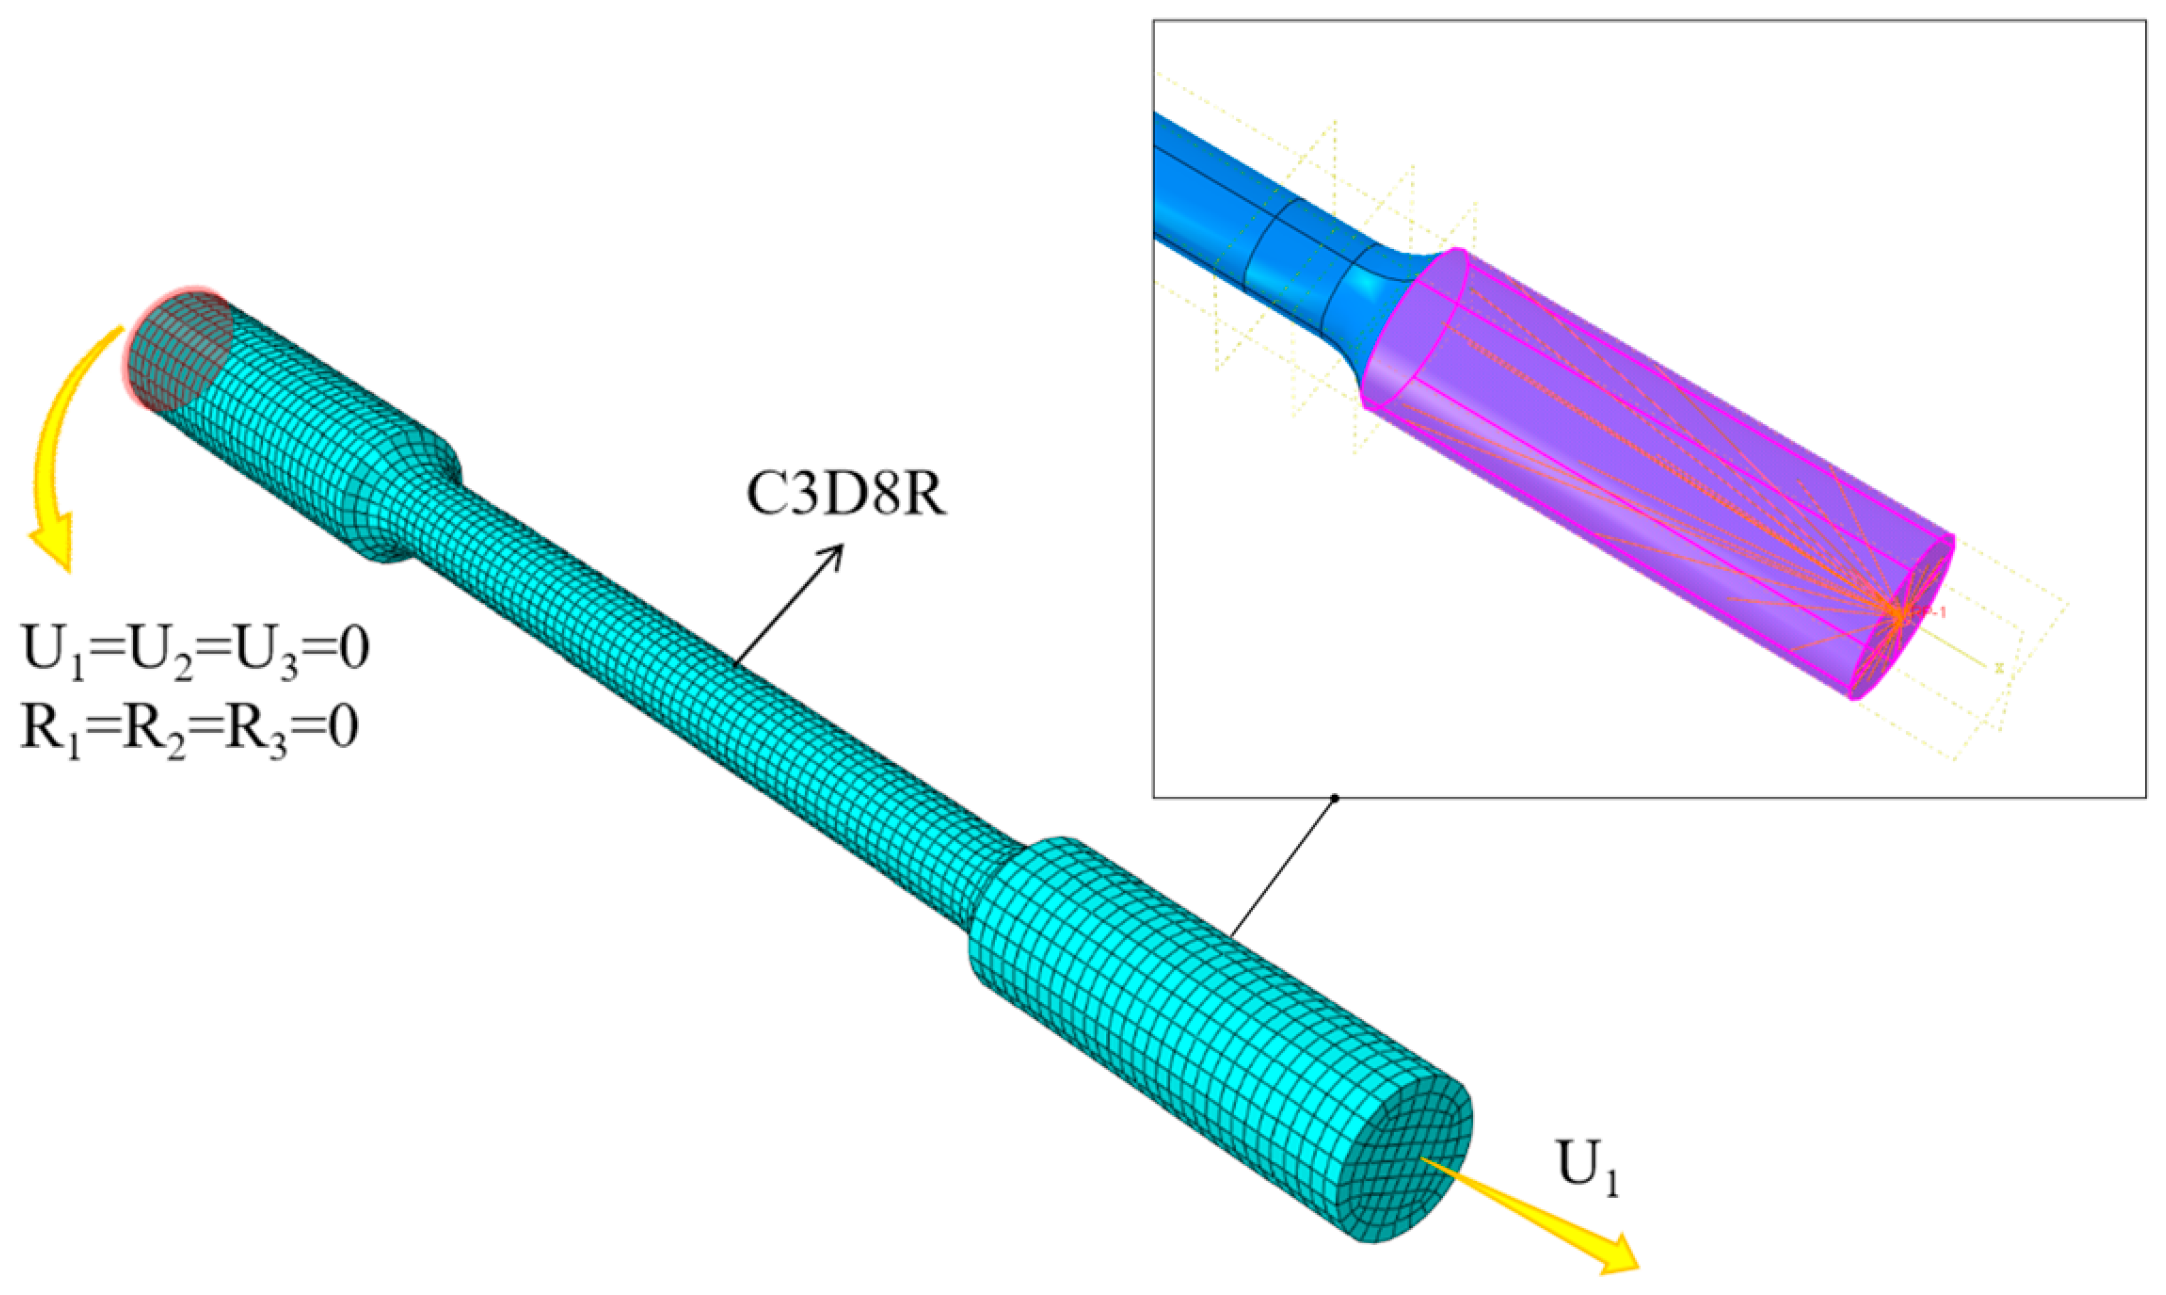
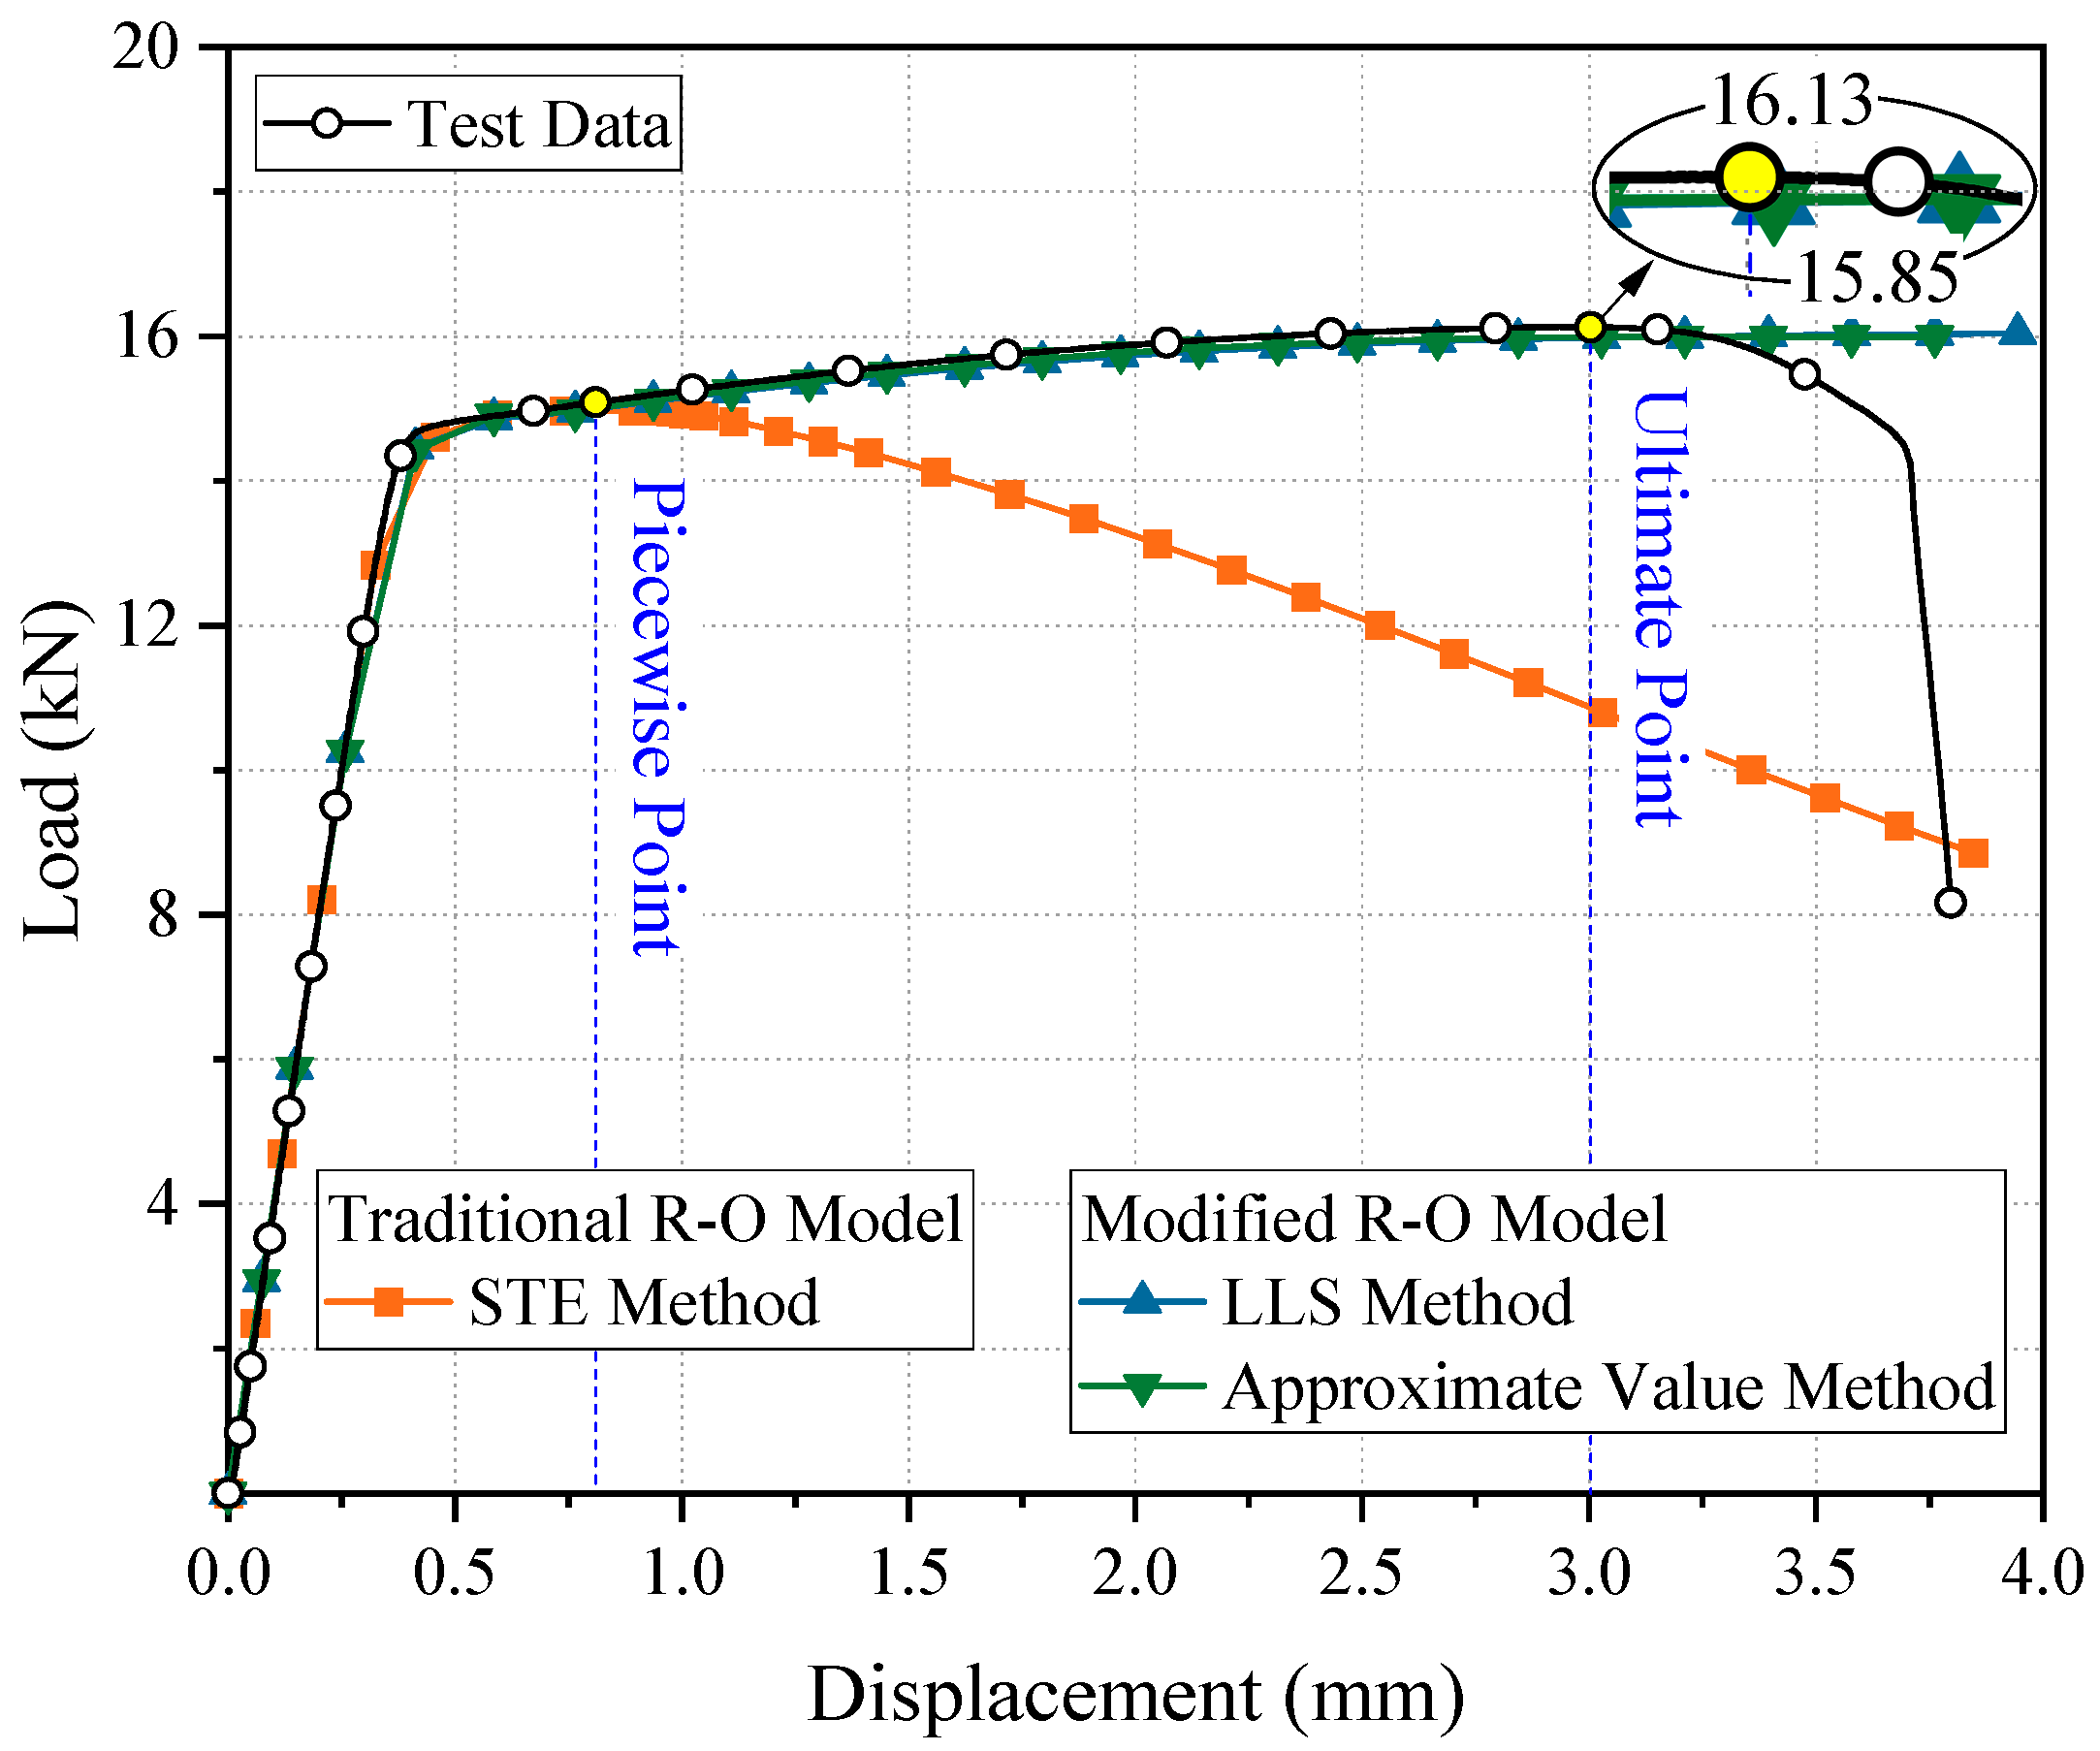
5. Verification of the Modified R–O Constitutive Model
6. Conclusions
- (1)
- Room-temperature tensile tests were conducted on 7075-T6 aluminum alloy specimens, obtaining fundamental mechanical properties such as the elastic modulus, nonproportional extension strength, ultimate strength, and fracture stress. These were used to establish an experimental foundation for the proposal and calibration of subsequent constitutive models.
- (2)
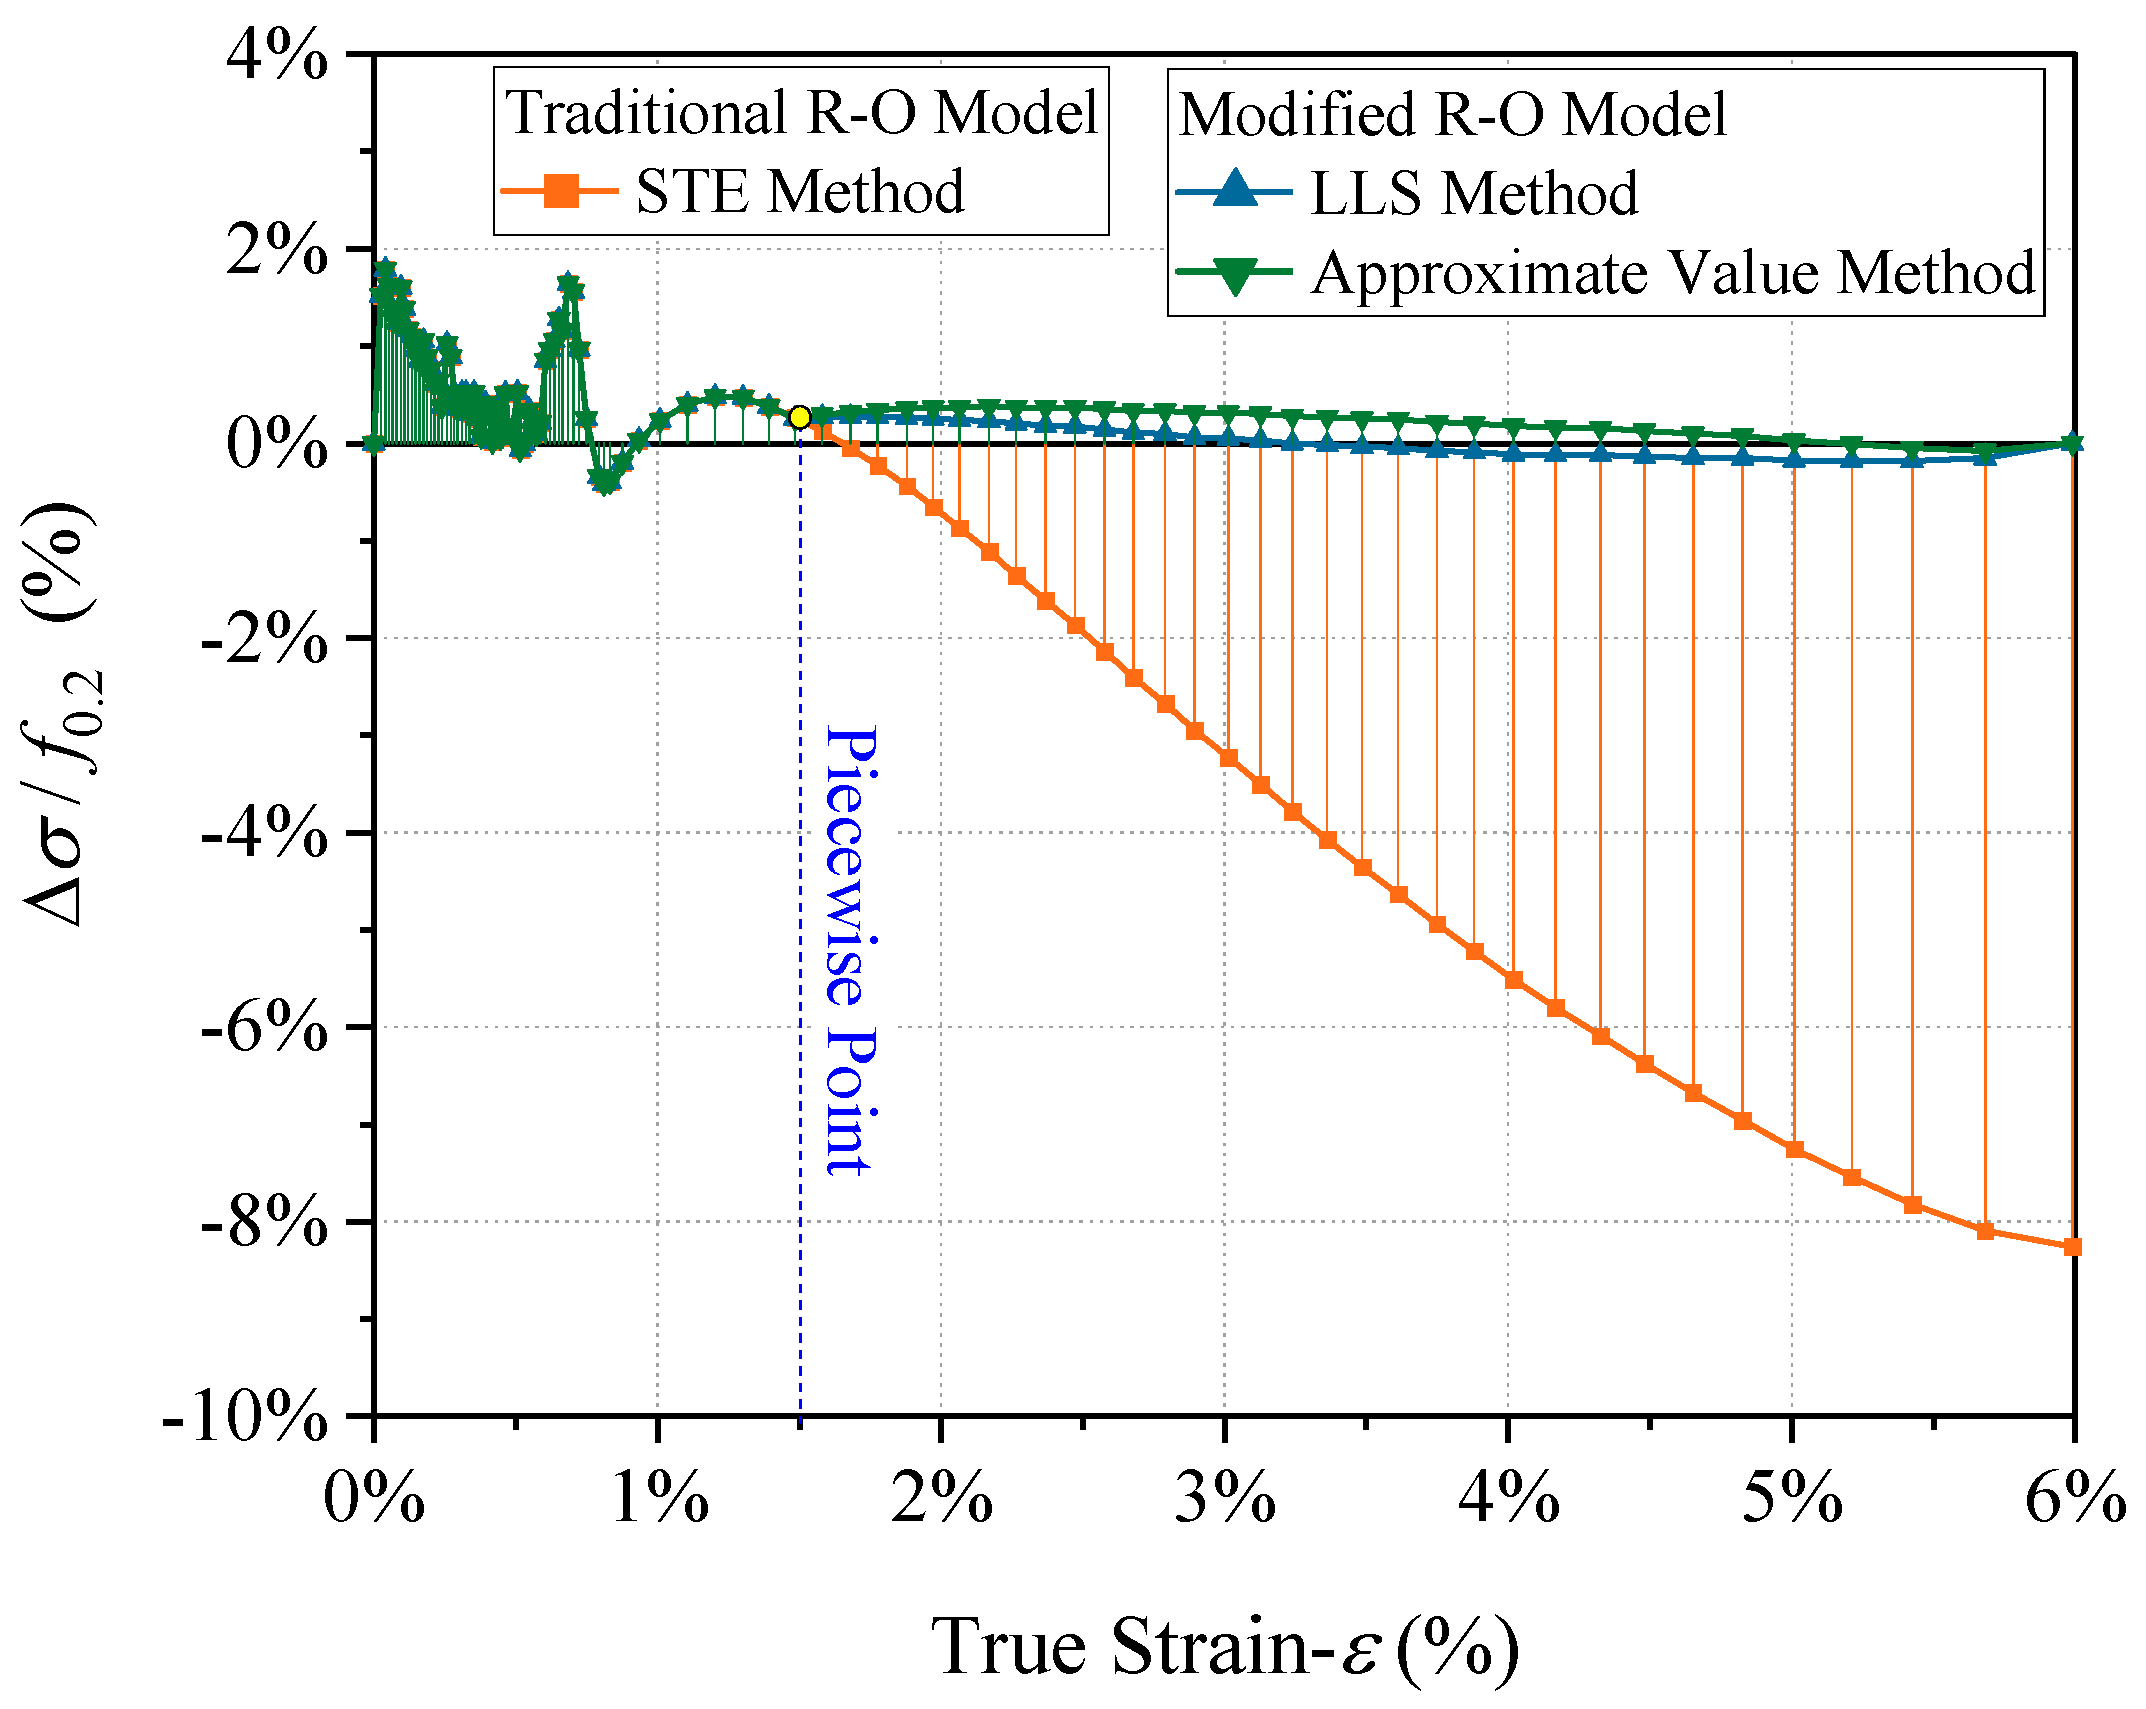
- The parameters of the classical R–O constitutive model were calibrated using the LLS method, the traditional TP method, and the STE method. The results indicated that in the common-strain range of 7075-T6 aluminum alloy (ε < 0.015), the reasonable value for n is 50 to 80.
- (3)
- To address the insufficient prediction accuracy of the classical R–O model in the large-strain stage (ε > 0.15), a modified R–O constitutive model based on a piecewise function was proposed. Compared with the classical model, the modified model reduced the fitting error by over 75% across the entire strain range, thereby verifying its effectiveness.
- (4)
- An approximate value method was developed to determine the parameters of the modified R–O model, requiring only the nonproportional extension strength and elastic modulus to achieve rapid model calibration. This approach eliminates the dependency of fitting-based calibration methods on full-range strain data, significantly improving its convenience for engineering applications.
Author Contributions
Funding
Data Availability Statement
Acknowledgments
Conflicts of Interest
Abbreviations
| CNC | computerized numerical control |
| LLS | linear least squares |
| TP | two point |
References
- Mazzolani, F.M. Aluminium Alloy Structures, 2nd ed.; Chapman & Hall: London, UK, 1995. [Google Scholar]
- Kissell, R.J.; Ferry, R.L. Aluminum Structures: A Guide to Their Specifications and Design, 2nd ed.; John Wiley & Sons: New York, NY, USA, 2002. [Google Scholar]
- Xiong, Z.; Guo, X.; Luo, Y.; Zhu, S. Elasto-plastic stability of single-layer reticulated shells with aluminium alloy gusset joints. Thin-Walled Struct. 2017, 115, 163–175. [Google Scholar] [CrossRef]
- Zhao, C.Q.; Zhou, Y.W.; Wang, G.; Li, H.; Wang, Y. Calculation method of the bearing capacity of a novel modular joint of an aluminium alloy lattice shell structure. Structures 2021, 34, 3268–3282. [Google Scholar] [CrossRef]
- Zhang, W.; Xiao, X.K.; Wei, G. Constitutive relationship and failure model of 7A04 aluminum alloys. Explos. Shock Wave 2011, 31, 81–87. (In Chinese) [Google Scholar]
- Li, J.J.; Ding, Y.J.; Wang, C.X.; Li, Z.Y.; Rong, B.; Wan, W.Y. Research on properties test and constitutive model of 7A04-T6 aluminum alloy tubes. Steel Constr. (Chin. Engl.) 2019, 34, 35–39. (In Chinese) [Google Scholar]
- Wang, Y.Q.; Wang, Z.X. Experimental investigation and FE analysis on constitutive relationship of high strength aluminum alloy under cyclic loading. Adv. Mater. Sci. Eng. 2016, 1–16. [Google Scholar] [CrossRef]
- Zhang, D.N.; Shangguan, Q.Q.; Xie, C.J.; Liu, F. A modified Johnson-Cook model of dynamic tensile behaviors for 7075-T6 aluminum alloy. J. Alloys Compd. 2015, 619, 186–194. [Google Scholar] [CrossRef]
- Chen, Z.H.; Lu, J.; Liu, H.B. Experimental investigation on mechanical properties of structural aluminum alloys after single and multiple fire exposure. J. Build Struc. 2017, 38, 149–159+174. (In Chinese) [Google Scholar]
- Chen, Z.H.; Lu, J.; Liu, H.B.; Liao, X.W. Experimental investigation on the post-fire mechanical properties of structural aluminum alloys 6061-T6 and 7075-T73. Thin-Walled Struct. 2016, 106, 187–200. [Google Scholar] [CrossRef]
- Senthil, K.; Iqbal, M.A.; Chandel, P.S.; Gupta, N. Study of the constitutive behavior of 7075-T651 aluminum alloy. Int. J. Impact Eng. 2017, 108, 171190. [Google Scholar] [CrossRef]
- Wang, G.; Zhang, P.; Kou, L.Y.; Wu, Y.; Wen, T.; Shang, X.; Liu, Z. Research on constitutive model of aluminum alloy 7075 thermal deformation based on deep neural network. J. Mech. Sci. Technol. 2023, 37, 707–717. [Google Scholar] [CrossRef]
- Wu, J.F.; He, D.G.; Lin, Y.; Chen, Z.J.; Ding, H.B.; Qiu, Y.L. A unified constitutive model and microstructure evolution of a solution treated 7075 aluminum alloys under warm forming condition. J. Mater. Res. Technol. 2024, 30, 4159–4168. [Google Scholar] [CrossRef]
- Xi, R.; Xie, J.; Yan, J.B. Low-Temperature Mechanical Properties of AA 6063-T6 and 7075-T6: Tests and Full-Range Constitutive Models. J. Mater. Civil Eng. 2024, 36, 04024341. [Google Scholar] [CrossRef]
- GB/T 3190-2020; Chemical Composition of Wrought Aluminum and Aluminum Alloys. Standards Press of China: Beijing, China, 2020. (In Chinese)
- GB/T 228.1-2011; Metallic Materials-Tensile Testing-Part 1: Method of Test at Room Temperature. Standards Press of China: Beijing, China, 2011. (In Chinese)
- Baehre, R. Trycktastravorav Elastoplastikt Material-Nagrafragestallningar (Comparison Between Structural Behaviour of Elastoplastic Materials); Rep. No. 16 Tekn.; De Arne Johnson Ingenjorsbyra: Stockholm, Sweden, 1966. (In German) [Google Scholar]
- Mazzolani, F.M. Characterization of the s-e law and buckling of aluminum columns. Constr. Met. 1972, 3, 112–122. [Google Scholar]
- Ramberg, W.; Osgood, W.R. Description of Stress-Strain Curves by Three Parameters; Technical Note No. 902; National Advisory Committee for Aeronautics: Washington, DC, USA, 1943.
- DeMartino, A.; Landolfo, R.; Mazzolani, F.M. The use of the Ramberg-Osgood law for materials of round-house type. Mater. Struct. 1990, 23, 59–67. [Google Scholar] [CrossRef]
- Steinhardt, O. Aluminum im Konstruktiven Ingenierbau (Aluminum constructions in civil engineering). Aluminum 1971, 47, 131–139. [Google Scholar]


| Specimen Number | E (GPa) | f0.1 (MPa) | f0.2 (MPa) | fu (MPa) | ff (MPa) | εu (%) | εf (%) | Ψ (%) |
|---|---|---|---|---|---|---|---|---|
| AL-7075-1 | 71.66 | 524 | 528 | 606 | 729 | 6.0 | 36.8 | 30.8 |
| AL-7075-2 | 74.55 | 523 | 527 | 606 | 706 | 6.1 | 37.3 | 31.1 |
| AL-7075-3 | 75.22 | 523 | 527 | 604 | 683 | 5.8 | 28.6 | 24.9 |
| AL-7075-4 | 73.17 | 525 | 529 | 607 | 752 | 6.1 | 36.1 | 30.3 |
| AL-7075-5 | 76.02 | 524 | 529 | 603 | 665 | 5.6 | 25.2 | 22.3 |
| Specimen Number | nLLS | nTP | nSTE |
|---|---|---|---|
| AL-7075-1 | 66.48 | 77.23 | 52.83 |
| AL-7075-2 | 61.43 | 79.45 | 52.72 |
| AL-7075-3 | 62.29 | 80.54 | 52.75 |
| AL-7075-4 | 62.87 | 86.30 | 52.88 |
| AL-7075-5 | 62.71 | 75.21 | 52.87 |
| Specimen Number | fs (MPa) | fu (MPa) | k | k′ | c | |||
|---|---|---|---|---|---|---|---|---|
| AL-7075-1 | 52.83 | 0.0073 | 0.052 | 540 | 606 | 2597 | −18,917 | 522 |
| AL-7075-2 | 52.72 | 0.0076 | 0.053 | 540 | 606 | 2637 | −19,653 | 521 |
| AL-7075-3 | 52.75 | 0.0076 | 0.050 | 541 | 604 | 2638 | −19,773 | 521 |
| AL-7075-4 | 52.88 | 0.0080 | 0.052 | 542 | 607 | 2612 | −19,148 | 522 |
| AL-7075-5 | 52.87 | 0.0081 | 0.048 | 542 | 603 | 2638 | −19,855 | 522 |
| Specimen Number | fs | fu | k | k′ | c | |||
|---|---|---|---|---|---|---|---|---|
| AL-7075-1 | 52.83 | 0.0076 | 541 | 0.051 | 607 | 2640 | −19,100 | 458 |
| AL-7075-2 | 52.72 | 0.0072 | 540 | 0.051 | 606 | 2635 | −19,384 | 457 |
| AL-7075-3 | 52.75 | 0.0072 | 540 | 0.051 | 606 | 2635 | −19,384 | 457 |
| AL-7075-4 | 52.88 | 0.0074 | 542 | 0.051 | 608 | 2645 | −19,371 | 459 |
| AL-7075-5 | 52.87 | 0.0071 | 542 | 0.054 | 608 | 2645 | −20,258 | 459 |
Disclaimer/Publisher’s Note: The statements, opinions and data contained in all publications are solely those of the individual author(s) and contributor(s) and not of MDPI and/or the editor(s). MDPI and/or the editor(s) disclaim responsibility for any injury to people or property resulting from any ideas, methods, instructions or products referred to in the content. |
© 2025 by the authors. Licensee MDPI, Basel, Switzerland. This article is an open access article distributed under the terms and conditions of the Creative Commons Attribution (CC BY) license (https://creativecommons.org/licenses/by/4.0/).
Share and Cite
Zhang, Y.; Zhao, L.; Cao, Z.; Wu, B. Modified Constitutive Model and Practical Calibration Method for Constructional 7075-T6 Aluminum Alloy. Buildings 2025, 15, 2306. https://doi.org/10.3390/buildings15132306
Zhang Y, Zhao L, Cao Z, Wu B. Modified Constitutive Model and Practical Calibration Method for Constructional 7075-T6 Aluminum Alloy. Buildings. 2025; 15(13):2306. https://doi.org/10.3390/buildings15132306
Chicago/Turabian StyleZhang, Yishu, Lin Zhao, Zhenggang Cao, and Bizhao Wu. 2025. "Modified Constitutive Model and Practical Calibration Method for Constructional 7075-T6 Aluminum Alloy" Buildings 15, no. 13: 2306. https://doi.org/10.3390/buildings15132306
APA StyleZhang, Y., Zhao, L., Cao, Z., & Wu, B. (2025). Modified Constitutive Model and Practical Calibration Method for Constructional 7075-T6 Aluminum Alloy. Buildings, 15(13), 2306. https://doi.org/10.3390/buildings15132306