Article

The Influence of Soft Soil, Pile–Raft Foundation and Bamboo on the Bearing Characteristics of Reinforced Concrete (RC) Structure

1
Chengdu Construction & Engineering Group Third Construction Co., Ltd., Chengdu 610016, China
2
Chengdu Technological University, Chengdu 610031, China
3
School of Emergency Management, Xihua University, Chengdu 610039, China
4
School of Civil Engineering, Southwest Jiaotong University, Chengdu 611756, China
5
China Southwest Geotechnical Investigation & Design Institute Co., Ltd., Chengdu 610052, China
*
Author to whom correspondence should be addressed.
Buildings 2025, 15(13), 2302; https://doi.org/10.3390/buildings15132302
Submission received: 21 April 2025 / Revised: 22 June 2025 / Accepted: 24 June 2025 / Published: 30 June 2025
(This article belongs to the Section Building Structures)

Abstract

Pile–raft foundations are widely used in soft soil engineering due to their good integrity and high stiffness. However, traditional design methods independently design pile–raft foundations and superstructures, ignoring their interaction. This leads to significant deviations from actual conditions when the superstructure height increases, resulting in excessive costs and adverse effects on building stability. This study experimentally investigates the interaction characteristics of pile–raft foundations and superstructures in soft soil under different working conditions using a 1:10 geometric similarity model. The superstructure is a cast-in-place frame structure (beams, columns, and slabs) with bamboo skeletons with the same cross-sectional area as the piles and rafts, cast with concrete. The piles in the foundation use rectangular bamboo strips (side length ~0.2 cm) instead of steel bars, with M1.5 mortar replacing C30 concrete. The raft is also made of similar materials. The results show that the soil settlement significantly increases under the combined action of the pile–raft and superstructure with increasing load. The superstructure stiffness constrains foundation deformation, enhances bearing capacity, and controls differential settlement. The pile top reaction force exhibits a logarithmic relationship with the number of floors, coordinating the pile bearing performance. Designers should consider the superstructure’s constraint of the foundation deformation and strengthen the flexural capacity of inner pile tops and bottom columns for safety and economy.

1. Introduction

With the development of high-rise buildings and complex foundation engineering, the design and application of pile–raft foundations on soft land foundations are increasingly common [1,2]. A pile–raft foundation combines the advantages of pile foundations and raft foundations, which can effectively improve the foundation bearing capacity and control the settlement [3,4]. However, the traditional design method usually considers the pile–raft foundation separately from the superstructure, ignoring the influence of the interaction on the overall mechanical properties. This design method has some limitations in practical engineering, especially in high-rise buildings; the coupling of the pile–raft foundation and the superstructure is crucial to the bearing characteristics and settlement control. The bearing capacity of the soft land foundation is low and the settlement is large, so measures need to be taken to improve the bearing capacity and reduce the settlement during the design. Piles in the raft foundation provide additional bearing capacity and reduce settlement, while the raft further disperses the load through contact with the foundation soil. Many studies have shown that the pile–raft foundation can effectively improve the overall performance of the foundation system in soft land.
Deb et al. [5] studied the different behaviors of a combined pile–raft foundation (CPRF) under soft soil/clay conditions through experiments. Harianto et al. [6] explored the soil reinforcement technique using wood as the foundation material for pile–raft under soft soil conditions. The results showed that the vertical settlement of the pile–raft foundation had the highest settlement reduction rate, of 65%. Abdel-Azim et al. [7] explored the behavior of a pile–raft foundation under the conditions in Frankfurt, based on the monitoring data of the Messeturm building in Germany. The results show that the pile–raft foundation used by the Messeturm building is the optimal solution, which effectively controls the settlement and determines the thickness of the raft. Lin et al. [8] discussed the application of a pile–raft foundation in solving the problems of low bearing capacity and the excessive settlement of the raft foundation in soft soil, especially the influence of the pile on the underground continuous wall and raft behavior. The results show that the pile can reduce the lateral displacement of the underground continuous wall, reduce the settlement influence range around the foundation pit, and improve the deformation mode and ground settlement of the underground continuous wall. Watcharasawe et al. [9] preliminarily confirmed the feasibility of using a pile–raft foundation system to construct high-rise buildings with basements in soft clayey soil through a series of parametric studies by three-dimensional (3D) finite element analysis.
In order to understand the joint effects of pile–raft foundation, superstructure, and soft land foundation, many studies use the methods of numerical simulation and physical model test. Numerical simulation can effectively analyze the mechanical characteristics of the three aforementioned factors under complex working conditions, while physical model tests provide intuitive experimental data to verify the reliability of numerical models.
Visuvasam et al. [10] studied the influence of the soil–pile–structure interaction on the RC building frame in earthquake conditions, especially in the soft soil layer. An equivalent static analysis was performed using PLAXIS 3D, considering the parameters of different building heights (5th floor, 10th floor, 15th floor), relative soil density (30%, 50%, 70%), and pile spacing (2D, 4D, 6D). For the pile spacing, 2D, 4D, and 6D refer to the distances between the centers of adjacent piles being two times, four times, and six times the pile diameter (D). The results showed that the soil–pile–structure interaction significantly affected the behavior of tall buildings, especially the lateral and interlayer displacement on the low and high floors. With the increase in the number of building floors, the decrease in soil density, and the narrowing of the pile spacing, the lateral displacement of the piles and the sway of the raft intensify, which leads to the response amplification of the building structure. Lee et al. [11] proposed a computational procedure combined with an approximate hybrid analysis method for the practical design of a pile–raft foundation, aiming to optimize the performance of the pile–raft foundation as a settlement reducer. This method considers the interactions of pile–soil, raft–soil, pile–soil–pile, and raft–soil–pile, and studies the nonlinear behavior of the pile and the interaction between the pile–raft and soil by comparing the results of a 3D finite element analysis. Bisht et al. [12] discussed the influence of the three key design parameters of pile number, pile length, and pile spacing on the interactions of pile–pile–soil and raft–pile–soil interaction. Patil et al. [13] analyzed soil–pile–raft-superstructure complex interaction for nuclear facilities on a soil site pile–raft joint foundation (CPRF) using 3D modeling. Their study indicates that the CPRF system offers more advantages when compared to independent raft foundations or pile foundations. It can effectively control settlement, and both the stiffness of the superstructure and the sequence of the construction have a positive impact on the system. Yang [14] analyzed the seismic response characteristics of a plant with a fixed foundation and a pile–raft foundation. The test included a free field, a fixed foundation structure, and a pile–raft foundation structure embedded in soil, and investigated the influence of seismic strength, frequency, soil–pile–structure interaction, and soil nonlinearity on the dynamic response of the system. Hanna et al. [15] analyzed the key parameters affecting the load sharing mechanism through an experiment on a prototype pile–raft foundation in sand, and the results showed that the pile spacing and settlement were the main factors in the load sharing of the pile–raft foundation. Chaudhuri et al. [16] studied the dynamic behavior of a pile–raft foundation embedded in soft clay under earthquake conditions through a 3D finite element analysis, and the influence of raft flexibility, pile spacing and pile diameter ratio, and pile length asymmetry on the dynamic characteristics and seismic response of the pile–raft foundation system were analyzed. Jayalekshmi et al. [17] analyzed the influence of different soil layers, chimney height, and raft thickness on the structure response. The study of the joint effect of the pile–raft foundation and superstructure provides new ideas for practical engineering design. The design method based on the theory of common action emphasizes systematization and integrity, and can optimize the matching of the pile layout, the raft thickness, and the stiffness of the superstructure, so as to improve the economy on the premise of ensuring safety.
Mishra et al. [18] studied the performance of a pile–raft foundation under vertical load, and mainly discussed the influence of soil characteristics, pile diameter, pile spacing, pile group arrangement, and raft thickness. The results show that the change in soil friction angle significantly affects the settlement behavior of the single pile system, and the settlement decreases when the friction angle increases. In addition, the pile diameter, pile length, raft thickness and pile group layout have a significant impact on the load–settlement behavior of the pile–raft foundation; in particular, the pile group layout plays a key role in the load carrying capacity of the system. Sinha et al. [19] simulated the load sharing behavior of a pile–raft foundation. A model was verified for analyzing the key parameters affecting the performance of the pile–raft foundation, such as the pile spacing, pile length, pile shape, pile diameter, raft thickness, and mechanical characteristics of the surrounding soil (shear strength angle and cohesion). The results provide guidance for the economic design of pile–raft foundations. Singh [20] proposed an analysis model for predicting the ultimate bearing capacity of a pile–raft foundation, and PLAXIS-3D simulated a full-size raft foundation. The soil density has a significant influence on the bearing capacity of the pile–raft foundation, and the relative density of sand is proposed. This method provides a reliable basis for the economic design of pile–raft foundations.
At present, as part of the structural research on and design of high-rise buildings, in the studies in the technical literature, the superstructure, foundations and soft land are considered separately. However, this design method of separating the interaction between these three aspects ignores the synergistic working relationship and the interaction between the superstructure and the pile–raft foundation. Therefore, for the soft land foundation formed in inland China, studying the mechanical characteristics of soil–foundation–superstructure working together provides more accurate theoretical guidance for engineering design, which is of profound significance for engineering practice and optimization design.

2. Model Parameters and Layout

2.1. Preparation of Similar Materials

Considering economy and other factors, this model experiment adopts a similar theory [21] to conduct the model design. It mainly focuses on the influence of the construction condition of frame building in soft land foundation on the deformation performance of pile foundation. The similar relationships in the present trial model are shown in Table 1.
In order to make the materials of the model test closer to those in the actual engineering, the superstructure, plate, and body in the model test are made of concrete pouring for self-mixing test, and the integrity and safety of the structure are checked through the preliminary design of PKPM (PKPM is well-known Chinese architectural engineering software for design, analysis, and management, with key modules like PK (frame design) and PM (modeling)). Through the calculation, the rigid heart, eccentricity, floor shear, and inter-layer displacement are in line with the “Code for Fire Protection Design of Buildings” [22]. The minimum weight ratio of the component is not less than 20, without considering the second-order effect of gravity.

Preparation of the Concrete in the Model

In order to simulate the mechanical properties of the prototype C30 concrete, we need to convert the material properties similarly, and choose suitable alternative materials. It is known that the theoretical compressive strength of C30 concrete is 30 MPa, and the compressive strength of the target material should be 1.5 MPa.
Portland Composite Cement (P·O) is a hydraulic cementitious material made by grinding, mainly from Portland cement clinker, with 5–20% admixtures (e.g., fly ash, slag) and appropriate gypsum, coded “P·O”. ” Its 28-day compressive strength is ≥42.5 MPa, making it a medium-strength cement. This ordinary Portland cement has the characteristics of high strength, fast hardening, and small shrinkage, but due to its fast hydration reaction, hydration heat is larger. In contrast, P·P is a hydraulic binder composed of clinker, 20–50% pozzolanic materials (e.g., volcanic ash, fly ash, calcined clay), and gypsum. These pozzolans contain reactive SiO2/Al2O3, enabling secondary hydration with calcium hydroxide from cement hydration. Volcanic ash Portland cement is made by adding volcanic ash material and gypsum on the basis of Portland cement clinker. Its early strength is low, the hydration heat is small, and it has good fire and heat resistance. After comparing and analyzing the characteristics of the two kinds of cement, considering the need of pouring mass concrete components and economic and construction constraints, P·O 42.5 ordinary Portland cement was selected as the test material.
In terms of the mix ratio, the mix ratio of M1.5 masonry mortar is determined by the method of linear calculation according to the formula for different grade of masonry mortar in the actual project. To meet the test requirements, cement was replaced with 42.5 for the preparation of test model concrete material. The combination is shown in Table 2.
As for the problem of lime in the original mix ratio, common admixtures such as fly ash, lime, and mineral powder will reduce the tensile strength and elastic modulus of mortar [23,24]. The formula for the M1.5 masonry mortar used in this test does not consider lime. The time interval between two consecutive components during pouring can be seen through the analysis of cement hydration heat test and other research [25,26]. The temperature generated by the hydration heat can be used as a measure of its reaction rate. Through design comparison, the pouring work for the next component can be conducted for about 3 days after pouring. The test operation table is shown in Figure 1.
To simulate the mechanical properties of the steel bars in the original model after scaling, material selection was carried out. Through comparison of mechanical parameters, the mechanical properties of round moso bamboo matched the expected values. The root segments of 4-year-old moso bamboo were selected to prepare the bamboo reinforcement for the test model. The bamboo was processed into bamboo slices after anti-corrosion, mildew-proof, and node-removal treatment, and then further processed into bamboo strips, making preparations for later binding. The bamboo samples are shown in Figure 2, below.

2.2. The Production of Models

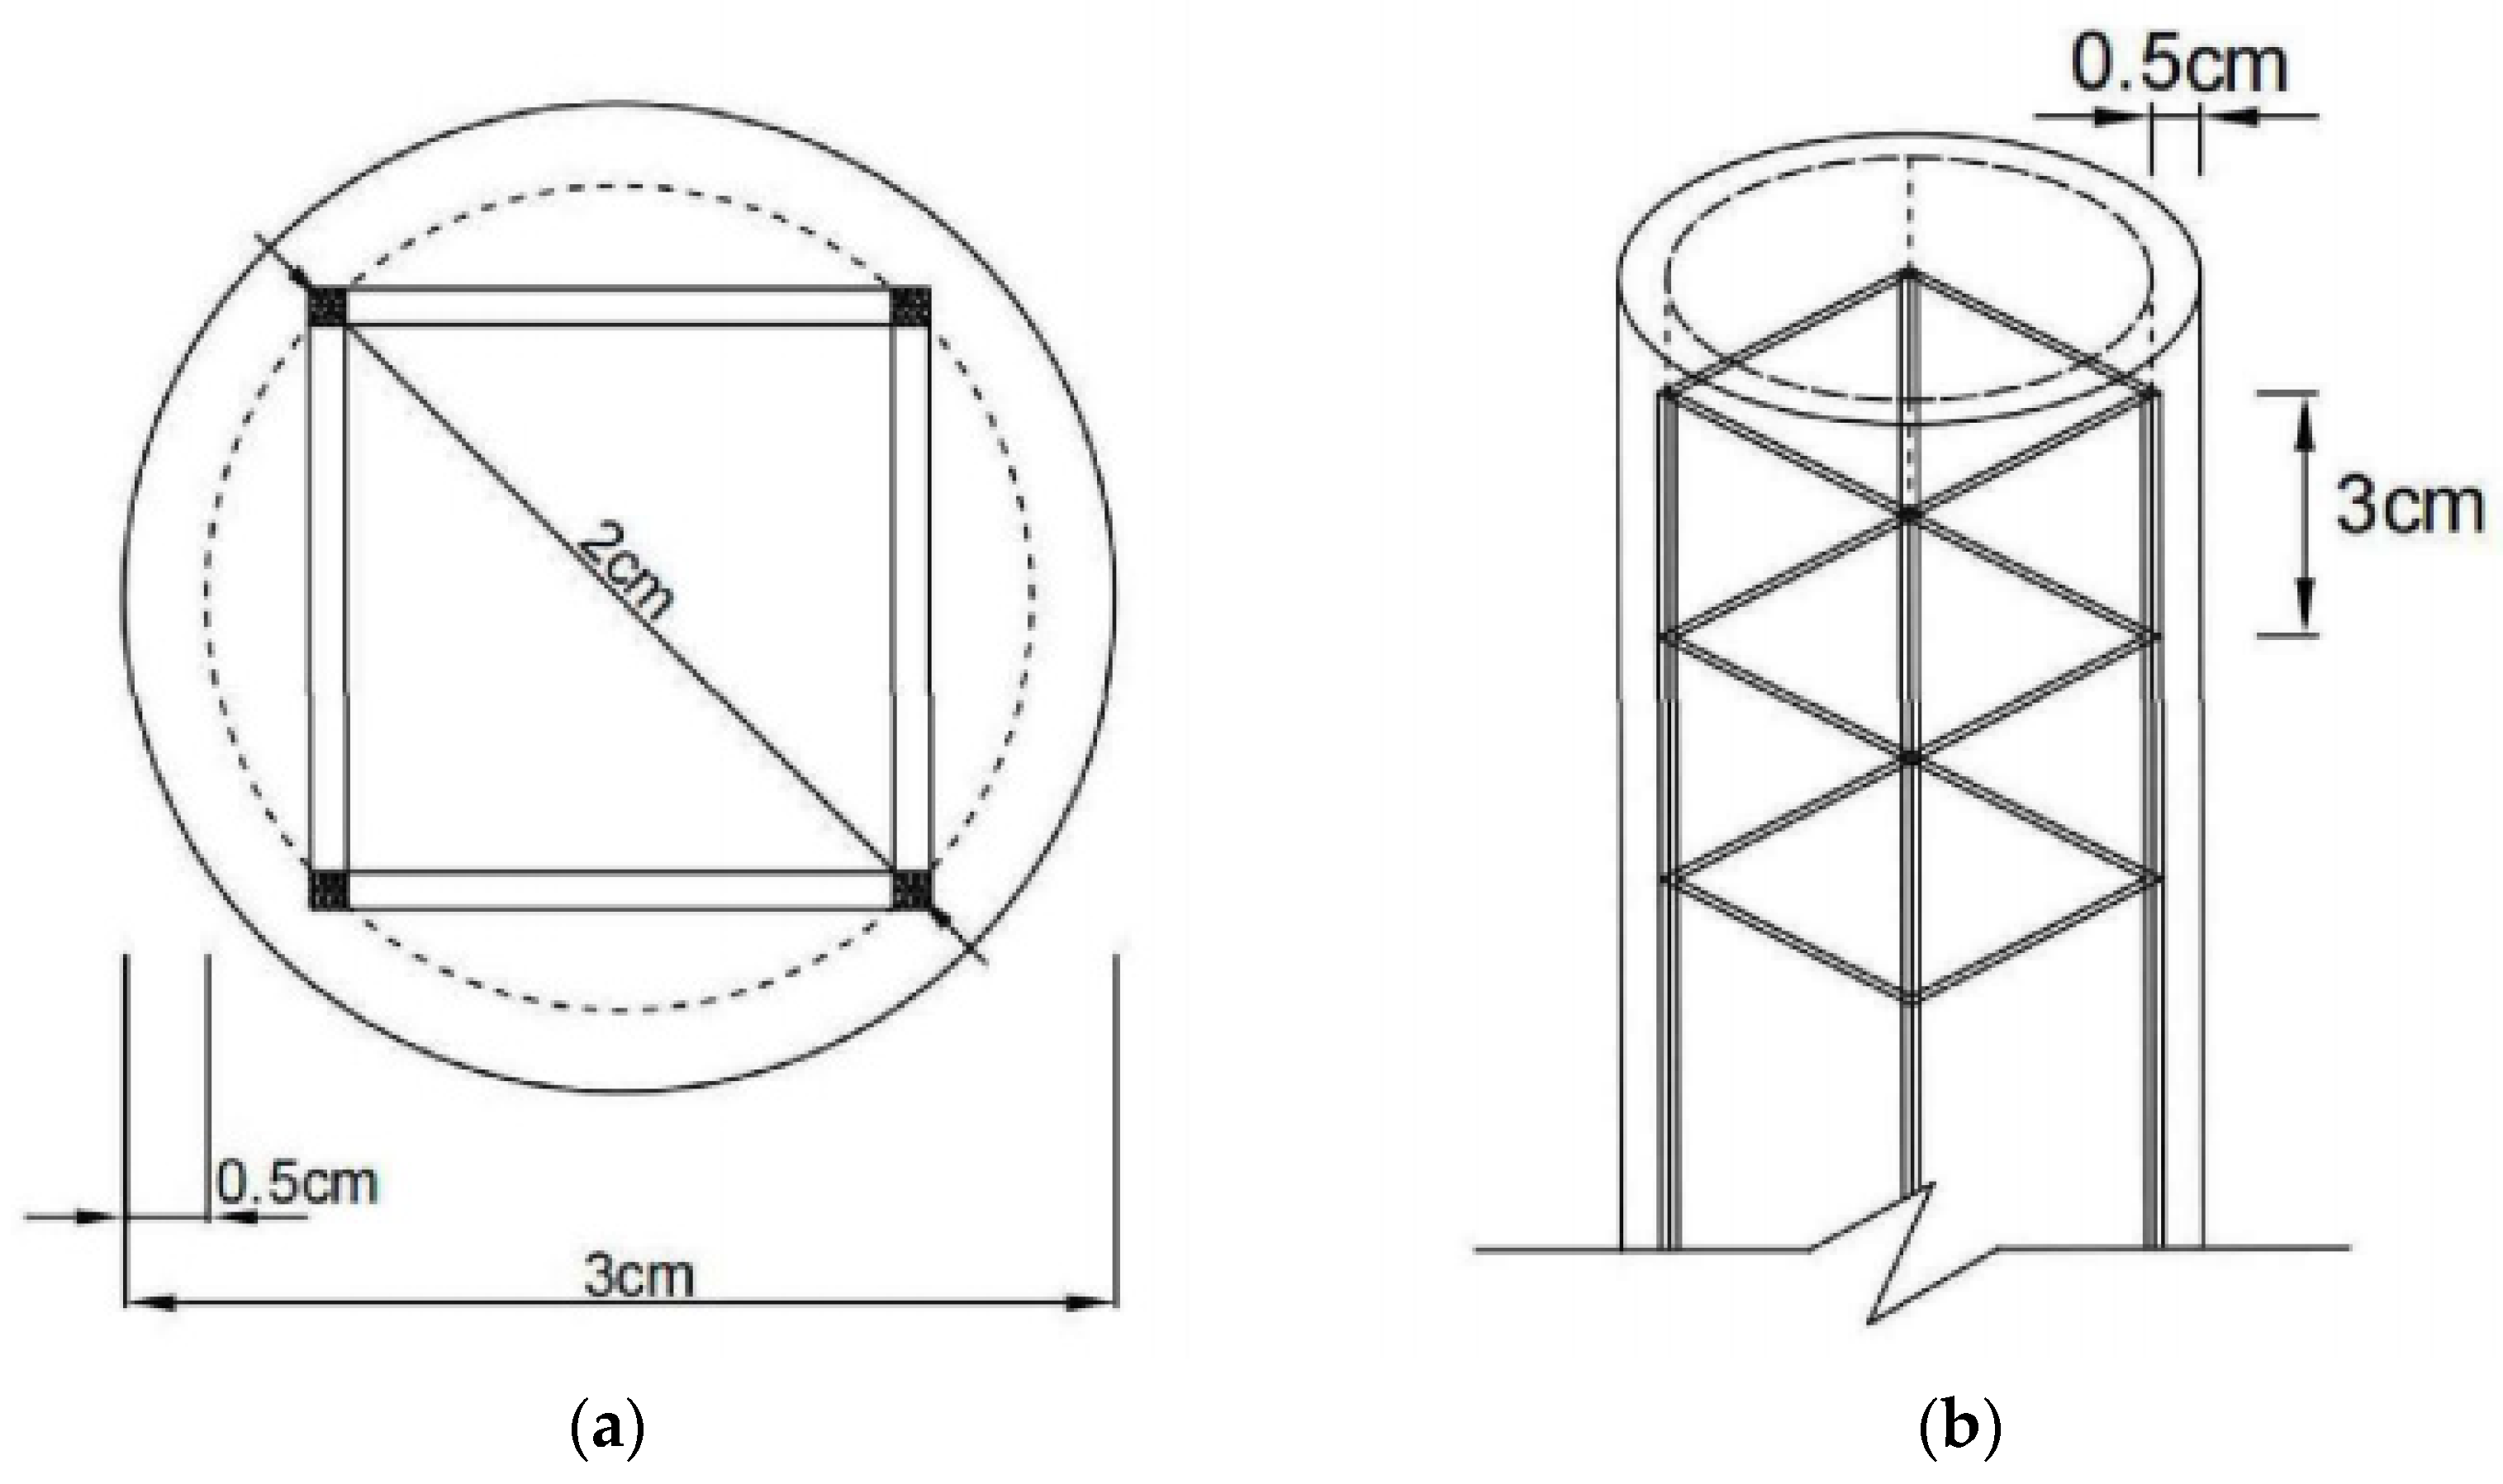
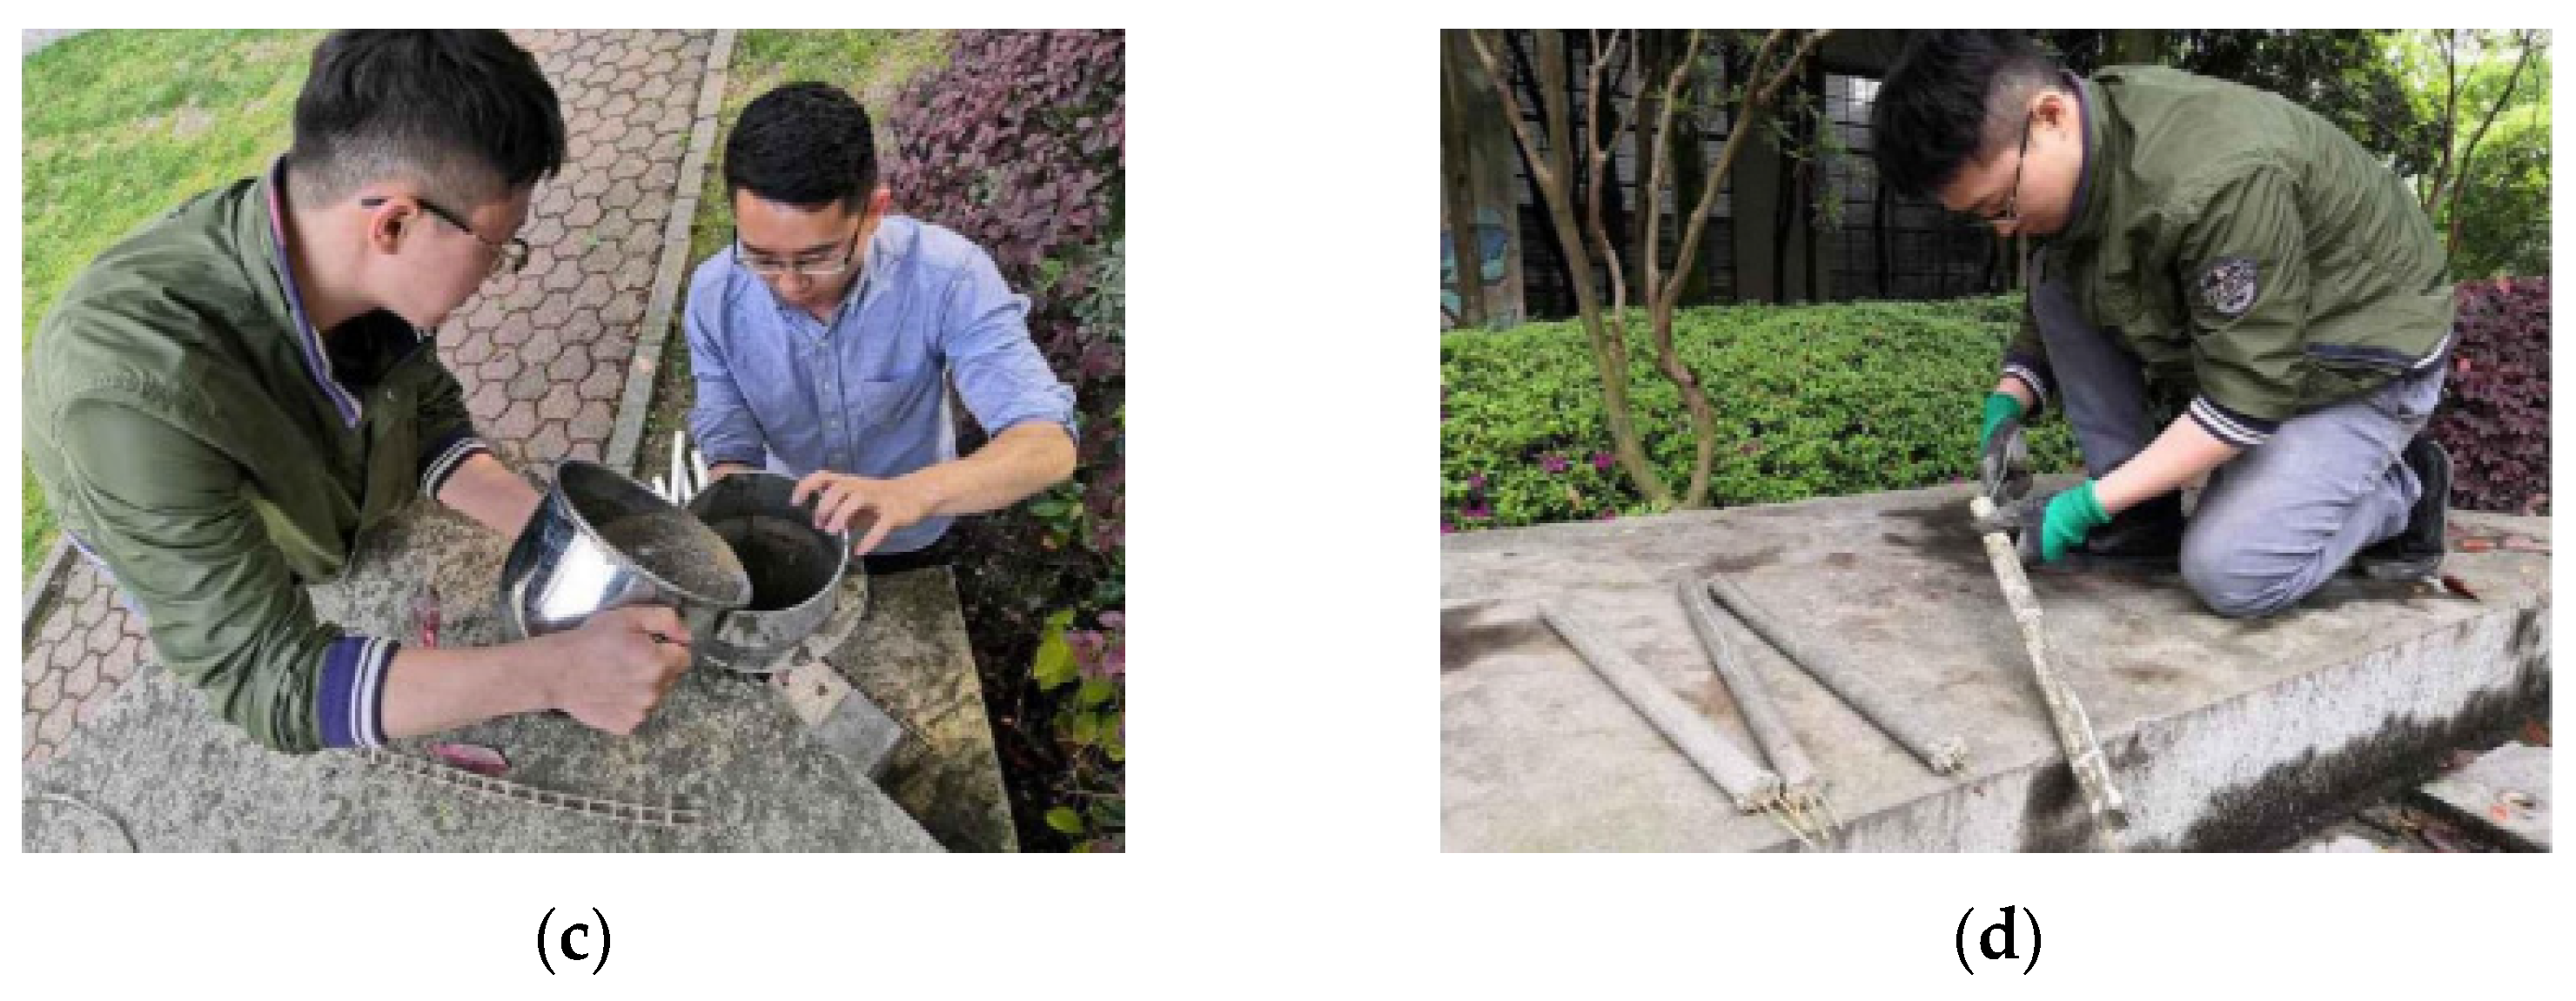
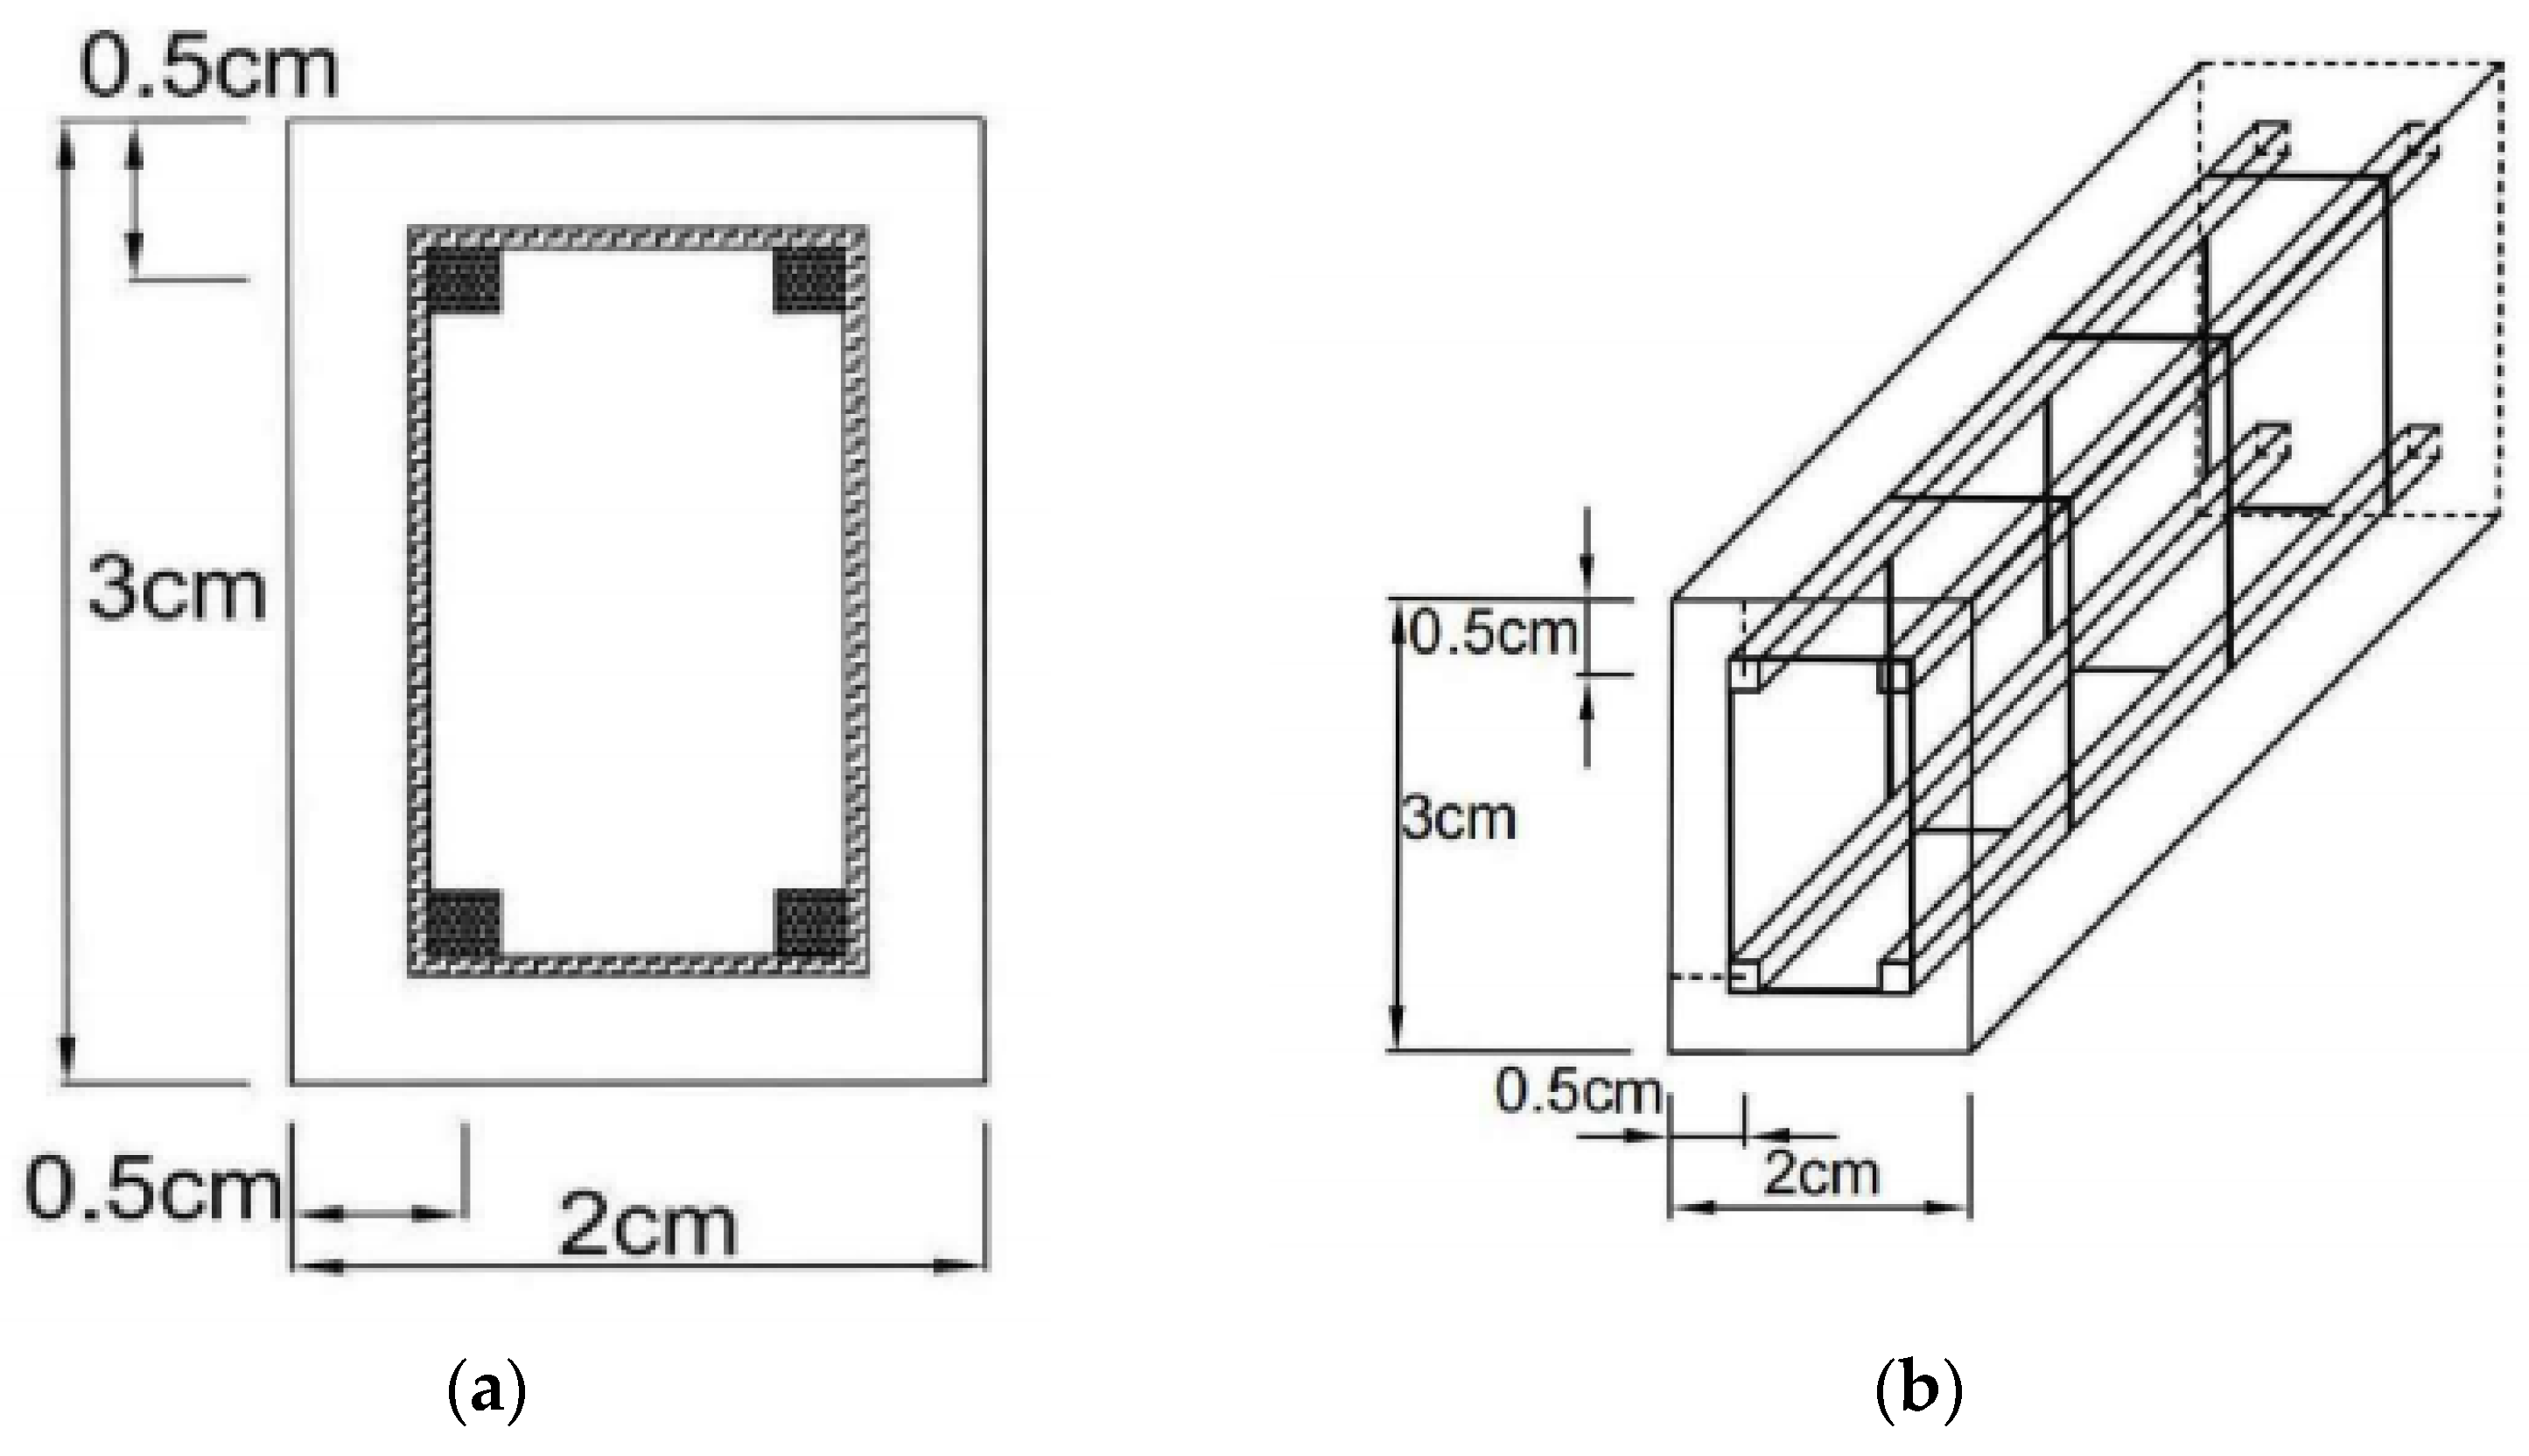
2.2.1. The Making of Pile

Considering that the pile is placed in the soft soil layer, which is a friction pile, and prefabricated through the comparison of the mechanical properties of the material, the elastic modulus of round bamboo meets the expected requirements of the test reinforcement, but the bulk weight and compressive strength need to be adjusted, and the principle of giving priority to the mechanical properties should be adjusted here. Set the pile body diameter to 3 cm and the pile body length to 50 cm. Then, the cross-sectional area of the pile body is 7.069 cm2. According to the Technical Code of Building Pile Foundations, when the pile body diameter is 300–2000 mm, the cross-sectional reinforcement ratio can be 0.65–0.2%. The smaller the pile diameter, the higher the value. After a similarity ratio of 1:10, the shrinkage size is calculated. Here, a 0.65% reinforcement ratio is adopted. It is known that the area of the positive bamboo material should be 7.069 × 0.65% = 0.04595 cm2. Since the bulk density of the ideal test reinforcement is 3 times that of the bamboo, the actual area should be 0.04595 × 3 = 0.1379 cm2. To fit the actual engineering conditions, bamboo tendons are made up of four bamboo strips. So, the total area should be divided by 4, resulting in 0.034475 cm2. It can be seen that the side length of the single bamboo strip section should be 0.2 cm. According to the specification [27], the thickness of the protective layer should not be less than the diameter of the bamboo reinforcement and should not be less than 40 mm. After a similar ratio of 1 to 10, the thickness of the protective layer of the bamboo reinforcement is set to 5 mm, and the upper and lower ends are set up successively, with a spacing of 3 cm. The specific layout of the bamboo cage is shown in Figure 3.
The material for replacing the reinforcement inside the pile is a rectangular round bamboo strip with a side length of about 0.2 cm. Outside the body, replace C30 concrete with masonry mortar M1.5. Take the PVC hose with 3 cm diameter on the inner wall as the mold, arrange the length of the bamboo strip with about 55 cm in length, as shown above, and as with the one used when tying the raft and the superstructure, and then fill the masonry mortar M1.5 into the pipe. The PVC mold and bamboo reinforcement cage used in the pile are shown in Figure 4.

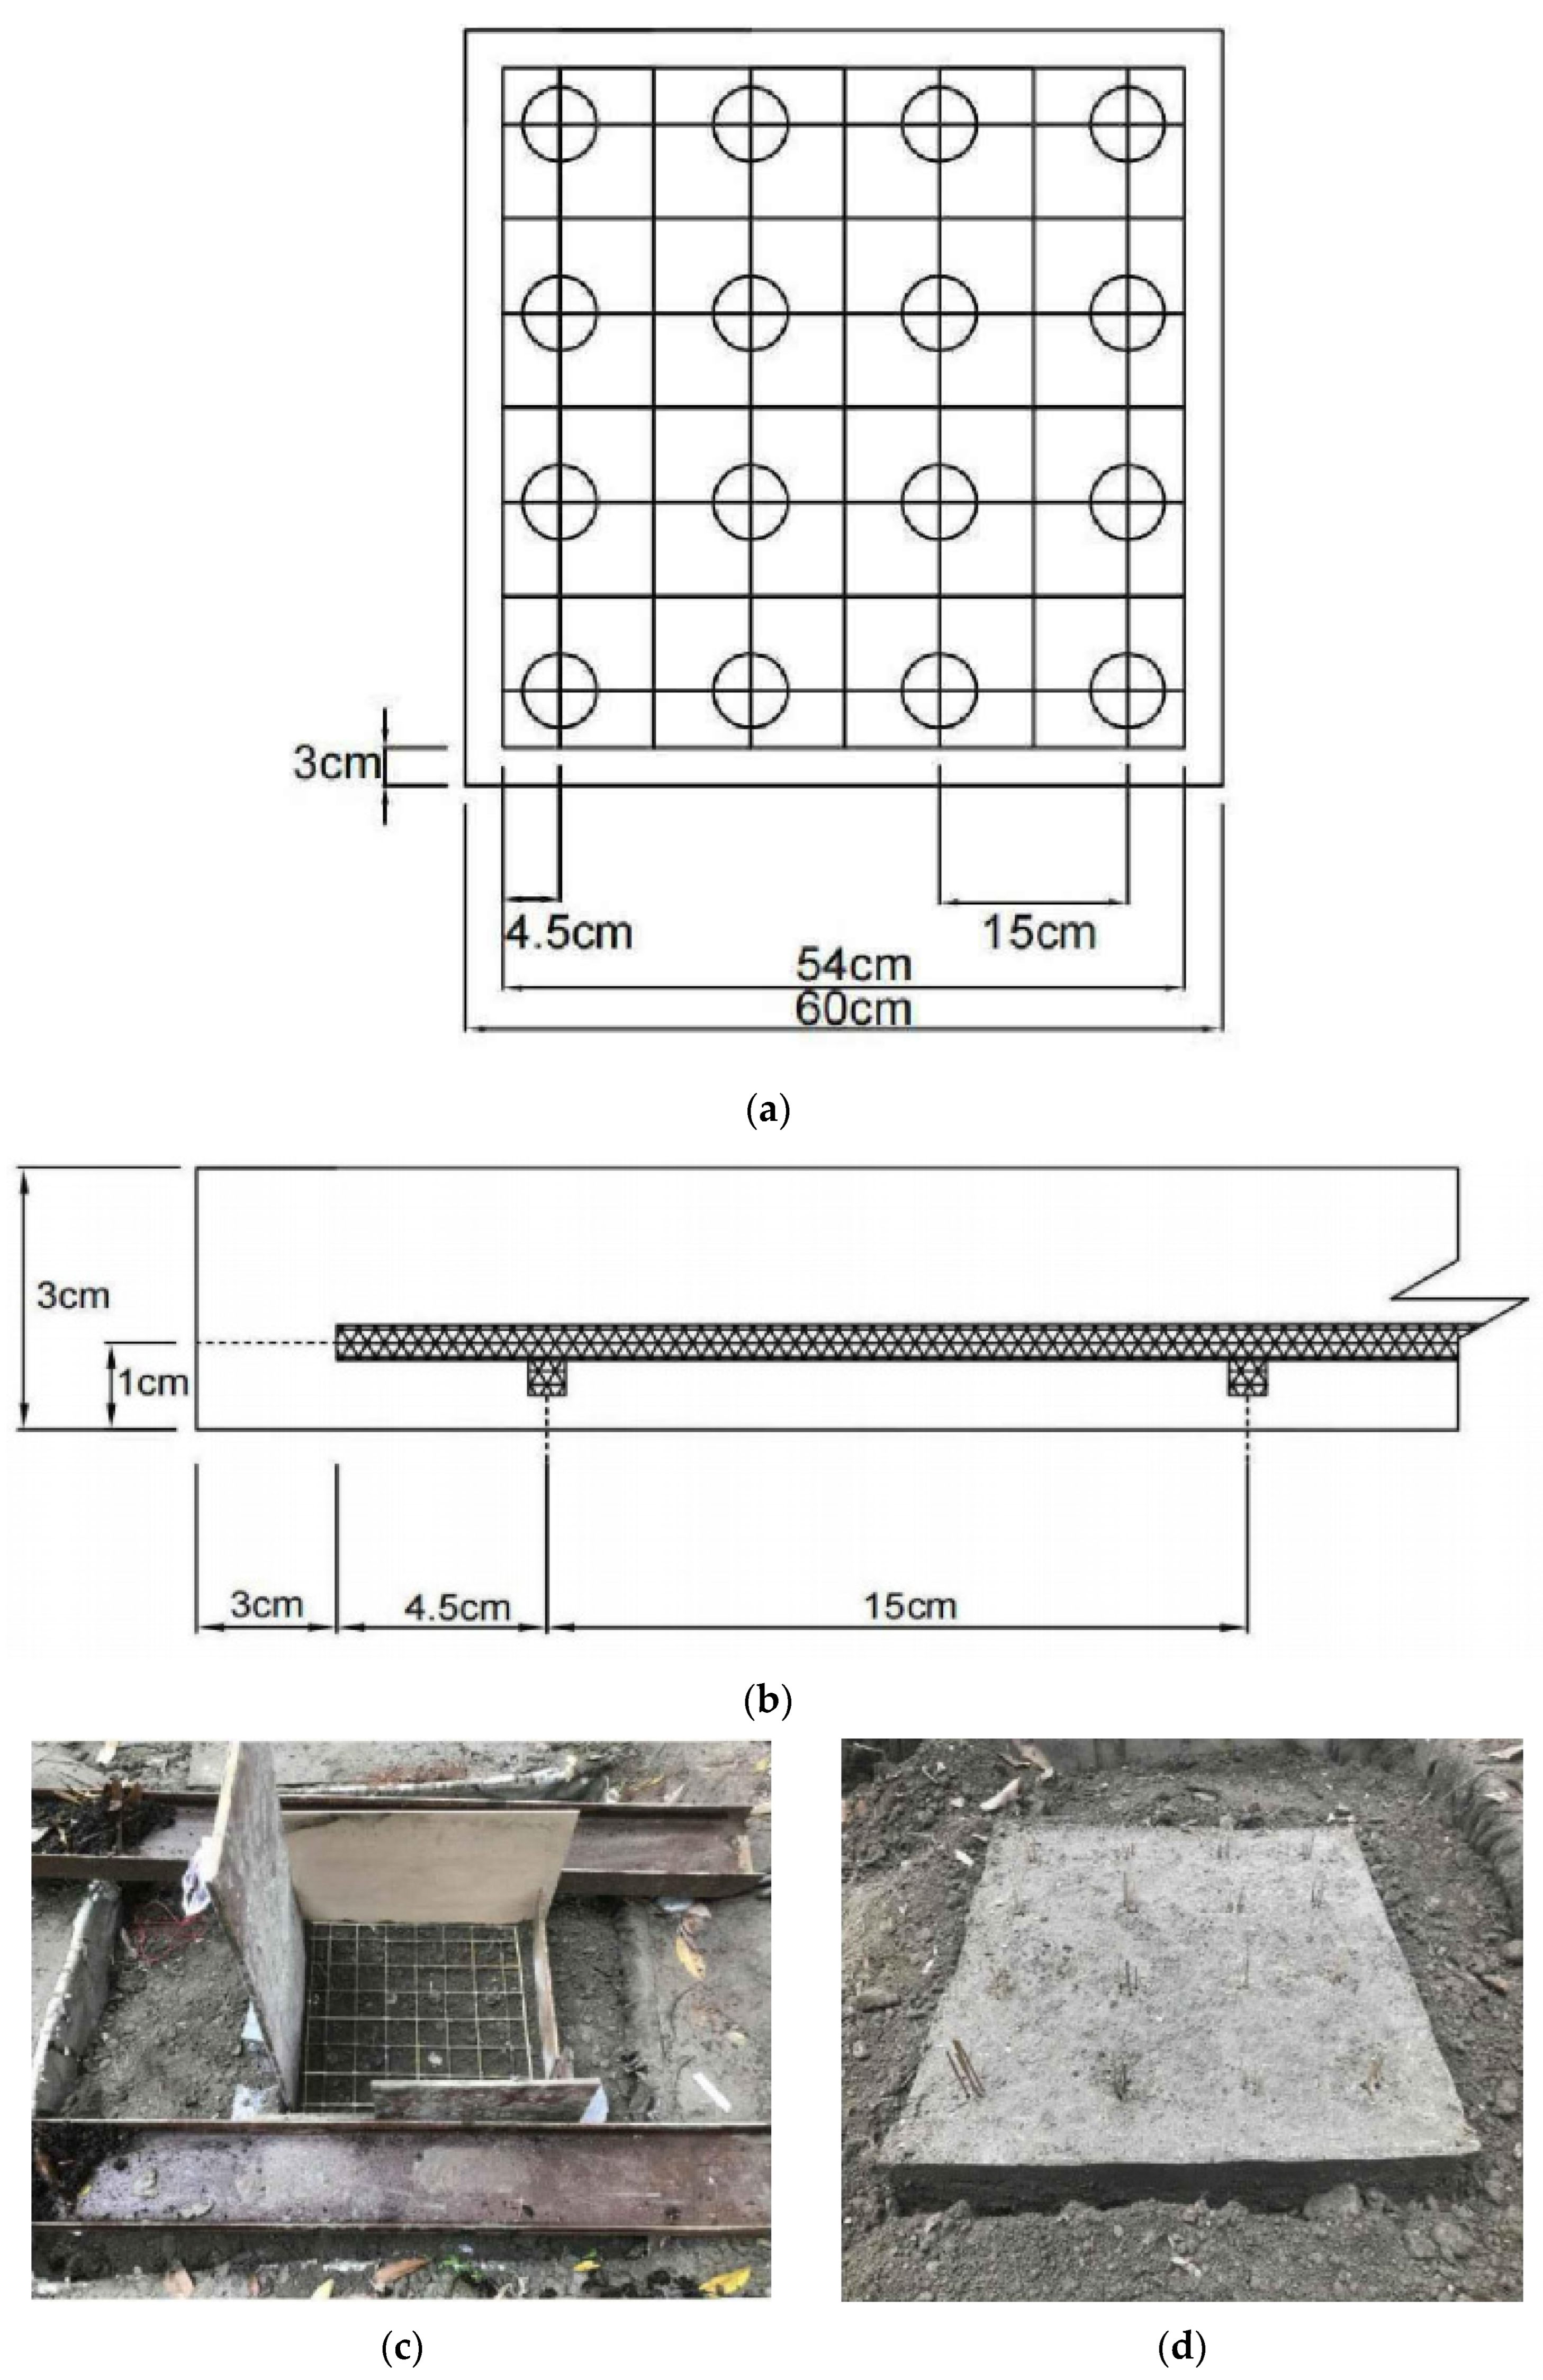
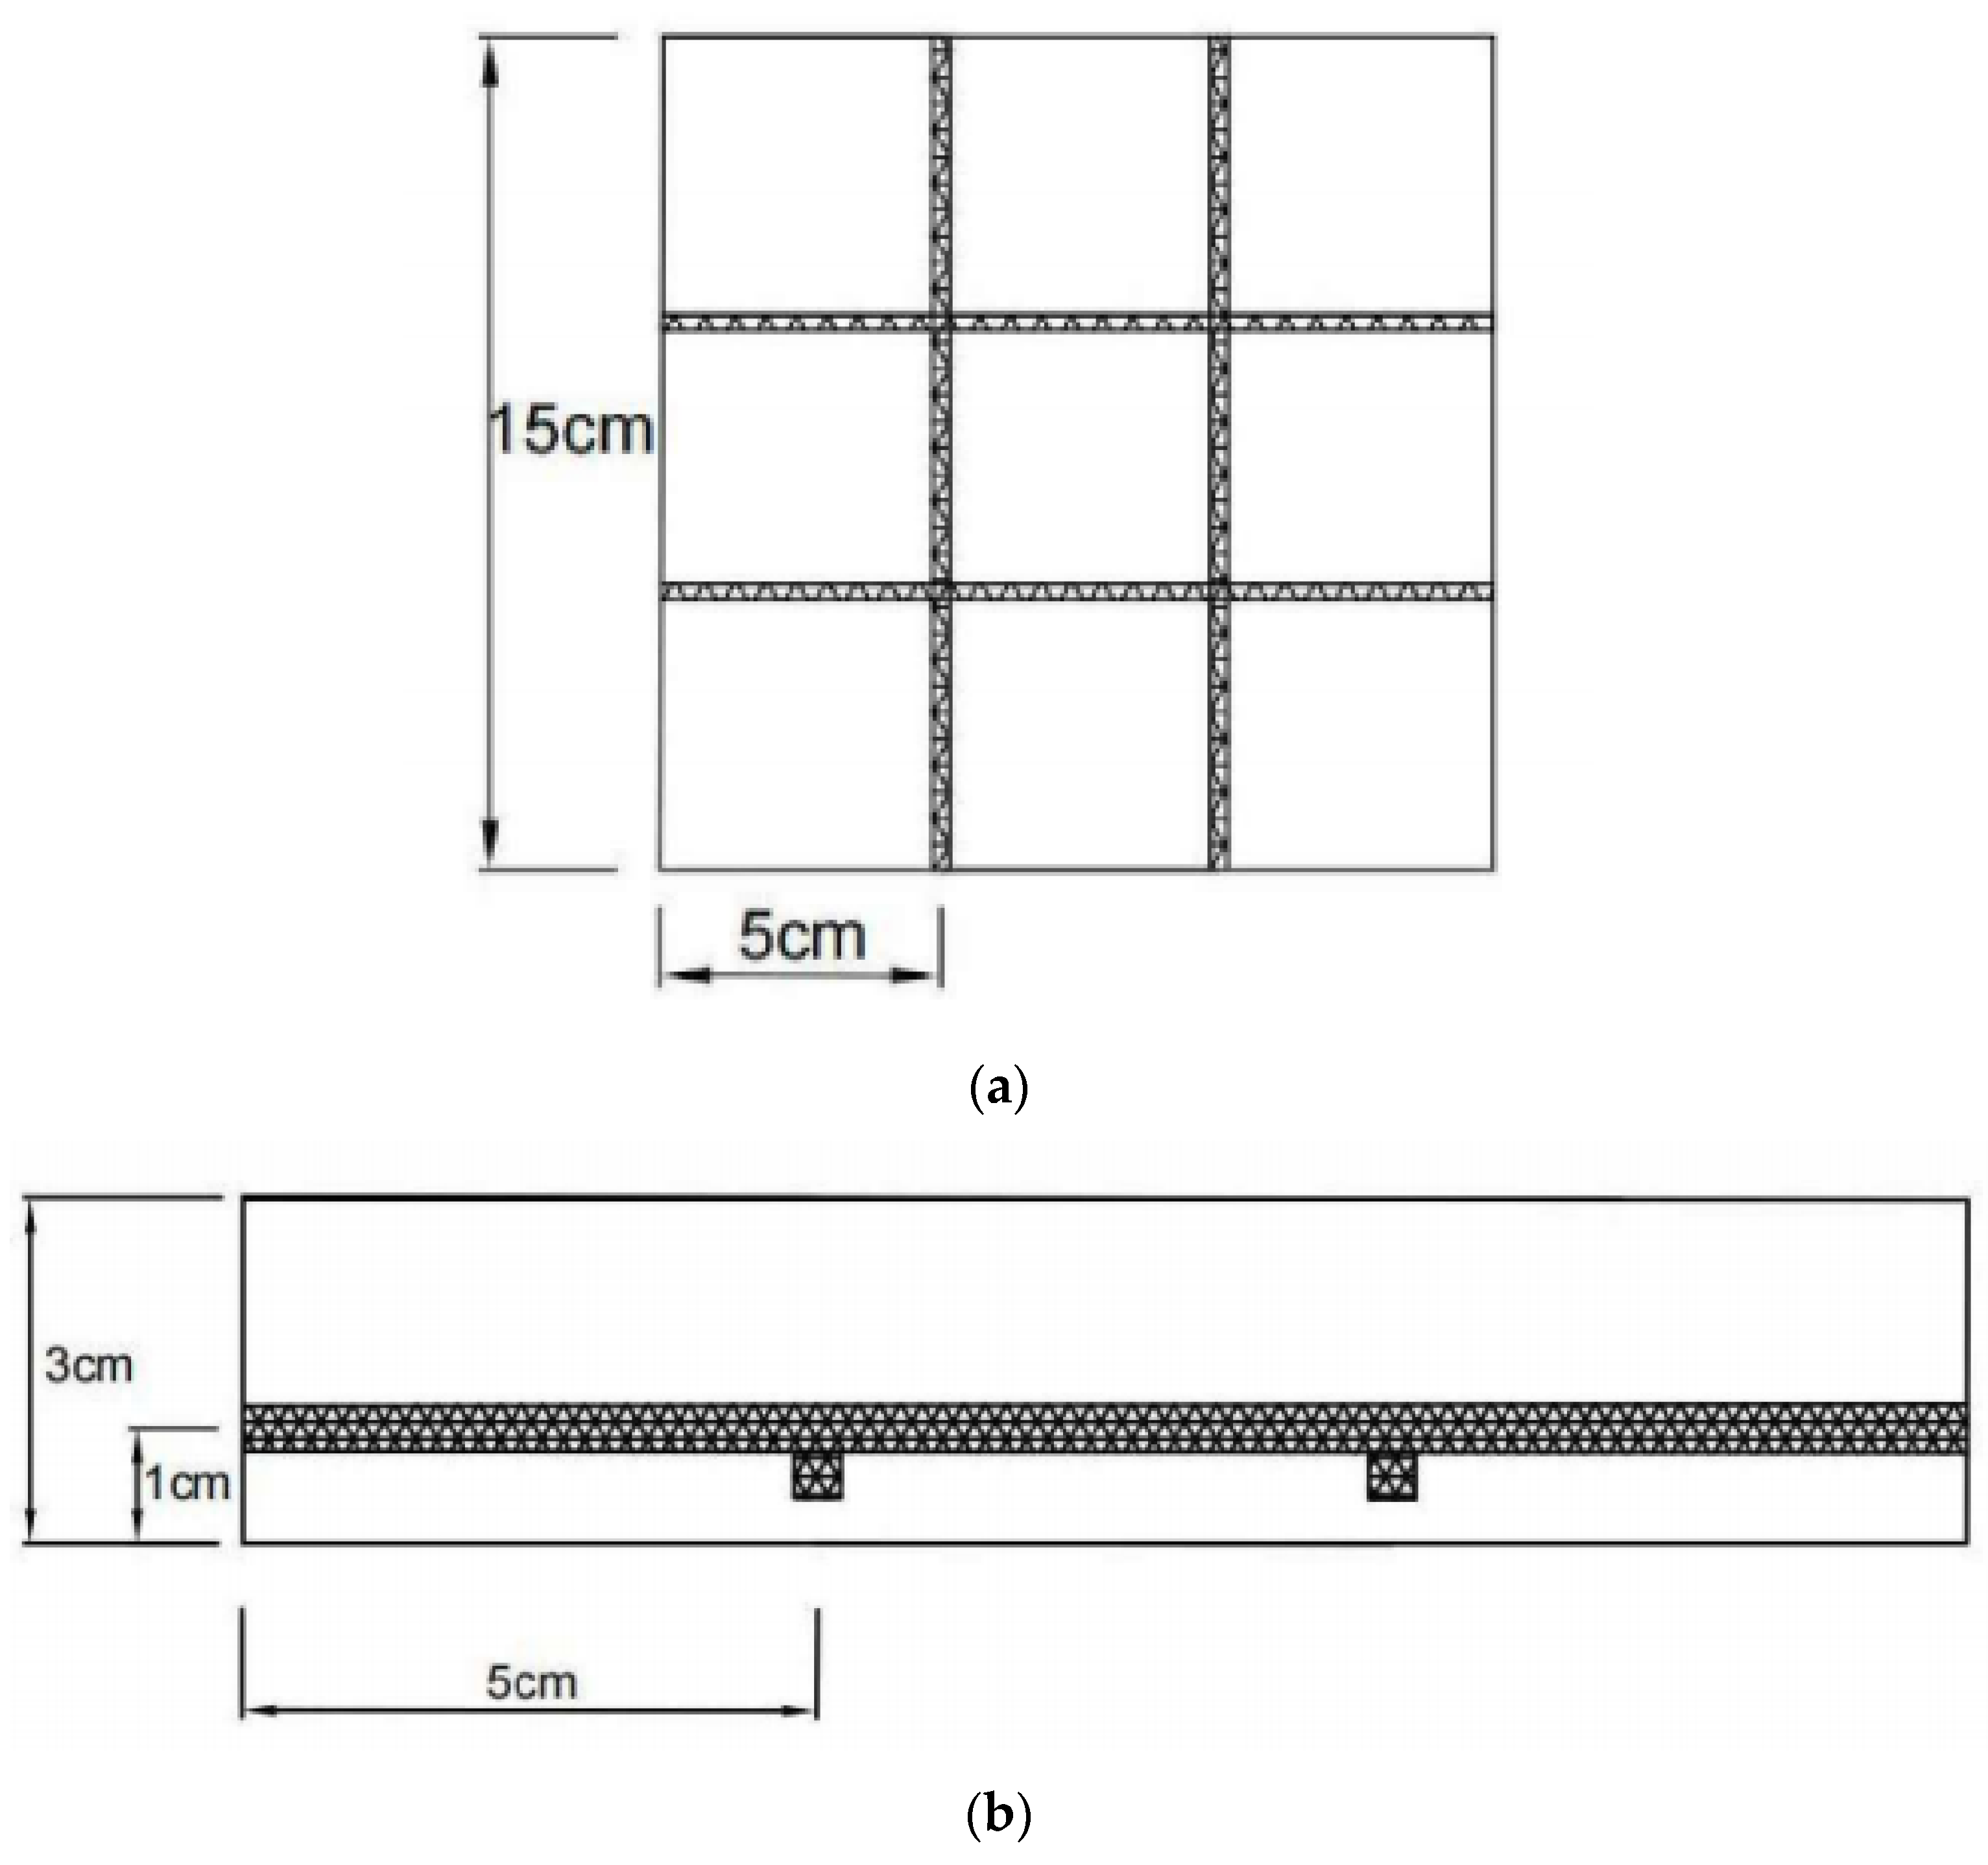
2.2.2. Raft Board Production

Unlike the production of the same pile body, the raft is cast-in-place. The raft is 60 cm × 60 cm wide and 3 cm thick. Bamboo strips processed from moso bamboo are used to replace the steel bars arranged in the raft foundation, and the reinforcement arrangement adopts the simple raft foundation reinforcement pattern. According to the calculation method and construction requirements of raft foundation, it is known that when the plate thickness is less than or equal to 300 mm, a 3 cm protective layer is reserved for the concrete cover, and the center of the pile body is arranged at the intersection point of the grid. The area of the replaced steel bar is the same as that of the bamboo strip of the pile, that is, the side length of the rectangular strip with a converted cross-sectional area of 0.1379 cm2 is about 0.37 cm (√0.1379 ≈ 0.37). The specific production diagram of the plate is shown in Figure 5.

2.2.3. The Way in Which the Superstructure Is Made

The superstructure, similarly to the raft in working condition, is a cast-in-place frame structure and is divided into beams, columns, and floor slabs. For the superstructure, bamboo with the same cross-sectional area as the pile body and the raft is used as the reinforcement material. The bamboo skeleton of the superstructure is pre-woven and then placed into the formwork for casting to take shape. In the process of production, additional single beam, single column, and single floor are made and weighed to provide a basis for the subsequent pressure application. The protective layer of the upper mechanism is 0.5 cm, and the layout of the superstructure is shown in Figure 6, Figure 7 and Figure 8. The cross-sectional area of the reinforcement for beams and columns was calculated and rounded to a side length of 0.2 cm for the rectangular bamboo strips. Because of the small span of the floor plate and the number of the reinforcement being the same as the column, the side length of the bamboo reinforcement section is 0.2 cm.
The pouring template of the superstructure is silver plate, and two sets of templates are made for two layers of pouring. The single-layer member provides the basis for the additional loading of the later superstructure. The finished template diagram and the pouring process diagram are shown in Figure 9.

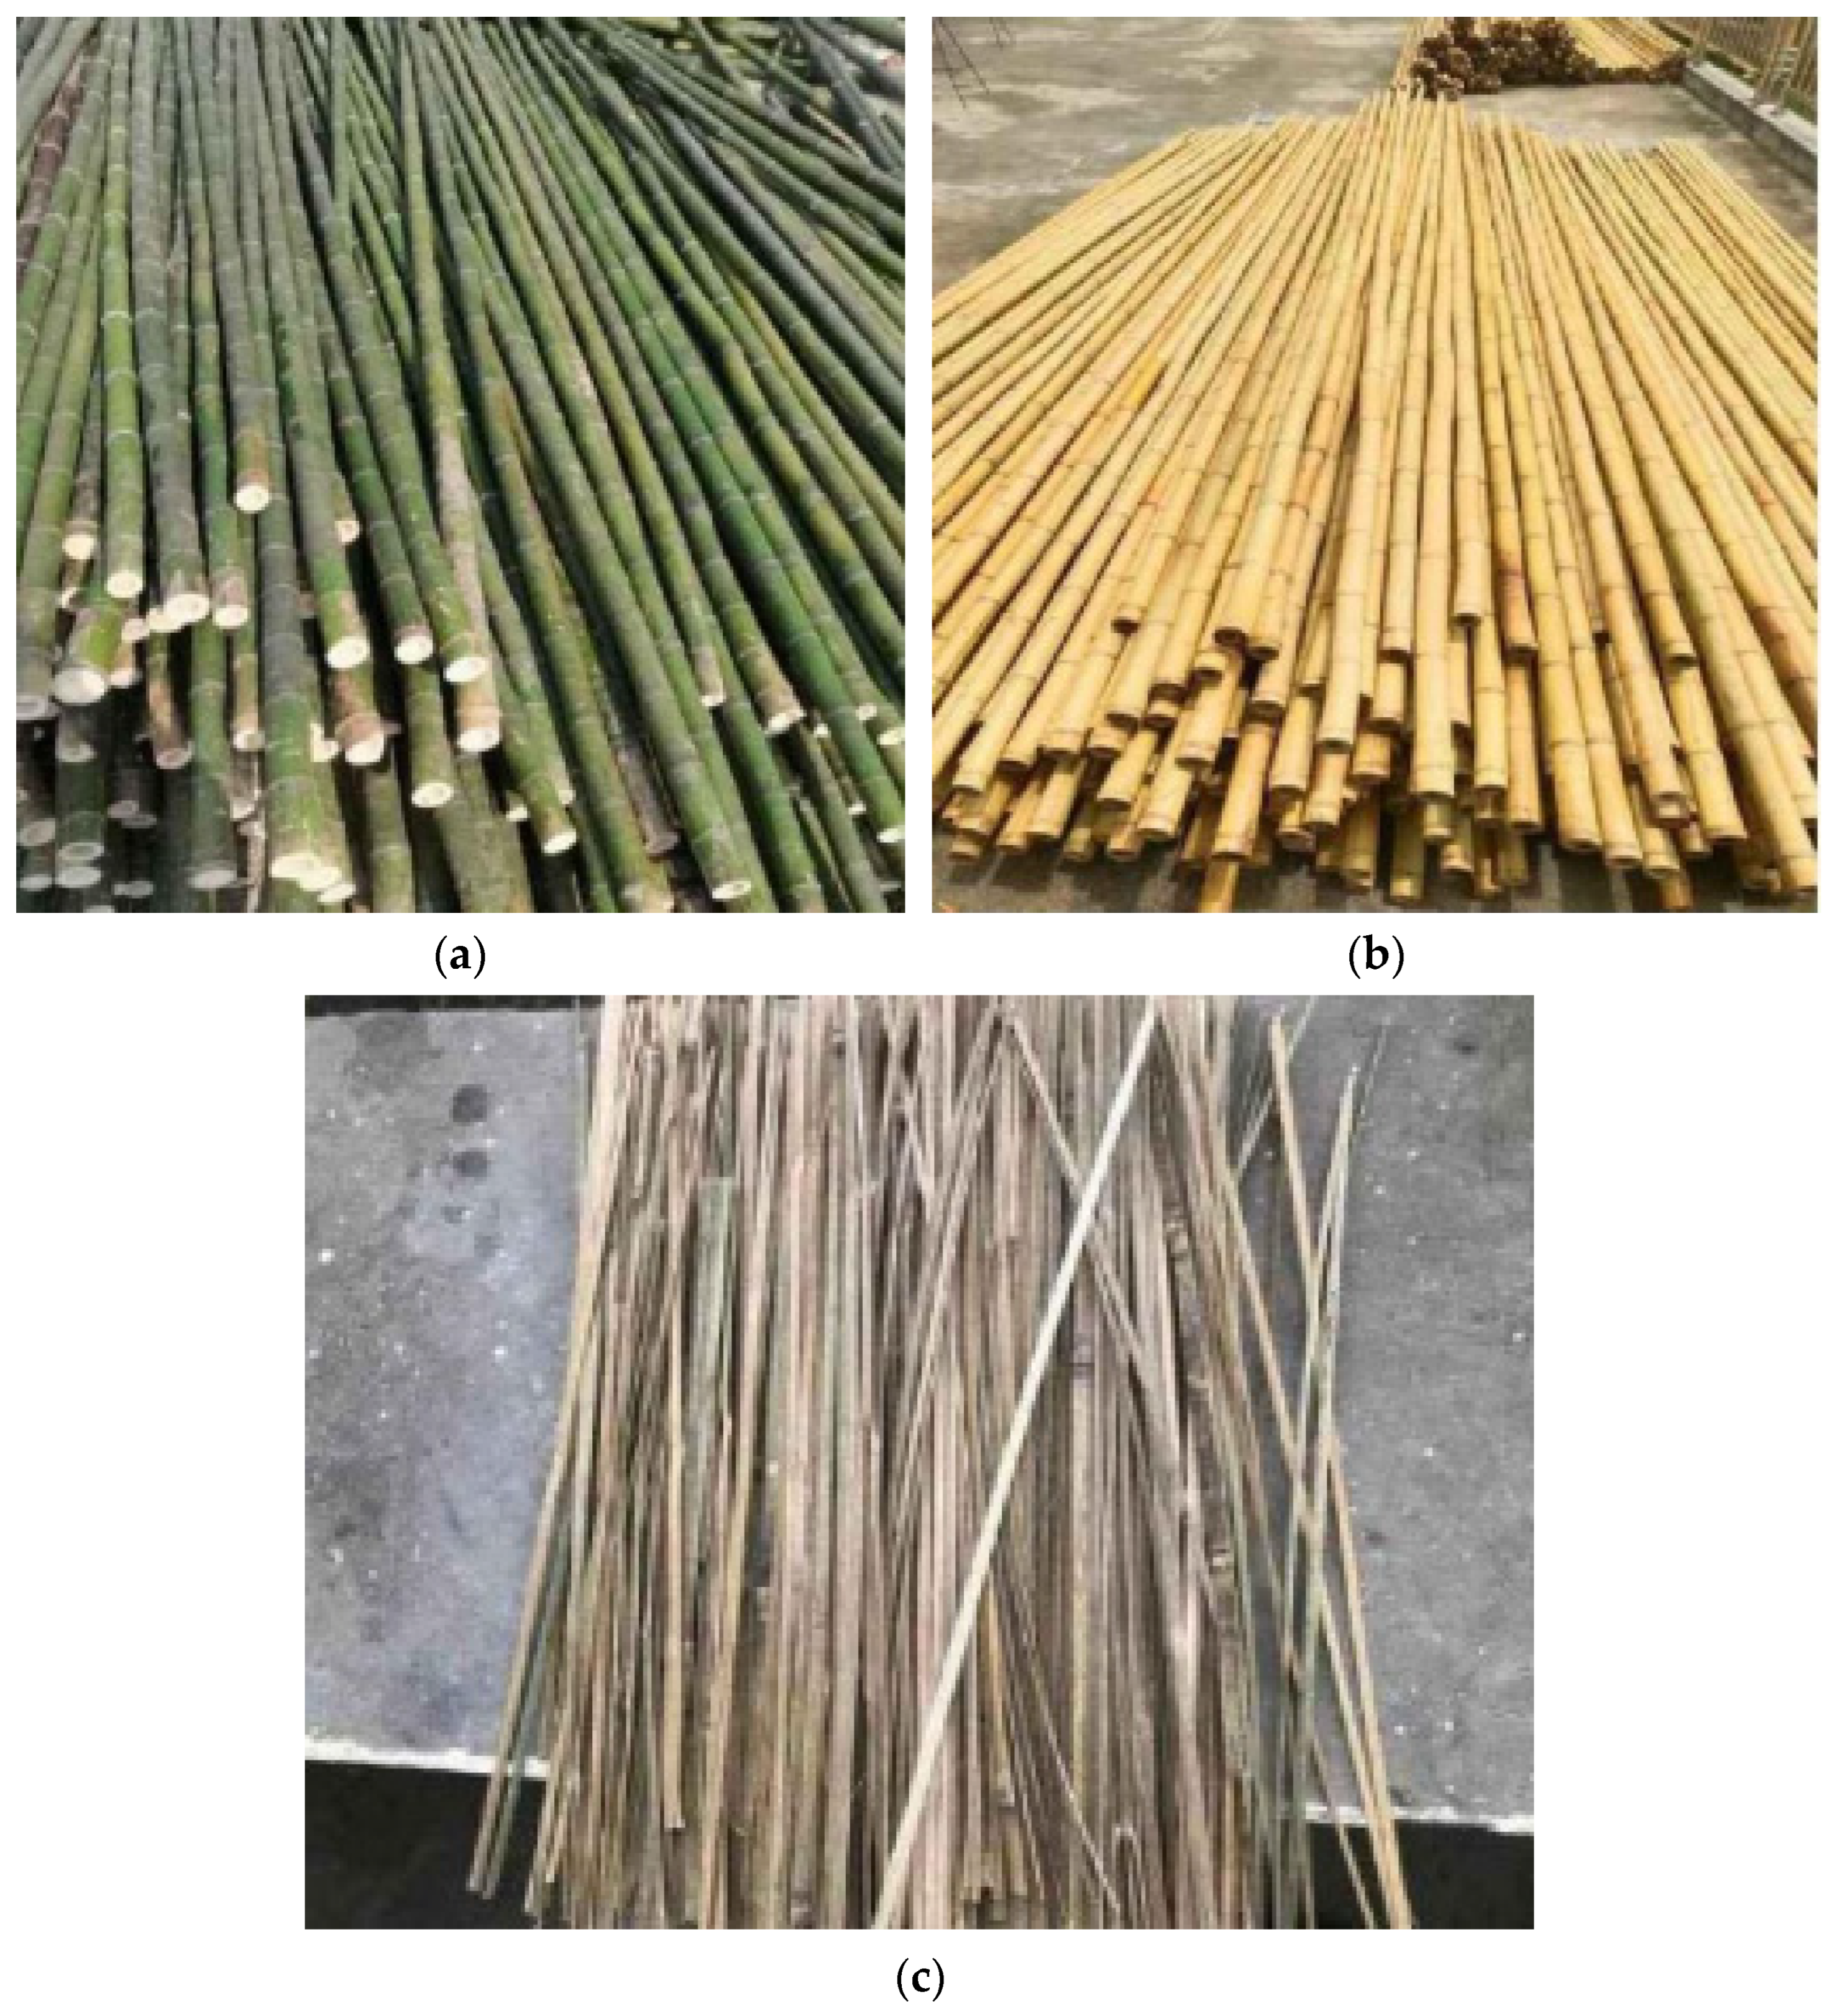
2.2.4. Bamboo Tendon Link Way

When simulating the rigid connection between the pile and the raft and the raft and the superstructure, the close bonding of each part must be fully considered, and the connection mode between different parts of the bamboo bars should also receive attention. Since the test considers the specimen as an ideal elastoplastic body and does not involve loading the specimen to failure, the connection point can be considered as a component with much greater strength than other parts. In order to ensure the firmness of the connection point, the surface of the bamboo tendon is carefully polished with sandpaper to increase the surface roughness, and then the hot melt glue and special glue are closely glued to ensure the stability and reliability of the connection.

2.3. Preparation of Soft Soil

The soft soil is taken from a place in Chengdu’s Pidu District (located in the heart of the Chengdu Plain, in the northwestern part of Chengdu; it is situated between 103°42′~104°2′ east longitude and 30°43′~30°52′ north latitude) and transported to the campus test site through a dump truck. Because the soil is a remolding soil, its mechanical property needs to be determined. Take the appropriate amount of soil and test for impurities to provide the corresponding basis for the following numerical simulation.

2.3.1. Volume Weight Test of Soil

The measured capacity of soil is the natural severity of soil, that is, the capacity of soil under the natural water content, which refers to the total weight of air, water, and soil particles in the soil. After screening, the remodeling soil was sampled with a ring knife, the ring knife with soil was placed on the balance with a sensitivity of 0.001 g, and then the quality of the ring knife was measured. After calculation, the bulk weight of the soil was 19.87 kN/m3.

2.3.2. Water Content Test of Soil Body

The moisture content of soil refers to the weight of water contained in soil, which is an important indicator of soil properties. The water content of the soil is measured by weighing method, namely drying method. The sample is taken by ring knife, the soil is weighed before and after the drying, the temperature is set at 105 °C, and the soil is dried for 8~10 h until the weight of the soil hardly changes. After calculation, the moisture content of the soil is 29.61%.

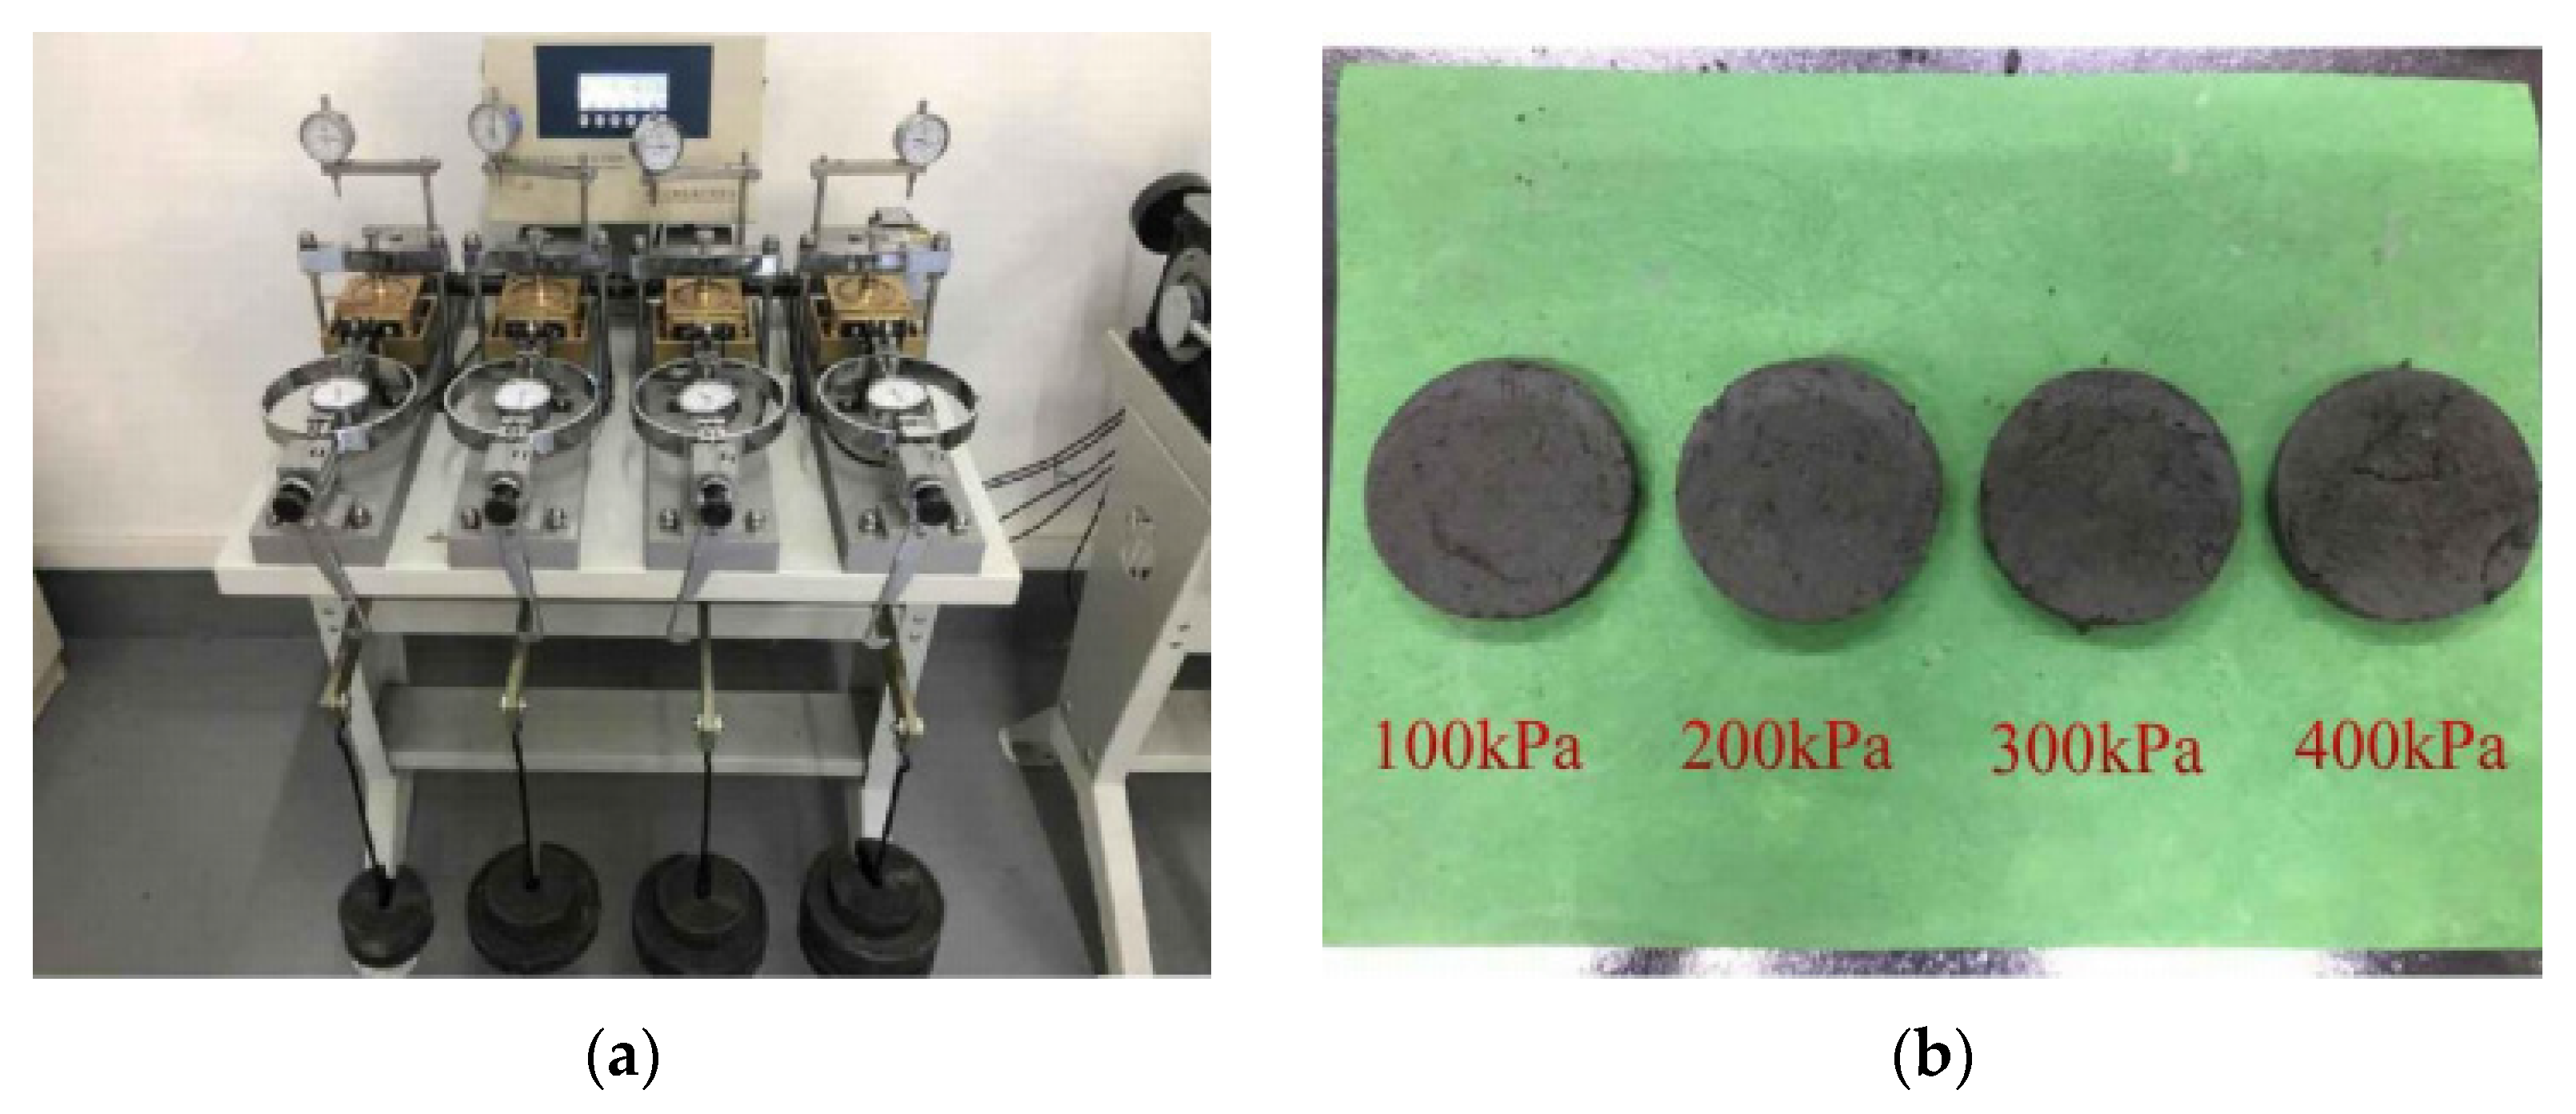
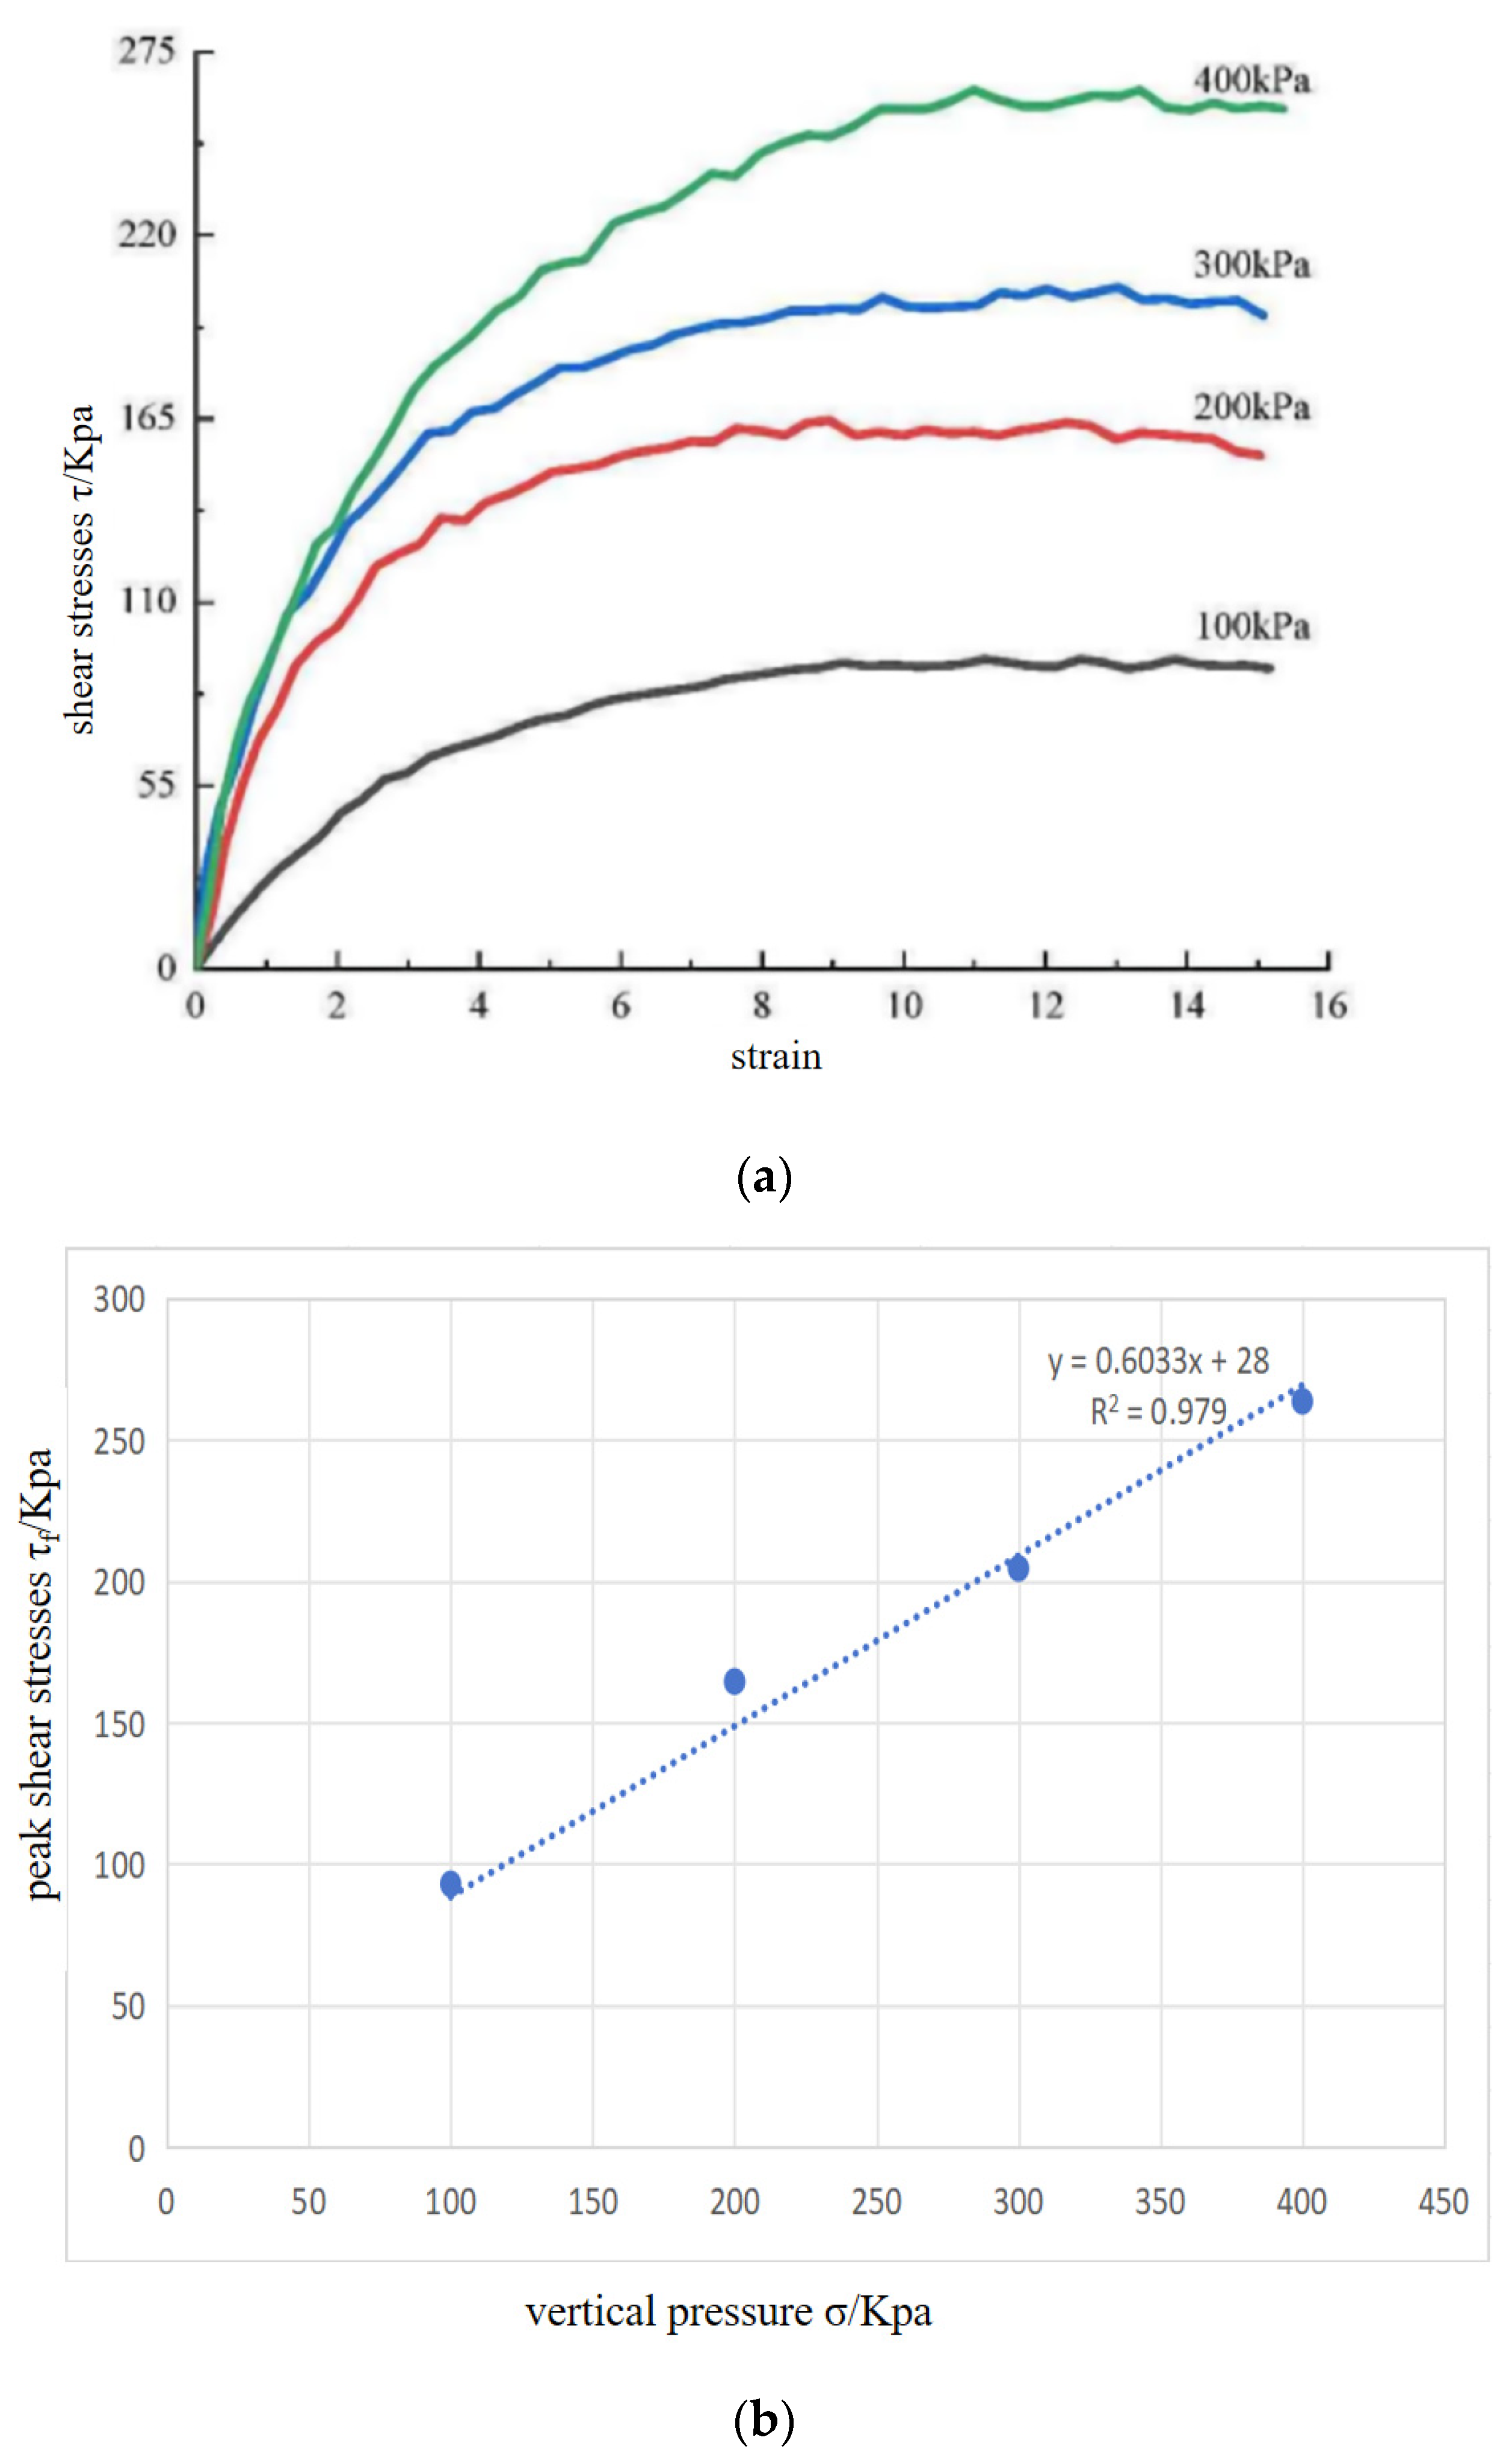
2.3.3. Direct Shear Test of Soil

The mechanical parameters of the test soil were measured by the direct shear instrument, and the shear strength index was calculated according to Coulomb’s theory [28]. The test soil was prepared with a ring knife, and four samples were prepared, with each sample and shear tested at 100 kPa, 200 kPa, 300 kPa, and 400 kPa vertical pressure. After applying vertical pressure, the control shear rate was within range of 0.8 mm/min~1.2 mm/min, a uniform speed of 4~6 revolutions per minute was cut, and the data received by the terminal was recorded. The test diagram is shown in Figure 10b. The results are 100 kPa, 200 kPa, 300 kPa, and 400 kPa.
According to the data to draw the abscissa for shear strain, the ordinate is the curve of shear stress, the peak stress for the corresponding shear pressure, shear strengths by four peaks stress fit a straight line, the slope of the line is the internal friction angle of the line, and y axis is the cohesion C. The stress–strain curves and fitted lines are shown in Figure 11.
After calculation, the internal friction angle of the soil is 29° and the cohesion C is 28 kPa.

2.4. Layout and Data Processing of the Test Components

The strain gauge is arranged at 3 cm below the top of the pile body. Considering the symmetry of the model, the two angles, two side piles, and two medium piles are arranged, and the arranged piles are numbered and recorded, as shown in Figure 12. According to the relationship between stress and strain in Mechanics of Materials, the superstructure column base stress and pile top stress are provided in Equations (1) and (2):
σ = E × ε
The pile top load is obtained as follows:
Q = σ × A
In the formula, σ is the pile body stress, E is the elastic modulus of the experimental concrete, ε is the pile body strain, and A is the cross-sectional area of the pile body.

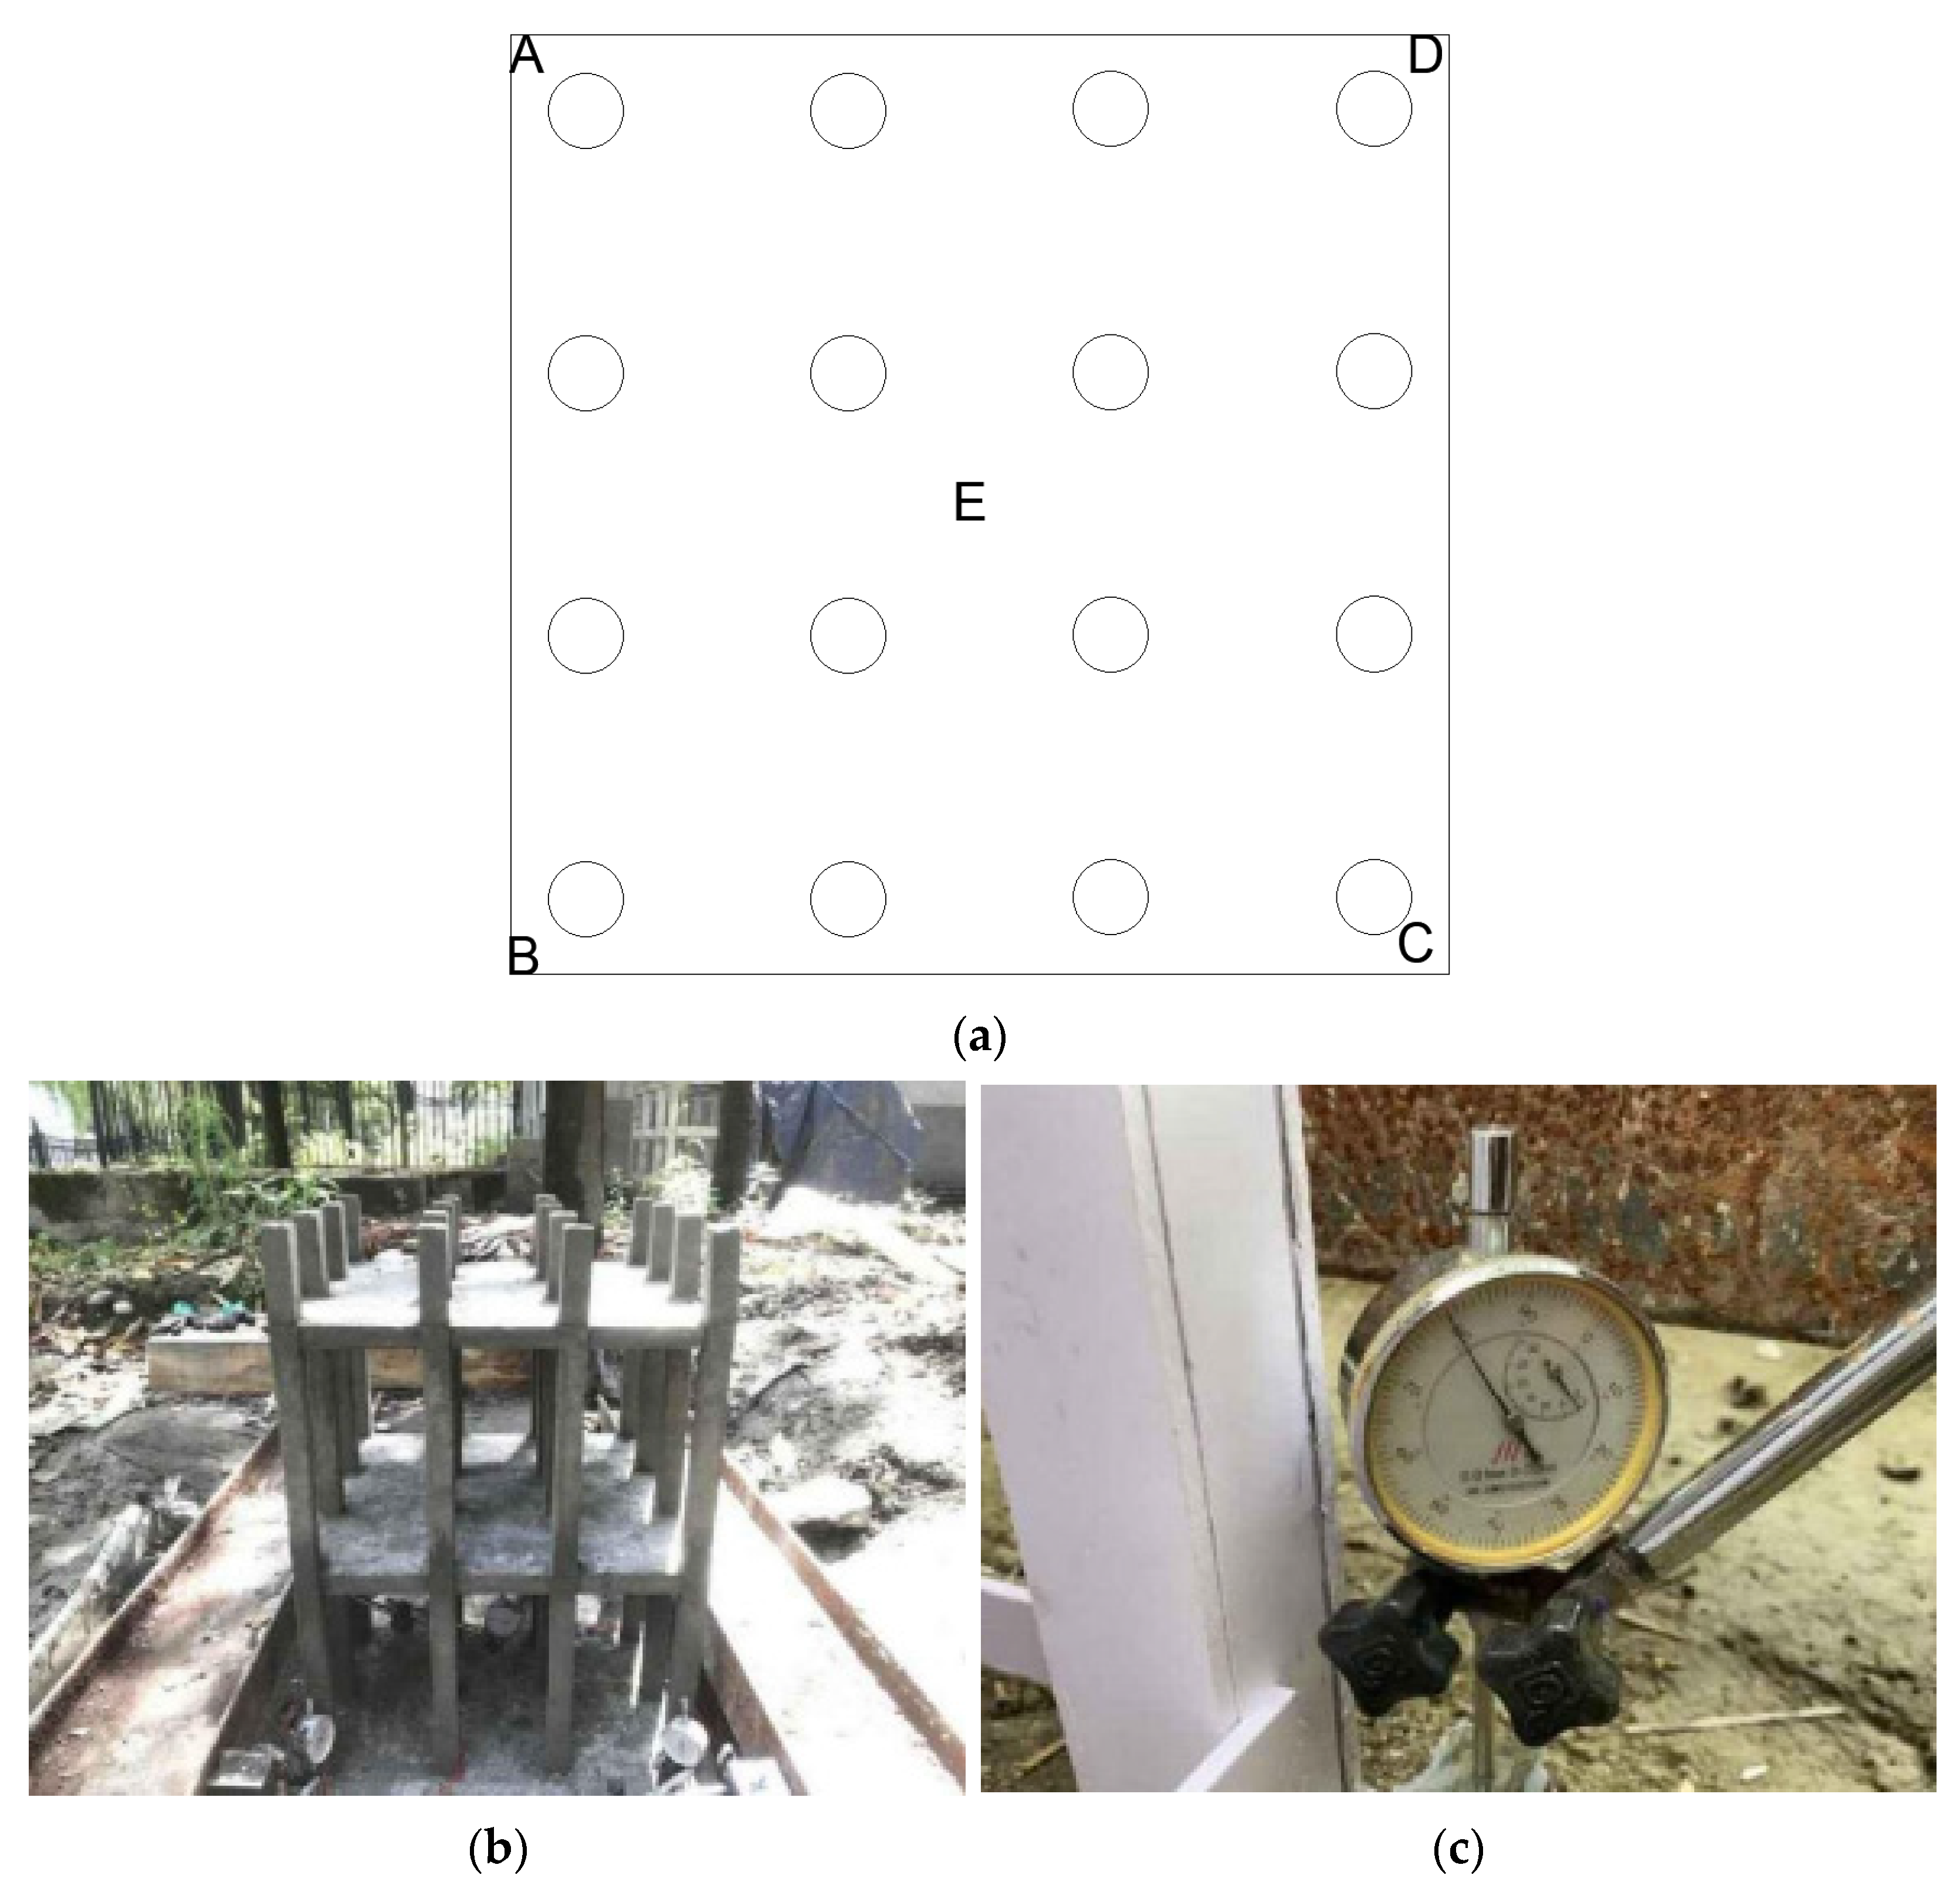
2.4.1. The Disposal of Raft Plate

The settlement of rafts was obtained from meter records. To prevent measurement errors caused by an uneven raft surface or disturbances, I-steel was arranged on both sides of the model and the raft. A fixing device with a magnet was attached to the I-steel, and hard glass pads were placed at the four corners of the raft. For the test, settlement observation points were set at the four corners (labeled ABCD),and Point E is the midpoint. The final settlement of the raft was determined by averaging the settlement values of these four observation points. The layout of the meter is shown in Figure 13.

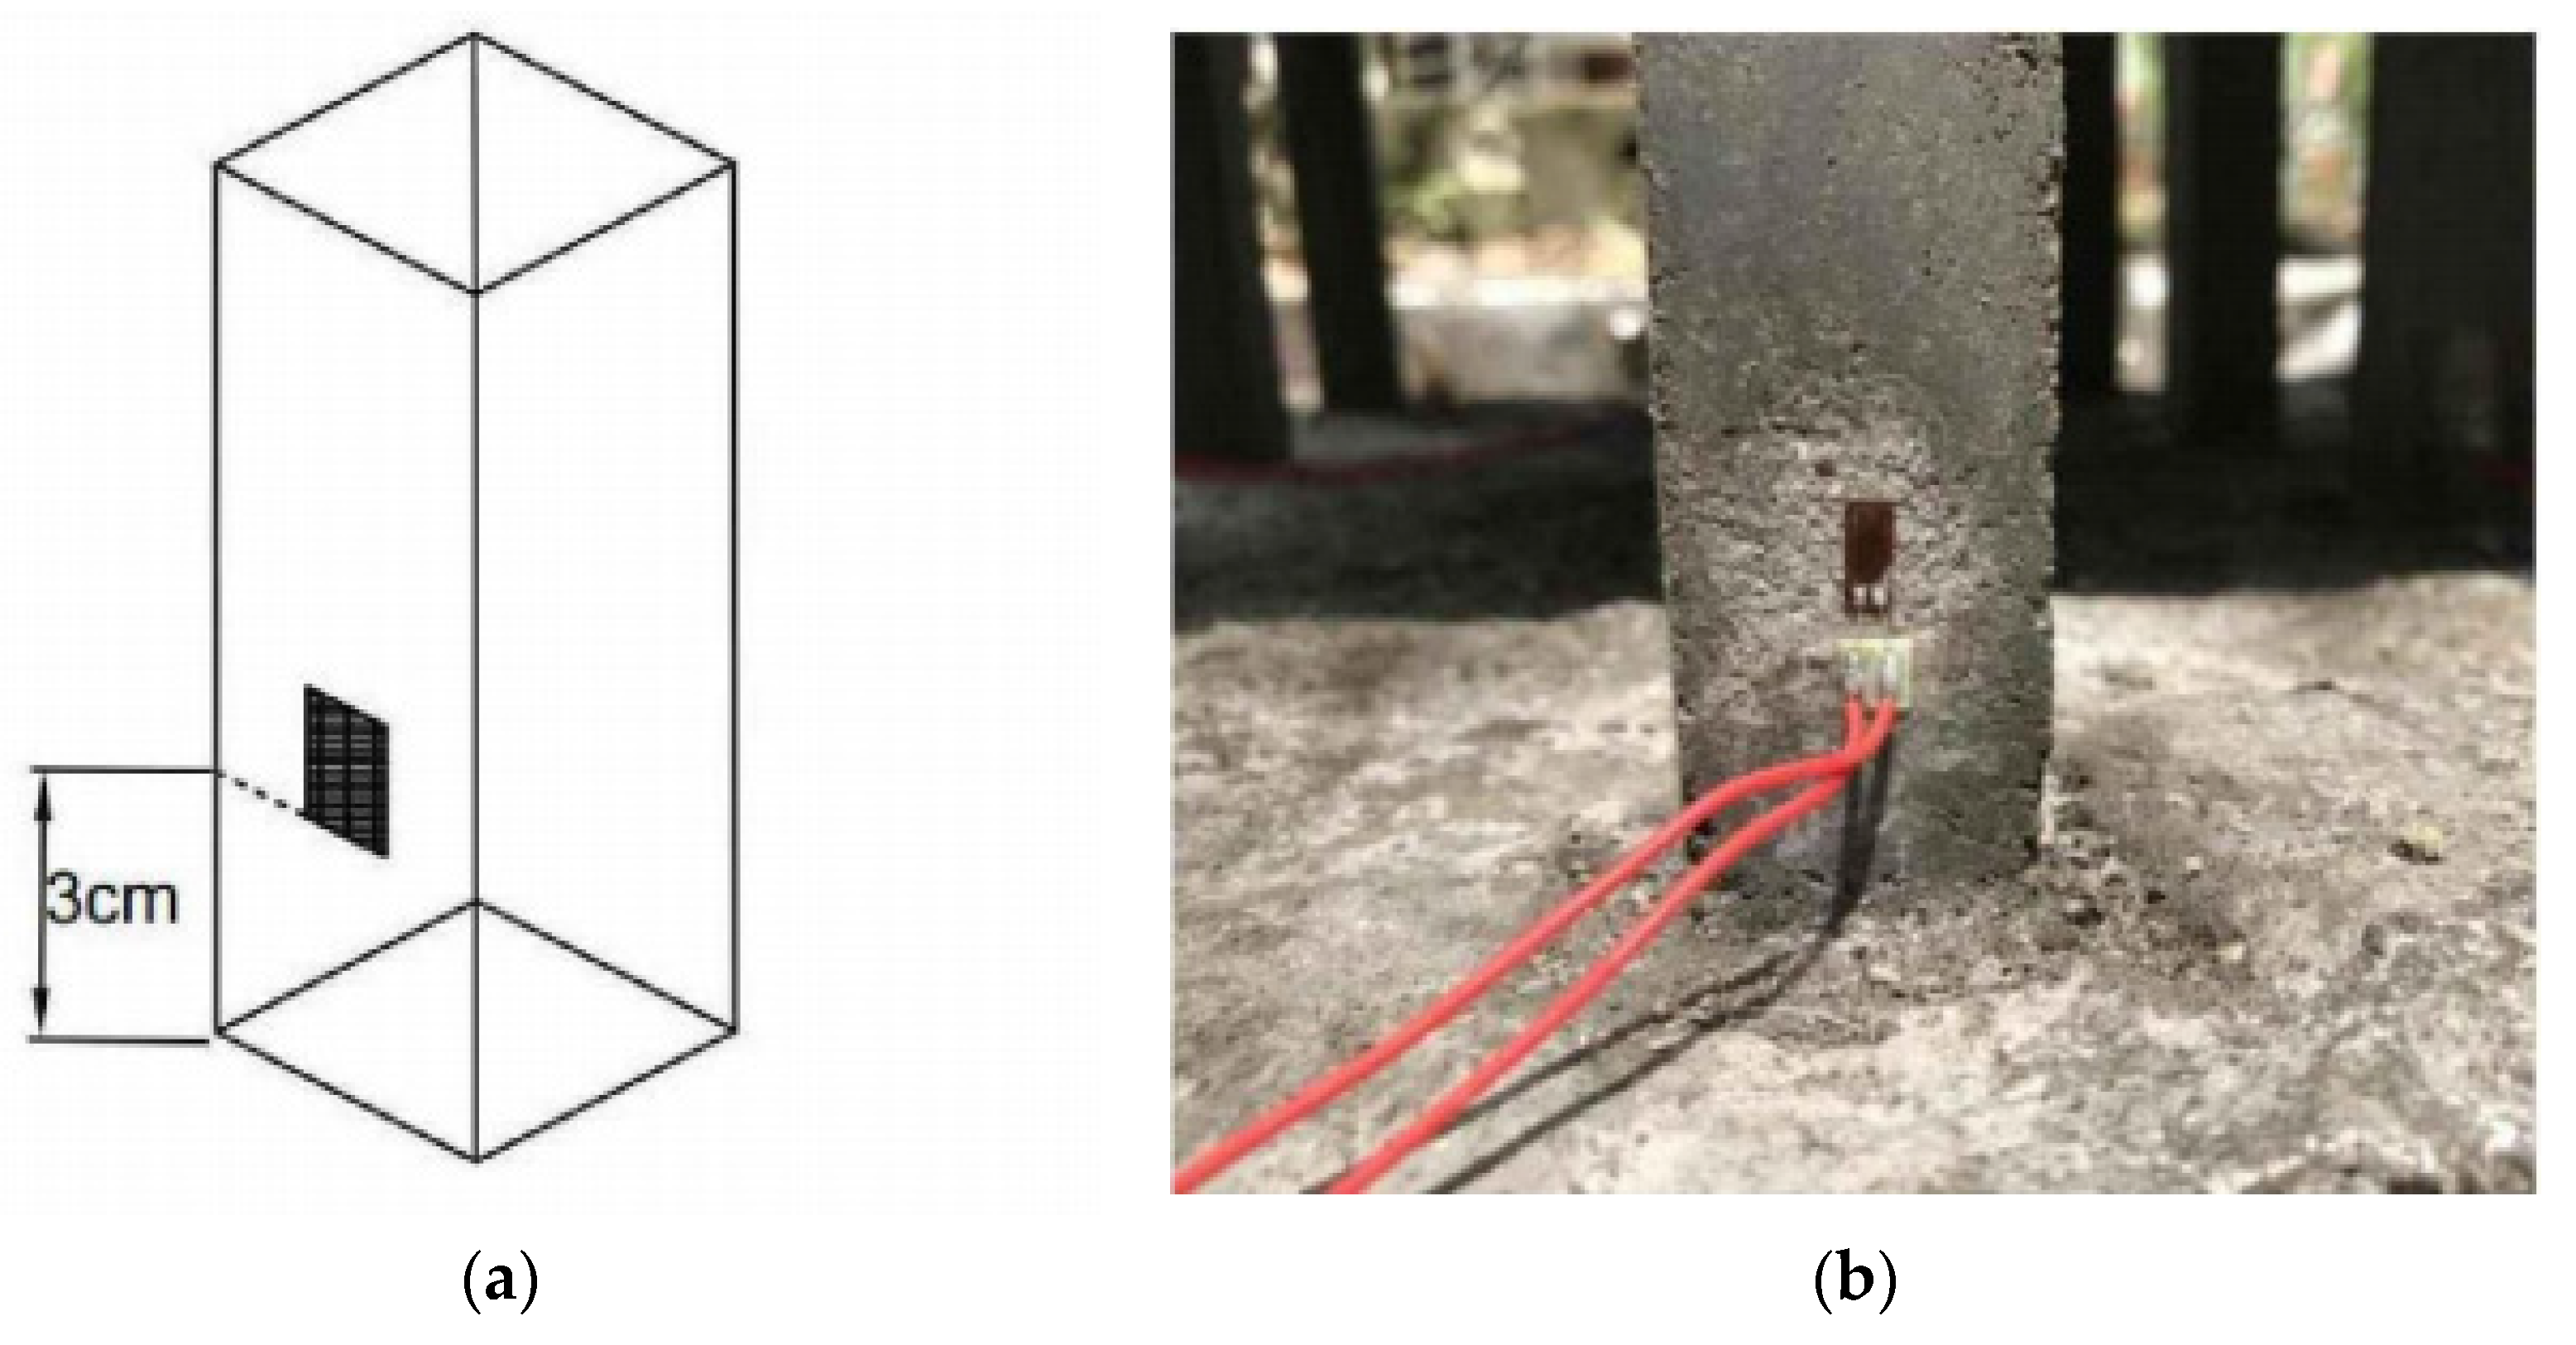
2.4.2. Treatment of the Superstructure

For the strain gauge of the column at 3 cm above the raft, considering the symmetry of the superstructure, there are six columns: two corner columns, two side columns, and two middle columns. The layout plan of the column base strain gauge is shown in Figure 14.

2.4.3. Loading Design

Considering the economic and experimental conditions, this test requires additional loading to simulate the working condition of a six-storey building. In order to better reduce the influence of the actual situation on the component, the stress process of the component was controlled to simulate the growth of layer number by placing additional counterweights such as weight. The made silver board and the poured individual components were weighed and used as the basis for the load weight of the single-storey building. In order to reduce the adverse effect of concentration on the test results, two layers of structure were actually poured in the test, a 10 cm column was poured over the two-layer structure, and a hard template was affixed on the body to disperse the load to restore the actual situation as much as possible. The physical loading diagram is shown in Figure 15.

2.5. Test Process and Error Analysis

2.5.1. Experimental Flow

This test was carried out in the foundation pit made in a specific area of Xihua University. The size of the foundation pit was 1.5 m × 1.5 m × 1.5 m. In order to ensure the accuracy of the test, tarp and geotextile were laid at the bottom and around the foundation pit and fixed with iron nails to maintain the characteristics of soft soil and reduce the impact of friction. The foundation pit design is reasonable, the side length is about three times that of the raft side length, and the depth is more than twice that of the raft length, which effectively reduces the effect of the marginal effect.
The test process includes backfilling the soil to a depth of 0.9 m and leveling, determining the position of the pile and the raft through the layout measurement, reserving the pile foundation space with PVC pipe, and tamping the soil to complete the pile layout. Subsequently, the cast-in-place method is used to make raft, build formwork, pour concrete, bamboo reinforcement laid and splicing to complete raft pouring and maintenance. Next, for the cast-in-place superstructure, place the formwork and the bamboo reinforcement frame, join the bamboo reinforcement and the raft, and pour into the concrete to form a complete structure. To simulate the actual stress state of a six-storey building, a stepwise loading protocol was employed after completing the second-layer superstructure pouring. Steel weights or rigid plates were placed symmetrically across the raft surface to convert point loads into a uniformly distributed load (UDL). The term “plate weight” refers to the self-weight of the raft foundation, which was incorporated into the total applied load. Each incremental load step was carefully calculated to replicate the gravitational effect of one additional superstructure layer, ensuring the total load accurately simulated the combined mass of the six-storey superstructure and the raft. This method allowed us to investigate the collaborative behavior between the pile–raft foundation and superstructure, focusing on load-bearing mechanisms and deformation characteristics. The entire testing process adhered to strict protocols to ensure data accuracy and reliability.

2.5.2. Analysis of Trial Error

Due to the non-uniformity of the test material and the difference between individuals in the component manufacturing, it is foreseeable that abnormal values will appear in the process of loading the component and the data obtained by the instrument. Analysis of the error sources is needed to better screen the data results. According to the analysis, the main error sources are the production process of the model, the inhomogeneity of the soil, the test elements, and the external environment.
In order to ensure the accuracy of the test data, three main error control methods are adopted in the test preparation stage: the focus on the single component and the pile preparation emphasizes synchronous casting and maintenance to eliminate the time difference; the second error control method involves soil treatment to reduce property differences and other variables.

3. Results and Discussion

3.1. Analysis of the Relative Stiffness of the Superstructure

Before this model test, the stiffness needs to be checked by the geometric size of the superstructure. The stiffness of the superstructure is calculated according to the elastic modulus of concrete.
Through calculation and comparison, according to the Code for Fire Protection Design of Buildings, GB 50016-2014 (2018 Edition) [22], under the standard value of gravity load and horizontal load or the standard value of gravity load, the height-to-width ratio is greater than 4; if the height–width ratio is not greater than 4, the area between the base surface and foundation shall not exceed 15% of the bottom area of the foundation. The overall stability of the rigid ratio of the original proportional superstructure is shown in Table 3.
According to the table above, after applying similarity ratios to the superstructure test model, it can be categorized into flexible, elastic, rigid, and absolutely rigid types. After calculation, it can be seen that its rigidity increases step by step in the working condition in which the number of each floor increases.

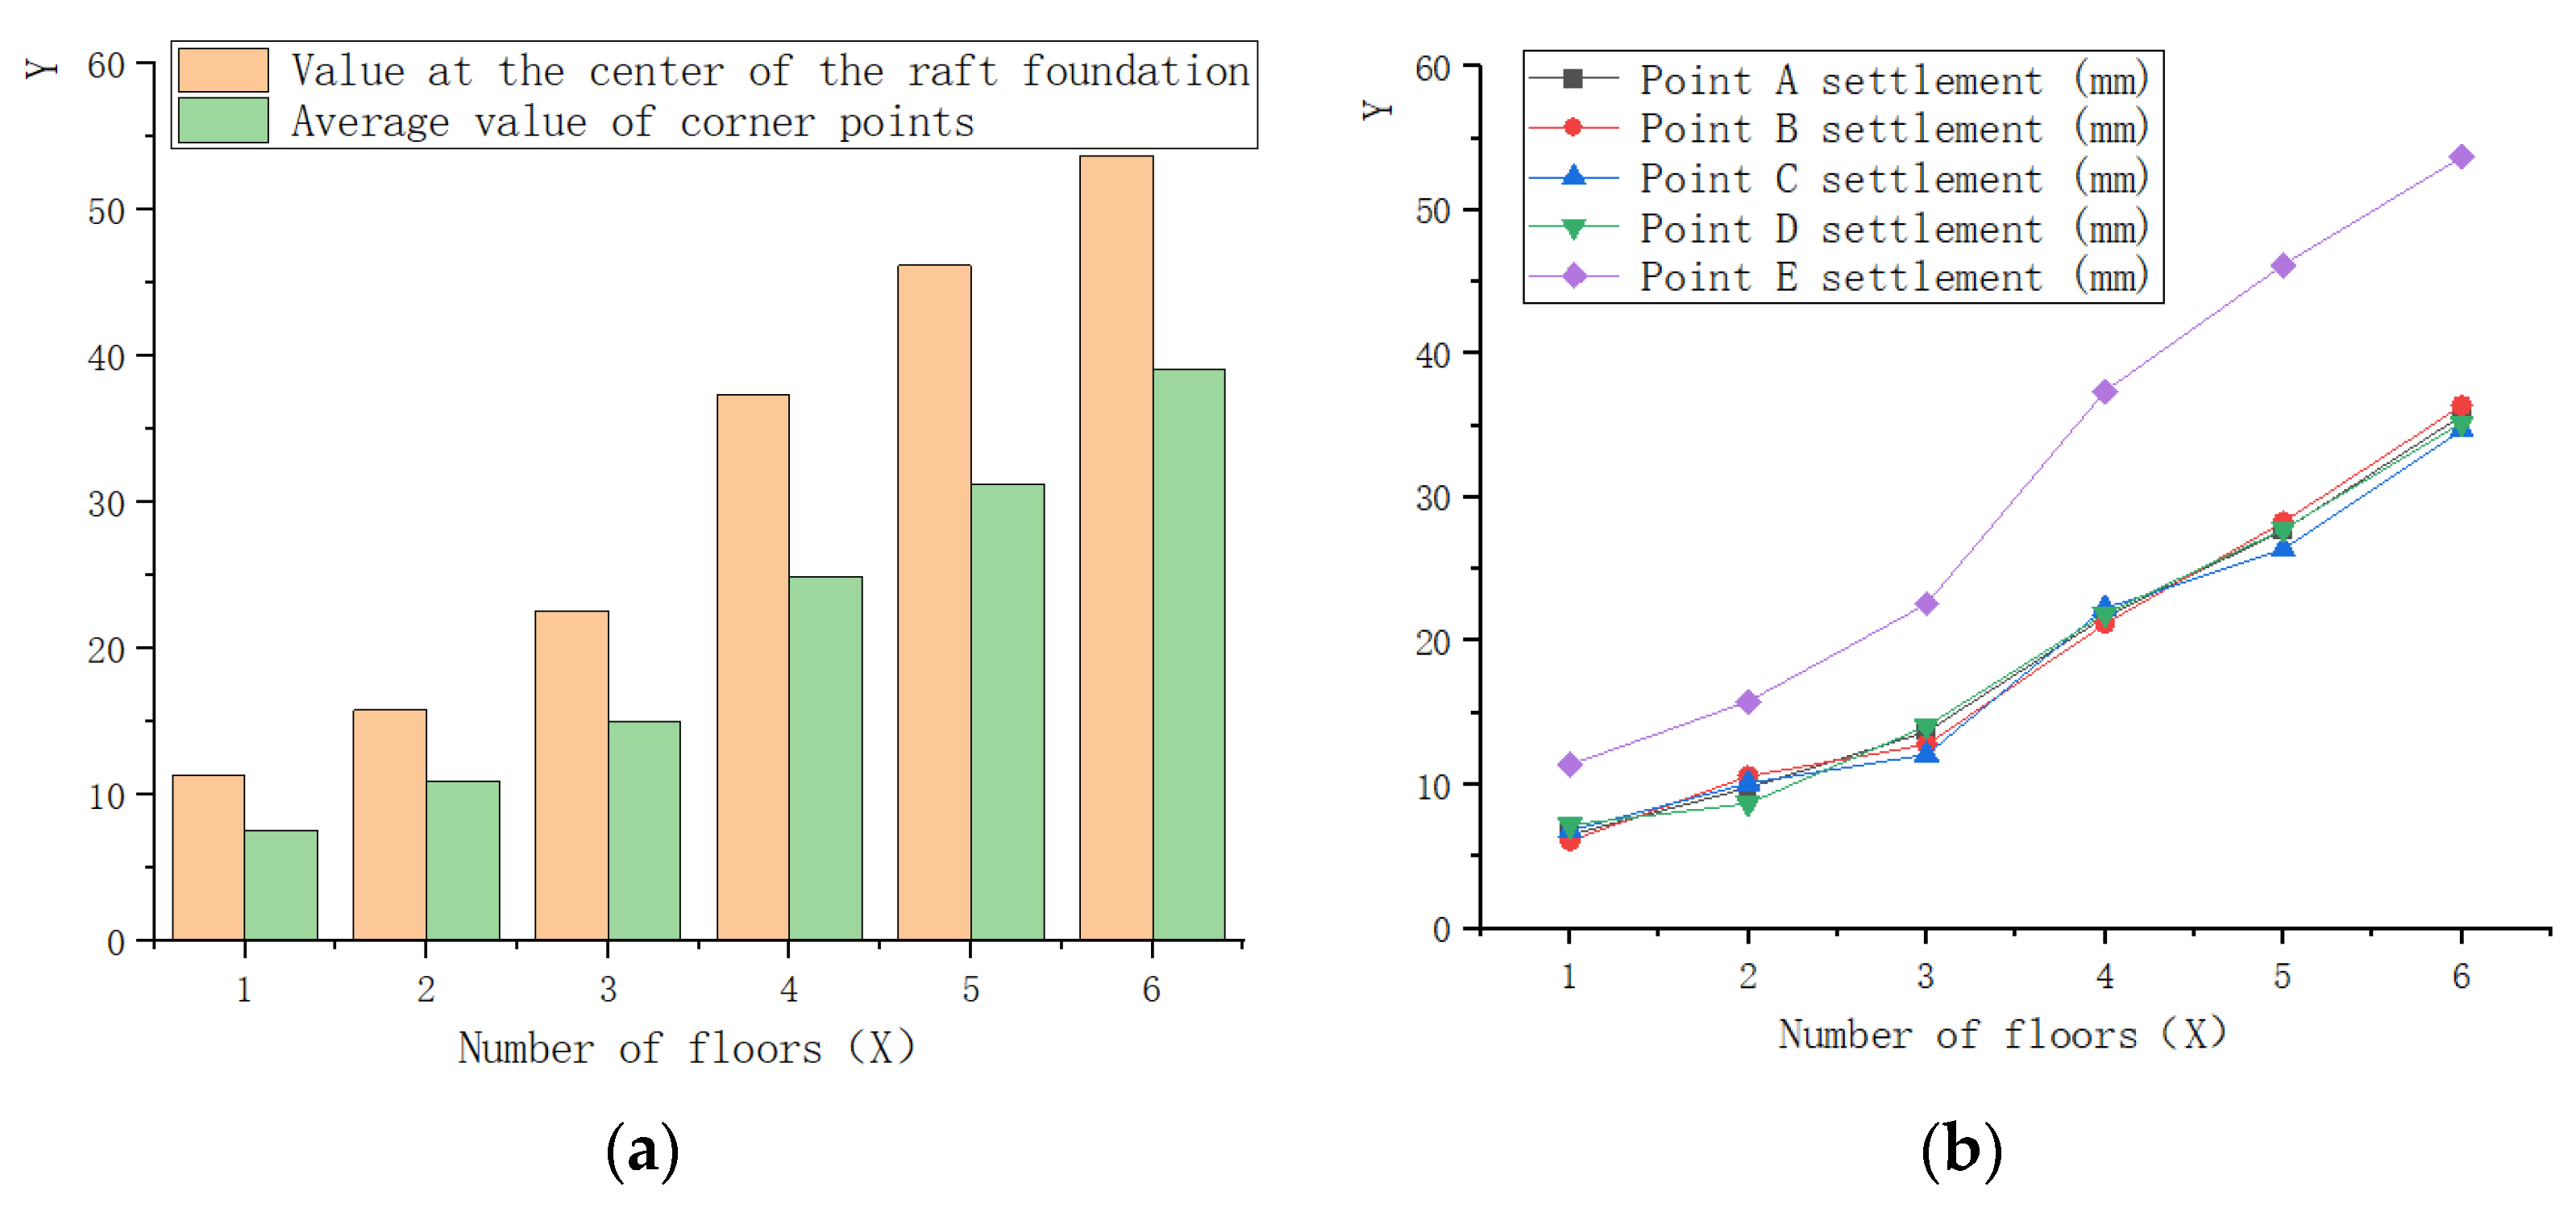
3.2. Load–Settlement Relationship

The uneven settlement of the foundations of high-rise buildings will have a very serious influence on the structure, which will cause wall cracking in the structure, or even the structure’s collapse. For high-rise buildings, it is more reasonable to control the settlement of the pile–raft foundation. Therefore, it is of great significance to study the load–settlement relationship between the superstructure and the pile–raft foundation.
The settlement data for the raft was obtained by observing preset positions, with the average value of each observation point taken as the final foundation settlement. Under different working conditions, the relationship between the settlement and superstructure height was calculated based on the average settlement values. After processing the settlement data as shown in Table 4 (unit mm), the linear fitting was adopted as shown in Figure 16, and the fitting relationship is shown in Table 5.
According to Figure 16b and Table 5, as the height increases, the average settlement of the raft foundation increases, as in the raft center point E’s increase from 11.4 mm to 53.7 mm, which is caused by the weight of the superstructure. Furthermore, the relationship between the settlement increase and height increase is linear, as in the A point fitting expression y = 5.9343x − 1.5867. When the superstructure works together with the pile–raft foundation, the average settlement of the foundation decreases, and the differential settlement is also reduced due to the deformation constraint of the superstructure. However, as the height of the superstructure increases, the differential settlement value will increase, suggesting limited control. At the same time, the reduction in the raft deformation contributes to better use of the soil and reduces the overall settlement, and the pile group effect leads to the basin settlement of the foundation. In areas with poor soil quality, the design priority is often controlling settlement. The participation of the superstructure can significantly reduce settlement, but the control effect is limited, and the cost of raft is high. Therefore, the designer needs to comprehensively consider the economic and working situation when assessing the joint action of the superstructure and the pile–raft foundation.

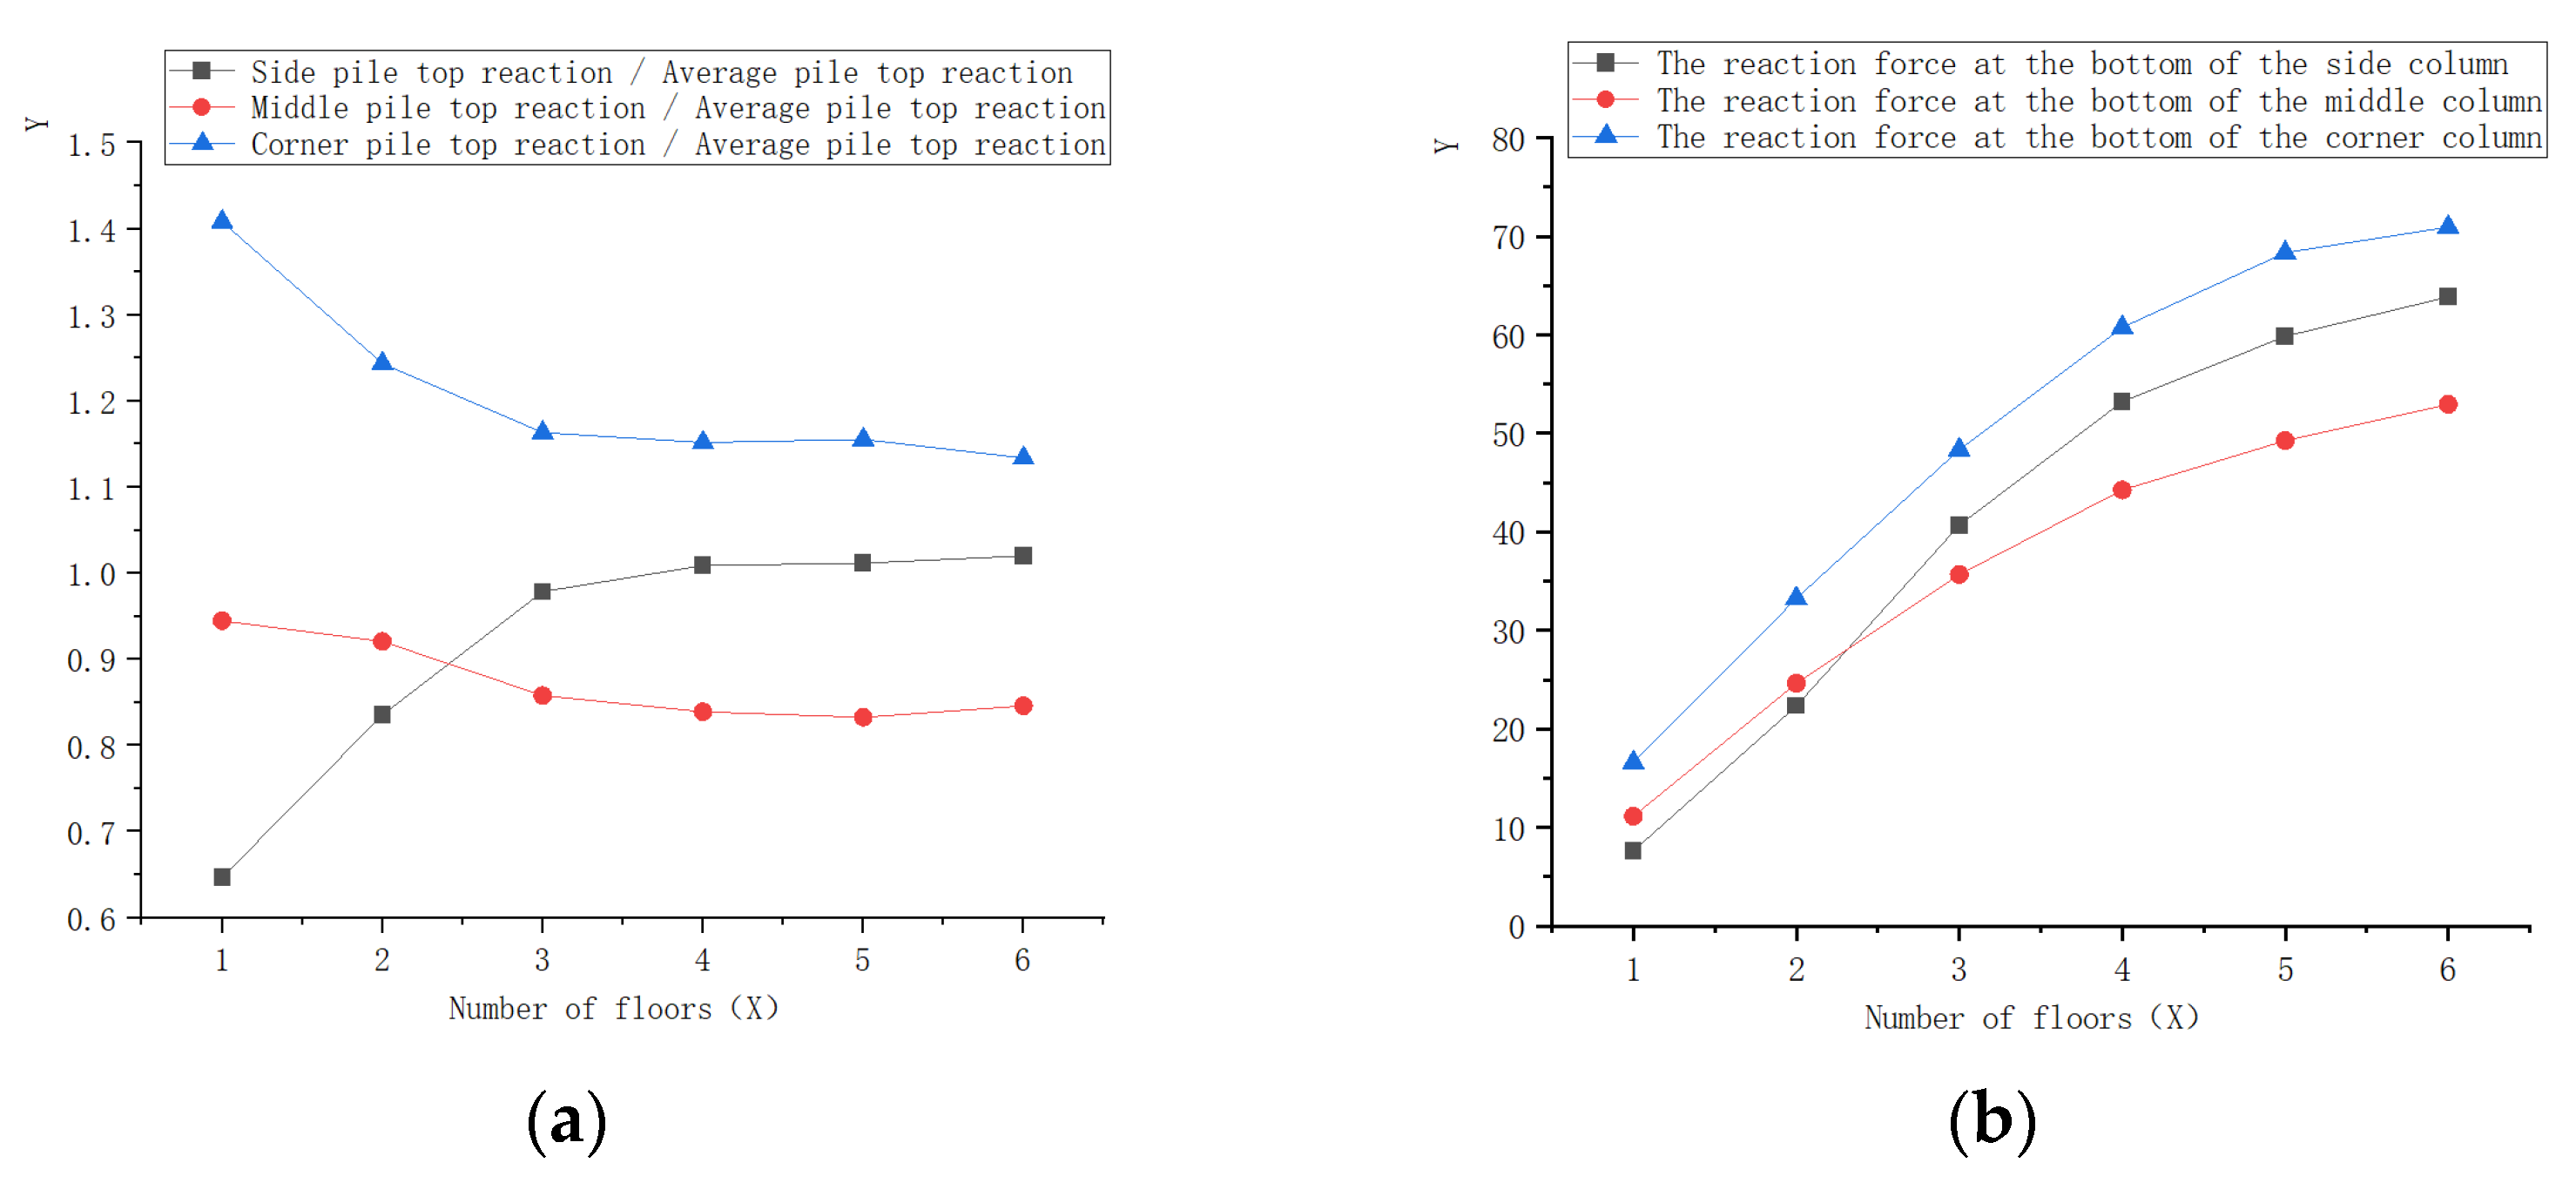
3.3. Load-Sharing Relationship of the Pile Body

From the strain patches at the preset positions on the pile, strain data was obtained via a static strain gauge. The working characteristics of the pile, side friction resistance, operational conditions, and load-sharing behavior were calculated and are listed in Table 6. Linear fitting was applied to the data, as shown in Figure 15.
As can be seen from Figure 17, under the joint influence of the pile–raft foundation and superstructure, the reaction force of the corner pile top is the largest, and the average reaction ratio remains above 1.1 (110%). With the increase in the number of floors, the reverse force of the side pile top gradually exceeds that of the middle pile. In the early stage, the middle pile provides a large bearing capacity due to the pile group effect, but with the increase in load, the stiffness of the superstructure increases, the deformation of the pile–raft foundation is constrained, the middle pile is unloaded, the side pile and the corner pile share more axial force, and the axial force increment of the corner pile is the largest. The five-layer and six-layer conditions show that the slope of the logarithmic fitting curve is significantly reduced, which indicates that although the consideration of the superstructure stiffness has a significant positive effect on increasing the utilization efficiency of the pile, the effect of this constraint will gradually decrease.

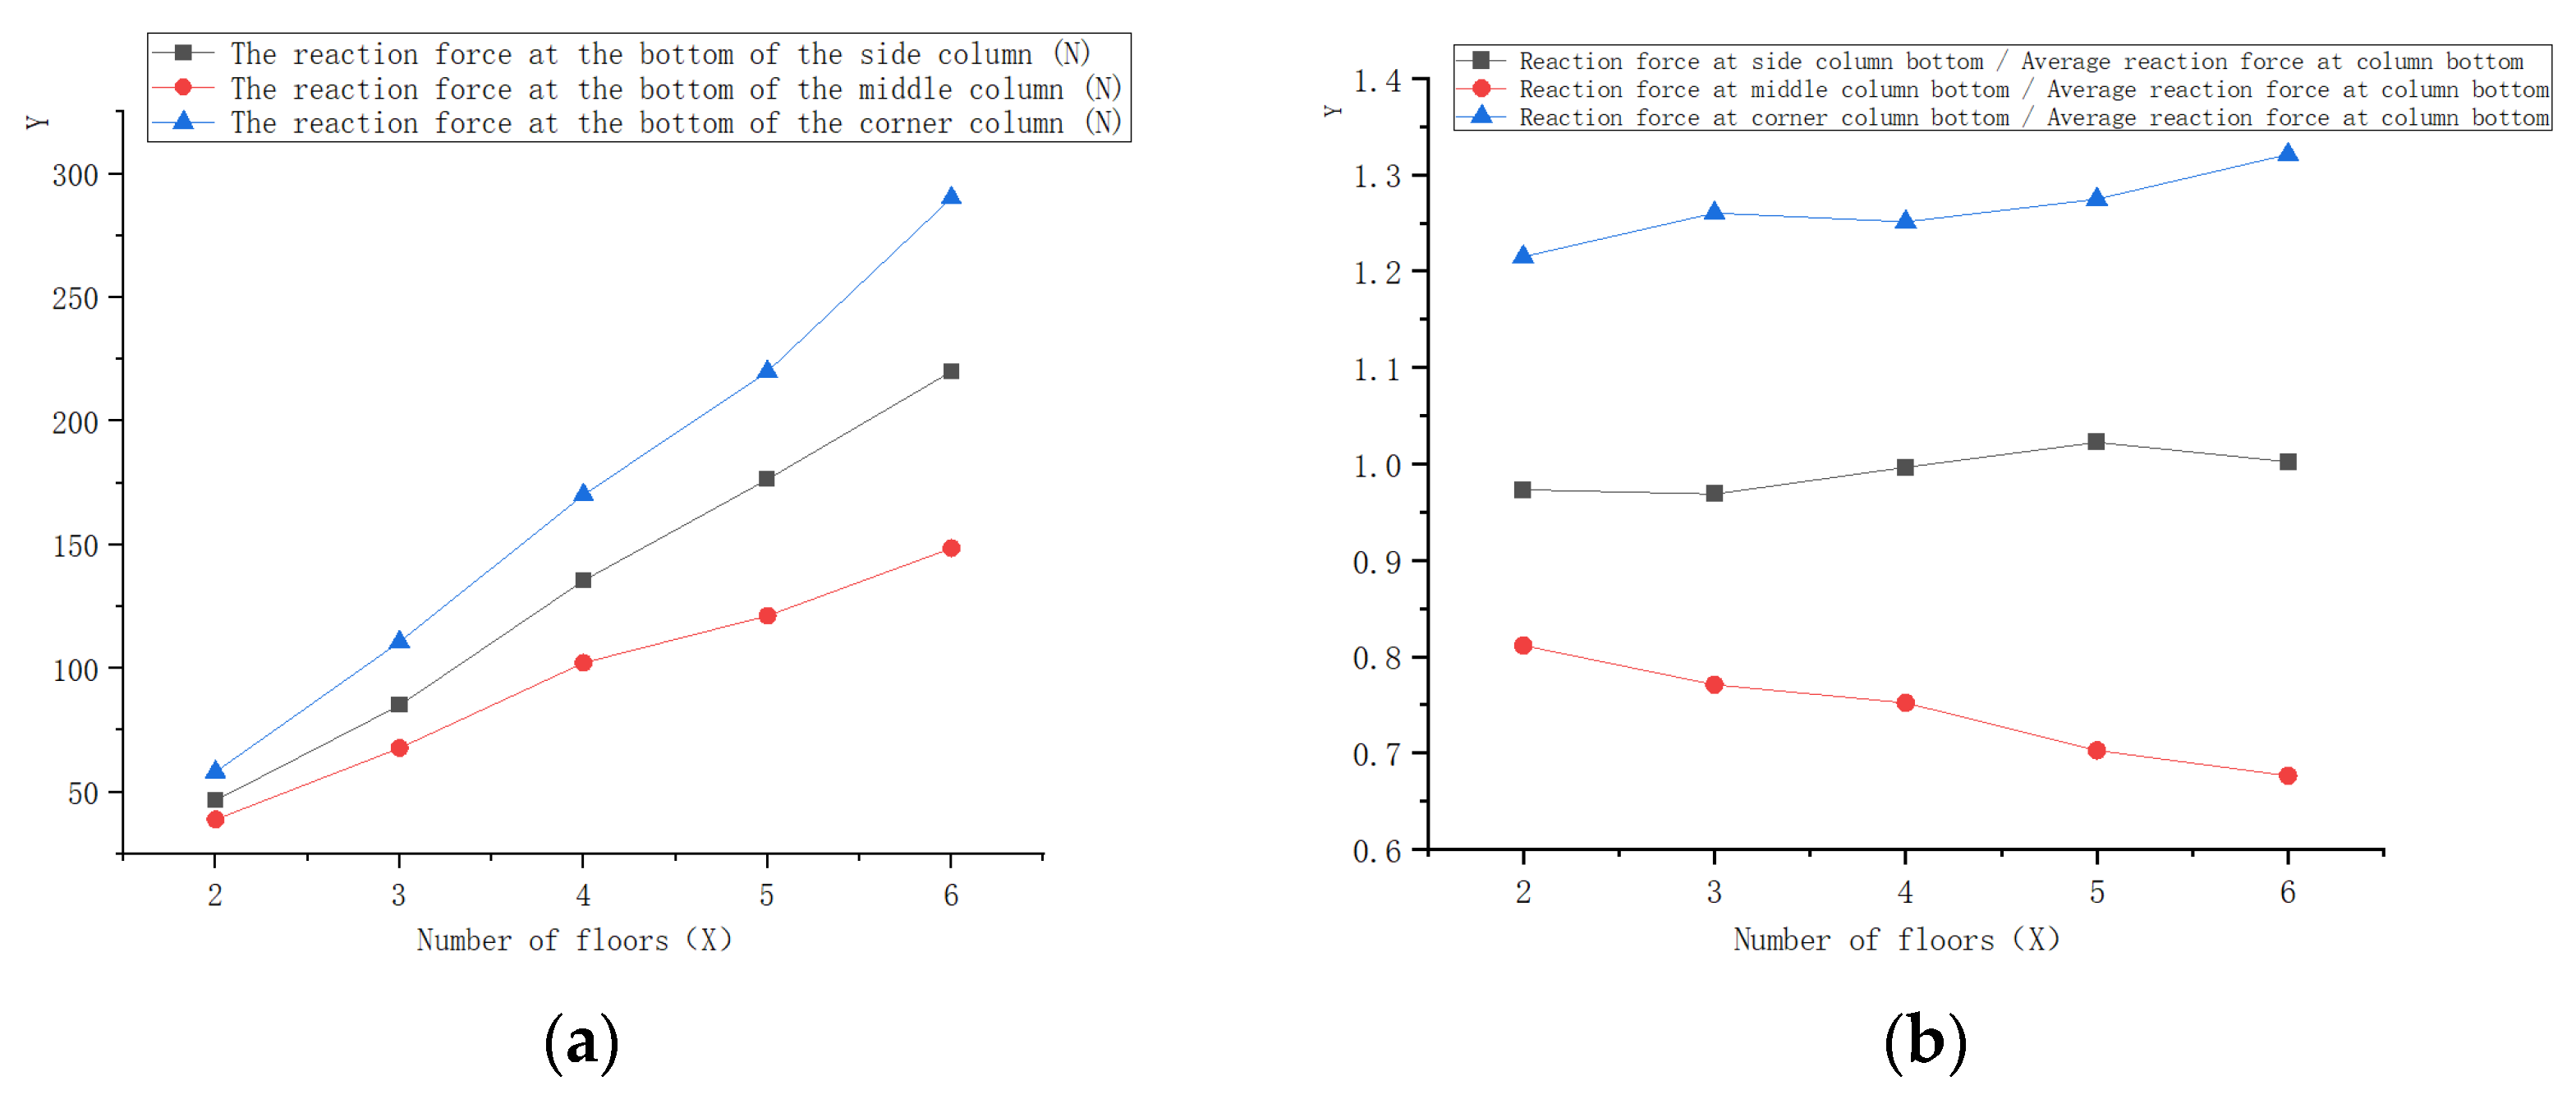
3.4. Working Characteristics of the Bottom Column of the Superstructure

Based on the strain gauge set at the preset position of the bottom column, through the static strain gauge, and in the construction of different working conditions of the axial force characteristics of the different parts of the middle column, side column, and corner column in the cast-in-place way, the measurement of the bottom column is shown in Table 7 and Figure 18.
As can be seen from Figure 18, with the increase in the number of layers of the superstructure and the increase in the vertical load, the axial force on the bottom column of the superstructure increases, and the linear relationship between the number of floors and the reverse force on the bottom column is obvious. The reverse force distribution at the bottom of the column shows a phenomenon of large size at the edges and smaller size in the middle, reflecting the foundation settlement pattern, and the corner column increases the fastest, followed by the side column, and the phenomenon of unloading appears in the middle column. In late loading, there is an increase in the slope of the reverse force curve between the corner and side columns. According to a further analysis, this is due to the superstructure and pile–raft foundation constraints, influencing the internal force distribution, although the superstructure reducing the differential settlement has an obvious effect. However, with the increase in the load, the raft inevitably increases the basin settlement trend, the middle settlement is large, the surrounding settlement is small, and consequently, for a frame raft, the axial forces in the corner and side columns increase rapidly.

4. Conclusions

In this paper, the bearing characteristics of a pile–raft foundation and superstructure in soft earth are studied by using the similarity theory. The test focuses on analyzing the working characteristics of the components under different superstructure heights, especially the influence of the superstructure construction conditions on the settlement, the distribution relationship of the pile top load, and the working characteristics of the bottom column of the superstructure. The main conclusions are summarized as follows:
(1) The number of floors exhibits a significant linear relationship with the raft settlement. As the height of the superstructure increases, the load on the pile–raft foundation increases, resulting in the average settlement increasing. However, after considering the combined action of the superstructure, the mean settlement of the foundation is reduced. The constraints generated by the design and construction of the superstructure effectively distribute the loads, significantly reducing the internal stress levels of the raft foundation. This, in turn, enhances the safety and stability of the foundation, while minimizing the differential settlement caused by local deformations.
(2) When the height of the superstructure initially increases, the pile group effect leads to “basin-type” settlement of the foundation, the middle pile is unloaded, and part of the axial force is borne by the corner pile and the side pile. In a pile foundation system, the load experienced by corner piles generally increases at a faster rate compared to piles located in other positions, resulting in the rapid growth of their reaction force during the initial application of the building load; the side pile experiences the second largest force, and the middle pile undergoes the smallest. As the number of floors increases further, the slope of the reaction force growth curve of the pile top gradually decreases, indicating that the stiffness constraint effect of the superstructure is gradually weakened.
(3) When bearing the load of the superstructure, the axial force on the bottom column presents the distribution characteristics of higher at the perimeter and lower in the center. The axial force increment of the corner column is the largest, and that of the side column is the second largest; the middle column is partially unloaded. Unlike the working characteristics of the piles, the slope of the corner column increases with the number of floors. This is due to the intensification of the “basin” settlement and the bridge effect of the raft, leading to the rapid increase in the axial force on the corner column and the side column. This phenomenon reflects the interaction between superstructure and pile–raft foundation and the redistribution of internal forces.

Author Contributions

All authors contributed to the study conception and design. Methodology, Z.Z. and S.H.; conceptualization, X.H.; investigation, C.M., B.L., K.C. and L.Z.; validation, Z.S. and Y.W. All authors have read and agreed to the published version of the manuscript.

Funding

This research received no external funding.

Data Availability Statement

The original contributions presented in the study are included in the article, further inquiries can be directed to the corresponding author.

Conflicts of Interest

Author Zhibin Zhong, Xiaotong He, Shangheng Huang, Chao Ma was employed by Chengdu Construction & Engineering Group Third Construction Co., Ltd. Author Lining Zheng was employed by China Southwest Geotechnical Investigation & Design Institute Co., Ltd. The remaining authors declare that the research was conducted in the absence of any commercial or financial relation-ships that could be construed as a potential conflict of interest.

References

  1. Chang, D.-W.; Lin, J.-H.; Cheng, S.-H.; Ge, L. Dimensionless Reaction Coefficients for Embedded Piled Raft Foundations in Soft Clays under Vertical Loads. Int. J. Géoméch. 2024, 24, 04024025. [Google Scholar] [CrossRef]
  2. Ahmed, D.; Taib, S.N.L.B.; Ayadat, T.; Hasan, A. Numerical Analysis of the Carrying Capacity of a Piled Raft Foundation in Soft Clayey Soils. Civ. Eng. J. 2022, 8, 622–636. [Google Scholar] [CrossRef]
  3. Van Cao, H.; Nguyen, T.A.; Le, V.A.N. 3D Finite Element Analysis of the Effect of Raft Thickness, Pile Spacing, and Pile Length on the Behavior of Piled Raft Foundation. Int. J. Geomate 2022, 23, 47–56. [Google Scholar] [CrossRef]
  4. Al-Zuhairi, A.H.; Abdualrahman, S.Q.; Hanoon, A.N.; Ali, A.I.T.; Abdulhameed, A.; Al Zand, A.W. Enhancing the Structural Analysis of RC Piled-Raft Foundation by Actual Behaviour of Supporting Piles. Civ. Environ. Eng. 2022, 18, 678–687. [Google Scholar] [CrossRef]
  5. Deb, P.; Debnath, B.; Reang, R.B.; Pal, S.K. Structural Analysis of Piled Raft Foundation in Soft Soil: An Experimental Simulation and Parametric Study with Numerical Method. Ocean. Eng. 2022, 261, 112139. [Google Scholar] [CrossRef]
  6. Harianto, T.; Yunus, M.; Walenna, M.A. Bearing Capacity of Raft-Pile Foundation Using Timber Pile on Soft Soil. Int. J. Geomate 2021, 21, 108–114. [Google Scholar] [CrossRef]
  7. Abdel-Azim, O.A.; Abdel-Rahman, K.; Ei-Mossallamy, Y.M. Numerical Investigation of Optimized Piled Raft Foundation for High-Rise Building in Germany. Innov. Infrastruct. Solut. 2020, 5, 11. [Google Scholar] [CrossRef]
  8. Lin, D.-G.; Liu, W.-T.; Chou, J.-C. Mechanical Behaviors of Piled-Raft Foundation and Diaphragm Wall in Deep Excavation of Taipei Metropolitan. J. Mar. Sci. Technol. 2016, 24, 980–991. [Google Scholar] [CrossRef]
  9. Watcharasawe, K.; Jongpradist, P.; Kitiyodom, P.; Matsumoto, T. Measurements and Analysis of Load Sharing Between Piles and Raft in a Pile Foundation in Clay. Geomech. Eng. 2021, 24, 559–572. [Google Scholar] [CrossRef]
  10. Visuvasam, J.; Chandrasekaran, S.S. Effect of Soil–Pile–Structure Interaction on Seismic Behaviour of RC Building Frames. Innov. Infrastruct. Solut. 2019, 4, 45. [Google Scholar] [CrossRef]
  11. Lee, S.; Moon, J.-S. Effect of Interactions between Piled Raft Components and Soil on Behavior of Piled Raft Foundation. KSCE J. Civ. Eng. 2017, 21, 243–252. [Google Scholar] [CrossRef]
  12. Bisht, R.S.; Juneja, A. Load Sharing Ratios and Interaction Effects for Piled Raft Foundations in Sands. Proc. Inst. Civ. Eng.-Geotech. Eng. 2021, 176, 105–117. [Google Scholar] [CrossRef]
  13. Patil, G.; Choudhury, D.; Mondal, A. Three-Dimensional Soil-Foundation-Superstructure Interaction Analysis of Nuclear Building Supported by Combined Piled-Raft System. Int. J. Géoméch. 2021, 21, 04021029. [Google Scholar] [CrossRef]
  14. Yang, Y.; Gong, W.; Cheng, Y.P.; Dai, G.; Zou, Y.; Liang, F. Effect of Soil-Pile-Structure Interaction on Seismic Behaviour of Nuclear Power Station via Shaking Table Tests. Structures 2021, 33, 2990–3001. [Google Scholar] [CrossRef]
  15. Hanna, A.M.; Vakili, R. Load-Sharing Mechanism of Non-Displacement Piled-Raft Foundation in Sand. Proc. Inst. Civ. Eng.-Ground Improv. 2021, 174, 105–115. [Google Scholar] [CrossRef]
  16. Chaudhuri, C.H.; Chanda, D.; Saha, R.; Haldar, S. Three-Dimensional Numerical Analysis on Seismic Behavior of Soil-Piled Raft-Structure System. Structures 2020, 28, 905–922. [Google Scholar] [CrossRef]
  17. Jayalekshmi, B.R.; Jisha, S.V.; Shivashankar, R. Response in Piled Raft Foundation of Tall Chimneys under Along-Wind Load Incorporating Flexibility of Soil. Front. Struct. Civ. Eng. 2015, 9, 307–322. [Google Scholar] [CrossRef]
  18. Mishra, A.; Venkatesh, K.; Karumanchi, S.R. 3D Numerical Analysis of Single Pile and Pile–Raft Subjected to Vertical Loading. Indian Geotech. J. 2023, 53, 686–697. [Google Scholar] [CrossRef]
  19. Sinha, A.; Hanna, A.M. 3D Numerical Model for Piled Raft Foundation. Int. J. Géoméch. 2017, 17, 04016055. [Google Scholar] [CrossRef]
  20. Singh, H.; Garg, P.; Jha, J.N. Modeling the Response of a Piled-Raft Footing: Ultimate Bearing Capacity. Iran. J. Sci. Technol. Trans. Civ. Eng. 2021, 45, 359–371. [Google Scholar] [CrossRef]
  21. Wang, C.; Gao, F.; Tan, X.; Xu, W. A Modified Method for Improving the Prediction Accuracy of the Tunnel Shaking Table Model Test Based on Non-Direct Similarity Technique. Syst. Sci. Control Eng. 2022, 10, 104–114. [Google Scholar] [CrossRef]
  22. GB 50016-2014; Code for Fire Protection Design of Buildings (2018 Edition). Ministry of Housing and Urban-Rural Development of the People’s Republic of China, China Planning Press: Beijing, China, 2018.
  23. Feng, Z.; Shen, D.; Zhang, J.; Tang, H.; Jiang, G. Effect of Crystalline Admixture on Early-Age Residual Stress and Cracking Potential of High-Strength Concrete. Struct. Concr. 2023, 24, 4243–4258. [Google Scholar] [CrossRef]
  24. Suryanita, R.; Maizir, H.; Zulapriansyah, R.; Subagiono, Y.; Arshad, M.F. The Effect of Silica Fume Admixture on the Compressive Strength of the Cellular Lightweight Concrete. Results Eng. 2022, 14, 100445. [Google Scholar] [CrossRef]
  25. Li, Z.; Gao, X.; Lu, D.; Dong, J. Early Hydration Properties and Reaction Kinetics of Multi-Composite Cement Pastes with Supplementary Cementitious Materials (SCMs). Thermochim. Acta 2022, 709, 179157. [Google Scholar] [CrossRef]
  26. Cheng, Y.-h.; Yang, S.-h.; Zhang, J.-y.; Sun, X.-h. Test Research on Hydration Process of Cement-Iron Tailings Powder Composite Cementitious Materials. Powder Technol. 2022, 399, 117215. [Google Scholar] [CrossRef]
  27. GB 55008-2021; Code for General Concrete Structures. Ministry of Housing and Urban-Rural Development of the People’s Republic of China, China Architecture & Building Press: Beijing, China, 2021.
  28. Coulomb, C.A. Essaí sur une application des règles de maximis & minimis à quelques problèmes de statique. Rev. Française Géotechnique 2023, 175, 1. [Google Scholar]
Figure 1. Schematic diagram of the preparation process for test concrete.
Buildings 15 02302 g001
Figure 2. Bamboo tendon sample for test: (a) Primary processing of the bamboo; (b) Bamboo poles after anti-corrosion and anti-mildew treatment; (c) The processed bamboo strips.
Buildings 15 02302 g002
Figure 3. Pile bamboo reinforcement layout drawings: (a) Top view of bamboo reinforcement layout; (b) Perspective view of bamboo reinforcement layout.
Buildings 15 02302 g003
Figure 4. Schematic diagram of pile production: (a) Bamboo tendon physical diagram; (b) PVC template physical diagram; (c) Pile pouring process diagram; (d) Pile body mold removal process drawing.
Buildings 15 02302 g004aBuildings 15 02302 g004b
Figure 5. Schematic diagram of raft production: (a) Top view of bamboo reinforcement layout in raft foundation; (b) Front view of bamboo reinforcement layout in raft foundation; (c) Before raft foundation pouring; (d) Formed raft foundation after concrete pouring.
Buildings 15 02302 g005
Figure 6. The layout drawing of the upper structure columns: (a) Top view of the superstructure column reinforcement; (b) Perspective view of the superstructure column reinforcement.
Buildings 15 02302 g006
Figure 7. The layout drawing of the upper structure beams: (a) Facing the upper view of the superstructure beam reinforcement; (b) Perspective view of the superstructure beam reinforcement.
Buildings 15 02302 g007
Figure 8. The layout drawing of floor slabs: (a) Top view of floor reinforcement; (b) Facing view of floor reinforcement.
Buildings 15 02302 g008
Figure 9. Physical map of the superstructure: (a) Silver board model; (b) Physical picture of floor slab and beam and bamboo tendons; (c) Physical drawing after the template lap; (d) Physical drawing after the first layer is poured.
Buildings 15 02302 g009aBuildings 15 02302 g009b
Figure 10. Schematic diagram of the test object: (a) Quadruple direct shear apparatus; (b) Soil samples with the test results.
Buildings 15 02302 g010
Figure 11. Schematic diagram of direct shear test results of soil: (a) Stress and strain relationship under different vertical pressures; (b) Peak stress fitting to the straight line result.
Buildings 15 02302 g011
Figure 12. Pile strain gauge layout diagram: (a) Layout diagram of pile strain gauge; (b) Physical diagram of pile strain micrograph; (c) Physical drawing of the pile body number.
Buildings 15 02302 g012
Figure 13. Micrometer layout diagram: (a) Schematic diagram of the layout; (b) Thousand-point layout physical map; (c) Physical graph of thousand points.
Buildings 15 02302 g013
Figure 14. Layout of the column strain gauge: (a) Schematic diagram of the column strain gauge; (b) Physical diagram of the column strain micrograph.
Buildings 15 02302 g014
Figure 15. Physical loading map for simulation of working conditions; (a) Physical drawing of loading weight; (b) Physical drawing of the superstructure loading.
Buildings 15 02302 g015
Figure 16. The relationship between the number of floors and the settlement of the foundation: (a) Plot of point settlement and number of floors; (b) The relationship between average edge settlement and central settlement.
Buildings 15 02302 g016
Figure 17. The relationship between the number of floors and the reaction force at the top of the pile: (a) Reverse force ratio of pile top under different working conditions; (b) Diagram of pile top reaction forces under different loads.
Buildings 15 02302 g017
Figure 18. The relationship between the number of floors and the reaction force at the bottom of the column: (a) Counterforce diagram of the bottom column under different working conditions; (b) Reverse force ratio of the bottom column under different working conditions.
Buildings 15 02302 g018
Table 1. Test model similarity.
Physical QuantitySymbolSimilarity RelationSimilarity Constant
Geometric dimensions (control quantity)LCL = 1010
Elastic modulus (control quantity)ECE = CL Cγ20
Compressive strength (control amount)σCσ = CL Cγ20
Volume weight (control volume)γCγ = 22
Internal friction angleφCφ = 11
Cohesive strengthCCC = CL Cγ20
Meeting an emergencyεCε = 11
Acceleration of gravitygCg = 11
TimetCt = CL0.53.2
Table 2. Mix ratio of masonry mortar per cubic meter.
ProjectMasonry Mortar
M1.0M2.5M5.0M1.5
materialunitquantitative proportionquantitative proportionquantitative proportionquantitative proportion
32.5 MPa Cementton0.1580.1760.2040.170
limeton0.0750.0670.055/
medium sandton1.0151.0151.0151.015
watercubic meter0.4000.4000.4000.400
Table 3. Checking calculation of rigid-weight ratio of superstructure in original proportion.
Level Number (m)X to Stiffness
(kN/m)
Y Orientation Stiffness
(kN/m)
Floor Height (m)Upper Weight (kN)X-Direction Stiffness-to-Weight RatioY-Direction Stiffness-to-Weight Ratio
661,893.1961,893.173.00734.40252.83252.83
561,014.1161,014.093.001015.20180.30180.30
465,017.9765,017.973.001749.60111.48111.48
364,588.5264,588.493.002030.4095.4395.43
267,960.8867,960.853.002764.8073.7473.74
187,309.0087,308.993.003045.6086.0086.00
Table 4. Settlement measuring points corresponding to different working conditions.
Number of FloorsPoint A Settlement (mm)Point B Settlement (mm)Point C Settlement (mm)Point D Settlement (mm)Point E Settlement (mm)
16.56.16.87.211.4
29.810.610.18.715.8
313.712.812.114.122.6
421.721.222.321.937.4
527.728.326.427.846.2
635.736.434.735.253.7
Table 5. The linear fitting relationship between the settlement of each point of the raft and the number of floors.
PTLinear Fitting of the ExpressionCorrelation (R2)
Ay = 5.9343x − 1.58670.9772
By = 6.0857x − 2.06670.9686
Cy = 5.6743x − 1.12670.9593
Dy = 5.8600x − 1.36000.9732
Ey = 9.0714x − 0.56670.9778
Table 6. The pile-top reaction forces of piles under different working conditions.
Number of FloorsSide Pile Top Thrust (N)Middle Pile Crest Reaction (N)Corner Pile Crest Reaction Force (N)
17.6211.1316.59
222.3524.6333.26
340.6935.6748.36
453.2144.2660.75
559.8549.2668.35
663.8552.9570.95
Table 7. The bottom reaction forces of the columns under different working conditions.
Number of FloorsEdge Column Base Reaction (N)Interior Column Base Reaction (N)Corner Column Base Reaction (N)
246.6538.9058.23
385.1367.75110.75
4135.52102.27170.14
5176.44121.26220.01
6220.09148.59290.17
Disclaimer/Publisher’s Note: The statements, opinions and data contained in all publications are solely those of the individual author(s) and contributor(s) and not of MDPI and/or the editor(s). MDPI and/or the editor(s) disclaim responsibility for any injury to people or property resulting from any ideas, methods, instructions or products referred to in the content.

