Article

Numerical Analysis of the Stress–Deformation Behavior of Soil–Geosynthetic Composite (SGC) Masses Under Confining Pressure Conditions

1
Department of Bridge and Road, Mientrung University of Civil Engineering, Tuy Hoa 620000, Vietnam
2
Department of Civil Engineering, National Taipei University of Technology (Taipei Tech), Taipei 106344, Taiwan
3
Department of Civil Engineering, University of Texas Rio Grande Valley, Edinburg, TX 78539, USA
*
Author to whom correspondence should be addressed.
Buildings 2025, 15(13), 2229; https://doi.org/10.3390/buildings15132229
Submission received: 7 May 2025 / Revised: 17 June 2025 / Accepted: 20 June 2025 / Published: 25 June 2025
(This article belongs to the Special Issue Advances in Soil–Geosynthetic Composite Materials)

Abstract

The growing application of soil–geosynthetic composites (SGCs) in geotechnical engineering has highlighted the critical role of reinforcement spacing in enhancing structural performance. This study presents a numerical investigation of the stress–deformation behavior of SGC masses under working stress and failure load conditions, considering both confining and unconfined pressure scenarios. A finite element (FE) model was developed to analyze stress distribution, reinforcement strain profiles at varying depths, and lateral displacement at open facings. Results revealed that vertical stresses in reinforced and unreinforced soil masses were nearly identical, while lateral stresses increased notably in reinforced masses, particularly near reinforcement layers and open facings. Closer reinforcement spacing (0.2 m) effectively reduced lateral displacement and enhanced structural stability compared with wider spacing (0.4 m). In some cases, strengthening reinforcement in the upper portion of the SGC mass proved more effective under failure loads in both confining and unconfined pressure conditions. These findings provide critical insights for optimizing reinforcement spacing in SGC systems, with implications for the design of retaining walls and bridge abutments.

1. Introduction

Soil–geosynthetic composite (SGC) systems that utilize closely spaced reinforcements (Sv ≤ 0.2 m) have garnered significant attention due to their numerous advantages. Unlike mechanically stabilized earth (MSE) structures, where soil mass and reinforcement layers are treated as separate entities and designed similarly to tied-back retaining wall systems, SGC systems integrate soil and reinforcements to create a unified composite behavior.
In MSE designs, stabilization is achieved by specifying the strength and spacing of reinforcements to withstand the theoretical loads imposed by unstabilized soil. In contrast, SGC systems take advantage of closely spaced reinforcements within geosynthetic reinforced oil structures (GRSs) to enhance confining stress on the soil. This increased confining stress significantly influences the fundamental particle-to-particle interactions within cohesionless soils, thereby improving the overall stability and performance of the soil-reinforcement composite.
Early research primarily focused on examining the effects of reinforcement spacing, with findings supported by field-scale experiments [1,2,3]. For instance, Elton and Patawaran [1] conducted detailed unconfined compression tests using non-woven geotextiles to analyze the behavior of reinforced soil across various spacing configurations. Similarly, Adams et al. [2] presented results from five mini-pier experiments involving GRSs to assess the influence of both reinforcement spacing and strength on GRS performance. Furthermore, Pham [3] conducted five large-scale field tests on SGC systems to investigate how variations in reinforcement spacing and strength affected their effectiveness. Together, these studies demonstrate the significant impact of reinforcement spacing and strength on enhancing the performance of reinforced soil. Several large-scale model tests have been conducted to investigate the ultimate bearing capacity of GRS systems by loading specimens to failure. Elton and Patawaran [1] examined cylindrical geotextile-reinforced soil samples under unconfined conditions, varying reinforcement spacing and strength to analyze load-carrying capacity and the interaction between soil and reinforcement under applied loads. Adams et al. [2] explored GRS performance through a series of tests, focusing on the influence of reinforcement spacing on overall behavior and efficiency. Similarly, Pham [3], Wu and Pham [4], and Gui et al. [5] evaluated the effects of reinforcement spacing and strength on GRS masses, and they concluded that spacing plays a more critical role in system performance than strength.
The inclusion of reinforcing layers results in an increase in lateral stress within the soil mass, primarily due to the compaction process. During compaction, both vertical and lateral stresses are generated within the soil. Once the compactor is removed, the increase in vertical stress typically diminishes to zero, while the rise in lateral stress may only experience a slight reduction. The residual increase in lateral stress within the soil mass is commonly referred to as “lock-in” lateral stress. This “lock-in” lateral stress resulting from compaction is defined as compaction-induced stress (CIS) [6].
A series of two-dimensional (2D) numerical studies [3,4,5,6,7,8,9,10,11] were conducted to assess the composite behavior of the GRS wall developed by Pham [3] under static loading conditions. Specifically, Pham [3] performed multiple finite element analyses to investigate how specimen dimensions influence the global stress–strain relationships and volume changes of SGC masses. The objective was to identify the optimal dimensions for a generic SGC model that accurately replicated the load–deformation behavior observed in full-scale SGC structures. In addition, Wu et al. [8] carried out an extensive series of parametric studies aimed at examining the influence of various factors, including reinforcement stiffness, reinforcement spacing, and soil stiffness, on the volume change behavior of SGC masses. These studies provided valuable insights into how these parameters interact and contribute to the overall deformation and performance characteristics of SGC masses. Concurrently, Gui et al. [10] and Phan et al. [11] carried out numerous numerical analyses on a 2 m SGC mass to examine the impacts of compaction load, compaction procedures, and surcharge loads on the stress–deformation behavior of GRS masses. These investigations considered factors such as reinforcement strains, lateral displacements of walls, and net CIS, thereby highlighting the significant role of compaction in influencing the stress–deformation characteristics of SGC masses.
Numerous studies [12,13,14,15,16,17] have focused on analyzing the composite behavior of geosynthetic reinforced soil-integrated bridge systems (GRS-IBSs). For instance, Ardah et al. [12] developed a two-dimensional (2D) plane strain finite element model to simulate the response of GRS-IBSs under various loading scenarios.
Recent trends in numerical simulation of geosynthetic-reinforced soil (GRS) structures have enhanced understanding of reinforcement–soil interaction under various loading conditions [18,19,20,21,22]. Zhao et al. [18] emphasized the critical role of contact modeling in simulating reinforcement–block–soil interfaces for accurate stress prediction. Li et al. [19] examined reinforcement spacing and interface properties under cyclic loads, providing insights into strain localization mechanisms.
Three-dimensional modeling approaches have gained attention for improved accuracy beyond traditional 2D simplifications. Siacara et al. [20] highlighted the value of 3D numerical modeling through comprehensive bibliometric analysis, particularly for complex boundary conditions and variable reinforcement geometries.
Under dynamic loading, Fan et al. [21] demonstrated the impact of horizontal and vertical seismic forces on reinforced wall stability, while Yünkül and Gürbüz [22] explored polymeric strap-reinforced walls under seismic excitation. These studies collectively showed that reinforcement configuration, interface behavior, and loading type significantly influence stress distribution, deformation patterns, and structural performance of GRS systems.
Additionally, significant research efforts have been dedicated to understanding CIS by simulating uniform compaction loads applied to the top surface of each fill layer during the incremental construction of walls [3,23,24,25,26,27,28,29,30,31,32,33,34,35]. Specifically, Mirmoradi and Ehrlich [32,33,34], along with Nascimento et al. [35], evaluated CIS by applying uniform loads to both the top and bottom surfaces of soil layers. Furthermore, Gui et al. [10] demonstrated that the compaction process, characterized by uniformly distributed loads on both surfaces of Type-II soil lift, closely aligned with the analytical model introduced by Wu and Pham [6].
Soil–geosynthetic composite (SGC) systems have demonstrated significant effectiveness in enhancing soil stability and structural performance, particularly in applications such as retaining walls and embankments. The spacing of reinforcement, particularly Sv ≤ 0.2 m, plays a crucial role in improving the performance of composite materials by increasing the confining pressures within the soil, thereby enhancing its overall stability. Numerous studies have explored the effects of reinforcement spacing on the behavior of SGC systems under confined pressure, emphasizing the critical role of reinforcement in lateral displacement and stress distribution.
However, existing literature, including Pham [3], has yet to address the influence of reinforcement spacing on the behavior of SGC systems under unconfined pressure, nor have the underlying mechanisms governing this effect been thoroughly investigated. While physical experiments face challenges in accurately quantifying these effects, finite element (FE) analysis offers a more precise and effective method for analyzing the stress distribution within the soil mass. This gap in the current research presents a significant opportunity for further investigation.
The objective of this study was to investigate the impact of reinforcement spacing on the stress–deformation behavior of SGC systems under unconfined pressure. Through the application of FE analysis, this research examined key factors including stress distribution, strain profiles of reinforcements at varying depths, lateral displacement at open faces, and the overall response of SGC systems under both confining and unconfined loading conditions. The findings of this study are expected to contribute to a deeper understanding of the behavior of SGC systems, offering new insights into the role of reinforcement spacing under unconfined conditions and furthering the understanding of these materials in practical applications.

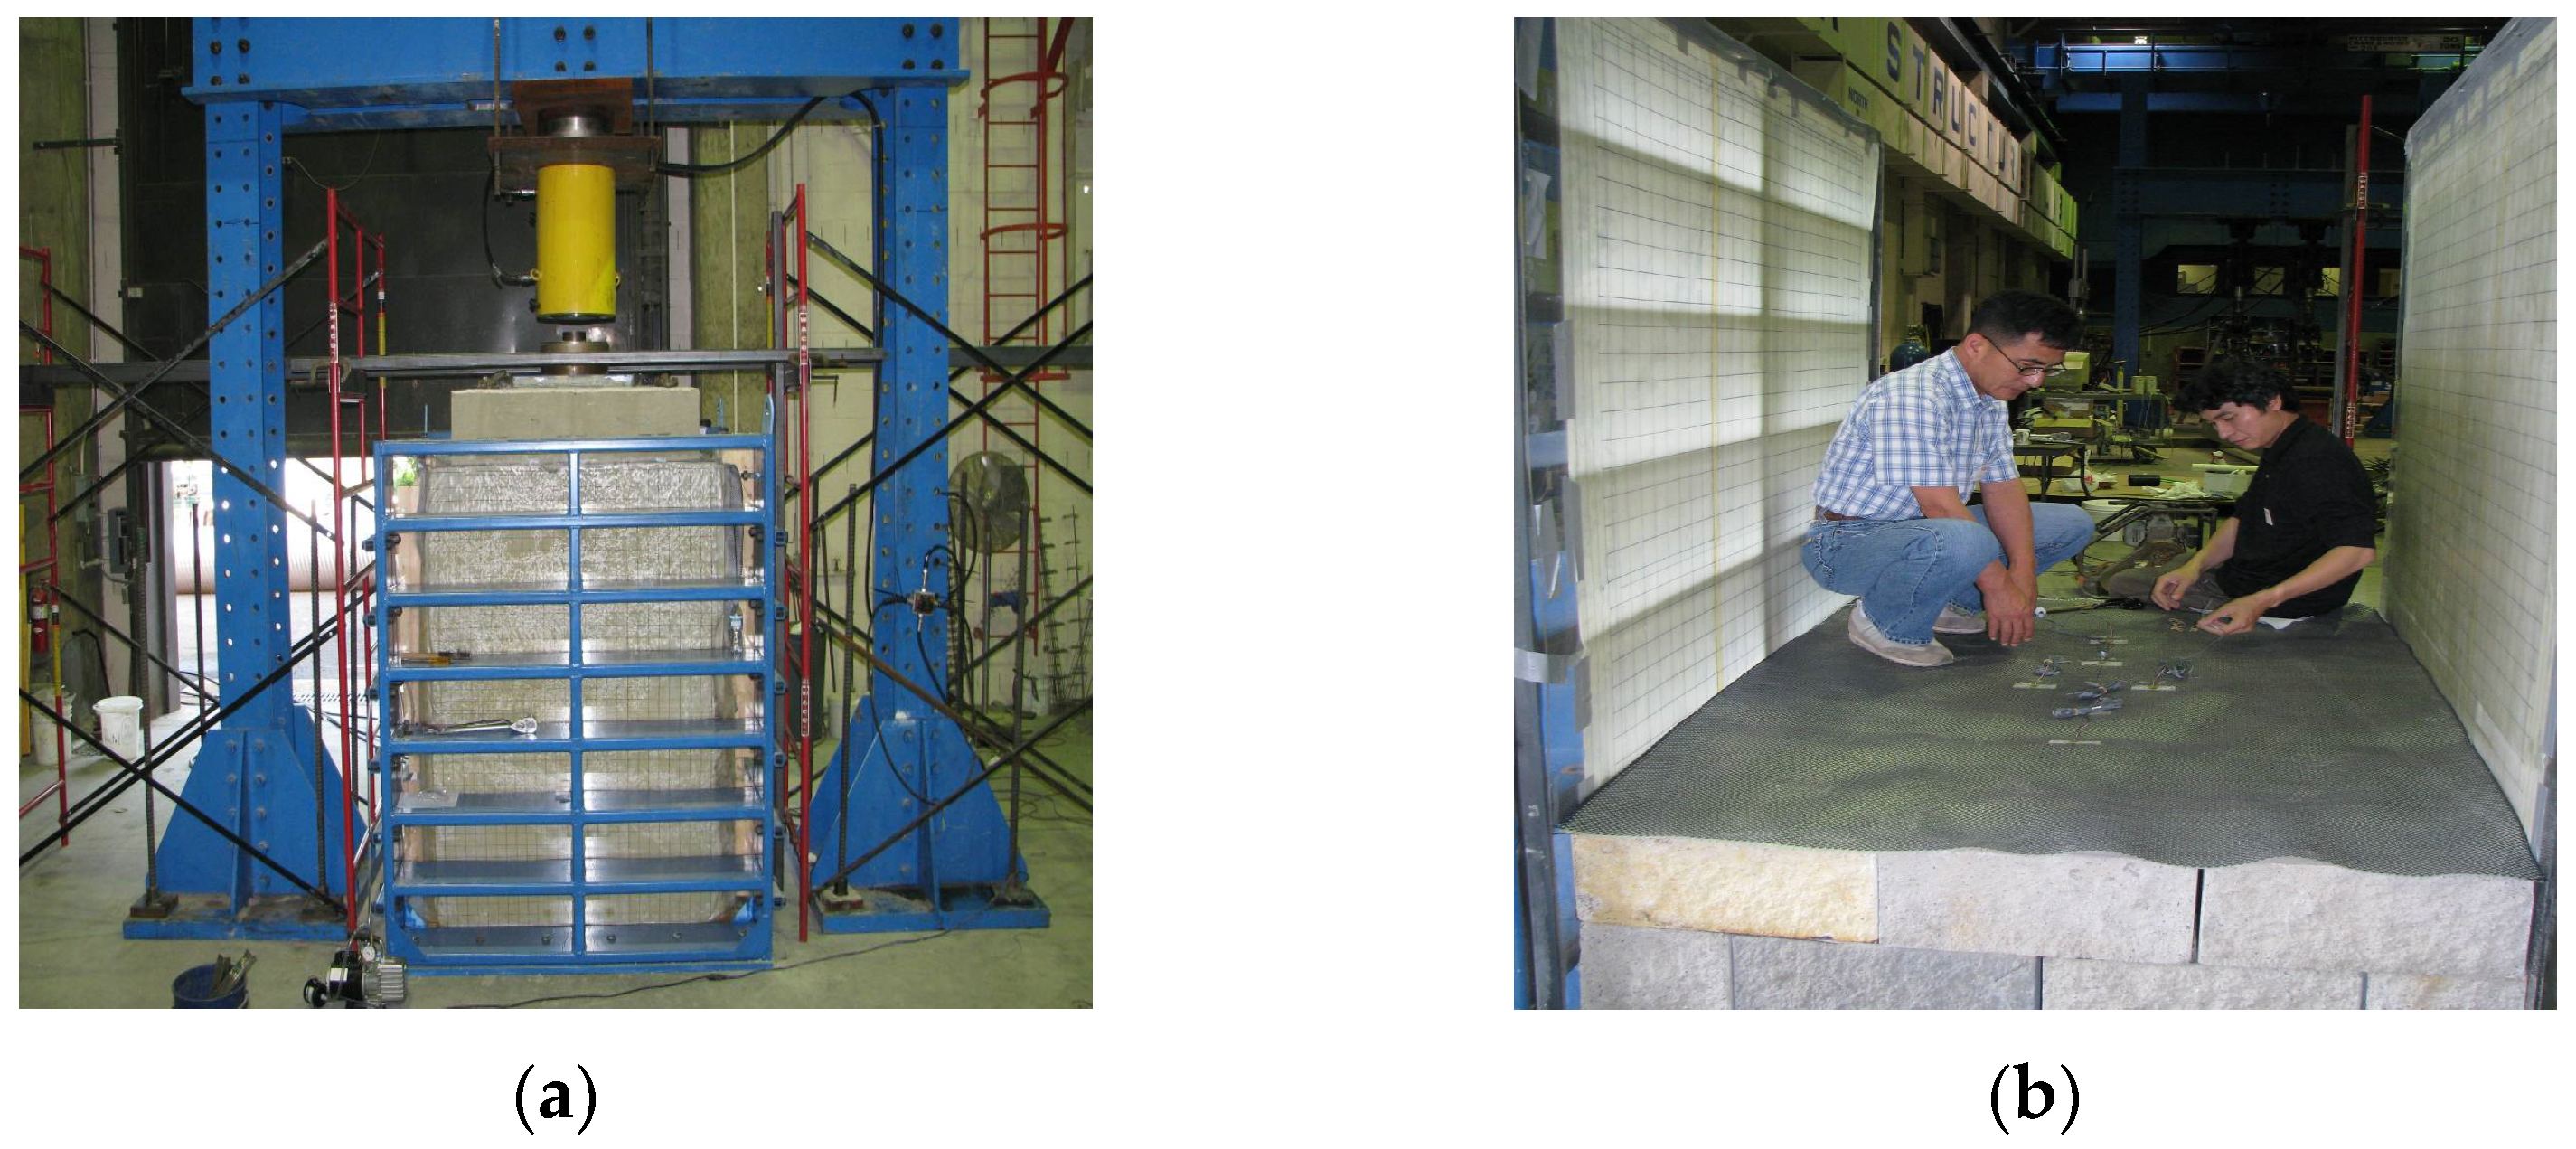
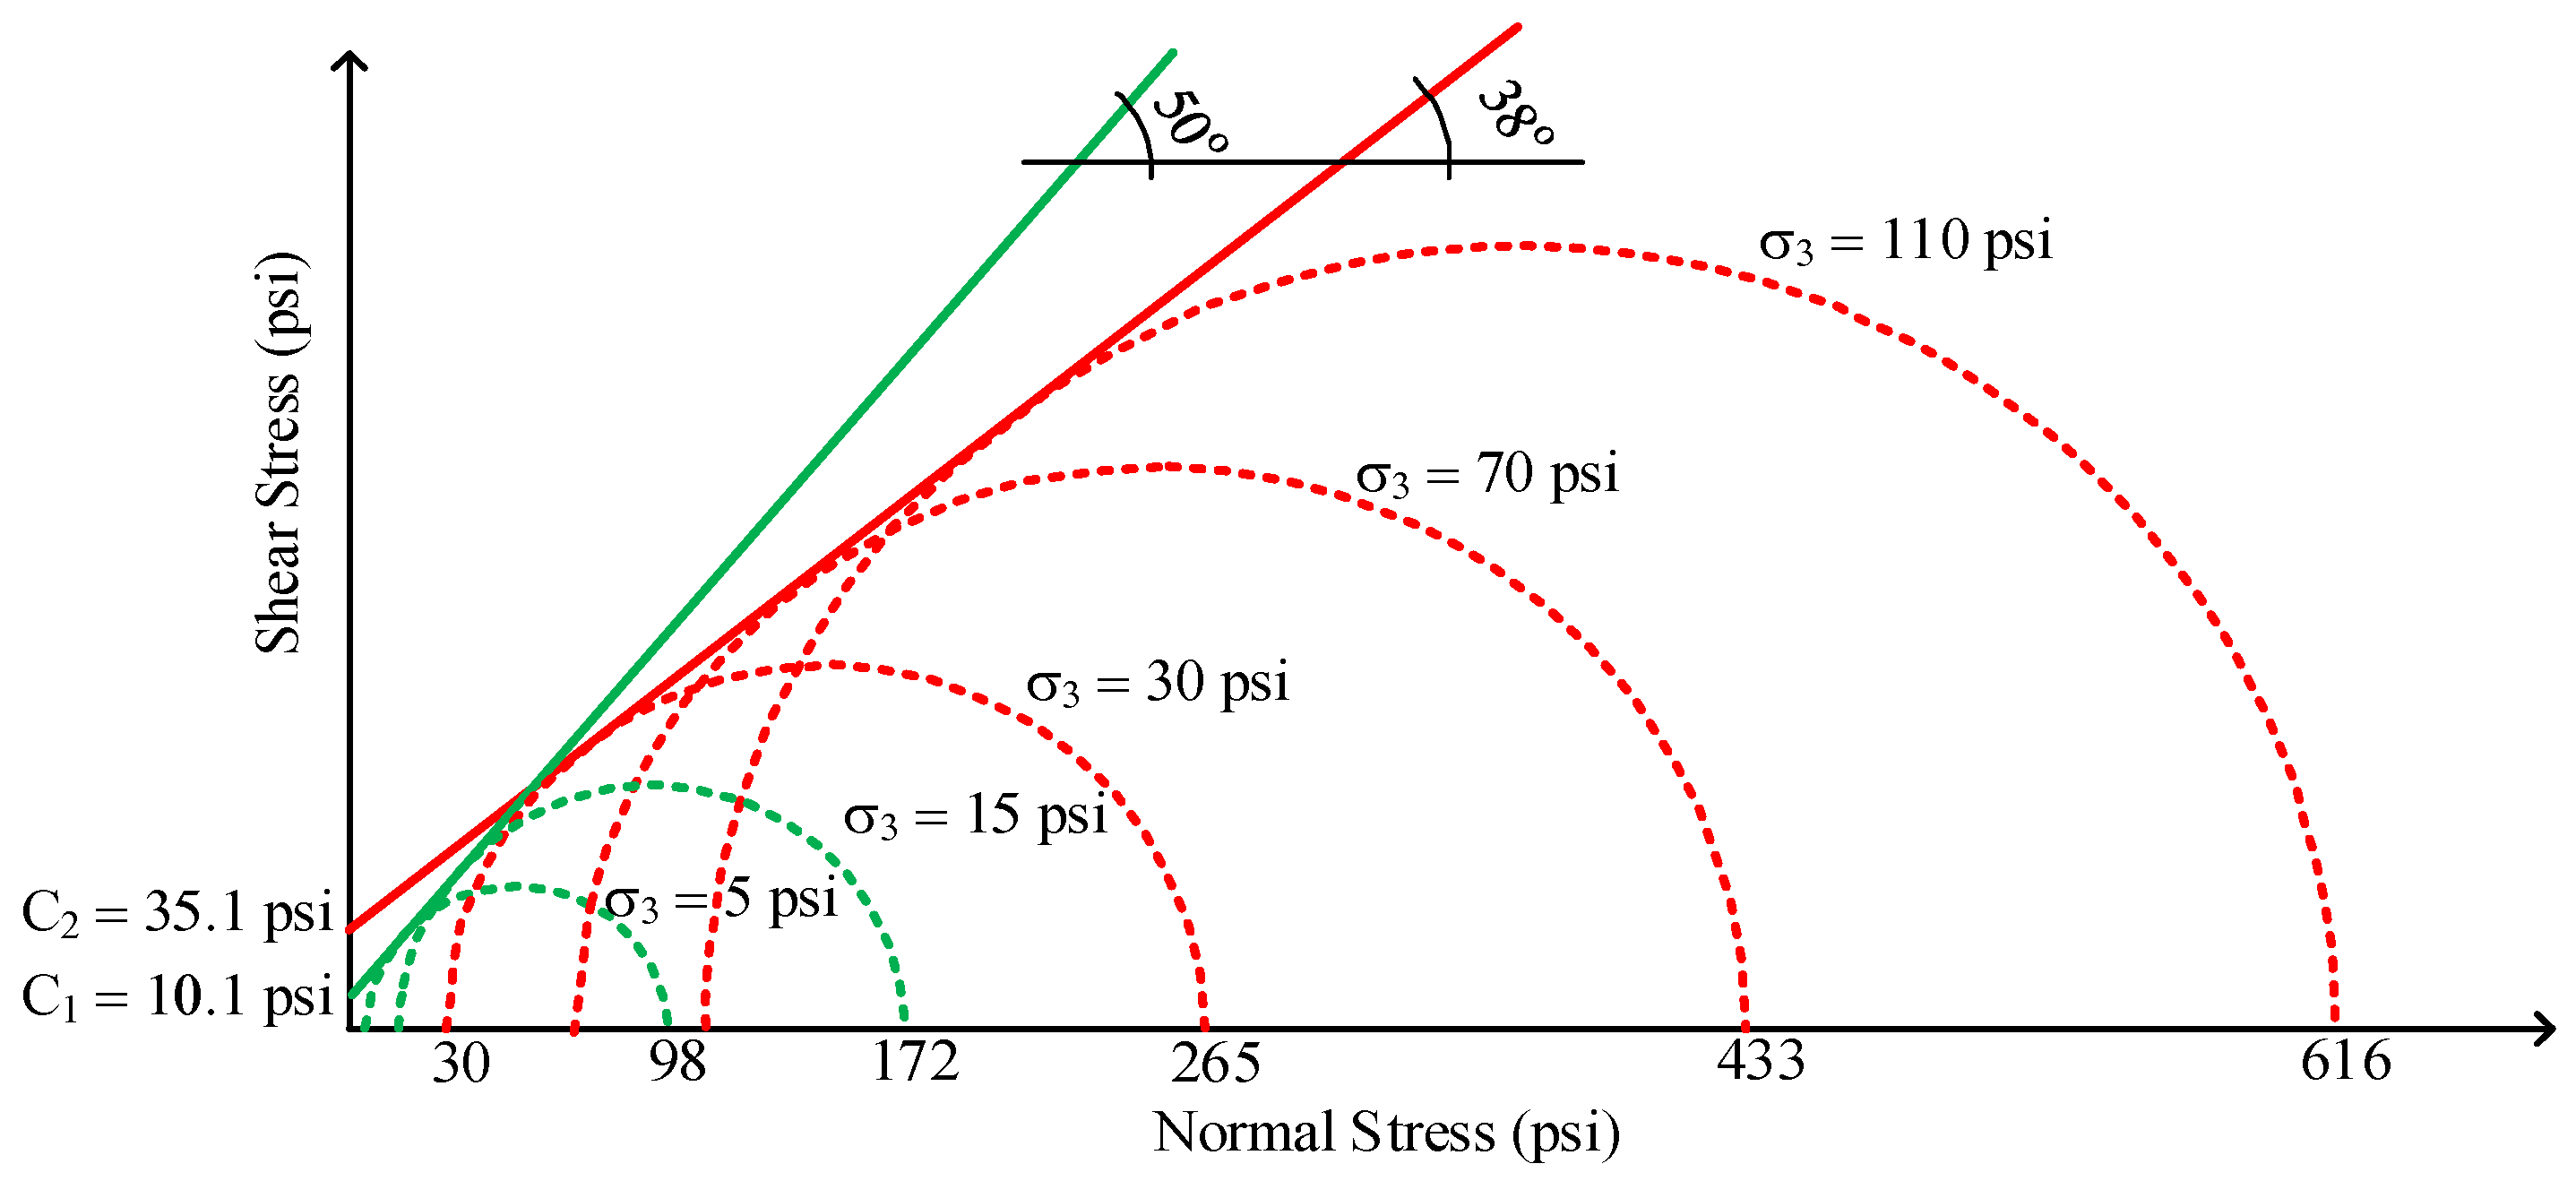
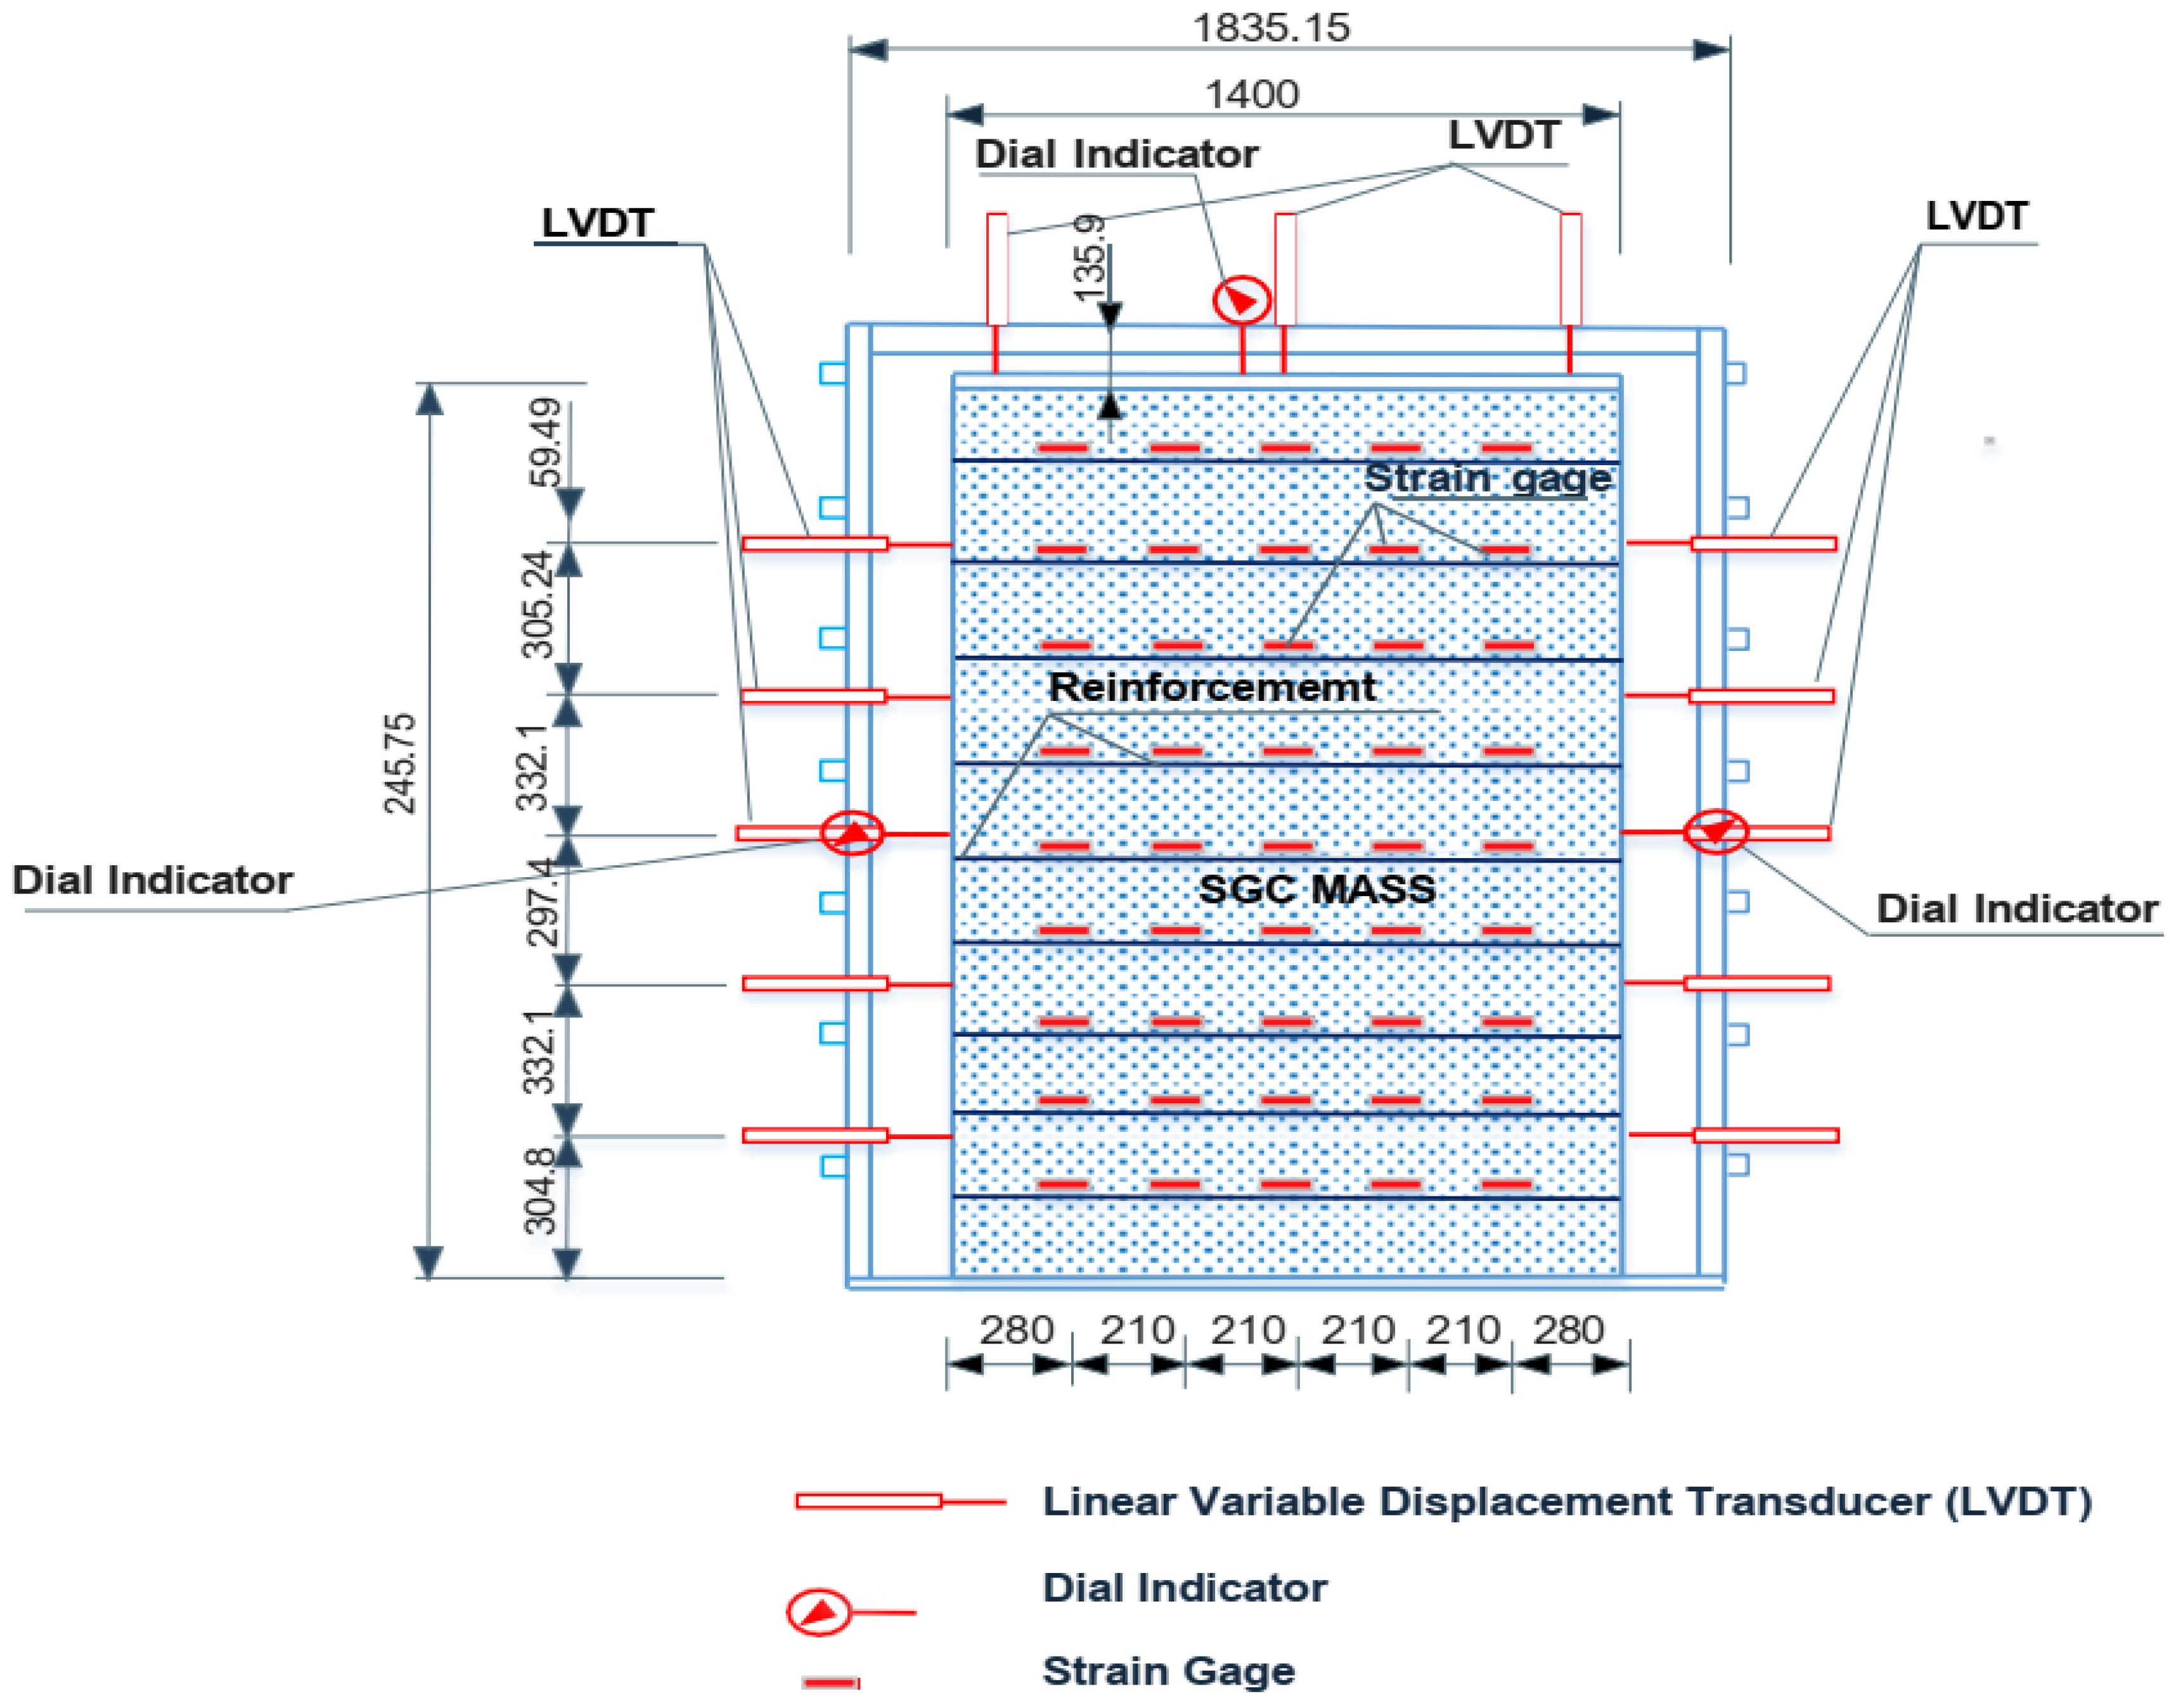
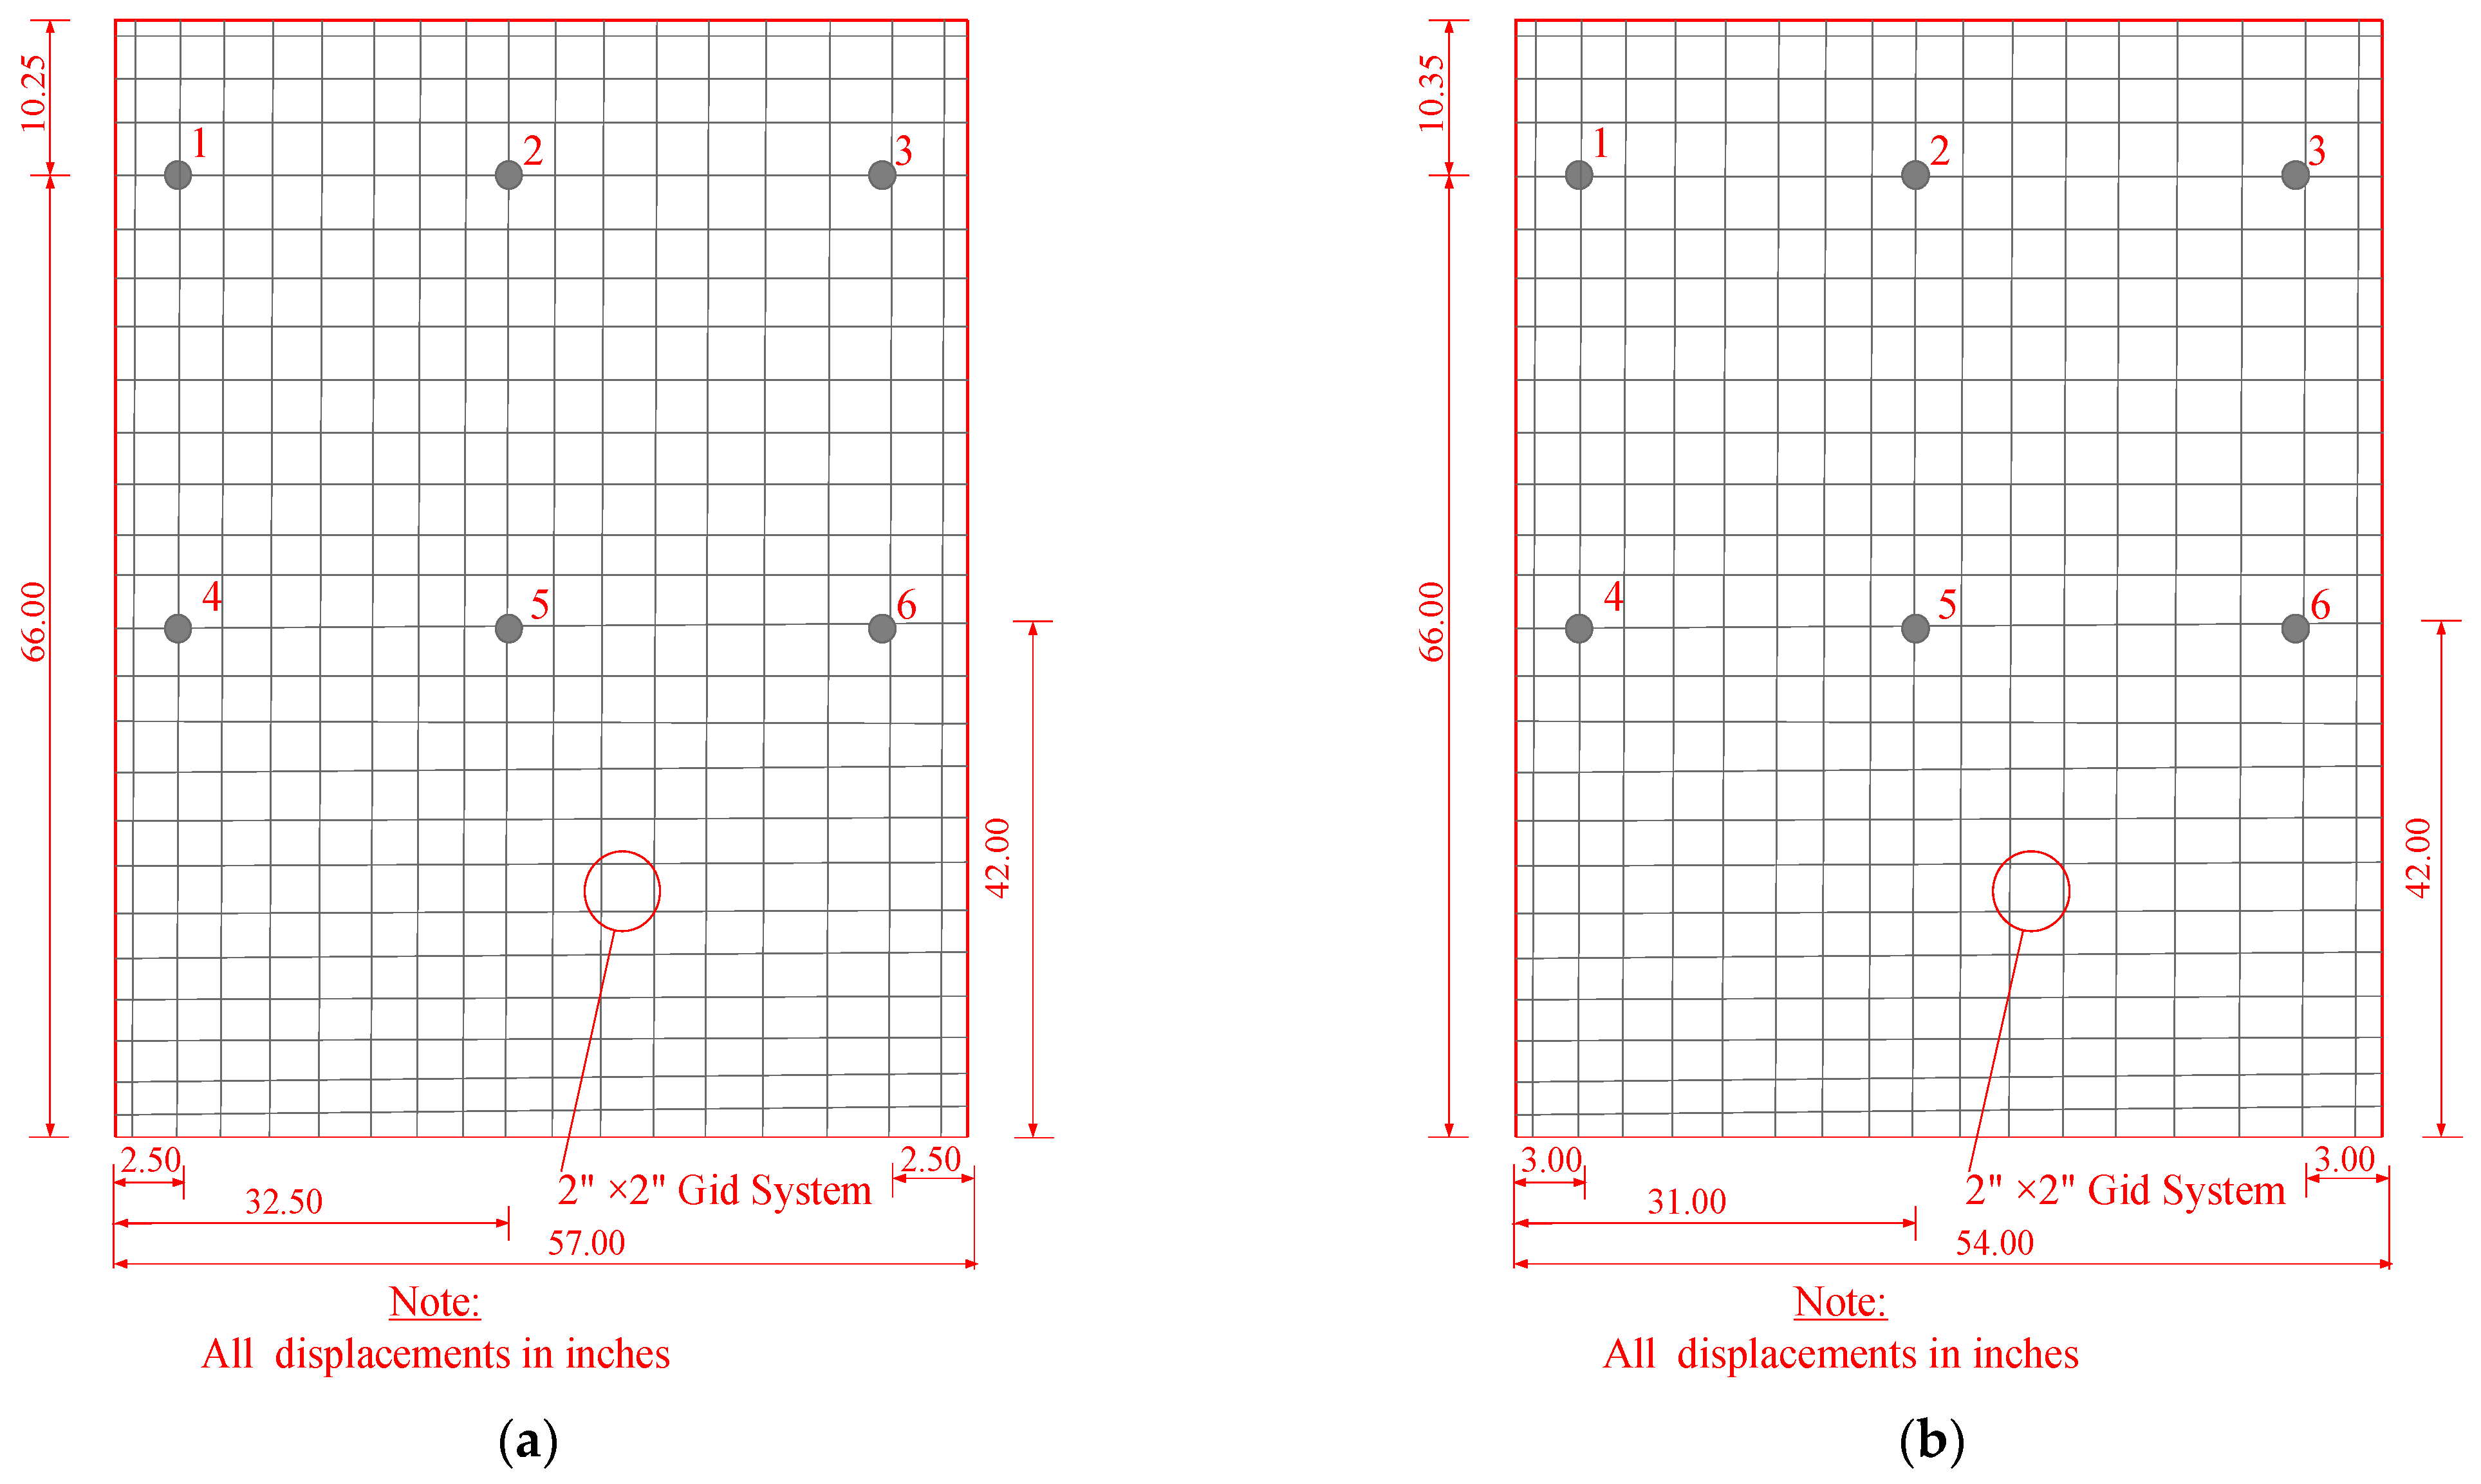
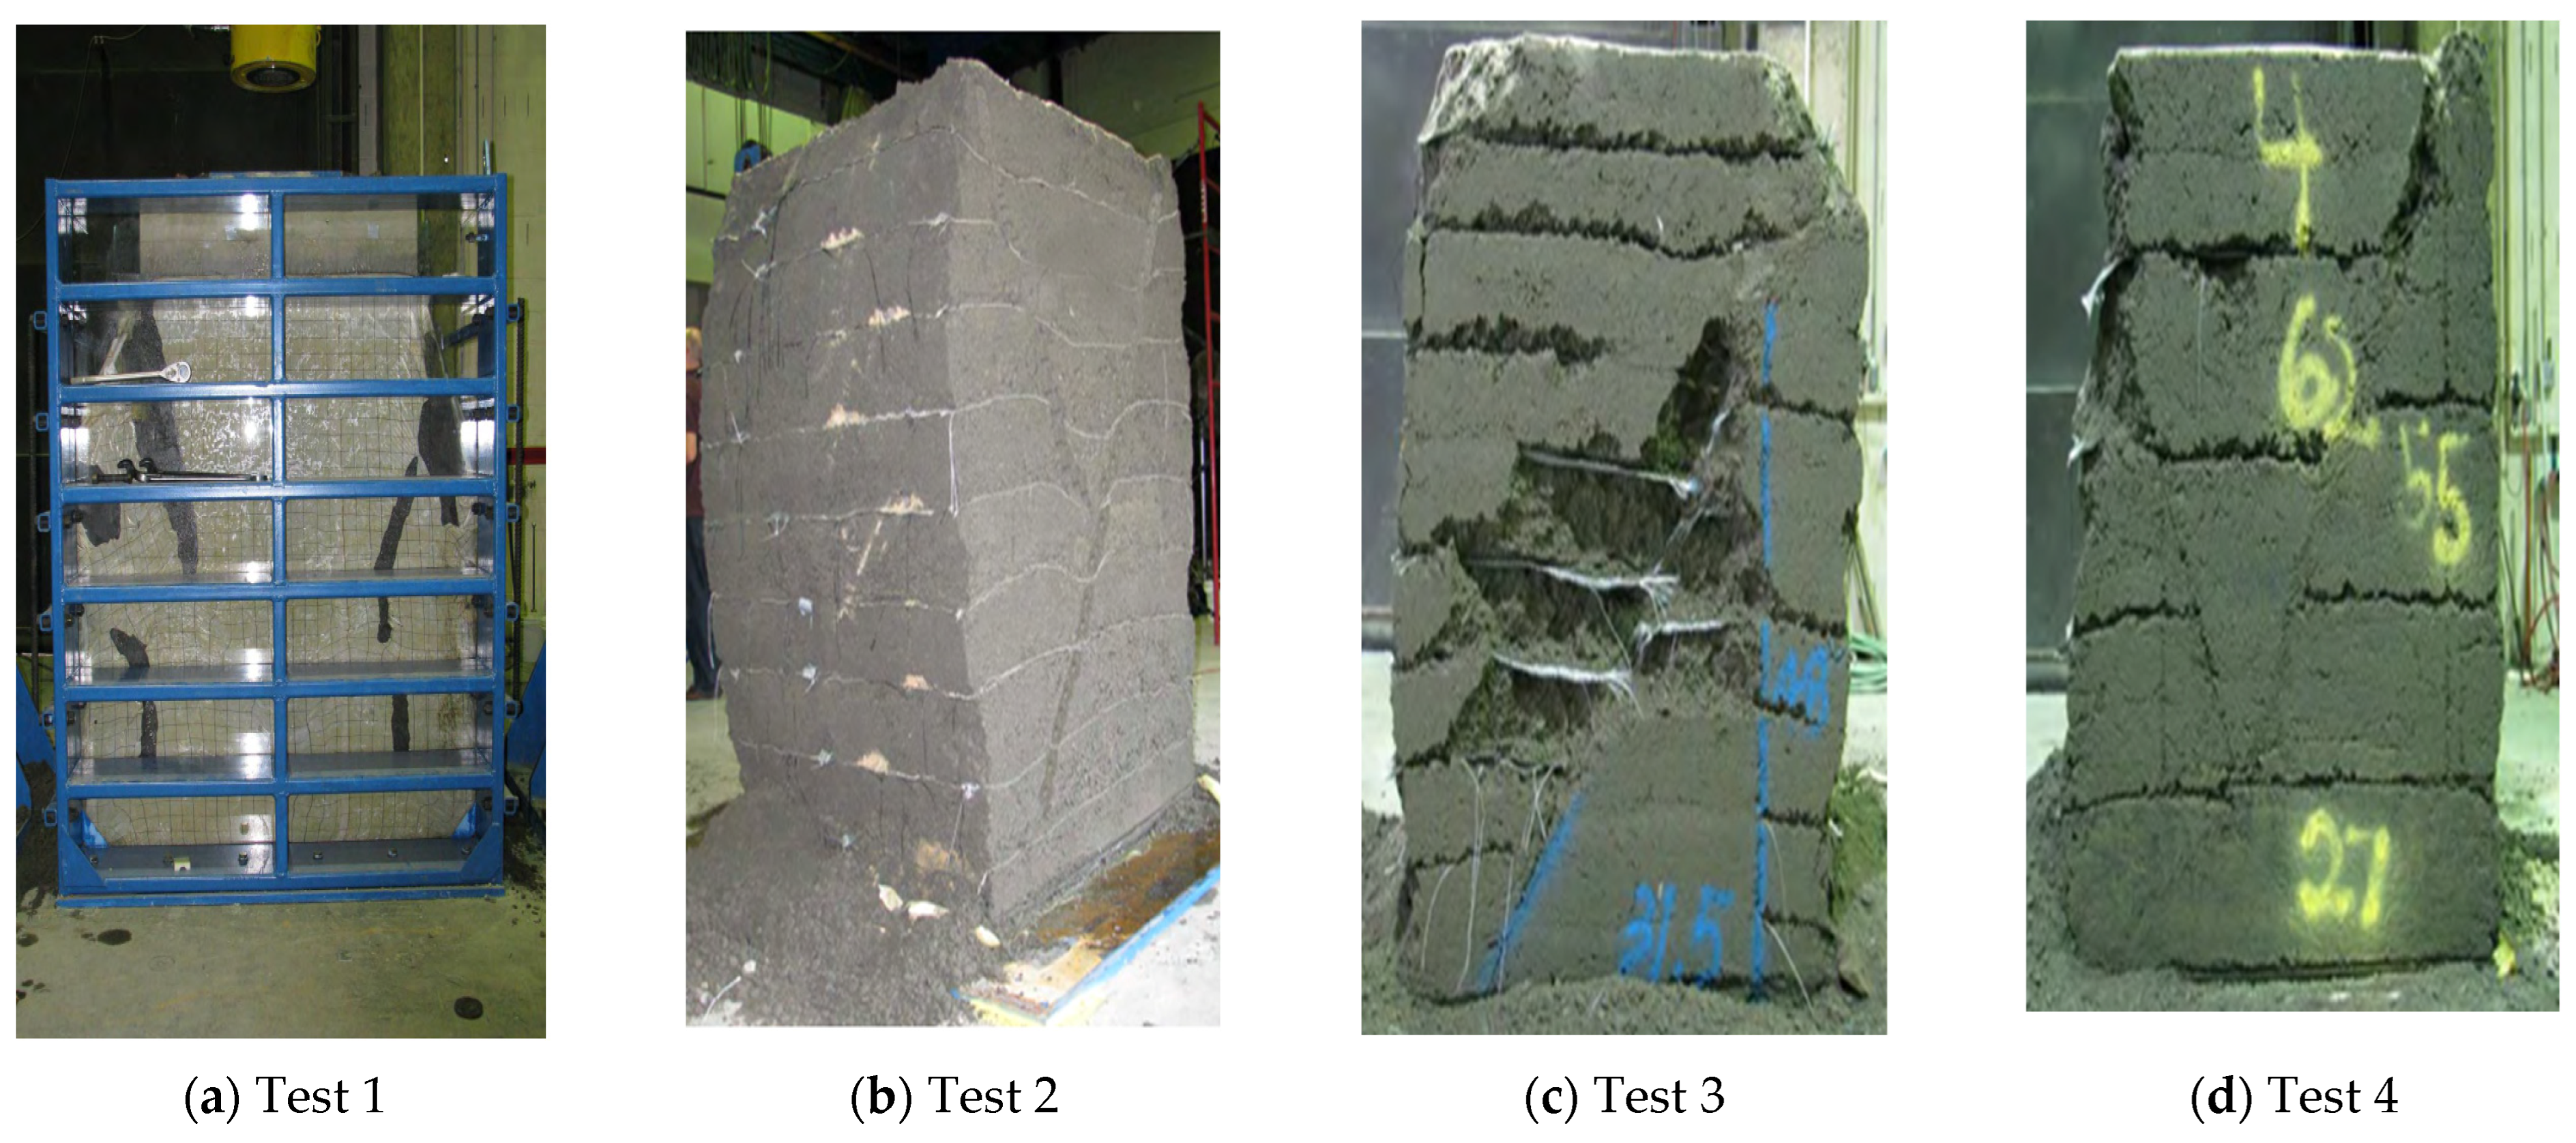
2. Full-Scale SGC Testing by Pham [3]

Four full-scale SGC tests were conducted to evaluate the system’s composite behavior under varying reinforcement and pressure conditions. Test 1 involved an unreinforced SGC specimen subjected to confining pressure. Meanwhile, Tests 2, 3, and 4 utilized reinforced specimens with geotextiles. Tests 2 and 3 employed nine sheets of single-layer reinforcement with a vertical spacing (Sv) of 0.2 m, tested under both confining and unconfined pressure conditions. In contrast, Test 4 used five sheets of single-layer reinforcement with a vertical spacing (Sv) of 0.4 m, tested solely under confining pressure (Figure 1).
Each SGC specimen measured 2 m in height and 1.4 m in width, with an L/H ratio of 0.7. The backfill material was crushed diabase (GW) with a maximum particle size of 33 mm, compacted to 98% of its maximum dry density. Key properties of the backfill included a specific gravity (Gs) of 3.0, 14.6% fines content, a maximum dry unit weight (γd) of 24 kN/m3, and an optimum water content (w) of 5.2%.
Large-scale triaxial tests were conducted on specimens with dimensions of 150 mm in diameter and 300 mm in height to evaluate the shear strength of the backfill material. The tests revealed a peak internal friction angle (ϕ′) of 50° and cohesion (c′) of 70 kPa (10.1 psi) under confining pressures ranging from 5 psi to 30 psi, which are typical for retaining wall applications (see Figure 2).
Polypropylene (PP) woven geotextiles were used as reinforcement in the SGC tests. These geotextiles exhibited ultimate tensile strengths (Tult) of 70 kN/m and 140 kN/m, maintaining a breakage strain of about 12%. Furthermore, the axial stiffness (EA) was recorded as 1000 kN/m for single-sheet configurations and 2000 kN/m for double-sheet configurations (refer to Figure 3).
Hollow concrete blocks (397 mm × 194 mm × 194 mm) were used as facings during preparation and removed before surcharge application. Specimens were sealed under vacuum using a 0.5 mm thick latex membrane, and a 34 kPa confining pressure was applied via vacuuming.
A hydraulic jack with a capacity of one million pounds applied vertical loads to a 30 cm thick concrete pad placed on top of the specimen. To monitor the performance of the SGC mass, LVDTs and digital dial indicators were installed on the concrete pad and along the specimen’s height to measure its vertical and lateral movements, respectively. Additionally, high-elongation strain gauges were used to assess strain within the geotextile reinforcement (refer to Figure 4). Internal soil movements at specific points under failure load were recorded by marking preselected locations on a 2-inch by 2-inch grid system drawn on the membrane (see Figure 5).
The vertical load was applied gradually until failure; for Test 1, the SGC mass without reinforcement, the vertical failure stress and strain were measured to be approximately 770 kPa and 3%, respectively. For Test 2, the SGC mass was reinforced by nine sheets of single-layer Geotex 4 × 4 with a spacing of 0.2 m and the vertical failure stress and strain were measured to be approximately 2700 kPa and 6.75%, respectively. For SGC Test 3, which was similarly reinforced by nine single sheets of Geotex 4 × 4 at 0.2 m spacing, vertical failure stress and strain were approximately 1900 kPa and 6%, respectively. Finally, vertical failure stress and strain were approximately 1300 kPa and 4.0%, respectively, for SGC Test 4 where the mass was reinforced by five single sheets of Geotex 4x4 at the spacing of 0.4 m.

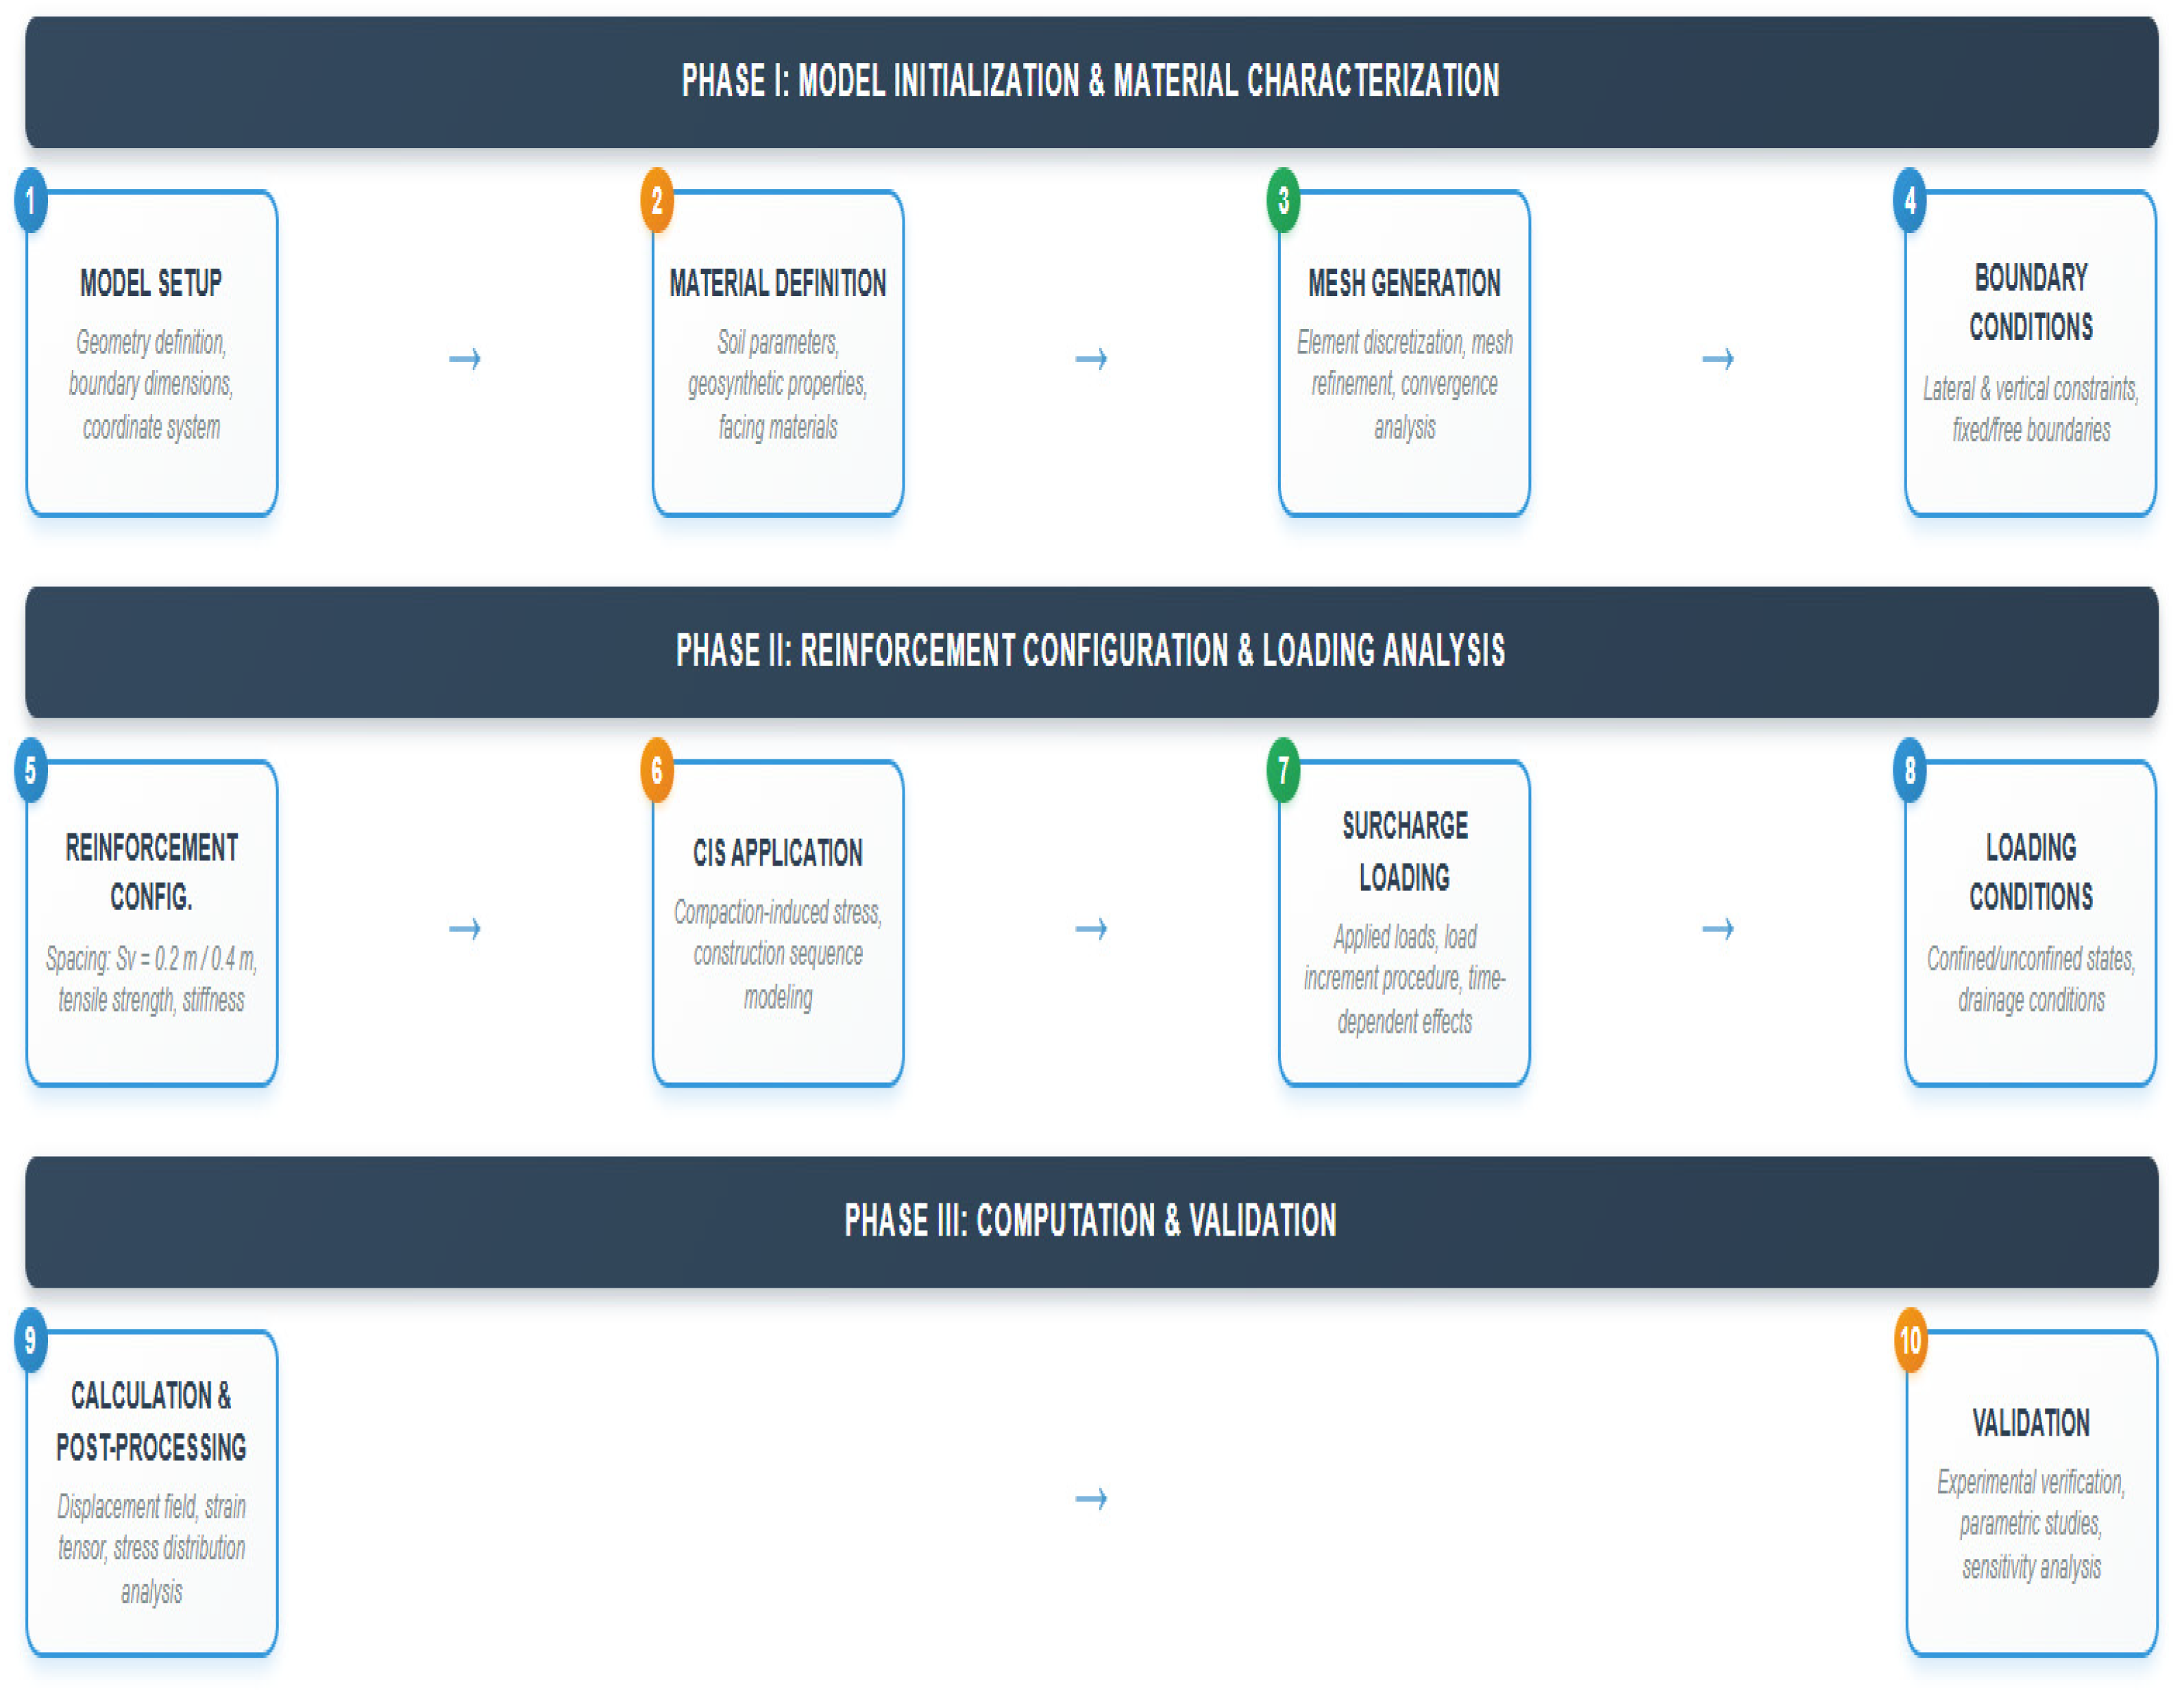
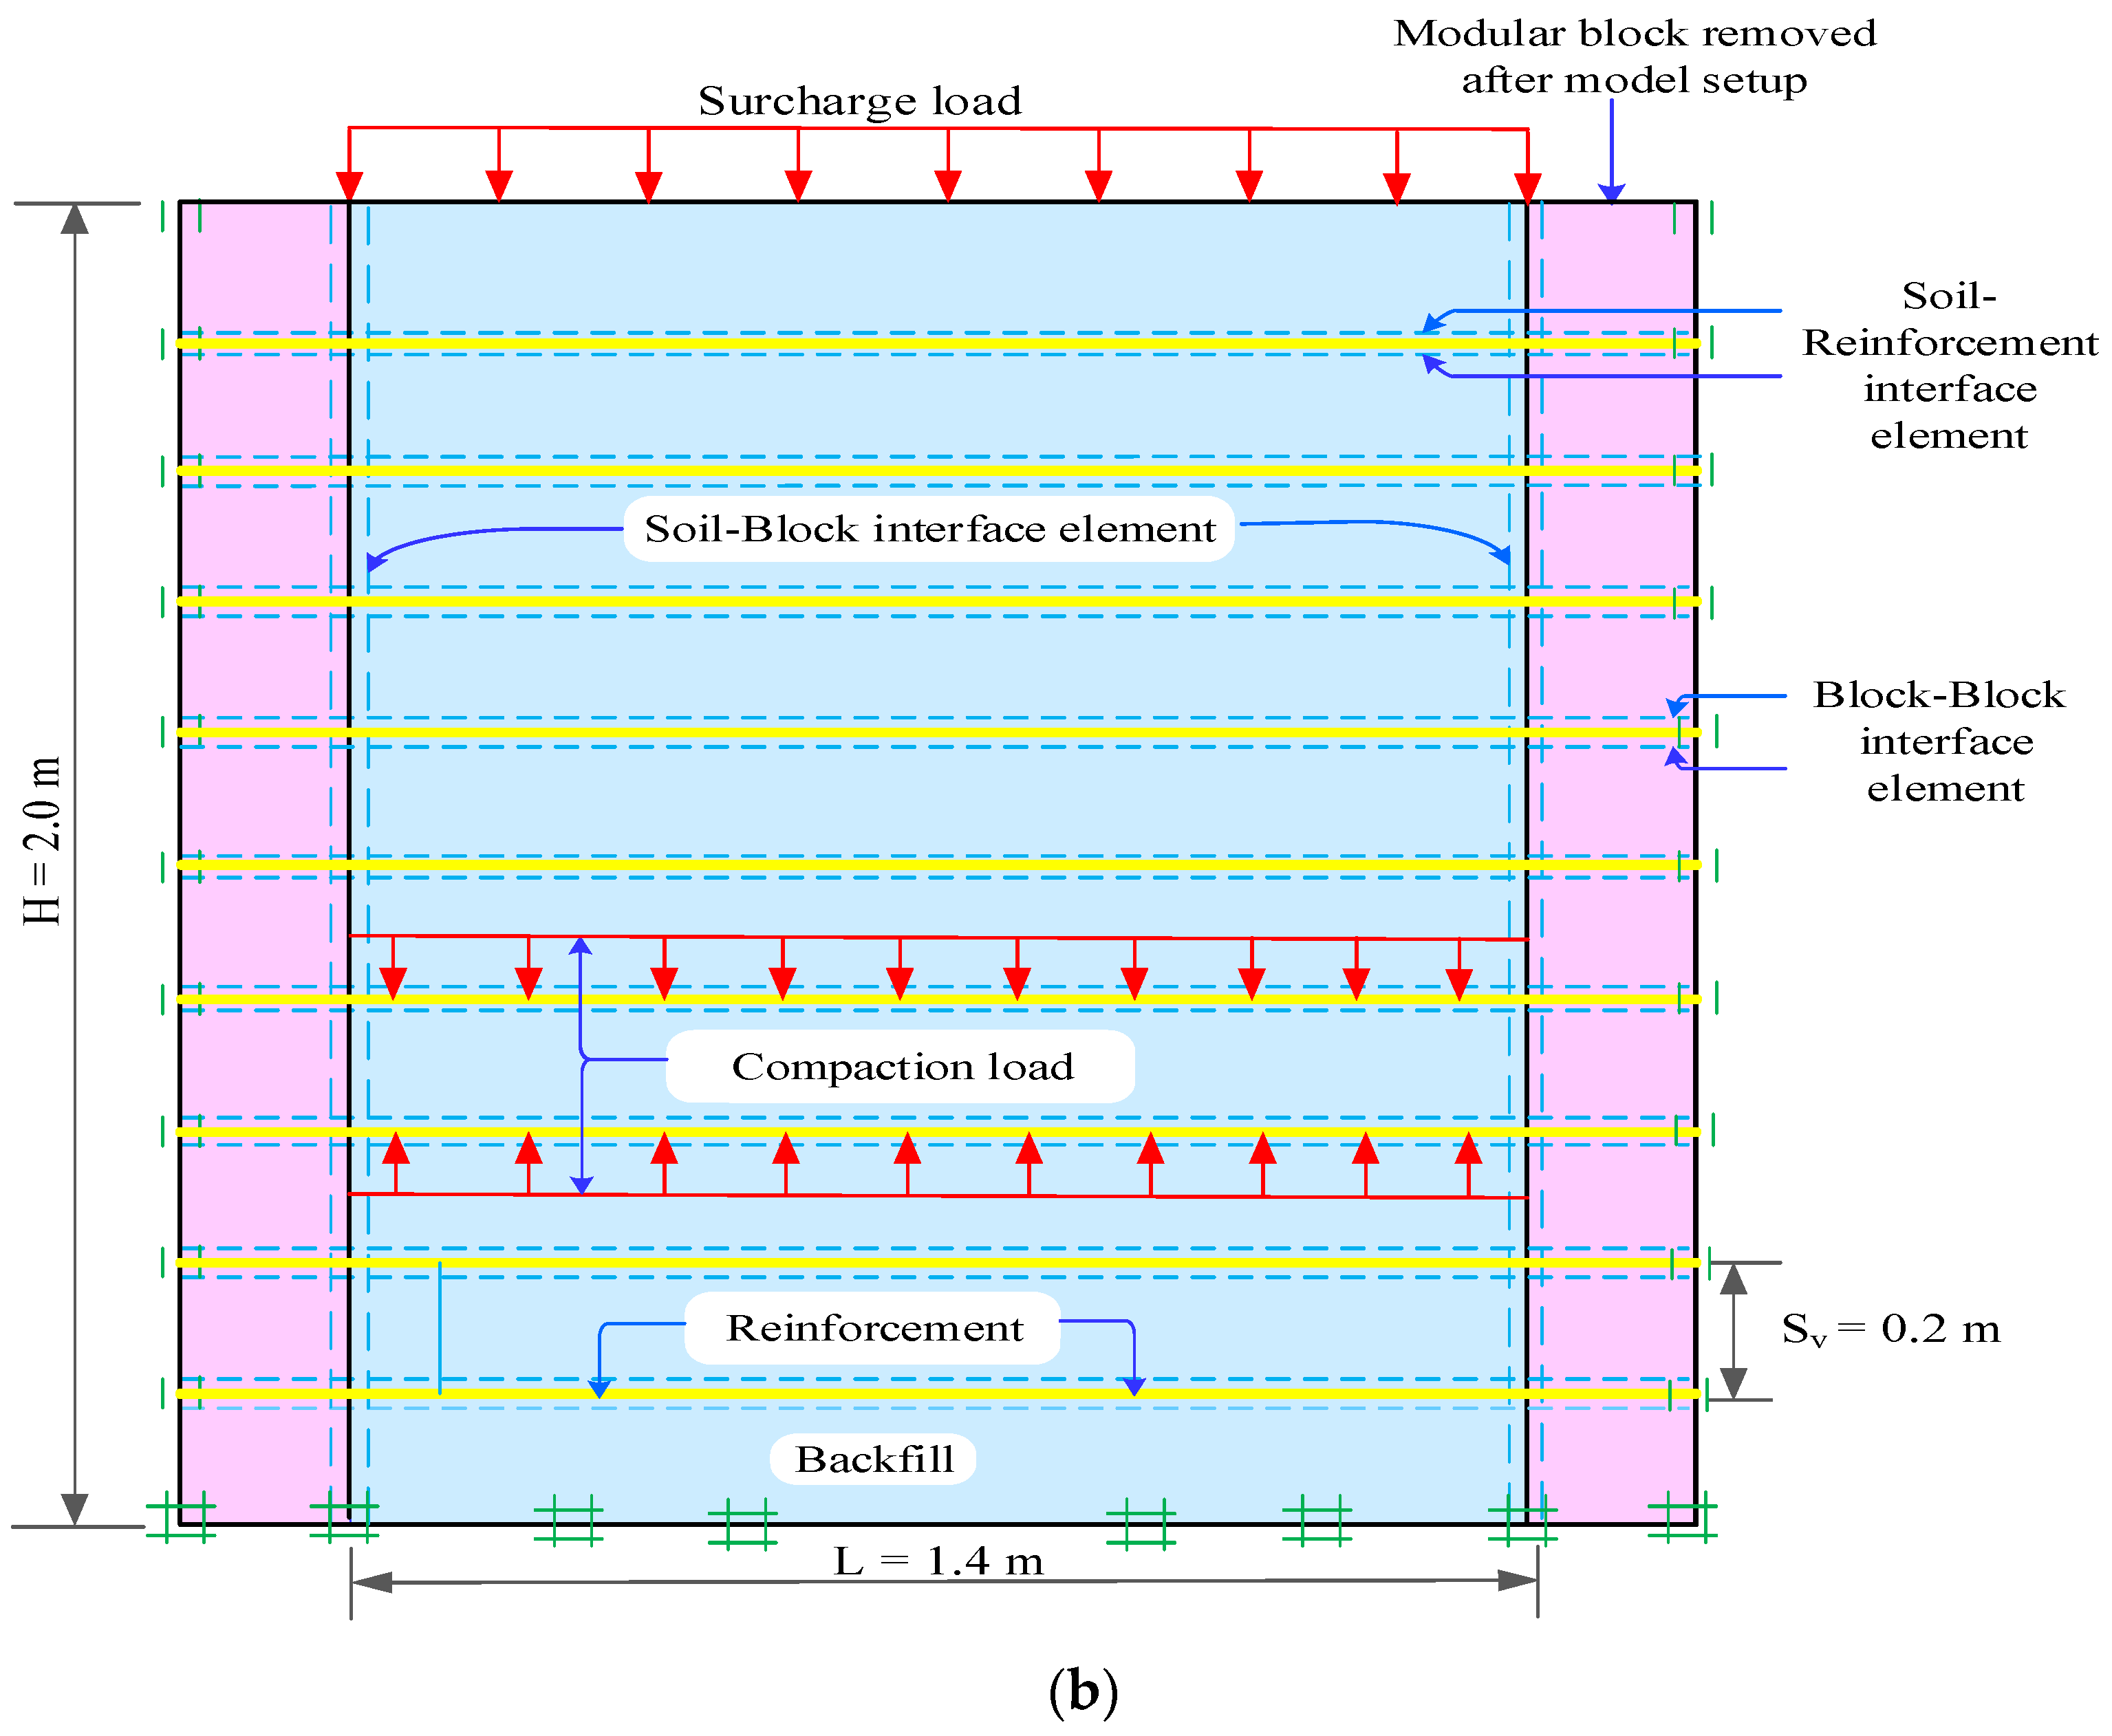
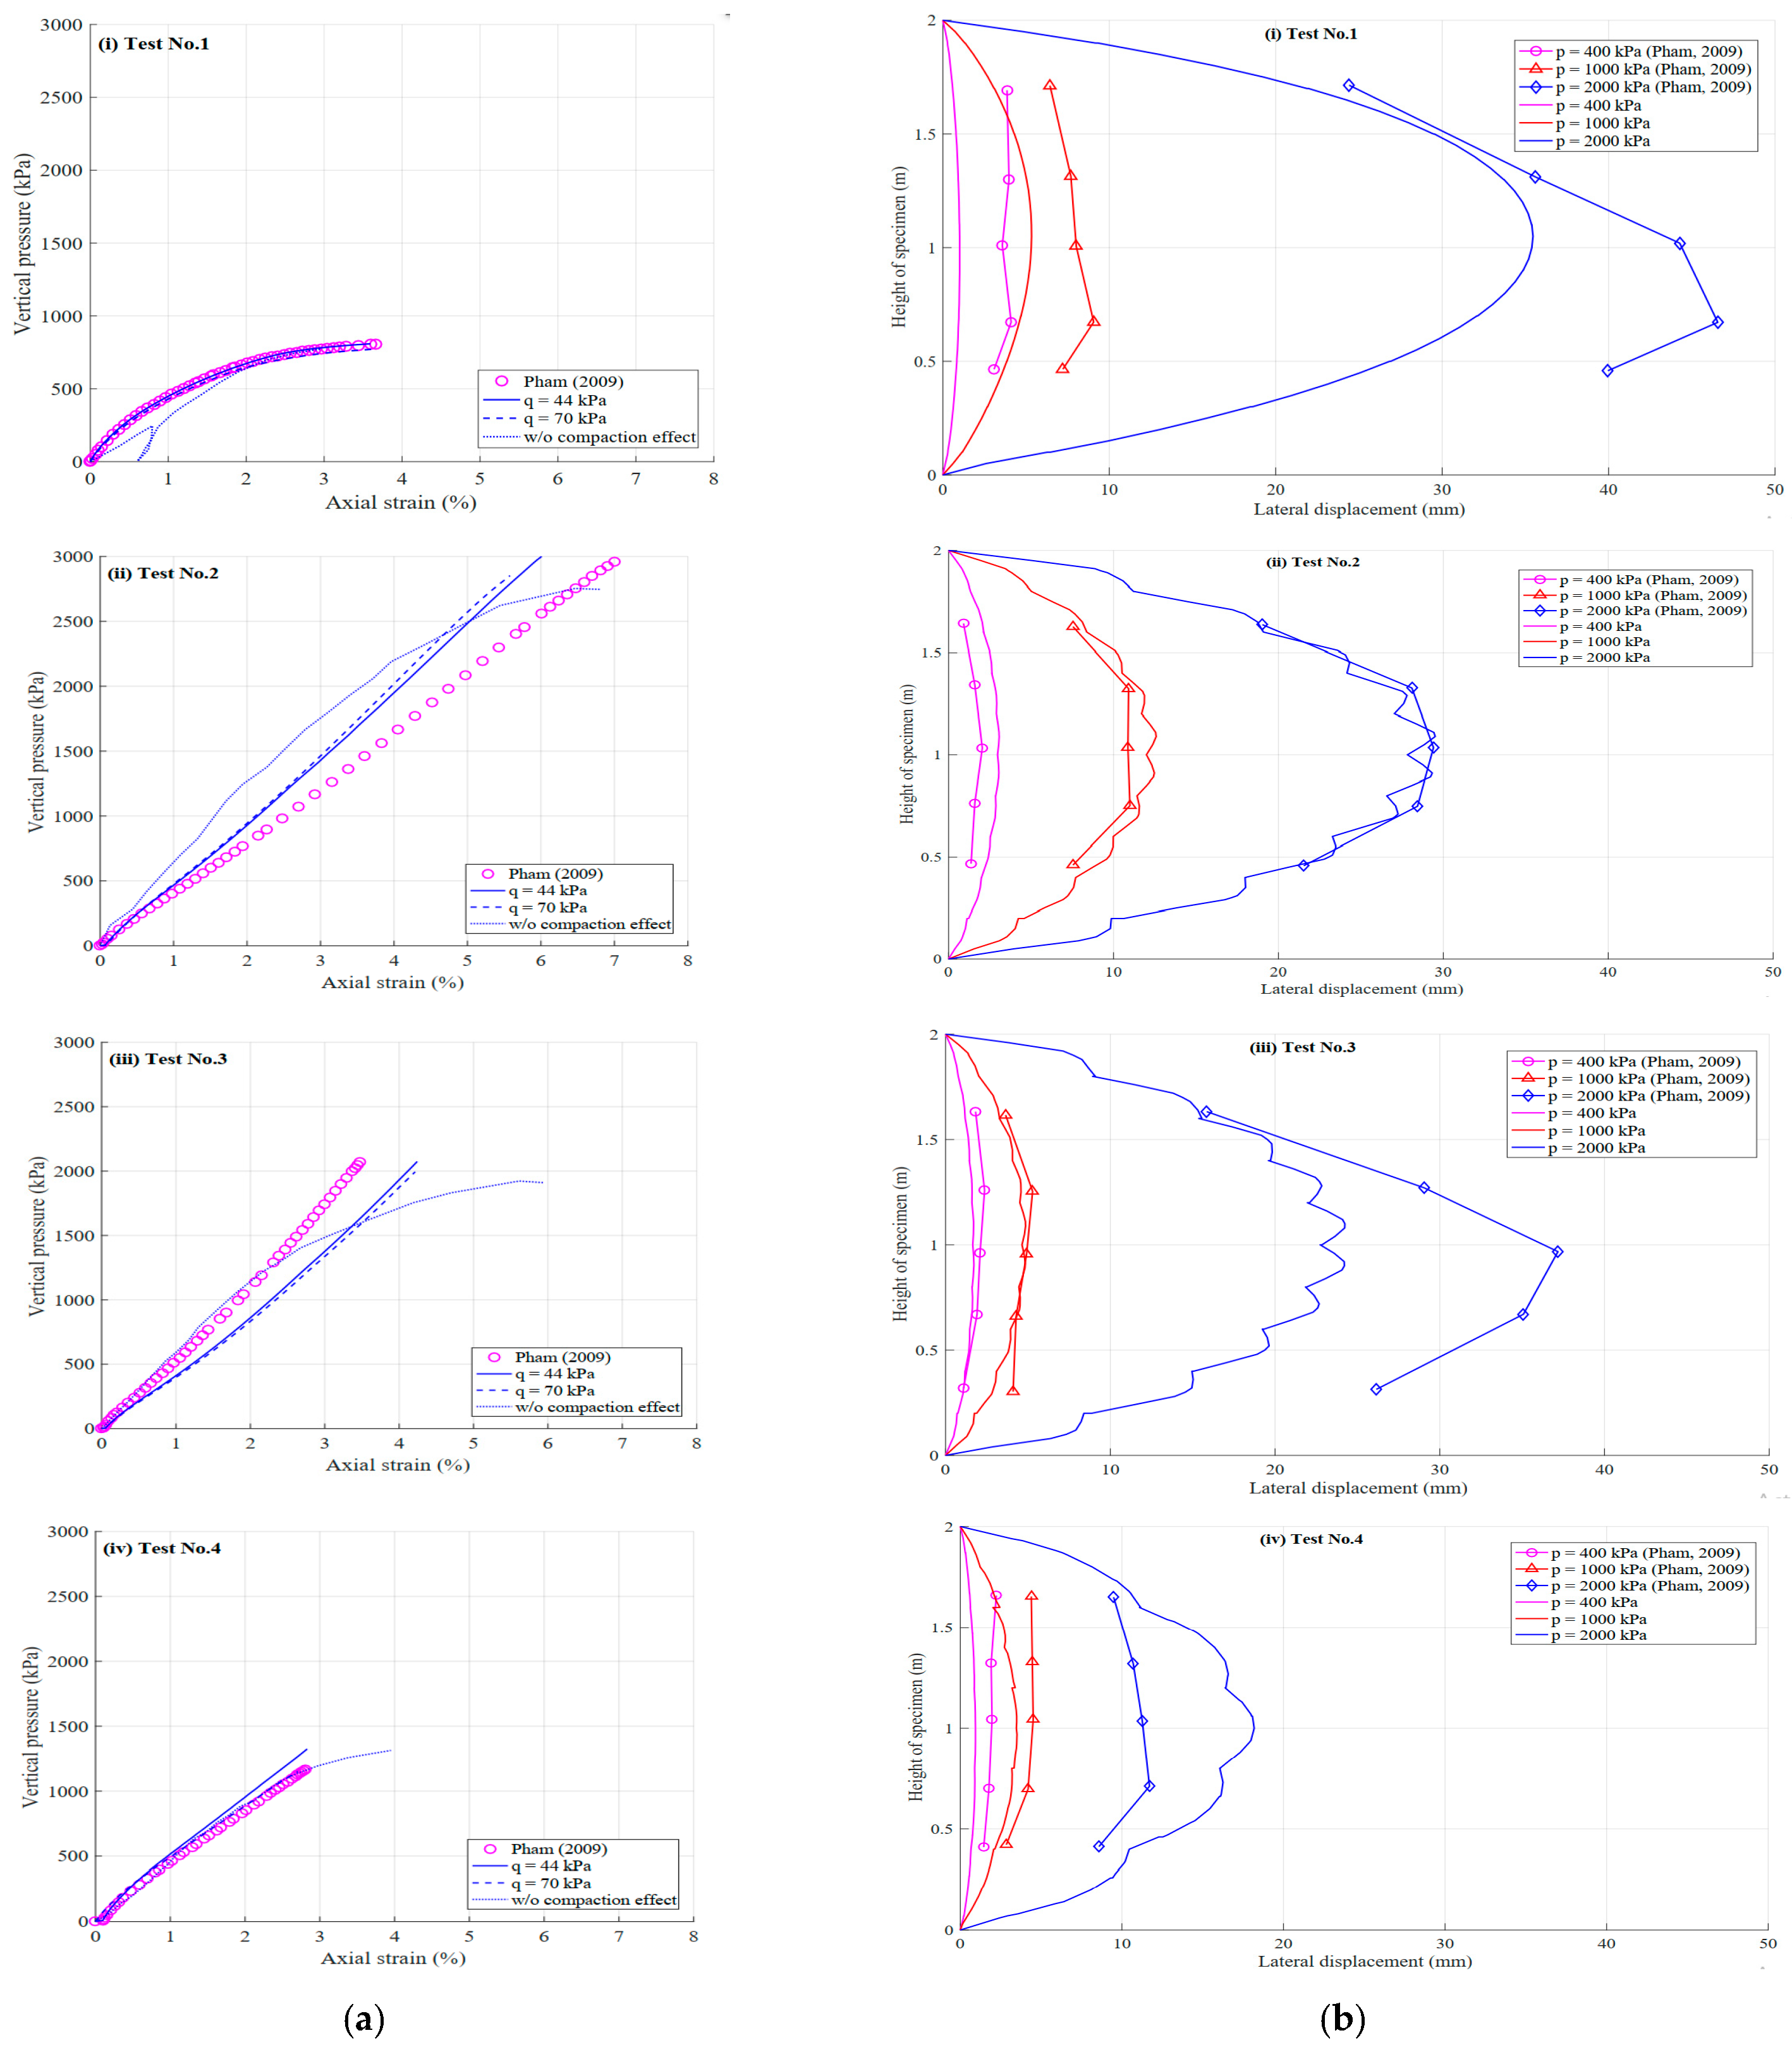
3. Numerical Model and Verification

The numerical model in this study was developed using Plaxis 2D, incorporating several simplifying assumptions, including the plane strain condition, idealized boundary conditions, and an elastic–perfectly plastic soil model. The interaction between the soil and geosynthetic reinforcements was simulated using a linear Coulomb contact model, with parameters calibrated from previous experimental data. These assumptions may affect the accuracy of predicted stress and deformation responses. Therefore, the model is best suited for cases with linear geometry, stable loading conditions, and relatively homogeneous subsoil profiles.
Figure 6 illustrates the structured finite element modeling (FEM) framework employed in this study to simulate the behavior of geosynthetic-reinforced soil (GRS) structures. The modeling process was systematically divided into three main phases: (i) model initialization and material characterization, (ii) reinforcement configuration and loading analysis, and (iii) computation and validation. Each step—from mesh generation and boundary condition assignment to the application of compaction-induced stress and model verification—was implemented to ensure numerical consistency, physical realism, and computational accuracy.
The numerical geometry, boundary conditions, and interface elements (Figure 7a,b) utilized material properties consistent with the experimental models. The numerical model used 15-noded triangular elements for soil and blocks, 5-noded geogrid elements for geotextiles, and zero-thickness Mohr–Coulomb elements for interfaces. The stress–strain behavior of the backfill was modeled using a second-order hyperbolic elasto–plastic hardening soil model, which captured the non-linear stress–strain behavior typically seen in granular soils under loading and unloading. The interface between the soil and the geotextiles was represented by the parameters ϕi, ci, ψi, Gi, Eoed,i, νi = 0.45, and Ri = 0.8, as referenced in Gui et al. [10]. Axial forces were calculated at Newton–Cotes stress points [37,38].
The FEM simulation was conducted in two sequential stages: the initial filling and compaction phase, followed by the application of a surcharge load on the SGC mass. The wall construction process was carried out incrementally, with soil lifts measuring 0.2 m in thickness being sequentially placed and compacted until a total height of 2 m was achieved. To replicate the staged construction process with precision, the compaction of each soil lift was modeled through the application of an equivalent load, uniformly distributed across both the top and bottom surfaces of the soil (see Figure 7).
Two compaction pressures, 44 kPa and 70 kPa, were used for model verification. The 70 kPa pressure represented light compaction equipment limits, while the 44 kPa pressure simulated conditions from the MB GP1200 plate compactor used in Pham’s SGC tests [3].
To capture the interaction behavior between structural components, the model incorporated a variety of interface elements, as illustrated in Figure 7. Soil–block interface elements were defined as the contact between the backfill and modular facing units; block–block interface elements were placed between adjacent facing blocks to allow the frictional resistance and load transfer between the reinforcement layers and the surrounding soil. Figure 7 highlights the placement and function of these interface elements within the model, providing a clear representation of how each interaction zone contributed to the composite mechanical response of the reinforced wall system during both construction and loading phases.
A uniformly distributed surcharge load was applied to the top of the model to simulate operational loading conditions. Reinforcement layers were installed at regular vertical spacings (denoted as Sv). After the model setup was completed, the outermost modular blocks were removed from the simulation to reflect the actual experimental configuration shown in Figure 7, in which these blocks were not retained in the final working structure.
Table 1 summarizes the material properties and parameters used in the finite element (FE) analyses, including soil properties, block properties, and interface characteristics for the four test cases.
The global stress–strain relationships, lateral displacement at the open facing, and failure patterns from FE analyses compared with measured data by Pham [3] are shown in Figure 8a,b. The simulation results agreed well with experimental data, especially up to 770 kPa (Test 1), 2700 kPa (Test 2), 1900 kPa (Test 3), and 1300 kPa (Test 4).
Including CIS improved the accuracy of stress–strain simulations and increased the strength of the SGC mass by about 5%. Therefore, CIS should be included in analyses under both confining and unconfined conditions.
Compaction pressures of 44 kPa and 70 kPa had negligible impacts on stress–deformation behavior. Hence, a 44 kPa compaction pressure was uniformly applied to simulate the compaction process (Figure 8a).
Figure 9 shows that the crossing shear plane obtained by numerical simulation was in good agreement with the observation failure pattern of a single failure surface or bi-planar (X or Y shape) failure surface from large-scale loading tests on an SGC mass by Pham [3].

4. Results and Discussion

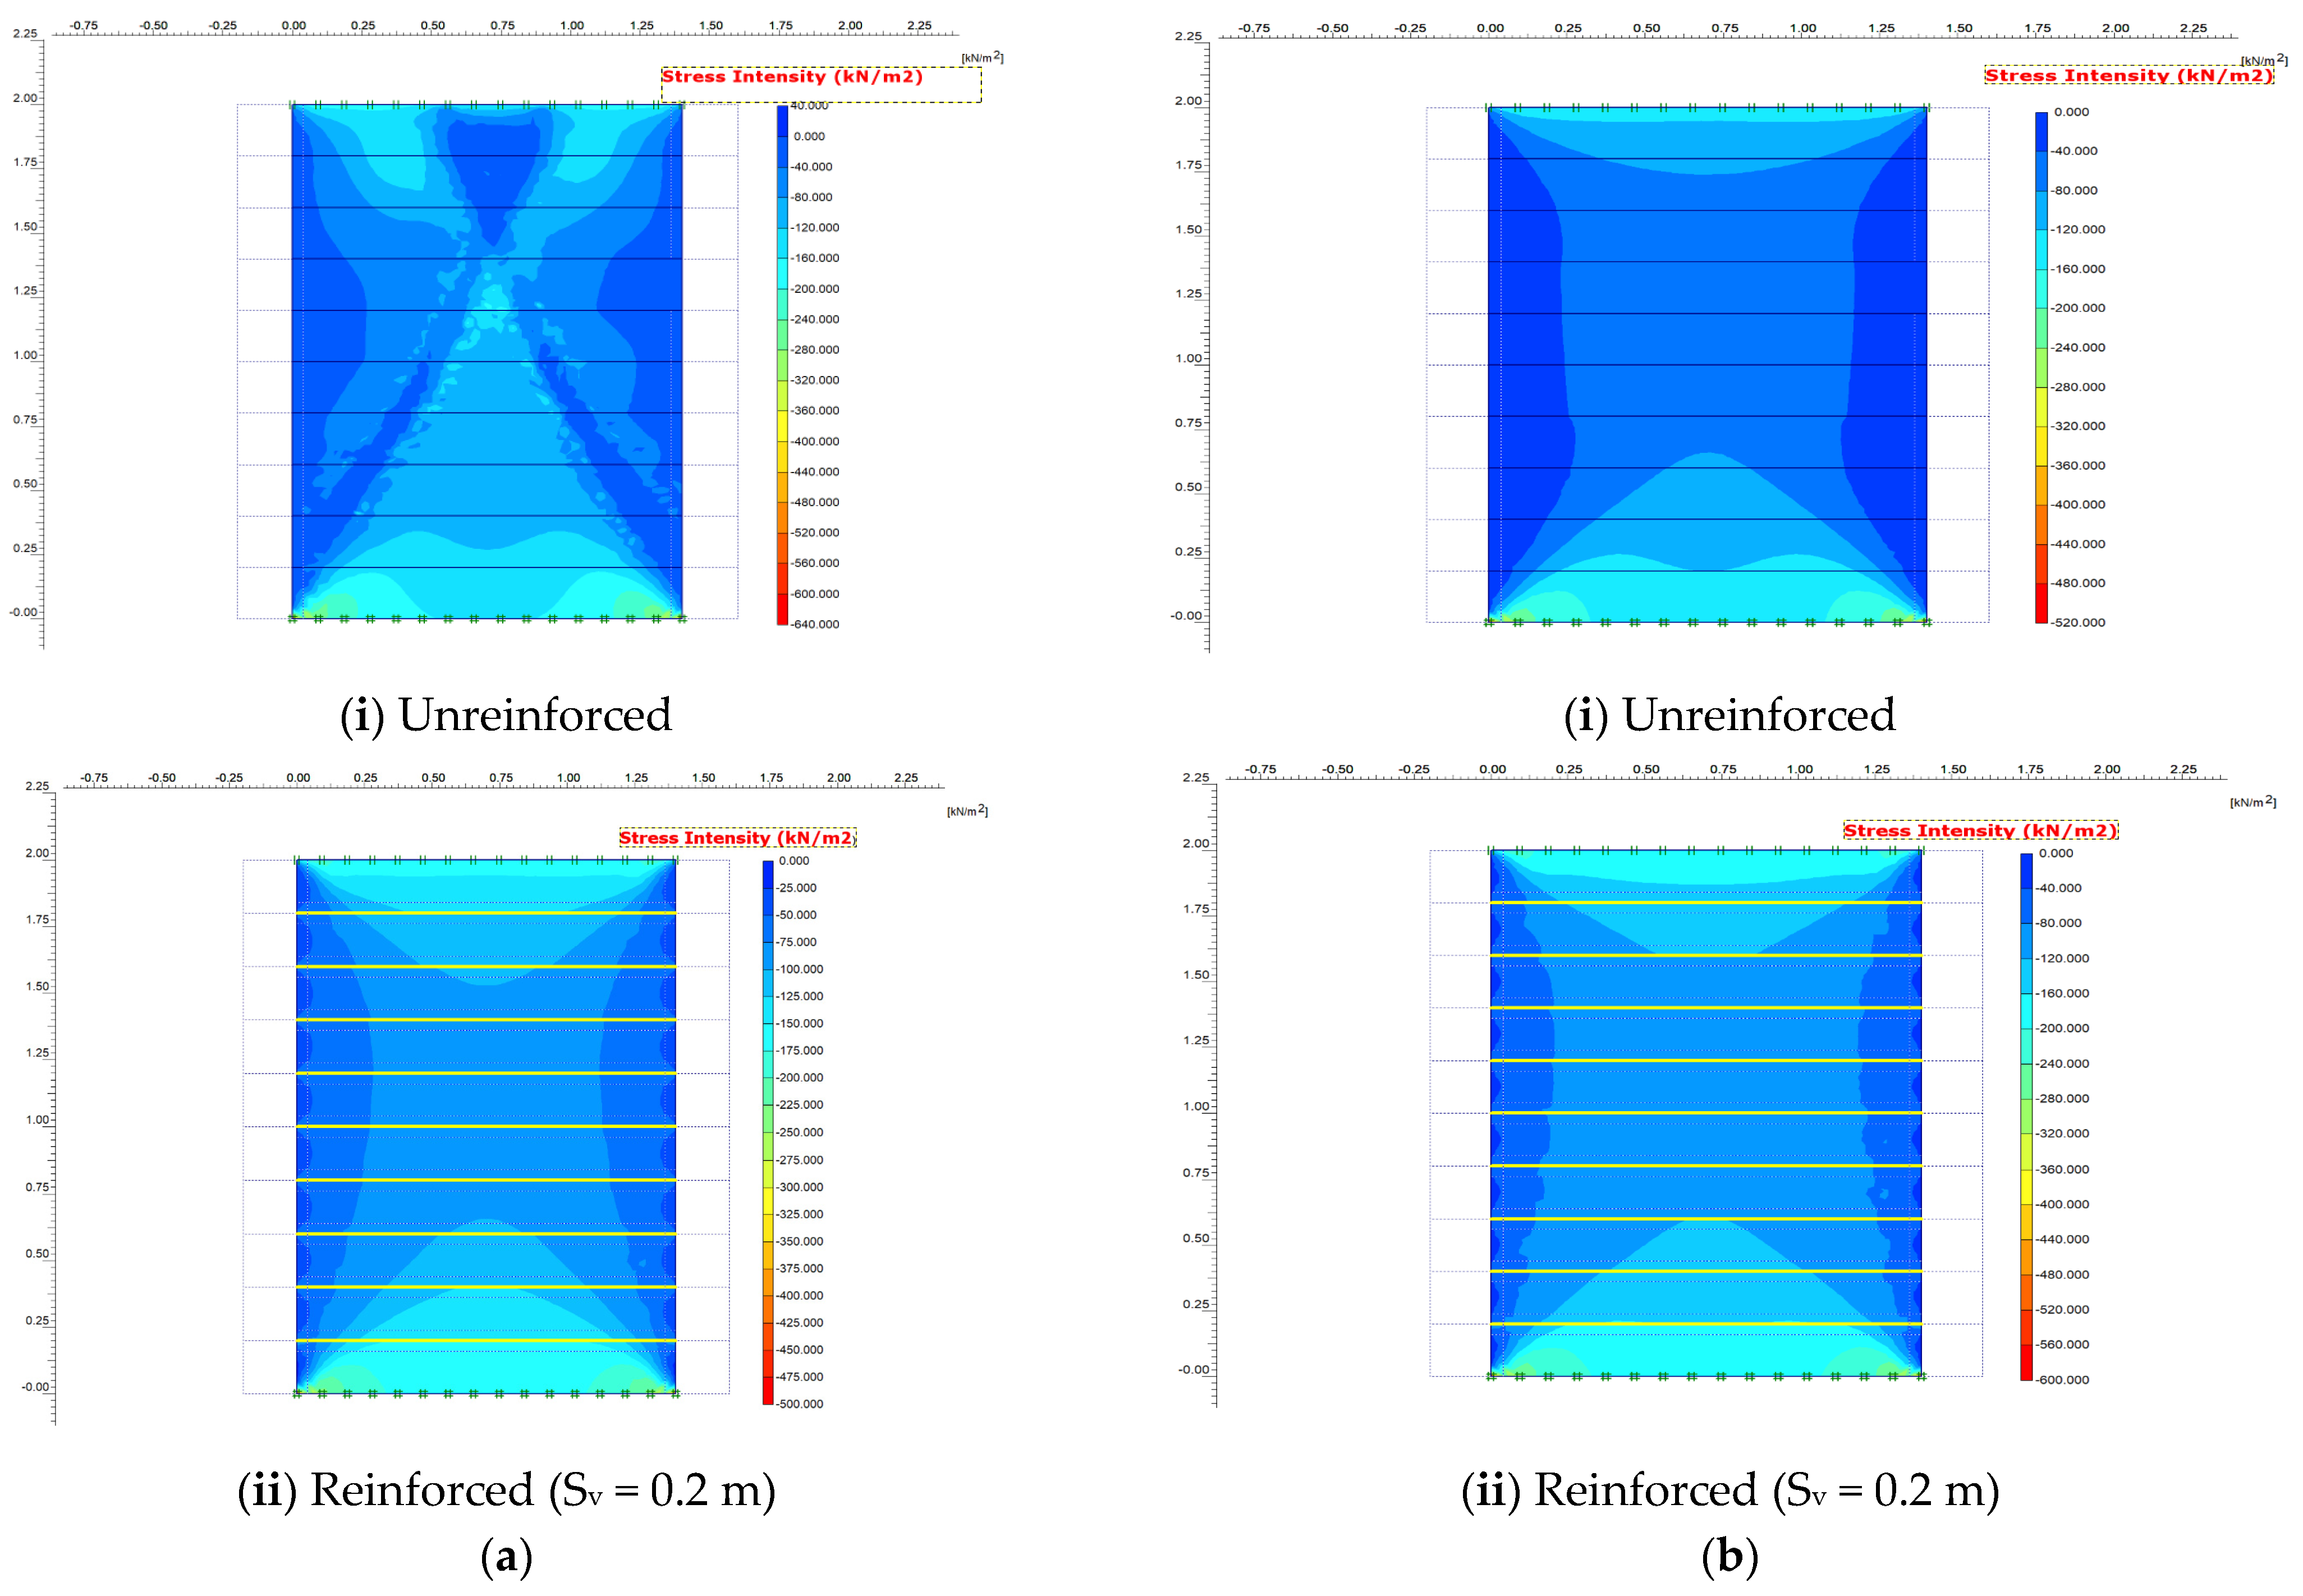
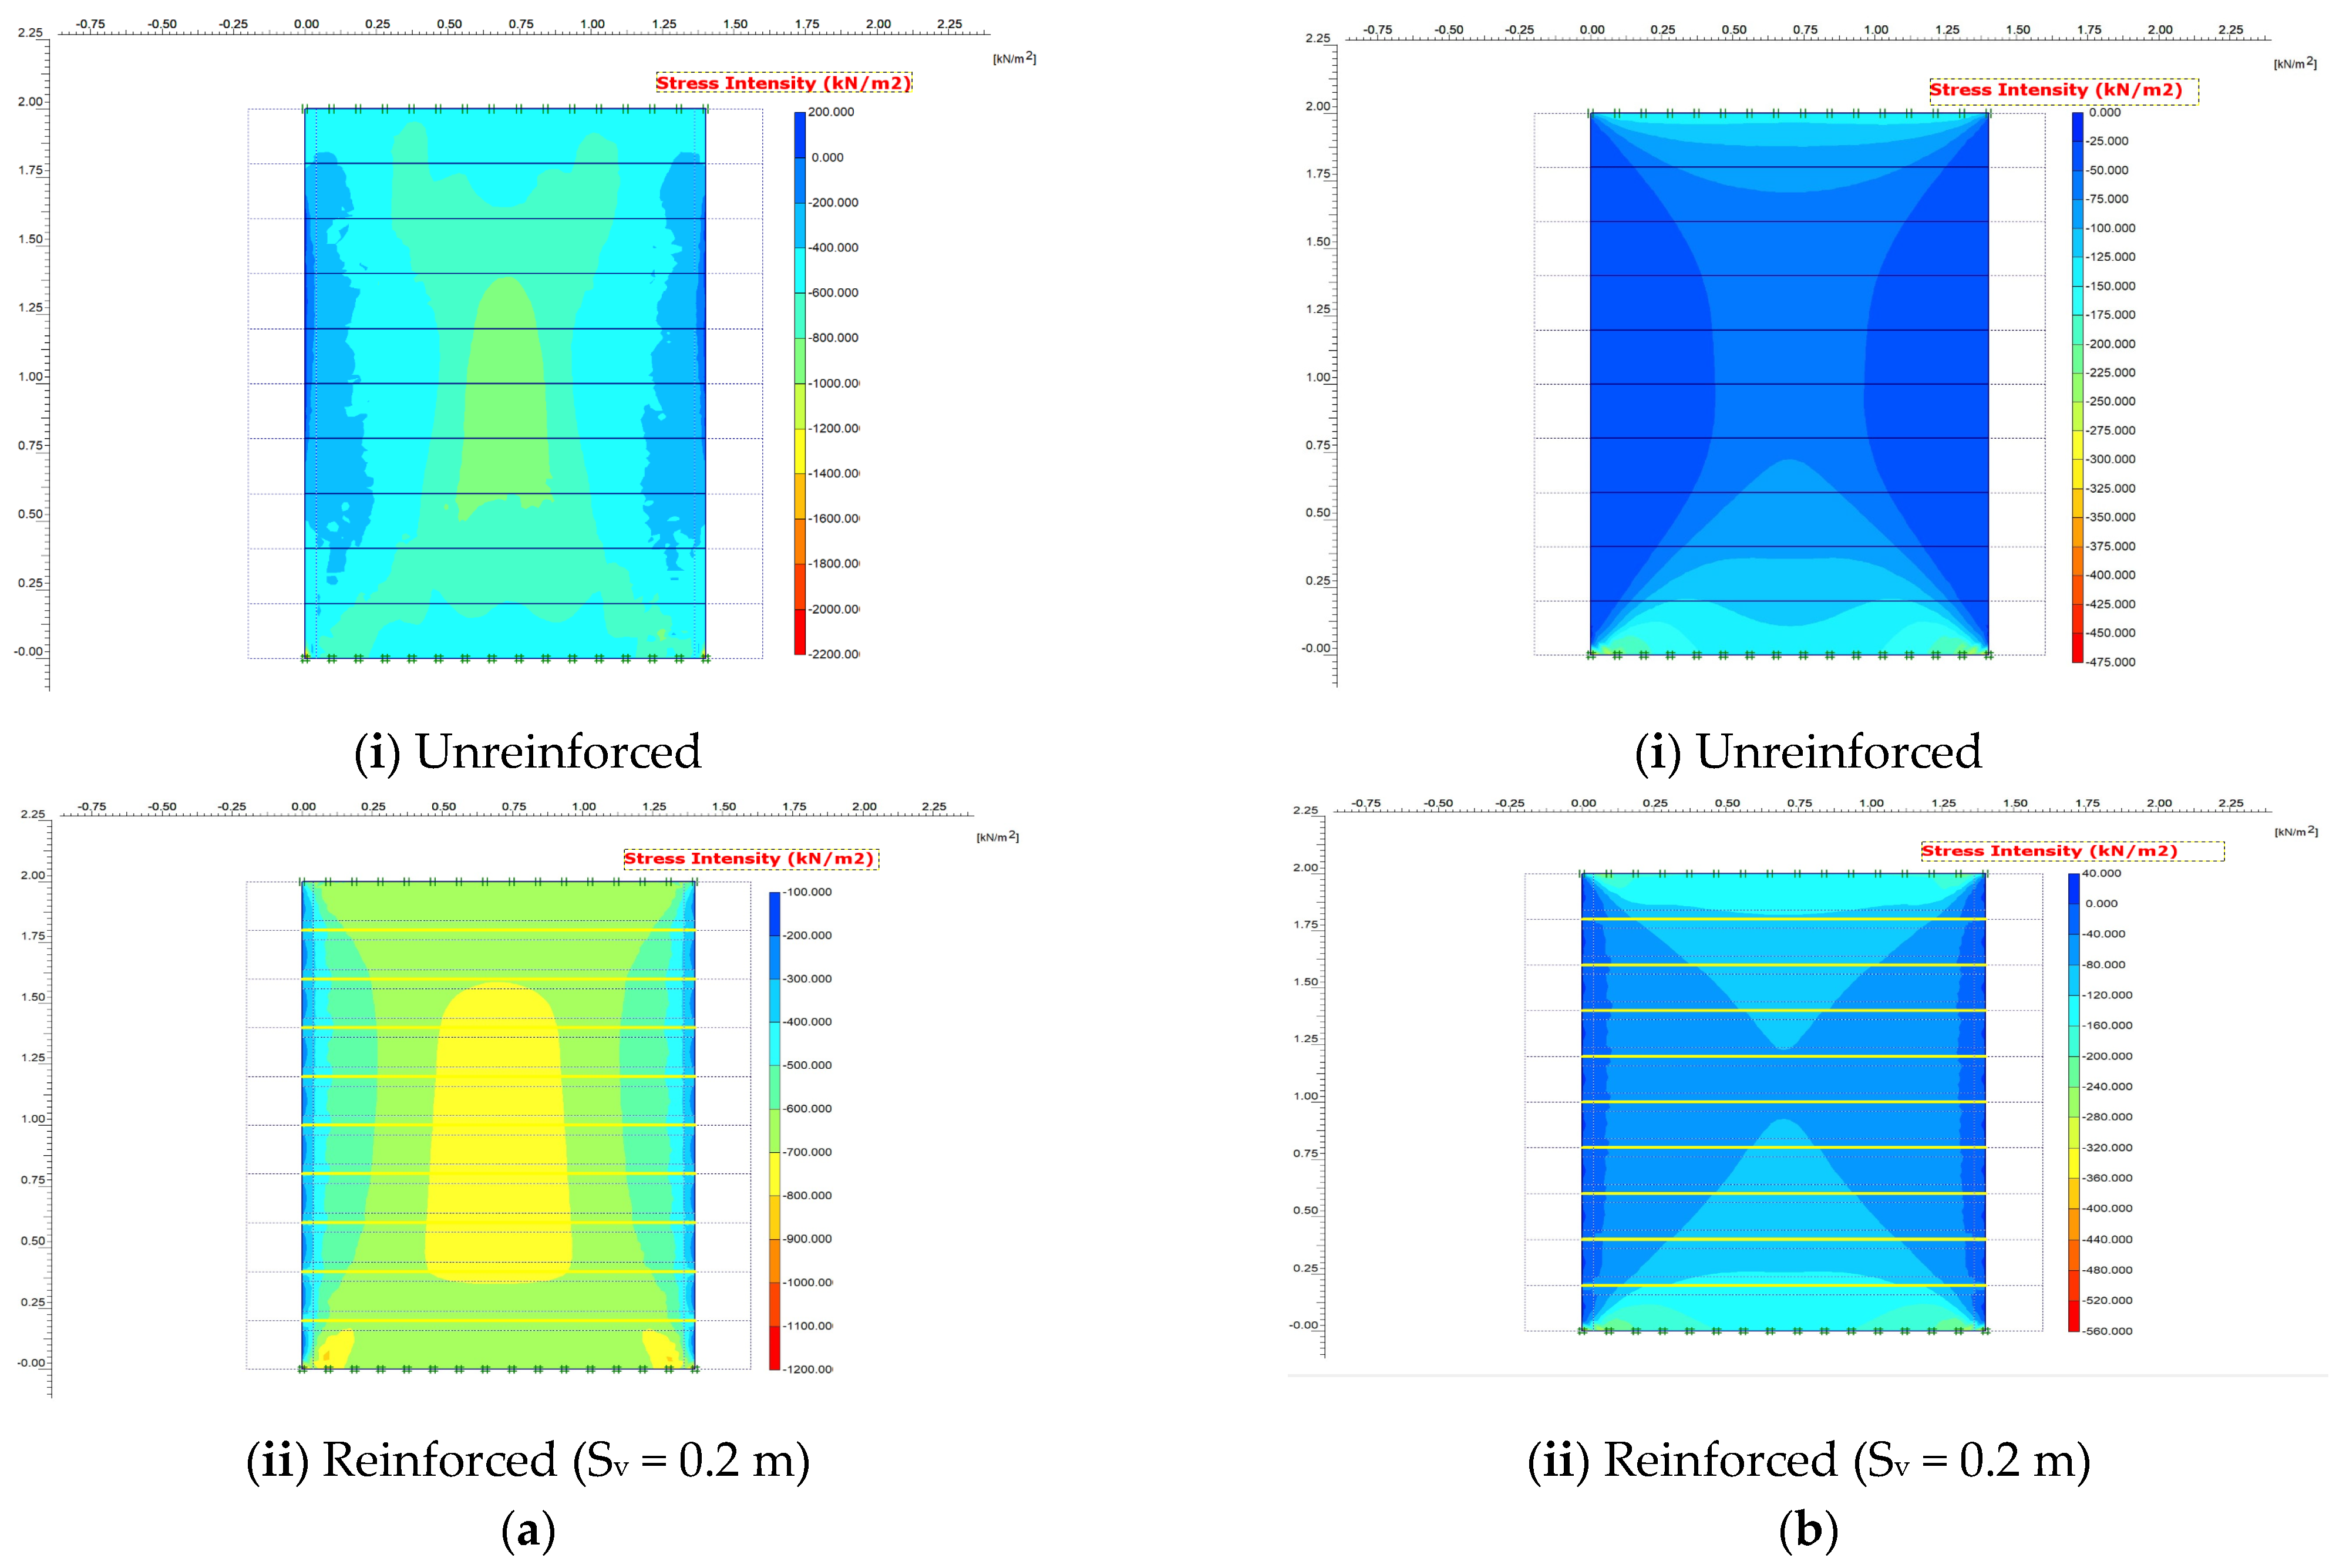
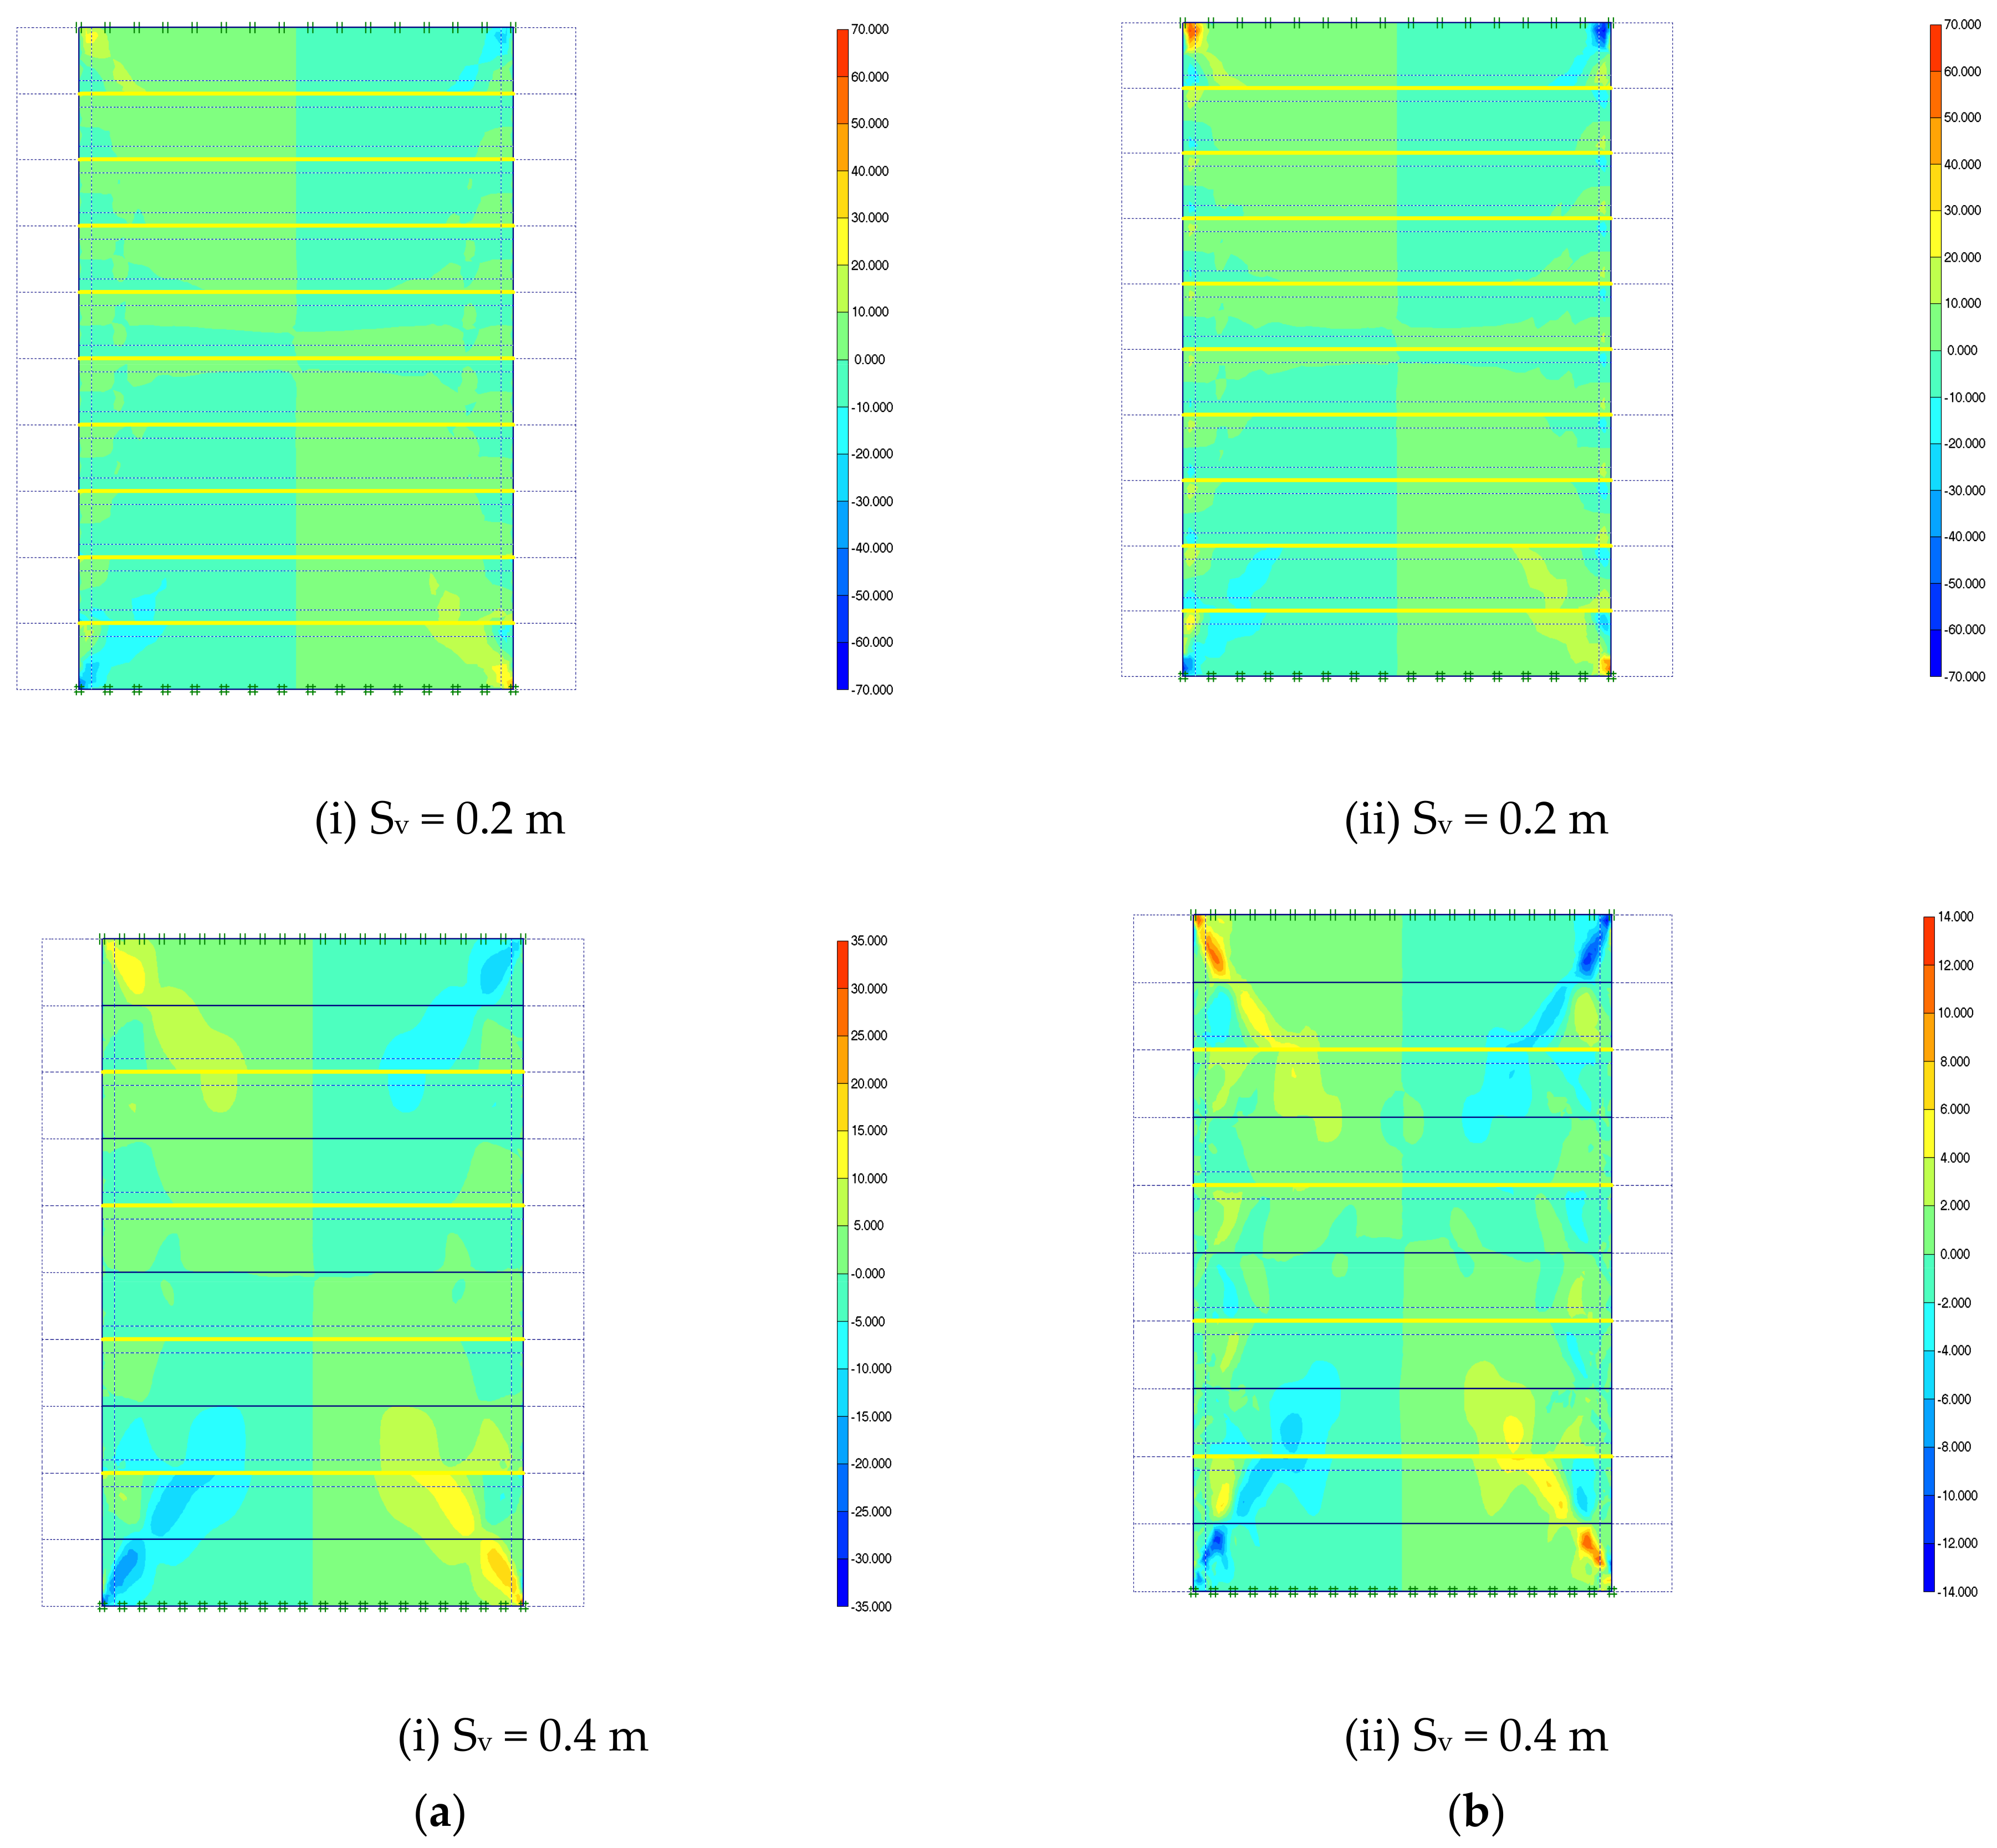
4.1. Analysis of Stress Distribution in SGC Mass

Figure 10 and Figure 11 show distributions of vertical stress and lateral stress within the unreinforced soil mass and reinforced soil mass with the difference in the reinforcement spacing Sv of 0.2 m for both cases, confining pressure and unconfined pressure conditions, under applied vertical pressure of 600 kPa, which is a typical bridge abutment design load. This applied load provided a good simulation of vertical deformation; therefore, it was selected to investigate working stress conditions of SGC masses in this study
The results showed that vertical stresses within the reinforced soil mass were nearly identical in both the reinforced soil mass and the unreinforced soil mass. This is because vertical load was primarily transmitted through the soil skeleton, with reinforcement affecting lateral restraint rather than vertical load paths. However, the closer-spaced reinforcement layers led to smaller vertical stress in the reinforced soil mass when comparing the different reinforcement spacing of Sv of 0.2 m for both cases, confining pressure and unconfined pressure conditions. The greater number of reinforcement layers enhanced the positive arching effect within the soil mass (Figure 10a and Figure 11a). Arching occurs when load is redistributed around stiff inclusions (reinforcements), reducing vertical stress between reinforcement layers.
In contrast, the lateral stresses of unreinforced soil mass and reinforced soil mass were evidently different, with the lateral stress in the reinforced soil mass being higher, especially near the reinforcement layers and the open facing of the soil mass for both cases, confining pressure and unconfined pressure conditions (Figure 10b and Figure 11b). The higher lateral stress within the reinforced soil mass was due to higher restraint of lateral deformation resulting from bonding at the soil–reinforcement interface.

4.2. Lateral Displacement at Open Facing

Figure 12 shows the effect of the reinforcement spacing on the lateral facing displacement at the open face of the SGC mass for both confining pressure and unconfined pressure conditions under applied vertical pressure of 600 kPa. Figure 12 indicates that the reinforcement spacing significantly influenced the lateral facing displacement under the applied load of 600 kPa. For example, reducing the reinforcement spacing from 0.4 m to 0.2 m resulted in a decrease in the maximum lateral displacement by approximately 24% under confining pressure (from 7.78 mm to 5.90 mm), and by about 34% under unconfined pressure conditions (from 12.39 mm to 8.23 mm) (see Table 2). Large lateral displacements could lead to serviceability issues in bridge abutments and necessitate closer spacing. An approximate value of the location of the maximum lateral displacement of the lateral displacement profile can be found at the applied load of 600 kPa. The maximum lateral displacement occurred at about 1/2H from the base of the specimen.

4.3. Reinforcement Strain Profiles at Different Depths of SGC Mass

Tensile forces along the length of reinforcement represent the strain distribution along with the reinforcement at 20, 40, 60, and 80% of the specimen height, as measured from the bottom of the specimen, under the applied load of 600 kPa for both confining and unconfined pressure conditions (see Figure 13). The magnitude of maximum strain increased with an increase in reinforcement spacing. Overall, reducing the reinforcement spacing from 0.4 m to 0.2 m significantly improved performance by reducing axial strain in the reinforcement. At the critical location of 0.2 H, the axial strain decreased by approximately 28% under confining pressure and 37% under unconfined pressure. When averaged across all measured locations (from 0.2 H to 0.8 H), the axial strain reductions remained consistent at around 28% and 37% under confining and unconfined conditions, respectively (see Table 3). Furthermore, the numerical results showed good agreement with the experimental data reported by Pham [3]. The maximum reinforcement strain envelope was located very close to the open face of about 0.2 m from the open face at 0.2 H and 0.8 H and moved to about 0.7 m away from the open face at 0.4 H and 0.6 H. The location of peak tensile force in both confining pressure and unconfined pressure was almost identical.
Figure 14 plots the maximum shear strain increment contours for the cases with the applied load of 600 kPa for confining and unconfined pressure conditions. The slightly higher shear strains were observed at the top and bottom reinforcement of the SGC mass, which coincided with the formed peak strain in the reinforcement layer of 0.2 H and 0.8 H from bottom of the specimen (see Figure 13). In the middle of the SGC mass, the maximum shear strain was not clearly observed in both confining pressure and unconfined pressure conditions. This implies that the failure surface in the SGC mass was not fully formed. Because the analysis was carried out under working pressure of 600 kPa, which was less than the failure pressure, the shear stress was not sufficient to reach the failure surface.
Table 4 shows a comparison of reinforcement spacing effects between the present study and the selected previous study (Adams et al. [2]). The table highlights differences in boundary conditions, research focus, and key findings, particularly emphasizing the novel conclusion of this study regarding the effectiveness of upper-layer reinforcement under unconfined pressure conditions. While previous studies (e.g., Adams et al. [2]) focused primarily on confined systems and global deformation responses, the present work introduces a new vertical perspective by demonstrating that strain reduction is more significant at upper reinforcement levels in unconfined scenarios. This insight may inform improved reinforcement layout strategies for geosynthetic-reinforced structures in partially confined or flexible-faced applications.
Figure 12 and Figure 14 also show that the higher shear stress was easily observed for the specimen with reinforcement spacing of Sv = 0.4 m compared with the reinforcement spacing Sv of 0.2 m, due to the larger lateral displacement at the open facing of SGC mass. This coincides with the higher axial strain in the model with reinforcement spacing Sv = 0.4 m compared with the model with Sv = 0.2 m (see Figure 13).

5. Conclusions

This paper presents numerical models of an SGC mass developed from a large-scale SGC test to investigate the effect of reinforcement spacing on stress distribution, reinforcement strain profiles at various depths, and lateral displacement at open faces. Based on the results of this study, the findings and conclusions can be summarized as follows:
  • Vertical stresses in both the unreinforced and reinforced soil masses were identical, however, the lateral stresses were greater in the reinforced masses due to the restraining effect of the reinforcement.
  • Reinforcement spacing significantly influenced lateral displacement at the facing under the applied loading condition of 600 kPa, which is typical for bridge abutment design, in both confining and unconfined pressure conditions.
  • In some cases, strengthening the reinforcement in the upper part of the SGC mass was more effective than reinforcing the lower part under failure loads, regardless of confining or unconfined pressure conditions. This finding is particularly relevant for geotechnical designs involving shallow excavation or surface-dominated loading, such as traffic or compaction, where strategic reinforcement placement can improve structural efficiency and reduce material usage.
  • Combining analyses of stress in soil, lateral displacement at the open face, and axial strain in each reinforcement layer using the finite element analysis provides a clearer understanding of the stress–deformation behavior of SGC masses, which is challenging to measure accurately during physical experiments.
  • Designers should consider reinforcement spacing of 0.2 m or less to control lateral displacements and maximize stability under typical bridge loading.
  • The findings are for dry, cohesionless backfill; clayey soils may behave differently to what we have observed in this study.

Author Contributions

Conceptualization, T.T.T.P., T.P. and M.-W.G.; methodology, T.T.T.P., T.P., and M.-W.G.; numerical analysis, T.T.T.P. and B.T.L.; validation, T.P. and M.-W.G.; experimental data curation, T.P.; numerical data curation, T.T.T.P.; writing—original draft preparation, T.T.T.P.; writing—review and editing, T.P. and M.-W.G. All authors have read and agreed to the published version of the manuscript.

Funding

This research received no external funding.

Institutional Review Board Statement

Not applicable.

Informed Consent Statement

Not applicable.

Data Availability Statement

The data presented in this study are included in the article.

Conflicts of Interest

The authors declare no conflicts of interest.

Abbreviations

The following abbreviations are used in this manuscript:
GRSGeosynthetic-reinforced soil
IBSIntegrated bridge system
PPPolypropylene
SGCSoil–geosynthetic composite
CISCompaction-induced stress
MSEMechanically stabilized earth

References

  1. Elton, D.J.; Patawaran, M.A.B. Mechanically Stabilized Earth Reinforcement Tensile Strength from Tests of Geotextile-Reinforced Soil. Transp. Res. Rec. 2004, 1868, 81–88. [Google Scholar] [CrossRef]
  2. Adams, M.T.; Ketchart, K.; Wu, J.T.H. Mini Pier Experiments: Geosynthetic Reinforcement Spacing and Strength as Related to Performance. In Proceedings Geo-Denver 2007: Geosynthetics in Reinforcement and Hydraulic Applications (Geotechnical Special Publication 165); Gabr, M.A., Bowders, J.J., Eds.; ASCE Geo-Institute: Reston, VA, USA, 2007. [Google Scholar]
  3. Pham, T.Q. Investigating Composite Behavior of Geosynthetic-Reinforced Soil (GRS) Mass. Ph.D. Thesis, University of Colorado, Denver, CO, USA, 2009; 378p. [Google Scholar]
  4. Wu, J.T.H.; Pham, T.Q. Load-Carrying Capacity and Required Reinforcement Strength of Closely Spaced Soil-Geosynthetic Composites. J. Geotech. Geoenviron. Eng. 2013, 139, 1468–1476. [Google Scholar] [CrossRef]
  5. Gui, M.W.; Phan, T.T.T.; Pham, Q.T. Mechanical Responses of Soil-Geosynthetic Composite (SGC) Mass under Failure Load. Sustainability 2022, 14, 9629. [Google Scholar] [CrossRef]
  6. Wu, J.T.H.; Pham, T.Q. An Analytical Model for Evaluation of Compaction-Induced Stresses in a Reinforced Soil Mass. Int. J. Geotech. Eng. 2010, 4, 549–556. [Google Scholar] [CrossRef]
  7. Wu, J.T.H.; Yang, K.H.; Mohamed, S.; Pham, T.Q.; Chen, R.H. Suppression of Soil Dilation—A Reinforcing Mechanism of Soil-Geosynthetic Composites. Transp. Infrastruct. Geotechnol. 2014, 1, 68–82. [Google Scholar] [CrossRef]
  8. Wu, J.T.H.; Tung, C.; Adams, M.T.; Nicks, J.E. Analysis of Stress-Deformation Behavior of Soil-Geosynthetic Composites in Plane Strain Condition. Transp. Infrastruct. Geotechnol. 2018, 5, 210–230. [Google Scholar] [CrossRef]
  9. Yang, K.H.; Wu, J.T.H.; Chen, R.H.; Chen, Y.S. Lateral Bearing Capacity and Failure Mode of Geosynthetic-Reinforced Soil Barriers Subject to Lateral Loadings. Geotext. Geomembr. 2016, 44, 799–812. [Google Scholar] [CrossRef]
  10. Gui, M.W.; Phan, T.T.T.; Pham, Q.T. Impacts of Compaction Load and Procedure on Stress-Deformation Behaviors of a Soil Geosynthetic Composite (SGC) Mass—A Case Study. Appl. Sci. 2020, 10, 6339. [Google Scholar] [CrossRef]
  11. Phan, T.T.T.; Gui, M.W.; Pham, Q.T. Numerical Simulation of Compaction Load on Stress Deformation Behavior of Soil Geosynthetic Composite Mass. In Advances in Transportation Geotechnics IV. Lecture Notes in Civil Engineering; Tutumluer, E., Nazarian, S., Al-Qadi, I., Qamhia, I.I., Eds.; Springer: Cham, Switzerland, 2021. [Google Scholar] [CrossRef]
  12. Abu-Farsakh, M.; Ardah, A.; Voyiadjis, G. Numerical parametric study to evaluate the performance of a Geosynthetic Reinforced Soil Integrated Bridge System (GRS-IBS) under service loading. Transp. Geotech. 2019, 20, 100238. [Google Scholar] [CrossRef]
  13. Ardah, A.; Abu-Farsakh, M.; Voyiadjis, G. Numerical evaluation of the performance of a Geosynthetic Reinforced Soil-Integrated Bridge System (GRS-IBS) under different loading conditions. Geotext. Geomembr. 2017, 45, 558–569. [Google Scholar] [CrossRef]
  14. Zheng, Y.W.; Fox, P.J. Numerical investigation of geosynthetic-reinforced soil bridge abutments under static loading. J. Geotech. Geoenviron. Eng. 2016, 142, 04016004. [Google Scholar] [CrossRef]
  15. Zheng, Y.W.; Fox, P.J. Numerical investigation of the geosynthetic-reinforced soil integrated bridge system under static loading. J. Geotech. Geoenviron. Eng. 2017, 143, 04017008. [Google Scholar] [CrossRef]
  16. Zheng, Y.W.; Fox, P.J.; McCartney, J.S. Numerical simulation of deformation and failure behavior of geosynthetic reinforced soil bridge abutments. J. Geotech. Geoenviron. Eng. 2018, 144, 04018037. [Google Scholar] [CrossRef]
  17. Zheng, Y.W.; Fox, P.J.; McCartney, J.S. Numerical study on maximum reinforcement tensile forces in geosynthetic reinforced soil bridge abutments. Geotext. Geomembr. 2018, 46, 634–645. [Google Scholar] [CrossRef]
  18. Zhao, C.; Xu, C.; Shen, P.; Li, G.; Wang, Q. Assessing Numerical Simulation Methods for Reinforcement–Soil/Block Interactions in Geosynthetic-Reinforced Soil Structures. Buildings 2024, 14, 422. [Google Scholar] [CrossRef]
  19. Li, J.; Wang, M.; Chen, L.; Zhang, Y. Model Test and Numerical Simulation Research of Reinforced Soil Retaining Walls under Cyclic Loads. Sustainability 2022, 14, 15643. [Google Scholar] [CrossRef]
  20. Siacara, A.T.; Beck, A.T.; Futai, M.M. 3D Numerical Modeling of Geosynthetics for Soil Reinforcement: A Bibliometric Analysis and Literature Review. Geotechnics 2024, 4, 668–704. [Google Scholar] [CrossRef]
  21. Fan, C.; Liu, H.; Cao, J.; Ling, H.I. Responses of Reinforced Soil Retaining Walls Subjected to Horizontal and Vertical Seismic Loadings. Soil Dyn. Earthq. Eng. 2020, 129, 105969. [Google Scholar]
  22. Yünkül, K.; Gürbüz, A. Numerical Simulation of Polymeric Strap Material Reinforced Walls under Seismic Excitation. Transp. Res. Rec. 2024, 2678, 1181–1204. [Google Scholar] [CrossRef]
  23. Broms, B. Lateral Pressure Due to Compaction of Cohesionless Soils. In Proceedings of the 4th Budapest Conference on Soil Mechanics and Foundation Engineering: 3rd Danube-European Conference, Budapest, Hungary, 12–15 October 1971; pp. 373–384. [Google Scholar]
  24. Aggour, M.S.; Brown, C.B. The Prediction of Earth Pressure on Retaining Walls Due to Compaction. Geotechnique 1974, 24, 489–502. [Google Scholar] [CrossRef]
  25. Seed, R. Compaction-induced Stresses and Deflections on Earth Structure. Ph.D. Dissertation, Department of Civil Engineering, University of California, Berkeley, CA, USA, 1983; 447p. [Google Scholar]
  26. Duncan, J.M.; Seed, R.B. Compaction-Induced Earth Pressures Under K0-Conditions. J. Geotech. Eng. 1986, 112, 1–12. [Google Scholar] [CrossRef]
  27. Seed, R.; Duncan, J. FE Analyses: Compaction-Induced Stresses and Deformations. J. Geotech. Eng. 1986, 112, 23–43. [Google Scholar] [CrossRef]
  28. Hatami, K.; Bathurst, R.J. Development and Verification of a Numerical Model for the Analysis of Geosynthetic-Reinforced Soil Segmental Walls under Working Stress Conditions. Can. Geotech. J. 2005, 42, 1066–1085. [Google Scholar] [CrossRef]
  29. Hatami, K.; Bathurst, R.J. Numerical Model for Reinforced Soil Segmental Walls under Surcharge Loading. J. Geotech. Geoenviron. Eng. 2006, 132, 673–684. [Google Scholar] [CrossRef]
  30. Bathurst, R.J.; Nernheim, A.; Walters, D.L.; Allen, T.M.; Burgess, P.; Saunders, D.D. Influence of Reinforcement Stiffness and Compaction on the Performance of Four Geosynthetic-Reinforced Soil 785 Walls. Geosynth. Int. 2009, 16, 43–59. [Google Scholar] [CrossRef]
  31. Yu, Y.; Bathurst, R.J.; Allen, T.M. Numerical Modelling of Two Full-Scale Reinforced Soil Wrapped-Face Walls. Geotext. Geomembr. 2017, 45, 237–249. [Google Scholar] [CrossRef]
  32. Mirmoradi, S.H.; Ehrlich, M. Modeling of the Compaction-Induced Stresses in Numerical Analyses of GRS Walls. Int. J. Comput. Methods 2014, 11, 1342002. [Google Scholar] [CrossRef]
  33. Mirmoradi, S.H.; Ehrlich, M. Modeling of the Compaction-Induced Stress on Reinforced Soil Walls. Geotext. Geomembr. 2015, 43, 82–88. [Google Scholar] [CrossRef]
  34. Mirmoradi, S.H.; Ehrlich, M. Numerical Simulation of Compaction-Induced Stress for the Analysis of RS Walls under Working Conditions. Geotext. Geomembr. 2018, 46, 354–365. [Google Scholar] [CrossRef]
  35. Nascimento, G.; Ehrlich, M.; Mirmoradi, S.H. Numerical-simulation of compaction-induced stress for the analysis of RS walls under surcharge loading. Geotext. Geomembr. 2020, 48, 532–538. [Google Scholar] [CrossRef]
  36. ASTM D4595-17; Standard Test Method for Tensile Properties of Geotextiles by the Wide-Width Strip Method. ASTM International: West Conshohocken, PA, USA, 2017.
  37. Plaxis 2D—Version 8, Reference Manual; Delft University of Technology: Delft, The Netherlands, 2002; Available online: https://www.plaxis.com/support/manuals/plaxis-2d-manuals/ (accessed on 30 May 2024).
  38. Schanz, T.; Vermeer, P.A.; Bonnier, P.G. The Hardening Soil Model: Formulation and Verification. In Beyond 2000 in Computational Geotechnics; Ronald, B., Brinkgreve, J., Eds.; Taylor & Francis Group: London, UK, 1999; p. 281. [Google Scholar]
Figure 1. Experimental setup, referenced from Pham [3], used for model validation: (a) preparation of the geosynthetic-reinforced soil (SGC) specimen and (b) placement of sensors for capturing axial strain within the reinforcement layers during staged construction.
Buildings 15 02229 g001
Figure 2. Mohr–Coulomb failure criteria curves for the backfill material [3].
Buildings 15 02229 g002
Figure 3. Load–deformation curves of the geosynthetics material, tested according to ASTM D4595-17 [36].
Buildings 15 02229 g003
Figure 4. Schematic of the instrumented SGC mass used for validation.
Buildings 15 02229 g004
Figure 5. Measured internal displacements at six selected points at failure stage: (a) Tests 1 and 2 and (b) Tests 3 and 4.
Buildings 15 02229 g005
Figure 6. Systematic workflow adopted in this study to simulate the stress–strain behavior of geosynthetic-reinforced soil structures using finite element modeling under various loading and confinement conditions.
Buildings 15 02229 g006
Figure 7. FE model of SGC mass: (a) confining pressure and (b) unconfined pressure.
Buildings 15 02229 g007aBuildings 15 02229 g007b
Figure 8. (a) Measured and simulated applied vertical pressure versus vertical strain relationship of the four SGC tests and (b) measured and simulated applied vertical pressure versus lateral displacement at open face relationship of the four SGC tests [3].
Buildings 15 02229 g008
Figure 9. Failure planes of the composite mass after testing of four SGC tests.
Buildings 15 02229 g009
Figure 10. Stress distributions under confining pressure conditions: (a) vertical stress and (b) lateral stress, comparing unreinforced and SGC masses. Color bars represent stress magnitude in kilonewtons per square meter (kN/m2).
Buildings 15 02229 g010
Figure 11. Stress distributions under unconfined pressure conditions: (a) vertical stress and (b) lateral stress, comparing unreinforced and SGC masses. Color bars represent stress magnitude in kilonewtons per square meter (kN/m2).
Buildings 15 02229 g011
Figure 12. Effect of reinforcement spacing on lateral displacement at open facing under applied load of 600 kPa for confining pressure and unconfined pressure [3].
Buildings 15 02229 g012
Figure 13. Axial strain profiles along the reinforcement length at different heights under applied load of 600 kPa for confining pressure and unconfined pressure [3].
Buildings 15 02229 g013
Figure 14. Maximum shear strain increment contours under applied load of 600 kPa for (a) confining pressure and (b) unconfined pressure.
Buildings 15 02229 g014
Table 1. Parameters in the FE analyses.
Material PropertiesTest No. 1Test No. 2Test No. 3Test No. 4
Soil properties
ModelHardening soilHardening soilHardening soilHardening soil
Peak friction angle, ϕ (°) 50505050
Cohesion, c (kPa) 70707070
Dilation angle, Ψ (°)19191919
Unit weight, γ (kN/m3)25252525
Confining pressure, σ3 (kN/m2)3434034
Eref50, (kN/m3)62,37462,37462,37462,374
Eur50 = 3 Eref50, (kN/m3)187,122187,122187,122187,122
Stress dependence exponent, m0.50.50.50.5
Failure ratio, R0.80.80.80.8
Poisson’s ratio, υ 0.20.20.20.2
Pref (kPa)100100100100
ReinforcementN/ASingle-sheet Single-sheet Single-sheet
Model N/AElastic–perfectly plasticElastic–perfectly plasticElastic–perfectly plastic
Elastic axial stiffness (kN/m) N/A100010001000
Reinforcement spacing, Sv (m)N/A0.20.20.4
Modular block properties
ModelLinear elasticLinear elasticLinear elasticLinear elastic
Stiffness modulus (kPa)3 × 1063 × 1063 × 1063 × 106
Unit weight, γ (kN/m3)12.512.512.512.5
Poisson’s ratio, υ 0000
Block–Block interface
ModelMohr–CoulombMohr–CoulombMohr–CoulombMohr–Coulomb
Stiffness modulus (kPa)3 × 1063 × 1063 × 1063 × 106
Unit weight, γ (kN/m3)0000
Poisson’s ratio, υ 0.450.450.450.45
Angle of internal friction, ϕ (°) 33333333
Cohesion, c (kPa) 2222
Soil–Block interface
ModelMohr–CoulombMohr–CoulombMohr–CoulombMohr–Coulomb
Unit weight, γ (kN/m3)0000
Poisson’s ratio, υ 0.450.450.450.45
Angle of internal friction, ϕ (°) 33.3333.3333.3333.33
Cohesion, c (kPa) 46.6746.6746.6746.67
Stiffness modulus (kPa)74,829.71174,829.71174,829.71174,829.711
Soil–Reinforcement interface
ModelN/AMohr–CoulombMohr–CoulombMohr–Coulomb
Unit weight, γ (kN/m3)N/A000
Poisson’s ratio, υ N/A0.450.450.45
Angle of internal friction, ϕ (°) N/A404040
Cohesion, c (kPa) N/A565656
Stiffness modulus (kPa)N/A106,685.26106,685.26106,685
Zero-thickness interface parameters were specified, with soil and facing block properties taken from triaxial tests and reference [3].
Table 2. Maximum lateral displacement (mm) under different reinforcement spacings and confinement conditions.
Reinforcement Spacing (Sv)Confining PressureUnconfined Pressure
0.2 m5.9 mm8.23 mm
0.4 m7.78 mm12.39 mm
Table 3. Maximum axial strain (%) under different reinforcement spacings and confinement conditions.
Reinforcement Spacing of
Sv = 0.2 m
Reinforcement Spacing of Sv = 0.4 m
Confining Unconfined Confining Unconfined
0.8 H0.69%0.96%0.94%1.48%
0.6 H0.98%1.32%1.39%2.07%
0.4 H0.91%1.27%1.25%1.97%
0.2 H0.74%0.96%1.02%1.63%
Table 4. Comparison of reinforcement spacing effects between the present study and selected previous study (Adams et al. [2]).
StudyReinforcement Spacing (Sv)Boundary
Condition
Key FocusKey Findings
Adams et al. [2]0.2 m, 0.4 mConfined (mini-pier model)Reinforcement spacing and strengthReduced spacing improved
load capacity and system
stiffness under confined load
This study0.2 m, 0.4 mConfining and unconfinedAxial strain distribution by reinforcement depthUpper reinforcement more
effective in unconfined
conditions
Disclaimer/Publisher’s Note: The statements, opinions and data contained in all publications are solely those of the individual author(s) and contributor(s) and not of MDPI and/or the editor(s). MDPI and/or the editor(s) disclaim responsibility for any injury to people or property resulting from any ideas, methods, instructions or products referred to in the content.

