Article

The Influence of Thermal History and Air Conditioner Use Behavior Under Different Cooling Set Point Temperature Modes on Health

1
College of Civil Engineering, Hunan University, Changsha 410081, China
2
School of Architectural and Artistic Design, Henan Polytechnic University, Jiaozuo 454000, China
*
Authors to whom correspondence should be addressed.
Buildings 2025, 15(13), 2211; https://doi.org/10.3390/buildings15132211
Submission received: 4 June 2025 / Revised: 21 June 2025 / Accepted: 23 June 2025 / Published: 24 June 2025
(This article belongs to the Section Building Energy, Physics, Environment, and Systems)

Abstract

Chinese local governments mandate public buildings to maintain a cooling set point temperature (SPT ≥ 26 °C). To explore how thermal history and air conditioner use behavior under different cooling SPT modes influence health, an experimental study and field investigation was carried out in split air-conditioned office buildings in China’s cold climate regions. Two categories were established based on energy policy: the H group (SPT ≥ 26 °C) and the L group (SPT < 26 °C). The results showed that L group subjects experienced longer, colder, and higher CO2/formaldehyde exceedance rate exposures in air-conditioned environments, demonstrating greater reliance on air conditioners, although indoor air quality satisfaction showed no significant difference between groups. Air quality perception demonstrates long-term adaptation to indoor air temperature and CO2. Compared with the high SPT mode, the adverse influences and mechanisms of the low SPT mode on health are as follows: making people adapt to cold environments due to colder thermal history and inducing pathological adaptation cycles, thus promoting strong reliance on the air-conditioned environment. This leads to a substantial increase in air conditioner use time, thereby increasing the severity of sick building syndrome (SBS), indoor pollutants, formaldehyde carcinogenic risk, and desensitized air quality perception. China’s government should systematically enhance the enforcement of SPT-related policies.

1. Introduction

1.1. Energy-Saving Policy and Health

Within China’s building energy landscape, occupant-driven thermal comfort requirements contribute significantly to operational energy demand. Statistical analysis reveals that public buildings represented 79% of final operating building energy consumption in 2022 [1]. Therefore, the government in China introduced a policy in 2007 to restrict the set point temperature (SPT) range of air conditioners in public buildings to save energy: the SPT must be ≥26 °C during summer [2]. Despite the fact that the 2021 reissuance of SPT guidelines aligned with China’s 2030 CO2 peaking and 2060 carbon neutrality goals, empirical research [2] revealed widespread SPT below 26 °C in split air-conditioned offices. To explore the rationality of this energy-saving policy, the author’s team conducted a thermal comfort field survey. The results showed that through thermal adaptation, the thermal comfort and thermal acceptability of subjects in H mode were very high, which can completely meet people’s comfort needs. Furthermore, there was cold discomfort in L mode [3]. Therefore, from the perspective of comfort, we should continue to strengthen the policy guidance. In China’s small/medium offices (predominantly using split air conditioners), occupants fully control the SPT and on/off status of the split air conditioner, complicating policy enforcement. Empirical studies in split air-conditioned offices [4,5] identify two critical behavioral patterns. Low SPT (<26 °C) is primarily driven by economic insensitivity, as occupants often do not bear direct energy costs. High SPT adjustments (≥26 °C) occur when health is prioritized, with occupants citing health improvements (e.g., reduced sick building syndrome) as the main motivator—significantly outweighing energy-saving concerns. This discrepancy highlights that health-centric interventions are more effective than energy-focused campaigns in promoting policy compliance [2]. Hence, investigating the health impacts of different SPT modes holds high practical relevance for promoting the implementation of SPT energy-saving policies, advancing building energy efficiency, and creating healthy indoor environments. Our prior surveys revealed no significant thermal comfort differences between SPT modes but identified distinct behavioral patterns [3]. Building on this foundation, the current study specifically examines how thermal history and air conditioner use behaviors under different SPT modes influence health.

1.2. Indoor Thermal History and Thermoregulatory Capacity

Thermoregulatory capability, a critical physiological function for maintaining stable core body temperature, is increasingly recognized as a key mediator between thermal history and health. Different indoor thermal histories may affect people’s thermoregulatory capacity. Compared with people who stayed in the naturally ventilated building environment for a long time, people who stayed in the air-conditioned building environment all day showed weaker thermoregulation capacity, including a slower skin temperature adjustment and a lower sweating rate. This will lead to poor tolerance to the high-temperature environment, human thermal stress capacity degradation, and many health problems [6]. However, there was no significant difference in thermoregulation capacity between people who stayed in naturally ventilated buildings for a long time and those who stayed in split air-conditioned buildings for a long time [7]. On this basis, Zhang et al. [8] conducted a study on the thermal comfort of participants from different air-conditioned building types under varying temperature conditions. The findings revealed that in hot environments, the thermoregulatory capacity of participants who long-term occupied centrally air-conditioned buildings was significantly weaker than that of participants from split air-conditioned buildings.
Overall, prior research has demonstrated that differences in indoor thermal history across building types (naturally ventilated vs. air-conditioned buildings), as well as different forms of air-conditioned buildings, significantly affect occupants’ thermoregulatory capacity. On the contrary, no significant thermoregulatory capacity impact was found between natural ventilation and split air-conditioned thermal histories. Nevertheless, previous studies neglected SPT influences. In split air-conditioned buildings where users freely adjust SPTs, the health implications of SPT-mediated thermal histories on thermoregulatory capacity remain unclear. The SPT energy policy (≥26 °C) operates through a health-adaptive closed-loop mechanism: SPT < 26 °C is associated with negative health impacts, which in turn drive voluntary policy compliance. This study establishes SPT as a critical factor linking thermal adaptation mechanisms, health outcomes, and policy efficacy, warranting further exploration.

1.3. Behavior and IAQ

Globally, beyond examining the interaction between indoor thermal conditions and health [9,10], extensive research has consistently prioritized indoor air quality (IAQ)—a key determinant of occupant comfort and well-being—since the World Health Organization first established the concept of “sick building syndrome” over three decades ago [11,12,13]. Prolonged or repeated exposure to poor air quality may lead to severe health consequences, including respiratory diseases, cardiovascular disorders, and cancer [14]. Sérafin et al. [15] compiled global office building pollutant data from the early 21st century. Formaldehyde and PM2.5 have been classified as priority contaminants through systematic evaluation of their carcinogenicity, mutagenicity, chronic toxicity, and endocrine-disrupting effects. Formaldehyde, a primary indoor air contaminant, originates predominantly from artificial building materials, decorative finishes, paints, and thermal insulation materials. In office environments, its concentration peaks near emission sources, such as furniture, photocopiers, and printers, where cumulative off-gassing creates localized hotspots [16]. Classified as a Group 1 carcinogen, formaldehyde exposure is causally linked to nasopharyngeal carcinoma, malignant lymphoma, and leukemia, with epidemiological evidence suggesting associations with gastric cancer, brain tumors, and thyroid neoplasms in women [17]. These carcinogenic risks are particularly relevant in sealed air-conditioned spaces, as inadequate ventilation may sustain elevated formaldehyde levels above the health threshold. Although carbon dioxide (CO2) exhibits no direct toxicological risks, elevated concentrations may alter respiratory patterns, peripheral blood flow, autonomic nervous function, and cerebral cortical activity [18,19]. Office workers, representing the largest occupational group across nine standard categories and growing steadily in number, typically spend over eight hours daily in office environments [20]. This prolonged exposure has heightened concerns about office IAQ. Cheng et al. [21] compared centrally air-conditioned offices across Chinese climate zones, finding marginally better IAQ in Kunming’s temperate climate (attributed to prevalent natural ventilation) than in Tianjin and Changsha. However, exposure assessments still indicated substandard indoor conditions. Alonso et al. [22] evaluated pollutants in Norwegian residential office buildings featuring natural and mechanical ventilation systems, revealing frequent exceedances of health thresholds for CO2 and other contaminants. Qiu et al. [23] performed an on-site study on the CO2 and PM2.5 levels in six office buildings equipped with central air conditioning systems in Chengdu, China, and showed that daily concentrations exceeded WHO guidelines for ≥50% of occupancy periods. In addition, a lack of or ineffective ventilation systems also exacerbated CO2 accumulation.
Proper ventilation practices effectively mitigate health hazards by diluting and reducing indoor air pollution levels, thereby representing the most effective strategy for maintaining optimal indoor air quality [24,25]. The current on-site studies regarding the IAQ of office buildings predominantly concentrate on those with central air conditioning systems [26,27,28], whereas research on split air-conditioned buildings is scarce. Centrally air-conditioned buildings are equipped with mechanical ventilation or fresh air systems, and indoor ventilation is completely different from split air-conditioned buildings. The ventilation of split air-conditioned buildings only relies on operable doors and windows. However, occupants often shut windows while operating split air conditioners to minimize energy consumption and heat dissipation. This results in the room becoming sealed, with ventilation being poor, and consequently, indoor pollutant levels rise. Therefore, air conditioner use behavior exhibits significant correlations with summertime IAQ, and occupants’ indoor thermal history influences their air conditioner use behaviors [29]. However, what differences exist in air conditioner use behaviors among individuals experiencing distinct SPTs, and to what extent do these differences impact indoor air quality and subsequently affect health? These questions require systematic investigation.
In China, the majority of office buildings with split air conditioners lack IAQ monitoring equipment, meaning occupants rely solely on subjective perception to assess air quality. Thus, occupants’ accurate perception of IAQ influences ventilation behavior, which in turn mitigates the health risks posed by indoor air pollution. Previous research has indicated that indoor temperature and CO2 influence occupants’ perception of IAQ [30,31,32]. As a critical parameter for assessing indoor air freshness, elevated CO2 levels trigger human IAQ sensitivity, thereby prompting ventilation behavior. Nevertheless, prolonged exposure to varying thermal and CO2 conditions may induce adaptive desensitization of IAQ perception—potentially impairing occupants’ cognitive appraisal of air quality thresholds. This phenomenon remains insufficiently characterized in environmental health research.

1.4. Study Aims

Overall, indoor thermal history and IAQ represent critical determinants that influence people’s health. To study the health of SPT policy, it appears obvious and crucial to investigate the differences in thermal history and air conditioner use behaviors of people who are used to different cooling SPT modes in split air-conditioned buildings and how these differences relate to thermoregulatory capacity and indoor air pollution exposure. The findings offer a theoretical basis for applying energy-efficient SPT policies and addressing indoor environmental health issues in split air-conditioned public buildings during summer. This investigation pursues four primary aims as follows:
(1) Investigate differences in thermal history and air conditioner use behaviors of people who are used to different cooling SPT modes.
(2) Explore the effects of the thermal history of different SPT modes on human thermoregulatory capacity.
(3) Discuss the influence of the air conditioner use behaviors of different SPT modes on IAQ and occupants’ IAQ perception and assess their implications for health.
(4) Clarify the mechanisms by which different SPTs affect health.

2. Methods

This study was conducted during the summer (July–August) in Jiaozuo—a typical city in the cold climate regions of China (113°4′ E–113°26′ E, 35°10′ N–35°21′ N) [33]. By integrating the dual methodological strengths of experimental research and field investigation, we systematically examined the health impacts of thermal exposure history and air conditioner use behaviors under different SPT modes. The measured daily mean outdoor air temperature during the research period, obtained using a PC-4 Automatic Meteorological Station (manufactured by Jinzhou Sunshine Meteorological Technology Company Limited, located in Jinzhou, China; test content: −40–70 °C; accuracy: ±0.1 °C) deployed on the rooftop of the building housing the laboratory (3rd floor) in Jiaozuo City, reached 27.2–32.8 °C. The research framework comprised two components. The experimental part focused on the continuous physiological measurement, conducting an in-depth analysis of thermal history differences under different SPT modes and their effects on thermoregulatory capacity. The field investigation focused on the differences in air conditioner use behaviors under different SPT modes and the impact of these differences on indoor air quality and perception and other health factors. Written informed consent from all participants was obtained before the study.

2.1. Experimental Scheme

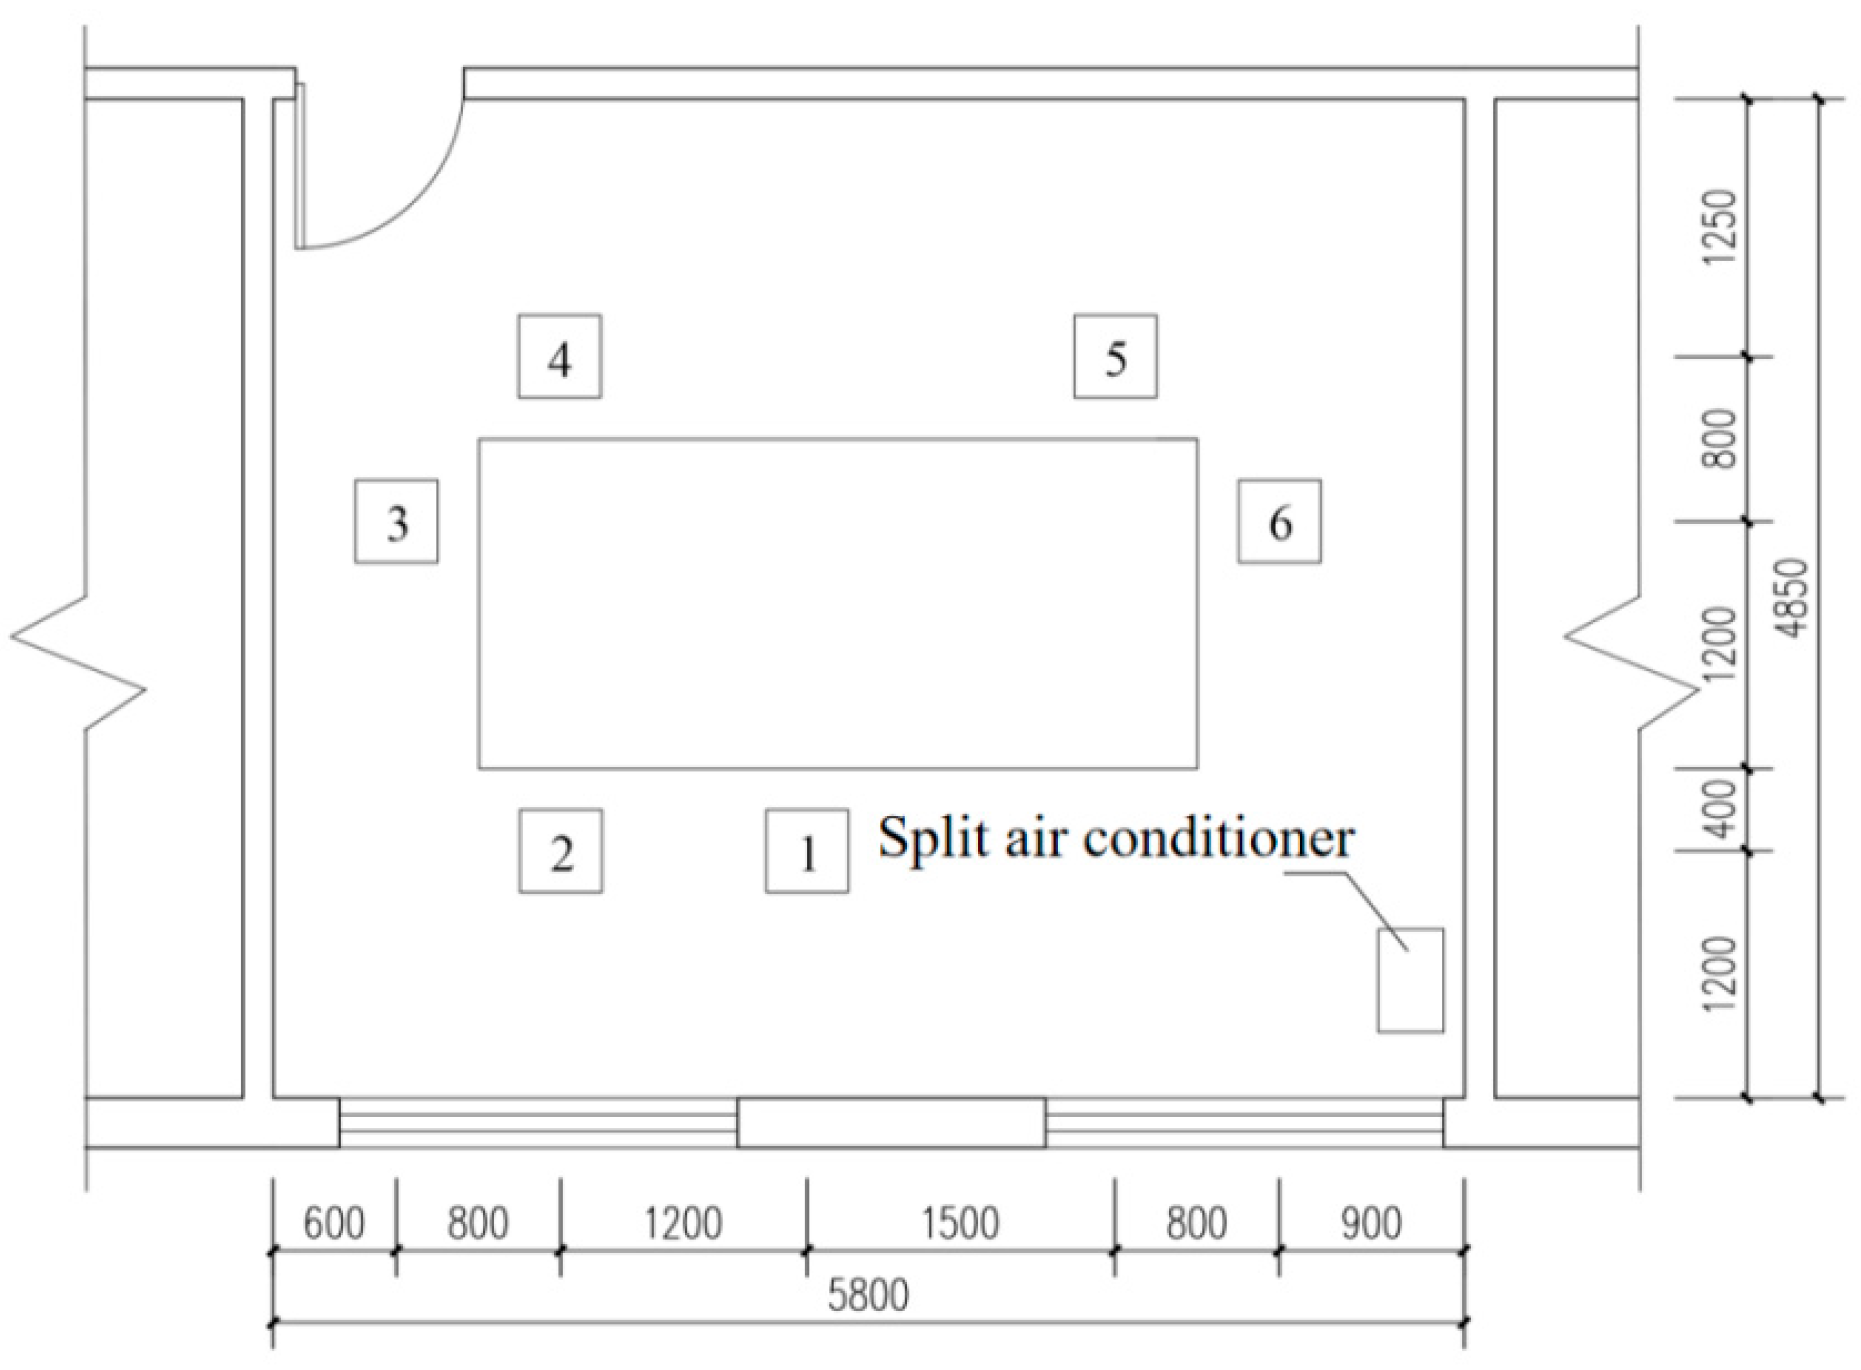
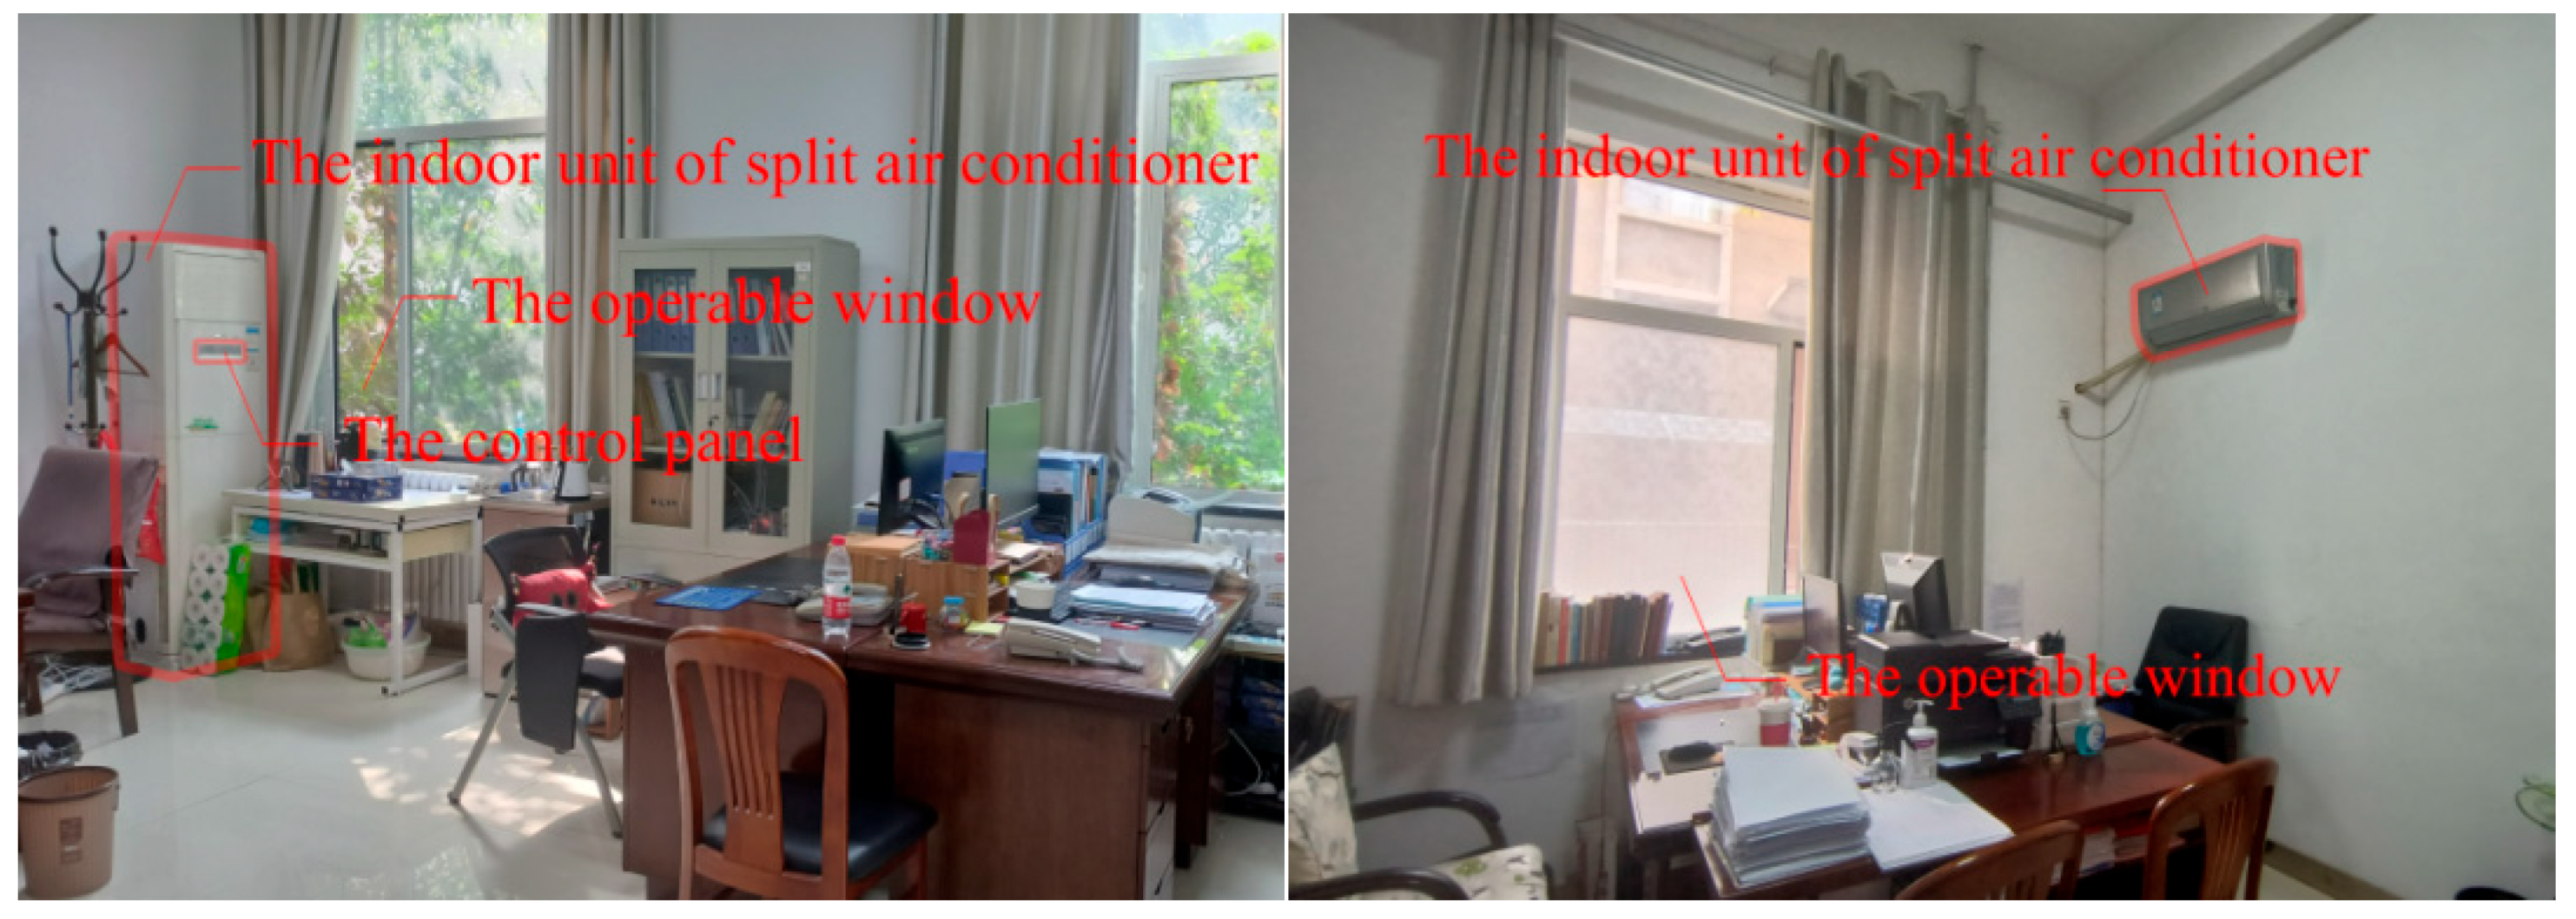
2.1.1. Experimental Room

The experiment was conducted in a room with a split air conditioner (Figure 1). The building structure is the local common brick and concrete structure. During the experiment, the windows were closed to keep the room well sealed to avoid air exchange through the windows.

2.1.2. Subject Information

This study determined that the minimum sample size was 12 participants through a priori power analysis using G*Power 3.1 [34]. Accordingly, 12 subjects were ultimately recruited. The basic information of the subjects is shown in Table 1. All participants were in good physical condition, had resided in Jiaozuo for a minimum of one year, and had adapted well to the local climate. Based on an empirical investigation of split air-conditioned office buildings in Jiaozuo, the proportion of summer clothing insulation in the 0.3–0.4 clo range reached a peak [3]. To facilitate skin temperature monitoring, subjects were required to uniformly wear underwear, short-sleeved shirts, shorts, and slippers and use wooden office chairs (with an equivalent additional thermal resistance of 0.1 clo). The total clothing insulation of 0.32 clo was derived by summing the intrinsic thermal resistances of individual garments (e.g., underwear, shirts, shorts) and the wooden office chair as specified in ASHRAE Standard 55-2023 (Section 2.1.2, Tables 5-3 and 5-4) [35], as shown in Figure 2. During the experiment, all subjects maintained a sedentary state and could read books or browse electronic products sitting still. According to ASHRAE 55-2023 (see Figure 3), the metabolic rate was estimated to be 1.0 met [35].

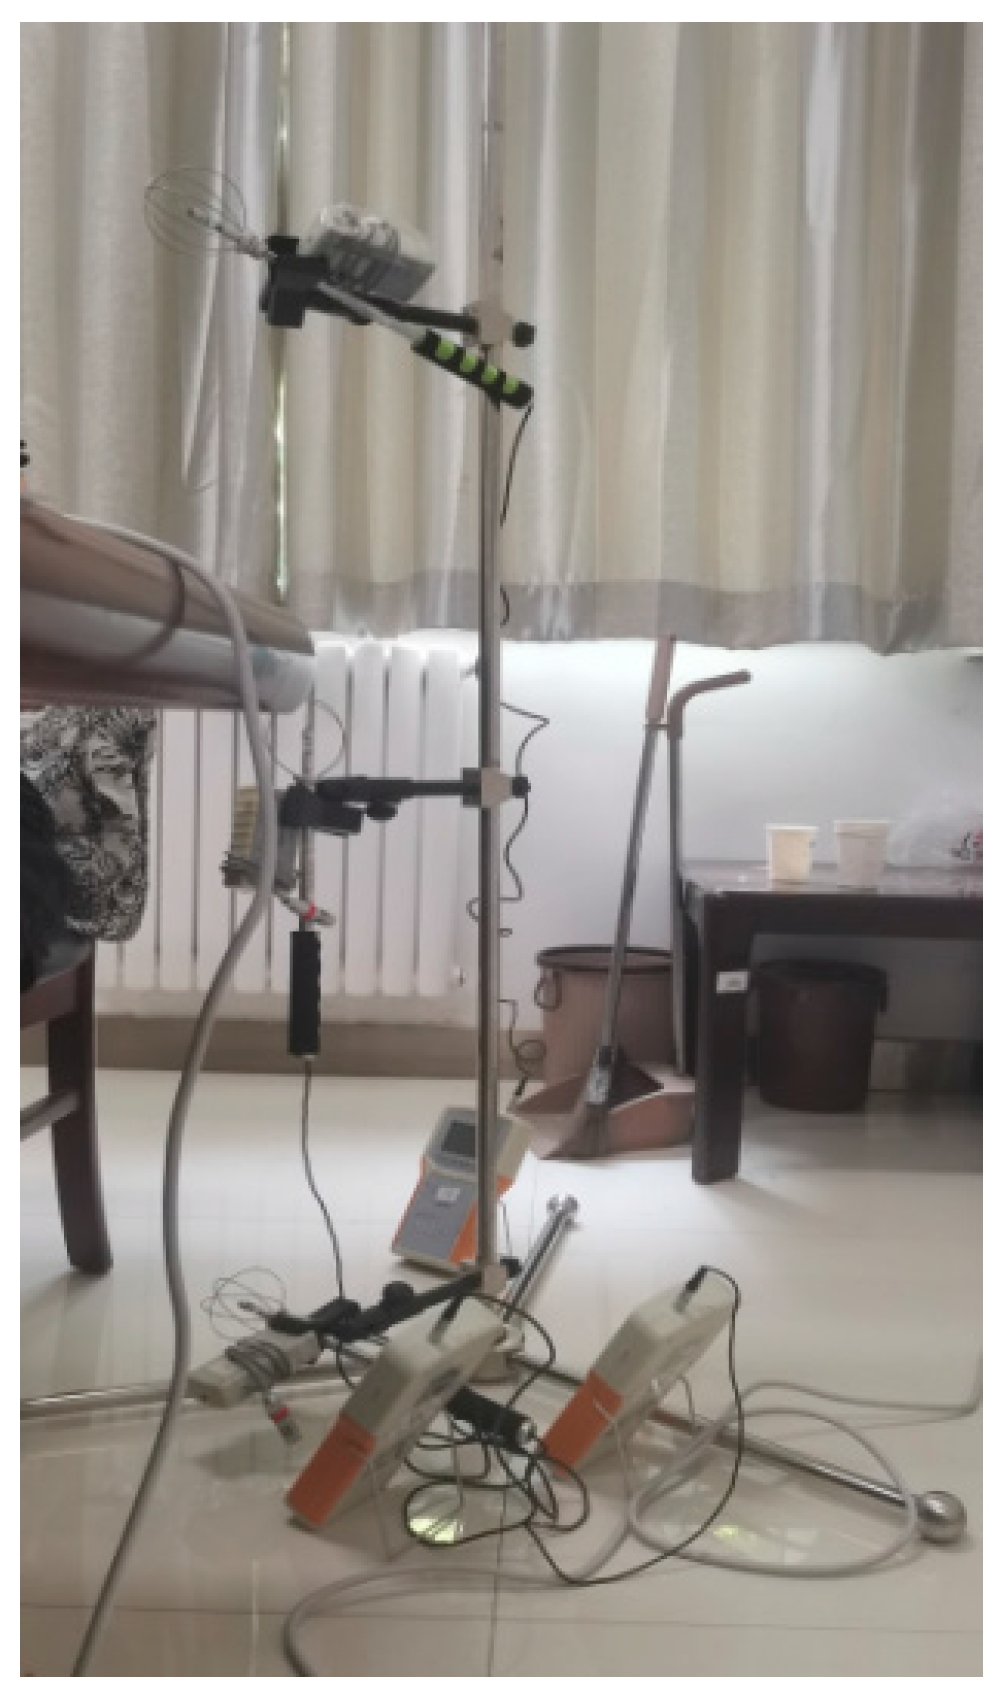
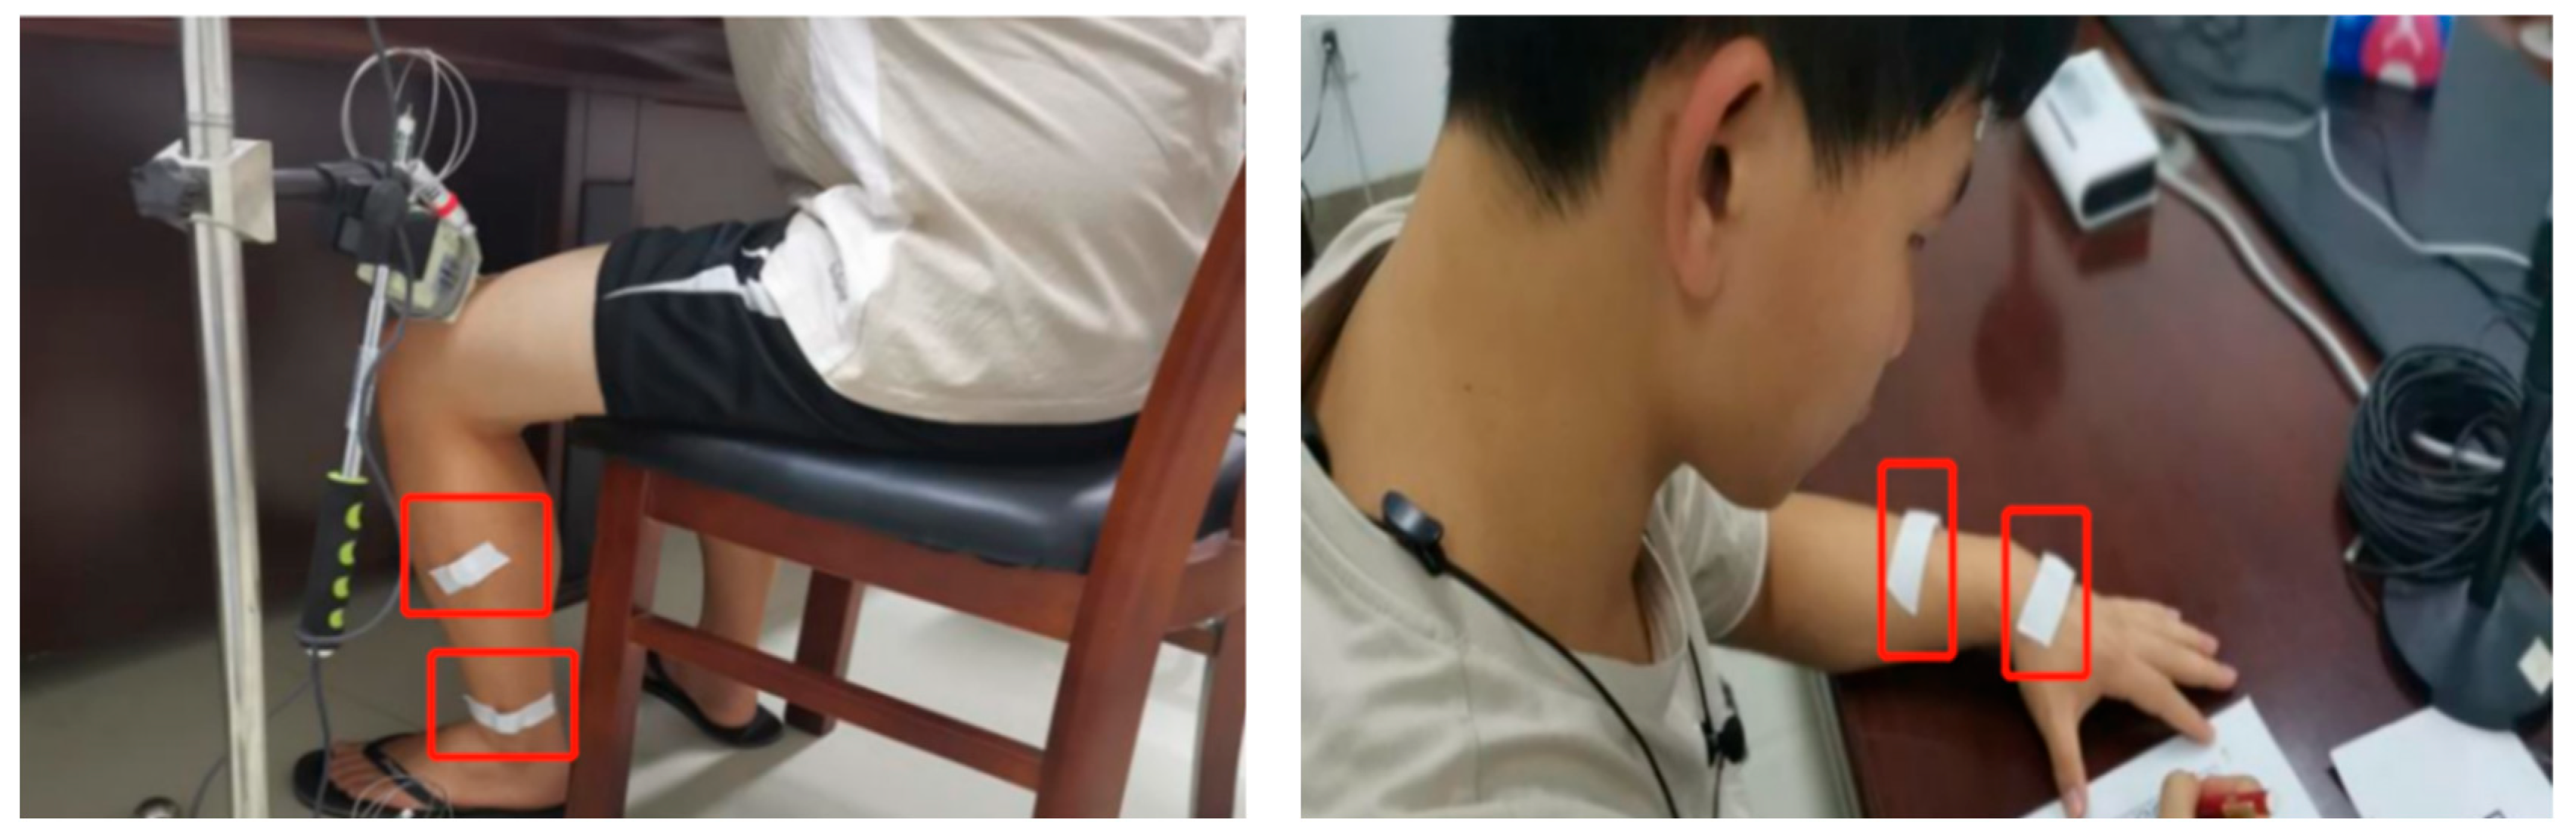
2.1.3. Test Content and Instrument

Environmental Parameter Measurement
The measured environmental parameters mainly include indoor and outdoor thermal environments and CO2 concentration. A total of 6 measuring points were arranged horizontally, and 3 measuring points (0.1 m, 0.6 m, 1.1 m) were arranged vertically (Figure 4). According to ISO 7726 [36], the mean thermal environment was calculated with the weights of 0.25, 0.5, and 0.25 for the thermal environment at the heights of 0.1 m, 0.6 m, and 1.1 m. The indoor thermal environment parameters, including the indoor air temperature (Ta), the temperature of the black globe (Tg), relative humidity (RHin), and air velocity (Va), were continuously monitored by instruments at each measuring point. Specific information about the instruments and the testing scenarios are shown in Table 2 and Figure 4, respectively.
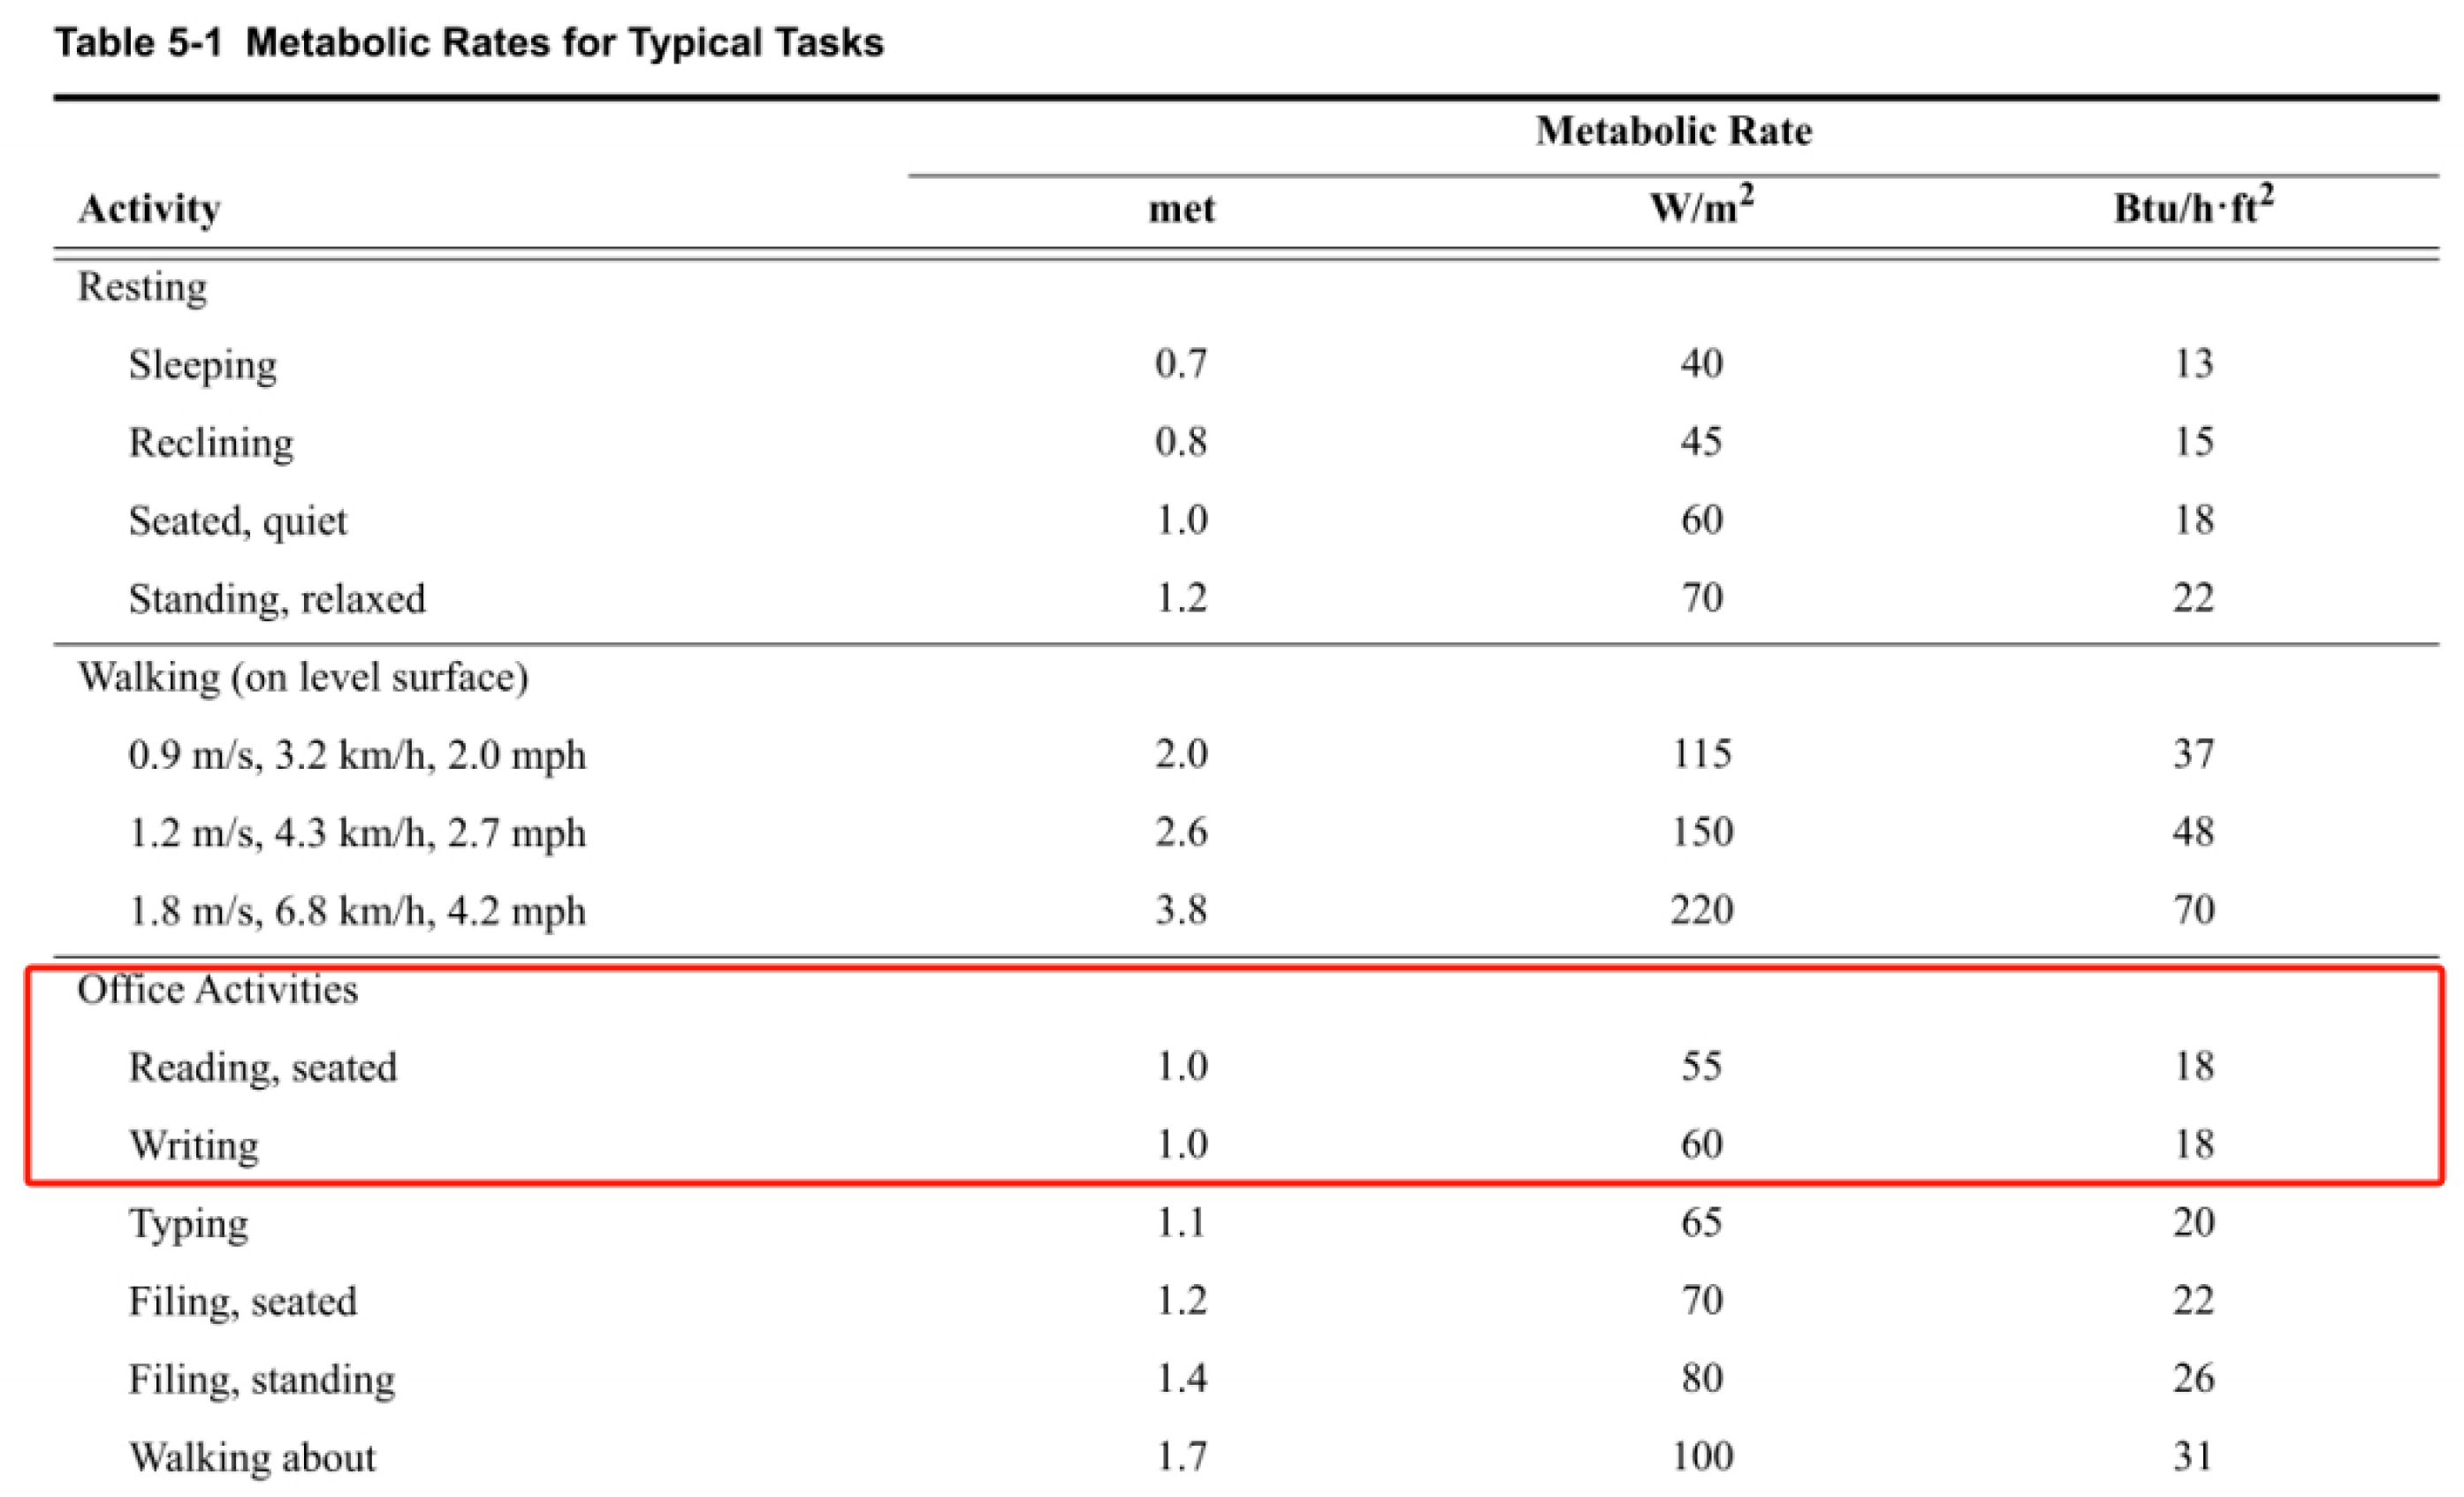
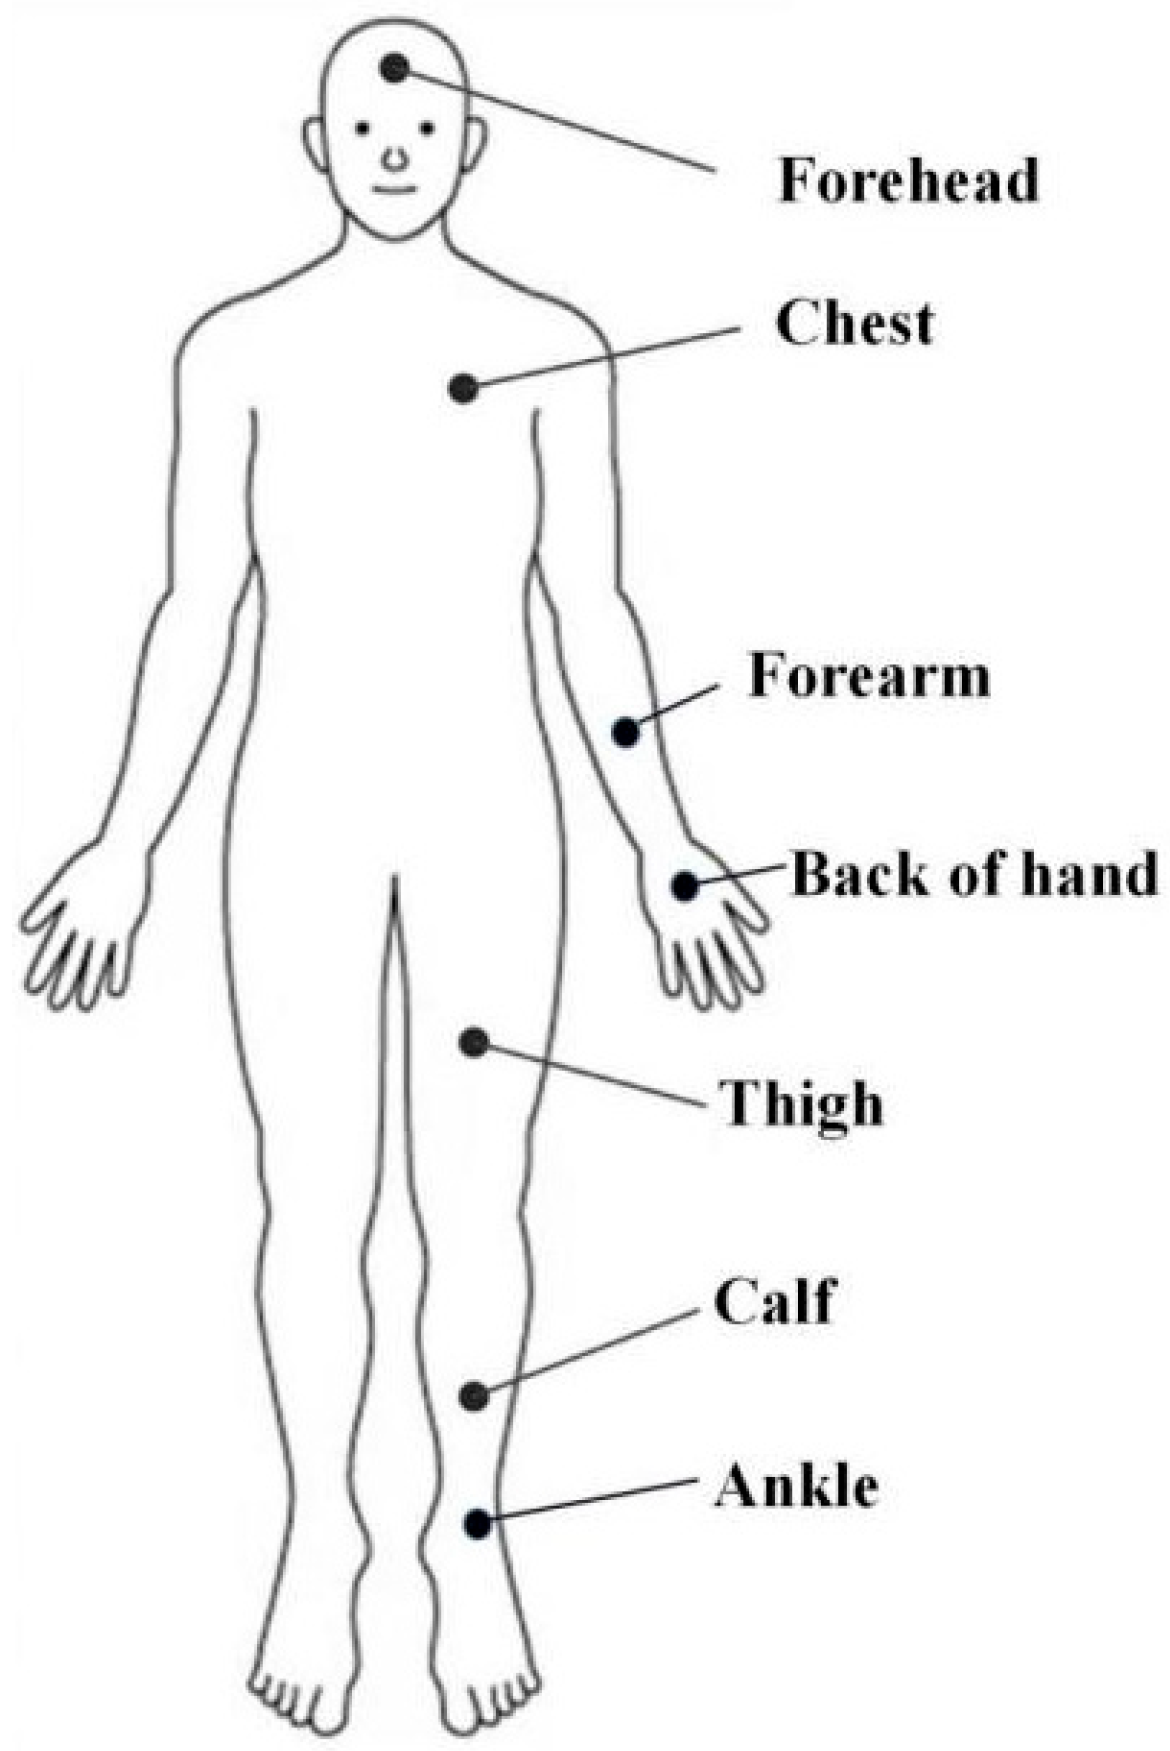
Physiological Parameter Measurement
When stimulated by cold, peripheral capillary constriction, decreased blood flow to reduce heat dissipation, and decreased skin temperature [37,38,39]. Accordingly, the main physiological parameter measured was skin temperature ( T s k ). Considering the rationality and ease of measurement, the seven-point method (Figure 5) was adopted to calculate the mean skin temperature ( M T s k ) [40,41]. The calculation formula is shown in Equation (1). The temperature recorder was used to continuously monitor the skin temperature of each part of the subjects. Table 2 and Figure 6 show the specific information about the physiological parameter measurement instruments and the measurement scenarios, respectively.
M T s k = 0.07 T f o r e h e a d + 0.35 T c h e s t + 0.19 T t h i g h + 0.14 T f o r e a r m + 0.05 T b a c k   o f   h a n d + 0.13 T c a l f + 0.07 T a n k l e

2.1.4. Experimental Design

Experimental Conditions
The experimental period was scheduled from 09:30 to 11:10 and 14:30 to 16:10. Based on the Predicted Mean Vote (PMV) model, two SPT conditions were set 26 °C (neutral thermal sensation) and 20 °C (cold sensation) [35], corresponding to the high SPT (H group) and low SPT (L group). A simulated six-workstation office environment was employed. Each subject participated in six experiments in total. Each single experiment involved 4 subjects and 2 staff members, located at Stations 1–6, respectively. Environmental monitoring devices were deployed at each workstation to record real-time thermal environment parameters near the subjects, with the layout detailed in Figure 4.
Experimental Procedure
The whole experiment lasted 1 h and 40 min (Figure 7). The first stage was the preparation stage, and the indoor air temperature was about 30.5 °C. The subjects need to adapt to this environment for 30 min to eliminate the previous thermal experience [42]. The second stage was the air conditioner operation stage, which lasted for a total of 70 min (0 min to turn on the air conditioner). The SPT information has been occluded, the subjects were unaware of the SPT. The sick building syndrome (SBS) questionnaires were collected every 10 min. At the same time, the environmental parameters and the skin temperature of the subjects were continuously measured, and the recording interval was 1 min/time.

2.2. Field Investigation Scheme

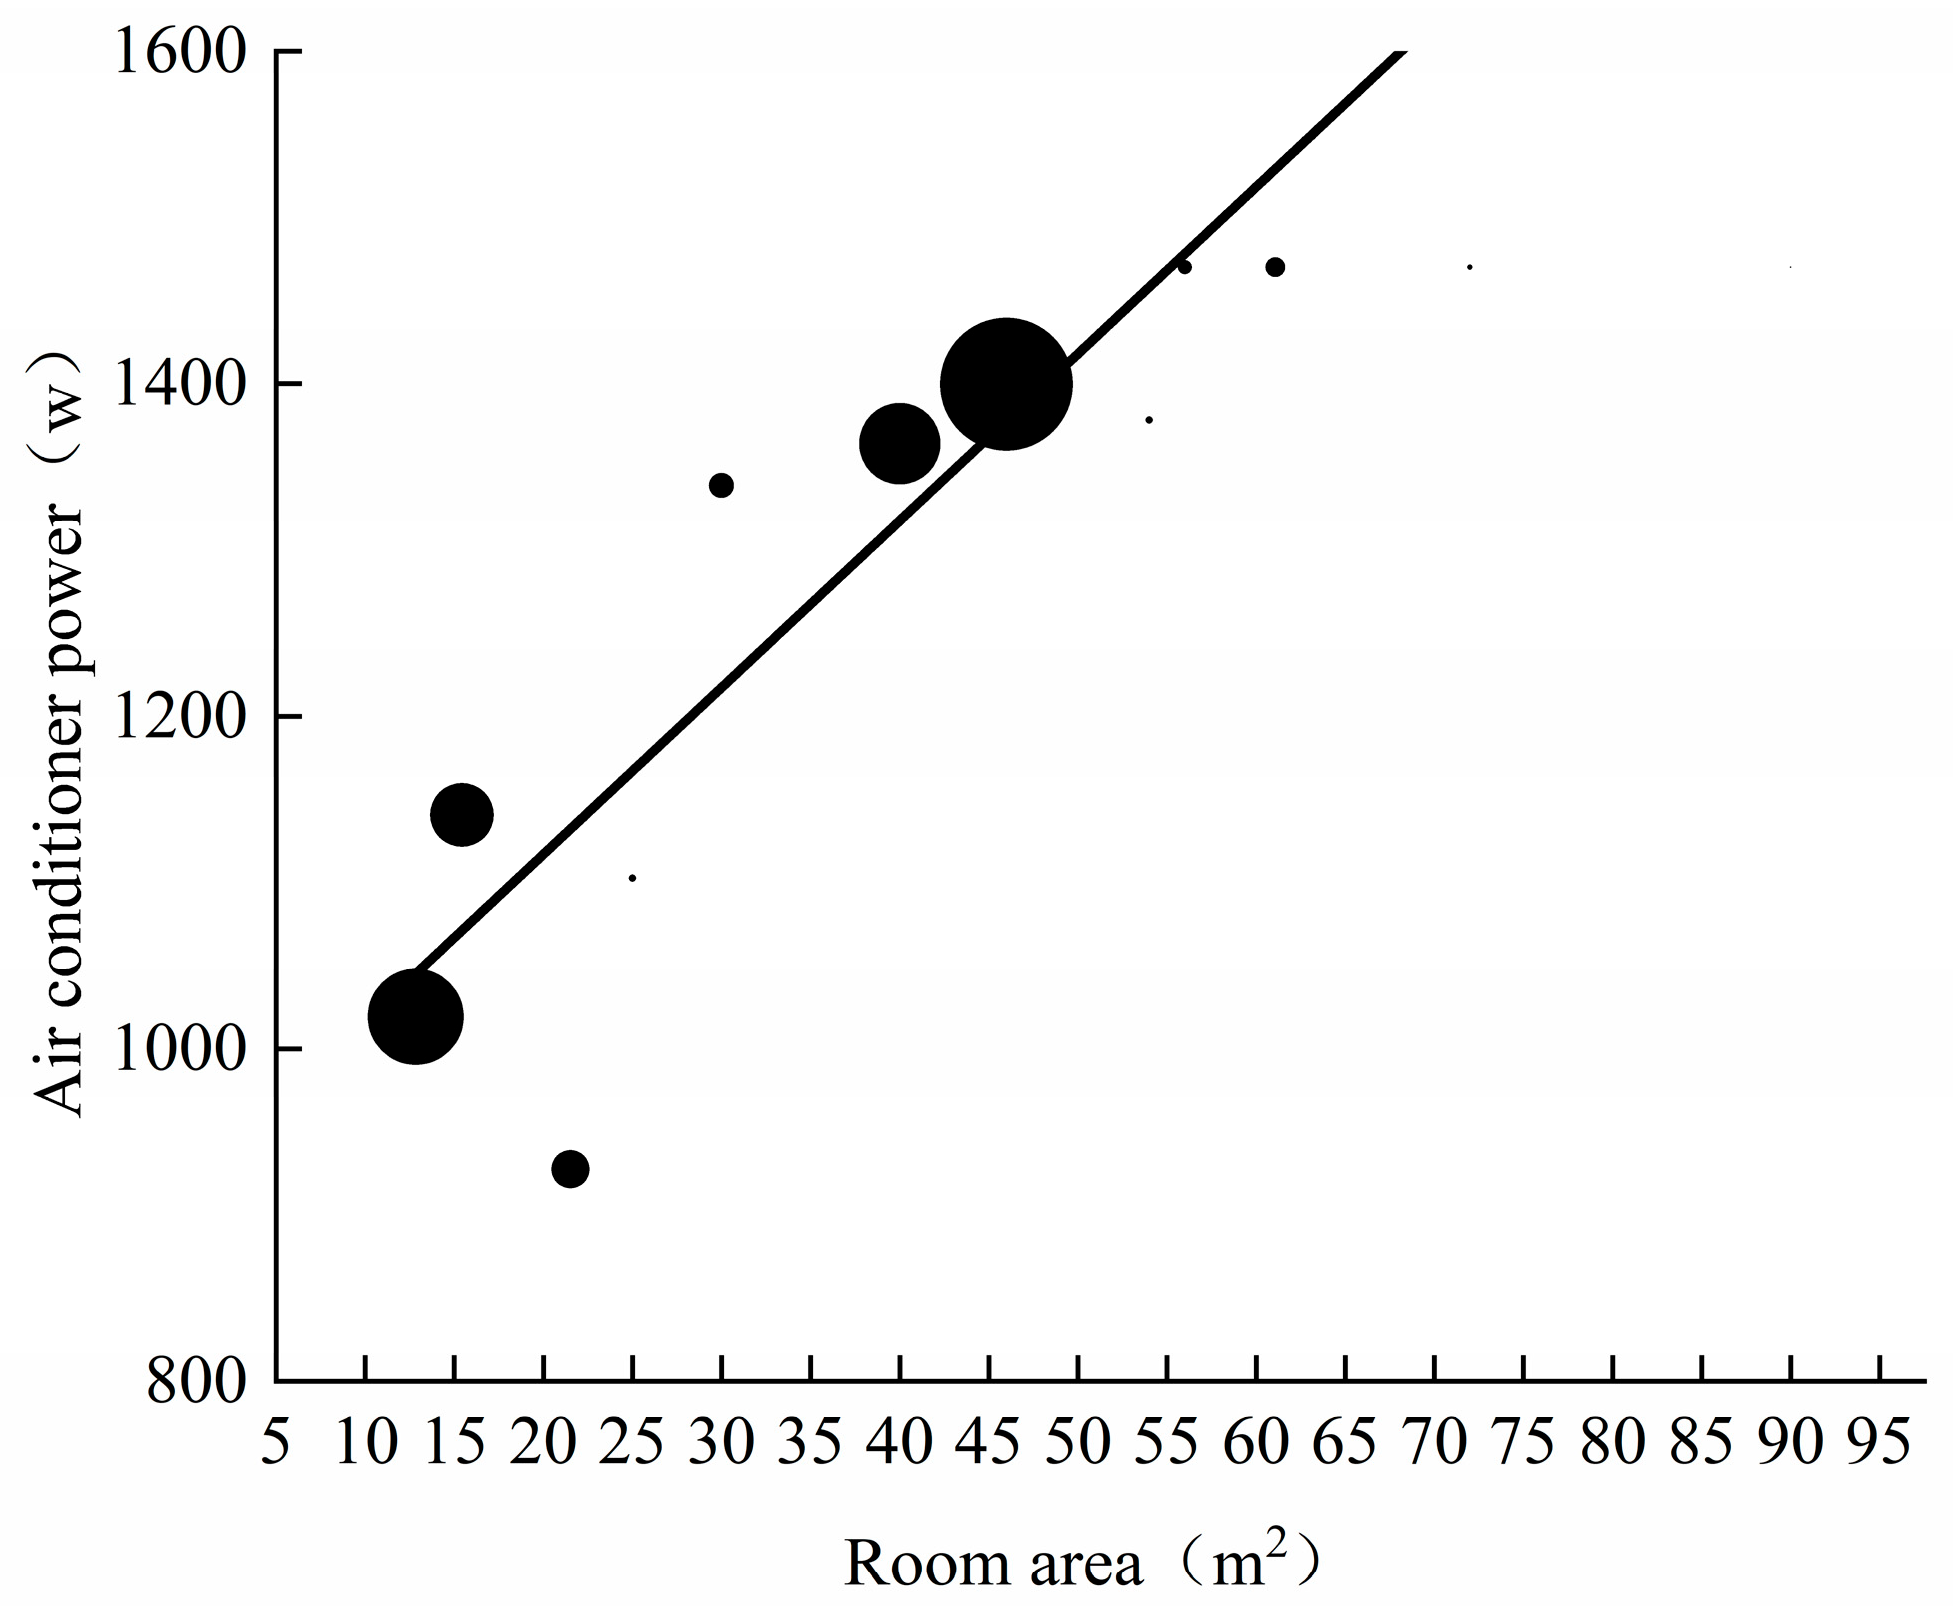
2.2.1. Buildings and Subjects

The field investigation selected office buildings with brick and concrete structures, openable doors and windows, and split air conditioners, as shown in Figure 8. The relationship between the investigated office area and air conditioner power is shown in Figure 9. To ensure the indoor cooling effect, indoor area and air conditioner power are positively correlated (p < 0.001, R2 = 0.810).
Based on a preset effect size (Cohen’s *d* = 0.5), significance level (α = 0.05), and statistical power (1 − β = 0.90), while accounting for the experimental design conditions, the calculated minimum sample size was 172 participants [34]. Accordingly, 430 subjects were ultimately recruited. The basic information about the subjects is shown in Table 3. The health status of the subjects was collected before the measurement. The employees who were sick or had drank were not allowed to participate in this survey. All these subjects had been employed in the office building for more than one year. A cross-sectional study was adopted. The subjects can freely open and close the doors and windows and fully control the operation of the split air conditioners. The cooling SPT range of split air conditioners in China is 16–30 °C. Additionally, the indoor personnel do not have to pay for the electricity bill.

2.2.2. Investigation Content and Instruments

This study consisted of two main parts. The first part was a questionnaire survey, and the second part was objective measurement. The questionnaire was mainly composed of three parts. The first part mainly asked the subjects for anthropometric information, such as weight, age, clothing type, gender, height, etc. In the second part, subjects were asked to provide their perceptions of indoor air quality according to the 7-point scale of air quality satisfaction (−3 = extremely unsatisfied, −2 = unsatisfied, −1 = somewhat unsatisfied, 0 = neutral, 1 = somewhat satisfied, 2 = satisfied, 3 = extremely satisfied). The third part was about air conditioner use behaviors, which was used to collect subjects’ air conditioner SPT, air conditioner use mode, date, and time.
The second major part was the measurement of indoor air pollutant concentrations and physical parameters of the thermal environment. The monitored indoor air pollutants comprised CO2, formaldehyde, and PM2.5. The information about indoor and outdoor thermal environment measurement parameters and instruments (all complying with the requirements of the ISO 7726 standard [36]) is provided in Table 4. The layout methods of measuring points for the indoor thermal environment and indoor air parameters were all based on the ASHRAE manual [43]. According to the requirements of the ASHRAE manual for seated subjects, the indoor thermal environment and air quality parameters at a height of 0.6 m were measured and recorded. When the subjects responded to a paper questionnaire that was handed out, the indoor thermal environment and air quality parameters were measured at the same time with the instruments placed near the subjects. To eliminate the influence of time, the survey time was from 8:00 to 22:00, covering all the working hours of office buildings.

2.2.3. Data Collection

Based on participants’ self-reported SPTs and stratifying against the minimum permissible cooling SPT stipulated in public buildings, the field investigation data were categorized into two groups. The data were divided into two groups based on SPT: the H group (SPT ≥ 26 °C, mean = 27 °C) and the L group (SPT < 26 °C, mean = 22 °C). The H and L groups demonstrated comparable mean outdoor air temperatures (32.7 °C vs. 33.0 °C; p = 0.255), confirming equivalent outdoor thermal histories between both subject groups.

2.3. Data Processing

According to the ASHRAE 55 standard [35], the operative temperature (To) was calculated to comprehensively consider the effects of indoor air temperature and radiation temperature (see Equations (2) and (3)).
To = A × Ta + (1 − A) × Tr
where Ta is the air temperature (°C), Tr is the mean radiant temperature (°C), and A is a weighting coefficient determined by air velocity (Va): if Va < 0.2 m/s, A = 0.5; if 0.2 m/s ≤ Va ≤ 0.6 m/s, A = 0.6; if Va > 0.6 m/s, and A = 0.7.
Tr = 2.4 × Va0.5 (Ta − Tg) + Tg
where Va is the air velocity (m/s) and Tg is the globe temperature (°C).
Quantitative data processing was conducted leveraging IBM SPSS Statistics (v26.0) for statistical computations and OriginPro 2019 for graphical visualization. To reduce the impact of extreme values on the error of the data analysis, the interval method and the weight method were used to process the data. Independent variables were grouped to calculate their mean values, and relevant dependent variables were analyzed using weighted regression analysis. The weight was determined using the standard coefficient approach. Pearson and Spearman correlation analyses were used to evaluate correlations between data groups. Specifically, Pearson analysis was used for continuous data groups conforming to the normal distribution, while Spearman was used for data groups not conforming to Pearson analysis. Covariance analysis was used to examine the disparity in gradient and intercept among several linear regression lines. If the normal distribution is satisfied and the variance is equal, the difference between the two sets of data in the experiment and the investigation is analyzed by the paired sample t-test and the independent samples t-test, respectively. If the data does not conform to the normal distribution, the Wilcoxon test was used. All of the differences were accepted as significant at a 0.05 level [44].

3. Results

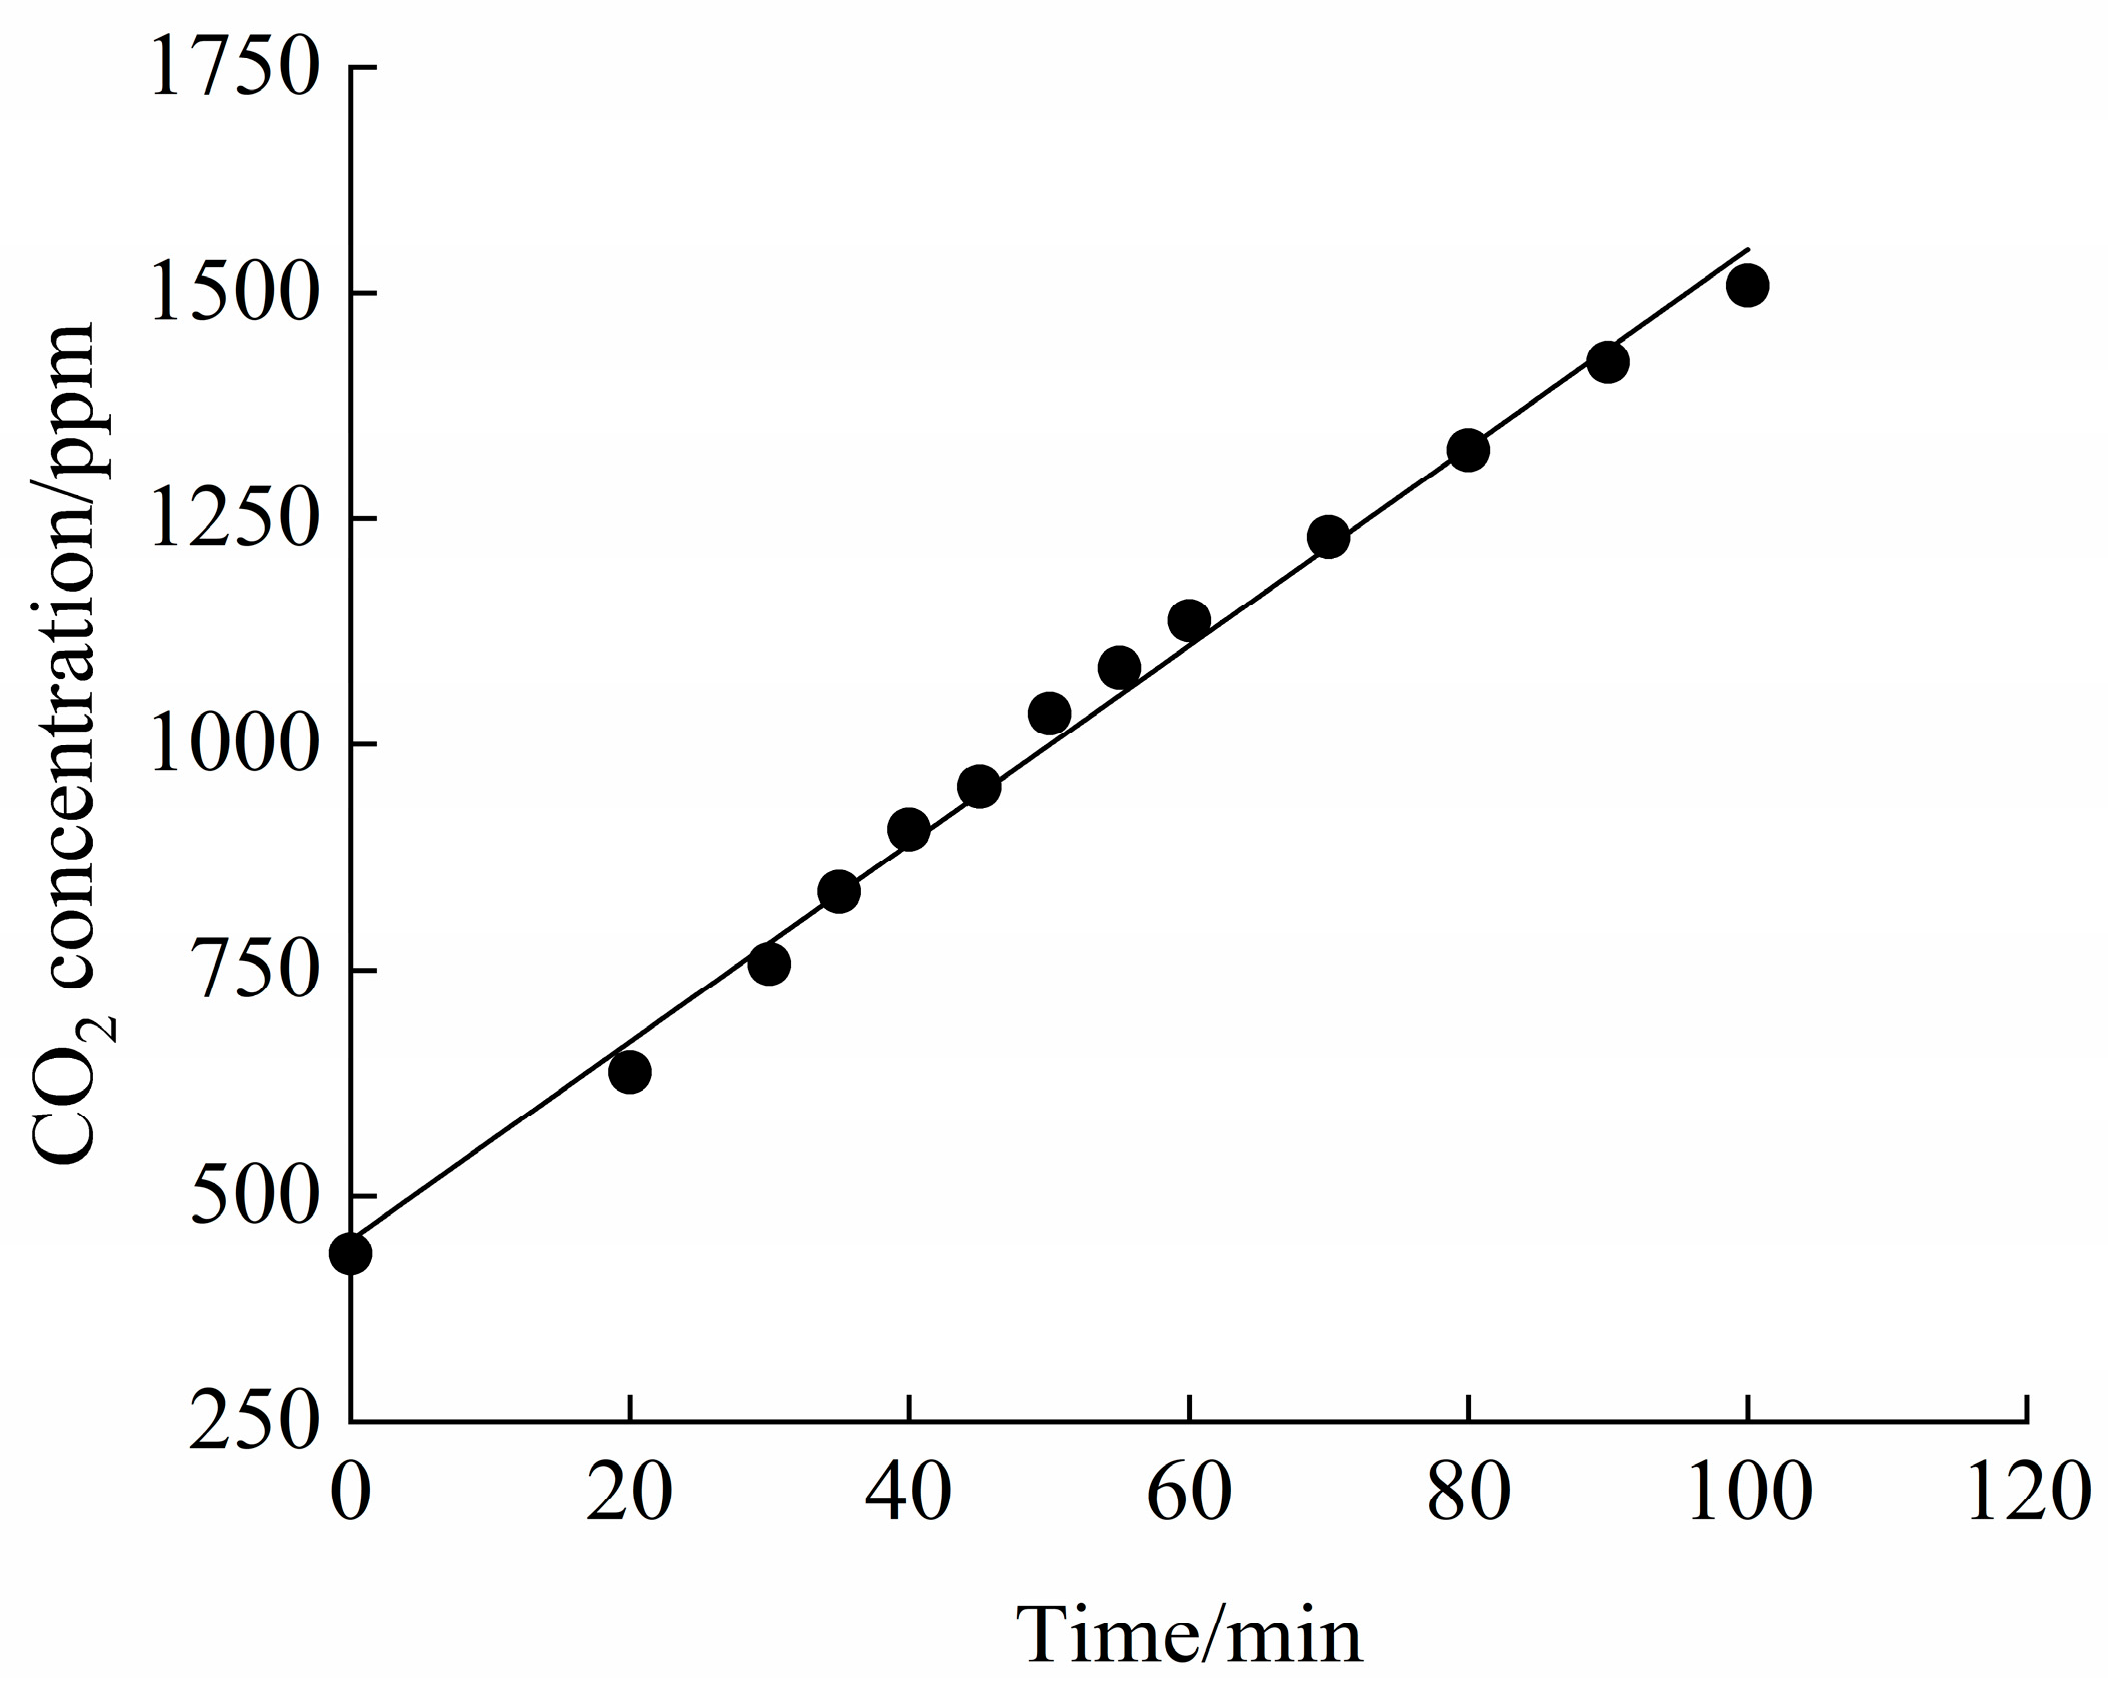
3.1. Experimental Results: Thermal History and Thermal Responses

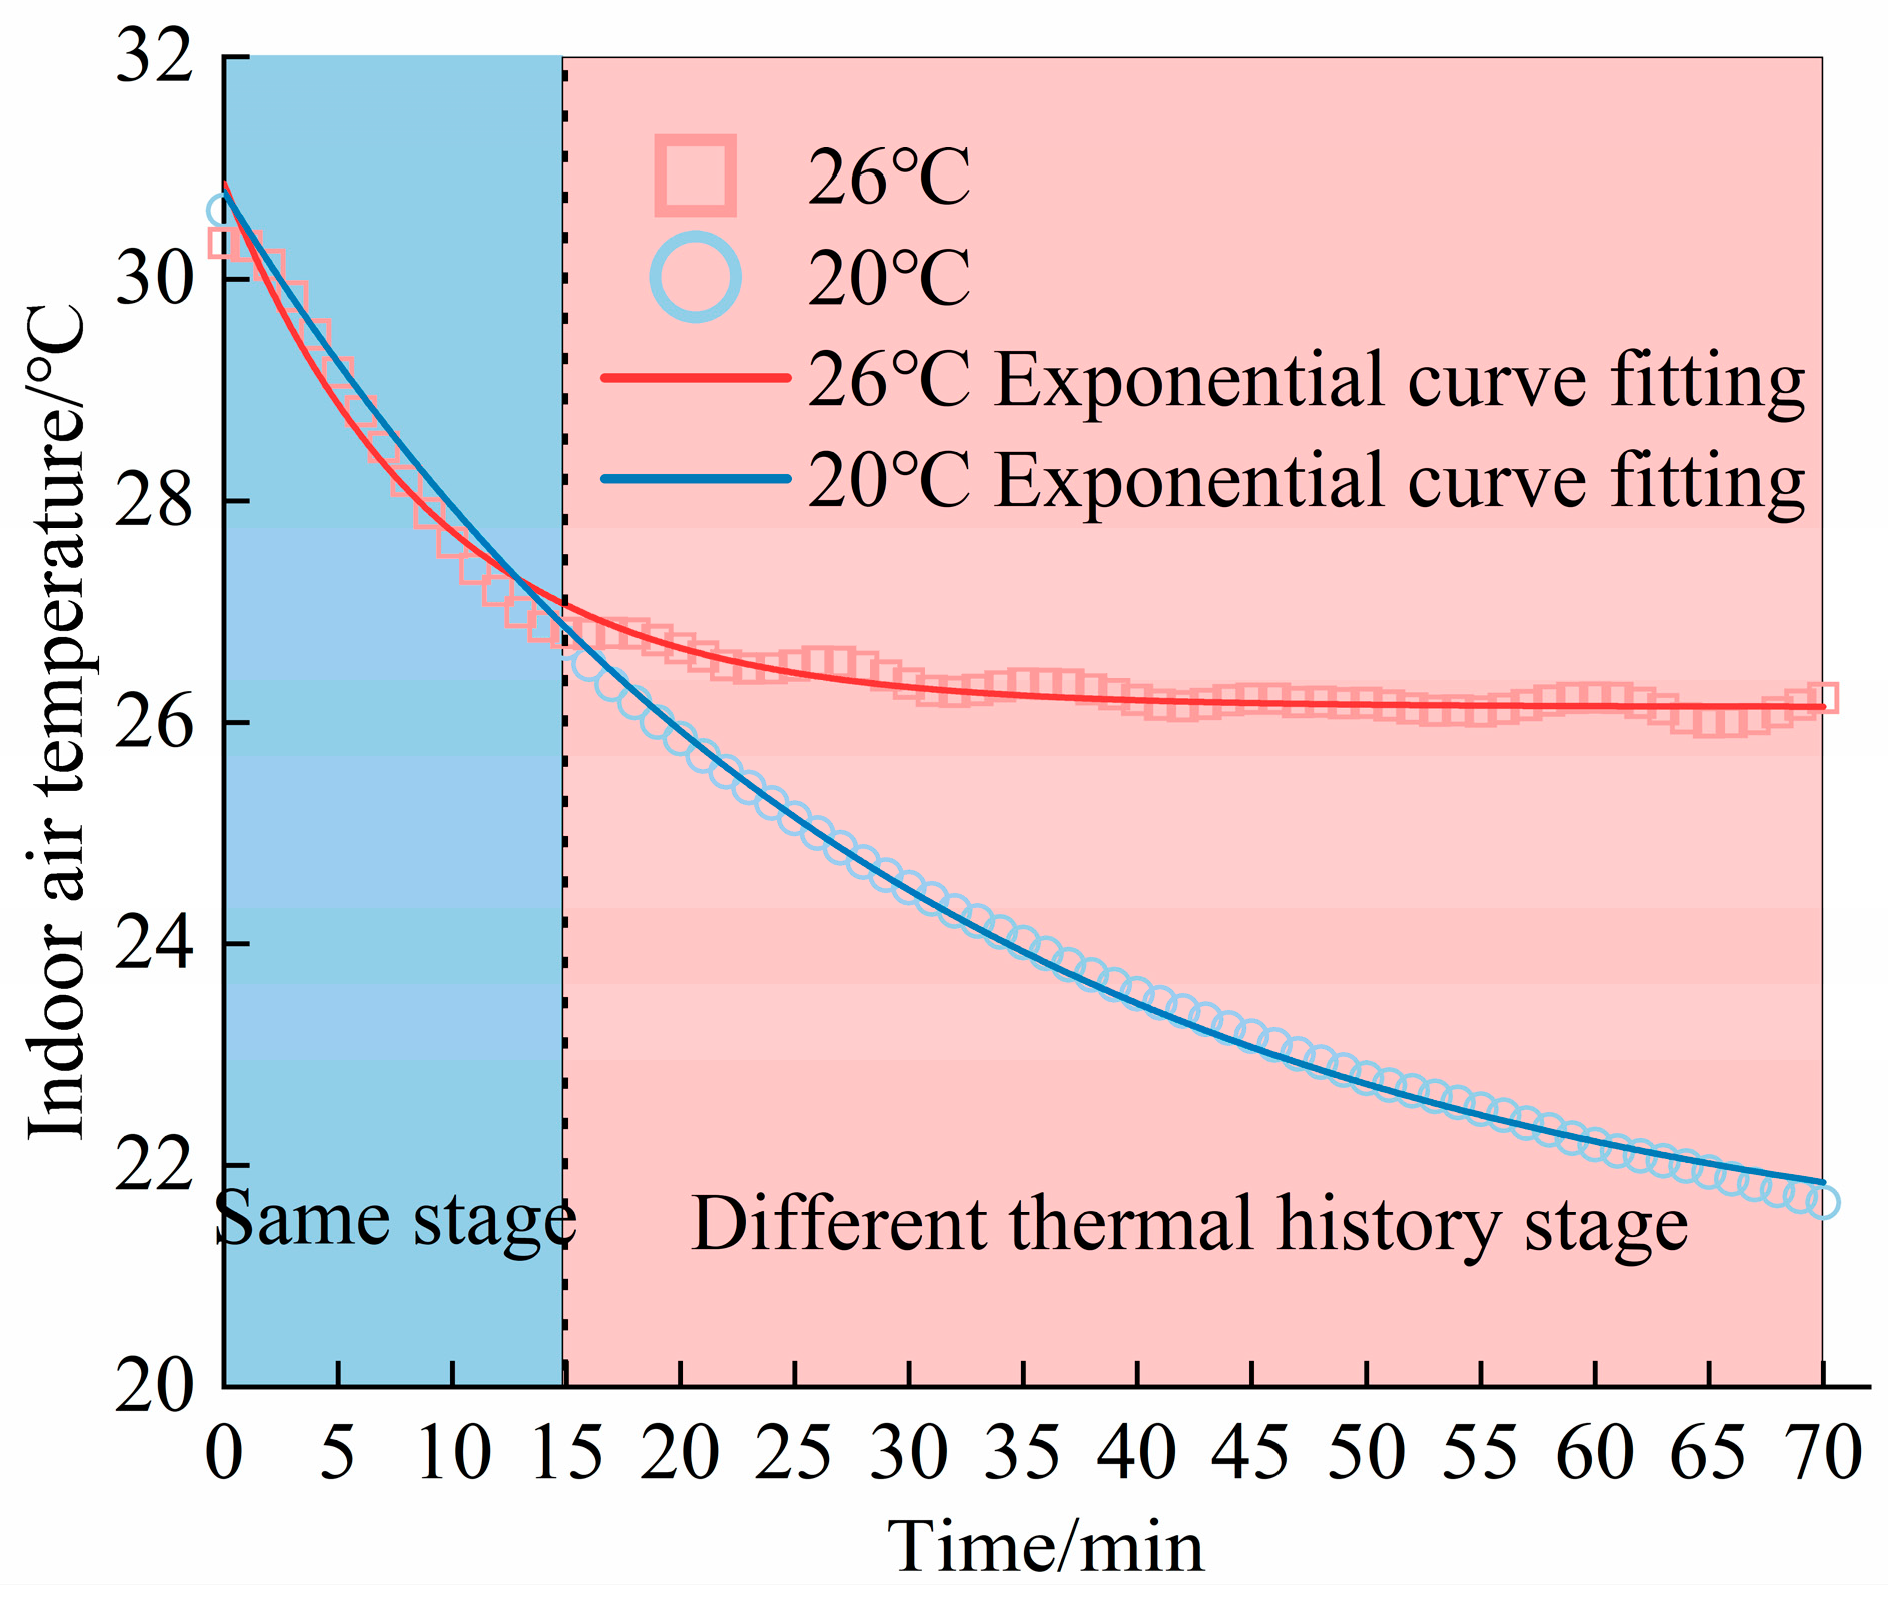
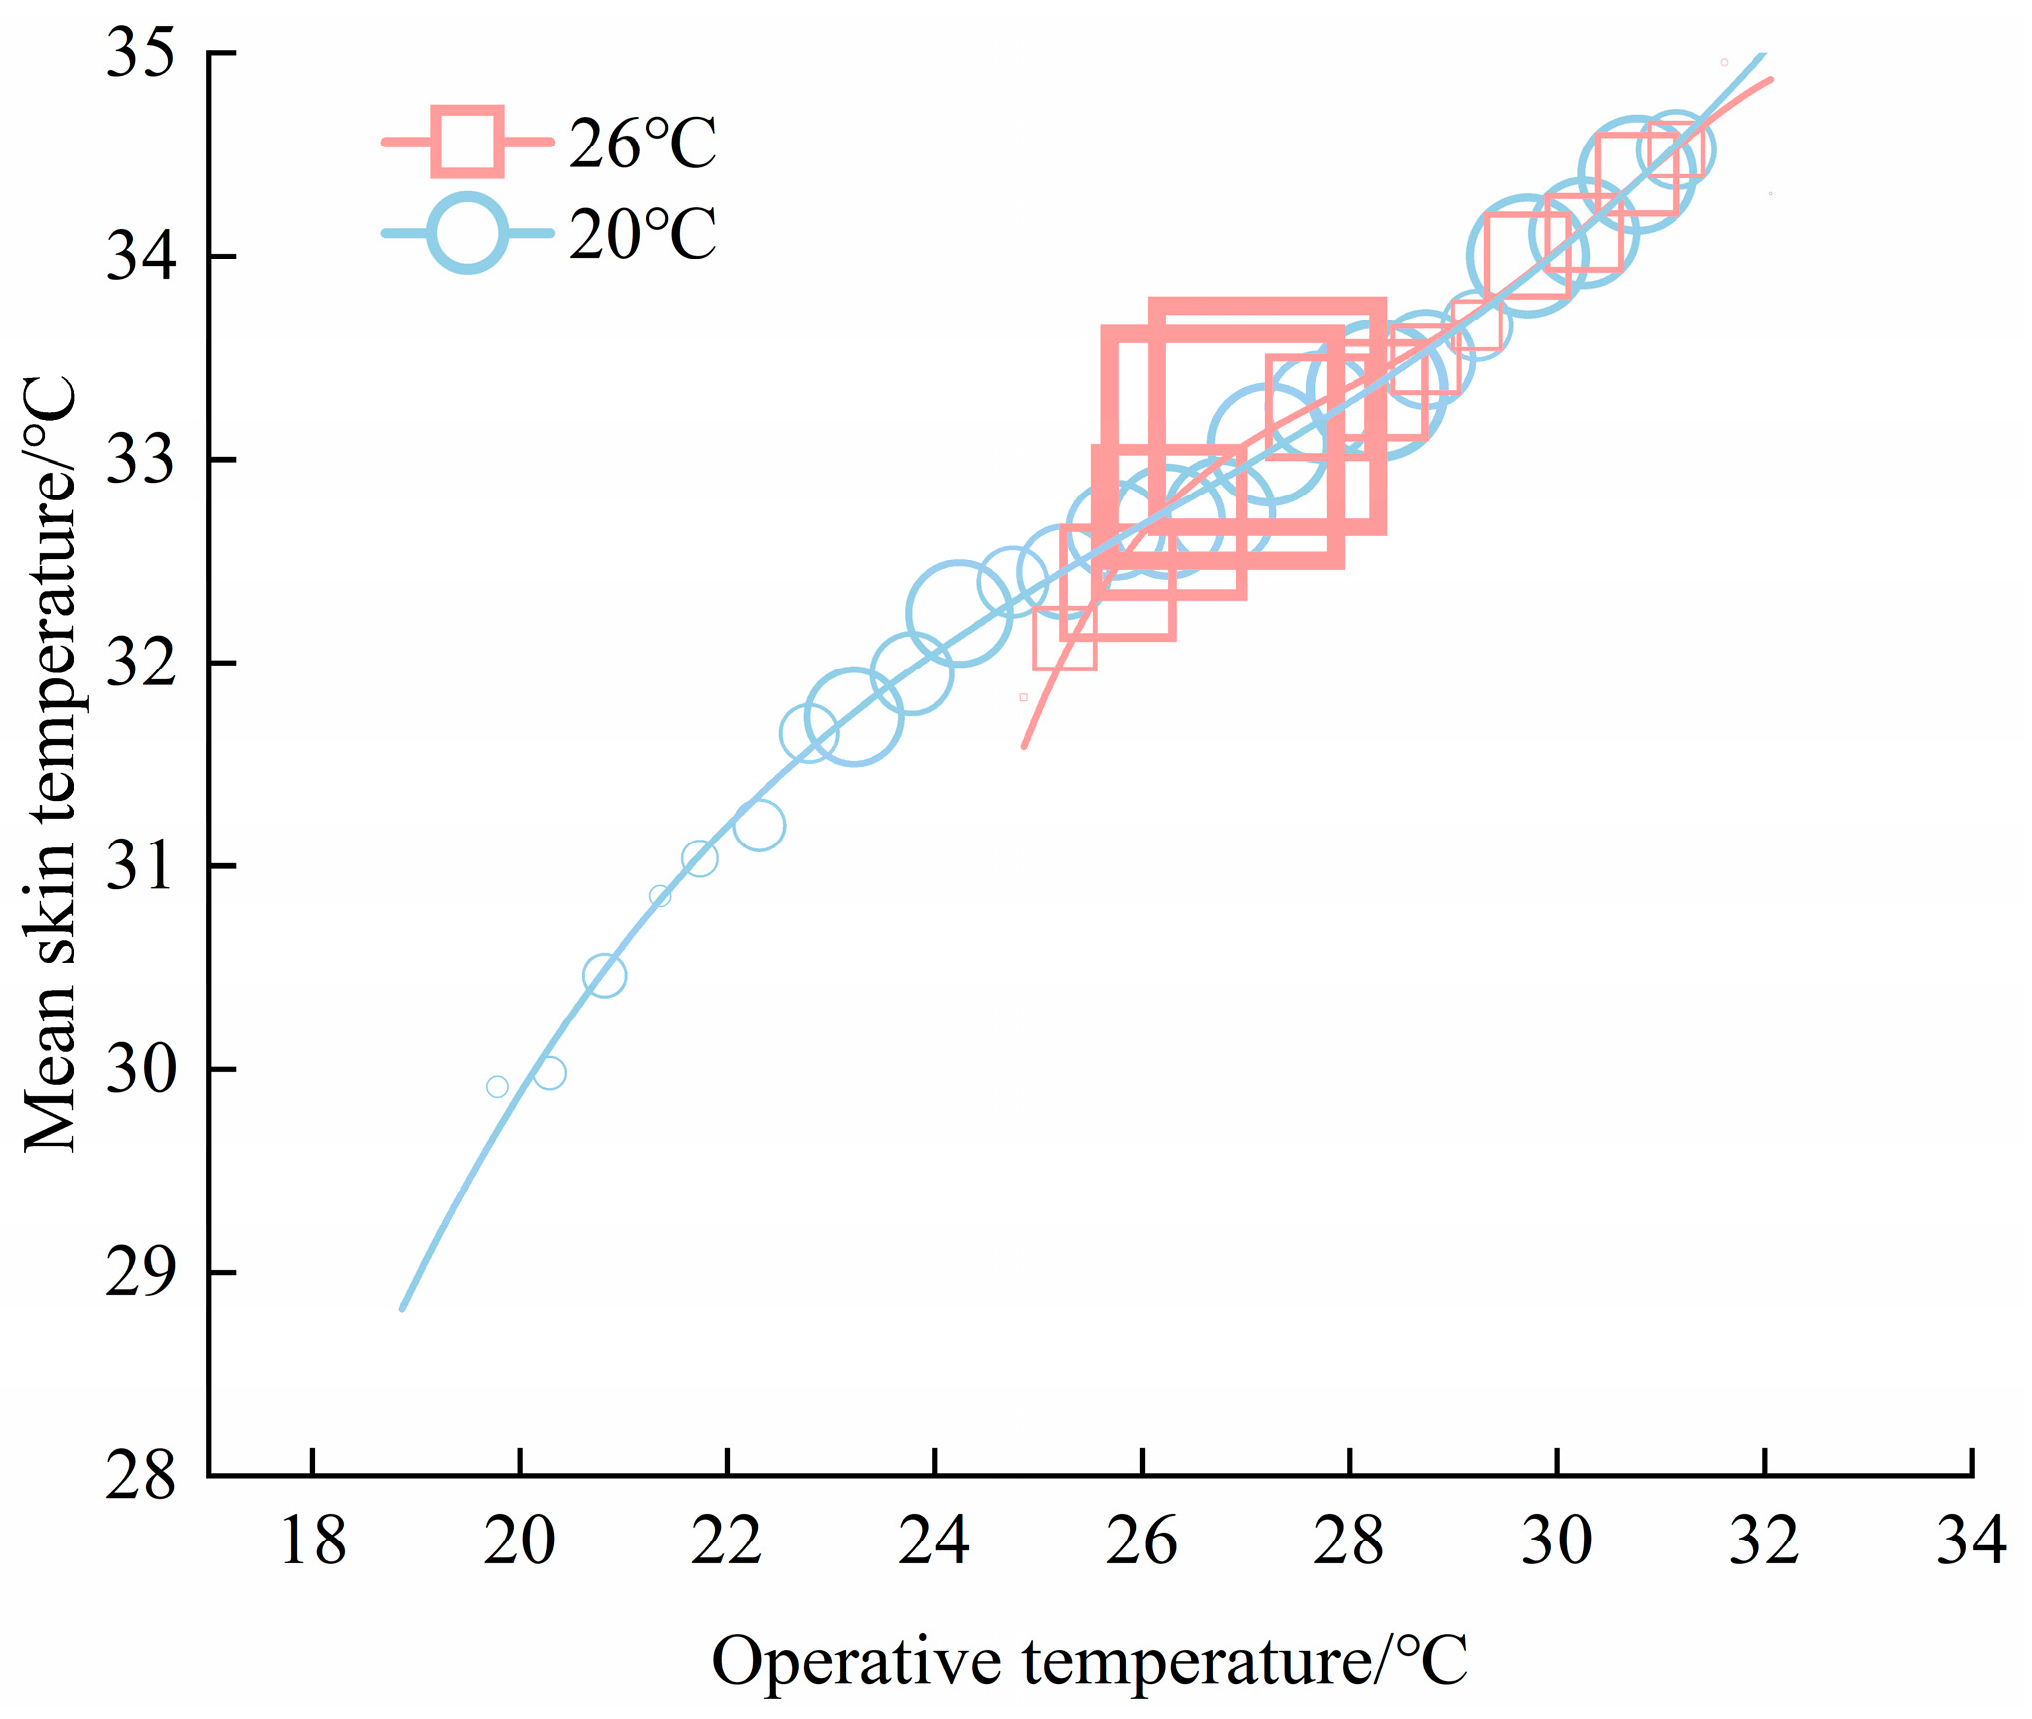
3.1.1. Thermal History

The changes in mean indoor air temperature over time at 26 °C and 20 °C during the experiment are shown in Figure 10. After the air conditioner is turned on, the indoor air temperature decreases rapidly with time and gradually tends to stabilize. Notably, lower SPT resulted in longer stabilization times. The initial mean indoor air temperature was 30.5 °C. Upon activating the air conditioner at 0 min, the temperature dropped rapidly. During the 0–15 min interval, there was no discernible difference in indoor air temperature trends between the two SPT groups. Nevertheless, distinct patterns emerged between 15 and 70 min. At 26 °C, the indoor air temperature reached the preset value and stabilized into a fluctuating steady state, with mean values ranging from 25.9 °C to 26.8 °C. At 20 °C, the indoor air temperature continued to decline exponentially throughout this period, with mean values ranging from 21.6 °C to 26.5 °C. In summary, the thermal history divergence between subjects under 26 °C and 20 °C conditions primarily occurred between 15 and 70 min.

3.1.2. Physiological Responses

Figure 11 shows the regression relationship between mean skin temperature and operative temperature. The mean skin temperature decreased with decreasing operative temperature. When the operative temperature was greater than 26.3 °C, there was no difference in the mean skin temperatures in the two SPTs, whereas when the operative temperature dropped below 26.3 °C, the mean skin temperatures under the 26 °C condition were significantly lower than those under the 20 °C condition at the same operative temperature. It can be seen that the subjects in the 20 °C condition had a physiological adaptation to the cold environment compared to the 26 °C condition, resulting in less vasoconstriction and higher skin temperatures, which is the same phenomenon of a physiological adaptation to the cold environment as found in existing studies [45].
To analyze when physiological adaptation differences occur, first, the mean skin temperature and operative temperature of the two SPTs (no significant difference in the environmental changes in the first 15 min, which were not considered) were analyzed by regression separately. Then, the predicted skin temperature of the 20 °C condition was calculated using the 26 °C equation. Finally, the difference between the actual skin temperature at different times under the 20 °C condition and the predicted skin temperature calculated by the 26 °C equation was tested, and the results are shown in Table 5. Before 30 min, there was no significant difference between the actual and predicted skin temperatures. The 26 °C working condition equation could completely predict the mean skin temperature under the 20 °C condition. However, after 30 min, the predicted skin temperatures calculated by the 26 °C equation were significantly lower than the actual skin temperatures under the 20 °C condition. This indicated that compared with the 26 °C condition, the physiological adaptation time of the subjects in the 20 °C condition to the cold environment was 30 min after the air conditioner was turned on.

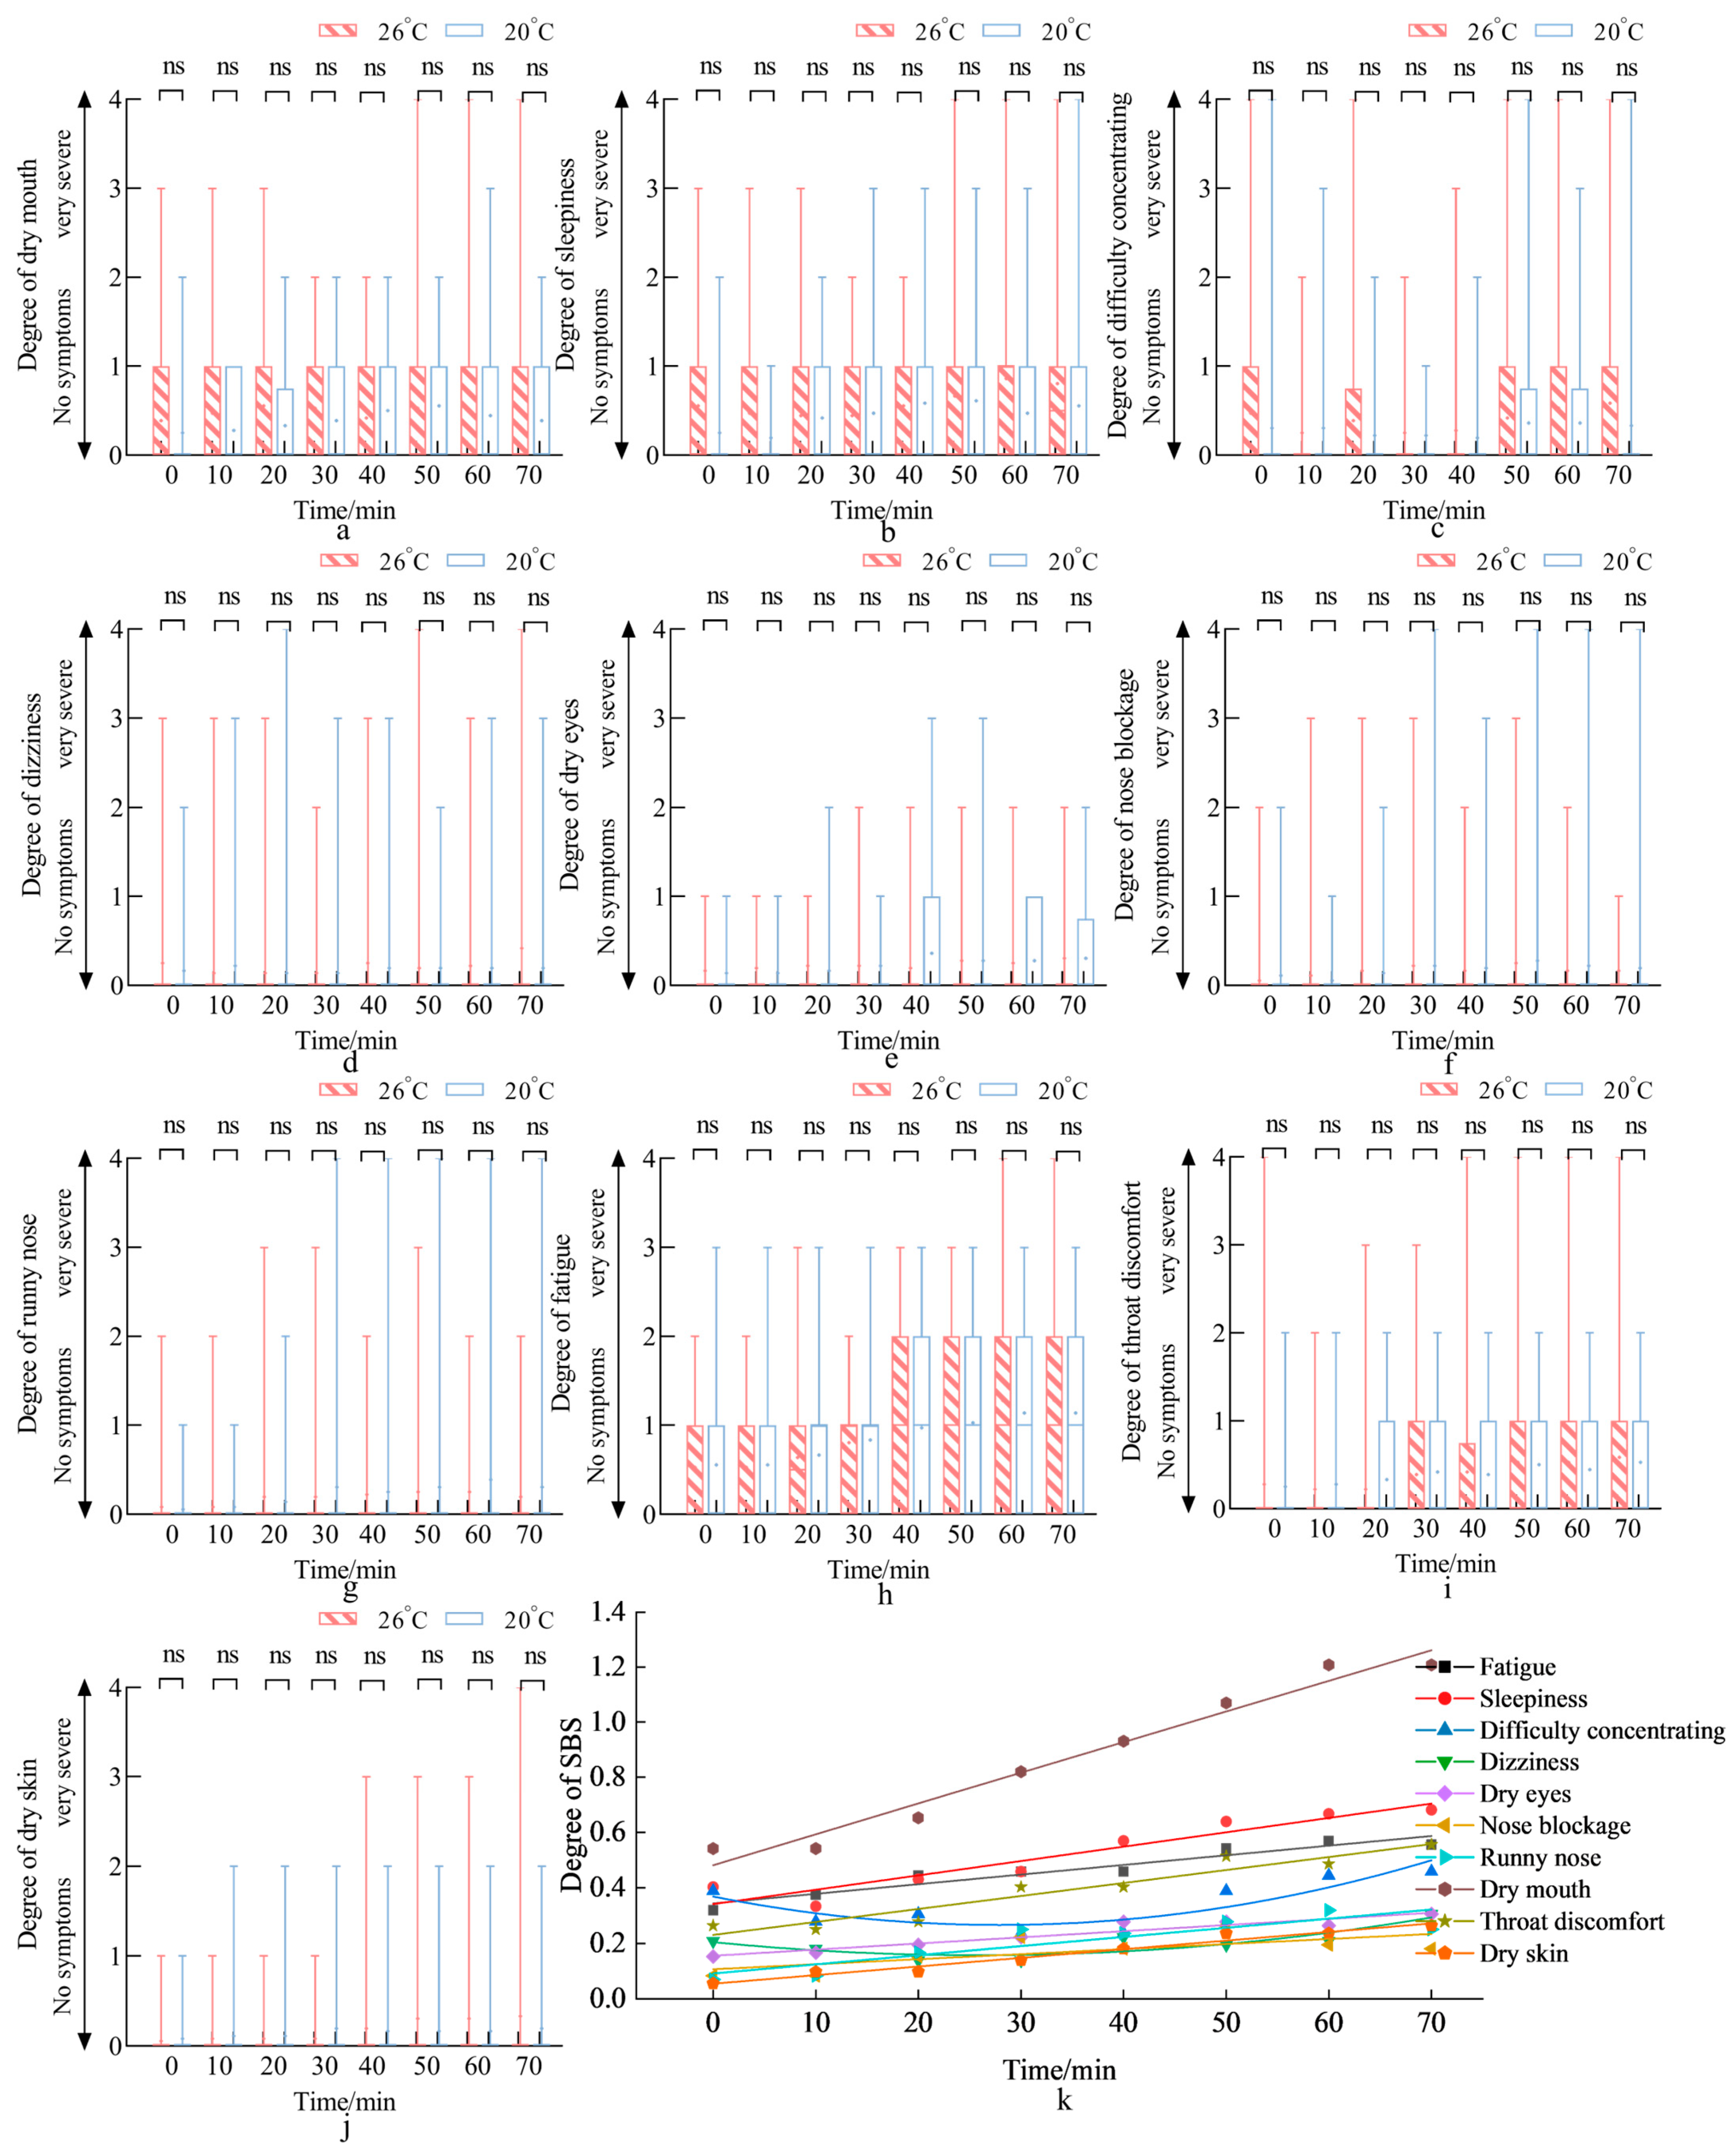
3.1.3. Sick Building Syndrome (SBS)

The change in SBS over time during air conditioner cooling is shown in Figure 12. As can be seen in Figure 12a–j, there was no significant difference in the degree of all SBS symptoms in different SPTs. Figure 12k shows that, except for the difficulty concentrating, the degree of SBS decreased first and then increased with time, and other SBS levels showed an upward trend with time. Specifically, dry mouth was the most severe symptom, followed by drowsiness, fatigue, and throat discomfort. Then came difficulty concentrating. Symptoms such as dry eyes, runny nose, dizziness, nasal congestion, and dry skin were relatively mild. Existing research suggests that difficulty concentrating is related to temperature [46]. After the air conditioner was turned on, the symptoms of difficulty concentrating decreased as the temperature dropped. But, they are also affected by time, and with time, the effect of temperature was offset, and the symptoms rose again. In sum, an SPT difference of 6 °C does not affect SBS, and the symptoms of SBS are mainly affected by the duration during air conditioner cooling.

3.2. Field Investigation Results: Air Conditioner Use Behavior and IAQ

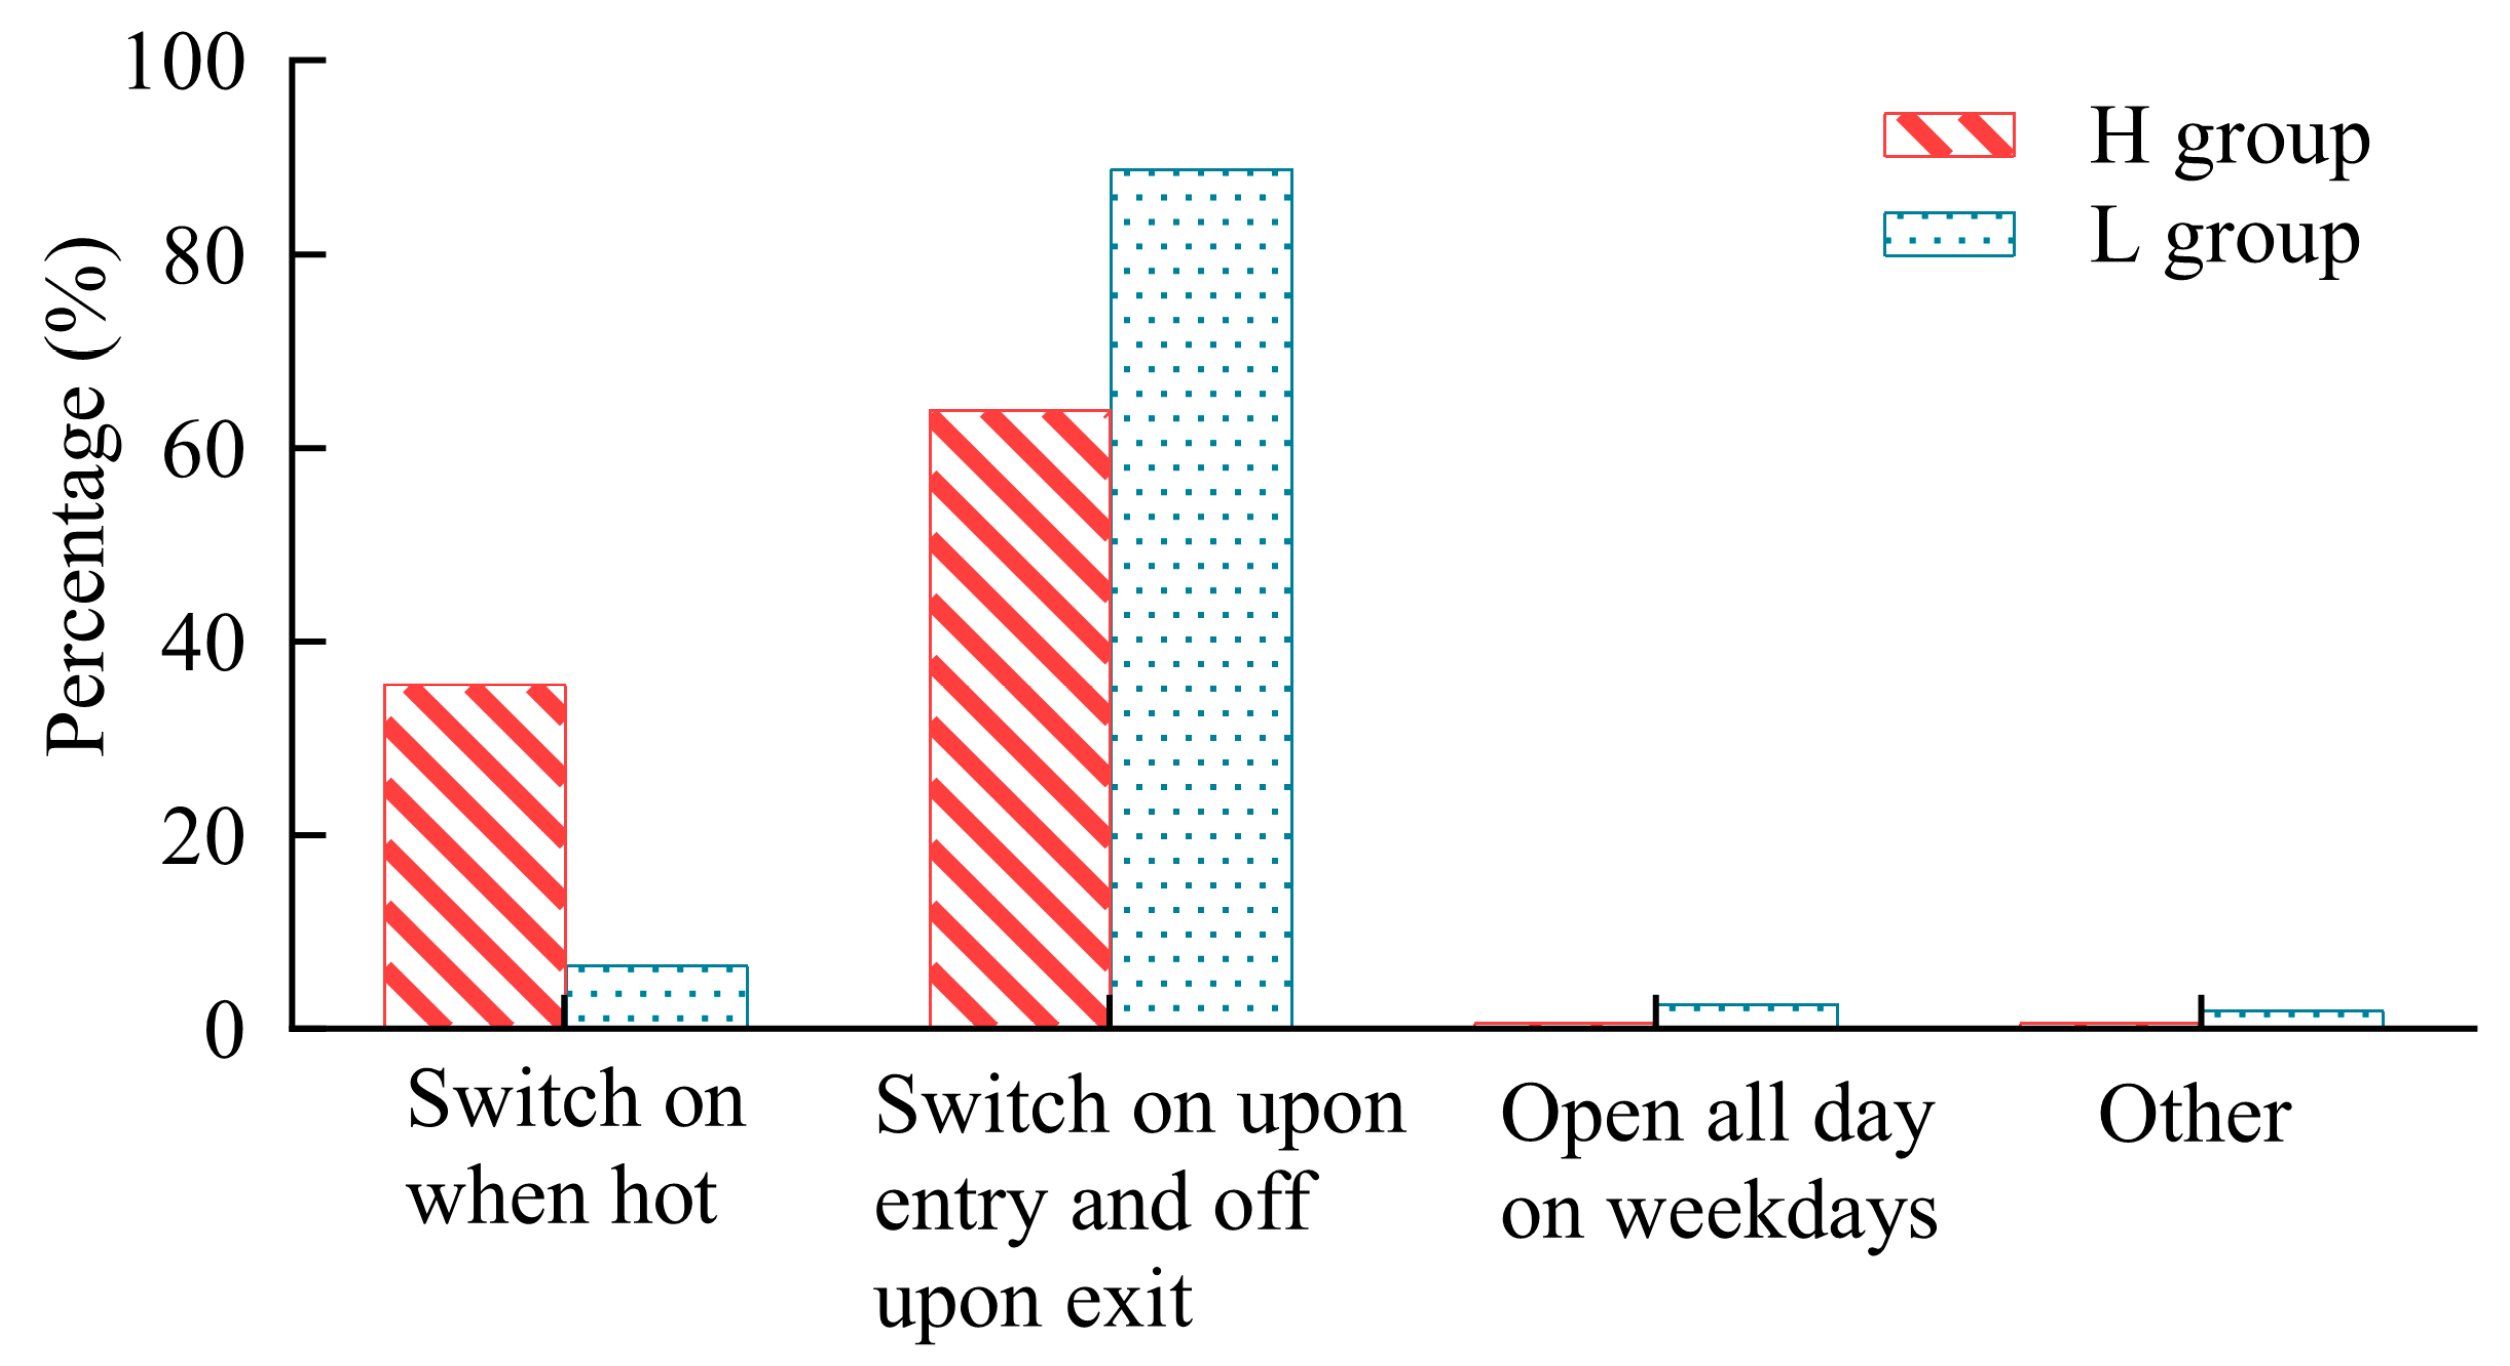
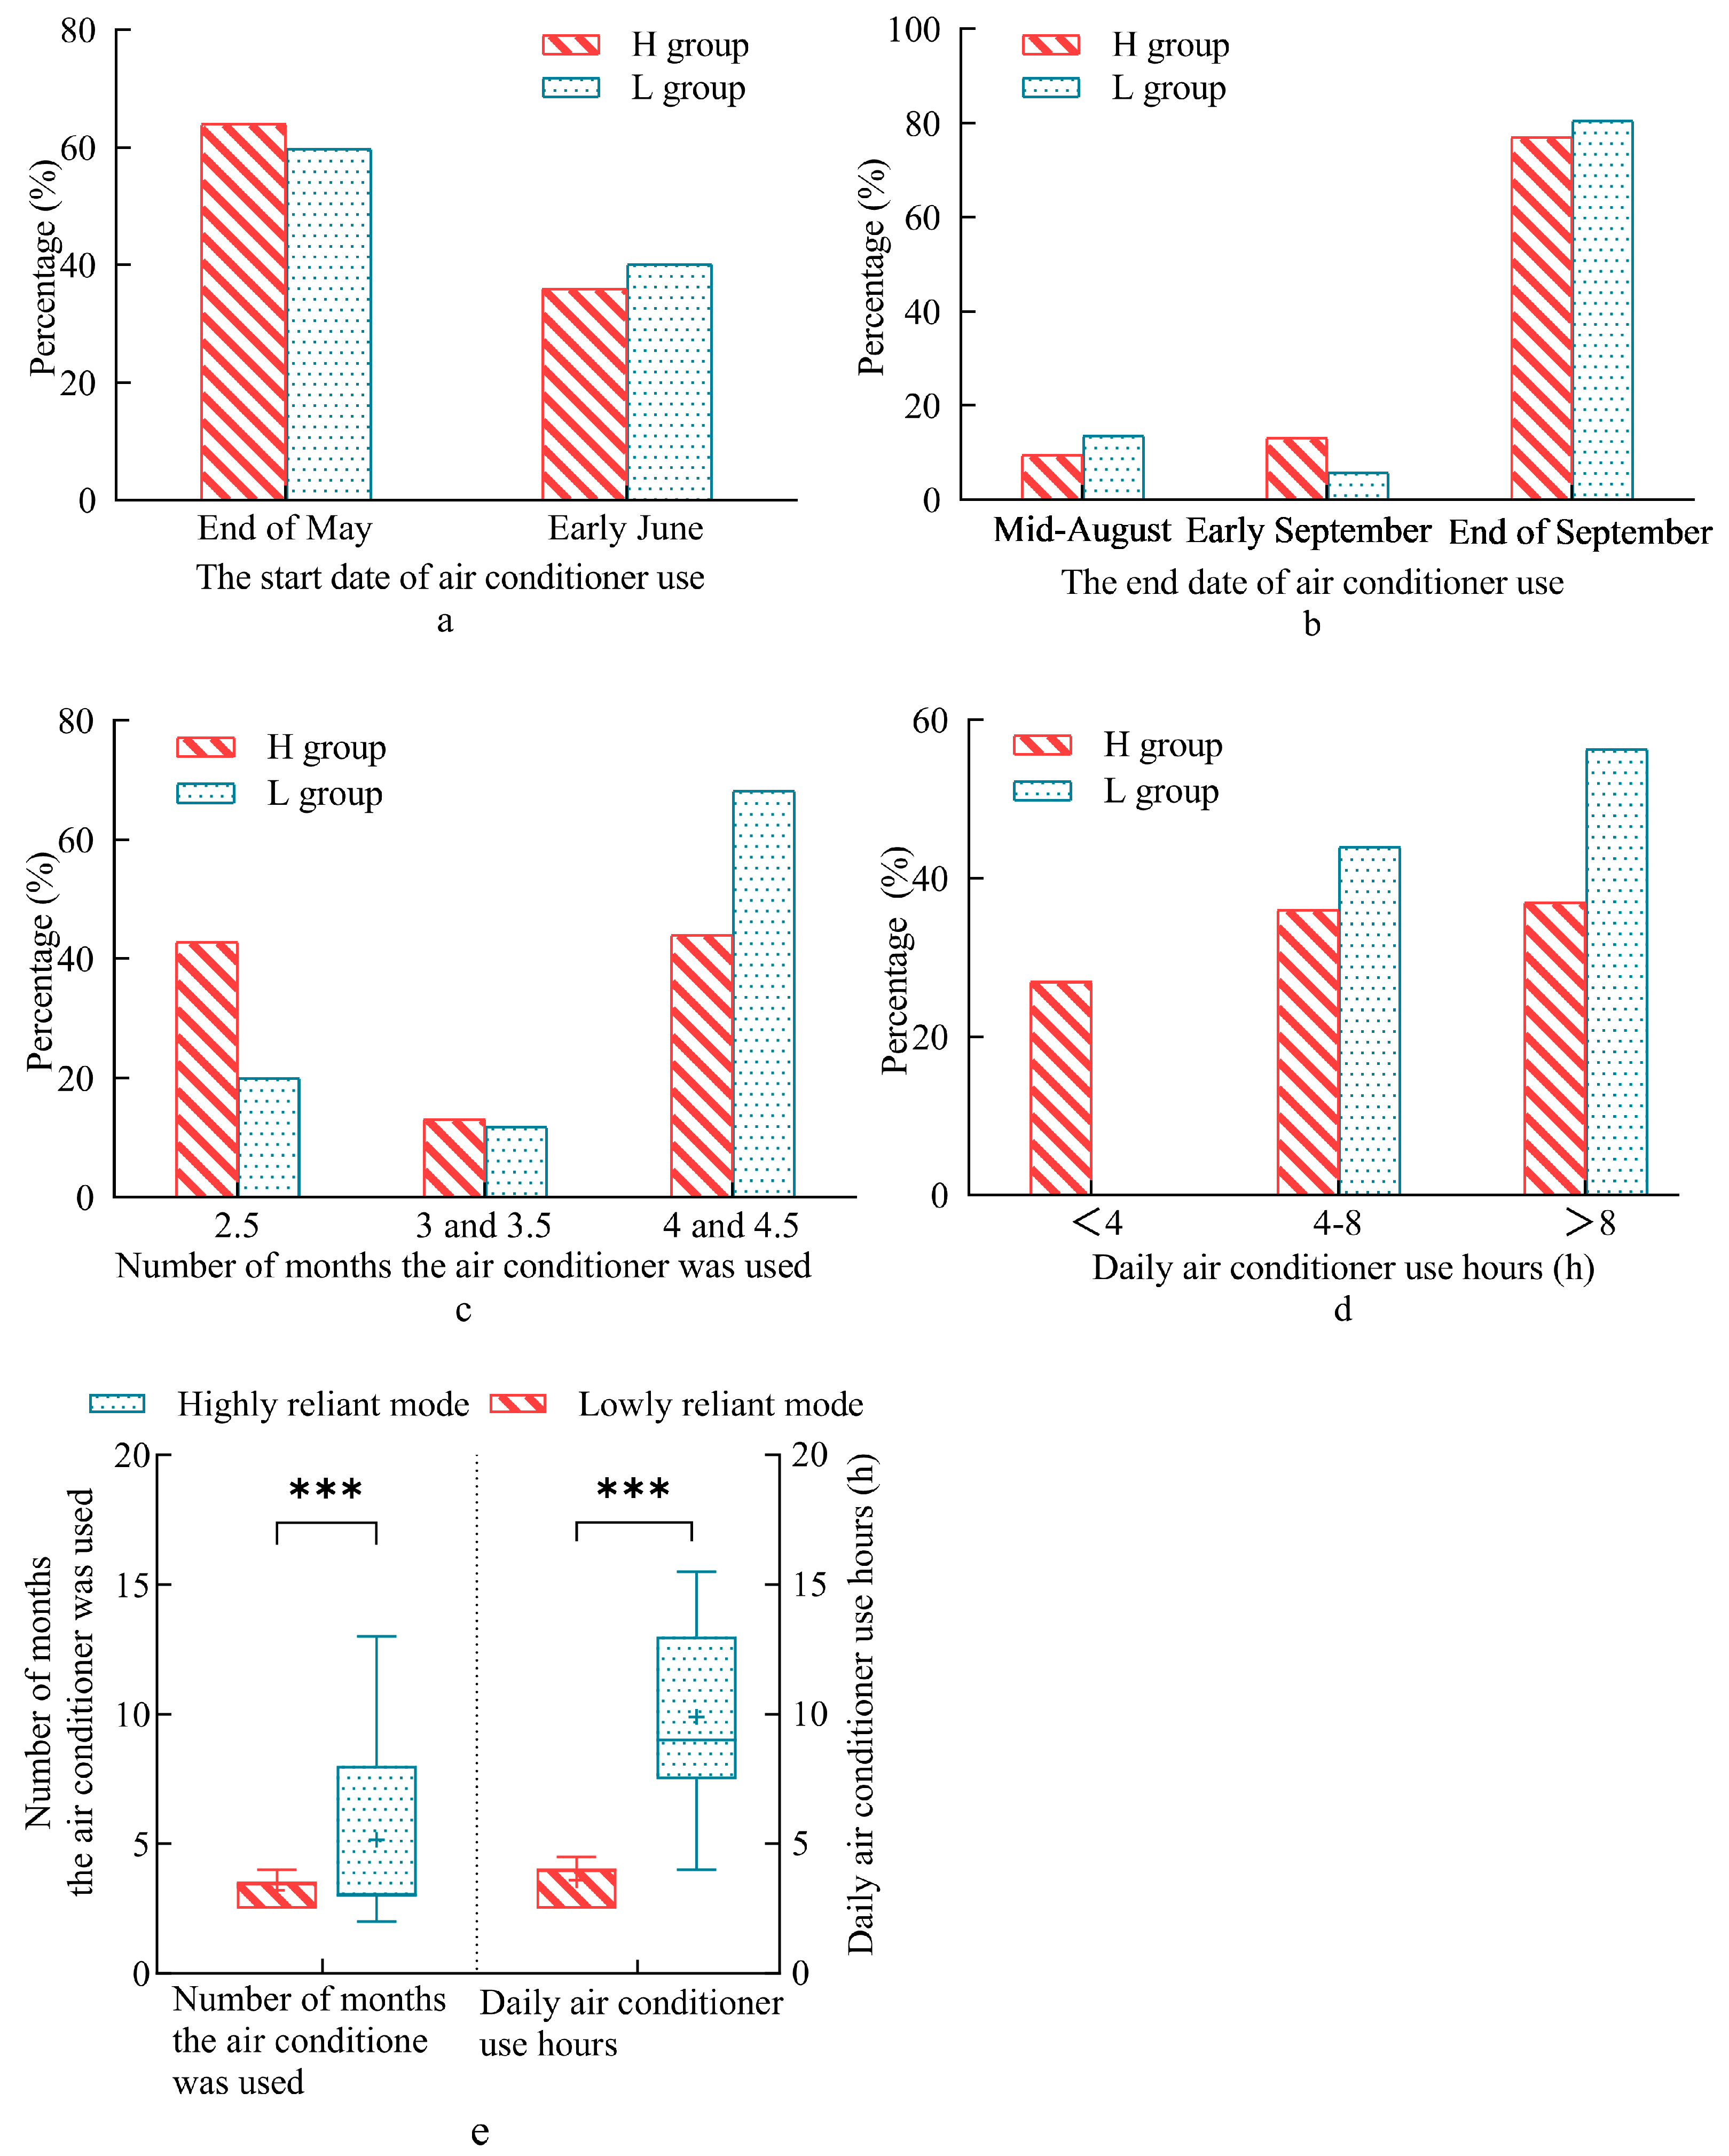
3.2.1. Air Conditioner Use Behavior

Air Conditioner Use Modes
Figure 13 depicts how air conditioner use modes are distributed. Office environments predominantly exhibited two air conditioner use modes: “Switch on when hot” and “Switch on upon entry and off upon exit”. The lowly reliant mode (“Switch on when hot”) demonstrated minimal system engagement, whereas the highly reliant mode (“Switch on upon entry and off upon exit”) indicated substantial reliance. Comparative analysis revealed that the L group predominantly adopted the energy-intensive, highly reliant mode (89%), markedly exceeding the H group’s 64% utilization. Conversely, the energy-conserving lowly reliant mode was scarcely employed by the L group (6%) versus 35% adoption in the H group, quantitatively confirming that participants in the L group exhibited greater reliance on air conditioners compared with those in the H group.
Air Conditioner Use Time
Figure 14a,b delineate the distribution of the starting and ending dates for using air conditioners. Both groups exhibited concentrated start-use dates in late May and end-use dates in late September. Figure 14c presents air conditioner cooling duration frequencies. The L group demonstrated reduced prevalence in 2.5-month usage (20% vs. the H group’s 43%) while exhibiting elevated rates in 4–4.5-month durations (68% vs. 44%). Mean usage durations differed significantly between groups (H: 3.3 months; L: 3.6 months; p = 0.001), statistically confirming prolonged air conditioner cooling durations in the L group. Figure 14d depicts the frequency distribution of daily use hours. The L group demonstrated a lower prevalence in sub-4 h daily engagement (0% vs. the H group’s 27%) while exhibiting heightened rates exceeding 8 h thresholds (56% vs. 37%). Comparative analysis revealed a marked difference in air conditioner use hours (H: 8 h; L: 10 h; p < 0.001), statistically confirming prolonged daily air conditioner cooling use hours in the L group. In summary, while no statistically significant difference emerged between the H and L groups in air conditioner start/end dates, the L group demonstrated statistically significant increases in both cumulative summer operational duration and daily air conditioner use hours compared to the H group. This quantitative disparity confirms that exposure to air-conditioned environments was significantly longer in the L group than in the H group.
Figure 14e illustrates that the cumulative summer operational duration and daily air conditioner use hours of the highly reliant mode substantially exceeded those of the lowly reliant mode (p < 0.001), demonstrating that reliance degree directly influences air conditioner use time. Correlation analyses revealed no statistically significant association between daily air conditioner use hours and outdoor air temperature (p = 0.204), confirming that occupant behavioral reliance levels primarily govern the daily air conditioner use hours in office buildings.

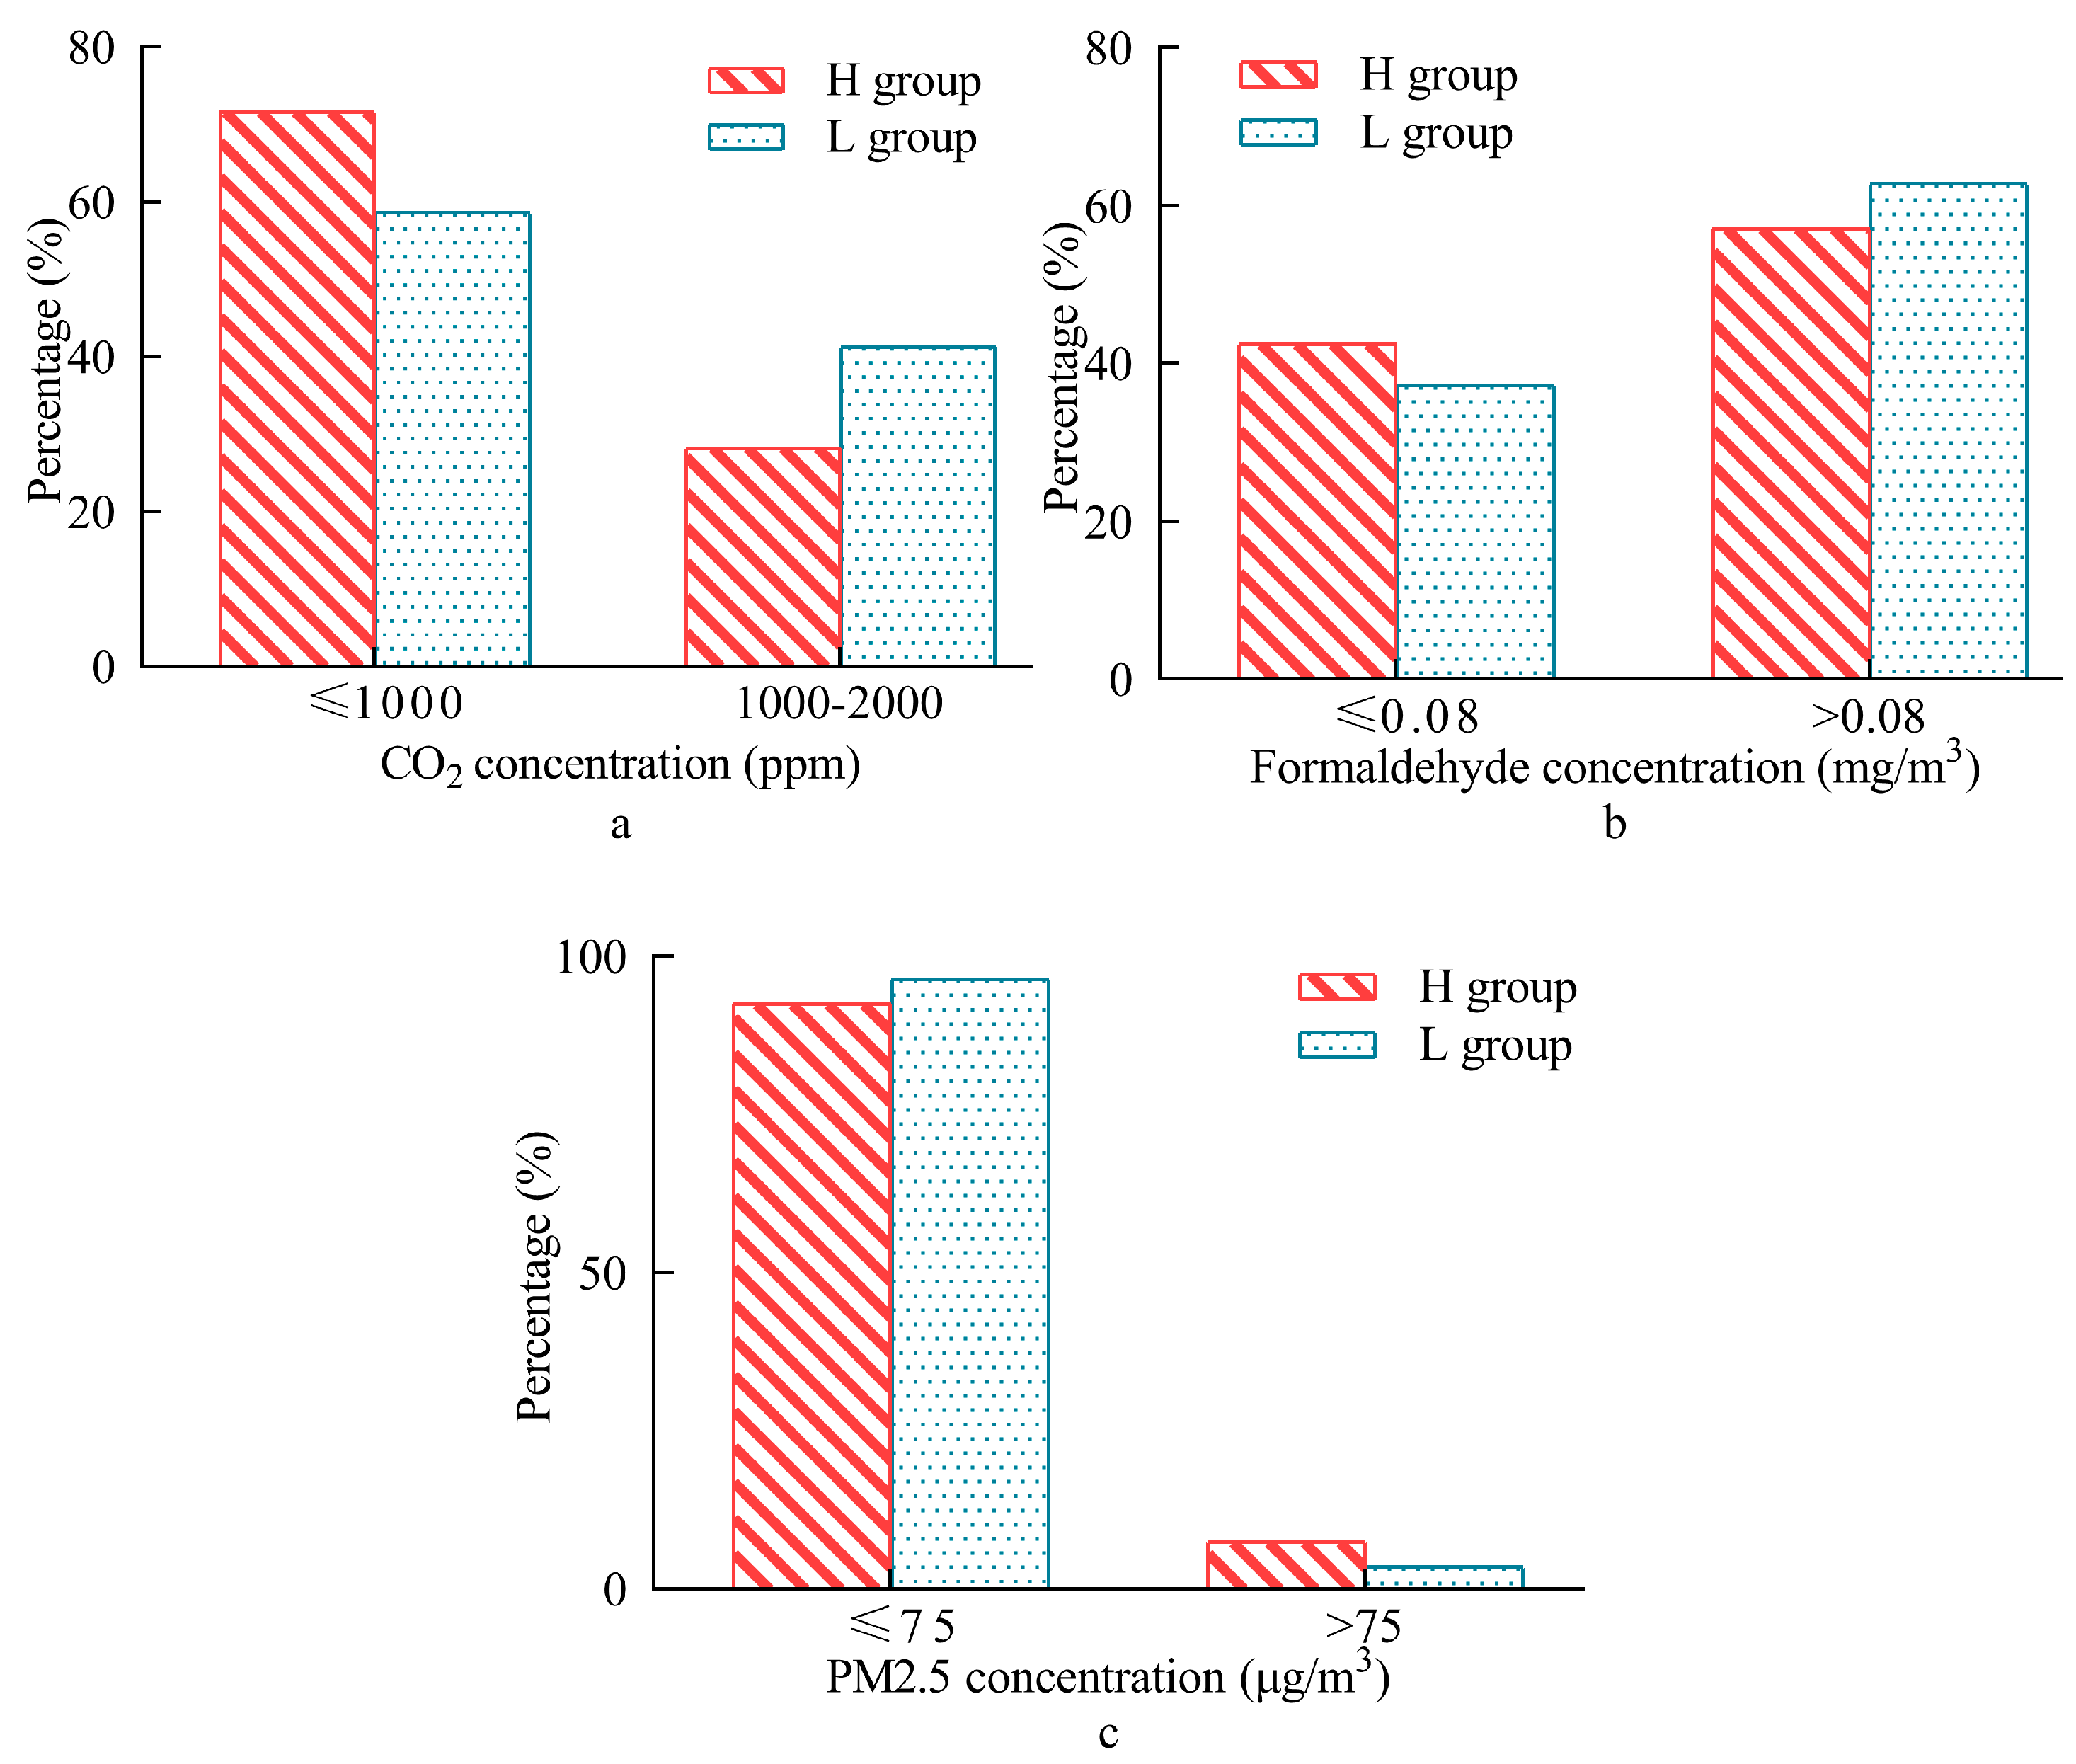
3.2.2. Differences in IAQ

To understand the variation law of indoor air quality in a typical split air-conditioned office, the variation of indoor CO2 concentration was analyzed according to the experimental data obtained in Section 2.1. Through correlation analysis, it was found that in a confined space, due to human breathing, CO2 concentration is only related to time and has nothing to do with SPT. The change in CO2 concentration over time is shown in Figure 15, and the regression equation is shown in Equation (4). The CO2 concentration increases linearly with time, increasing by 11 ppm per minute and reaching the CO2 threshold (1000 ppm) after 50 min. It can be seen that the indoor air quality problem is more serious when the split air conditioner is running.
CO 2   concentration = 10.963 t + 451.38   ( R 2 = 0.996 ,   p = 0.000 )
Based on the regulatory thresholds for indoor environments in China [47,48,49], the permissible limits were set at 0.1% for CO2, 0.08 mg/m3 for formaldehyde, and 75 μg/m3 for PM2.5. The formaldehyde concentration was standardized using a conversion factor of 1 ppm = 1.341 mg/m3. Figure 16 shows the inter-group IAQ parameters, revealing significant differences. For CO2 (Figure 16a), the exceedance frequency in the L group was 41%, significantly higher than the 28% in the H group. Regarding formaldehyde (Figure 16b), the exceedance frequency in the H group was 57%, while that in the L group reached 63%. As for PM2.5 (Figure 16c), 93% of the measurements in the H group and 96% in the L group met the regulatory standard. Comparative analysis revealed elevated non-compliance rates for CO2 and formaldehyde in split air-conditioned office buildings, particularly evident in the L group, whereas PM2.5 concentrations remained consistently low. Thus, addressing summer IAQ challenges in Jiaozuo’s split air-conditioned offices primarily involves mitigating excessive CO2 and formaldehyde levels. Subsequent statistical analyses indicated that CO2 and formaldehyde concentrations in the L group were substantially higher relative to the H group (p < 0.05), with a particularly pronounced gap when CO2 levels surpassed regulatory thresholds (p < 0.001). This indicated a more serious indoor air quality issue in the L group compared to the H group.

3.2.3. Health Risk Assessment of Formaldehyde Exposure

Formaldehyde, classified as a human carcinogen, poses significant health hazards, necessitating rigorous assessment of prolonged exposure to health risks.
The health risk assessment method [50] of the U.S. Environmental Protection Agency (EPA) was utilized, with formaldehyde carcinogenic risk quantification delineated in Equations (5)–(7).
C a n c e r R i s k = C D I × S F
CDI represents the mean daily exposure dose, mg/kg·d, and SF represents the slope factor, kg·d/mg.
C D I = ( C × I R × E D ) / ( B W × A T )
C represents the pollutant concentration, mg/m3. IR represents the respiratory rate, m3/d. ED represents the exposure duration, d. BW represents the weight, kg. AT represents the lifetime, d.
E D = [ D a i l y   a v e r a g e   w o r k i n g   h o u r s / 24 ] × W e e k l y   a v e r a g e   w o r k i n g   d a y s × A n n u a l   w e e k s × E m p l o y e e   w o r k i n g   y e a r s
The SF value was retrieved by querying the EPA IRIS database, and the SF for formaldehyde is 4.55 × 10⁻² kg·d/mg. IR, as per the Exposure Factors Handbook of Chinese Population (Adult Volume), was defined as 17.70 m3/day (male) and 14.30 m3/day (female). Occupational exposure duration was quantified through algorithmic derivation of lifetime occupational engagement. Based on survey data, the daily average working hours were conservatively set at 8 h, with a 5-day workweek. Annual weeks were calculated as 365 divided by 7, and the employee’s working period was assumed to be 40 years. The U.S. EPA standardized uses 70 years (25,550 days) as the carcinogenic risk assessment lifetime (AT).
Table 6 presents the conclusions of the formaldehyde carcinogenic risk assessment for different groups. The L group demonstrated statistically higher carcinogenic risk potential (p = 0.044) compared with the H group. Moreover, both groups persistently surpassed the EPA carcinogenic safety threshold (1 × 10⁻⁶) by orders of magnitude. These findings confirm that summertime formaldehyde concentrations in split air-conditioned public buildings impose a non-negligible health threat, particularly in the L group.

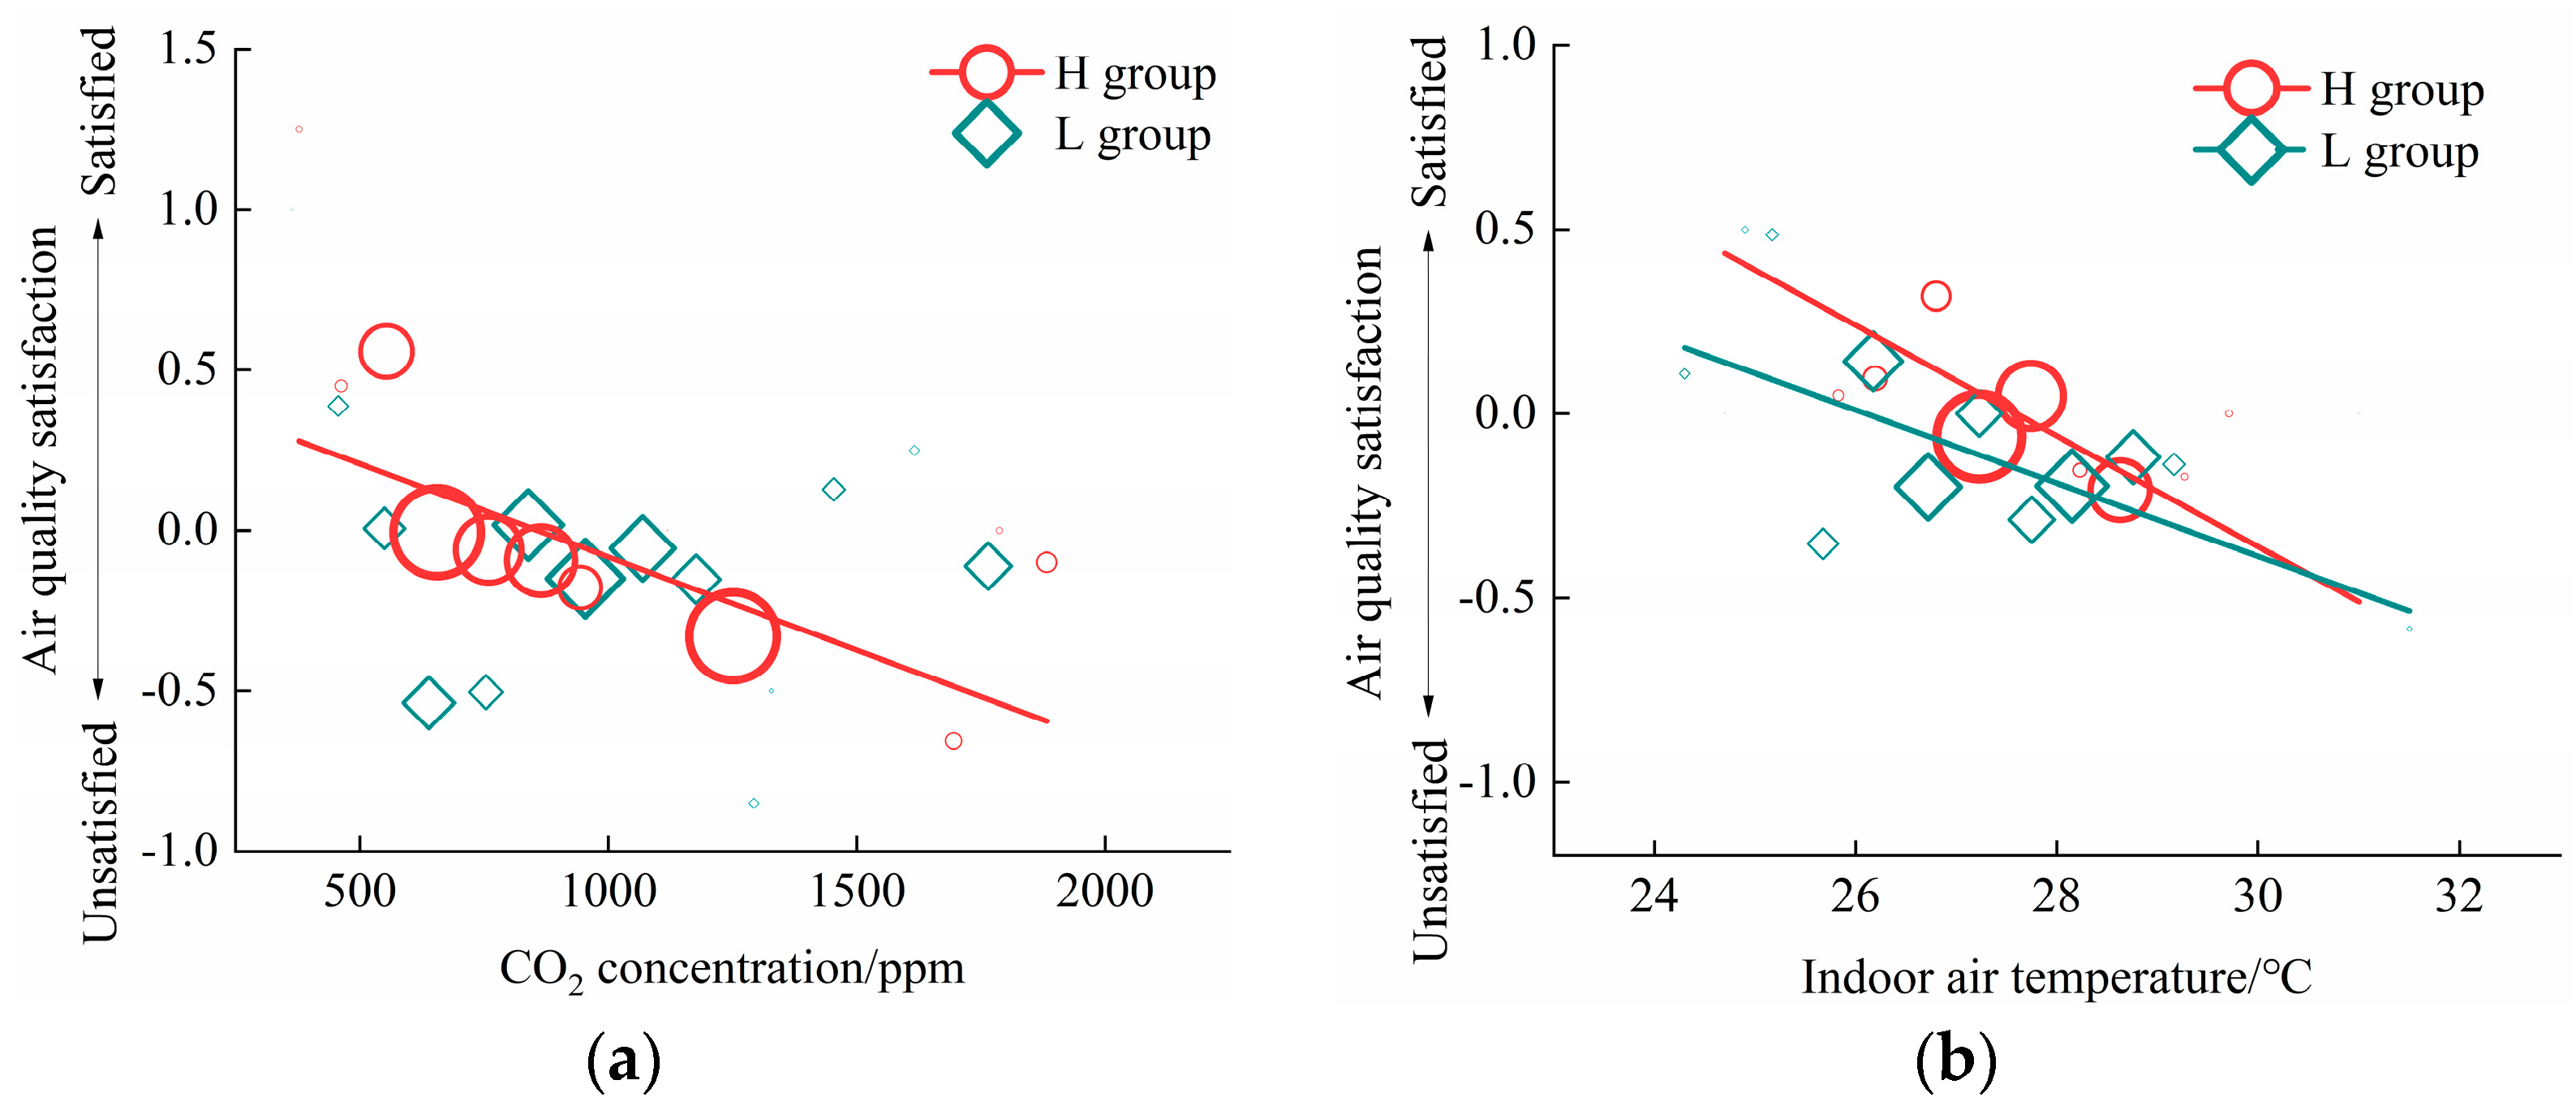
3.2.4. Air Quality Satisfaction

Despite markedly elevated air pollutant concentrations in the L group compared with the H group, no statistically discernible difference was observed in occupant indoor air quality satisfaction (p = 0.106). Bivariate assessments revealed no significant associations between IAQ satisfaction and either PM2.5 or formaldehyde concentrations (p > 0.05). Moreover, only CO2 levels in the H group demonstrated a robust inverse correlation with satisfaction metrics (Figure 17a; p < 0.001). Conversely, Figure 17b reveals a statistically significant inverse relationship between IAQ satisfaction and air temperature across both groups (p < 0.001). This phenomenon likely stems from thermodynamic mechanisms where elevated ambient temperatures increase inhaled air’s specific enthalpy, thereby diminishing the respiratory mucosa’s evaporative cooling capacity. Such physiological interference induces perceived thermal discomfort and respiratory impedance [51], ultimately degrading subjective air quality evaluations. Additionally, statistical differences in the gradient and intercept were observed across different groups (p < 0.001). This implies that the L group’s sensitivity of IAQ satisfaction to temperature was less pronounced than that of the H group. Under 30 °C thermal conditions, at the same temperature level, the L group’s IAQ satisfaction was statistically lower than that of the H group. Nevertheless, as the indoor air temperature went up, this gap gradually narrowed.
Overall, IAQ satisfaction in the H group was influenced by both CO2 levels and temperature, whereas that in the L group was primarily influenced by temperature. Consequently, the lack of significant inter-group differences in IAQ satisfaction can be attributed to the lower indoor temperatures measured in the L group compared to the H group.

4. Discussion

4.1. Influence of Thermal History of Different SPT Modes on Physiology

As shown in Section 3.1.1, during convective cooling, the significantly higher indoor air temperatures experienced by subjects under the 26 °C condition compared to the 20 °C condition led to physiological adaptation to cold environments under the 20 °C condition. This adaptation manifested as reduced vasoconstriction and weakened peripheral vascular resistance, consequently resulting in lower skin temperatures and decreased skin temperature sensitivity to environmental temperatures.
This demonstrates that in the low SPT mode, short-term exposure enhances individuals’ adaptation capacity to cold environments, making them more accustomed to lower ambient temperatures. Over the long term (based on our team’s previous research [3]), it reduces the body’s thermoregulatory capacity in warmer environments. Previous studies have indicated that individuals who spend extended periods in air-conditioned environments possess poorer thermoregulatory capacities compared to those in naturally ventilated buildings [6]. Additionally, the thermoregulatory capabilities of occupants in centrally air-conditioned buildings are weaker than those in split air-conditioned buildings [8]. Nevertheless, this research revealed that within the same air-conditioned building, the thermal histories of different SPT modes not only weakened occupants’ thermoregulatory capacity in warm environments but also enhanced the thermoregulatory capacity in cold environments. Additionally, this effect is pronounced, becoming significant 30 min after the air conditioner is turned on, which undoubtedly subjects the human thermoregulatory system to frequent stress and may lead to disruptions in its regulatory mechanisms. Furthermore, from both short- and long-term perspectives, individuals tend to become more accustomed to cold environments and diminish their tolerance to hot environments [6], thereby increasing reliance on air conditioners. Consequently, as evidenced in Section 3.2.1, the L group exhibited greater reliance on air conditioners compared to the H group. Moreover, this operational mode under the low SPT instigates self-reinforcing exposure cycles. Heightened air conditioner cooling reliance directly correlates with prolonged habituation to air-conditioned environments, thereby exacerbating the degradation of thermoregulatory capacity. Crucially, such thermodynamic maladaptation induces pathological adaptation cycles (repetitive physiological adjustments that paradoxically exacerbate health risks, arising from prolonged exposure to suboptimal thermal conditions), wherein diminished autonomous thermal regulation capacity reciprocally amplifies air conditioner cooling reliance, establishing persistent positive feedback loops. Vecchi et al. [52] observed that individuals accustomed to air conditioners tend to opt for them as a primary method of environmental regulation. This study further found that users of the low SPT mode exhibit increased reliance on air conditioners, which significantly increases their air conditioner use time. Additionally, as can be known from Section 3.1.3, the symptoms of SBS are mainly affected by the increase in air conditioner operation time, which will inevitably lead to an increase in the severity of SBS for users in the low SPT mode.

4.2. Influence of Air Conditioner Use Behavior of Different SPT Modes on IAQ

As delineated in Section 3.2.2 and Section 3.2.3, the L group exhibited statistically higher indoor air pollutant levels (CO2 and formaldehyde) and formaldehyde carcinogenic risk relative to the H group. This disparity can be attributed to the varying degrees of reliance on air conditioners among individuals under different SPT modes. Figure 18 presents the CO2 and formaldehyde concentrations for different degrees of human reliance on air conditioners. Notably, the concentrations of both substances in the highly reliant mode were statistically higher than those in the lowly reliant mode (p < 0.05). Elevated indoor air pollutant levels arise from energy-conserving cooling practices, wherein occupants maintain airtight conditions by closing windows/doors to minimize thermal transfer, thereby suppressing ventilation efficacy [53]. Consequently, air conditioner reliance levels directly influence indoor pollutant concentrations, with the highly reliant mode establishing adverse feedback loops that exacerbate indoor air quality degradation. Section 3.2.1 indicates that the L group exhibited heightened air conditioner cooling reliance and prolonged air conditioner operation time relative to the H group, inducing compromised ventilation efficacy that elevated indoor air pollutant levels. Of particular concern is formaldehyde—a known carcinogen with significant health hazards. Its concentration tends to increase in conjunction with rising temperature levels [54]. Section 3.1.1 shows that the L group had significantly lower indoor air temperature compared to the H group. Conversely, formaldehyde concentrations in the L group were statistically higher. These findings indicate that although the reduced indoor air temperature under the low SPT mode inhibited formaldehyde volatilization, the high reliance on air conditioners hindered the effective dispersion of indoor formaldehyde. Consequently, formaldehyde concentrations were elevated in the low SPT mode, directly contributing to significantly increased carcinogenic risk. Collison et al. [55] demonstrated that indoor temperature is a critical determinant of ventilation behavior. Specifically, lower winter temperatures reduce ventilation frequency, correlating with elevated CO2 concentrations. This study further reveals that air conditioning dependency likewise impacts indoor air quality by modulating ventilation patterns. In summary, the low SPT mode posed more severe air quality issues and formaldehyde-related cancer risks, stemming from people’s intense reliance on split air conditioners.

4.3. Influence of Long-Term Thermal and Air History of Different SPT Modes on Air Quality Perception

Extensive research has established carbon dioxide’s influence on human perception of air quality [30,31,56]. Dating to 1936, Yaglou et al. [30] identified thermal conditions as critical determinants in subjective air quality assessments. Subsequent research by Berglund and Cain [57] revealed that temperature potentially outweighs air pollutant concentrations in shaping occupants’ subjective assessment of IAQ. However, previous studies often neglect the role of prior environmental exposure in shaping air quality perception—specifically, whether perceptual adaptation occurs. Adaptation represents a diminution of neuroadaptive responses to recurring exogenous stimuli [58]. Fang et al. [59] compared air quality acceptability assessments conducted immediately upon entering a climate chamber and after 20 min exposures, finding no significant difference (i.e., no short-term adaptation). In this research, people’s environmental exposure histories differed between groups. The L group experienced prolonged exposure to lower temperatures and higher CO2 concentrations compared to the H group. This raises a critical question: Might prolonged exposure to varying environmental conditions exert adaptational impacts on individuals’ perception of air quality?
Section 3.2.4 shows reduced sensitivity of occupant IAQ satisfaction to thermal stimuli in the L group relative to the H group. This observation indicates that air quality perception may develop long-term adaptation under prolonged indoor environmental exposure. Temperature alters the energy content of inhaled air and modulates respiratory tract cooling. Typically, inhaled air below mucosal temperature (30–32 °C) cools the mucosa, with stronger cooling within this range correlating to fresher perceived air [60,61]. However, prolonged low-temperature exposure subjects the respiratory tract to sustained cooling stimuli, potentially desensitizing temperature-related air quality perception. Consequently, the L group exhibited reduced sensitivity in IAQ satisfaction to temperature relative to the H group, indicating that prolonged low-temperature exposure potentially induces hyposensitivity to perceiving air quality changes related to ambient thermal stimuli.
The investigation results reveal that CO2 concentration had a more significant effect on IAQ satisfaction in the H group than temperature (56% vs. 44%). The L group data demonstrated no statistically significant association between CO2 concentrations and IAQ satisfaction, suggesting that prolonged exposure to low SPT modes lessens individuals’ sensitivity to CO2, thereby impairing their effective perception of air quality. Therefore, we propose that individuals’ perception of air quality may develop long-term adaptability to CO2. Similar to thermal adaptation (wherein prolonged exposure to non-neutral environments induces physiological and psychological adaptation, manifesting as diminished perceived thermal discomfort), occupants also exhibit air quality adaptation mechanisms. The L group exhibited significantly higher CO2 concentrations compared to the H group. Prolonged high-CO2 exposure likely induced physiological and psychological adaptation, thereby diminishing CO2 sensitivity. Zhang et al. [62] observed in laboratory studies that the effects of CO2 on air quality acceptability diminished at 28 °C compared with 24 °C and 26 °C, with its perceptual impact inversely correlated with temperature. However, our survey results showed stronger effects of CO2 in high SPT modes. The key distinction lies in taking into consideration environmental exposure history—specifically, long-term CO2 adaptation. This adaptation appears to outweigh immediate temperature effects on perception. To conclude, prolonged high-CO2 exposure may desensitize people’s air quality perception of CO2.
In conclusion, in the low SPT mode, elevated CO2 and formaldehyde levels were accompanied by diminished perceptual sensitivity to air quality, thereby posing greater health risks to occupants.

4.4. Influence and Mechanisms of Different SPT Modes on Health

According to the above analysis, in split air-conditioned office buildings, the mechanisms by which SPT influences health risks are as follows: thermal history → physiological adaptation (health) → air conditioner dependency → air conditioner use behavior → SBS/indoor air pollution → health. Compared with the high SPT mode, a prolonged thermal history of cold exposure in the low SPT mode enables individuals to develop adaptability to cold environments and diminishes their thermoregulatory capacity in warmer conditions, inducing pathological thermal adaptation cycles, thus promoting strong dependence on the air-conditioned environment. This leads to a substantial increase in air conditioner use time, thereby increasing the severity of SBS and elevating indoor CO2 and formaldehyde concentrations. These elevated pollutant levels are accompanied by a significantly higher cancer risk of formaldehyde and desensitized air quality perception (reduced sensory responsiveness to indoor pollutants due to chronic exposure, leading to delayed detection of air quality deterioration), ultimately posing greater health risks to occupants.
By assessing the health implications of different SPT modes, this research substantiates the appropriateness of Chinese regulatory policies regarding cooling SPT in split air-conditioned office buildings. Consequently, persistent enforcement of the policy stipulating a minimum summer cooling SPT of 26 °C for office buildings remains essential. Health-centric interventions are more effective than energy-focused campaigns in promoting policy compliance. Therefore, it is recommended that the government enhance communication about the adverse health impacts of low SPT and guide individuals to adopt higher SPTs. This is of substantial importance in fostering energy conservation and promoting public health and well-being.

4.5. Limitations

Temperature Gradient Design: This study focuses on exploring the influence of thermal history and air conditioner use behavior under different cooling SPT modes on health, with the influence of thermal history on thermoregulatory capacity being one of the core contents. Based on the Predicted Mean Vote (PMV) model, two SPT conditions were established: 26 °C (neutral thermal sensation) and 20 °C (cold sensation). By comparing human physiological responses in different thermal environments, the study systematically revealed the effects of thermal history induced by SPTs on thermoregulatory capacity and physiological adaptation. As a study exploring the effects of thermal history induced by specific temperature differences, the current design has laid a foundation for follow-up work. However, the study still has the following limitation: only two SPTs were considered in the experiment. Future research can further expand the temperature range (e.g., adding groups at 24 °C, 28 °C, etc.) to more comprehensively and systematically understand the dose–response relationship among different temperatures, thermal adaptation, and health effects.
Quantitative Validation of Causal Mechanisms: The experimental results indicated that thermal history under low SPTs induced subjects to develop adaptation to cold environments, with thermal history quantified via continuous temperature logging and occupant exposure diaries. Field investigation data further revealed that the low-SPT group exhibited stronger air conditioner reliance, with significantly prolonged use duration. Mechanistically, cold adaptation may directly lead to increased AC reliance and prolonged operation, implying a potential causal pathway. As a preliminary exploration of this association, this study did not employ specialized statistical frameworks (e.g., mediation analysis or longitudinal tracking) to quantitatively validate the precise pathways through which thermal adaptation mediates air conditioning (AC) dependence or the effect sizes. Future research should specifically design experiments or collect time-series data to quantitatively analyze how changes in thermal adaptability drive specific air conditioner use behavior decisions, thereby deepening our understanding of this behavioral feedback loop.

5. Conclusions

This study explored the influence of cooling set point temperature (SPT) on health through experimental research and field investigation of split air-conditioned office buildings in China’s cold climate regions. The specific conclusions are as follows:
(1) Thermal history and air conditioner use behavior: Subjects in the L group were exposed to lower temperatures for longer periods in air-conditioned environments and showed stronger reliance on air conditioners than those in the H group. The air conditioner use time was primarily determined by user reliance level on air conditioners.
(2) Physiology: Physiological adaptation to cold environments emerged after 30 min in the 20 °C condition and was primarily reflected in significant changes in skin temperature. The low SPT mode induced a pathological adaptation, compromising autonomous thermoregulatory capacity.
(3) Indoor air quality: The exceedance rates of CO2 and formaldehyde concentrations were higher in the two cities. The L group had worse indoor air quality, but no statistical difference was observed in air quality satisfaction. Human perception of air quality demonstrates long-term adaptation to indoor air temperature and CO2.
(4) Health: The mechanism by which low SPT influences health risks is as follows: Prolonged cold thermal history → pathological physiological adaptation cycle (weakened thermoregulatory capacity) → strong reliance on air conditioners → significantly increased air conditioner use time → higher severity of SBS and indoor air pollution → elevated formaldehyde carcinogenic risk and reduced sensitivity to air quality perception.
(5) Policy: This health study validates China’s SPT-based energy policies. Promoting health is more effective than encouraging energy conservation. We recommend that governments implement health-driven communication strategies highlighting low SPT health risks while guiding individuals to adopt higher SPTs.
The above findings have great significance for promoting the implementation of SPT energy-saving policies, creating a low-carbon and healthy indoor environment, and increasing public health and well-being.

Author Contributions

Conceptualization, methodology, validation, formal analysis, and writing—review and editing, F.S., N.L. and H.Y.; software, investigation, data curation, writing—original draft preparation, and visualization, F.S.; resources, supervision, project administration, and funding acquisition, N.L. and H.Y. All authors have read and agreed to the published version of the manuscript.

Funding

This study was supported by the National Natural Science Foundation of China (Grant Nos. 52378095 and 52278105), the Key Research Projects of Higher Education Institutions in Henan Province (Grant No. 24A410001), and the international science and technology cooperation project of Henan Province (Grant No. 252102521004).

Data Availability Statement

The original contributions presented in this study are included in the article. Further inquiries can be directed to the corresponding author.

Acknowledgments

We thank the building operators in Jiaozuo for facilitating field investigations and all participants for their time and cooperation.

Conflicts of Interest

The authors declare that they have no known competing financial interests or personal relationships that could have appeared to influence the work reported in this paper.

References

  1. China Building Energy Efficiency Association; Chongqing University. Research Report on Carbon Emissions from Urban and Rural Construction in China, 2024th ed.; China Building Energy Efficiency Association; Chongqing University: Chongqing, China, 2025. [Google Scholar]
  2. Zhuang, X.; Wu, C. Saving Energy when Using Air Conditioners in Offices—Behavioral Pattern and Design Indications. Energy Build. 2014, 76, 661–668. [Google Scholar] [CrossRef]
  3. Yan, H.; Shi, F.; Sun, Z.; Yuan, G.; Wang, M.; Dong, M. Thermal Adaptation of Different Set Point Temperature Modes and Energy Saving Potential in Split Air-Conditioned Office Buildings during Summer. Build. Environ. 2022, 225, 109565. [Google Scholar] [CrossRef]
  4. Zhou, X.; Xu, L.; Xie, J.; He, L.; Zhang, J.; Wu, Z.; Pan, Y. Personnel Movement and Air Conditioner Usage Behavior for a University Office in Shanghai. Build. Sci. 2020, 36, 1–7+73. (In Chinese) [Google Scholar]
  5. Bae, C.; Chun, C. Research on Seasonal Indoor Thermal Environment and Residents’ Control Behavior of Cooling and Heating Systems in Korea. Build. Environ. 2009, 44, 2300–2307. [Google Scholar] [CrossRef]
  6. Yu, J.; Ouyang, Q.; Zhu, Y.; Shen, H.; Cao, G.; Cui, W. A Comparison of the Thermal Adaptability of People Accustomed to Air-Conditioned Environments and Naturally Ventilated Environments. Indoor Air 2012, 22, 110–118. [Google Scholar] [CrossRef]
  7. Wu, Z.; Li, N.; Wargocki, P.; Peng, J.; Li, J.; Cui, H. Field Study on Thermal Comfort and Energy Saving Potential in 11 Split Air-Conditioned Office Buildings in Changsha, China. Energy 2019, 182, 471–482. [Google Scholar] [CrossRef]
  8. Zhang, Z.; Zhang, Y.; Khan, A. Thermal Comfort of People from Two Types of Air-Conditioned Buildings—Evidences from Chamber Experiments. Build. Environ. 2019, 162, 106287. [Google Scholar] [CrossRef]
  9. Kravchenko, I.; Velashjerdi Farahani, A.; Kosonen, R.; Kilpeläinen, S.; Saranko, O.; Fortelius, C. Effect of the Urban Microenvironment on the Indoor Air Temperature of the Residential Building Stock in the Helsinki Region. Build. Environ. 2023, 246, 110971. [Google Scholar] [CrossRef]
  10. Guo, F.; Ham, S.W.; Kim, D.; Moon, H.J. Deep Reinforcement Learning Control for Co-Optimizing Energy Consumption, Thermal Comfort, and Indoor Air Quality in an Office Building. Appl. Energy 2025, 377, 124467. [Google Scholar] [CrossRef]
  11. Poulin, P.; Marchand, A.; Lévesque, B.; Dubé, M.; Aubin, D.; Ouazia, B.; Duchaine, C.; Brisson, M. Impact of Improved Indoor Air Quality in Nunavik Homes on Children’s Respiratory Health. Indoor Air 2022, 32, e13009. [Google Scholar] [CrossRef]
  12. Lovas, S.; Pál, L.; Kovács, N.; Diószegi, J.; McKee, M.; Szűcs, S. Dataset on Concentrations of Volatile Organic Compounds in Indoor Environments of Offices, Educational and Residential Buildings in the European Union between 2010 and 2023. Data Brief 2024, 57, 111070. [Google Scholar] [CrossRef] [PubMed]
  13. Ge, B.; Tieskens, K.; Vyas, P.; Botana Martinez, M.P.; Yuan, Y.; Walsh, K.H.; Main, L.; Bolton, L.; Yajima, M.; Fabian, M.P. Decision Tools for Schools Using Continuous Indoor Air Quality Monitors: A Case Study of CO2 in Boston Public Schools. Lancet Reg. Health–Am. 2025, 48, 101148. [Google Scholar] [CrossRef]
  14. Jung, D.; Choe, Y.; Shin, J.; Kim, E.; Min, G.; Kim, D.; Cho, M.; Lee, C.; Choi, K.; Woo, B.L.; et al. Risk Assessment of Indoor Air Quality and Its Association with Subjective Symptoms among Office Workers in Korea. Int. J. Environ. Res. Public Health 2022, 19, 2446. [Google Scholar] [CrossRef]
  15. Sérafin, G.; Blondeau, P.; Mandin, C. Indoor Air Pollutant Health Prioritization in Office Buildings. Indoor Air 2020, 31, 646–659. [Google Scholar] [CrossRef]
  16. Salthammer, T. Formaldehyde Sources, Formaldehyde Concentrations and Air Exchange rates in European Housings. Build. Environ. 2019, 150, 219–232. [Google Scholar] [CrossRef]
  17. Nielsen, G.D.; Larsen, S.T.; Wolkoff, P. Recent Trend in Risk Assessment of Formaldehyde Exposures from Indoor Air. Arch. Toxicol. 2013, 87, 73–98. [Google Scholar] [CrossRef]
  18. Kulshreshtha, P.; Khare, M.; Seetharaman, P. Indoor Air Quality Assessment in and around Urban Slums of Delhi City, India. Indoor Air 2008, 18, 488–498. [Google Scholar] [CrossRef]
  19. Azuma, K.; Ikeda, K.; Kagi, N.; Yanagi, U.; Osawa, H. Physicochemical Risk Factors for Building-Related Symptoms in Air-Conditioned Office Buildings: Ambient Particles and Combined Exposure to Indoor Air Pollutants. Sci. Total Environ. 2018, 616–617, 1649–1655. [Google Scholar] [CrossRef]
  20. Yoon, H.; Shuai, J.F.; Kim, T.; Seo, J.; Jung, D.; Ryu, H.; Yang, W. Micro-Environmental Time Activity Patterns of Weekday and Weekend on Korean Adults. J. Odor. Indoor. Environ. 2017, 16, 182–186. [Google Scholar] [CrossRef]
  21. Cheng, Z.; Lei, N.; Bu, Z.; Sun, H.; Li, B.; Lin, B. Investigations of Indoor Air Quality for Office Buildings in Different Climate Zones of China by Subjective Survey and Field Measurement. Build. Environ. 2022, 214, 108899. [Google Scholar] [CrossRef]
  22. Alonso, M.J.; Jørgensen, R.B.; Mathisen, H.M. Short Term Measurements of Indoor Air Quality when Using the Home Office in Norway. E3S Web Conf. 2021, 246, 01002. [Google Scholar] [CrossRef]
  23. Qiu, Y.; Wang, Y.; Tang, Y. Investigation of Indoor Air Quality in Six Office Buildings in Chengdu, China Based on Field Measurements. Build. Simul. 2020, 13, 1009–1020. [Google Scholar] [CrossRef]
  24. Chiesa, G.; Vigliotti, M. Comparing Mechanical Ventilation Control Strategies for Indoor Air Quality: Monitoring and Simulation Results of a School Building in Northern Italy. Energy Build. 2024, 322, 114665. [Google Scholar] [CrossRef]
  25. Carrer, P.; De Oliveira Fernandes, E.; Santos, H.; Hänninen, O.; Kephalopoulos, S.; Wargocki, P. On the Development of Health-Based Ventilation Guidelines: Principles and Framework. Int. J. Environ. Res. Public Health 2018, 15, 1360. [Google Scholar] [CrossRef]
  26. Sekhar, S.C.; Lim, A.H. Indoor Air Quality and Energy Issues of Refrigerant Modulating Air-Conditioning Systems in the Tropics. Build. Environ. 2003, 38, 815–825. [Google Scholar] [CrossRef]
  27. Licina, D.; Langer, S. Indoor Air Quality Investigation before and after Relocation to WELL-Certified Office Buildings. Build. Environ. 2021, 204, 108182. [Google Scholar] [CrossRef]
  28. Vergerio, G.; Becchio, C. Pursuing Occupants’ Health and Well-Being in Building Management: Definition of New Metrics Based on Indoor Air Parameters. Build. Environ. 2022, 223, 109447. [Google Scholar] [CrossRef]
  29. Schweiker, M.; Shukuya, M. Comparison of Theoretical and Statistical Models of Air-Conditioning-Unit Usage Behaviour in a Residential Setting Under Japanese Climatic Conditions. Build. Environ. 2009, 44, 2137–2149. [Google Scholar] [CrossRef]
  30. Yaglou, C.P.; Riley, E.C.; Coggins, D.I. Ventilation Requirements. ASHVE Trans. 1936, 42, 133–162. [Google Scholar]
  31. Park, J.; Loftness, V.; Aziz, A.; Wang, T.H. Critical Factors and Thresholds for User Satisfaction on Air Quality in Office Environments. Build. Environ. 2019, 164, 106310. [Google Scholar] [CrossRef]
  32. Peter, W.; Peter, T.; Ute, M.; Bernhard, D.; Anna, W.; Michael, K.; Hans-Peter, H. Health and Wellbeing of Occupants in Highly Energy Efficient Buildings: A Field Study. Int. J. Environ. Res. Public Health 2017, 14, 314. [Google Scholar] [CrossRef]
  33. GB 50176; Code for Thermal Design of Civil Building. Ministry of Housing and Urban-Rural Development of the People’s Republic of China: Beijing, China, 2016.
  34. Lan, L.; Lian, Z. Application of Statistical Power Analysis–How to Determine The Right Sample Size in Human Health, Comfort and Productivity Research. Build. Environ. 2010, 45, 1202–1213. [Google Scholar] [CrossRef]
  35. ANSI/ASHRAE Standard 55-2023; Thermal Environmental Conditions for Human Occupancy. American Society of Heating, Refrigerating and Air-Conditioning Engineers: Atlanta, GA, USA, 2023.
  36. ISO 7726; Ergonomics of the Thermal Environment—Instruments for Measuring Physical Quantities. International Organization for Standardization: Geneva, Switzerland, 2001.
  37. Lin, Y.; Yang, L.; Luo, M. Physiological and Subjective Thermal Responses to Heat Exposure in Northern and Southern Chinese People. Build. Simul. 2021, 14, 1619–1631. [Google Scholar] [CrossRef]
  38. Yang, Y. Body Temperature and Thermoregulatory Physiology; People’s Military Medical Publishing House: Beijing, China, 2015. [Google Scholar]
  39. Castellani, J.; Young, A. Human Physiological Responses to Cold Exposure: Acute Responses and Acclimatization to Prolonged Exposure. Auton. Neurosci. 2016, 196, 63–74. [Google Scholar] [CrossRef]
  40. Choi, J.; Miki, K.; Sagawa, S.; Shiraki, K. Evaluation of Mean Skin Temperature Formulas by Infrared Thermography. Int. J. Biometeorol. 1997, 41, 68–75. [Google Scholar] [CrossRef]
  41. Mitchell, D.; Wyndham, C. Comparison of Weighting Formulas for Calculating Mean Skin Temperature. J. Appl. Physiol. 1969, 26, 616–622. [Google Scholar] [CrossRef]
  42. He, Y.; Li, N.; Zhang, H.; Zhou, L. Air-conditioning Use Behaviors when Elevated Air Movement Is Available. Energy Build. 2020, 225, 110370. [Google Scholar] [CrossRef]
  43. ASHRAE. Handbook of Fundamentals; American Society of Heating, Refrigerating and Air-Conditioning Engineers Inc.: Atlanta, GA, USA, 2017. [Google Scholar]
  44. Hui, Y.; Tang, Y.; Yang, Q.; Mochida, A. Numerical Study on Influence of Surface Vegetation on Aerodynamics of High-Rise Buildings. Sustain. Cities Soc. 2024, 107, 105407. [Google Scholar] [CrossRef]
  45. Xu, H. Study on the Night Air Conditioning Thermal Environment of a College Dormitory in Chongqing. Master’s Thesis, Chongqing University, Chongqing, China, 2015. [Google Scholar]
  46. Zhang, H.; Arens, E.; Kim, D.E.; Buchberger, E.; Bauman, F.; Huizenga, C. Comfort, Perceived Air Quality, and Work Performance in a Low-Power Task–Ambient Conditioning System. Build. Environ. 2010, 45, 29–39. [Google Scholar] [CrossRef]
  47. GB 50325; Code for Indoor Environmental Pollution Control of Civil Building Engineering. Ministry of Housing and Urban-Rural Development of the People’s Republic of China: Beijing, China, 2020.
  48. GB/T 18883; Indoor Air Quality Standard. Department of Industry and Transportation. National Standards Commission: Beijing, China, 2002.
  49. T/CECS 586; Technical Specification for Pollution L of Fine Particulate Matter (PM2.5) in Building. China Academy of Building Research: Beijing, China, 2019.
  50. USEPA. Risk Assessment Guidance for Superfund Volume I—Human Health Evaluation Manual (Part A); Office of Emergency and Remedial Response: Washington, DC, USA, 1989. [Google Scholar]
  51. Toftum, J.; Jørgensen, A.S.; Fanger, P.O. Upper Limits of Air Humidity for Preventing Warm Respiratory Discomfort. Energy Build. 1998, 28, 15–23. [Google Scholar] [CrossRef]
  52. Vecchi, R.D.; Cândido, C.M.; Lamberts, R. Thermal History and Comfort in a Brazilian Subtropical Climate: A ‘Cool’ Addiction Hypothesis. Ambient Constr. 2016, 16, 7–20. [Google Scholar] [CrossRef]
  53. Liang, W.; Lu, M.; Yang, X. Development of a Physics-Based Model for Analyzing Formaldehyde Emissions from Building Material Under Coupling Effects of Temperature and Humidity. Build. Environ. 2021, 203, 108078. [Google Scholar] [CrossRef]
  54. Molina, C.; Jones, B.; Hall, I.P.; Sherman, M.H. CHAARM: A Model to Predict Uncertainties in Indoor Pollutant Concentrations, Ventilation and Infiltration Rates, and Associated Energy Demand in Chilean Houses. Energy Build. 2020, 230, 110539. [Google Scholar] [CrossRef]
  55. Collison, A.K.; Byrne, M.A.; McGrath, J.A. Indoor Air Quality in Naturally Ventilated Classrooms and Offices in Ireland. Build. Environ. 2025, 279, 113023. [Google Scholar] [CrossRef]
  56. Kim, J.; Hong, T.; Kong, M.; Jeong, K. Building Occupants’ Psycho-Physiological Response to Indoor Climate and CO2 Concentration Changes in Office Buildings. Build. Environ. 2020, 169, 106596. [Google Scholar] [CrossRef]
  57. Berglund, L.G.; Cain, W.S. Perceived Air Quality and the Thermal Environment. In The Human Equation: Health and Comfort: Proceedings of the ASHRAE/SOEH Conference, IAQ 89, San Diego, CA, USA, 17–20 April 1989; American Society of Heating, Refrigerating, and Air-Conditioning Engineers: Atlanta, GA, USA, 1989; pp. 93–99. [Google Scholar]
  58. Mui, K.W.H.; Chan, W.T.D. Adaptive Comfort Temperature Model of Air-Conditioned Building in Hong Kong. Build. Environ. 2003, 38, 837–852. [Google Scholar] [CrossRef]
  59. Fang, L.; Clausen, G.; Fanger, P.O. Impact of Temperature and Humidity on the Perception of Indoor Air Quality. Indoor Air 1998, 8, 276–284. [Google Scholar] [CrossRef]
  60. Mcfadden, E.R. Respiratory Heat and Water Exchange: Physiological and Clinical Implications. J. Appl. Physiol. 1983, 54, 331–336. [Google Scholar] [CrossRef]
  61. Drettner, B.; Proctor, D.F.; Andersen, I.B. The Nose: Upper Airway Physiology and the Atmospheric Environment; Elsevier: Amsterdam, The Netherlands, 1982. [Google Scholar]
  62. Zhang, Y. The Experimental Research into the Influence of Temperature and Carbon Dioxide on Human Comfort in Small Space. Master’s Thesis, Chongqing University, Chongqing, China, 2018. [Google Scholar]
Figure 1. Plan of the experimental room.
Buildings 15 02211 g001
Figure 2. Clothing insulation in ASHRAE 55-2023.
Buildings 15 02211 g002
Figure 3. Metabolic rates for typical tasks in ASHRAE 55-2023.
Buildings 15 02211 g003
Figure 4. Environment parameter test scenario.
Buildings 15 02211 g004
Figure 5. Location of skin temperature measurement points.
Buildings 15 02211 g005
Figure 6. Physiological parameter measurement scenario.
Buildings 15 02211 g006
Figure 7. Experimental flowchart.
Buildings 15 02211 g007
Figure 8. Main forms of windows and split air conditioners.
Buildings 15 02211 g008
Figure 9. Correlation between room area and air conditioner power.
Buildings 15 02211 g009
Figure 10. Variation in indoor air temperature with time.
Buildings 15 02211 g010
Figure 11. Correlation between mean skin temperature and operative temperature.
Buildings 15 02211 g011
Figure 12. Relationship between SBS and time ((aj) Comparison of SBS symptom severity in subjects at 26 °C and 20 °C across different time points; (k) trend of SBS symptom severity in subjects over time. (ns represents p > 0.05).
Buildings 15 02211 g012
Figure 13. Distribution frequency of air conditioner use modes.
Buildings 15 02211 g013
Figure 14. Difference in air conditioner use time. (a) Distribution frequency of the start date of air conditioner use; (b) distribution frequency of the end date of air conditioner use; (c) distribution frequency of the number of months the air conditioner was used; (d) distribution frequency of daily air conditioner use hours; (e) air conditioner use duration under different degrees of dependence on air conditioners.) (*** represents p < 0.001).
Buildings 15 02211 g014
Figure 15. Correlation between CO2 concentration and time.
Buildings 15 02211 g015
Figure 16. Differences in IAQ ((a) distribution frequency of CO2 concentration; (b) distribution frequency of formaldehyde concentration; (c) distribution frequency of PM2.5 concentration).
Buildings 15 02211 g016
Figure 17. Correlation of air quality satisfaction with (a) CO2 concentration and (b) indoor air temperature.
Buildings 15 02211 g017
Figure 18. Air pollutant concentrations in different air-conditioner-reliant modes (* represents p < 0.05, *** represents p < 0.001).
Buildings 15 02211 g018
Table 1. Basic information of the experimental subjects.
GenderAgeHeight [cm]Weight [kg]
Male (n = 6)21 ± 0.632175.2 ± 6.88177.8 ± 14.496
Female (n = 6)21.5 ± 1.761162.7 ± 4.14856.3 ± 3.324
Total (n = 12)21.3 ± 1.289168.9 ± 8.45067.0 ± 15.039
Table 2. Measured range and accuracy of the instruments.
InstrumentsTest ContentValid RangeAccuracy
TR-72U, temperature and humidity recorder (manufactured by T&D Corporation, located in Matsumoto, Japan)Ta−10–+60 °C±0.3 °C
RHin0–100%±5%
WFWZY-1, air velocity (manufactured by Beijing Tianjian Huayi Technology Development Company Limited, located in Beijing, China)Va0.05–30 m/s±5%
JTR04, temperature of the black globe tester (manufactured by Beijing Century Jiantong Technology Company Limited, located in Beijing, China; diameter: 150 mm)Tg5–120 °C±0.5 °C
DS1922L iButton, temperature recorder (manufactured by Maxim Integrated Products, Incorporated, located in San Jose, CA, United States)Tsk−40–85 °C ±0.5 °C
ST8306, a variety of pollutant monitoring equipment (manufactured by Smart Sensor Instrument Company Limited, located in Shenzhen, China) CO2 0~5000 ppm±30 ppm
Table 3. Basic information about the investigation subjects.
SPT AgeHeight [cm]Weight [kg]Metabolic Rate [Met]
SPT ≥ 26 °CMean32.4169.264.51.0
Max59.0186.0115.01.2
Min21.0151.043.01.0
Std±8.8±7.8±11.3±0.03
SPT < 26 °CMean28.6171.466.81.0
Max56.0189.0118.01.2
Min20.0153.043.00.8
Std±14.2±7.8±12.9±0.02
Table 4. Information about the instruments.
InstrumentTest ContentValid RangeAccuracy
ST8306, a variety of pollutant monitoring equipment (manufactured by Smart Sensor Instrument Company Limited, located in Shenzhen, China)CO2 0–5000 ppm±30 ppm
Formaldehyde0–2 ppm±0.01 ppm
PM2.50–500 μg/m3±10%
JT-IAQ, indoor thermal comfort tester (manufactured by Beijing Century Jiantong Technology Company Limited, located in Beijing, China)Ta1–60 °C±0.2 °C
RHin10–98%±1.5%
Va0.05–5 m/s±(0.03 m/s + 2% reading)
Tg1–60 °C±0.3 °C
Table 5. The difference between the actual skin temperature at 26 °C and the skin temperature predicted by the 20 °C equation at different times.
Time/minMean Actual Skin Temperature [°C]Predicted Mean Skin Temperature [°C]p
2032.6432.550.549
2532.4432.290.345
3032.2631.720.007
4032.0031.190.000
5031.6630.890.001
6031.3230.20 0.000
7031.0229.870.000
Table 6. Estimated lifetime cancer risk of formaldehyde.
GroupsMinMaxMeanStd
H group0.43 × 10−44.75 × 10−41.36 × 10−4±0.60 × 10⁻⁴
L group0.24 × 10−410.29 × 10−41.43 × 10−4±0.91 × 10⁻⁴
Disclaimer/Publisher’s Note: The statements, opinions and data contained in all publications are solely those of the individual author(s) and contributor(s) and not of MDPI and/or the editor(s). MDPI and/or the editor(s) disclaim responsibility for any injury to people or property resulting from any ideas, methods, instructions or products referred to in the content.

