Article

Correlation Between Outdoor Microclimate and Residents’ Health Across Different Residential Community Types in Wuhan, China: A Case Study of Hypertension

1
School of Urban Design, Wuhan University, Wuhan 430072, China
2
Faculty of Architecture, The University of Hong Kong, Hong Kong 999077, China
3
School of Earth and Space Science and Technology, Wuhan University, Wuhan 430072, China
4
Zhongnan Hospital of Wuhan University, Wuhan 430071, China
*
Author to whom correspondence should be addressed.
Buildings 2025, 15(13), 2210; https://doi.org/10.3390/buildings15132210
Submission received: 8 April 2025 / Revised: 11 June 2025 / Accepted: 17 June 2025 / Published: 24 June 2025
(This article belongs to the Section Building Energy, Physics, Environment, and Systems)

Abstract

The spatial layout of residential communities has a significant impact on the local microclimate. These microclimate changes subtly affect the daily feelings and health status of residents. This study takes hypertension as a case to simulate the outdoor microclimate characteristics of different types of communities, and to analyze the potential correlation between spatial design and the health of residents, providing a scientific basis for the design of health-oriented communities. Initially, the microclimate characteristics of communities are obtained through computational fluid dynamics (CFD) simulation. Subsequently, the correlation between the outdoor microclimate and the incidence of hypertension in communities is discussed. The study area covers communities within a 4 km radius of Zhongnan hospital. The results indicate that microclimatic factors, such as temperature, Predicted Mean Vote (PMV), and Universal Thermal Climate Index (UTCI), are significantly negatively correlated with the incidence of hypertension in communities of different building heights. For temperature, the absolute value of the correlation coefficient for multi-story communities is 0.431, slightly lower for mid-rise communities at 0.323, and further drops to 0.296 for high-rise communities. Correspondingly, the values for PMV are 0.434, 0.336, and 0.306, respectively. The values for UTCI are 0.442, 0.310, and 0.303, respectively. This effect gradually weakens as building heights increase. Fluctuations in wind speed appear to weakly influence the incidence of hypertension. These results provide a scientific basis for health-oriented urban planning.

1. Introduction

Residential communities are the primary spaces for daily human activities, having a significant impact on health and living comfort [1]. Recently, many studies have shown that environmental factors are associated with the incidence of hypertension and pose potential health risks to residential populations [2,3,4]. Feigin et al. reported that hypertension accounts for approximately 10.8 million deaths annually worldwide, which is nearly 20% of all deaths [5]. And hypertension has become a common chronic disease [6]. Therefore, studying the relationship between hypertension incidence and microclimate changes caused by community layouts is important to guide scientific community design [7].
Currently, a number of studies have focused on exploring the relationship between microclimate-driven individual-level temperature and blood pressure (BP) [8,9,10]. Many scholars have quantitatively analyzed this relationship by directly measuring individual-level temperature. Martin Meyer et al. [11] recorded the BP and personal environmental temperature (PET) of 52 young women, but their work missed the issue of sample incompleteness. Kashiba et al. [12] recorded real-time changes in participants’ body temperature and blood pressure using a web-based home blood pressure monitoring system. Their approach captures short-term fluctuations but does not consider the broader role of urban form and community-scale microclimate in shaping population health risks.
Subsequently, Megan et al. [13] expanded the scope of research from an individual-level to a broader environment. They obtained meteorological data from the local weather center and combined it with ambulatory blood pressure monitoring (ABPM) to investigate the association between climate and blood pressure. This study attracted considerable attention from researchers.For example, van den Hurk et al. [14] used climate parameters from the Royal Netherlands Meteorological Institute to examine associations between average daily temperature and humidity and blood pressure. Xu et al. [15] obtained hourly temperature data from the China Meteorological Administration to investigate its association with systolic blood pressure (SBP), diastolic blood pressure (DBP), pulse pressure (PP), and mean arterial pressure (MAP). Zheng et al. [16] collected the daily average temperature, relative humidity, wind speed, and air pressure from the Jinchang Meteorological Bureau to analyze the effects of these climate parameters on winter blood pressure. Kang et al. [17] creatively proposed the use of meteorological satellite data to obtain the land surface temperature. Although these studies used different approaches to emphasize environmental influences, they focused primarily on the large-scale environment and overlooked local variability within urban areas.
In recent years, with the rise of CFD simulation technology [18], some researchers have begun to use this technology to calculate indoor temperature [19]. This method estimates the microclimate corresponding to each level of thermal insulation in residential buildings by using the thermal simulation software AE-Sim/Heat (available at: http://ae-sol.co.jp/). And the relationship between the indoor microclimate and the incidence of diseases was analyzed. However, extant studies have not focused on investigating this issue at the community scale and have overlooked differences between communities. Niu et al. [20] analyzed the indoor wind environment of high-rise residential buildings through CFD simulation and studied disease transmission. However, this study has certain limitations. First, the study only focuses on the wind environment, ignoring the possible impact of human thermal comfort on disease incidence rates. Second, the scope of the research is relatively narrow, limited to the indoor environment of high-rise residential buildings. The study does not include the outdoor environment, nor does it consider the differences between residential buildings of different heights. Although Yang et al. [21] considered the impacts of ventilation conditions and thermal comfort on the disease incidence rate in their research, their research scope was only limited to the indoor environment of hospitals. They neither included normal adult individuals as research subjects nor considered the situations in daily activity scenarios. Consequently, the correlation between community-level microclimate and hypertension remains to be further explored [22].
This study applies computer-based simulation methods to efficiently obtain their microclimate characteristics. Through this method, key parameters such as average wind speed, temperature, PMV, and UTCI are quantitatively characterized. Compared with traditional microclimate research methods that rely on site measurements, this paper introduces CFD simulation to conduct efficient and detailed modeling and analysis of the outdoor microclimate of residential communities. This not only improves research efficiency but also overcomes the problems of limited data and insufficient spatial coverage in site measurements. In terms of selecting microclimate indicators, this paper considers both ventilation conditions and thermal comfort indicators and combines them with the incidence of hypertension to preliminarily explore the correlation mechanism between spatial form and residents’ health. In addition, this paper classifies residential communities according to building height to identify the differences in microclimate regulation among different building forms. This classification method provides a scientific basis for health-oriented urban planning.

2. Materials and Methods

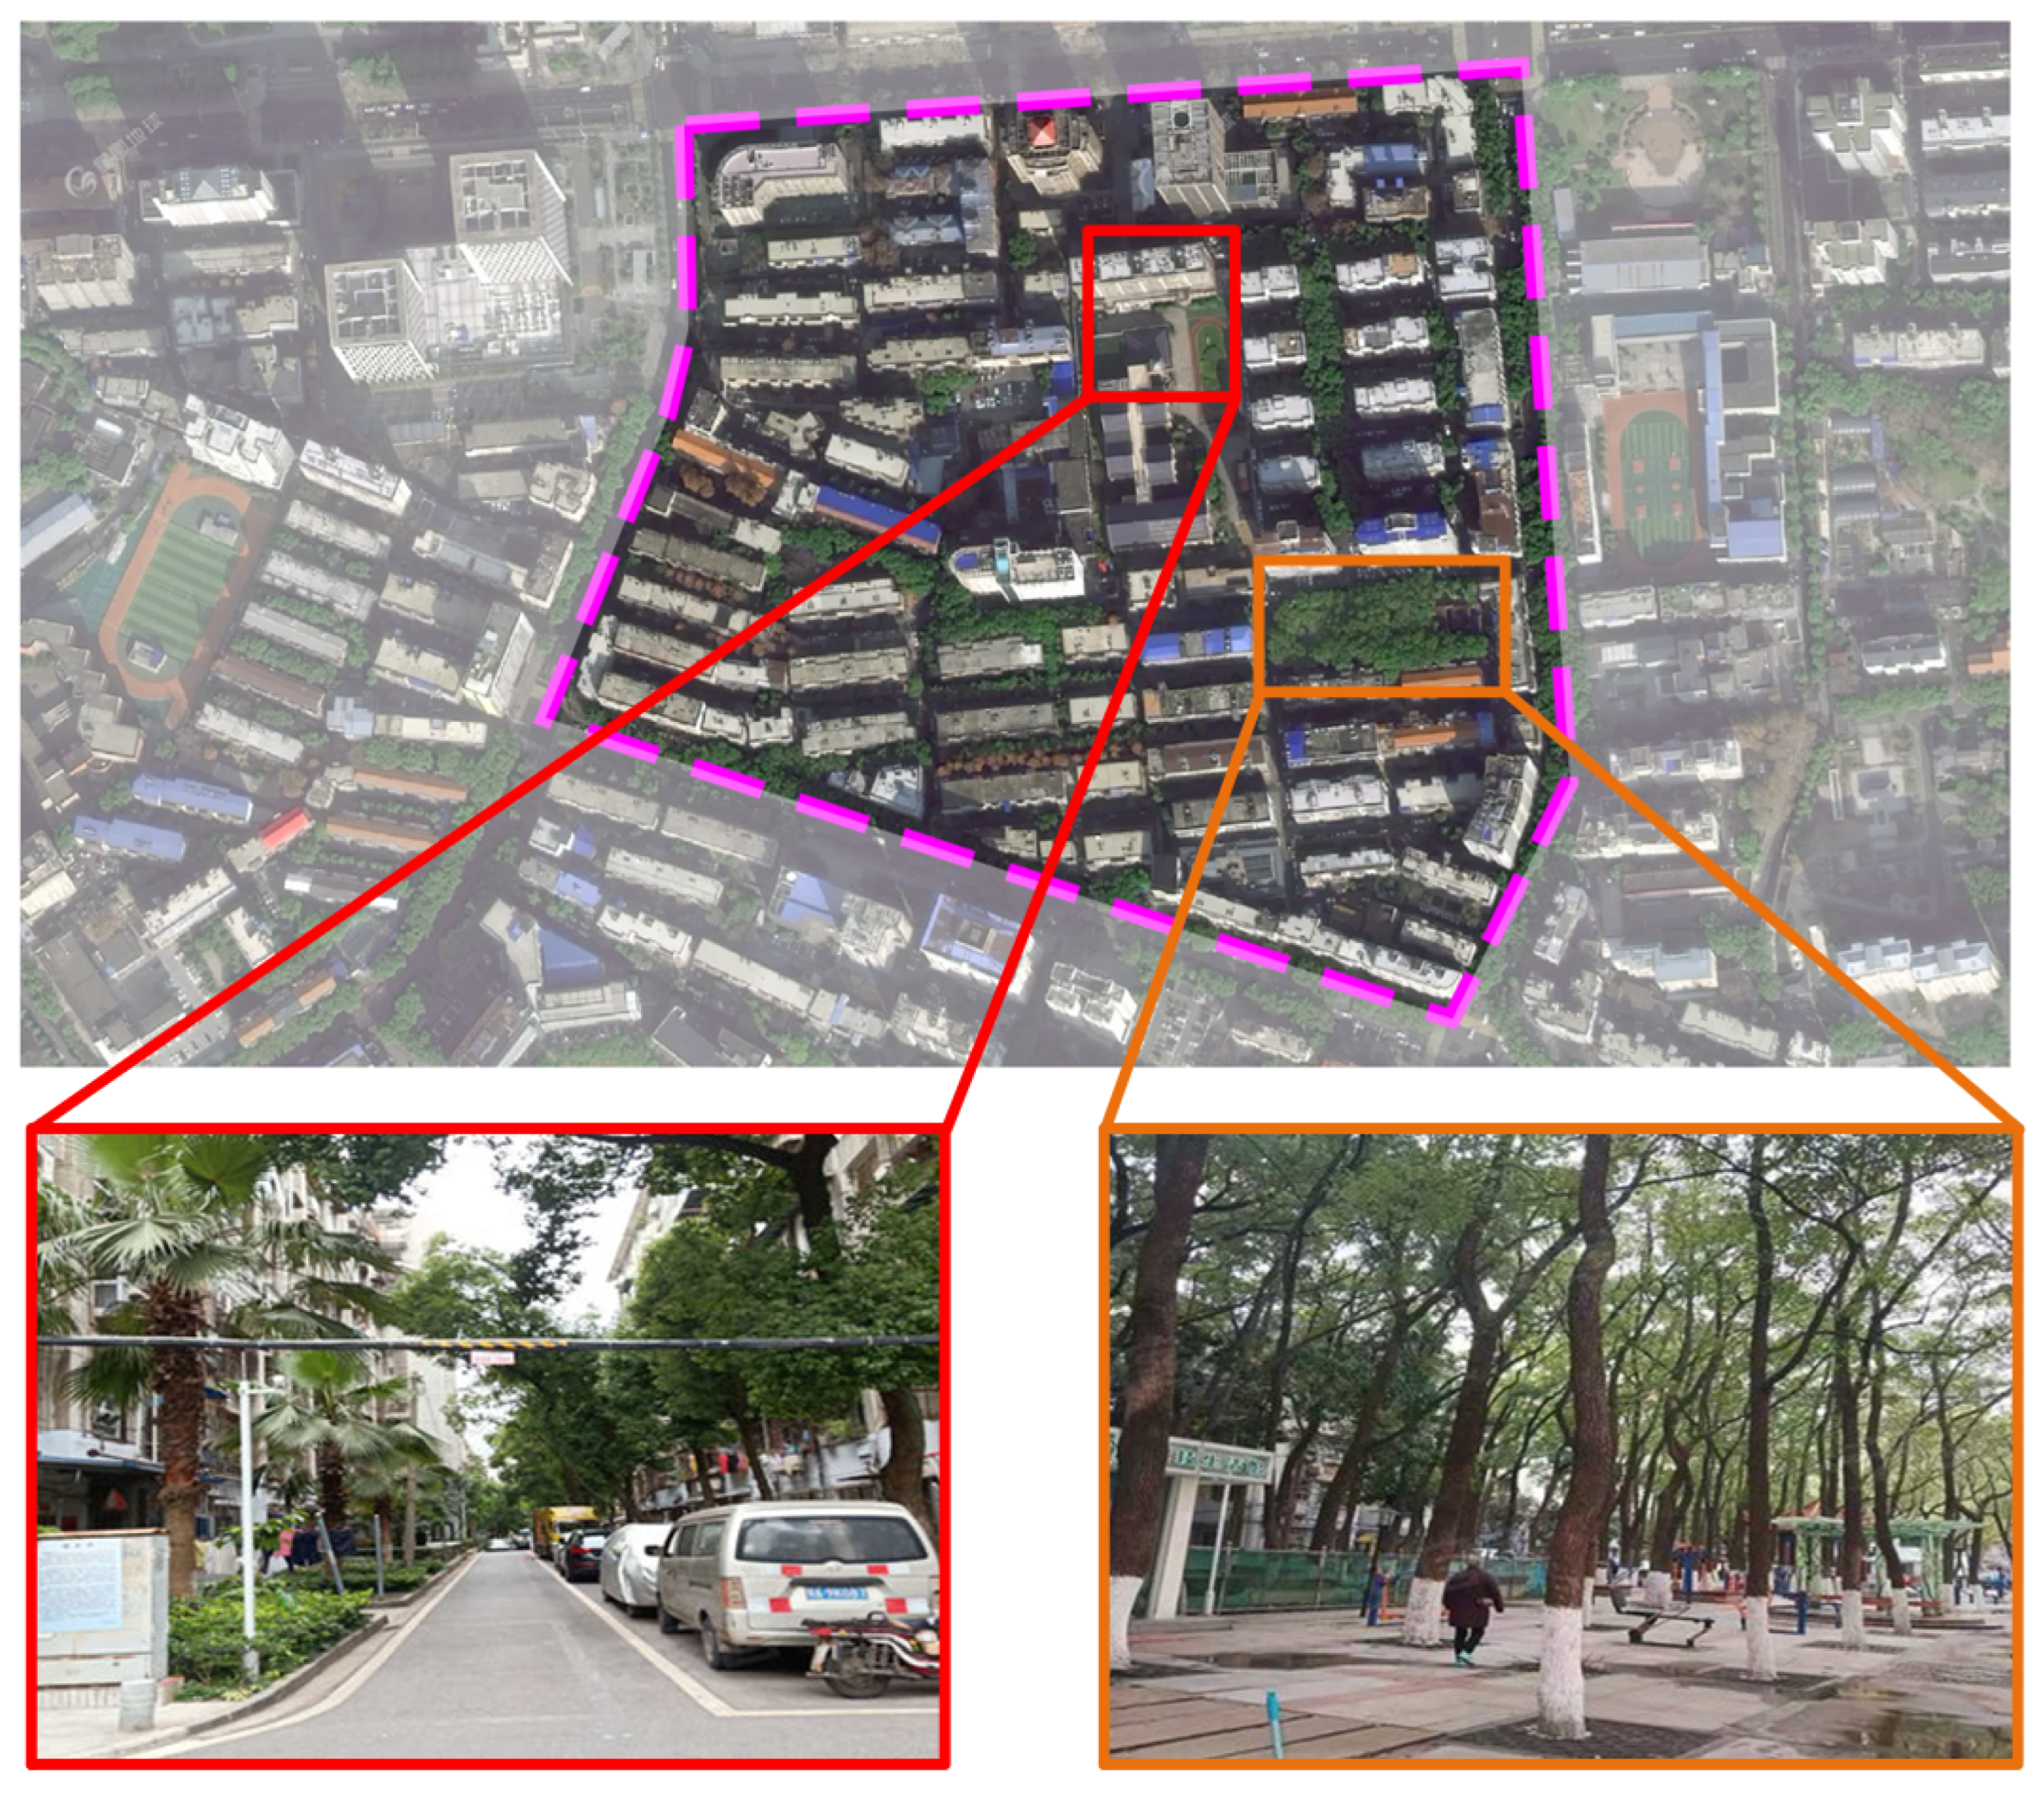
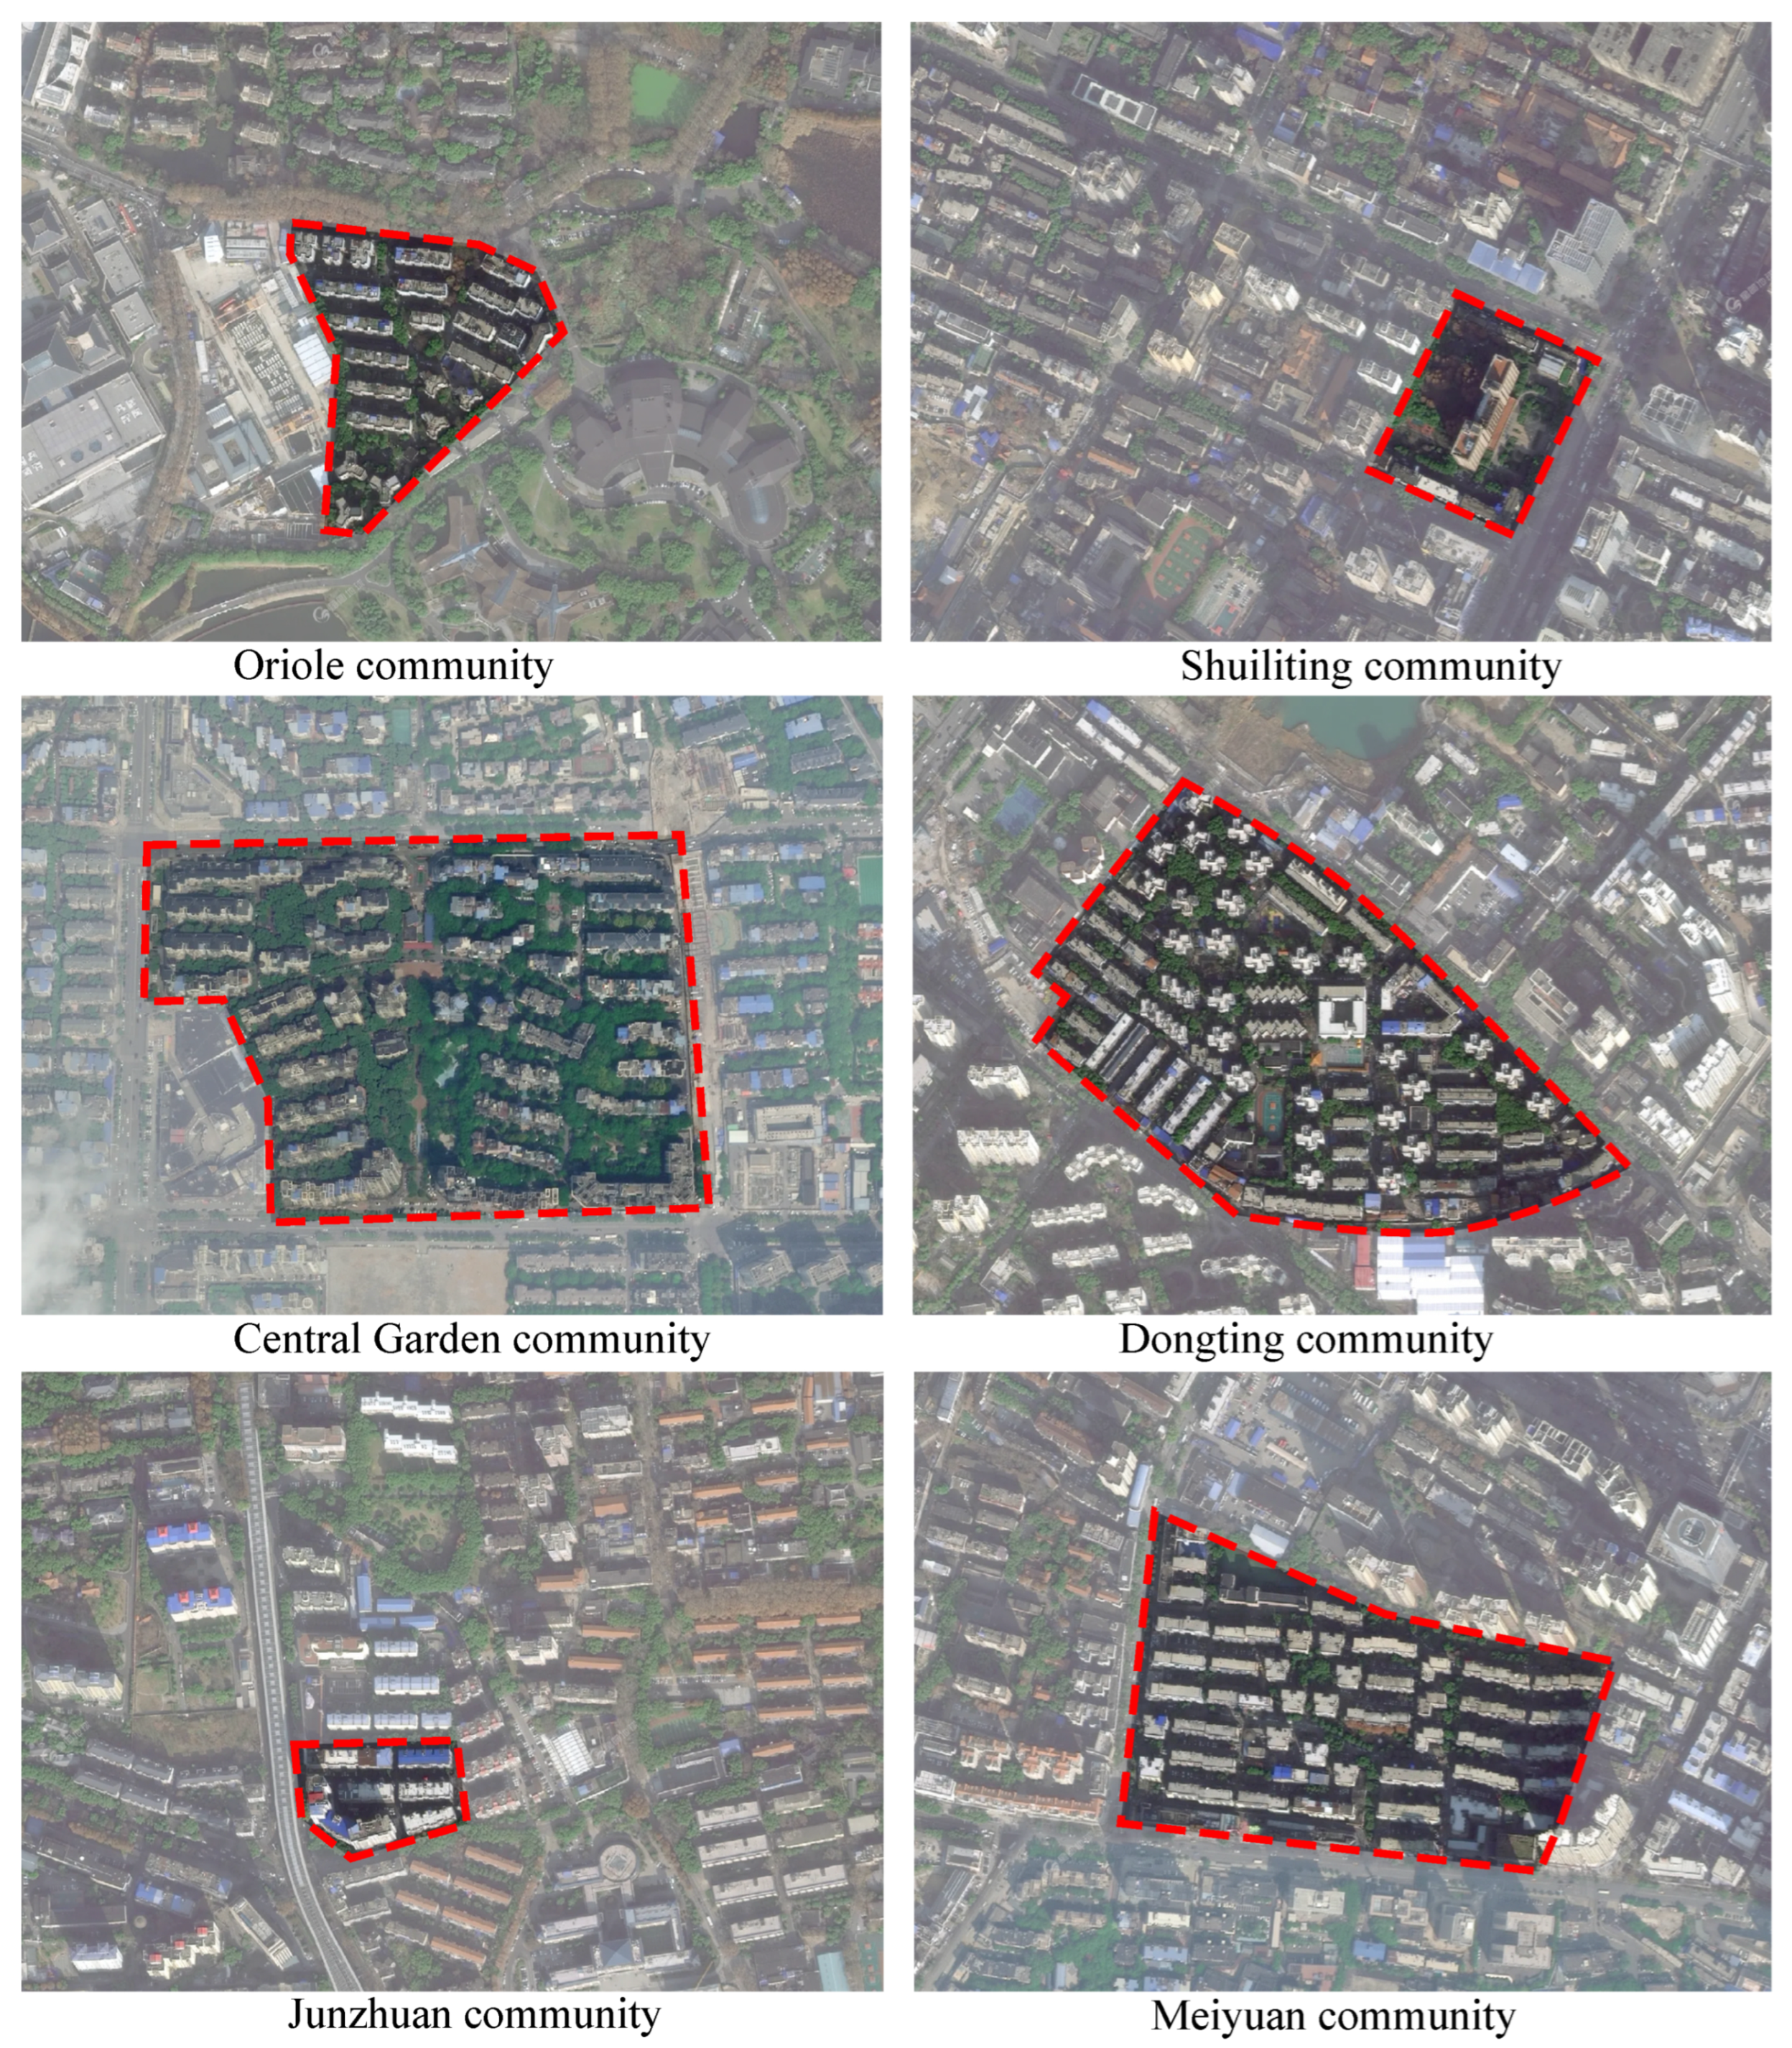
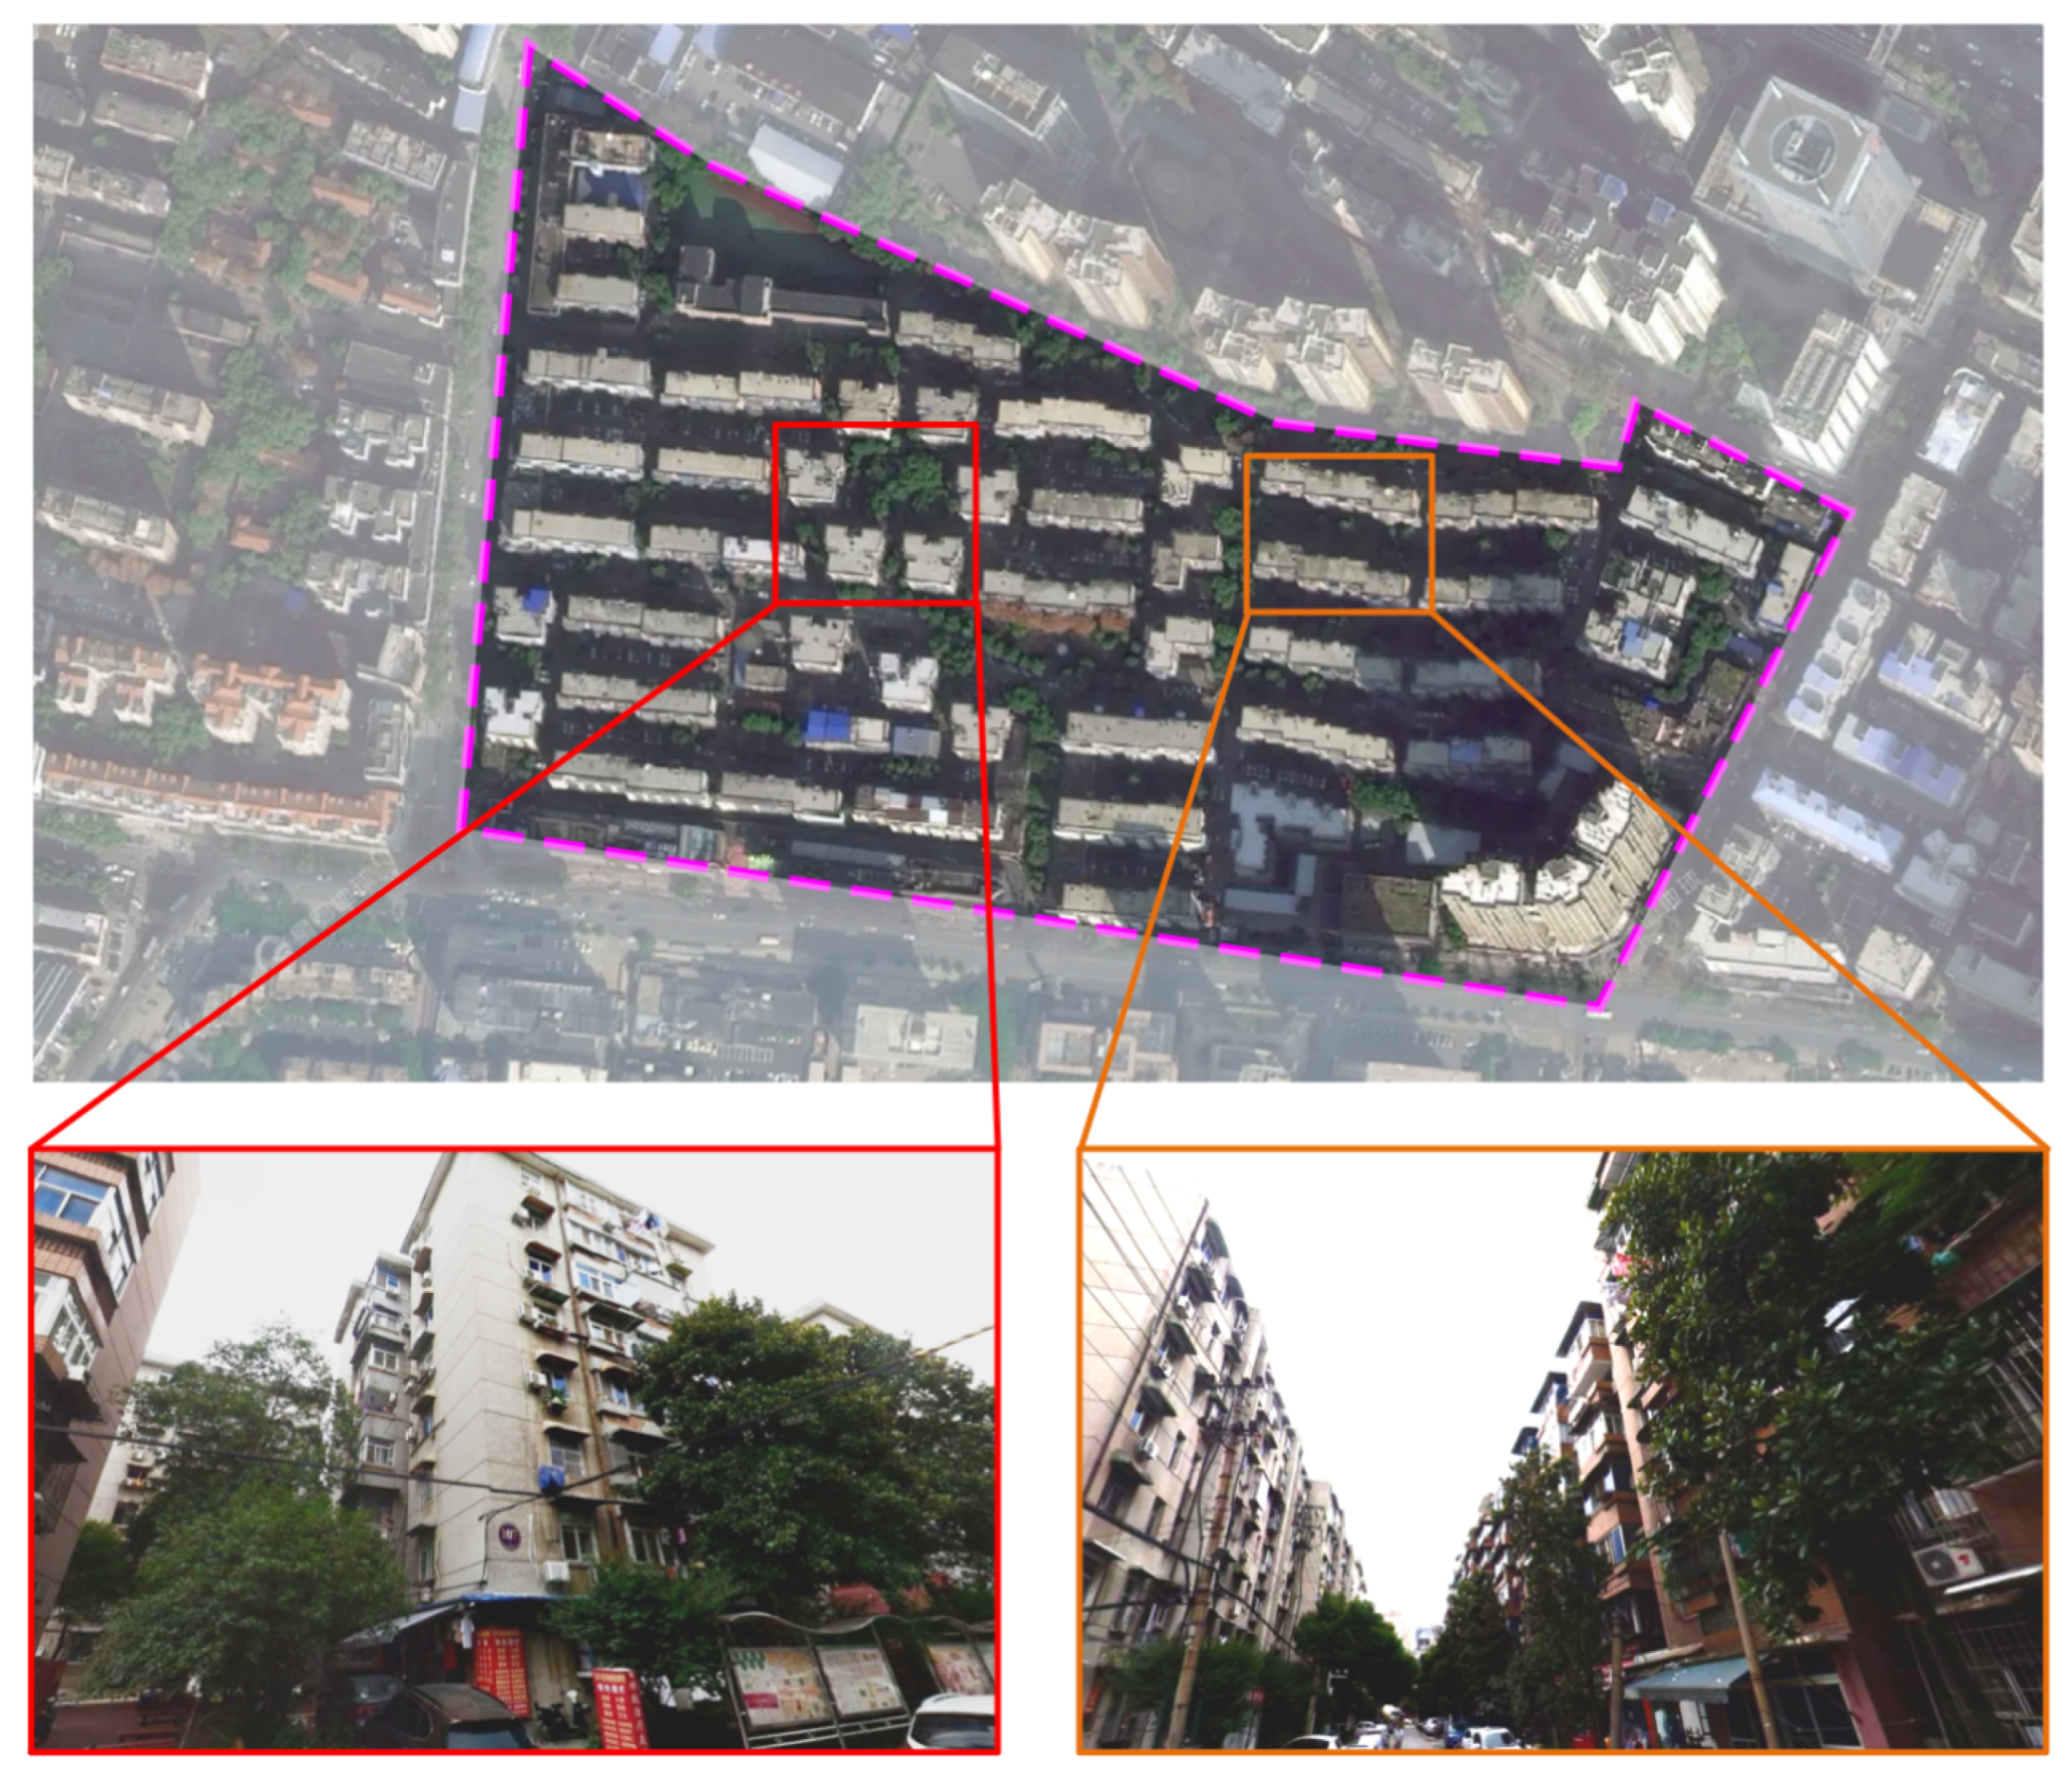
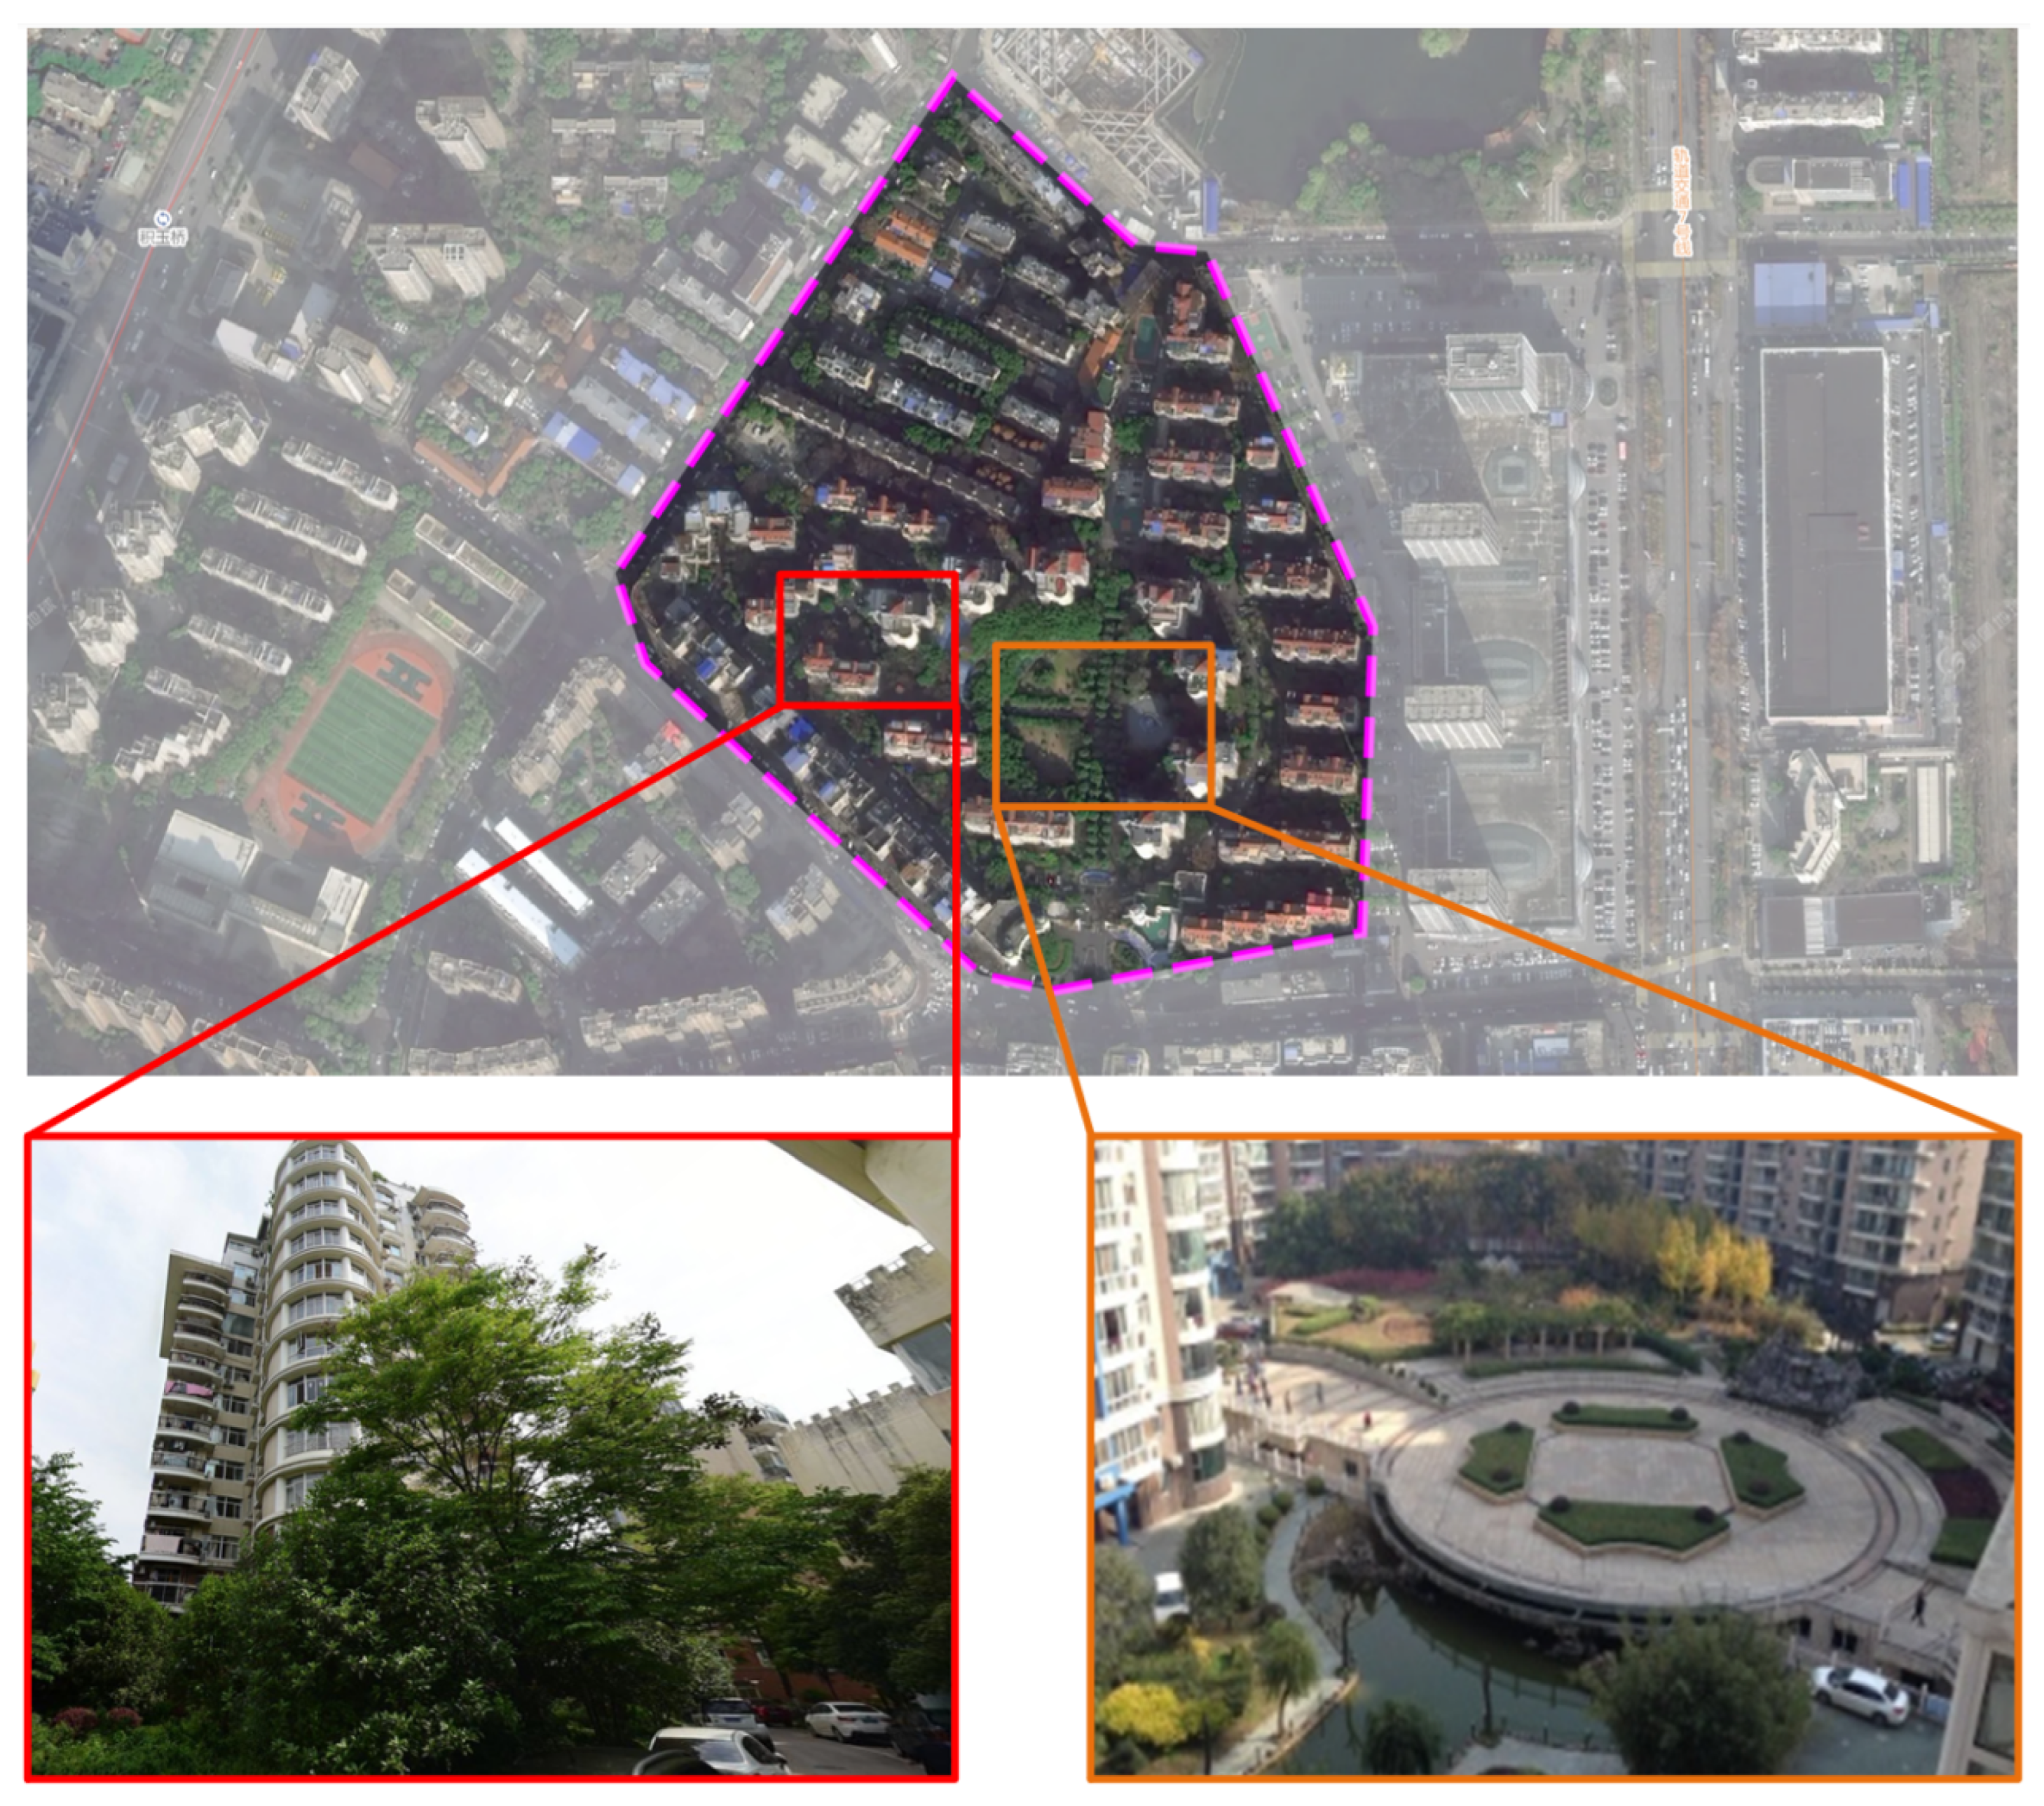
2.1. Study Area and Data

The study site for this research is situated in Wuhan City, Hubei Province. Located at the confluence of the Yangtze and Han Rivers, Wuhan spans a total area of 8569 km², with geographic coordinates ranging from 113 ° 41 to 115 ° 05 E and 29 ° 58 to 31 ° 22 N [23,24,25]. The city is bordered by water on three sides and features a diverse subsurface composition, including lakes, marshes, and roads, with lakes and rivers accounting for approximately one-fourth of its total area [23]. Wuhan is characterized by a humid subtropical monsoon climate, in which the weather in summers is hot and rainy [26], with prevailing easterly and southeasterly winds. The average daily temperature ranges from 26 °C to 30 °C, and on about 25% of the summer days the maximum temperature exceeds 35 °C [27]. In contrast, in winter (from December to February), prevailing winds are from the north, and temperatures range from 7.5 °C to 18 °C [28]. This significant seasonal temperature variation provides an ideal setting for investigating the impact of differing climatic conditions on hypertension incidence. Furthermore, Wuhan has undergone unprecedented urbanization over the past three decades [29], resulting in a dynamic mix of new and established urban districts, which enriches the scope of this study’s research targets.
The hypertension data used in this study were obtained from the Zhongnan Hospital of Wuhan University and include residents aged 15 to 105 years. Among them, 55% are male and 45% are female. In terms of age, 10% are in the 15–44 group, 24% are in the 45–59, and 66% are 60 years or older. Accordingly, the study area was defined as 18 representative residential communities within a 4 km radius around the hospital, as depicted in Figure 1. Residential communities is a common residential type in China. They tend to have clearly established boundaries, forming relatively closed spatial structures with shared outdoor spaces accessible only to residents. The residential communities within the scope of this study mainly include two layout types: the point layout and the row layout. The point layout is defined by the distribution of multiple buildings across the site. Conversely, the row layout refers to buildings arranged in rows with a consistent orientation and reasonable spacing, forming a more organized architectural cluster. The selected communities are diverse in type, which provides a comprehensive analysis of the environmental and urban factors that influence the incidence of hypertension. In this study, we classified residential communities according to building height.

2.2. Community Classification by Height of Buildings

This paper refers to the classification method in The General Code for Civil Buildings (GB 50352-2019) [30] and adjusts it according to the actual situation of the residential communities within the research scope. Therefore, the classification criteria in this study were adjusted to divide the buildings into three categories: multi-story residential buildings (4 to 6 stories), mid-rise residential buildings (7 to 11 stories), and high-rise residential buildings (12 stories or more, but not exceeding 100 m). All three types follow their respective urban planning standards. Within each category, the communities show a high degree of similarity in key environmental and physical characteristics, such as vegetation composition, minimum green coverage, ground surface materials, and wall materials. The distribution is shown in Figure 1.
As Figure 2 shows, multi-story residential communities became a typical residential form during China’s urbanization from the 1990s to the early 21st century [31]. These communities are characterized by 5- to 6-story frame-structured residential buildings, with building densities ranging from 22% to 39% and floor area ratios (FARs) typically between 1.2 and 1.8.
As shown in Figure 3, the Zhangjiawan community has a building density of 37.8% and a green cover of 32%. The row pattern creates a distinct “street canyon” effect. The height-to-width ratios (H/W) of the streets range from approximately 0.8 to 1.2, and hard pavement comprises 65% to 75% of the total area, primarily composed of asphalt and cement mortar. The community also features a multi-layered greening system with evergreen trees such as camphor and magnolia, and low shrubs including holly and Helianthus annuus. In addition, the public spaces are paved with permeable concrete blocks with a permeability coefficient of 1 × 10⁻³ cm/s, which form a public green zone with a central fitness area [32].
Mid-rise communities signify a transitional form in the evolutionary development of urban planning. Compared to multi-story communities, these communities strike a balance between efficient land utilization and residential comfort, resulting in more flexible spatial organization strategies. As shown in Figure 4, the mid-rise community adopts a combination of a row layout and a point layout, which effectively improves ventilation and thermal conditions. The row-layout buildings along the perimeter create continuous ventilation corridors, facilitating effective air circulation and mitigating thermal accumulation [33]. Meanwhile, the point layout buildings in the central area reduce airflow obstruction, facilitating heat dissipation [34].
The Meiyuan community, for instance, exhibits a building density of 31.8% and a greening rate of 35%. As illustrated in Figure 5, the community is designed using a row layout and point layout with two types of buildings: 8-story and 11-story buildings. The 8-story buildings are aligned in rows along the north–south axis, forming the main ventilation corridors. Meanwhile, the 11-story buildings are distributed in a point pattern in the central area of the site, creating a synergistic spatial relationship. The Meiyuan residential community has a street canyon H/W ratio between 1.2 and 1.5, which falls between multi-story and high-rise residential communities. At lower floors, the wind environment remains relatively mild. Although the wind speeds on the upper floors increase, they rarely result in excessive wind pressure [35,36]. Meanwhile, the 35% green cover further enhances the regulation of the microclimate.The frictional effect generated by the vegetation canopy has been shown to effectively reduce near-surface wind speeds. In addition, plant transpiration has been shown to reduce the air temperature at a height of 1.5 m in paved areas, thereby improving the overall thermal comfort of the community [37,38].
As shown in Figure 6, high-rise communities are typical representations of the vertical development model in modern cities, making them an important type of urban living space [39]. The environmental impact of such buildings is closely related to their spatial layout characteristics [40]. They typically adopt a layout of core concentration and peripheral diffusion, dominated by point pattern high-rise structures integrated with open public spaces [41]. However, the height of the buildings is significant, which tends to create a wind corridor effect between the towers, resulting in increased wind speeds in certain areas [42]. This phenomenon is particularly evident in upper-floor residential zones, where high-altitude wind pressure may pose challenges to both thermal comfort and structural safety [43,44].
Figure 7 illustrates the environmental conditions of the Shanglong community, which has a building density of 27.3% and a greening rate of 41%.The central area of the community is surrounded by 20-story buildings arranged in a clustered point pattern, creating a public activity space. The outer area consists of 10- to 16-story buildings arranged in rows along the streets. Building heights gradually decrease from the center to the periphery, forming a spatial structure that gradually becomes lower vertically. As the height of a building increases, the velocity of the wind typically accelerates, making its effects more noticeable on upper floors. During windy seasons, high-rise buildings may experience significant wind pressure. Furthermore, in comparison with residential communities of other height categories, the Shanglong community is characterized by a more diverse underlying surface. A plaza and fountain are located at the center of the community. Except for the areas paved with tiles and cement mortar, most of the open spaces between the residential buildings are covered with vegetation, providing a high level of greenery throughout the community.

2.3. CFD Simulation Settings

Traditional field measurements typically rely on portable sensors for sampling on the pointwise basis [45,46]. However, this method is constrained by limited sensor deployment, weather-related data collection difficulties, and substantial costs for long-term monitoring. To implement simultaneous observation, the necessary number of persons and devices for data collection are required.
CFD is a method that utilizes numerical simulation techniques to model fluid flow, heat and mass transfer, and related physical processes [47]. CFD is capable of constructing three-dimensional meteorological models to rapidly simulate microclimate parameters (wind speed, temperature, and PMV) at the community scale [48]. This approach not only decreases systematic bias caused by insufficient sampling density, but also significantly improves experimental efficiency. Accordingly, this study innovatively employs CFD simulation to examine microclimate parameters in communities, facilitating further analysis of their association with hypertension incidence.

2.3.1. Software Selection

In this study, CFD software Phoenics [49] (available at: http://www.cham.co.uk/phoenics.php) is used to simulate the outdoor thermal environment of the selected communities. The module [50] of Phoenics uses a structured mesh and supports three-dimensional simulations under different conditions. This approach ensures fast convergence and high solution accuracy, providing reliable simulation results [51]. In addition, the module supports data import and export in various formats, such as SketchUp, CAD, and 3ds Max, which enhances its applicability and flexibility for complex urban modeling tasks [52].
ENVI-met is a software tool that utilizes a three-dimensional non-hydrostatic model to simulate urban microclimates [53]. It is founded on the principles of fluid dynamics and thermodynamics, and aims to simulate microclimate interactions between the atmosphere, soil, vegetation, and buildings in small- to medium-sized urban areas [54]. However, ENVI-met has some limitations in microclimate modeling, which is insensitive to variables such as wind speed and prone to bias under extreme weather conditions [55]. Additionally, it generally uses regular grids [56], which makes it difficult to accurately model complex building geometries.
This study uses Phoenics to simulate the microclimate of a residential community and performs a comparative validation with the experimental results from ENVI-met (version V5.6.1 Winter23) [57]. The experiment focuses on key outdoor variables, including wind speed, temperature, PMV and UTCI. By comparing the outputs of the two software tools and identifying their differences, the work helps to explore the relationship between these microclimatic factors and the incidence of hypertension.

2.3.2. Climate Indicator Settings

This section focuses on the climate changes in Wuhan from 2016 to 2020. Monthly climate data were obtained from the China Meteorological Data Network (CMDN, https://data.cma.cn/ (accessed on 16 March 2025)), including key meteorological parameters such as wind speed, wind direction at maximum wind speed, air temperature, humidity, sunshine duration, and direct and diffuse solar radiation. Based on the annual activity cycle, the initial parameters for the Phoenics model were configured as shown in Table 1. According to the Design Code for Heating, Ventilation and Air Conditioning of Civil Buildings (GB 50736-2012) [58], the reference height for wind speed is set to 10 m above ground level. An exponential model [49] was used to describe the variation in wind speed with height. Considering that the study area is characterized by densely distributed buildings but relatively few high-rise structures, following the recommendations of the official Phoenics website, a power law index of 0.22 was chosen to ensure that the model is well suited to the urban terrain conditions of the study area [59,60].

2.3.3. Built Environment Settings

In this section, physical models were constructed for each community based on the building classification framework that was proposed in Section 2.2, and the thermal environment was simulated. To improve the accuracy of the wind speed and temperature field simulations, the physical model includes not only the target community, but also all buildings within a 300 m radius. At the same time, the CAD base map and Google Earth satellite imagery of the study area were imported into SketchUp to create detailed models of the vegetation and urban road network. For example, the model of the Oriole Community shown in Figure 8 serves as a representative case. These models were exported to Phoenics and ENVI-met, where appropriate material properties were assigned.
The material properties assigned to each object are detailed in Table 2. The types of vegetation in residential communities are identified through field surveys. Then, corresponding parameters such as leaf area index, drag coefficient, and transpiration rate are assigned. To more accurately reflect seasonal variations in vegetation status, the year is divided into three phases: summer, winter, and the transitional seasons. For evergreen plants, all parameters remained constant throughout the simulations. For other vegetation types, such as deciduous plants, the relevant parameters are adjusted based on the season.

2.3.4. Physical Parameters

Both Phoenics and ENVI-met support customization of physical parameters for virtual humans [61,62], including weight, height, walking speed, body surface area, and thermal resistance of clothing, as shown in Table 3. Based on historical weather data, Wuhan’s climate is classified into three seasonal periods [63]: winter (January, February, and December), transitional seasons (March, April, October, and November), and summer (May to September).The respective clothing thermal resistance values are set at 1.0 clo, 0.8 clo, and 0.6 clo. This is based on the default recommended values, which are intended to ensure consistency with the characteristics of seasonal climate variations.

2.3.5. Turbulence Model Selection

In this study, the standard k- ϵ model is used for airflow simulation. Due to its high stability and computational efficiency, the model has been widely applied in engineering and environmental fields [64]. The flow around buildings, which is typically characterized by incompressible, low-speed turbulence, follows the Boussinesq approximation and the interactions between airflow and building surfaces often result in confined flow, so the standard k- ϵ model is particularly well suited for such scenarios [65]. The model effectively meets the requirements of this microclimate simulation by providing a good balance between low computational cost and high prediction accuracy for the simulation of confined flows influenced by wall boundaries [66].

2.4. Exporting Simulation Results

Tecplot software (Tecplot 360 EX, version 2023) [67] was used to extract wind speed data at each measurement point from the CFD simulation results and calculate the average monthly wind speed for each community. Subsequently, the same method was employed to calculate the average temperature and PMV values in the later stages of the study.

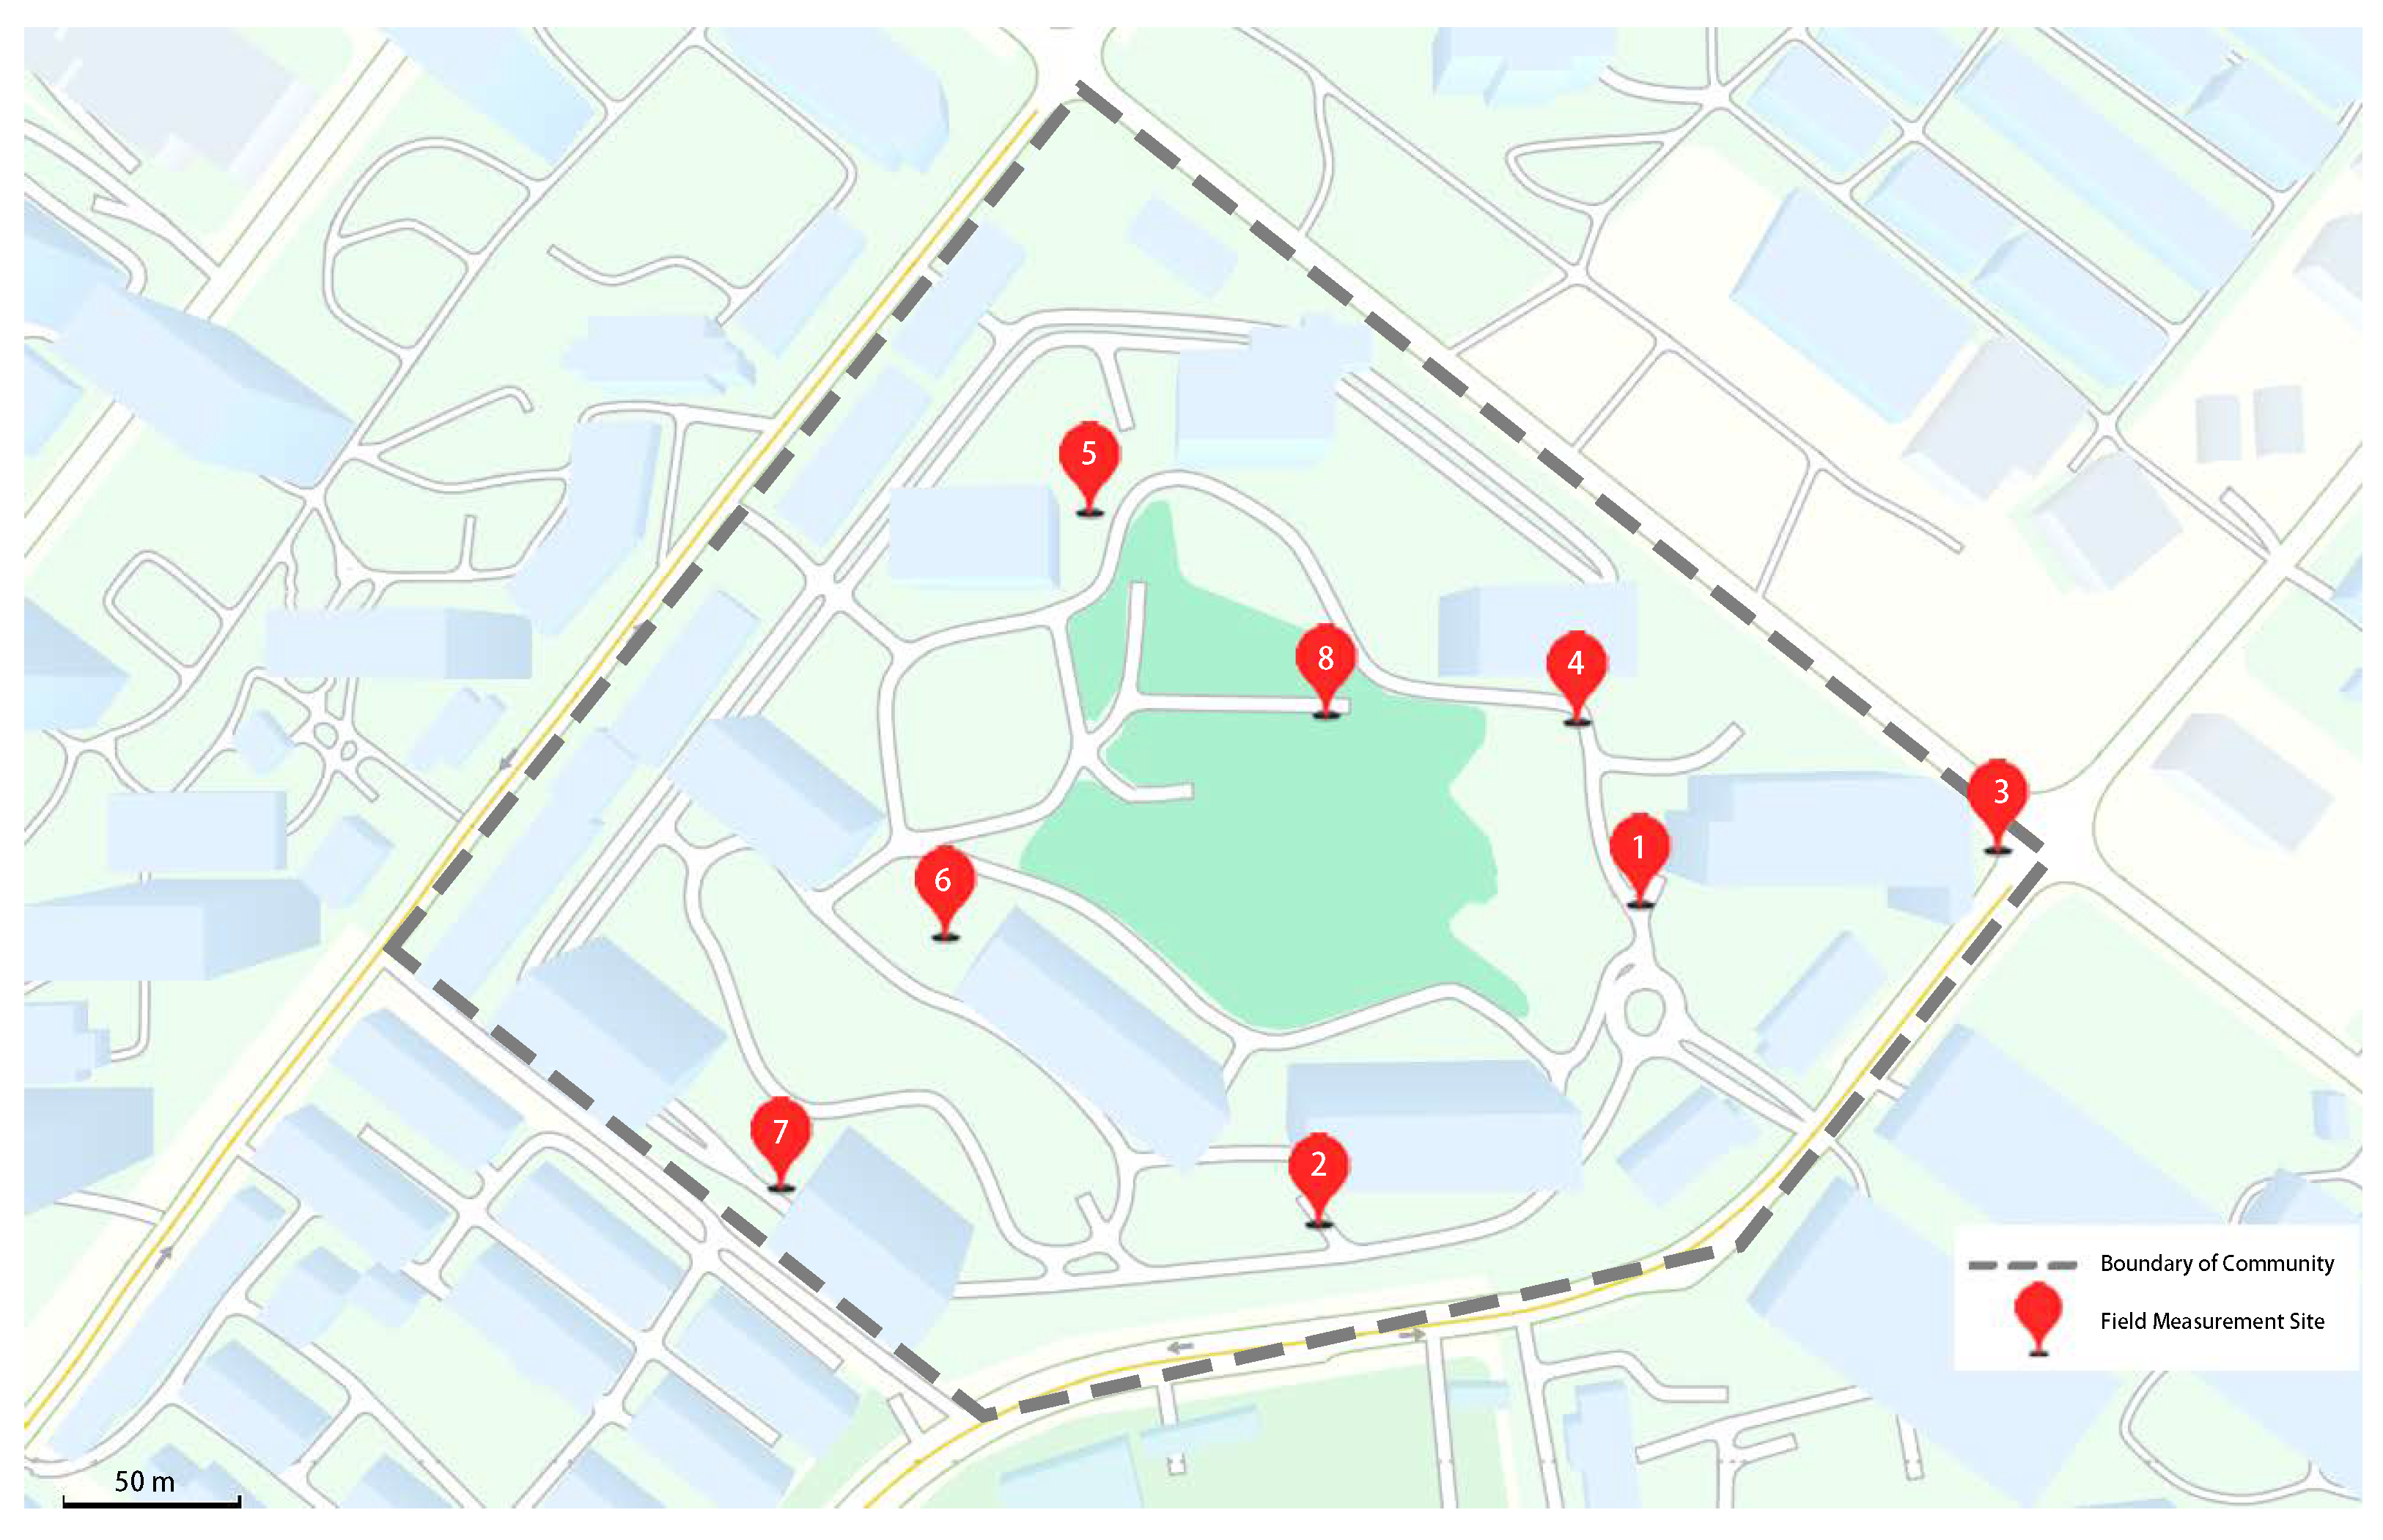
2.5. Field Measurement

In this study, in order to verify the accuracy of the simulation results, field measurements were conducted in the Fudi International Community. The UT-363 handheld high-precision anemometer was utilized for the validation task, and its measurement accuracy is detailed in Table 4. Eight locations were selected in the field to record temperature and wind speed, and the differences between the measured and simulated values at each location were compared. The specific experimental results are discussed in Section 3.2.
In order to verify the accuracy of the simulation data, this study selected the Fudi International Community as the site for field measurements. The measured results were used to evaluate the reliability of the simulation data. As illustrated in Figure 9, eight key outdoor activity areas within the community were selected for the measurements. The field measurement was conducted on 21 September 2024, from 2:30 p.m. to 6:30 p.m. During this period, wind speed data were recorded at 30 s intervals and temperature data were recorded every 5 min. After the measurements were completed, the average values of wind speed and temperature at each observation site were calculated. Subsequently, the confidence of the model results was evaluated by analyzing the deviation between the simulation results and the measured data.

2.6. Relevance Studies

2.6.1. Calculation Method

The data of hypertension patients cover the period from 9 December 2015 to 29 December 2020. Given the temporal characteristics of the data, this work employs the monthly proportion of annual patient cases (MAPC) to reflect the temporal variation in the incidence of hypertension, and the calculation formula is shown below:
MAPC = N visit , month N visit , year × 100 %
Considering the large population base, similar demographic structures, and a maximum linear distance of only 4 km between the communities, there is a high degree of consistency in climatic conditions and dietary habits. Based on this, monthly variations in microclimatic conditions may cause fluctuations in disease occurrence, partially reflecting the correlation between microclimatic changes and hypertension incidence.

2.6.2. Microclimate Parameters

To quantify the relationship between the microclimate and the incidence of hypertension, this study derived the following parameters from the Phoenics simulation results: outdoor temperature, wind speed, PMV, and UTCI. Among them, outdoor temperature and wind speed are important parameters describing objective microclimatic conditions, where temperature is measured in Celsius degrees (°C) and wind speed is measured in meters per second (m/s). PMV is a metric used to quantify individual subjective thermal sensations, reflecting the sense of warmth or cold experienced by most people in the thermal environment [68]. PMV is typically rated on seven levels: +3 (hot), +2 (warm), +1 (slightly warm), 0 (neutral), −1 (slightly cool), −2 (cool), and −3 (cold) [69]. UTCI is a bioclimatic index for describing the physiological comfort of the human body under specific meteorological conditions [70]. The unit of UTCI is °C.

2.6.3. Correlation Analysis

In this study, communities were classified according to building height, allowing to thoroughly investigate the relationship between outdoor microclimatic parameters and the incidence of hypertension in different community types.
In classifying communities by building height, this study first conducts a comparative analysis of the thermal environment disparities among different communities, illuminating the influence of building layout on microclimatic parameters. Subsequently, correlation coefficients and regression equations between outdoor microclimatic parameters and MAPC were calculated by Origin 2021 [71]. This method enabled a quantitative characterization of the association between microclimatic variables and hypertension incidence. Lastly, line graphs are developed for communities that depict monthly values of wind speed, temperature, PMV, UTCI and visits for hypertension. This analysis explores the interrelationship between microclimatic parameters and hypertension incidence.
Through these approaches, the influence of microclimatic factors on the incidence of hypertension is comprehensively analyzed.

3. Results and Discussion

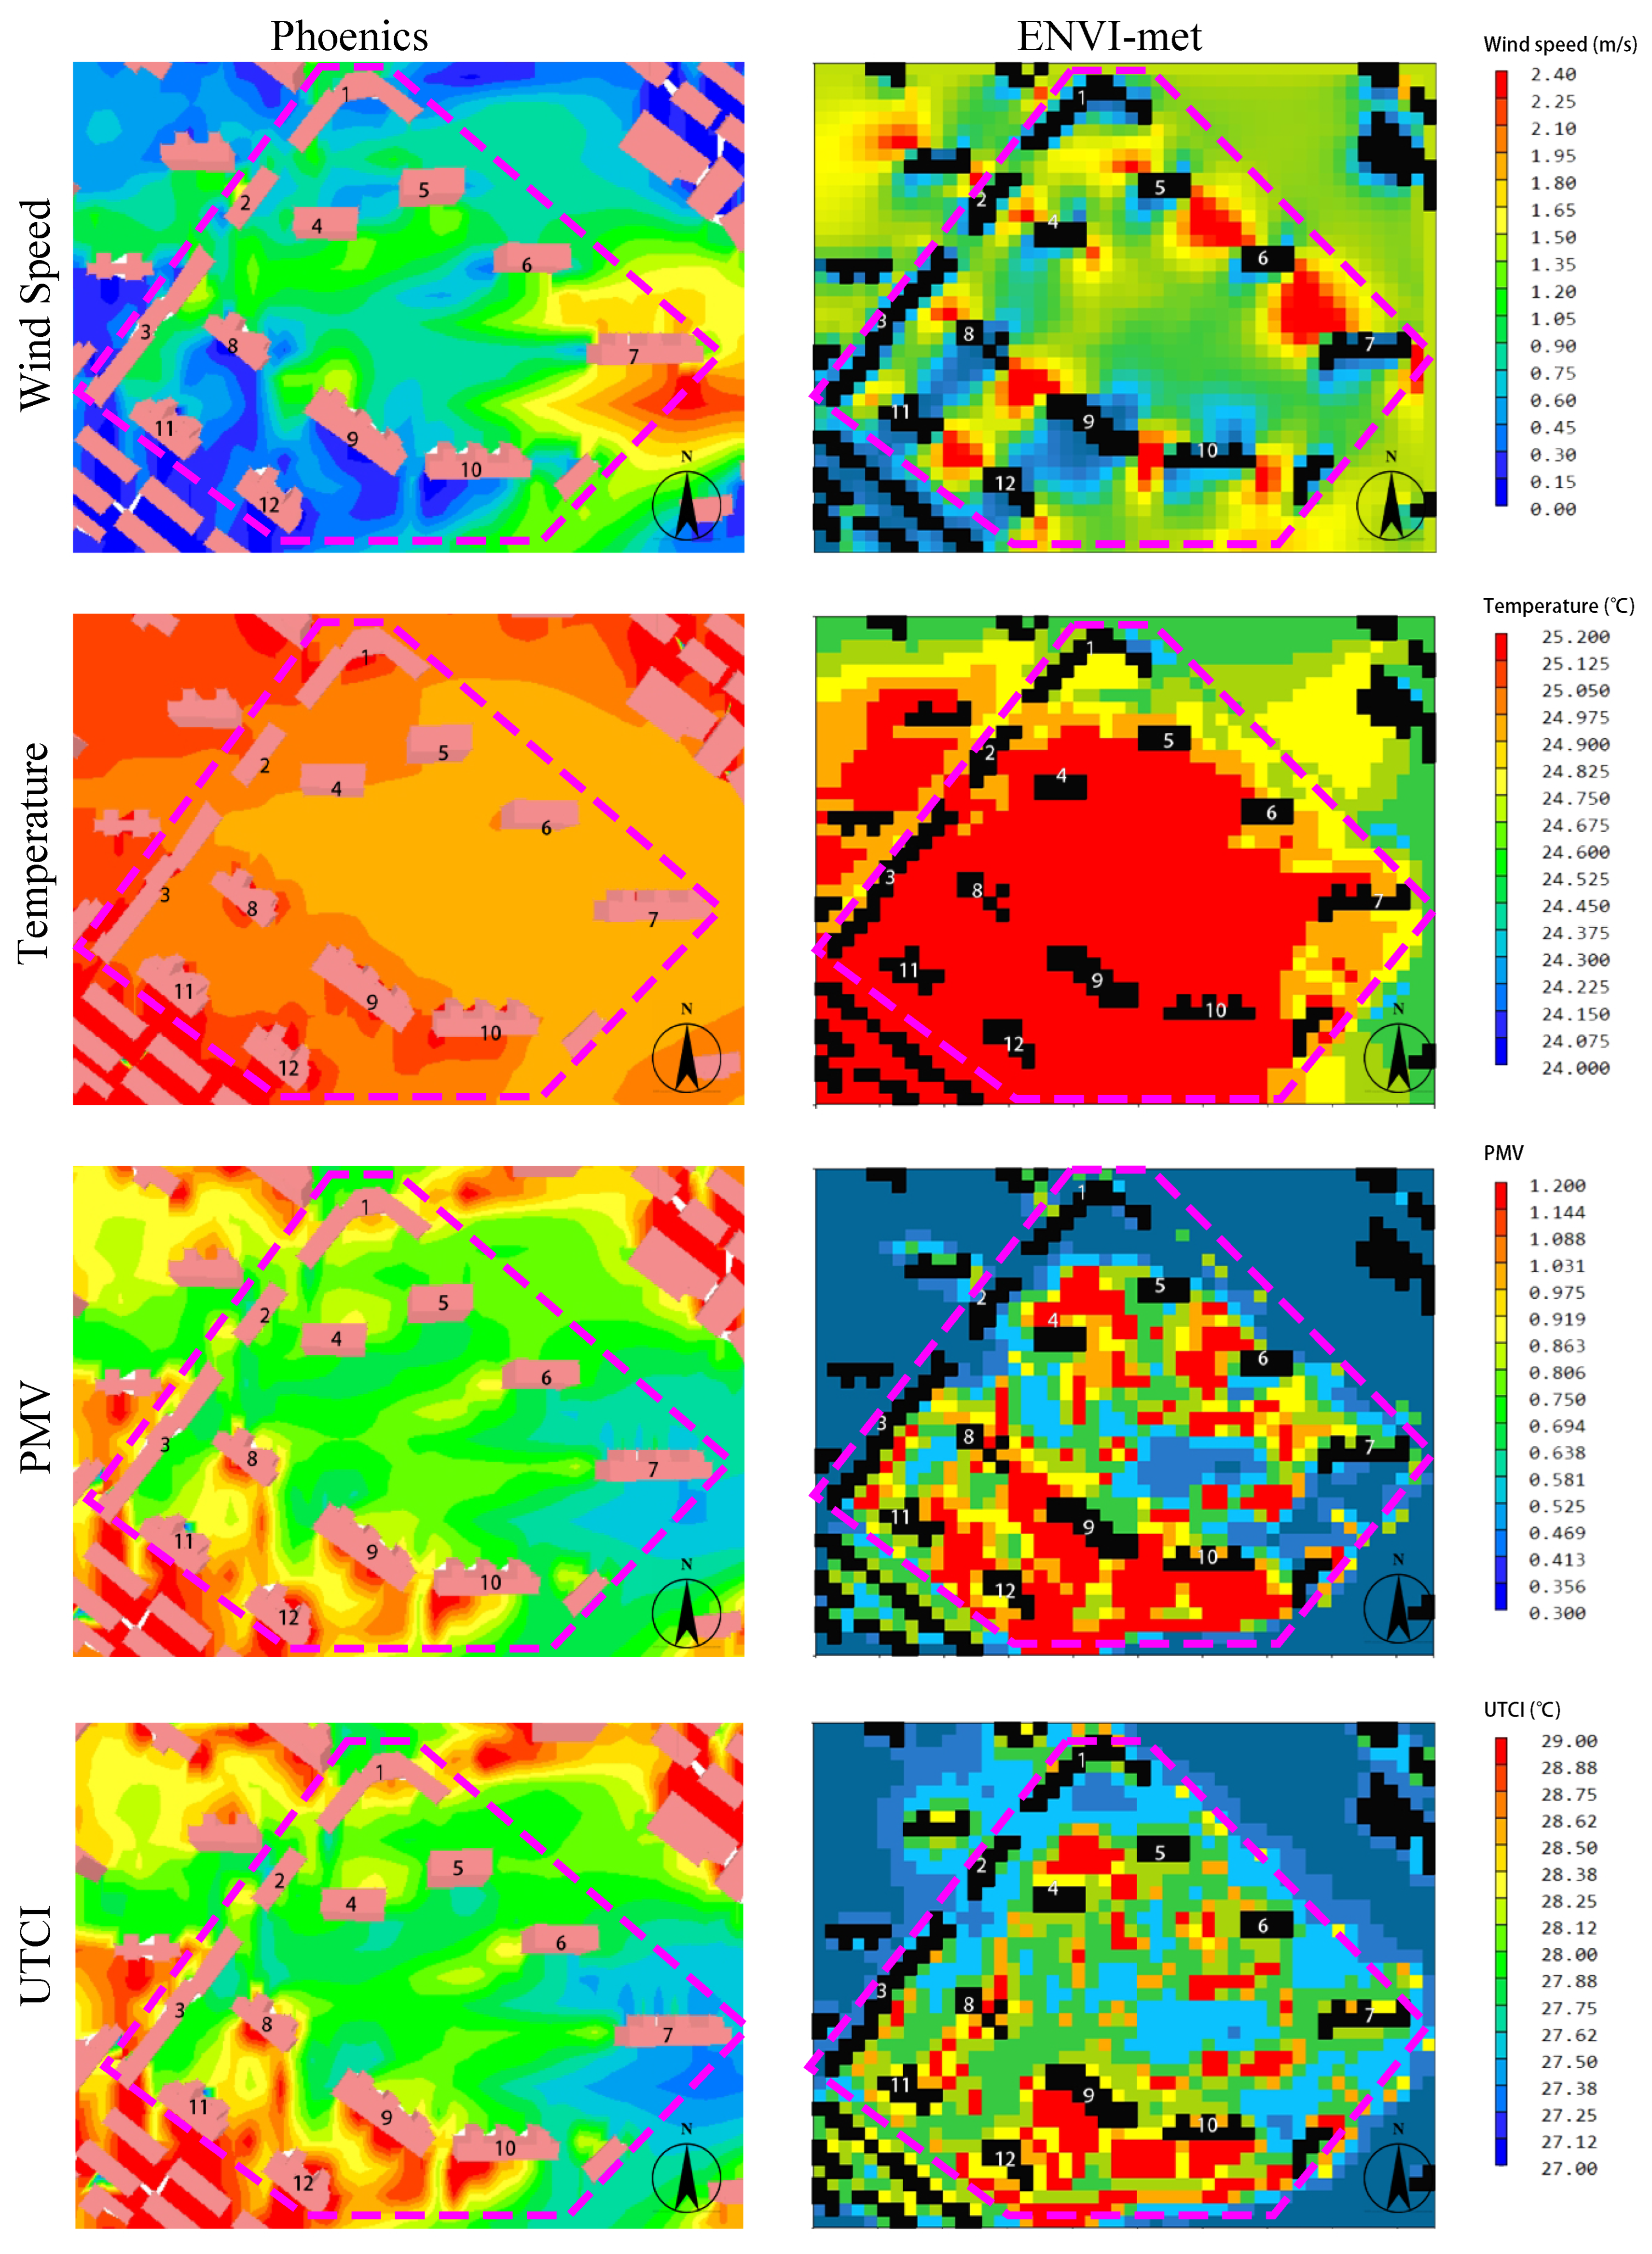
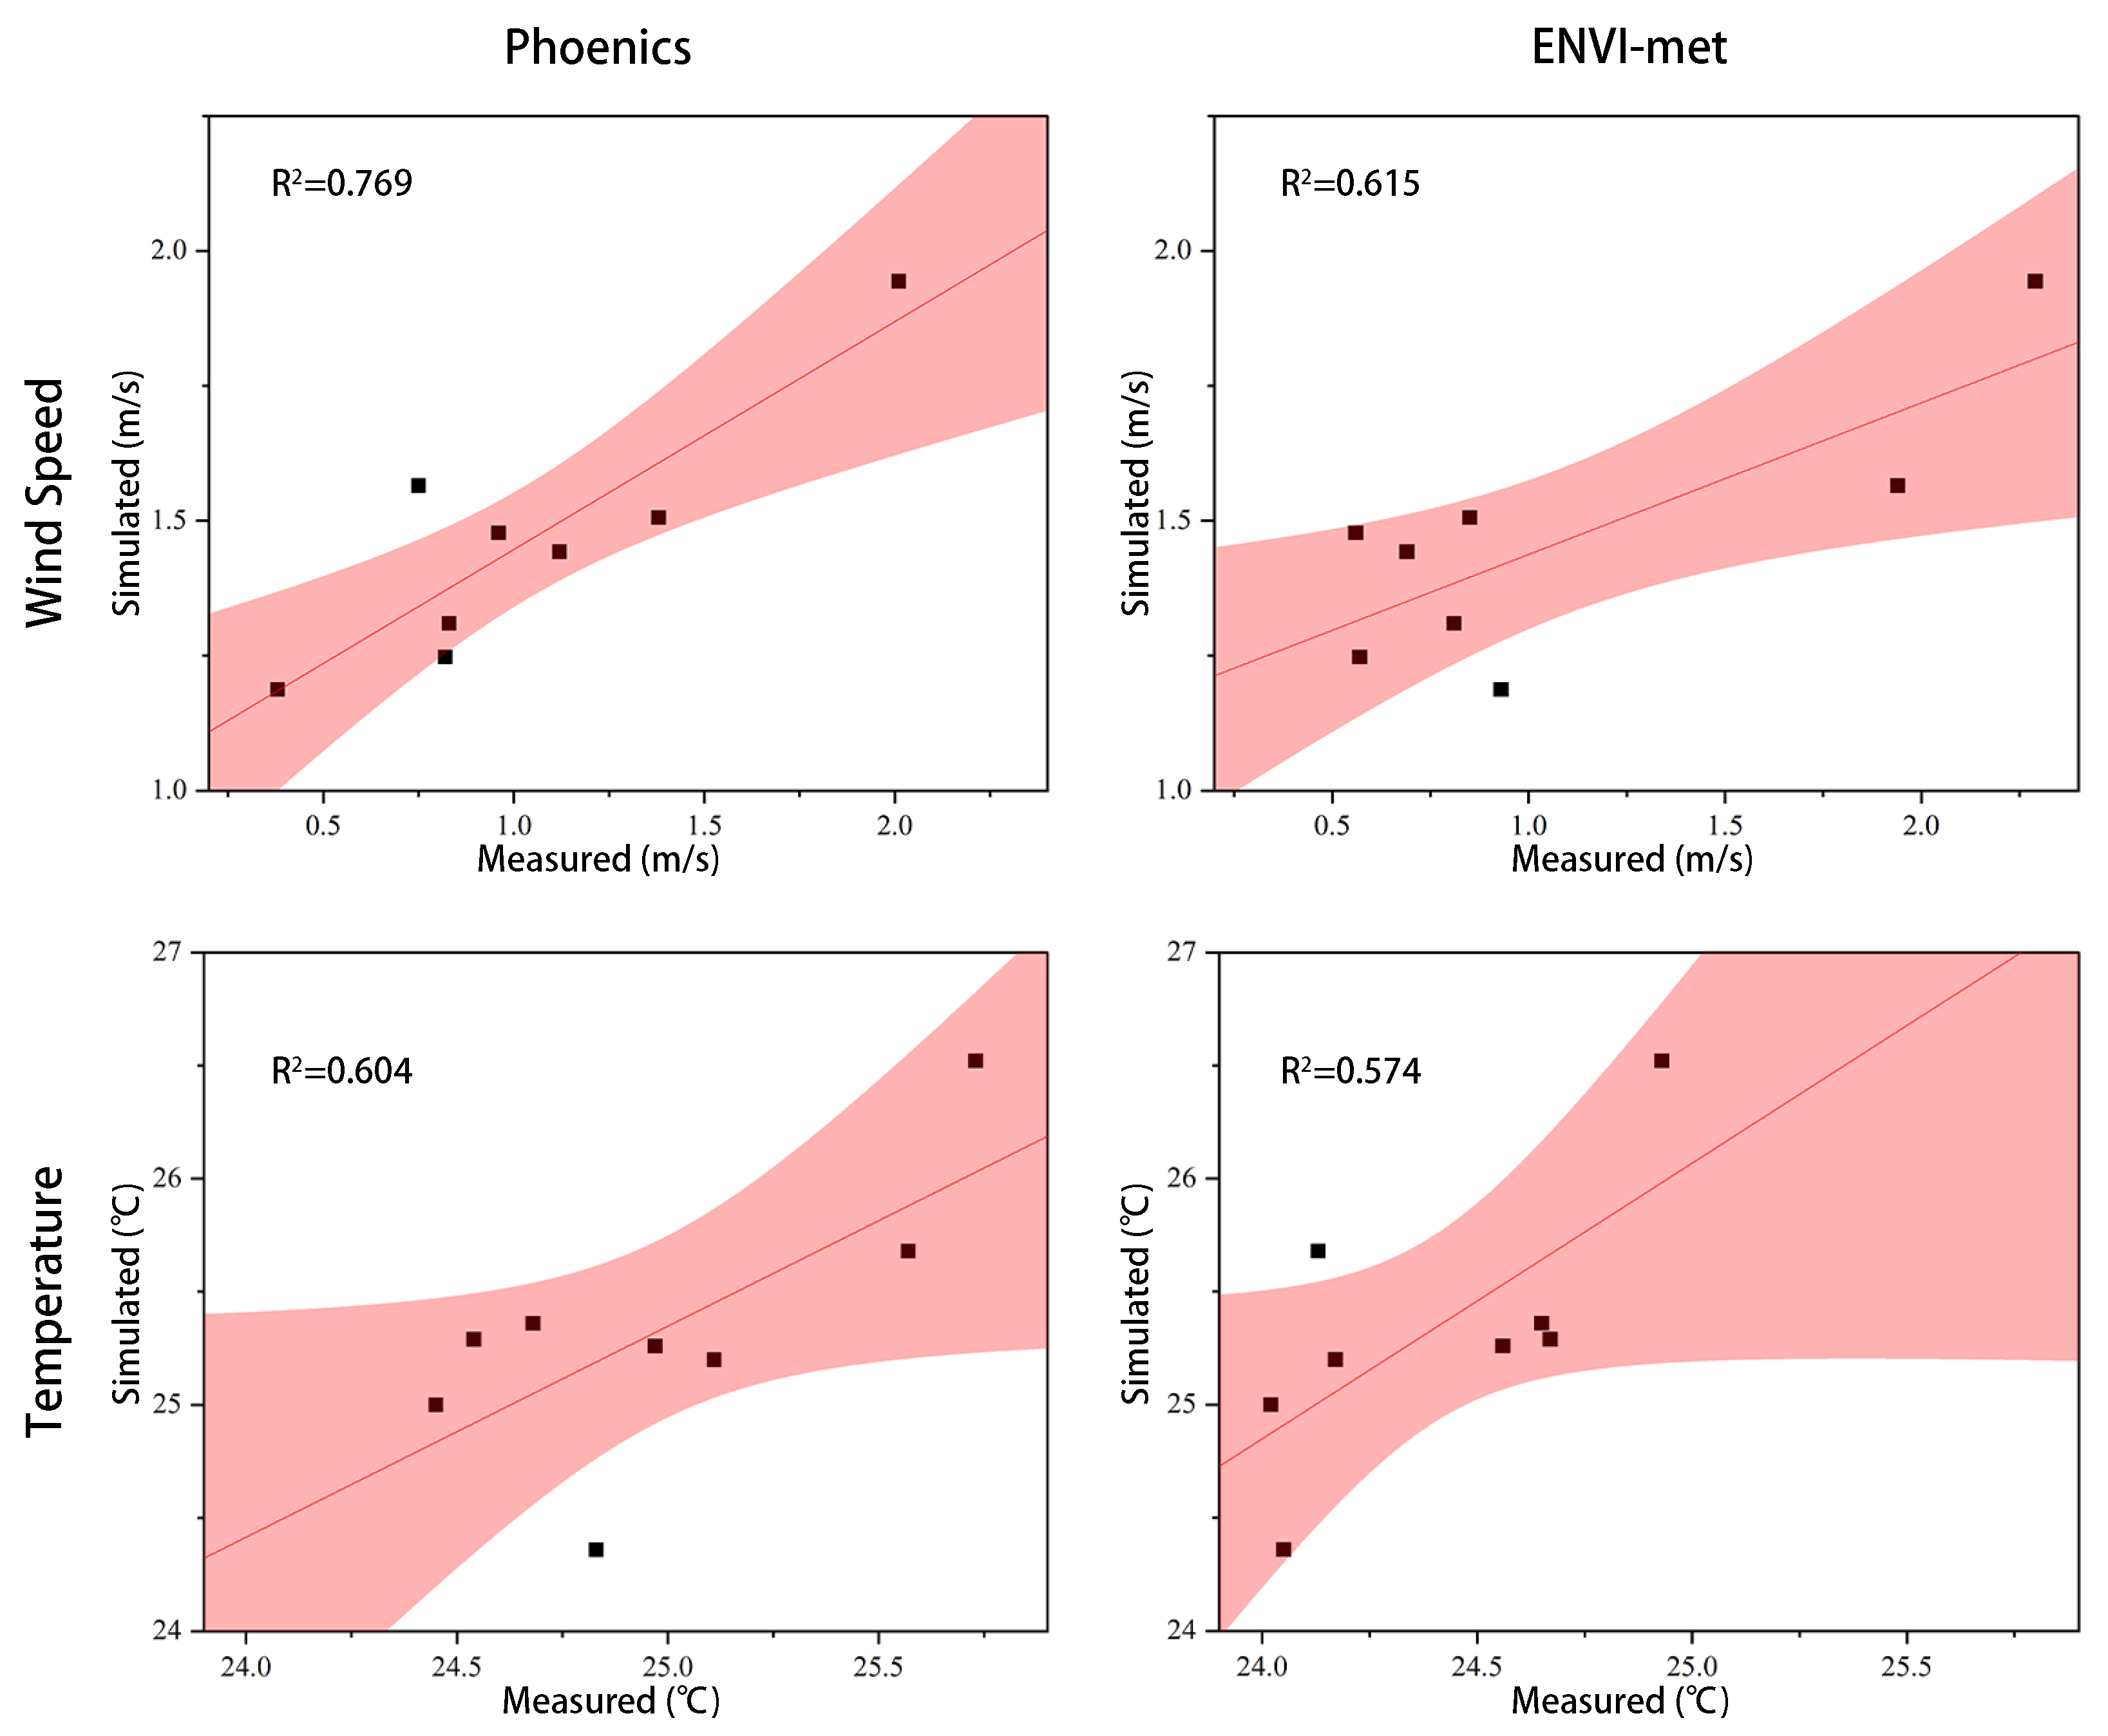
3.1. Analysis of Results from Phoenics and ENVI-Met

To explore the applicability of Phoenics and ENVI-met at the community scale, this chapter takes the Fudi International Community as the study area and conducts microclimate modeling analysis. First, the contour maps of wind speed, temperature, and PMV generated by the two models are compared to illustrate the differences. Then, the numerical outputs of each model are analyzed against the measured meteorological data to evaluate their fitting accuracy.
A previous review has shown that both Phoenics and ENVI-met can reliably simulate outdoor microclimates, with Phoenics achieving a maximum temperature error of approximately 0.3 °C and consistent wind speed trends, and ENVI-met reporting normalized root mean square errors (NR-MSEs) of 9.3% for temperature and 27% for wind speed, similar to the 7.1% and 33% found in this study [72].
Figure 10 shows a comparison of the contour plots generated by the two software for wind speed, temperature, PMV, and UTCI. In terms of temperature, the PMV and UTCI simulation results show similar variation trends. However, the differences are obvious in the wind speed simulation.The wind speed contour plot from ENVI-met reveals a sudden increase in wind speed near buildings. Due to the relatively coarse grid spacing and simplified numerical solution algorithm, the resolution of the contour plot lacks clarity. In contrast, Phoenics employs a flexible grid division approach and an optimized numerical solution algorithm, yielding accurate simulation results.
As shown in Figure 11, PHOENICS achieves an R2 of 0.769 for wind speed simulation, higher than ENVI-met’s 0.615 (95% confidence interval), indicating a better fit to observed values. Both models produced similar results in terms of temperature simulation, exhibiting, respectively, R2 values of 0.604 and 0.574 (95% confidence interval). Consequently, both of them can partially reflect the real outdoor microclimate conditions in residential areas.
In summary, Phoenics has been demonstrated to outperform ENVI-met in microclimate simulation in the communities, rendering it more suitable for the needs of this study.

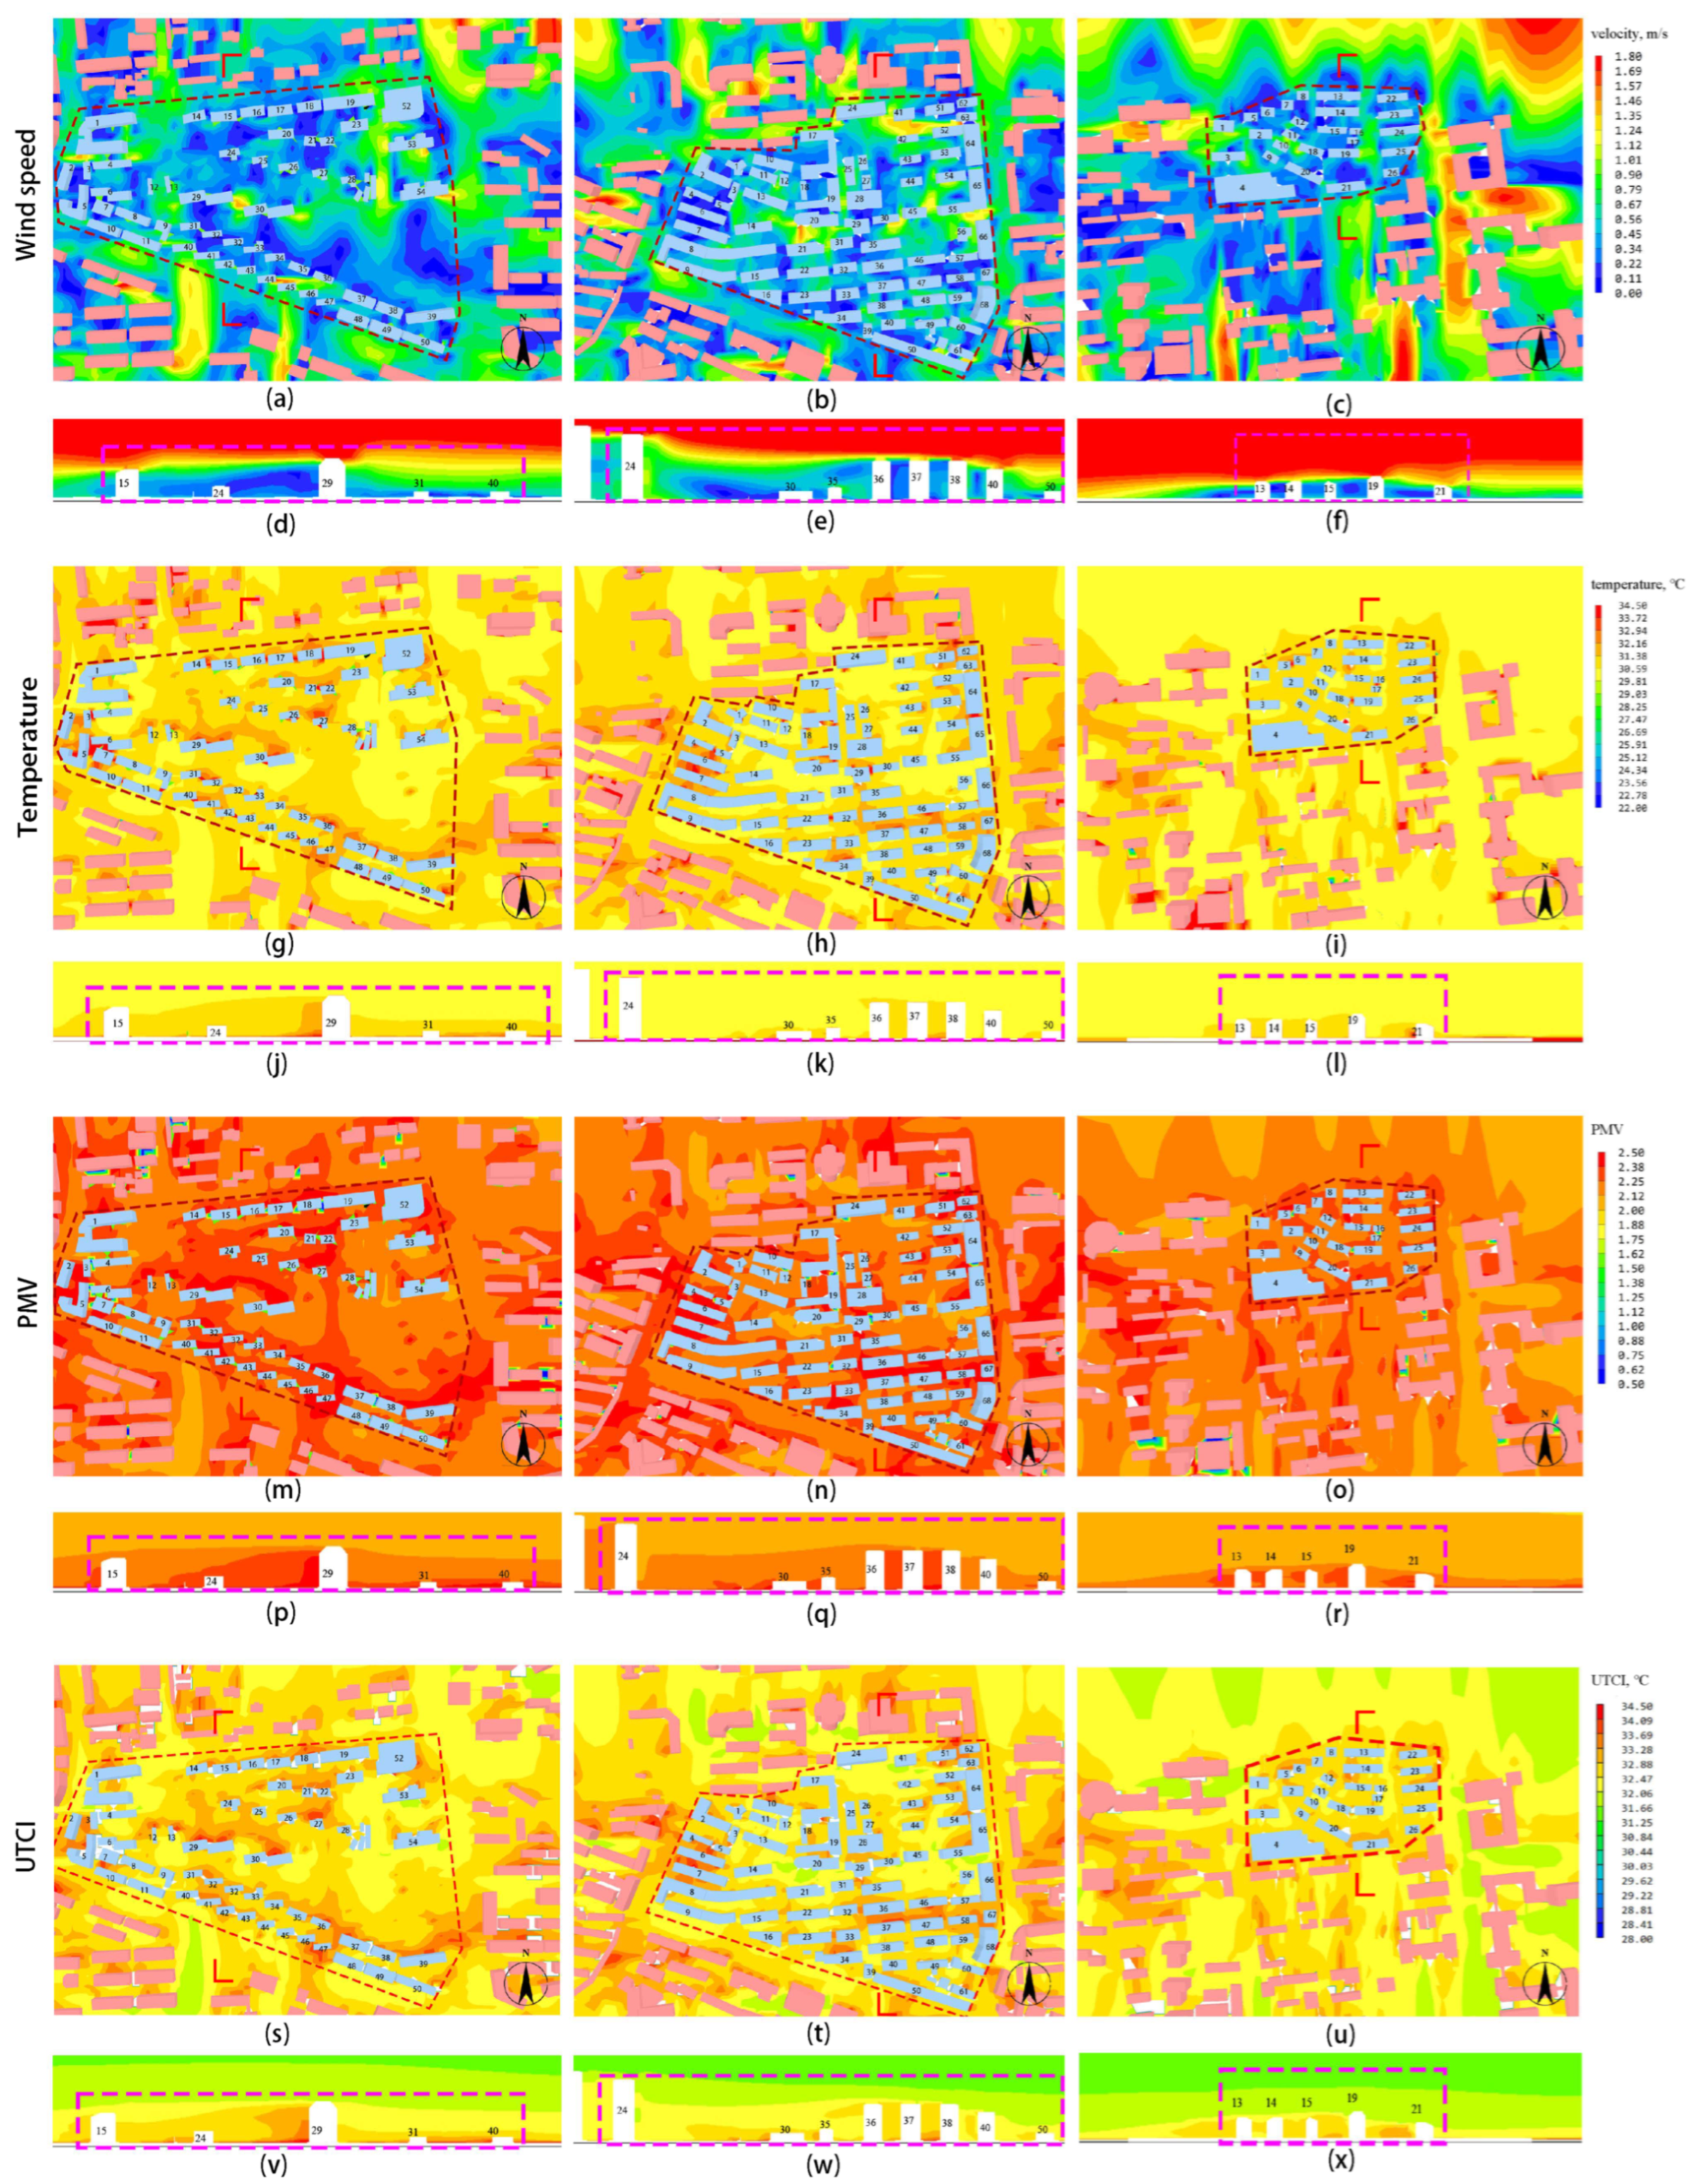
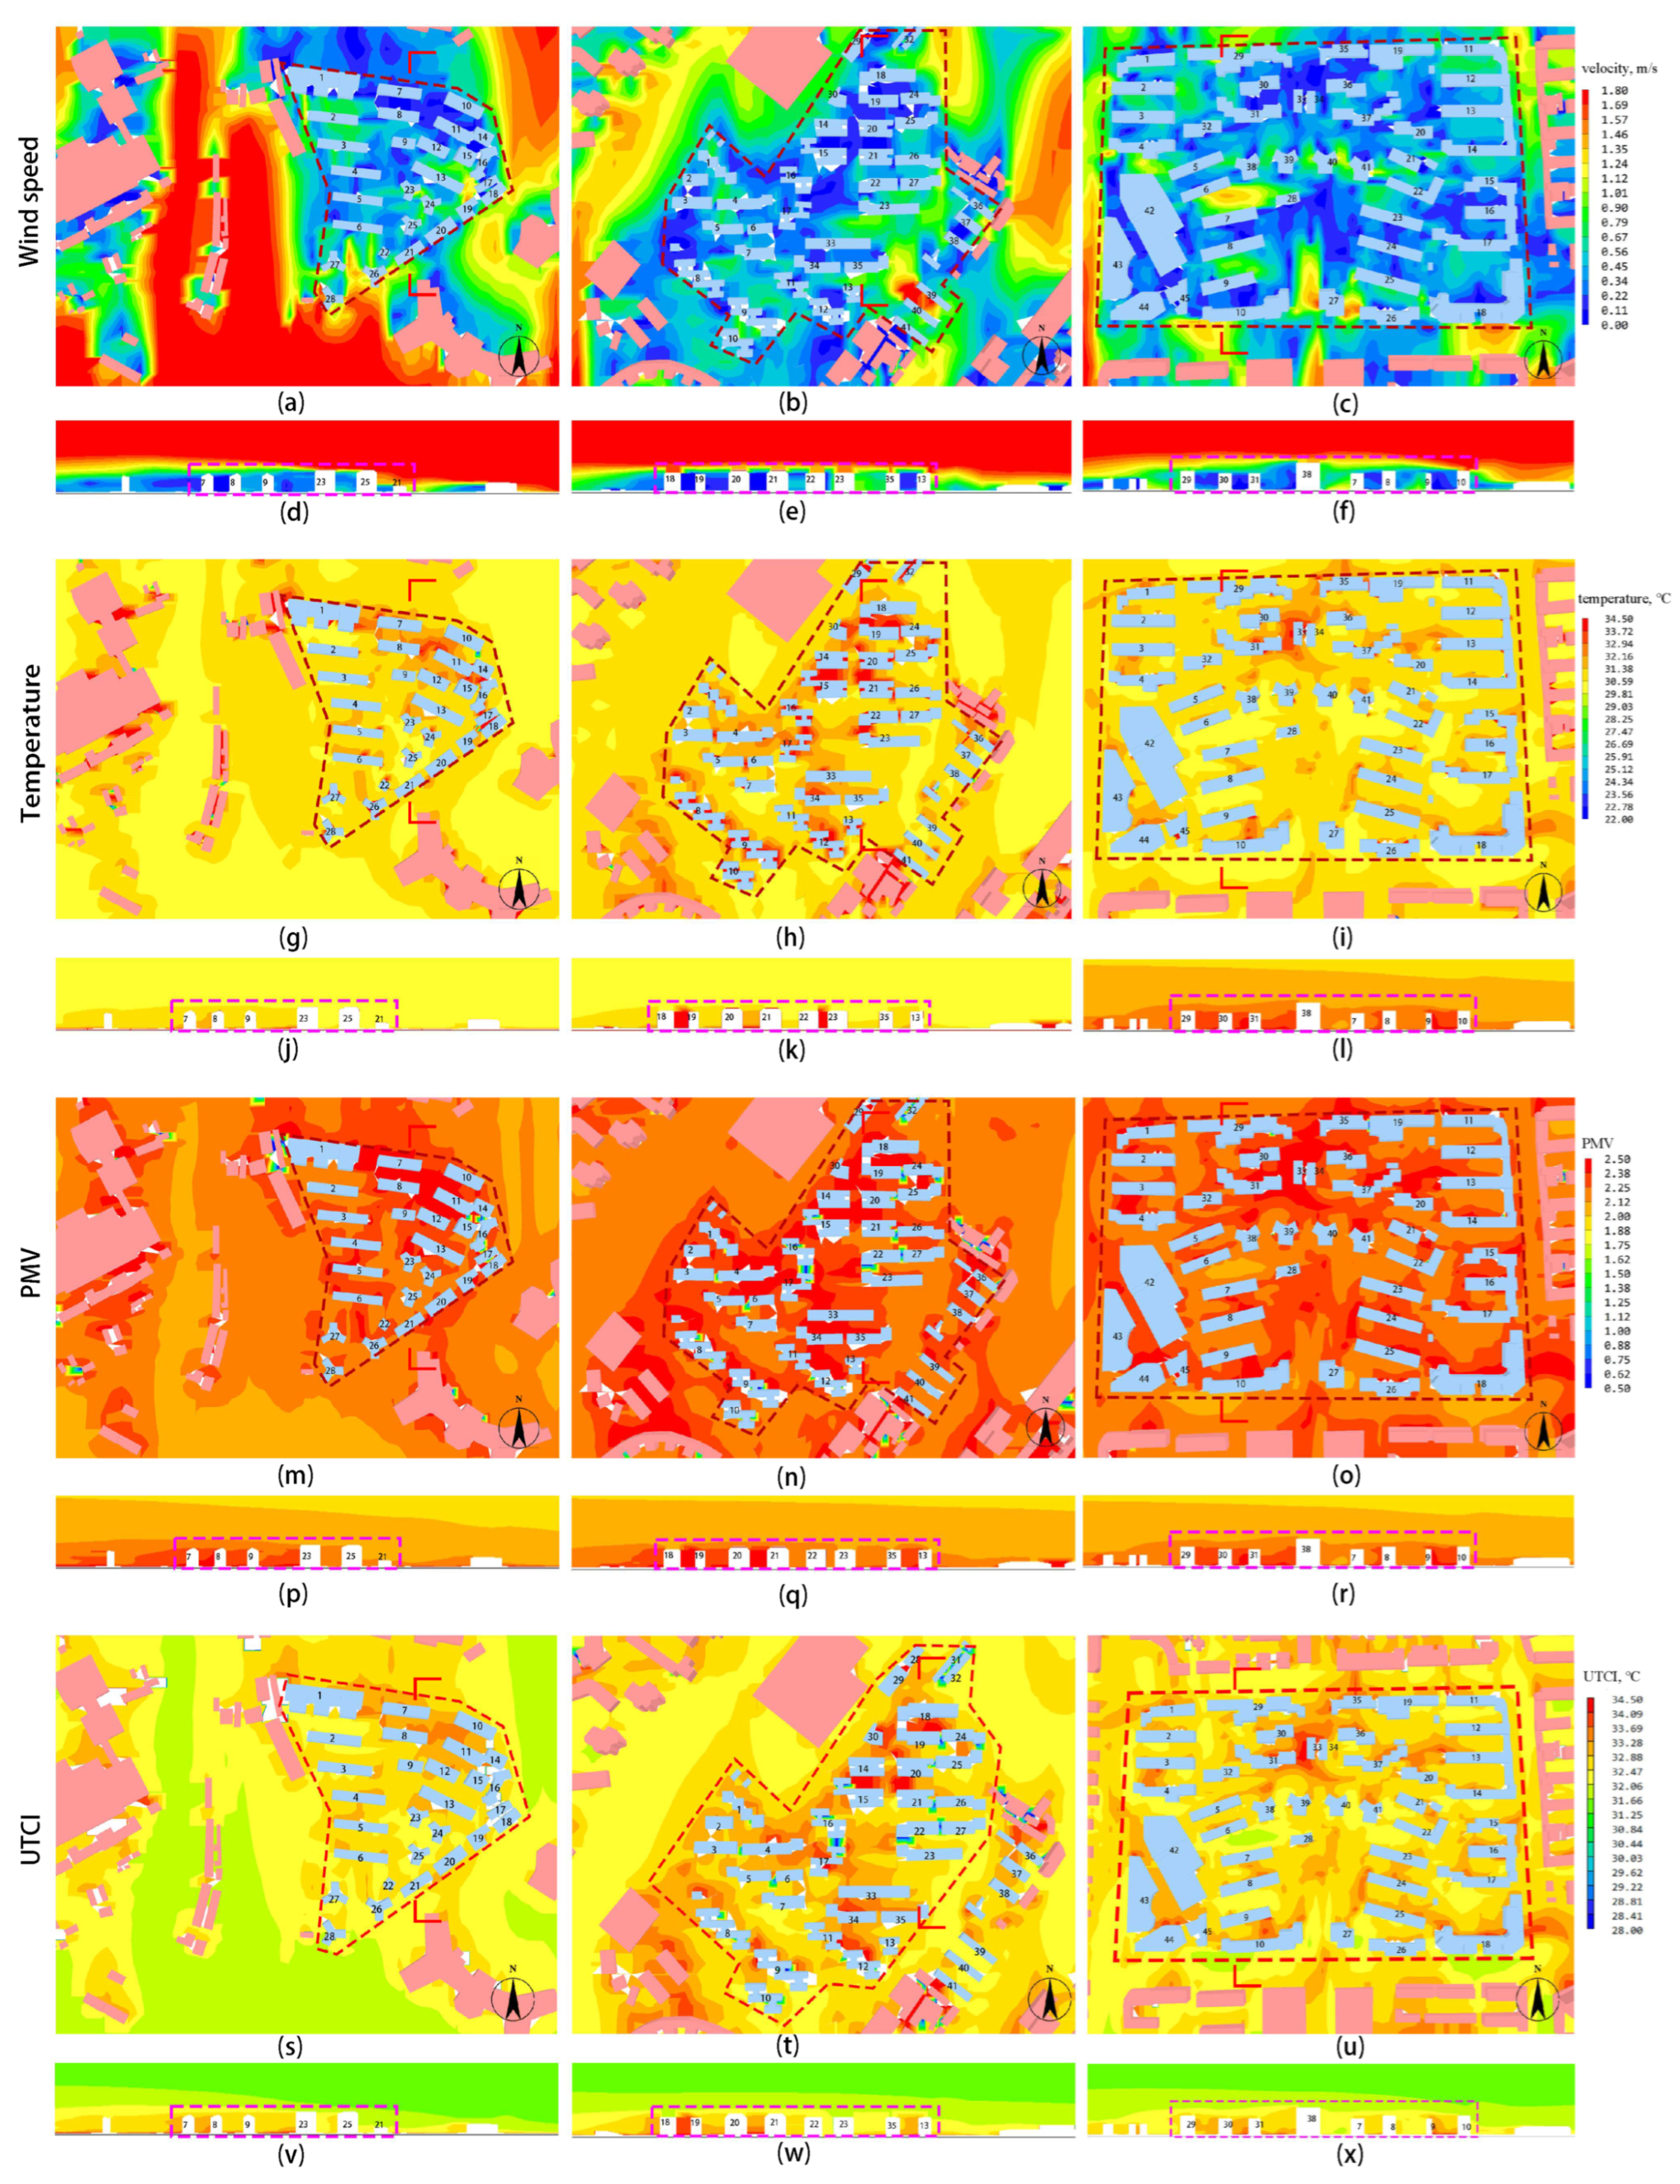
3.2. Analysis of Different Communities with Phoenics

3.2.1. Simulation Results Analysis for Multi-Story Communities

Multi-story residential communities commonly suffer from mutual obstruction between buildings, which reduces the near-ground wind speed, leading to heat accumulation. As shown in Figure 12a, several zones of low wind speed are formed around buildings 31–43 in Chagang community. As shown in Figure 12g,m,s, in these areas, the temperature is approximately 0.8 °C to 1.2 °C higher than the community average, the PMV is approximately 0.15 to 0.25 increased, and the UTCI increases by 1.3 °C to 2.4 °C. The spatial structure of the row layout promotes the development of orderly ventilation channels between buildings, improving local wind conditions. This characteristic can be observed in buildings 31–50 of Chagang community, buildings 41–45 of Zhangjiawan Community, and buildings 22–26 of Zhongke community. Within these corridors, wind speed increases by 0.4–0.6 m/s (Figure 12a–c) compared to adjacent areas, temperature decreases by 0.5 °C to 0.7 °C (Figure 12g–i), PMV decreases by 0.20 to 0.22 (Figure 12m–o), and UTCI decreases by 1.0 °C to 1.7 °C (Figure 12s–u).
Most outdoor activity areas are paved with bricks or cement in such communities, resulting in a lack of public green zones, such as green spaces and water features. When solar radiation is intense in the summer, this kind of environment is likely to cause high-temperature phenomena, which reduces residents’ thermal comfort. Chagang community has a fitness area for residents on the north side of buildings 29 and 30, which is paved with precast concrete blocks. As shown in Figure 12g,m,s, the temperature, PMV, and UTCI in this area are 1.8 °C, 0.38, and 1.2 °C greater than the surroundings, respectively.
Meanwhile, the high-density layout of the community leads to narrow spacing between buildings. This obstructs air currents and causes heat to accumulate, which exacerbates thermal discomfort in the summer. As shown in Figure 12e,k,q,w, the spacing between buildings 37 and 38 in Zhangjiawan Community is only 25 m. In this area, the temperature, PMV, and UTCI are approximately 1.9 °C, 0.14, and 1.6 °C higher than in the surrounding areas, respectively.

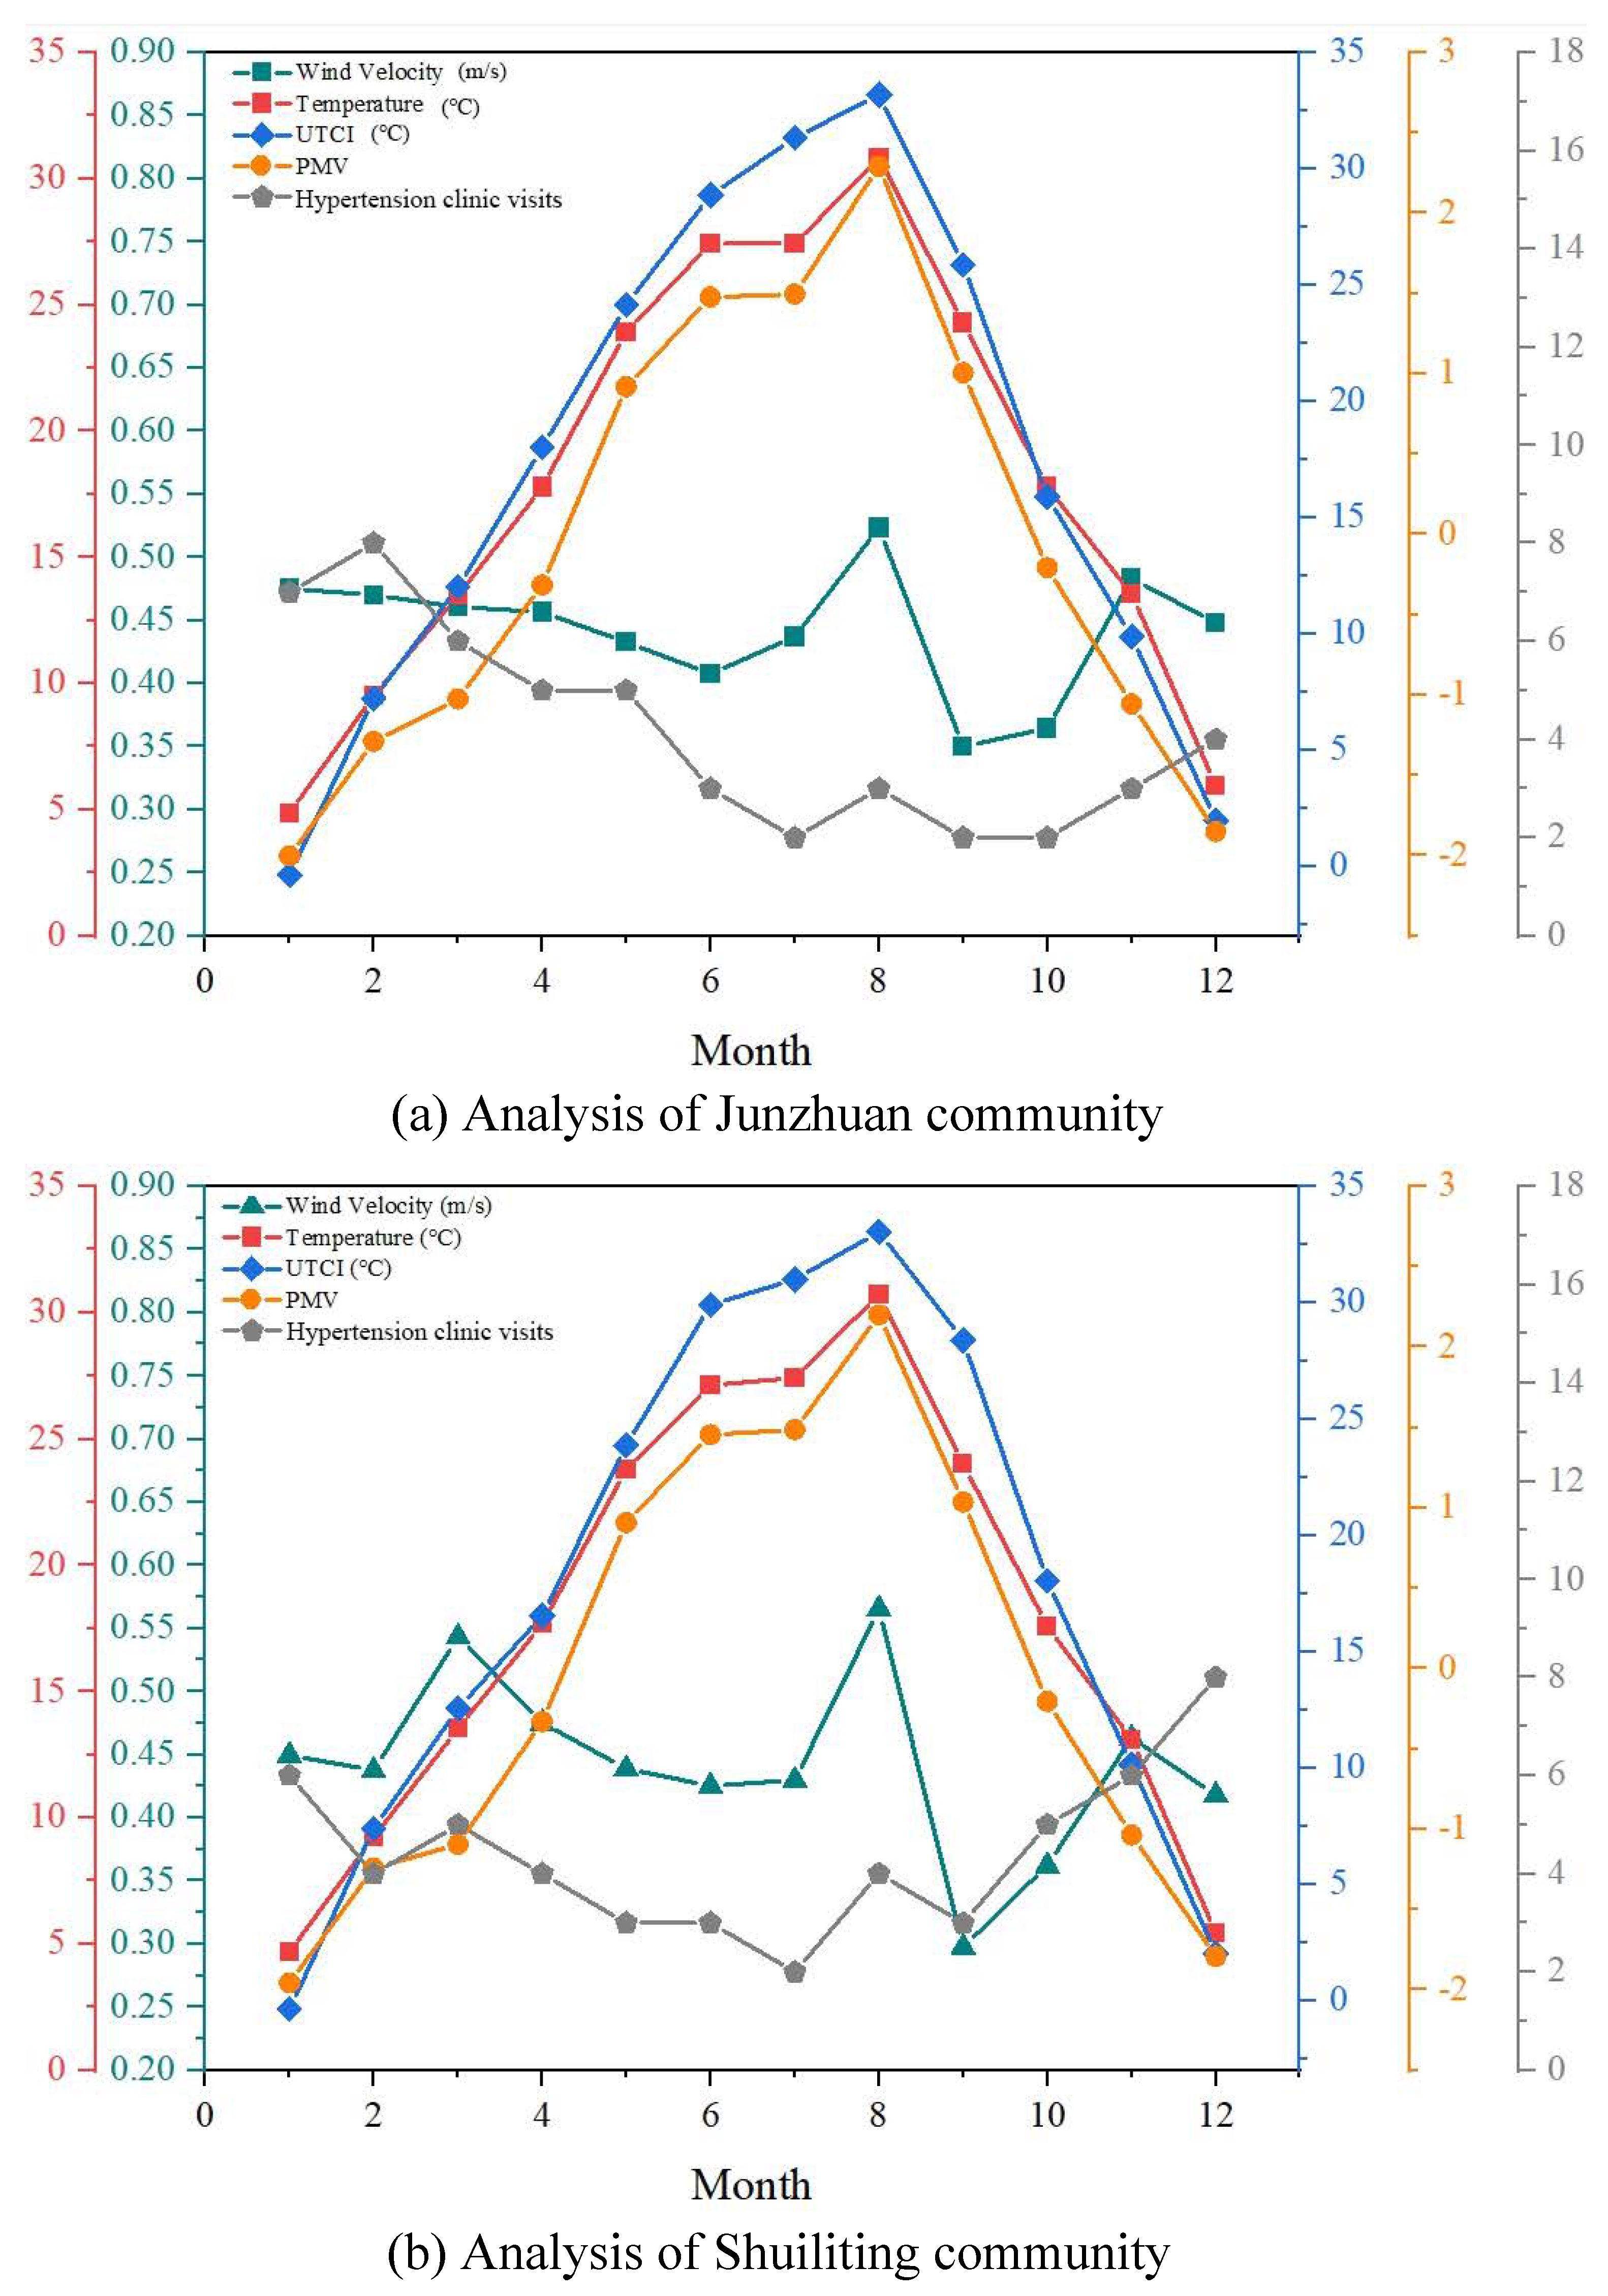
3.2.2. Simulation Results Analysis for Mid-Rise Communities

Compared to multi-story residential communities, mid-rise communities have higher wind speeds but lower temperatures, PMV values, and UTCI values. These communities are mostly set up as a row layout, integrating point-layout buildings into the central areas. Due to the relatively tall buildings (ranging from 21 to 33 m tall), airflow is partially obstructed. This creates high-wind zones on both sides of some buildings. This significantly reduces the local temperature and PMV. As shown in Figure 13, the building heights in Oriole community (building 26), Yinte community (building 13), and Central Garden community (buildings 38–41) are 30 m, 27 m, and 33 m, respectively. These heights are significantly higher than those of the surrounding buildings. As shown in Figure 13b, wind speeds reach 1.01 m/s to 1.37 m/s on windward sides of Central Garden Community (buildings 38–41), which is significantly higher than the community average of 0.55 m/s. In this area, temperature, PMV, and UTCI are lower than average. As shown in Figure 13i,o,u, the temperature drops by about 0.62 °C to 0.79 °C, the PMV drops by 0.13 to 0.17, and UTCI drops by 0.96 °C to 1.24 °C
Mid-rise residential communities typically have public green zones, such as vegetation, soil, and water features, on their underlying surfaces. These zones help improve residents’ thermal comfort. Yingte community has a public space between buildings 22 and 35. A circular water body with a radius of about 18 m is surrounded by vegetation. Figure 13h,n,t show that the temperature, PMV value, and UTCI in this area are 29.8 °C, 2.24, and 31.5 °C, respectively. All of these values are lower than the community’s overall averages, which improves thermal comfort in the summer.
Mid-rise communities have lower street height-to-width (H/W) ratios compared to multi-story communities, which are beneficial for air circulation. As shown in Figure 13c, the H/W ratio of the street between buildings 7 and 38 in the Central Garden Community is approximately 0.8. Wind speeds in this area are 38% to 53% higher than the average value of the community.

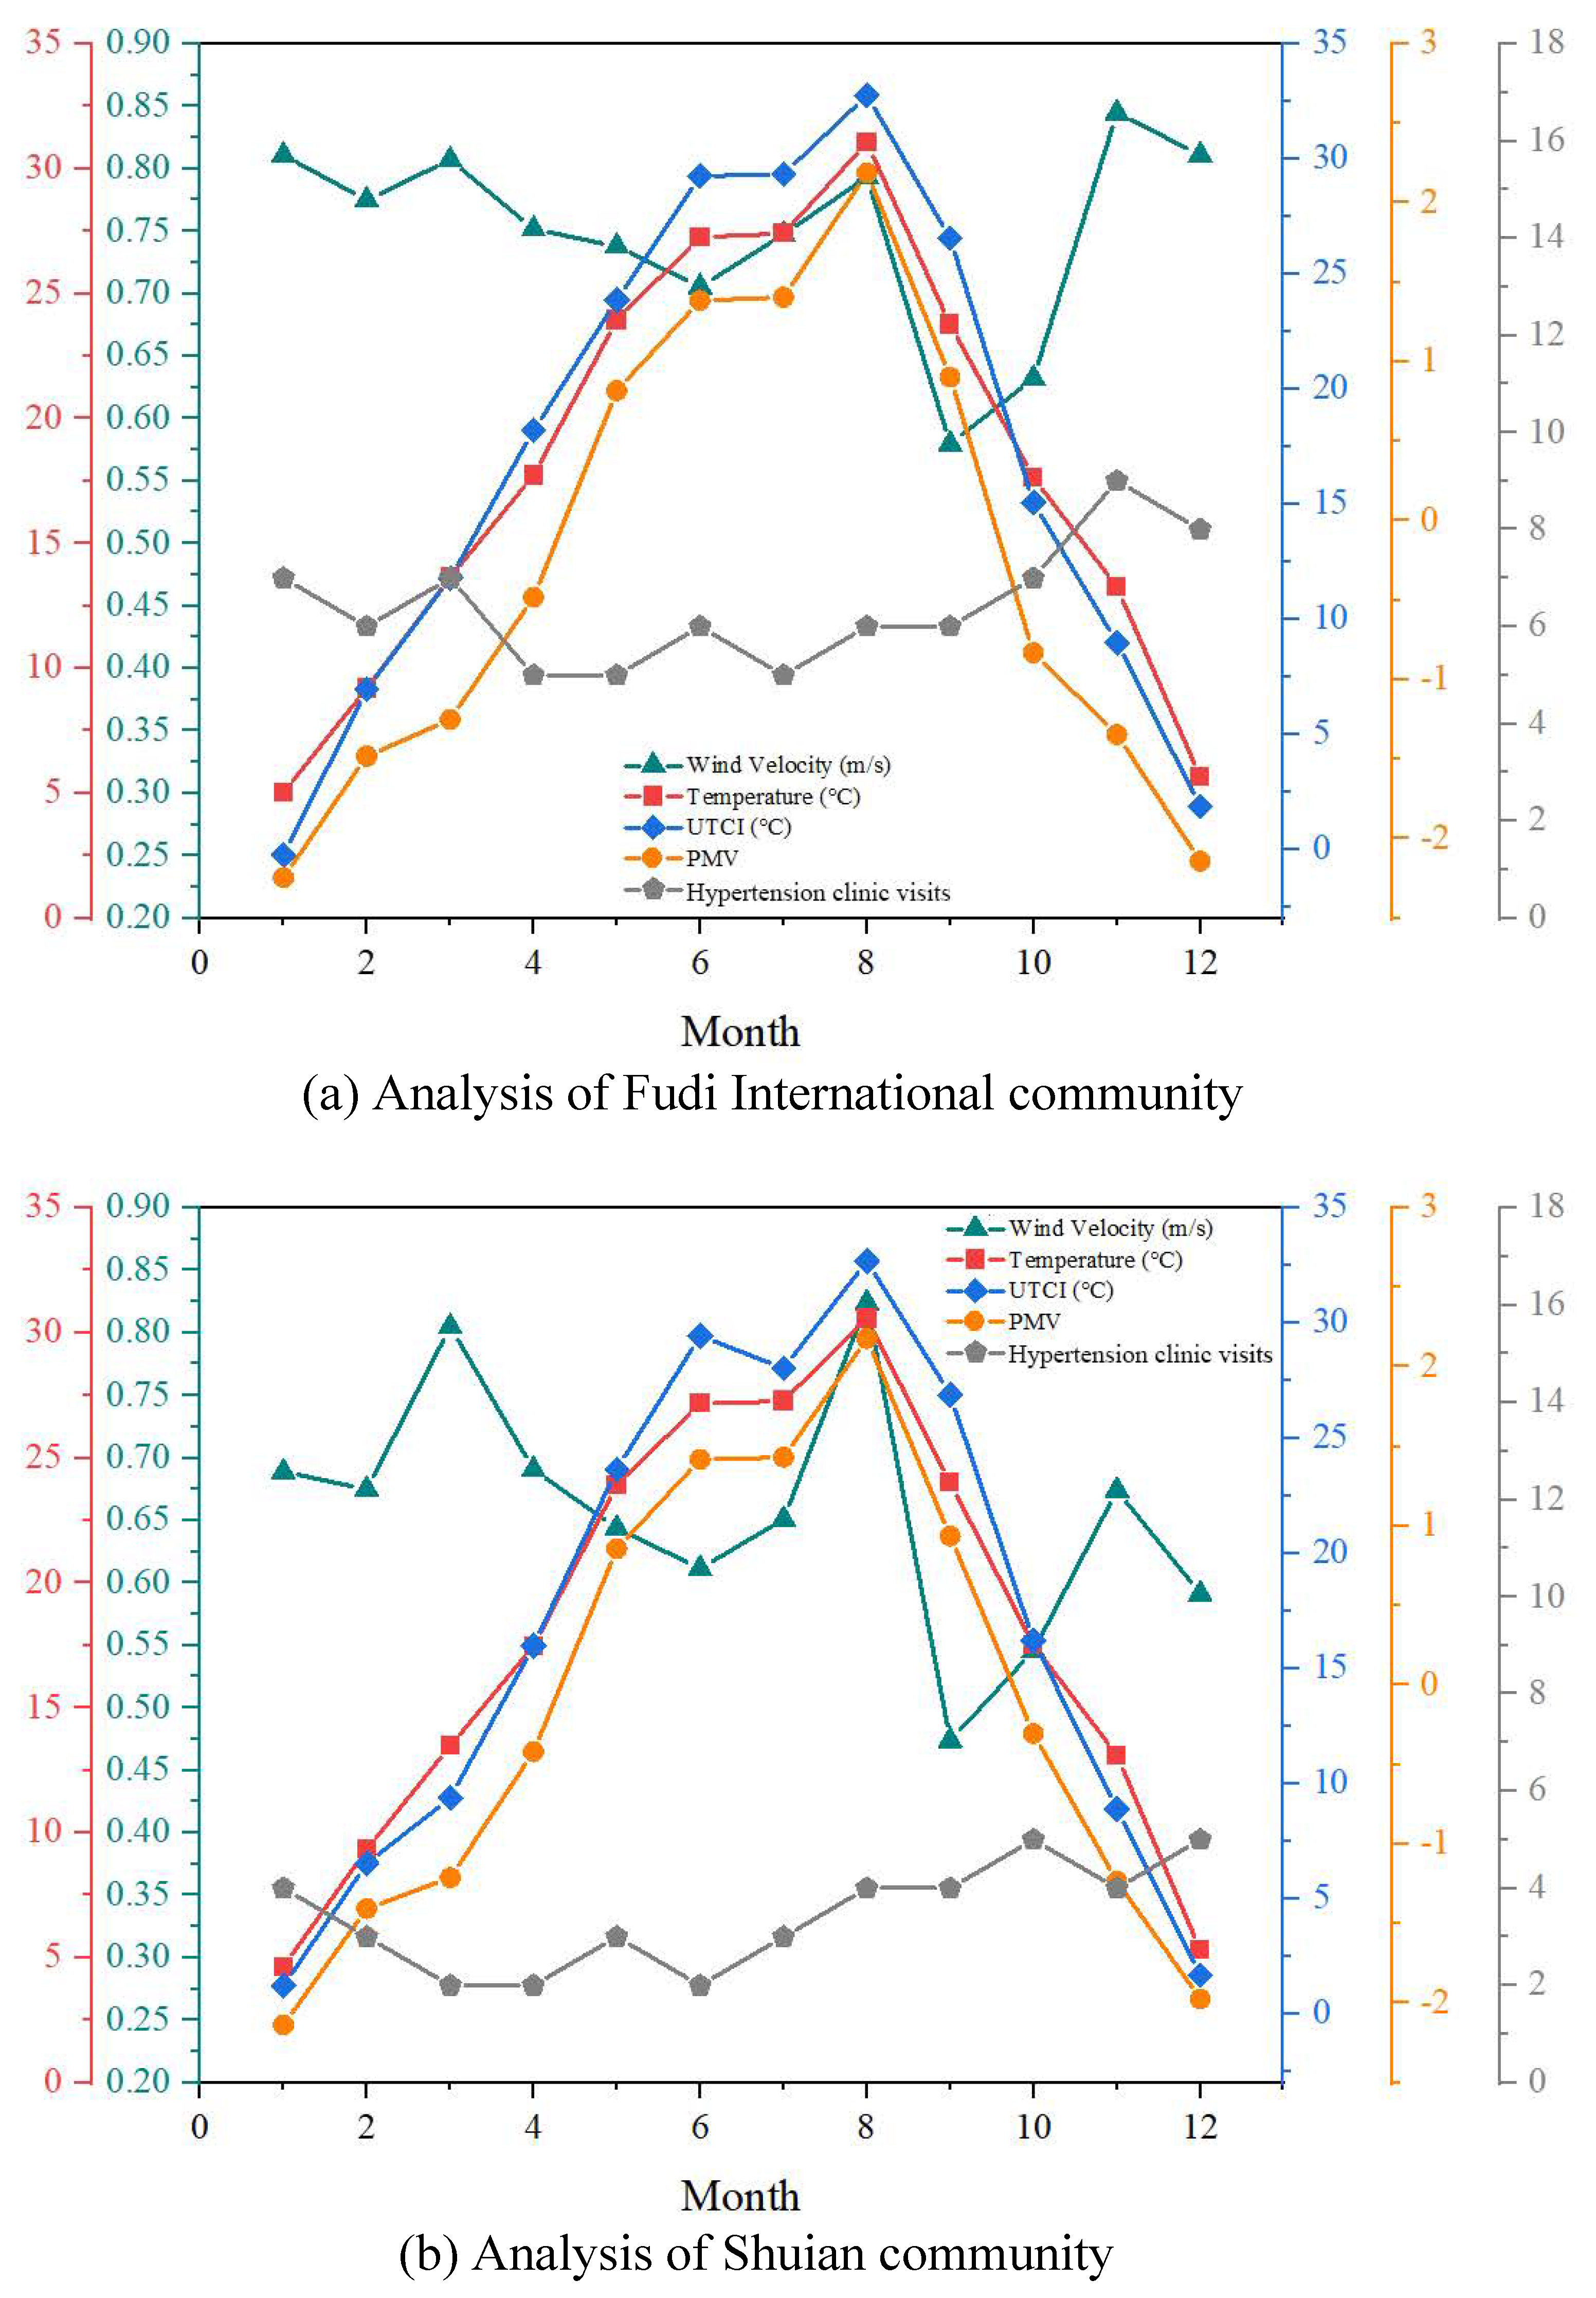
3.2.3. Simulation Results Analysis for High-Rise Communities

The central areas of high-rise residential communities are arranged primarily in a point layout, with buildings ranging from 33 to 63 m in height. Due to their height, these buildings enhance the local wind speed effect on the windward side, accelerating heat dissipation in these wind-exposed areas. Consequently, temperature, PMV, and UTCI values are lower in these areas than the community average. As shown in Figure 14a–c, the wind speed in the areas around buildings 43 and 44 in Shanglong, buildings 38–43 in Shuian, and buildings 4–10 in Fudi International communities is 0.56 m/s to 0.80 m/s higher than the community average. Accordingly, the temperature (Figure 14g–i) in these areas is 0.78 °C to 1.57 °C lower than the average value of the community. The PMV (Figure 14m–o) reduced by 0.16 to 0.25, while the UTCI (Figure 14s–u) decreased by 1.3 °C to 1.4 °C.
Compared to lower floors, higher floors usually have stronger wind speeds and colder temperatures, resulting in reduced PMV and UTCI values. As shown in the section of Figure 14f, the wind speed on the first floor of building 9 in Fudi International community is 1.36 m/s, and it increases to 1.71 m/s on the top floor. Meanwhile, as shown in Figure 14l,r,x, the temperature, PMV, and UTCI decrease from 31.8 °C, 2.21, and 32.1 °C to 30.5 °C, 2.15, and 30.6 °C, respectively. Although the simulation results show that the increased wind speed on higher floors is beneficial for improving thermal comfort in summer, the adverse effects of cold winds in the winter must also be considered.

3.3. Correlation Analysis

To explore the correlation between microclimatic factors and hypertension incidence, this study selected communities with a higher number of patients. Line graphs were plotted to illustrate the monthly variation in microclimatic factors and hypertension incidence across different building height types. In these graphs, vertical axes of the green, red, orange, blue, and gray lines correlate with monthly mean wind speed (m/s), temperature (°C), PMV value, UTCI value, and hypertension population, respectively. Given the complex effects of these factors on the hypertension incidence, the following discussion will categorize the analysis according to community type.

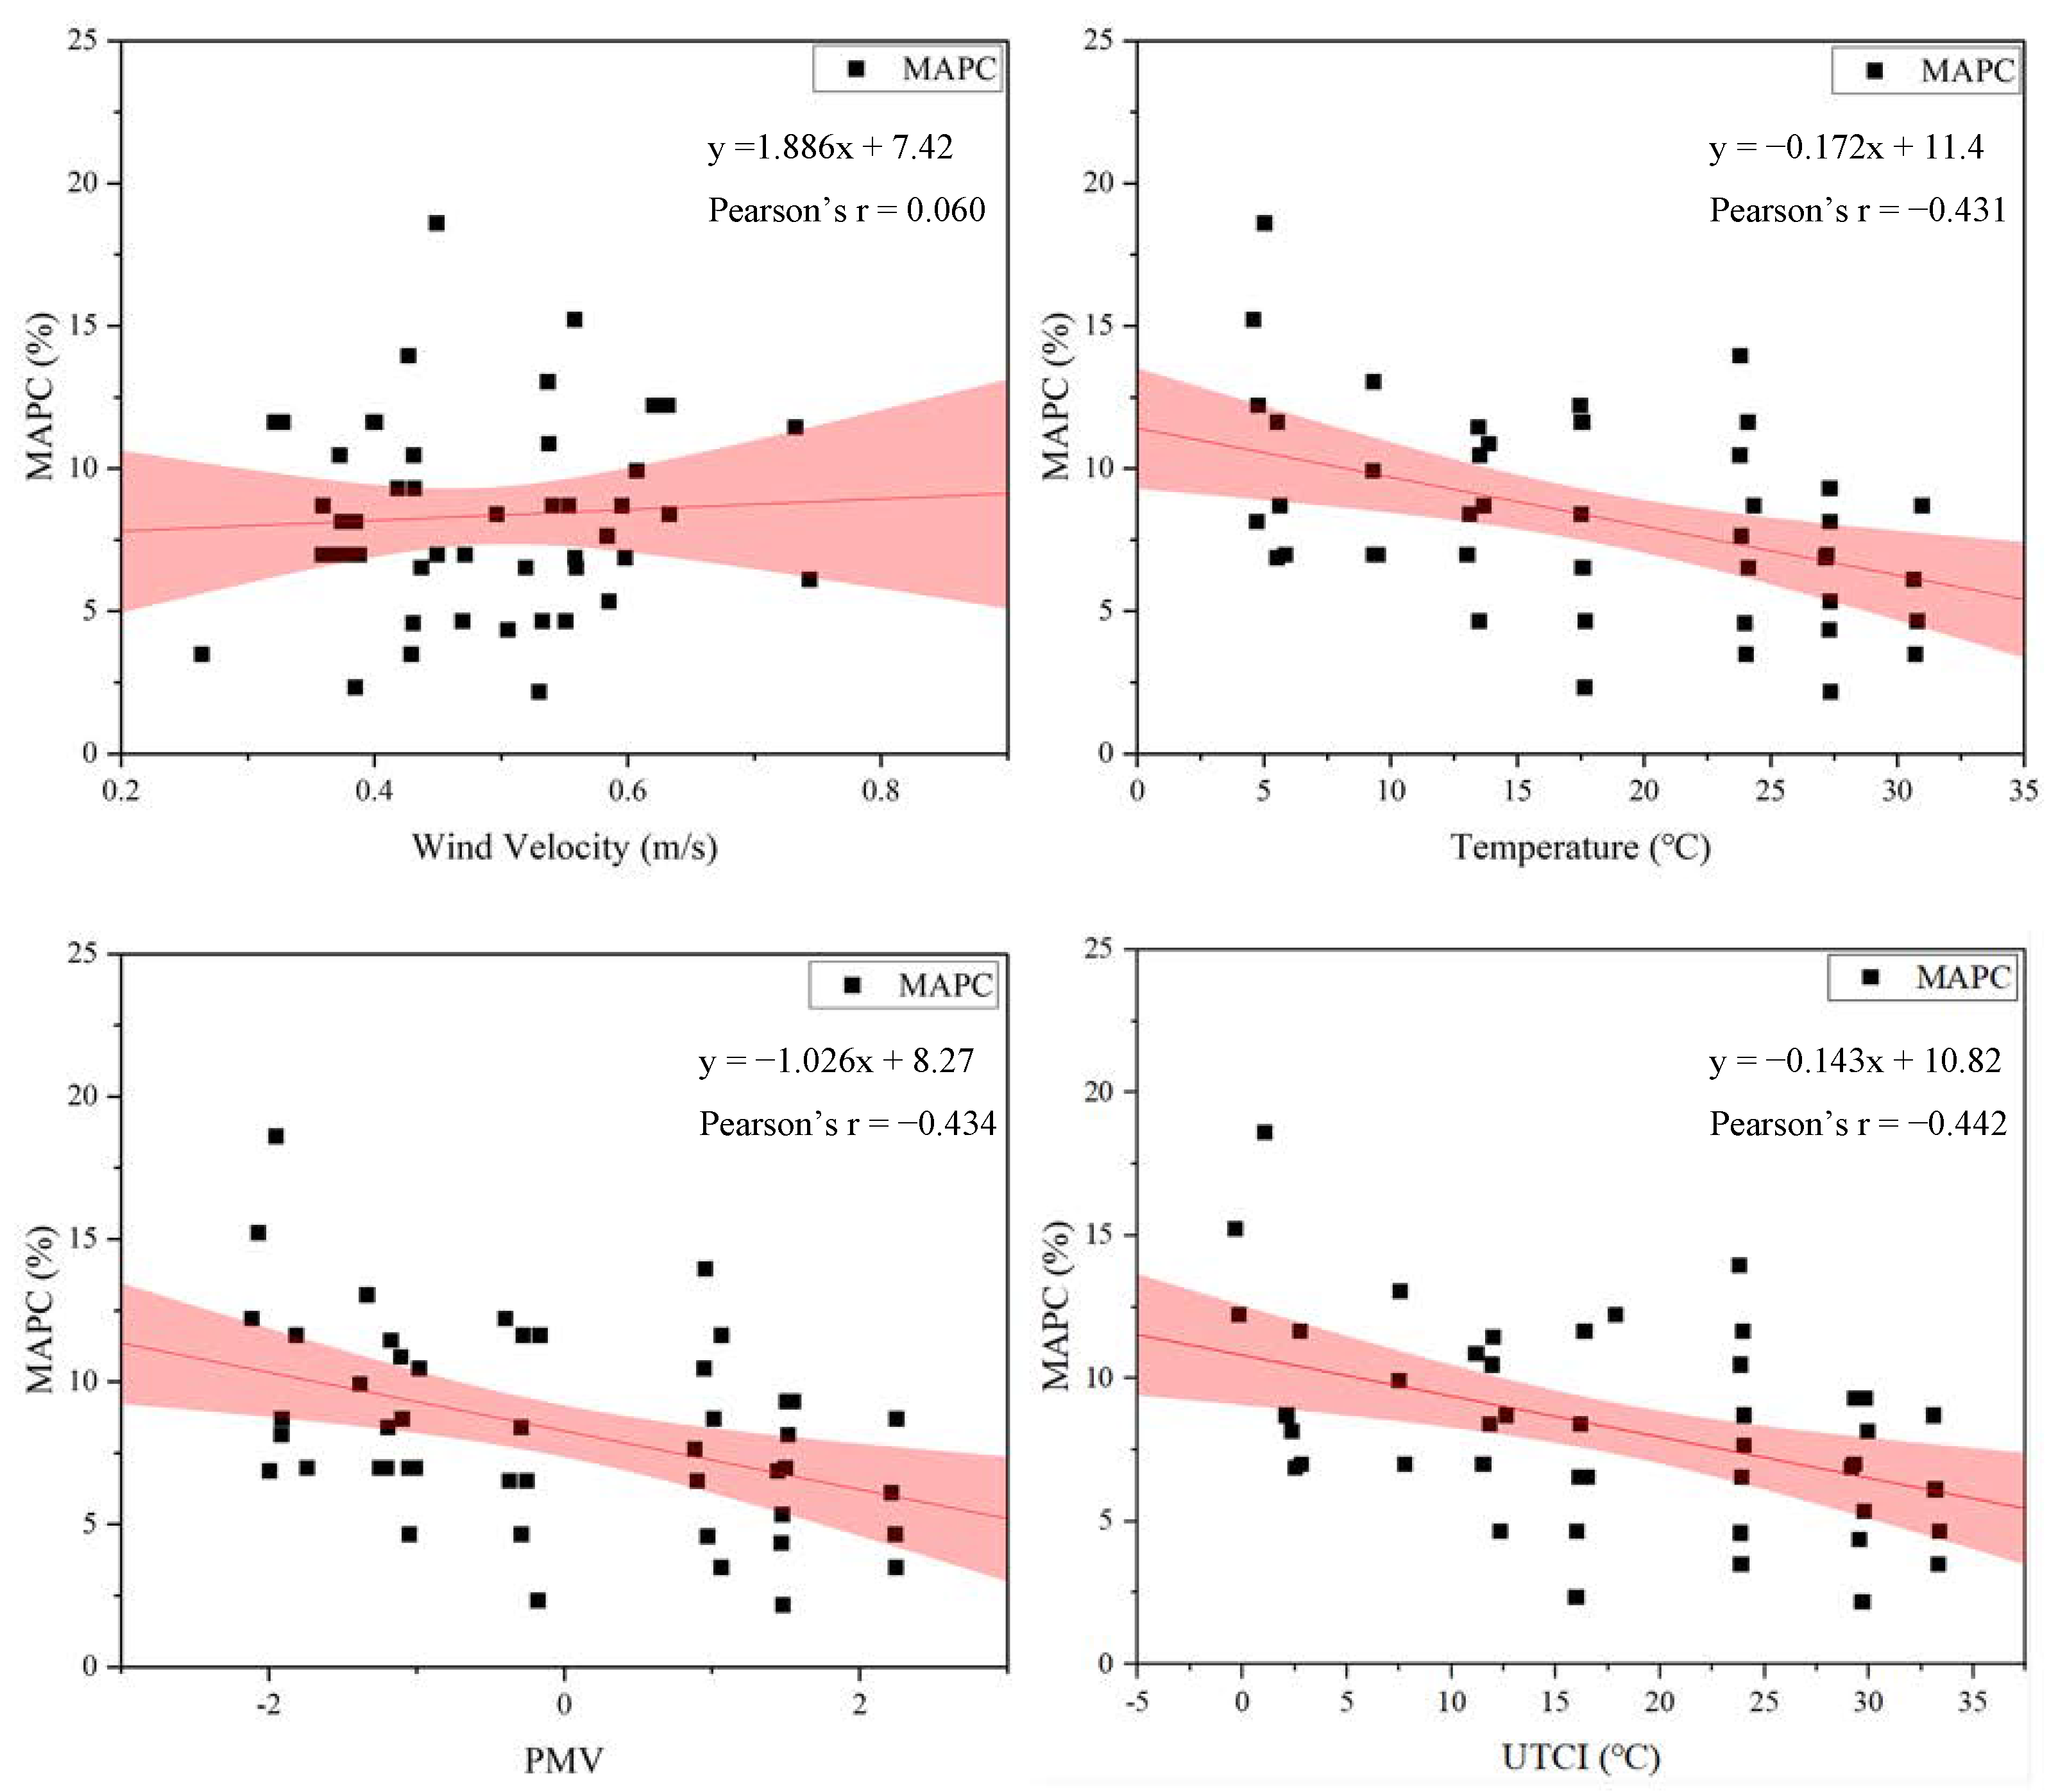
3.3.1. Correlation Analysis in Multi-Story Communities

As illustrated in Figure 15, the relationship between wind speed and hypertension incidence is not obvious. However, hypertension incidence tends to decrease as temperature, PMV or UTCI increases. Specifically, the MAPC decreases by approximately 1.719% per 10 °C increase in temperature (r = −0.431, p < 0.1); the MAPC decreases by approximately 1.026% for each 1 unit increase in PMV (r = −0.434, p < 0.1); and the MAPC decreases by approximately 1.431% per 10 °C increase in UTCI (r = −0.442, p < 0.1).
As illustrated in Figure 16, there is a significant correlation between temperature, PMV, UTCI, and hypertension incidence in the Shekeyuan and Zhangjiawan communities. However, the impact of temperature on PMV varies between the two communities. These differences may be attributed to common structural variations, such as low building heights, differences in environmental layout, and local wind speeds. These variations can also influence the incidence. During the periods from February to April, due to the previously mentioned differences, the two communities showed significant discrepancy in PMV, which in turn resulted in different trends in the number of clinic visits. Between March and April, temperatures were generally stable in both communities. In the Shekeyuan community, the wind speed remained relatively stable, with a PMV variation rate of 0.73, and the number of clinic visits continued to decrease. In contrast, the Zhangjiawan community had a PMV variation rate of only 0.26, and the number of clinic visits increased. This phenomenon further confirms the strong correlation between PMV and disease incidence. In addition, from June to July, the wind speed, temperature, and PMV in the Shekeyuan community remained stable at 0.5 m/s, 27.3 °C, and 1.47, respectively. Meanwhile, the UTCI increased from 29.6 °C to 32.7 °C. The number of clinic visits continued to decline during this period, which verifies the negative correlation between UTCI and clinic visits.

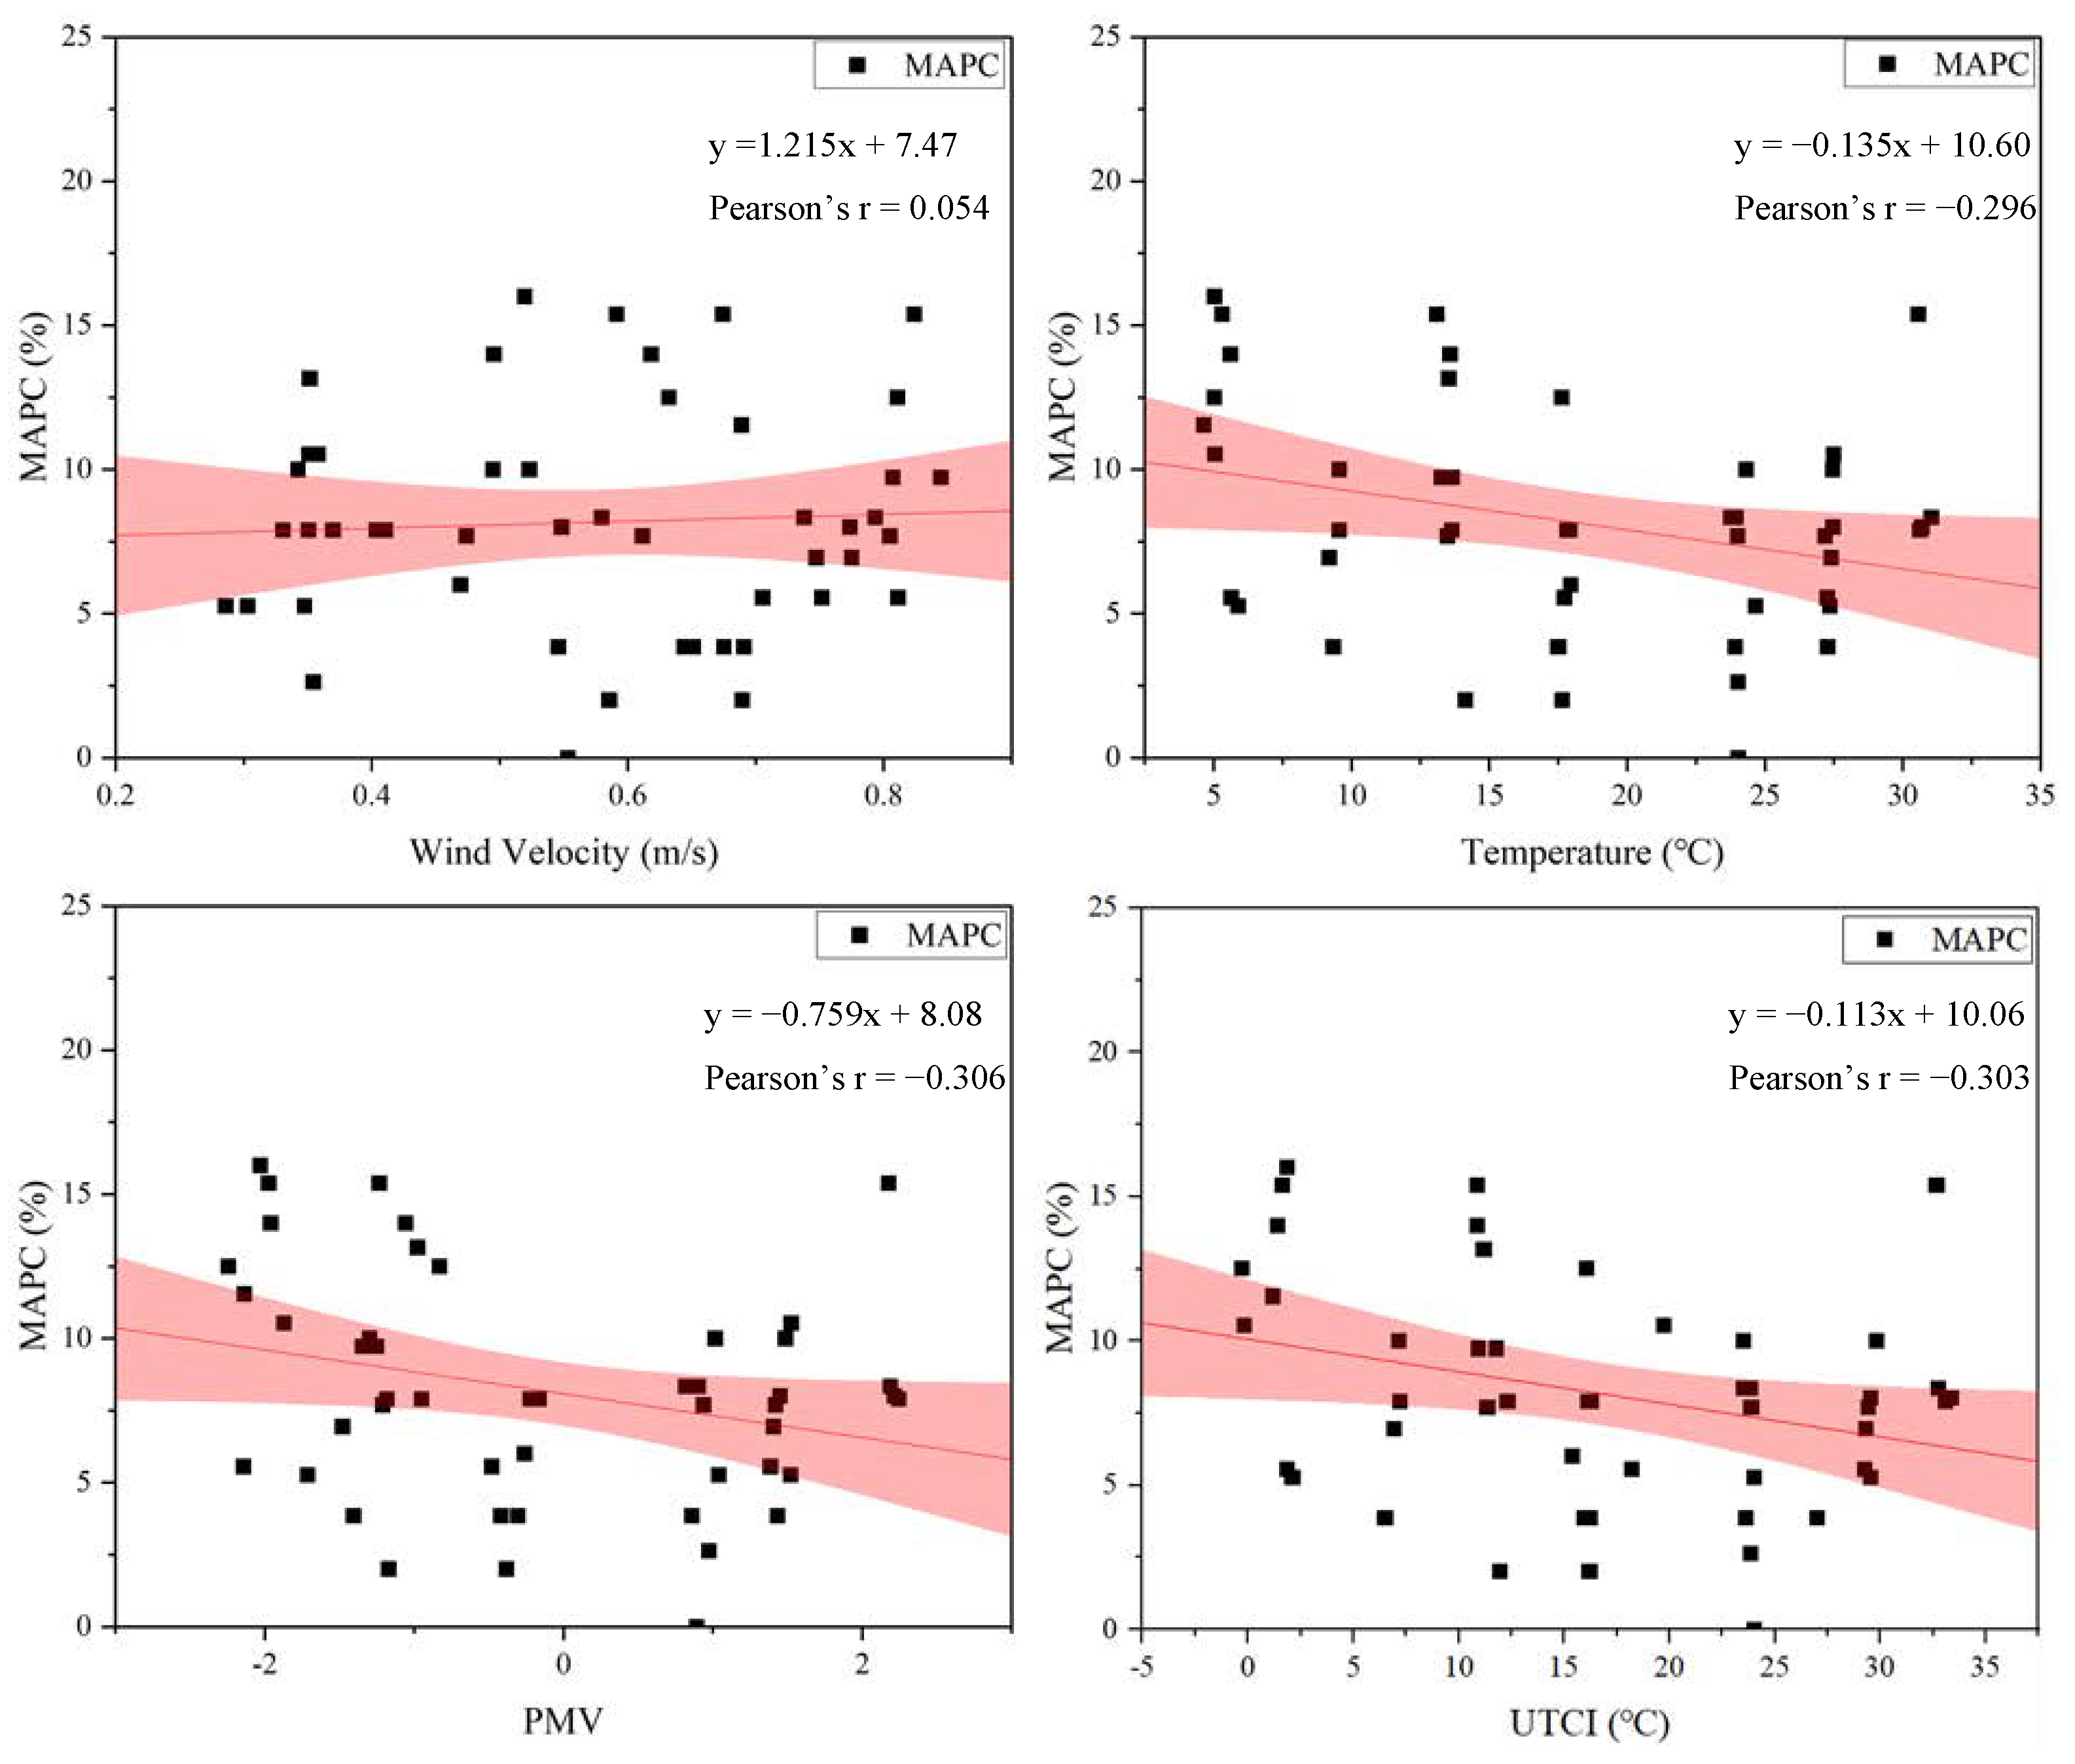
3.3.2. Correlation Analysis in Mid-Rise Communities

As shown in Figure 17, The results showed some changes under the impact of wind. However, the Pearson correlation coefficient (Pearson’s r) between wind speed and MAPC is 0.126, indicating that the correlation between wind speed and disease incidence is weak. Temperature, PMV, and UTCI show a negative correlation with the incidence of hypertension. Specifically, MAPC decreased by about 1.657% (r = −0.323, p < 0.1) with each 10 °C increase in temperature, the MAPC decreased by about 0.875% (r = −0.336, p < 0.1) per unit increase in PMV, and the MAPC decreased by about 1.264% (r = −0.310, p < 0.1) with each 10 °C increase in UTCI. Although these three indicators have a slightly weaker influence in multi-story communities, the experimental results still show that there is an association between temperature, PMV, UTCI, and the incidence of hypertension.
As demonstrated in Figure 18, the Junzhuan Community and the Shuiliting Community exhibit highly consistent microclimate changes, with similar trends observed in indicators such as wind speed, temperature, PMV, and UTCI. This consistency may have contributed to the observed stability in the health of the residents. The number of clinic visits in both communities remained relatively stable and exhibited a negative correlation with temperature, PMV, and UTCI. Concurrently, the decrease in temperature PMV and UTCI is often accompanied by increased clinic visits.
The two communities exhibit similar numbers of buildings. Concurrently, their population structures are also relatively equivalent. The number of clinic visits remains stable throughout the year, with little variation between the two communities. This phenomenon suggests that the hypertension incidence tends to remain roughly constant under similar living conditions and population structures, providing a meaningful reference for predicting urban health risks.

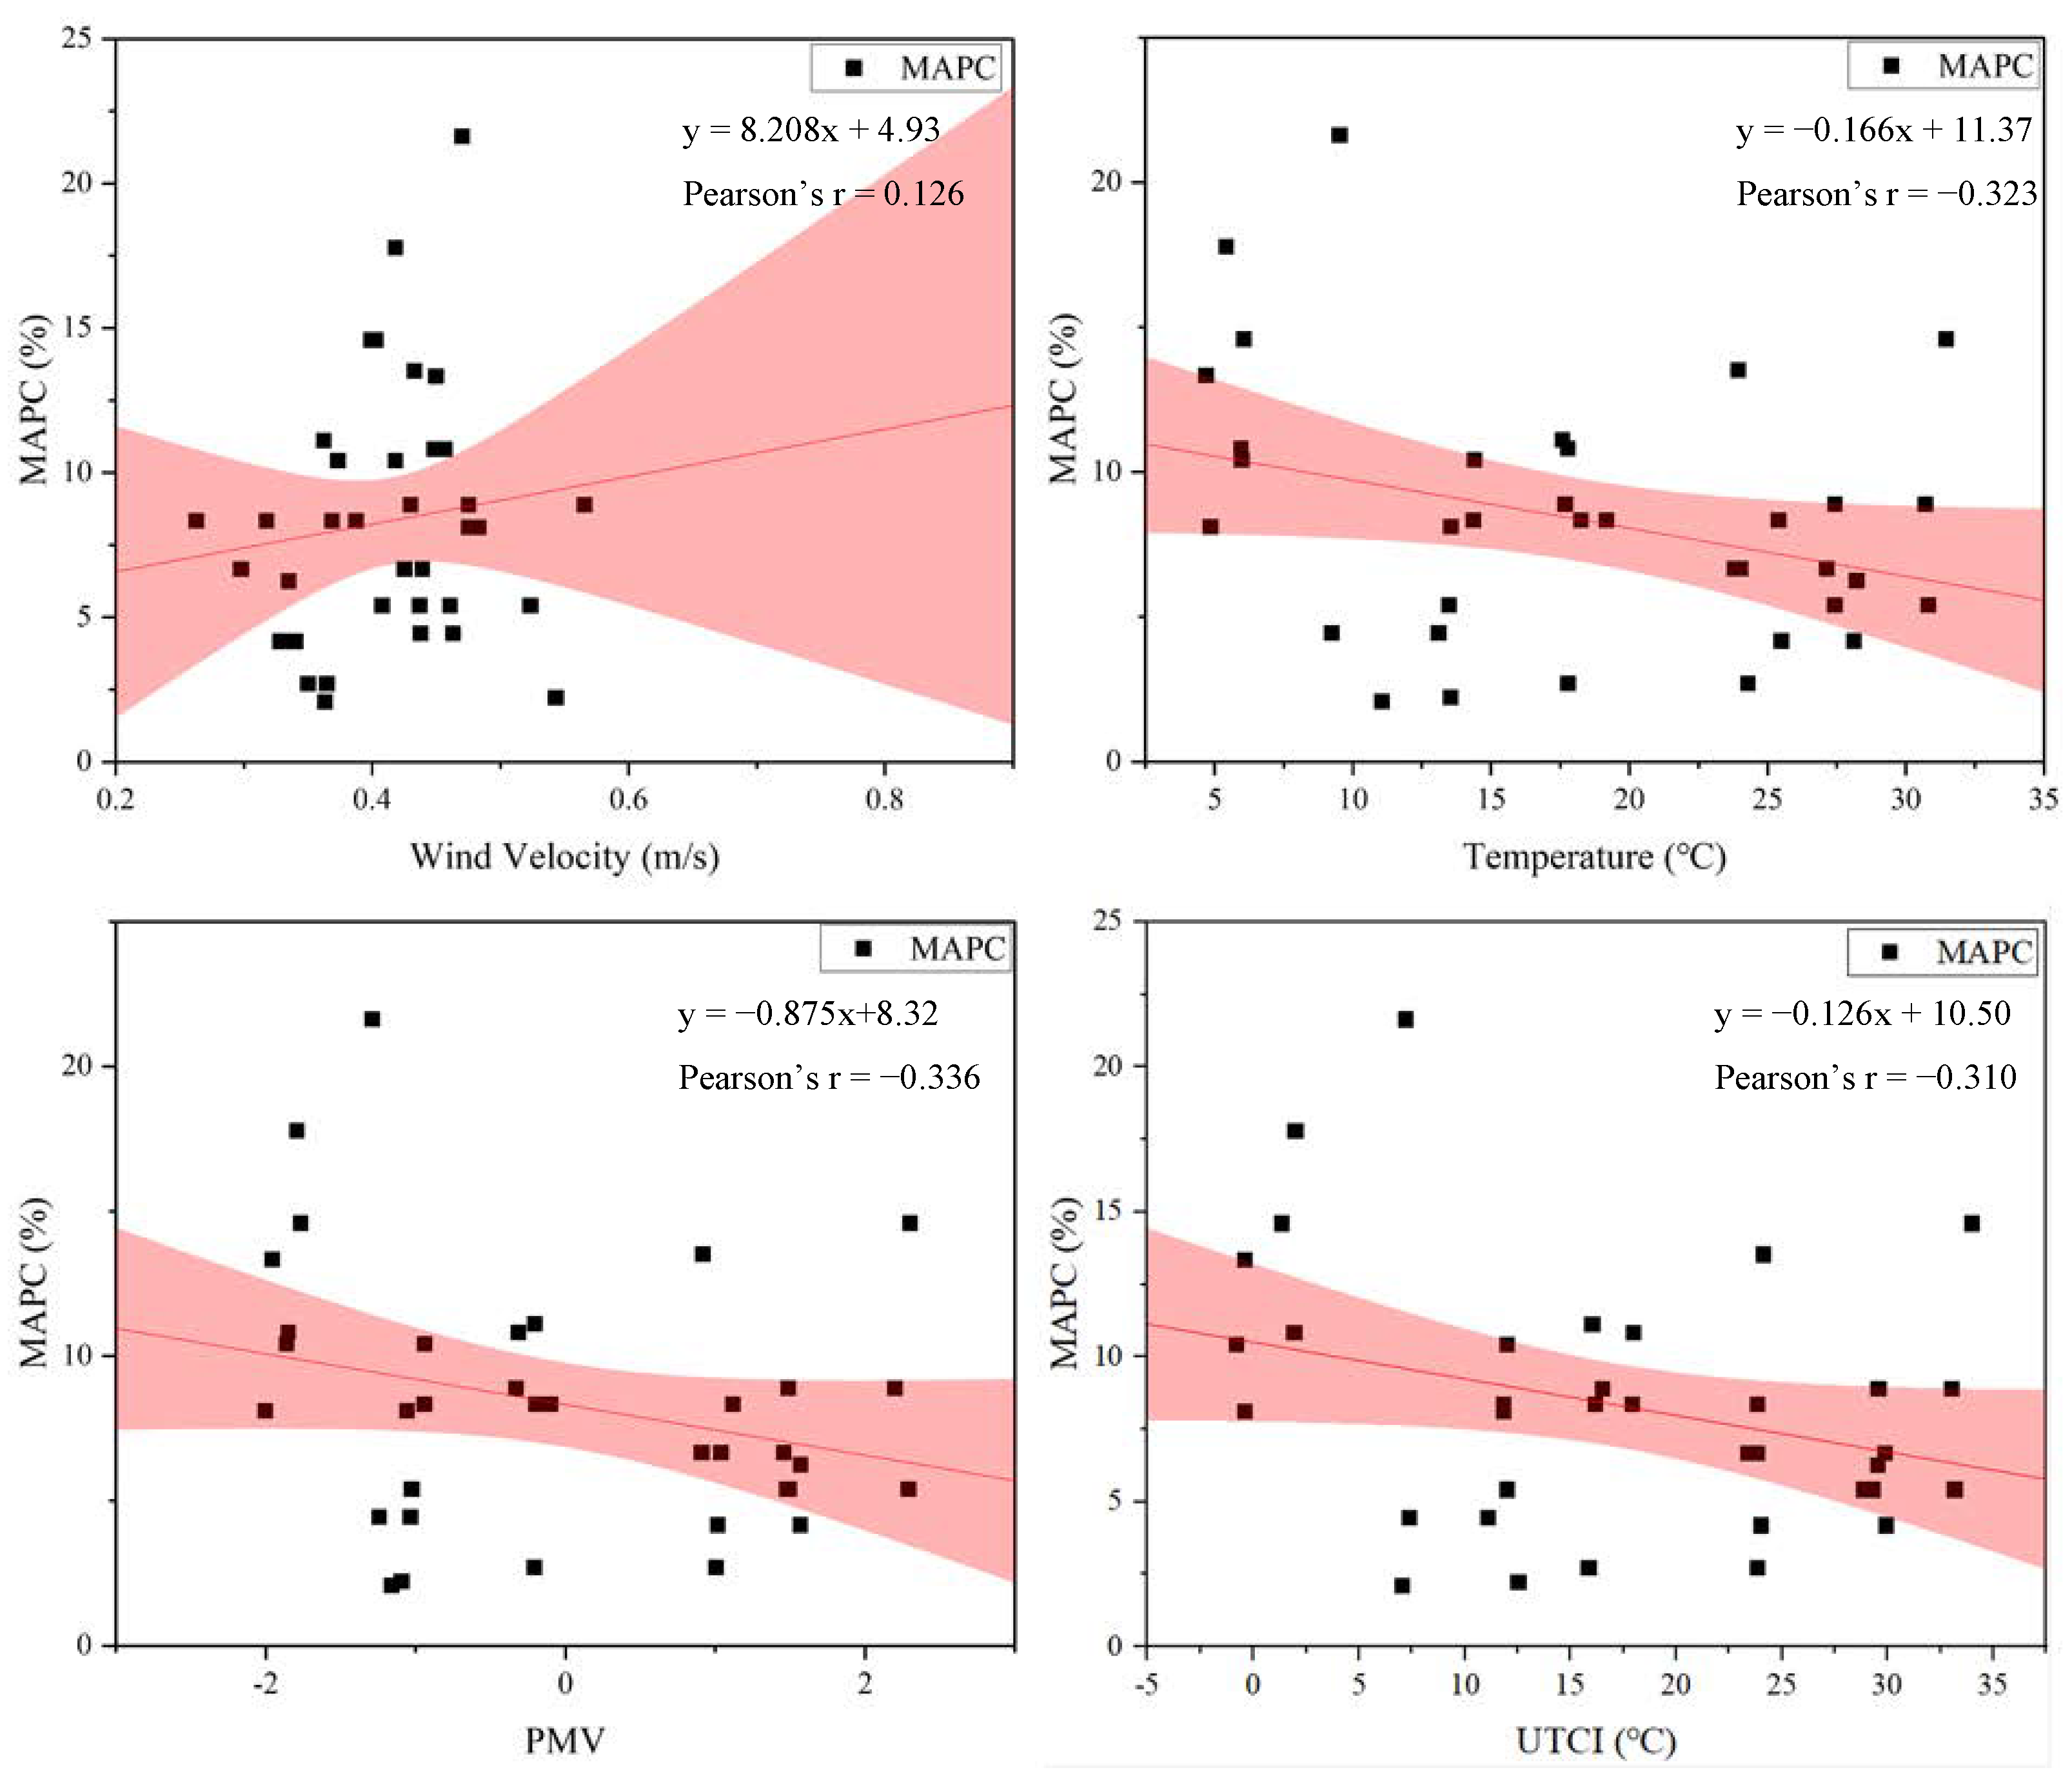
3.3.3. Correlation Analysis in High-Rise Communities
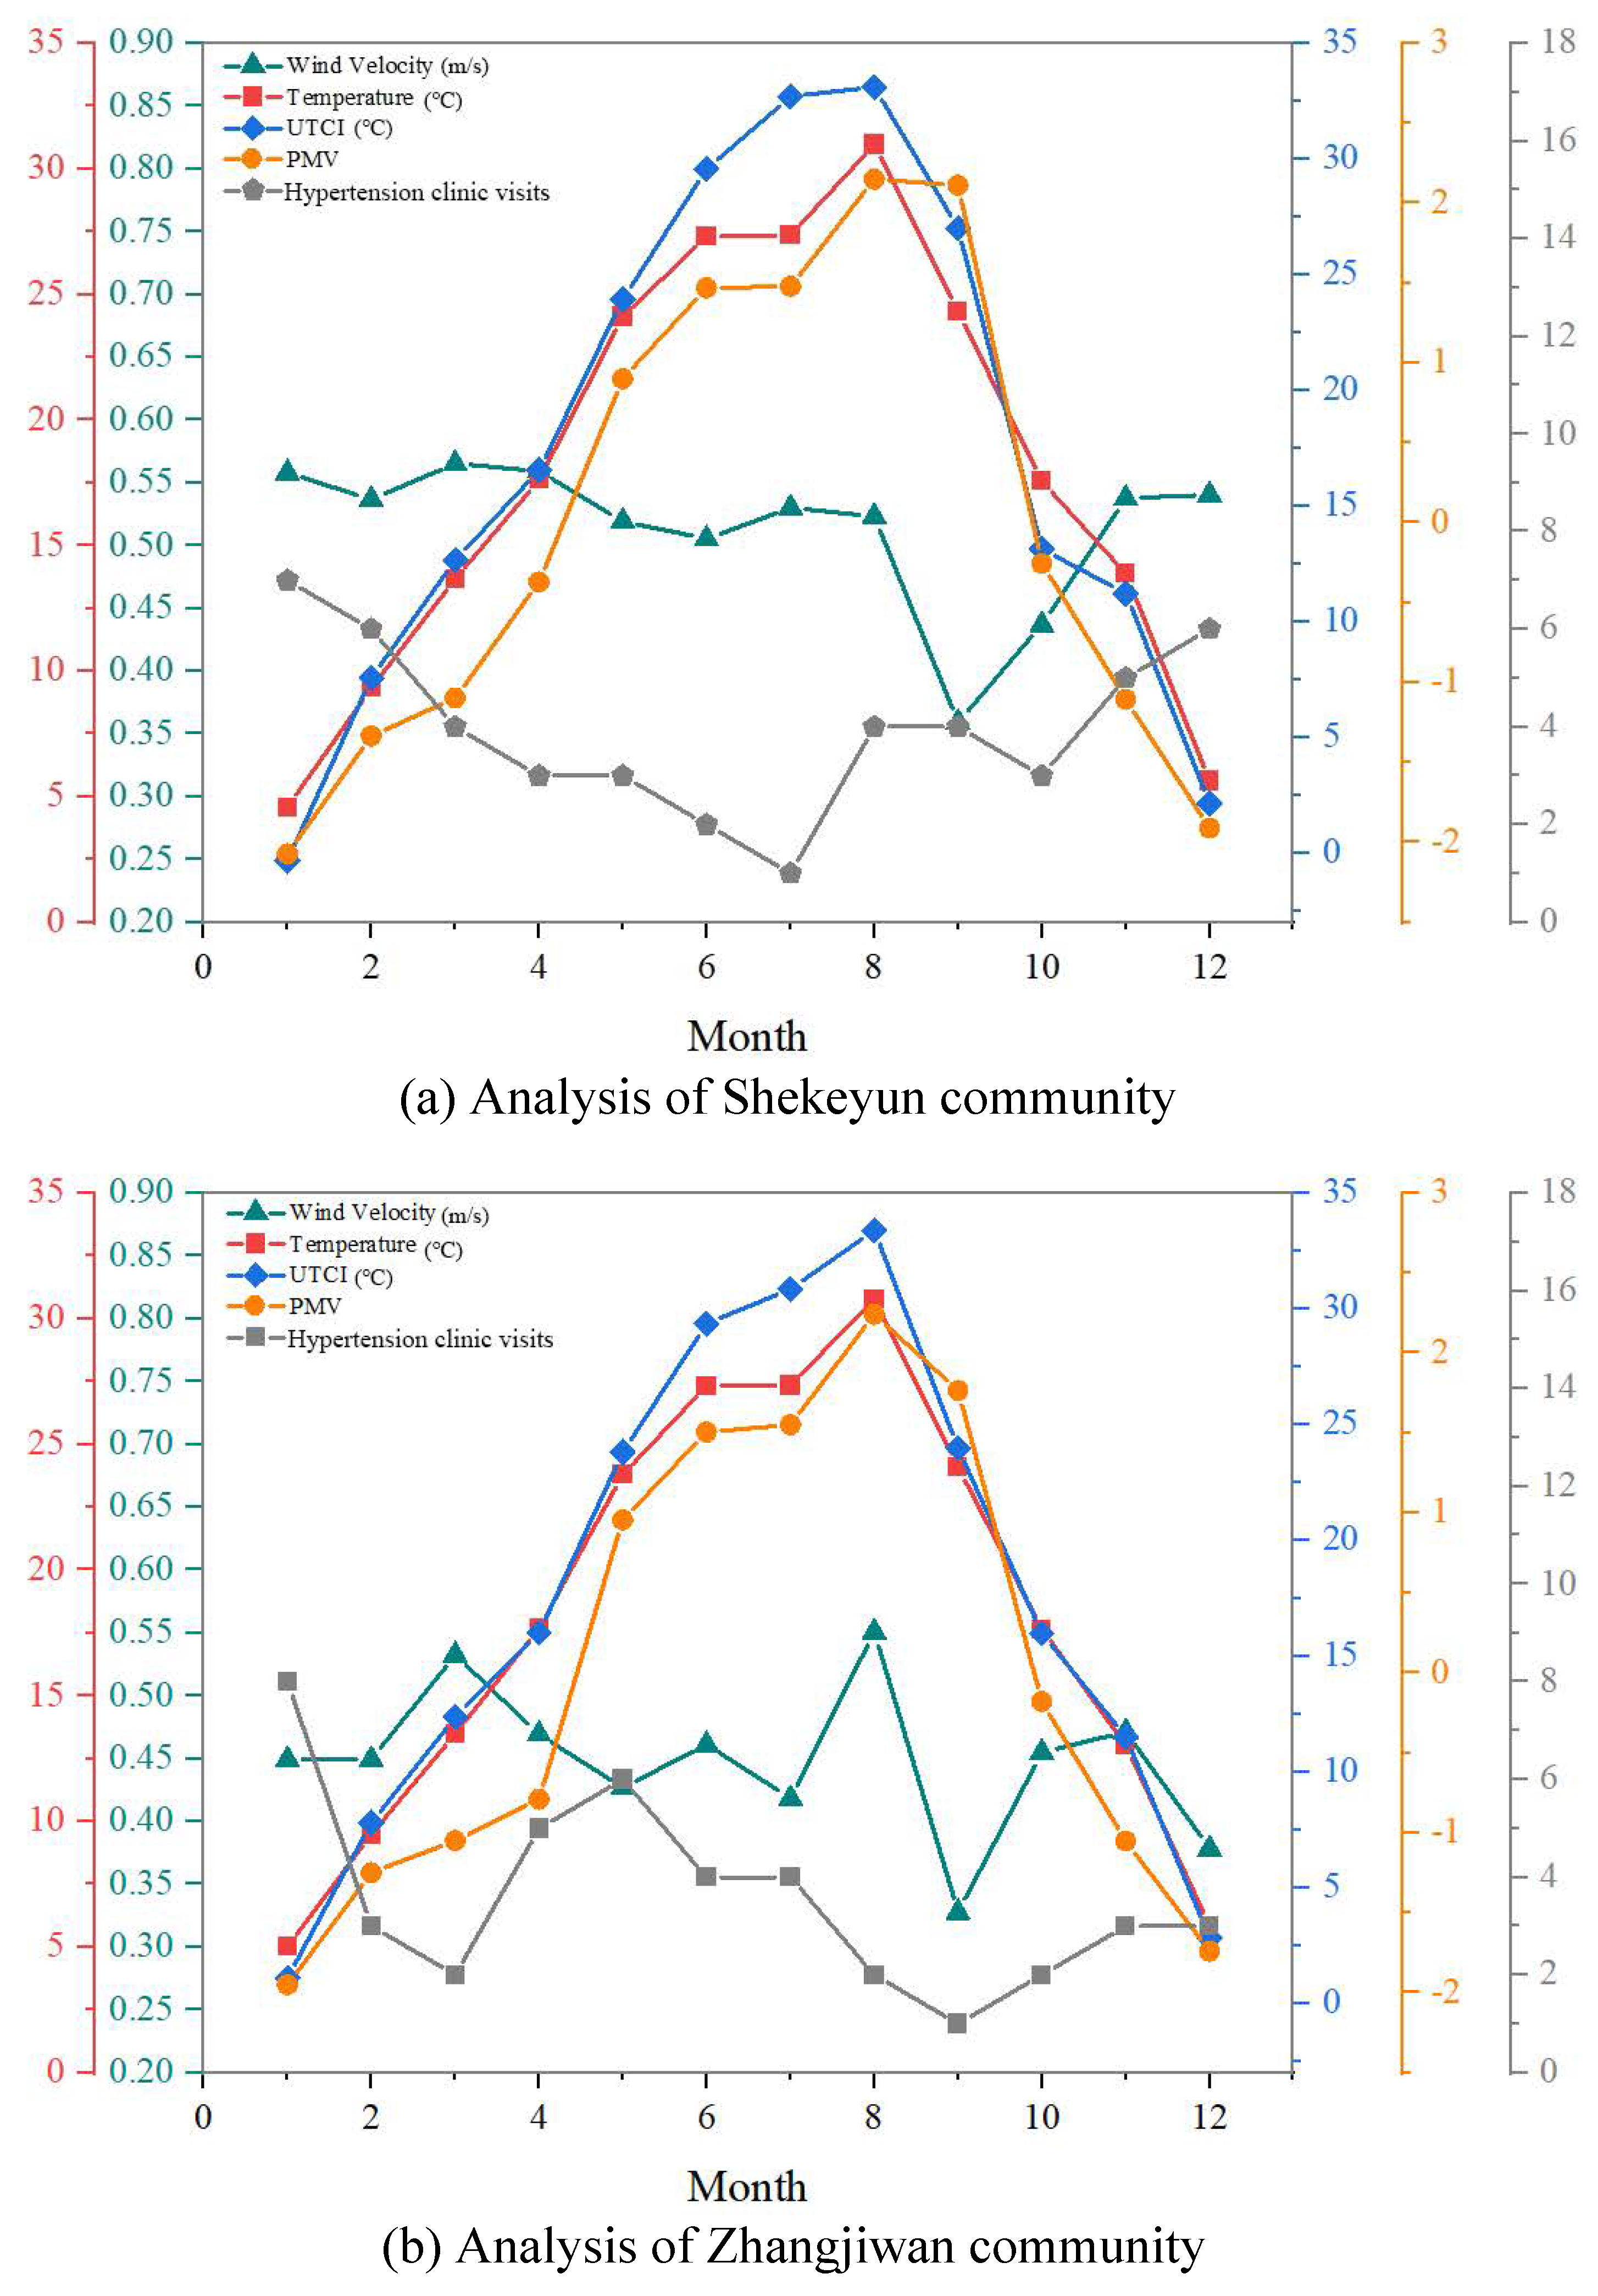
As demonstrated in Figure 19, compared with multi-story and mid-rise communities, the effect of wind speed in high-rise residential communities is close to zero, and the influence of temperature, PMV, and UTCI on hypertension incidence is also the lowest. MAPC decreases by about 1.349% for every 10 °C increase in temperature (r = −0.296, p < 0.1). It also decreases by about 0.759% for every unit increase in PMV (r = −0.306, p < 0.1) and by about 1.133% for every 10 °C increase in UTCI (r = −0.303, p < 0.1).
As illustrated in Figure 20, the number of clinic visits in high-rise residential communities exhibits stability throughout the year, minimizing variation from each month. Hypertension incidence still shows a negative correlation with temperature, PMV, and UTCI. Compared to the other two types of communities, the extent of change in response to fluctuations in these variables is weaker. This phenomenon may be associated with the height of the buildings. As a result, the exposed area of the residents is limited and the influence of the microclimate on their health is reduced.

3.4. Discussion

This study provides a new perspective on the associations between residential spatial form, microclimate characteristics, and hypertension risk. However, it has certain limitations. Firstly, although we incorporated buildings and vegetation within a 200 m radius of the target community in the CFD modeling to enhance the authenticity of boundary conditions, the scope of the simulation was limited to the community and its adjacent areas. Thus, the urban heat island effect (UHI) at the urban scale was not systematically considered. The UHI effect is one of the main mechanisms for heat accumulation in cities [73]. It involves complex factors such as differences in surface materials, anthropogenic heat emissions, and long-wave radiation. The unified boundary meteorological conditions used in this study do not fully reflect the impact of these mechanisms. Future research will simulate the UHI and its impact on health risks for residents. Secondly, this paper has not yet introduced socioeconomic and demographic variables (such as age, income, and education level) for control. In the future, combining community statistical data will further improve the analysis of population characteristics. Additionally, the current study primarily focuses on the relationship between microclimate and hypertension incidence. Other potential health-influencing factors, such as environmental variables like air pollution or noise, were not considered in this study. Future studies will take more environmental factors into account and systematically evaluate the combined impact of multiple urban environmental factors on residents’ health.

4. Conclusions

To promote the development of healthy community design, this study conducted year-round microclimate simulations for 18 residential communities using Phoenics. During the model construction process, spatial features such as community layout and building height were fully considered to improve the accuracy of the simulation results. On this basis, the relationships between microclimatic factors (such as wind speed, temperature, PMV, and UTCI) and the MAPC were further analyzed. The study showed that there is no significant correlation between the MAPC and wind speed, and the effect of temperature alone on the number of cases is relatively limited. However, the incidence rate decreases significantly when temperature, PMV, and UTCI increase together. The results suggest that the impact of community design on the health of residents can be achieved through the improvement of microclimate conditions within the community. The details are as follows:
  • In communities with different building heights, MAPC is reduced by approximately 1.35% to 1.72% for every 10 °C increase in temperature, by about 0.759% to 1.026% for every 1-unit increase in PMV, and by about 1.13% to 1.43% for every 10 °C increase in UTCI.
  • When temperature, PMV, and UTCI increase simultaneously, the effect on MAPC becomes more pronounced. Compared to other types of communities, temperature and PMV have the most significant impact on the MAPC in multi-story residential areas, which indicates the necessity of taking into account the health risks associated with microclimatic imbalances during cold seasons.
  • As building height increases, the influence of temperature, PMV, and UTCI on hypertension incidence tends to decrease. It is recommended to improve the stability of the outdoor microclimate by implementing public green zones.
The findings further confirm that climate-adaptive design should incorporate differentiated microclimate regulation strategies tailored to communities of different building heights, which is highly relevant for building healthy communities.

Author Contributions

Conceptualization, K.L. (Ke Li) and K.L. (Kun Li); writing—original draft preparation, K.L. (Ke Li); writing—review and editing, K.L. (Ke Li), K.L. (Kun Li), and H.J.; supervision, K.L. (Kun Li) and S.S.Y.L.; funding acquisition, M.F.; data curation, M.F. and F.L. All authors have read and agreed to the published version of the manuscript.

Funding

This research was funded by the National Natural Science Foundation of China (82070302, 81902018).

Institutional Review Board Statement

The study was conducted in accordance with the Declaration of Helsinki, and approved by the Medical Ethics Committee, Zhongnan Hospital of Wuhan University (protocol code: 2021009; 12 January 2021).

Informed Consent Statement

The study is based on a retrospective, non-interventional design and does not involve any personally identifiable information or direct contact with study participants. The hospitalization data used in this research were fully de-identified by the data provider prior to our analysis; all personal identifiers (such as name, national ID number, and contact information) were completely removed. During the study, we only used generalized spatial information about patients’ residential locations to analyze street-scale environmental features and did not involve reconstructing precise individual locations or extracting any sensitive personal attributes. It also does not involve human specimens or related experiments.

Data Availability Statement

Date available on request due to restrictions.

Conflicts of Interest

The authors declare no conflicts of interest.

Abbreviations

The following abbreviations are used in this manuscript:
CFDComputational Fluid Dynamics
PMVPredicted Mean Vote
UTCIUniversal Thermal Climate Index
BPBlood Pressure
PETPhysiological Equivalent Temperature
ABPMAmbulatory Blood Pressure Monitoring
SBPSystolic Blood Pressure
DBPDiastolic Blood Pressure
PPPulse Pressure
MAPMean Arterial Pressure
MAPCMonthly Proportion of Annual Patient Cases

References

  1. Wei, X. Research on Reducing Carbon Consumption in Residential Community Spaces as Influenced by Microclimate Environments. J. Urban Plan. Dev. 2021, 147, 04021037. [Google Scholar] [CrossRef]
  2. Zhang, W.C.; Luo, X.Y.; Peng, X.R.; Liu, R.Z.; Jing, Y.; Zhao, F.Y. Green roof on the ventilation and pollutant dispersion in urban street canyons under unstable thermal stratification: Aiding and opposing effects. Sustain. Cities Soc. 2021, 75, 103315. [Google Scholar] [CrossRef]
  3. Gundeti, V.; Aroor, S.; H, K.; Lewis, L.E.; Mundkur, S.C.; Bhat Y, R.; Kini, P. Alarming rise in prevalence of obesity among children with essential hypertension: Reflection of larger global epidemiological change of adolescent nutritional status. Clin. Epidemiol. Glob. Health 2025, 32, 101948. [Google Scholar] [CrossRef]
  4. Lin, S.; Yan, H.; Zhou, S.; Qiao, Z.; Chen, J. HRP-OG: Online Learning with Generative Feature Replay for Hypertension Risk Prediction in a Nonstationary Environment. Sensors 2024, 24, 5033. [Google Scholar] [CrossRef]
  5. GBD 2016 Lifetime Risk of Stroke Collaborators. Global, regional, and country-specific lifetime risks of stroke, 1990 and 2016. N. Engl. J. Med. 2018, 379, 2429–2437. [Google Scholar] [CrossRef]
  6. de la Sierra, A.; Ruilope, L.M.; Staplin, N.; Gorostidi, M.; Vinyoles, E.; Segura, J.; Armario, P.; Oliveras, A.; Williams, B. Resistant Hypertension and Mortality: An Observational Cohort Study. Hypertension 2024, 81, 2350–2356. [Google Scholar] [CrossRef]
  7. Rajagopalan, S.; Brook, R.D.; Münzel, T. Environmental Hypertensionology and the Mosaic Theory of Hypertension. Hypertension 2025, 82, 561–572. [Google Scholar] [CrossRef]
  8. Tai, Y.; Obayashi, K.; Yamagami, Y.; Saeki, K. Inverse association of skin temperature with ambulatory blood pressure and the mediation of skin temperature in blood pressure responses to ambient temperature. Hypertension 2022, 79, 1845–1855. [Google Scholar] [CrossRef]
  9. Komulainen, S.; Oja, T.; Rintamäki, H.; Virokannas, H.; Keinänen-Kiukaanniemi, S. Blood pressure and thermal responses to whole body cold exposure in mildly hypertensive subjects. J. Therm. Biol. 2004, 29, 851–856. [Google Scholar] [CrossRef]
  10. Goto, T.; Niu, Z.; Chiba, Y.; Amano, K.; Saijo, Y. Human body temperature and cardiovascular response to changes in ambient temperature and body posture. Build. Environ. 2024, 266, 112085. [Google Scholar] [CrossRef]
  11. Martinez-Nicolas, A.; Meyer, M.; Hunkler, S.; Madrid, J.A.; Rol, M.A.; Meyer, A.H.; Schötzau, A.; Orgül, S.; Kräuchi, K. Daytime variation in ambient temperature affects skin temperatures and blood pressure: Ambulatory winter/summer comparison in healthy young women. Physiol. Behav. 2015, 149, 203–211. [Google Scholar] [CrossRef] [PubMed]
  12. Kashiba, A.; Ueda, K.; Uematsu, Y.; Utsumi, M.; Miyai, N.; Arita, M. Blood Pressure-Variation By Room Temperature In Home Pressure Among Metabolic Syndrome Using Home Blood Pressure Web-Based Monitoring. Atherosclerosis 2019, 287, e155. [Google Scholar] [CrossRef]
  13. Jehn, M.; Appel, L.J.; Sacks, F.M.; Miller, E.R. The effect of ambient temperature and barometric pressure on ambulatory blood pressure variability. Am. J. Hypertens. 2002, 15, 941–945. [Google Scholar] [CrossRef] [PubMed]
  14. Van Den Hurk, K.; De Kort, W.L.; Deinum, J.; Atsma, F. Higher outdoor temperatures are progressively associated with lower blood pressure: A longitudinal study in 100,000 healthy individuals. J. Am. Soc. Hypertens. 2015, 9, 536–543. [Google Scholar] [CrossRef]
  15. Xu, D.; Zhang, Y.; Wang, B.; Yang, H.; Ban, J.; Liu, F.; Li, T. Acute effects of temperature exposure on blood pressure: An hourly level panel study. Environ. Int. 2019, 124, 493–500. [Google Scholar] [CrossRef]
  16. Zheng, S.; Wang, M.Z.; Cheng, Z.Y.; Kang, F.; Nie, Y.H.; Mi, X.Y.; Li, H.Y.; Jin, L.; Zhang, Y.W.; Bai, Y.N. Effects of Outdoor Temperature on Blood Pressure in a Prospective Cohort of Northwest China. Biomed. Environ. Sci. 2021, 34, 89–100. [Google Scholar]
  17. Kang, Y.; Han, Y.; Guan, T.; Wang, X.; Xue, T.; Chen, Z.; Jiang, L.; Zhang, L.; Zheng, C.; Wang, Z.; et al. Clinical blood pressure responses to daily ambient temperature exposure in China: An analysis based on a representative nationwide population. Sci. Total Environ. 2020, 705, 135762. [Google Scholar] [CrossRef]
  18. Yoshie, R.; Mochida, A.; Tominaga, Y.; Kataoka, H.; Harimoto, K.; Nozu, T.; Shirasawa, T. Cooperative project for CFD prediction of pedestrian wind environment in the Architectural Institute of Japan. J. Wind Eng. Ind. Aerodyn. 2007, 95, 1551–1578. [Google Scholar] [CrossRef]
  19. Fujita, K.; Yoshida, S.; Ishizaki, R.; Yamamoto, E.; Takahashi, N.; Iwamae, A. Estimation of the relationship between the thermal environment of a house in winter and its occupants’ health. Environ. Res. 2024, 253, 119147. [Google Scholar] [CrossRef]
  20. Niu, J.L.; Gao, N.P. CFD Simulation of Spread Risks of Infectious Disease due to Interactive Wind and Ventilation Airflows via Window Openings in High-Rise Buildings. In Proceedings of the 2nd International Symposium on Computational Mechanics 12th International Conference on the Enhancement and Promotion of Computational Methods in Engineering and Science, Hong Kong, China, 30 November–3 December 2009; pp. 169–174. [Google Scholar]
  21. Yang, Y.; Hu, J.; Tan, Y.; Wang, K.; Shen, L. Pollutant Diffusion in an Infectious Disease Hospital with Different Thermal Conditions. Buildings 2024, 14, 1185. [Google Scholar] [CrossRef]
  22. Park, S.; Kario, K.; Chia, Y.C.; Turana, Y.; Chen, C.H.; Buranakitjaroen, P.; Nailes, J.; Hoshide, S.; Siddique, S.; Sison, J.; et al. The influence of the ambient temperature on blood pressure and how it will affect the epidemiology of hypertension in Asia. J. Clin. Hypertens. 2020, 22, 438–444. [Google Scholar] [CrossRef] [PubMed]
  23. Cao, Q.; Huang, H.; Hong, Y.; Huang, X.; Wang, S.; Wang, L.; Wang, L. Modeling intra-urban differences in thermal environments and heat stress based on local climate zones in central Wuhan. Build. Environ. 2022, 225, 109625. [Google Scholar] [CrossRef]
  24. Ding, L.; Zhao, W.; Huang, Y.; Cheng, S.; Liu, C. Research on the Coupling Coordination Relationship between Urbanization and the Air Environment: A Case Study of the Area of Wuhan. Atmosphere 2015, 6, 1539–1558. [Google Scholar] [CrossRef]
  25. Zhang, C.; Xu, S.; Qi, C.; Dai, R.; Mendis, T.; Wang, M. Comparison of Thermal Comfort in Different Subway Spaces in China’s Hot Summer and Cold Winter Region: A Field Investigation Based on Subway Station Transition. Buildings 2025, 15, 786. [Google Scholar] [CrossRef]
  26. Li, R.; Zhang, Y.; Li, W.; Xu, X. Identification Model of Traditional Village Cultural Landscape Elements and Its Application from the Perspective of Living Heritage—A Case Study of Chentian Village in Wuhan. Buildings 2024, 14, 3535. [Google Scholar] [CrossRef]
  27. Deng, X.; Cao, Q.; Wang, L.; Wang, W.; Wang, S.; Wang, L. Understanding the impact of urban expansion and lake shrinkage on summer climate and human thermal comfort in a land-water mosaic area. J. Geophys. Res. Atmos. 2022, 127, e2021JD036131. [Google Scholar] [CrossRef]
  28. Li, C.; Xu, K.; Yan, S.; Ji, Q.; Zhang, D.; Zhou, X. Assessment of the estimation methods of Tmrt in semi-outdoor spaces in humid sub-tropical climates: An empirical study in Wuhan, China. Build. Environ. 2024, 262, 111758. [Google Scholar] [CrossRef]
  29. Jiao, L.; Dong, T.; Xu, G.; Zhou, Z.; Liu, J.; Liu, Y. Geographic micro-process model: Understanding global urban expansion from a process-oriented view. Comput. Environ. Urban Syst. 2021, 87, 101603. [Google Scholar] [CrossRef]
  30. GB 50352-2019; Unified Standard for Design of Civil Buildings. Ministry of Housing and Urban-Rural Development of the People’s Republic of China: Beijing, China, 2019.
  31. Chen, B.; Xie, M.; Feng, Q.; Li, Z.; Chu, L.; Liu, Q. Heat risk of residents in different types of communities from urban heat-exposed areas. Sci. Total Environ. 2021, 768, 145052. [Google Scholar] [CrossRef]
  32. Liang, H.; Meng, Q.; Qi, Q.; Ren, P. Spatiotemporal interaction between urban heat island and urban-construction indicators on the block scale in autumn in a humid and hot climate. Sustain. Cities Soc. 2022, 78, 103638. [Google Scholar] [CrossRef]
  33. Song, X.; Wang, G.; Deng, Q.; Wang, S.; Jiao, C. The Influence of Residential Block Form on Summer Thermal Comfort of Street Canyons in the Warm Temperate Zone of China. Buildings 2023, 13, 1627. [Google Scholar] [CrossRef]
  34. Zhang, A.; Gao, C.; Zhang, L. Numerical simulation of the wind field around different building arrangements. J. Wind Eng. Ind. Aerodyn. 2005, 93, 891–904. [Google Scholar] [CrossRef]
  35. Oke, T.R. Boundary Layer Climates. Earth Sci. Rev. 1987, 27, 265. [Google Scholar]
  36. Mou, B.; He, B.J.; Zhao, D.X.; Chau, K.W. Numerical simulation of the effects of building dimensional variation on wind pressure distribution. Eng. Appl. Comput. Fluid Mech. 2017, 11, 293–309. [Google Scholar] [CrossRef]
  37. Oliveira, S.; Andrade, H.; Vaz, T. The cooling effect of green spaces as a contribution to the mitigation of urban heat: A case study in Lisbon. Build. Environ. 2011, 46, 2186–2194. [Google Scholar] [CrossRef]
  38. Shashua-Bar, L.; Hoffman, M. Vegetation as a climatic component in the design of an urban street: An empirical model for predicting the cooling effect of urban green areas with trees. Energy Build. 2000, 31, 221–235. [Google Scholar] [CrossRef]
  39. Lu, M.; Song, D.; Shi, D.; Liu, J.; Wang, L. Effect of High-Rise Residential Building Layout on the Spatial Vertical Wind Environment in Harbin, China. Buildings 2022, 12, 705. [Google Scholar] [CrossRef]
  40. Nugroho, N.Y.; Triyadi, S.; Wonorahardjo, S. Effect of high-rise buildings on the surrounding thermal environment. Build. Environ. 2022, 207, 108393. [Google Scholar] [CrossRef]
  41. Xie, Z.Y.; Zheng, N.; Wang, C.H. Study on Ecological Design of Layout of Air Yard of High-Rise Building. Appl. Mech. Mater. 2012, 174, 3106–3110. [Google Scholar] [CrossRef]
  42. Shang, J.; Zhong, H.Y.; Zhang, H.L.; Li, B.; Wang, X.X.; Zhao, F.Y.; Li, Y. Diode effects on street canyon ventilation in valley city: Temperature inversion and calm geostrophic wind. Build. Environ. 2023, 244, 110839. [Google Scholar] [CrossRef]
  43. Huang, W.; Tian, F.; Huang, T. Energy Performance-Oriented Multi-Objective Optimization of Spatial Form of High-Rise Residential Blocks in the Changsha Region. Buildings 2025, 15, 56. [Google Scholar] [CrossRef]
  44. Shi, F.; Chen, Y.; Yue, W.; Wang, Y. High-Rise Residential District Morphology Optimization for Enhancing the Green Space Cooling Effect. Buildings 2024, 14, 183. [Google Scholar] [CrossRef]
  45. Elnabawi, M.H.; Hamza, N. A Behavioural Analysis of Outdoor Thermal Comfort: A Comparative Analysis between Formal and Informal Shading Practices in Urban Sites. Sustainability 2020, 12, 9032. [Google Scholar] [CrossRef]
  46. Luo, C.; Hui, L.; Shang, Z.; Wang, C.; Jin, M.; Wang, X.; Li, N. Portable Arduino-Based Multi-Sensor Device (SBEDAD): Measuring the Built Environment in Street Cycling Spaces. Sensors 2024, 24, 3096. [Google Scholar] [CrossRef]
  47. Wang, T.; Chen, Y.; Wei, Z.; Chen, J.; Fang, J.; Dong, Z.; Zheng, L. Images of Architectural Landmarks Integrated into Spatial Vision Based on Urban Image Theory: A Case Study on the Wuhan Design Biennale Exhibition Space. Buildings 2025, 15, 530. [Google Scholar] [CrossRef]
  48. Cai, B.; Cheng, H.; Xiang, F.; Wang, H.; Kang, T. Modeling the Effects of Vegetation on Air Purification Through Computational Fluid Dynamics in Different Neighborhoods of Beijing. Buildings 2025, 15, 995. [Google Scholar] [CrossRef]
  49. Chen, J.; Zeng, J.; Huang, T.; Wang, Y.; Yang, H.; Yu, X.; Wang, Z. Impacts of Plant Configuration on the Outdoor Wind Comfort of Subtropical Coastal Campuses: Evidence from a Study of Quanzhou. Forests 2025, 16, 461. [Google Scholar] [CrossRef]
  50. Du, Z.; Guo, W.; Li, W.; Gao, X. A Study on the Optimization of Wind Environment of Existing Villa Buildings in Lingnan Area: A Case Study of Jiangmen’s “Yunshan Poetic” Moon Island Houses. Buildings 2022, 12, 1304. [Google Scholar] [CrossRef]
  51. Lin, K.; Zhan, Q.; Xue, W.; Shu, Y.; Lu, Y. Thermal Environmental Impact of Urban Development Scenarios from a Low Carbon Perspective: A Case Study of Wuhan. Buildings 2025, 15, 208. [Google Scholar] [CrossRef]
  52. Toja-Silva, F.; Kono, T.; Peralta, C.; Lopez-Garcia, O.; Chen, J. A review of computational fluid dynamics (CFD) simulations of the wind flow around buildings for urban wind energy exploitation. J. Wind Eng. Ind. Aerodyn. 2018, 180, 66–87. [Google Scholar] [CrossRef]
  53. Negi, A.; Emmanuel, R.; Aarrevaara, E. Planning for a Warmer Future: Heat Risk Assessment and Mitigation in Lahti, Finland. Atmosphere 2025, 16, 146. [Google Scholar] [CrossRef]
  54. Jiang, Y.; Sun, Y.; Liu, Y.; Li, X. Exploring the correlation between waterbodies, green space morphology, and carbon dioxide concentration distributions in an urban waterfront green space: A simulation study based on the carbon cycle. Sustain. Cities Soc. 2023, 98, 104831. [Google Scholar] [CrossRef]
  55. Elraouf, R.A.; ELMokadem, A.; Megahed, N.; Eleinen, O.A.; Eltarabily, S. Evaluating urban outdoor thermal comfort: A validation of ENVI-met simulation through field measurement. J. Build. Perform. Simul. 2022, 15, 268–286. [Google Scholar] [CrossRef]
  56. Crank, P.J.; Sailor, D.J.; Ban-Weiss, G.; Taleghani, M. Evaluating the ENVI-met microscale model for suitability in analysis of targeted urban heat mitigation strategies. Urban Clim. 2018, 26, 188–197. [Google Scholar] [CrossRef]
  57. Li, B.; Guo, W.; Schnabel, M.A.; Zhang, Z. Virtual Simulation of New Residential Buildings in Lingnan Using Vernacular Wisdom. In Proceedings of the eCAADe 2020: Anthropologic-Architecture and Fabrication in the Cognitive Age, Berlin, Germany, 16–17 September 2020. [Google Scholar]
  58. GB 50736-2012; Design Code for Heating, Ventilation and Air Conditioning of Civil Buildings. Ministry of Housing and Urban-Rural Development of the People’s Republic of China: Beijing, China; General Administration of Quality Supervision, Inspection and Quarantine of the People’s Republic of China: Beijing, China, 2012.
  59. Lai, B.; Fu, J.M.; Guo, C.K.; Zhang, D.Y.; Wu, Z.G. Street Geometry Factors Influencing Outdoor Pedestrian Thermal Comfort in a Historic District. Buildings 2025, 15, 613. [Google Scholar] [CrossRef]
  60. Stavrakakis, G.M.; Katsaprakakis, D.A.; Damasiotis, M. Basic Principles, Most Common Computational Tools, and Capabilities for Building Energy and Urban Microclimate Simulations. Energies 2021, 14, 6707. [Google Scholar] [CrossRef]
  61. Li, X.; Shi, W.; Liu, Y.; Zhang, N. Optimization Strategy for Thermal Comfort in Railway Stations above Ground Level in Beijing. Buildings 2024, 14, 2843. [Google Scholar] [CrossRef]
  62. Halder, N.; Kumar, M.; Deepak, A.; Mandal, S.K.; Azmeer, A.; Mir, B.A.; Nurdiawati, A.; Al-Ghamdi, S.G. The Role of Urban Greenery in Enhancing Thermal Comfort: Systematic Review Insights. Sustainability 2025, 17, 2545. [Google Scholar] [CrossRef]
  63. Mei, S.J.; Luo, Z.; Zhao, F.Y.; Wang, H.Q. Street canyon ventilation and airborne pollutant dispersion: 2-D versus 3-D CFD simulations. Sustain. Cities Soc. 2019, 50, 101700. [Google Scholar] [CrossRef]
  64. Nicholls-Clow, R.; Simmonds-Buckley, M.; Waller, G. Avoidant/restrictive food intake disorder: Systematic review and meta-analysis demonstrating the impact of study quality on prevalence rates. Clin. Psychol. Rev. 2024, 114, 102502. [Google Scholar] [CrossRef]
  65. Zhong, H.Y.; Jing, Y.; Liu, Y.; Zhao, F.Y.; Liu, D.; Li, Y. CFD simulation of “pumping” flow mechanism of an urban building affected by an upstream building in high Reynolds flows. Energy Build. 2019, 202, 109330. [Google Scholar] [CrossRef]
  66. Yang, Y.; Wang, X.; Luo, S.; Wang, Y.; Wen, X.; Ni, N.; Wang, L.; Jiang, W.; Cai, J.; Xu, G.; et al. Study on the Impact of Courtyard Proportions in Kunming’s Vernacular One-Seal Dwellings (Yikeyin) on Architectural Climatic Adaptability. Sustainability 2025, 17, 3066. [Google Scholar] [CrossRef]
  67. Chudzik, M.; Williams, K.; Shields, A.; Nagesh, S.V.S.; Paccione, E.; Bednarek, D.R.; Rudin, S.; Ionita, C.N. Semi-automatic Co-Registration of 3D CFD Vascular Geometry to 1000 FPS High-Speed Angiographic (HSA) Projection Images for Flow Determination Comparisons. In Proceedings of the Medical Imaging 2022: Biomedical Applications In Molecular, Structural, and Functional Imaging, San Diego, CA, USA, 20–22 February 2022. [Google Scholar]
  68. Sunagawa, M.; Ichi Shikii, S.; Beck, A.; Kek, K.J.; Yoshioka, M. Analysis of the effect of thermal comfort on driver drowsiness progress with Predicted Mean Vote: An experiment using real highway driving conditions. Transp. Res. Part F Traffic Psychol. Behav. 2023, 94, 517–527. [Google Scholar] [CrossRef]
  69. Elshater, A.; Abusaada, H.; Alfiky, A.; El-Bardisy, N.; Elmarakby, E.; Grant, S. Workers’ Satisfaction vis-à-vis Environmental and Socio-Morphological Aspects for Sustainability and Decent Work. Sustainability 2022, 14, 1699. [Google Scholar] [CrossRef]
  70. Potchter, O.; Cohen, P.; Lin, T.P.; Matzarakis, A. Outdoor human thermal perception in various climates: A comprehensive review of approaches, methods and quantification. Sci. Total Environ. 2018, 631–632, 390–406. [Google Scholar] [CrossRef]
  71. Gao, C.Y.; Niu, J.G.; Gao, Q.C. The Application of Origin Software in the Data Processing of Rock Creep Experiment. Appl. Mech. Mater. 2014, 580–583, 509–513. [Google Scholar] [CrossRef]
  72. Yang, S.; Wang, L.L.; Stathopoulos, T.; Marey, A.M. Urban microclimate and its impact on built environment—A review. Build. Environ. 2023, 238, 110334. [Google Scholar] [CrossRef]
  73. Oke, T.R. The energetic basis of the urban heat island. Q. J. R. Meteorol. Soc. 1982, 108, 1–24. [Google Scholar] [CrossRef]
Figure 1. The locations of the 18 communities in this study are distributed within 4 km of Zhongnan hospital, and the image is captured from Amap, https://earth.google.com/web/, accessed on 27 March 2025.
Buildings 15 02210 g001
Figure 2. The structure of six multi-story communities; images are captured from Google Maps, data source: https://earth.google.com/web/, accessed on 27 March 2025.
Buildings 15 02210 g002
Figure 3. The Zhangjiawan community, showing the detailed structure of multi-story communities.
Buildings 15 02210 g003
Figure 4. The structure of six mid-rise communities; images are captured from Google Maps. Data source: https://earth.google.com/web/, accessed on 27 March 2025.
Buildings 15 02210 g004
Figure 5. The Meiyuan community, showing the detailed structure of mid-rise communities.
Buildings 15 02210 g005
Figure 6. The structure of six high-rise communities, and images are captured from Google Maps. Data source: https://earth.google.com/web/, accessed on 27 March 2025.
Buildings 15 02210 g006
Figure 7. The Shanglong community, showing the detailed structure of high-rise communities.
Buildings 15 02210 g007
Figure 8. Physical model used for CFD simulation, a case of Oriole Community.
Buildings 15 02210 g008
Figure 9. Eight field measurement sites in the Fudi International Community; the image is captured from Amap. Data source: https://earth.google.com/web/, accessed on 27 March 2025.
Buildings 15 02210 g009
Figure 10. Comparison of Phoenics and ENVI-met simulation results.
Buildings 15 02210 g010
Figure 11. Correlation between PHOENICS simulation results and field measurement data, and comparison between ENVI-met simulation results and field measurements.
Buildings 15 02210 g011
Figure 12. CFD simulation results of multi-story communities by Phoenics. (ac) Simulation image for plan of Chagang, Zhangjiawan, and Zhongke communities; (df) Simulation image for section of Chagang, Zhangjiawan, and Zhongke communities; (gi,mo,su): Corresponding simulation image for plan of the three communities; (jl,pr,vx): Corresponding simulation image for section of the three communities.
Buildings 15 02210 g012
Figure 13. CFD simulation results of mid-rise communities by Phoenics. (ac) Simulation image for plan of Oriole, Yingte, and Central Garden communities; (df) Simulation image for section of Oriole, Yingte, and Central Garden communities; (gi,mo,su): Corresponding simulation image for plan of the three communities; (jl,pr,vx): Corresponding simulation image for section of the three communities.
Buildings 15 02210 g013
Figure 14. CFD simulation results of high-rise communities by Phoenics. (ac) Simulation image for plan of Shanglong, Shuian, and Fudi International communities; (df) Simulation image for section of Shanglong, Shuian, and Fudi International communities; (gi,mo,su): Corresponding simulation image for plan of the three communities; (jl,pr,vx): Corresponding simulation image for section of the three communities.
Buildings 15 02210 g014
Figure 15. Correlation between microclimates (such as wind speed, temperature, PMV, and UTCI) and MAPC in multi-story communities.
Buildings 15 02210 g015
Figure 16. The annual variation in microclimatic factors (such as wind speed, temperature, PMV, and UTCI) and hypertension clinic visits in two typical multi-story residential communities.
Buildings 15 02210 g016
Figure 17. Correlation between microclimates (such as wind speed, temperature, PMV, and UTCI) and MAPC in mid-rise communities.
Buildings 15 02210 g017
Figure 18. The annual variation in microclimatic factors (such as wind speed, temperature, PMV, and UTCI) and hypertension clinic visits in two typical mid-rise residential communities.
Buildings 15 02210 g018
Figure 19. Correlation between microclimates (such as wind speed, temperature, PMV, and UTCI) and MAPC in high-rise communities.
Buildings 15 02210 g019
Figure 20. The annual variation in microclimatic factors (such as wind speed, temperature, PMV, and UTCI) and hypertension clinic visits in two typical high-rise residential communities.
Buildings 15 02210 g020
Table 1. Initial thermal environment parameters, obtained from the China Meteorological Administration website (https://data.cma.cn/ (accessed on 16 March 2025)).
MonthVelocityDirectionPressureTemp.Rel HumidityDirect Rad.Diffuse Rad.Daylight Hours
(m/s)(degrees)(Pa)(°C)(percent)(W/sq.m)(W/sq.m)(h)
Jan.1.48145123,0264.1286.0012.7411.853.03
Feb.1.45142102,1788.6380.8211.3712.595.98
Mar.1.66165101,53513.0078.7113.8410.557.25
Apr.1.49154101,56016.8170.5311.3514.458.52
May1.38153100,54623.1376.6416.339.345.01
Jun.1.32155100,11926.4885.5214.849.962.94
Jul.1.40149100,16126.4388.2425.067.382.00
Aug.1.60179100,20230.0275.7115.0814.387.76
Sep.0.99137100,97522.9385.2013.1213.773.21
Oct.1.15152101,79216.7585.1214.7912.583.18
Nov.1.38114102,15912.5081.8418.5412.553.77
Dec.1.2991102,5894.8576.5213.8812.702.89
Table 2. Materials used for each object.
MethodExterior WallLawnUnderlying
Surface
TreesLake and RiverRoad
PhoenicsBrick at 20 °CFoliageSoilWood and FoliageWater at 20 °CAsphalt
ENVI-metBrickWall (reinforced)Grass 25 cmSandy SoilDutch Elm (middle)Water at 20 °CAsphalt
Table 3. Physical parameterization.
AgeGenderWeightHeightWalking SpeedSurface AreaStatic Insulation Outdoor
35 yMale75.00 kg1.75 m2 km/h1.91 m20.6/0.8/1.0 clo
Table 4. UT-363 handheld high-accuracy anemometer.
Model NumberWind Speed MeasurementTemperature MeasurementWind RatingSampling Rate
UT-3630–30 m/s ± (5% + 0.5)−10–50 °C ± (2 °C)Level 0–12 (±1)500 ms
Disclaimer/Publisher’s Note: The statements, opinions and data contained in all publications are solely those of the individual author(s) and contributor(s) and not of MDPI and/or the editor(s). MDPI and/or the editor(s) disclaim responsibility for any injury to people or property resulting from any ideas, methods, instructions or products referred to in the content.

