1. Introduction
With the rapid development of industrialization and the continuous improvement of science and technology, the global energy demand is also synchronized with the continuous growth. Meanwhile, facing the increasingly severe global climate change, the effective development of renewable energy has become more and more critical to sustainable development [
1,
2]. And the extensive application of renewable energy is also crucial to the decarbonization of the city [
3,
4].
In response to the existing energy crisis and continued environmental degradation, it has become increasingly critical to adopt efficient methods of utilizing renewable energy. Renewable energy is a green, low-carbon energy source that is of great significance for improving the energy structure and realizing sustainable economic and social development. Therefore, realizing the wide application of renewable energy is the key to urban decarbonization [
5].
According to statistics, the energy consumption generated by buildings accounts for about 40% of the total global energy consumption [
6]. Moreover, the proportion of the global population living in cities is increasing and is now more than 55% [
7], and the process of global urbanization will continue. The energy demand of cities is rising, and energy consumption is also increasing [
8,
9,
10]. Therefore, it is important to prioritize the widespread application of renewable energy in urban areas, considering that buildings in urban areas are often densely distributed and the use of renewable energy sources such as wind, water, and nuclear energy is limited by various conditions, which makes it difficult to realize the large-scale use of renewable energy sources such as wind, water, and nuclear energy in urban areas. The use of solar photovoltaic (PV) power generation has many advantages, such as convenient installation location, shorter construction period, and more flexible installation scale [
11,
12], which is more suitable for countries and regions with high urban population density. Therefore, in order to alleviate the problem of energy consumption in urban areas, large-scale development of solar energy is one of the more effective solutions for the development and utilization of renewable energy in urban areas [
13]. According to the regional solar energy potential and power demand characteristics, the development of a suitable arrangement and planning of solar photovoltaic systems can maximize the advantages of solar power generation, improve the efficiency of energy use, and promote sustainable development.
According to the relevant research on the application of renewable energy, urban areas usually have higher solar energy potential [
14], but most of the areas have not yet effectively utilized solar energy [
15,
16]; therefore, to realize the integration of urban rooftop solar photovoltaic (PV) and to scientifically plan for the development and utilization of solar energy is one of the effective ways to alleviate the large amount of energy demand of the city [
17,
18,
19,
20,
21]. The development of solar photovoltaic new energy products can effectively alleviate the problem of “environmental degradation” on the one hand [
22] and alleviate the problem of power shortage on the other hand [
23]. Accurately assessing the usable area of building roofs and their solar energy potential is the basis for promoting the development of urban rooftop photovoltaic integration [
24], which is of great significance for the construction of sustainable urban energy systems. On this basis, PV system planning and capacity allocation in combination with regional power load characteristics will become a key technical path to promote urban PV applications on a large scale.
Currently, a series of studies have been carried out by related scholars on the assessment of rooftop PV potential. Most of the traditional methods for estimating the roof area of buildings are based on information such as the height and area of buildings [
25], and the data of these relevant buildings are generated based on LiDAR. These studies have utilized LiDAR technology along with GIS data in order to obtain a three-dimensional model of the city [
25,
26] and to obtain the urban PV utilization potential using radiation simulation methods. Lukac et al. [
27] proposed a novel method for assessing urban rooftop solar potential, which integrates urban topographic information extracted from LiDAR data and measured global diffuse solar irradiance and analyzes the key influencing factors extensively, and the experimental validation shows that the method is highly consistent with the measured data from actual PV plants, with a correlation of 97%. Julieta et al. [
28] systematically assessed the available roof area for PV systems in the Spanish region based on the total roof area and the urban type utilization factor and further quantified the exploitation potential of solar resources in Spain through a land use classification method. Although a high accuracy can be obtained by using this type of method, the cost of modeling and data collection is high, and the scope of application is small, making it unsuitable for use in larger cities.
With the rapid development of deep learning applications and the extensive use of open-source satellite imagery in recent years, with the enrichment of map datasets and geographic information systems (GIS), emerging deep learning-based image semantic segmentation methods have achieved more satisfactory results in the identification of building rooftops and rooftop photovoltaic panel recognition [
29,
30,
31].
Ren et al. [
32] integrated a 3D-Geographic Information System (3D-GIS) and proposed a new deep learning method that integrates the effects of building shading effects and rooftop obstacles on the roof’s available area to improve the accuracy of regional solar PV potential estimation. Ni et al. [
33] proposed a method that utilizes deep learning and Geographic Information System (GIS) to accurately measure the city-scale solar potential, which takes into account the effects of shadows and obstacles to improve the accuracy of renewable energy development. Li et al. [
34] proposed a new framework for improving the accuracy of rooftop solar potential estimation, which framework enables rooftop solar estimation in large-scale applications to investigate the correlation between urban rooftop solar potential and various local climate zone types. Zhong et al. [
35] proposed a method to automatically extract roof areas based on deep learning, and the results showed that the overall accuracy of the extracted roof areas in Nanjing reached 92%. Huang et al. [
36] identified building roofs by inputting a large number of satellite images into a U-Net model to further estimate the solar energy potential of the city and mapped the potential of the city’s solar photovoltaic utilization. The error of this method in identifying the density of Wuhan city is only 2.96%.
The above studies have mainly focused on improving the accuracy of identifying the available roof area and have achieved remarkable results in solar potential assessment. However, the existing research is still insufficient in comprehensively considering the impacts of factors such as regional solar potential, electricity demand characteristics, and related policies on PV applications. Several studies have focused on analyzing the feasibility of regional PV development and planning by combining regional PV potential with related factors such as electricity demand. Mainzer et al. [
37] quantify the technical potential of residential rooftop PV in Germany based on GIS spatial analysis and discuss grid optimization strategies. Liu et al. [
38] provide policy recommendations for the deployment of rooftop PV in different cities of Shaanxi Province based on the dimensions of power generation, economic benefits, and carbon reduction potential. Kaleshwarwar et al. [
39] integrated solar PV systems into the urban environments with different building densities in Indian cities and evaluated the solar energy potential using gridding methods and simulations. The results of the study demonstrate the financial viability and environmental benefits of adopting PV in urban areas, providing crucial insights for sustainable energy planning and policy development.
In actual engineering applications, the spatial and temporal heterogeneity of regional electricity loads and the structural variability of building roofs jointly constrain the installation capacity and layout optimization of PV modules. In addition, in order to optimize the installation and maintenance requirements, the necessary spacing between PV arrays should be reserved. Without comprehensive consideration of regional load characteristics and actual installation conditions, the potential for regional PV power generation will be systematically overestimated.
In summary, the existing research failed to adequately consider the actual installation constraints of PV systems (such as roof structural heterogeneity, obstacle shading, and installation spacing requirements), and on the other hand, it lacked the integration of the spatial distribution characteristics of the building in the region and the characteristics of the electricity load into the PV planning model. As a result, there is a large deviation between the PV potential assessment results and the actual engineering practice.
Based on the existing research, this paper proposes a solar potential assessment method that combines the actual PV planning needs of the region based on the deep learning method, systematically analyzes the spatial distribution characteristics of the regional PV power generation through the multi-dimensional building classification and the construction of the solar potential assessment model, develops the differentiated planning scheme for different functional subdivisions, and realizes the efficient allocation and optimal use of solar energy resources. The second part carries out the theoretical analysis and constructs the deep learning model based on satellite images and the evaluation criteria for assessing the prediction accuracy. The third part introduces the basic building types of the research area and the characteristics of the regional solar radiation distribution and also summarizes the calculation methodology process of solar PV potential. The fourth part summarizes the prediction results of the deep learning model and the results of the solar PV potential analysis to assess the potential of regional solar PV applications. To achieve efficient allocation and optimal utilization of solar energy resources.
2. Methods
2.1. Deep Learning Model Applications
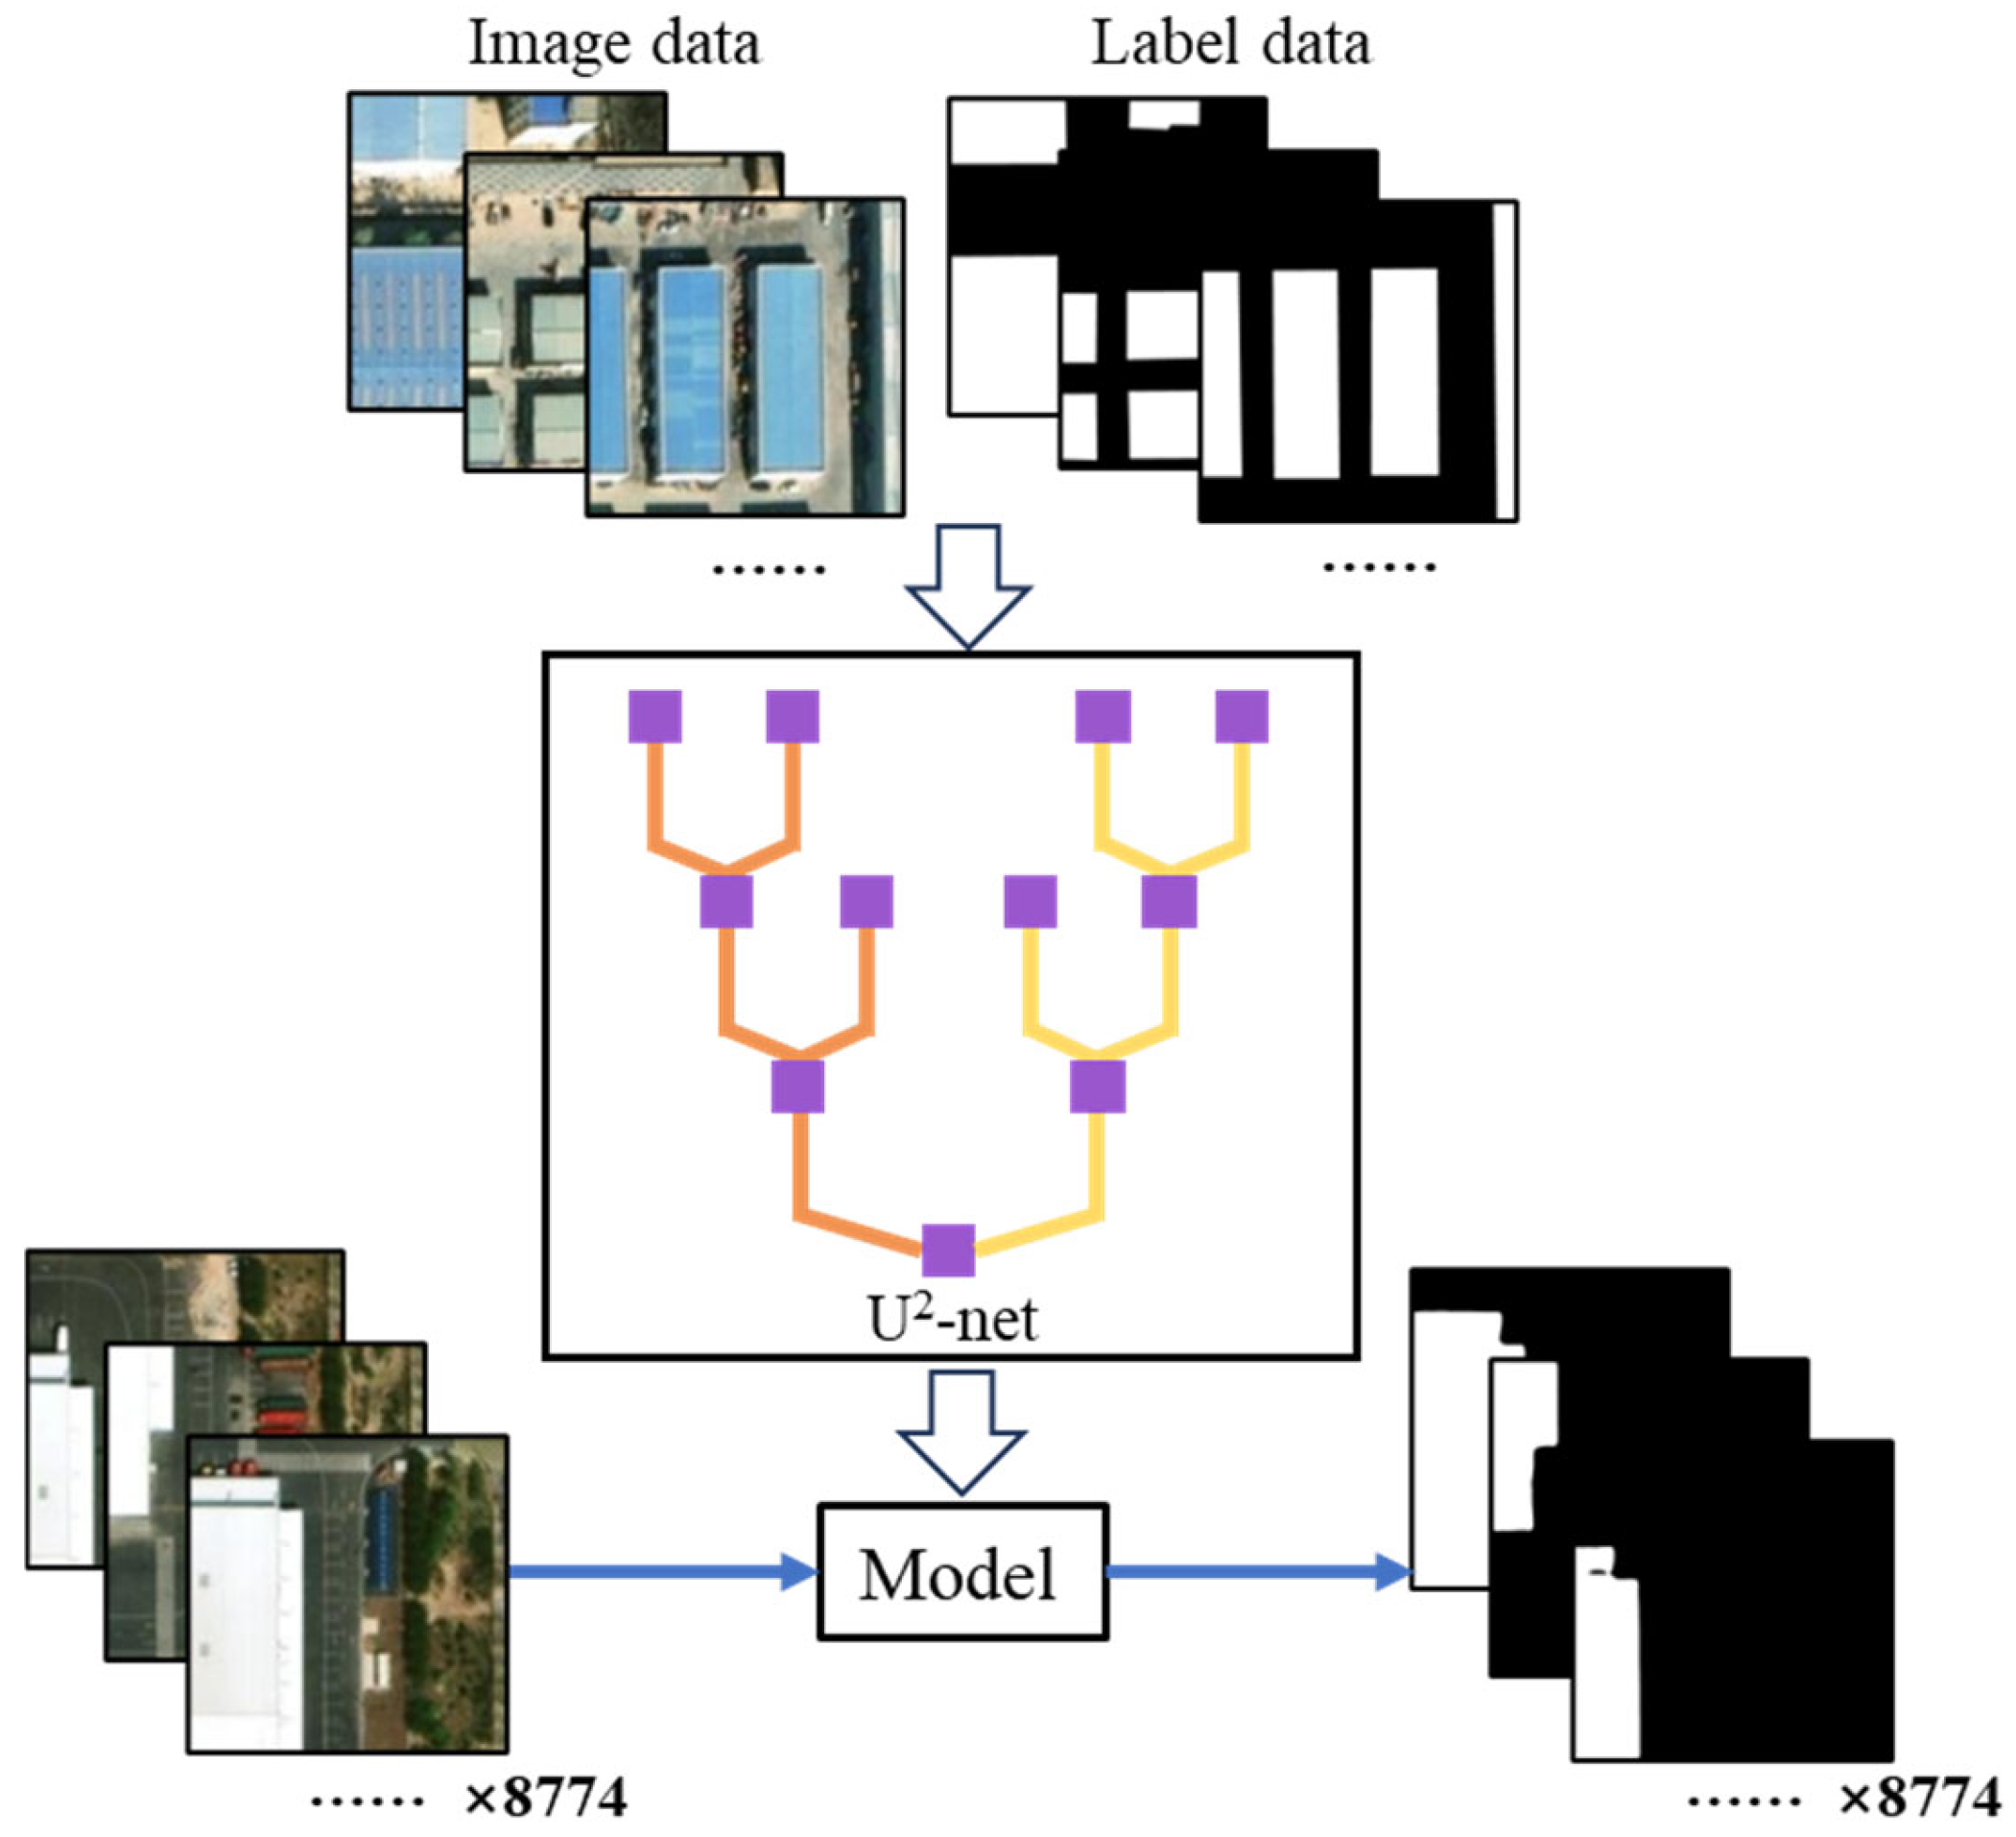
This paper employs the U2-Net (U Square Net), a lightweight and efficient deep learning model specifically designed for salient object detection tasks [
40,
41].
This deep learning model adopts a two-layer U-shaped structure. The U2-Net model mainly consists of three components: (1) A six-stage encoder, where input data are primarily downsampled through this architecture. (2) A five-stage decoder, where input data are primarily upsampled through this architecture. (3) A saliency map fusion module connected to the decoder layer and the final encoder stage, which generates the final predicted probability map through convolutional layers and activation functions.
The model is explained in
Figure 1. In this paper, the input of the model is mainly satellite images, and the output is a high-resolution saliency map to highlight the main objects in the image, which in this paper refers to the roof area.
The relevant parameters for model training are shown in
Table 1, mainly including learning rate, epoch, and batch size.
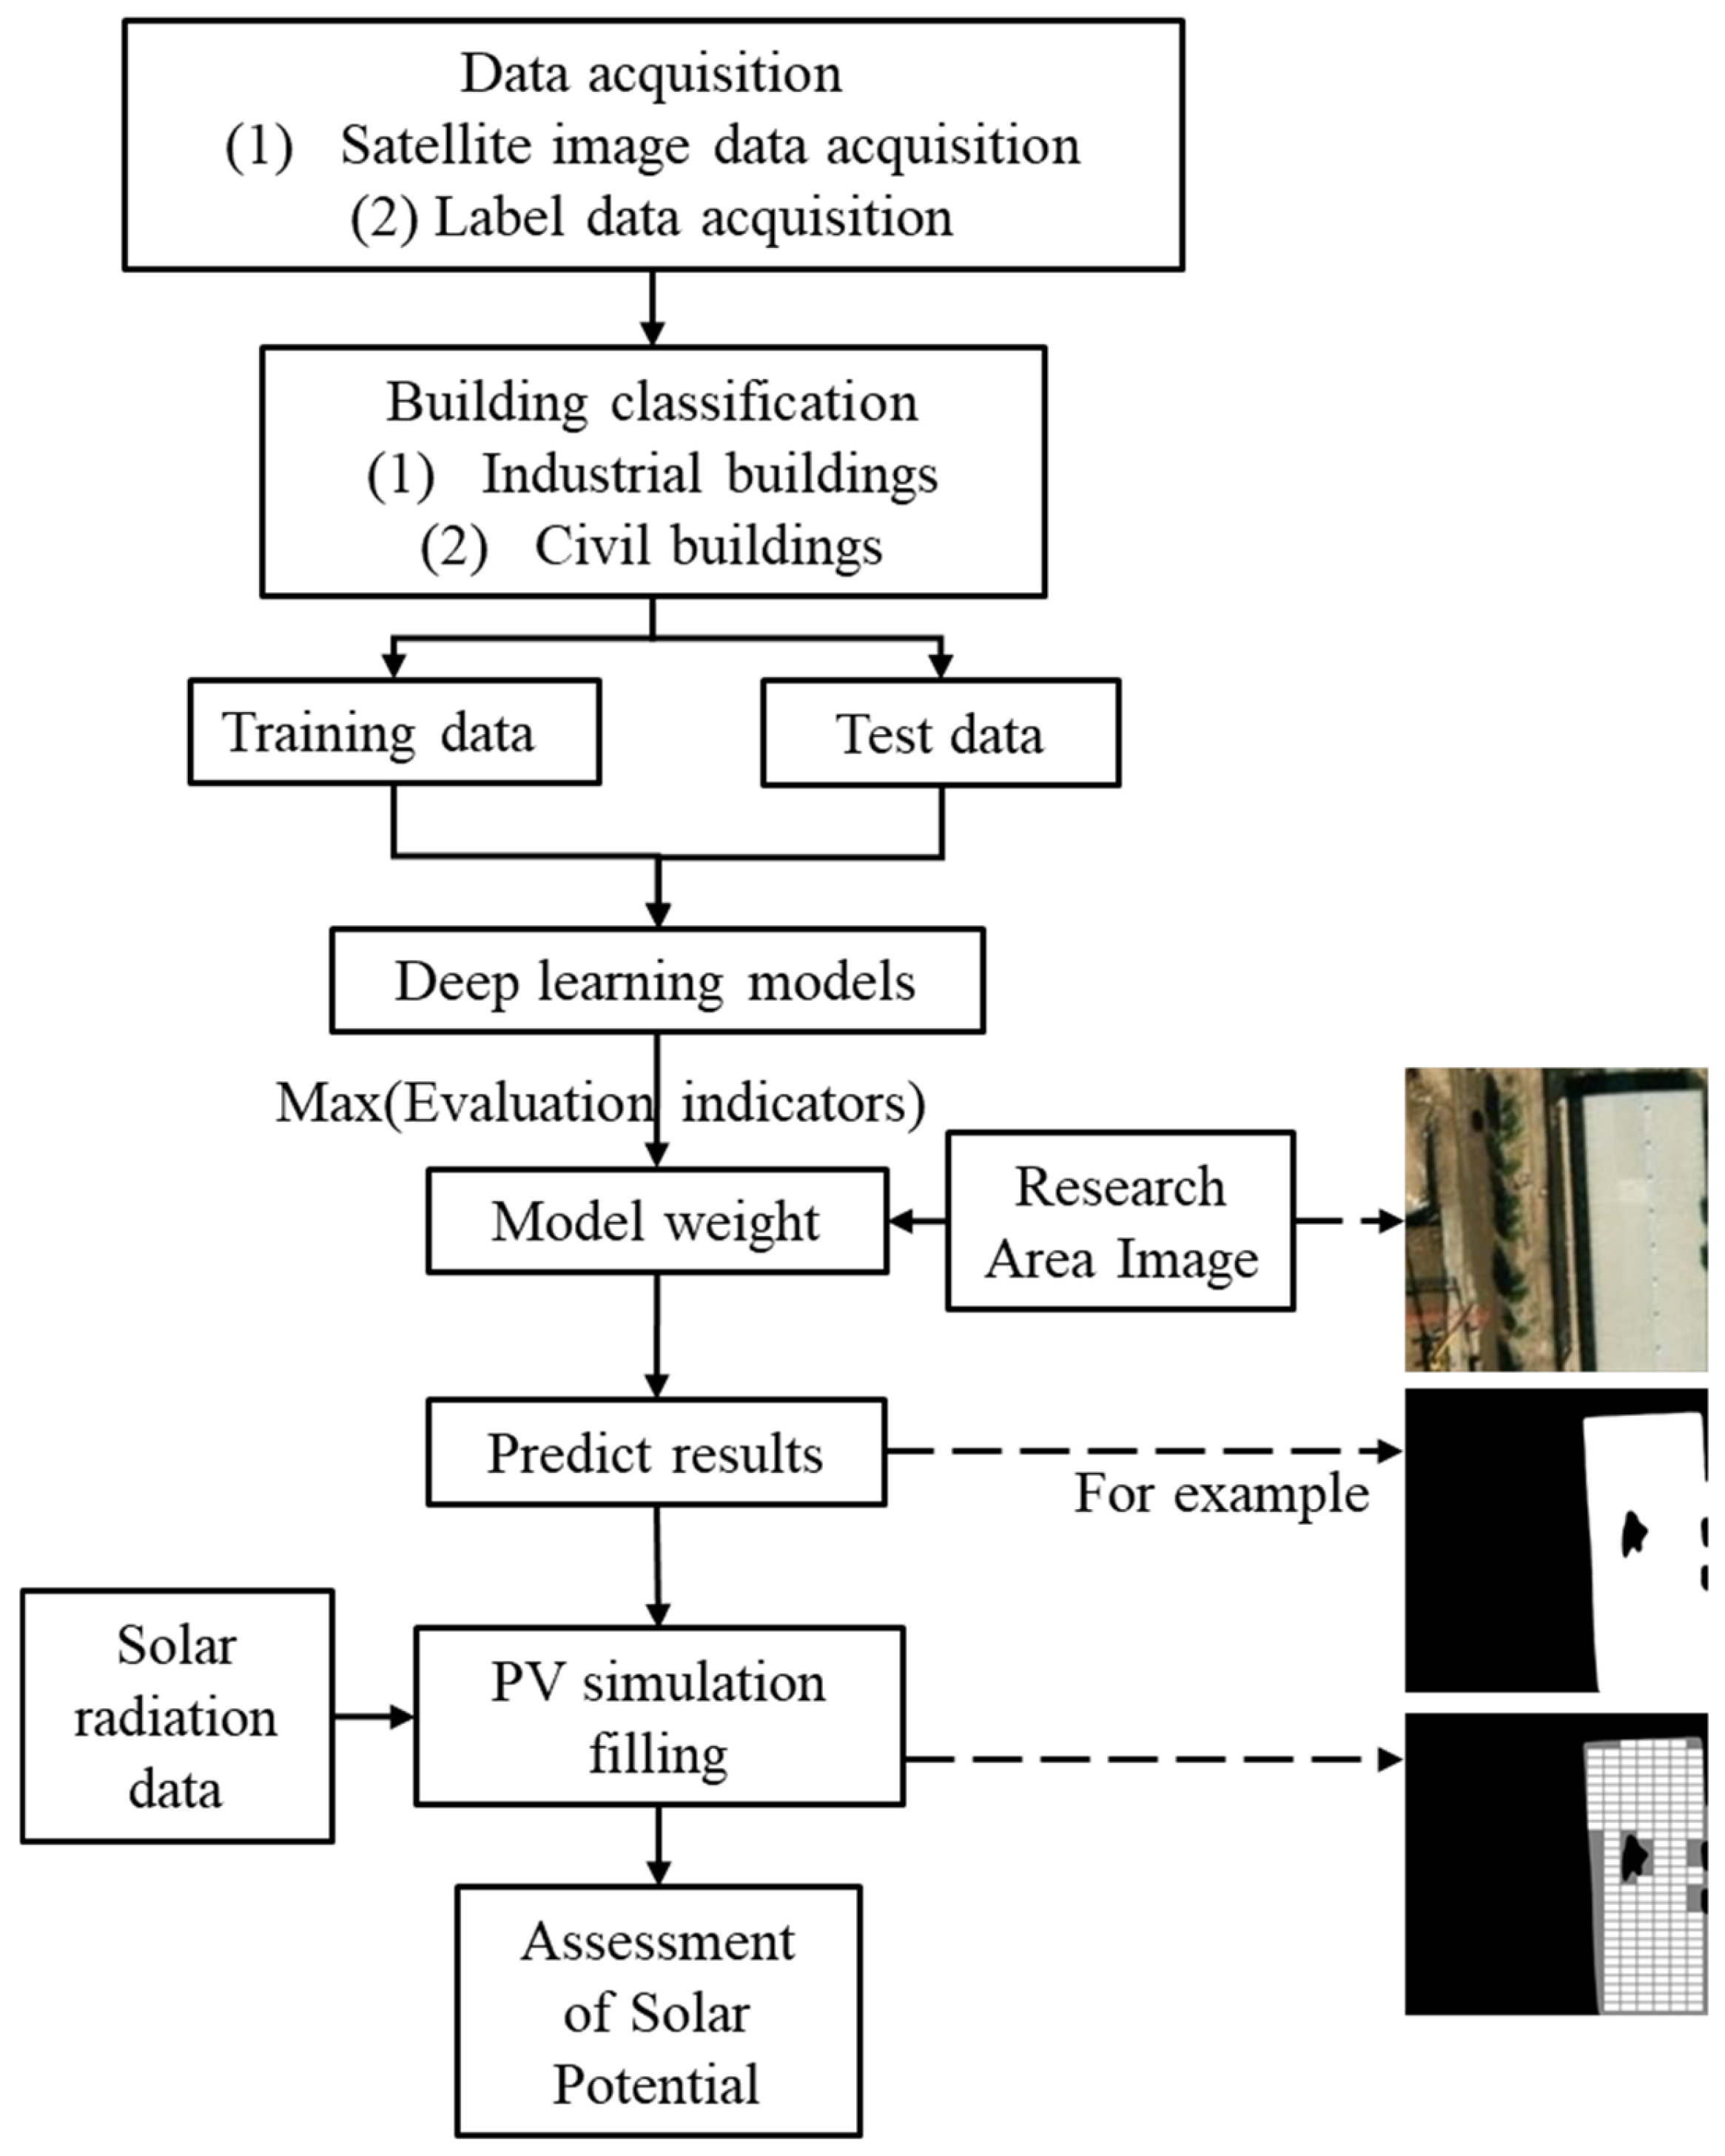
In this paper, the main purpose is to identify the roof area in the satellite image through the image identification method based on deep learning and calculate the identified area of the roof, synchronously calculate the area of the area where the simulated photovoltaic panels can be installed, and finally, combine with the intensity of the regional solar radiation to calculate the solar photovoltaic potential of the study area so that it can be used to guide the planning of the utilization of urban solar energy resources. The flow of the research route of this paper is shown in
Figure 2. The process mainly includes data acquisition, model training, PV simulation filling, and solar potential assessment.
(1) Data acquisition. It mainly includes land type vector data acquisition, satellite image acquisition, and labeling data acquisition. Since the roof of industrial buildings tends to have a simpler structure, the roof profile is mostly distributed in a rectangular shape, and the area is usually larger, and the structure of civil buildings is more complex, and the roof profile is mostly distributed in irregular polygons, the satellite image data are simply categorized into industrial buildings and civil buildings before training using the deep learning model. The land type vector data of Lanzhou New District is obtained through the open-source data website for building classification. The original satellite images are from ESRI satellite image maps, and the satellite maps are gridded and exported through QGIS software (Version number is 3.26.). Labeling data (including two types of labels: “roof” and “background”) are produced by LabelMe.
(2) Model training. Classify the buildings according to the land use type, divided into industrial buildings and civil buildings; divide the exported satellite map and corresponding labeled images into a training set and a test set according to the scale used for deep learning model training; and judge the results of model training according to the evaluation indexes; keep the optimal model training weights, and record the training results.
(3) PV simulation filling. Using the OpenCV-based method, the roof area results of the identified study area are filled with PV panel simulation, and the maximum area of the simulated roof to be covered with PV panels is calculated.
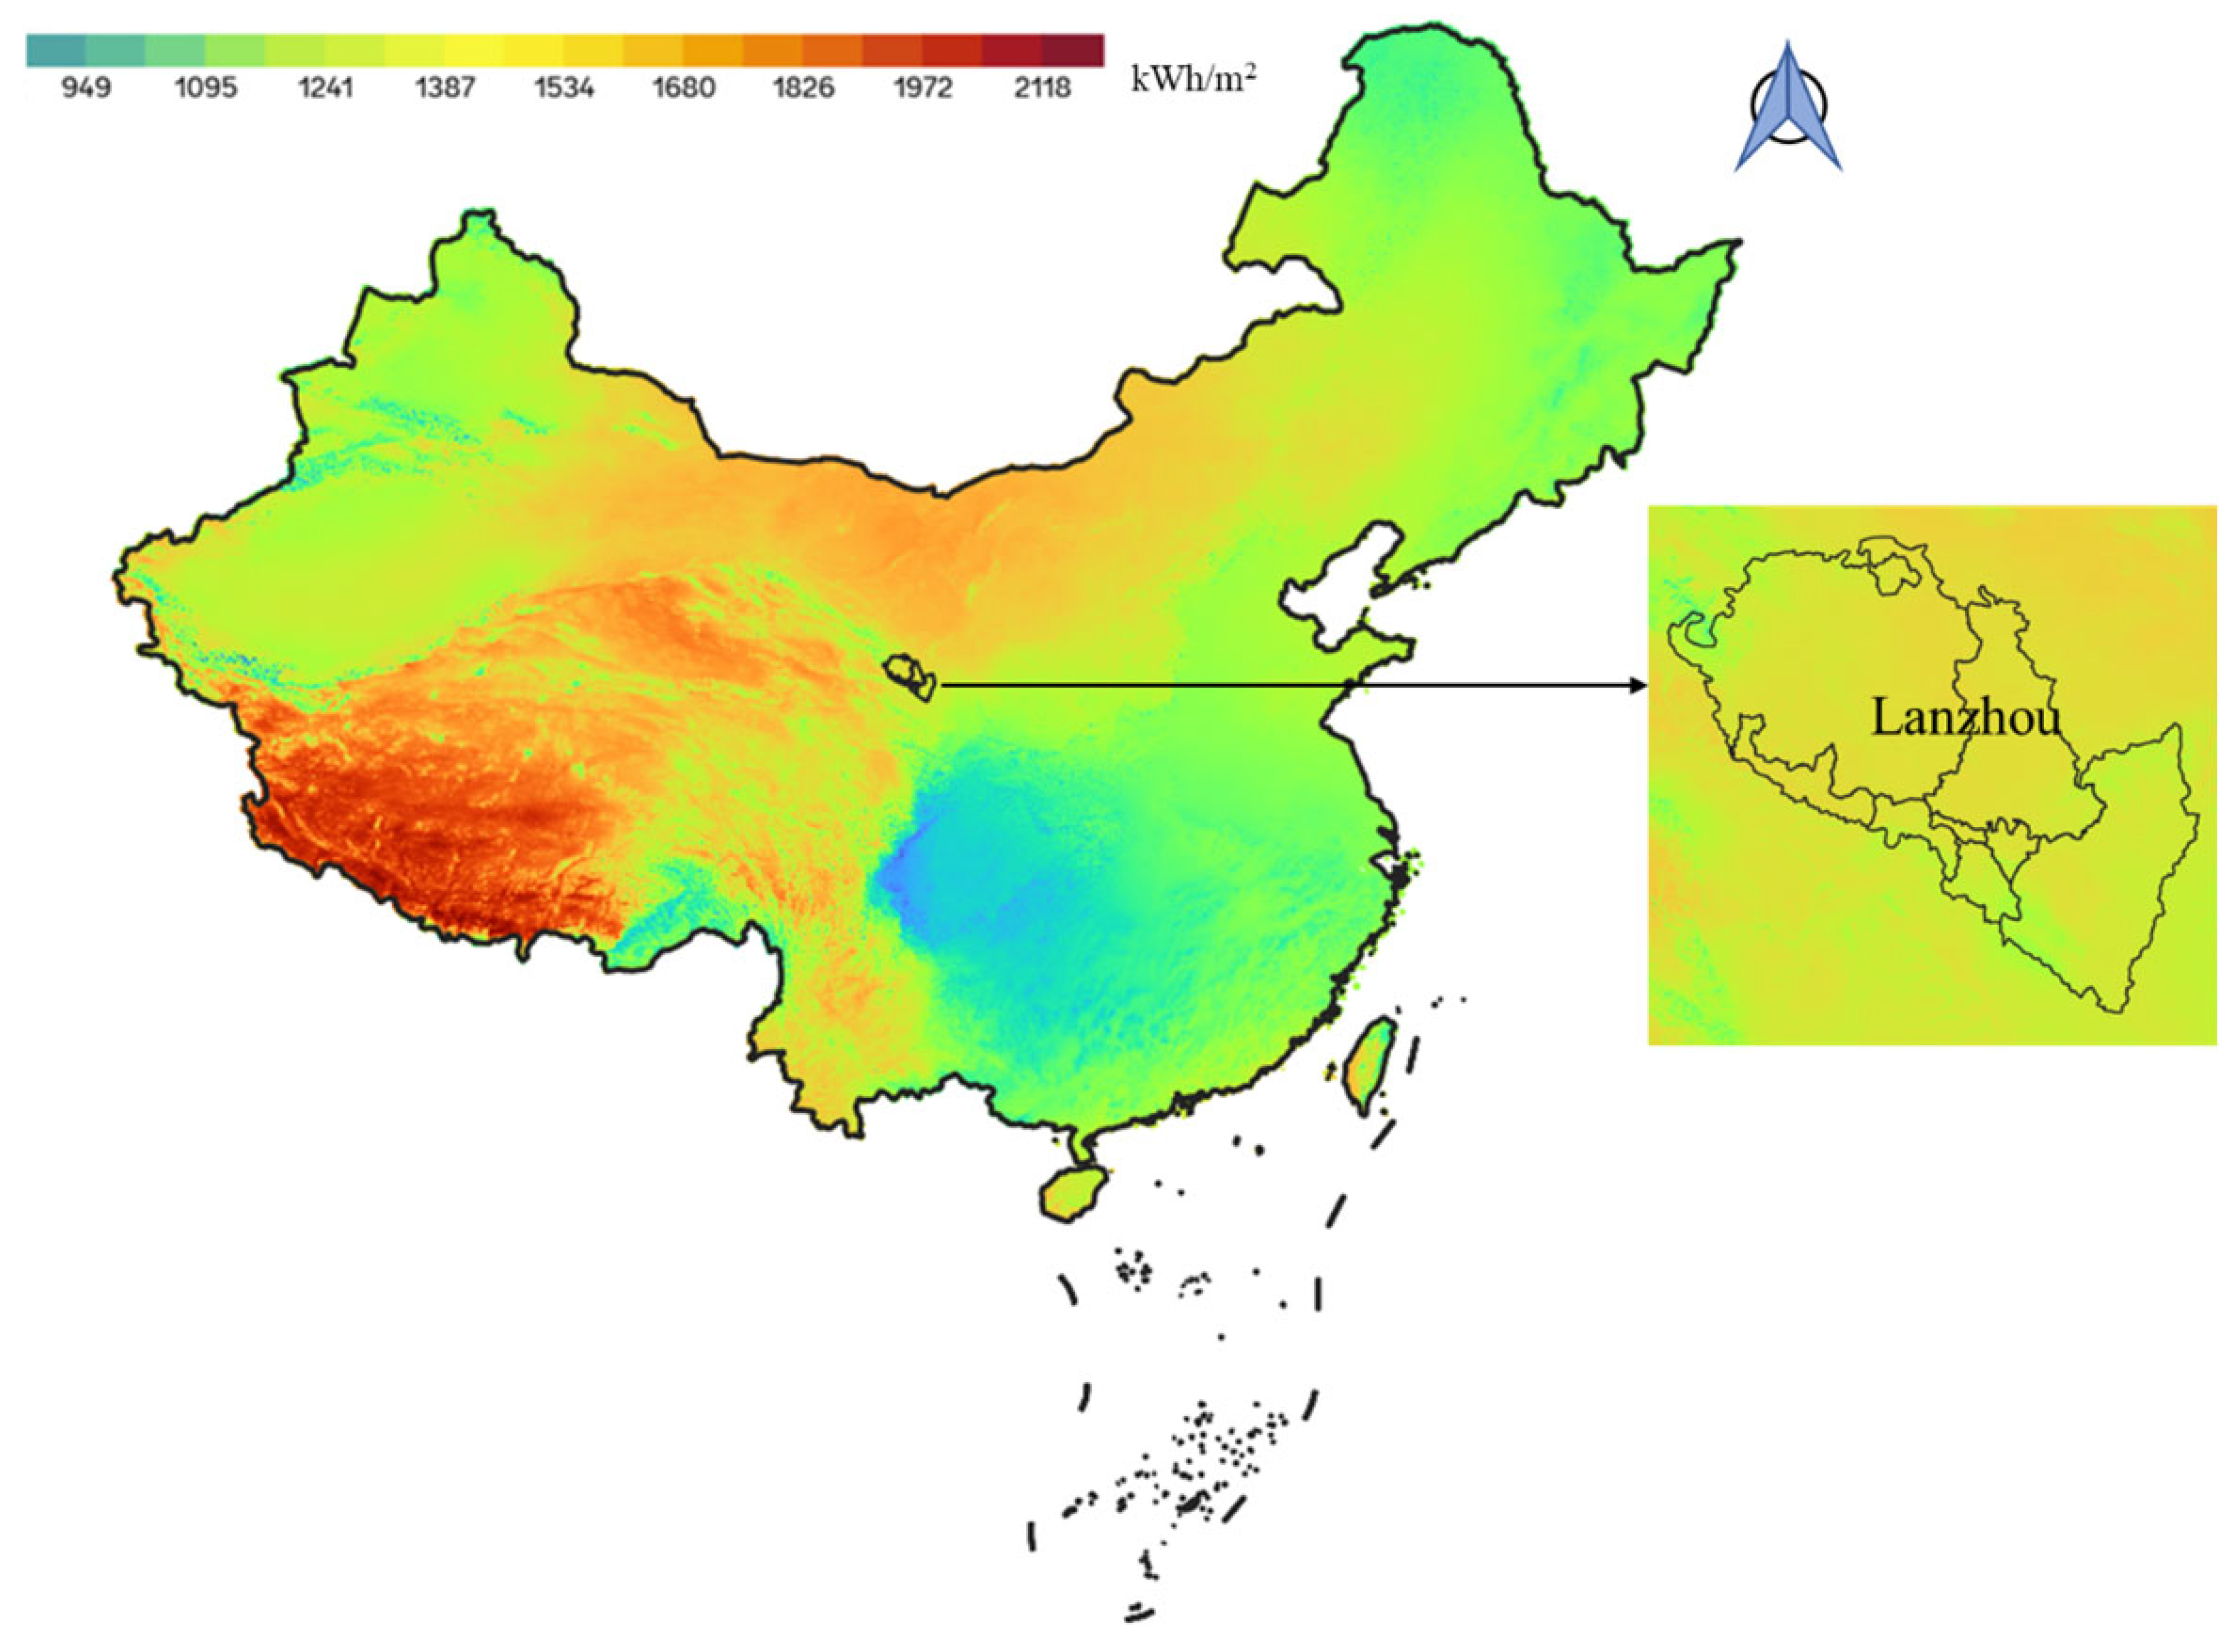
(4) Solar potential assessment. The rooftop solar PV potential of the research area is calculated by combining the calculated roof area of the research area and the local solar radiation data, which is taken from an open-source website (Global Solar Atlas). The regional solar PV potential is also visualized and analyzed in conjunction with regional electricity consumption historical data to guide regional solar PV application planning.
2.2. Data Description
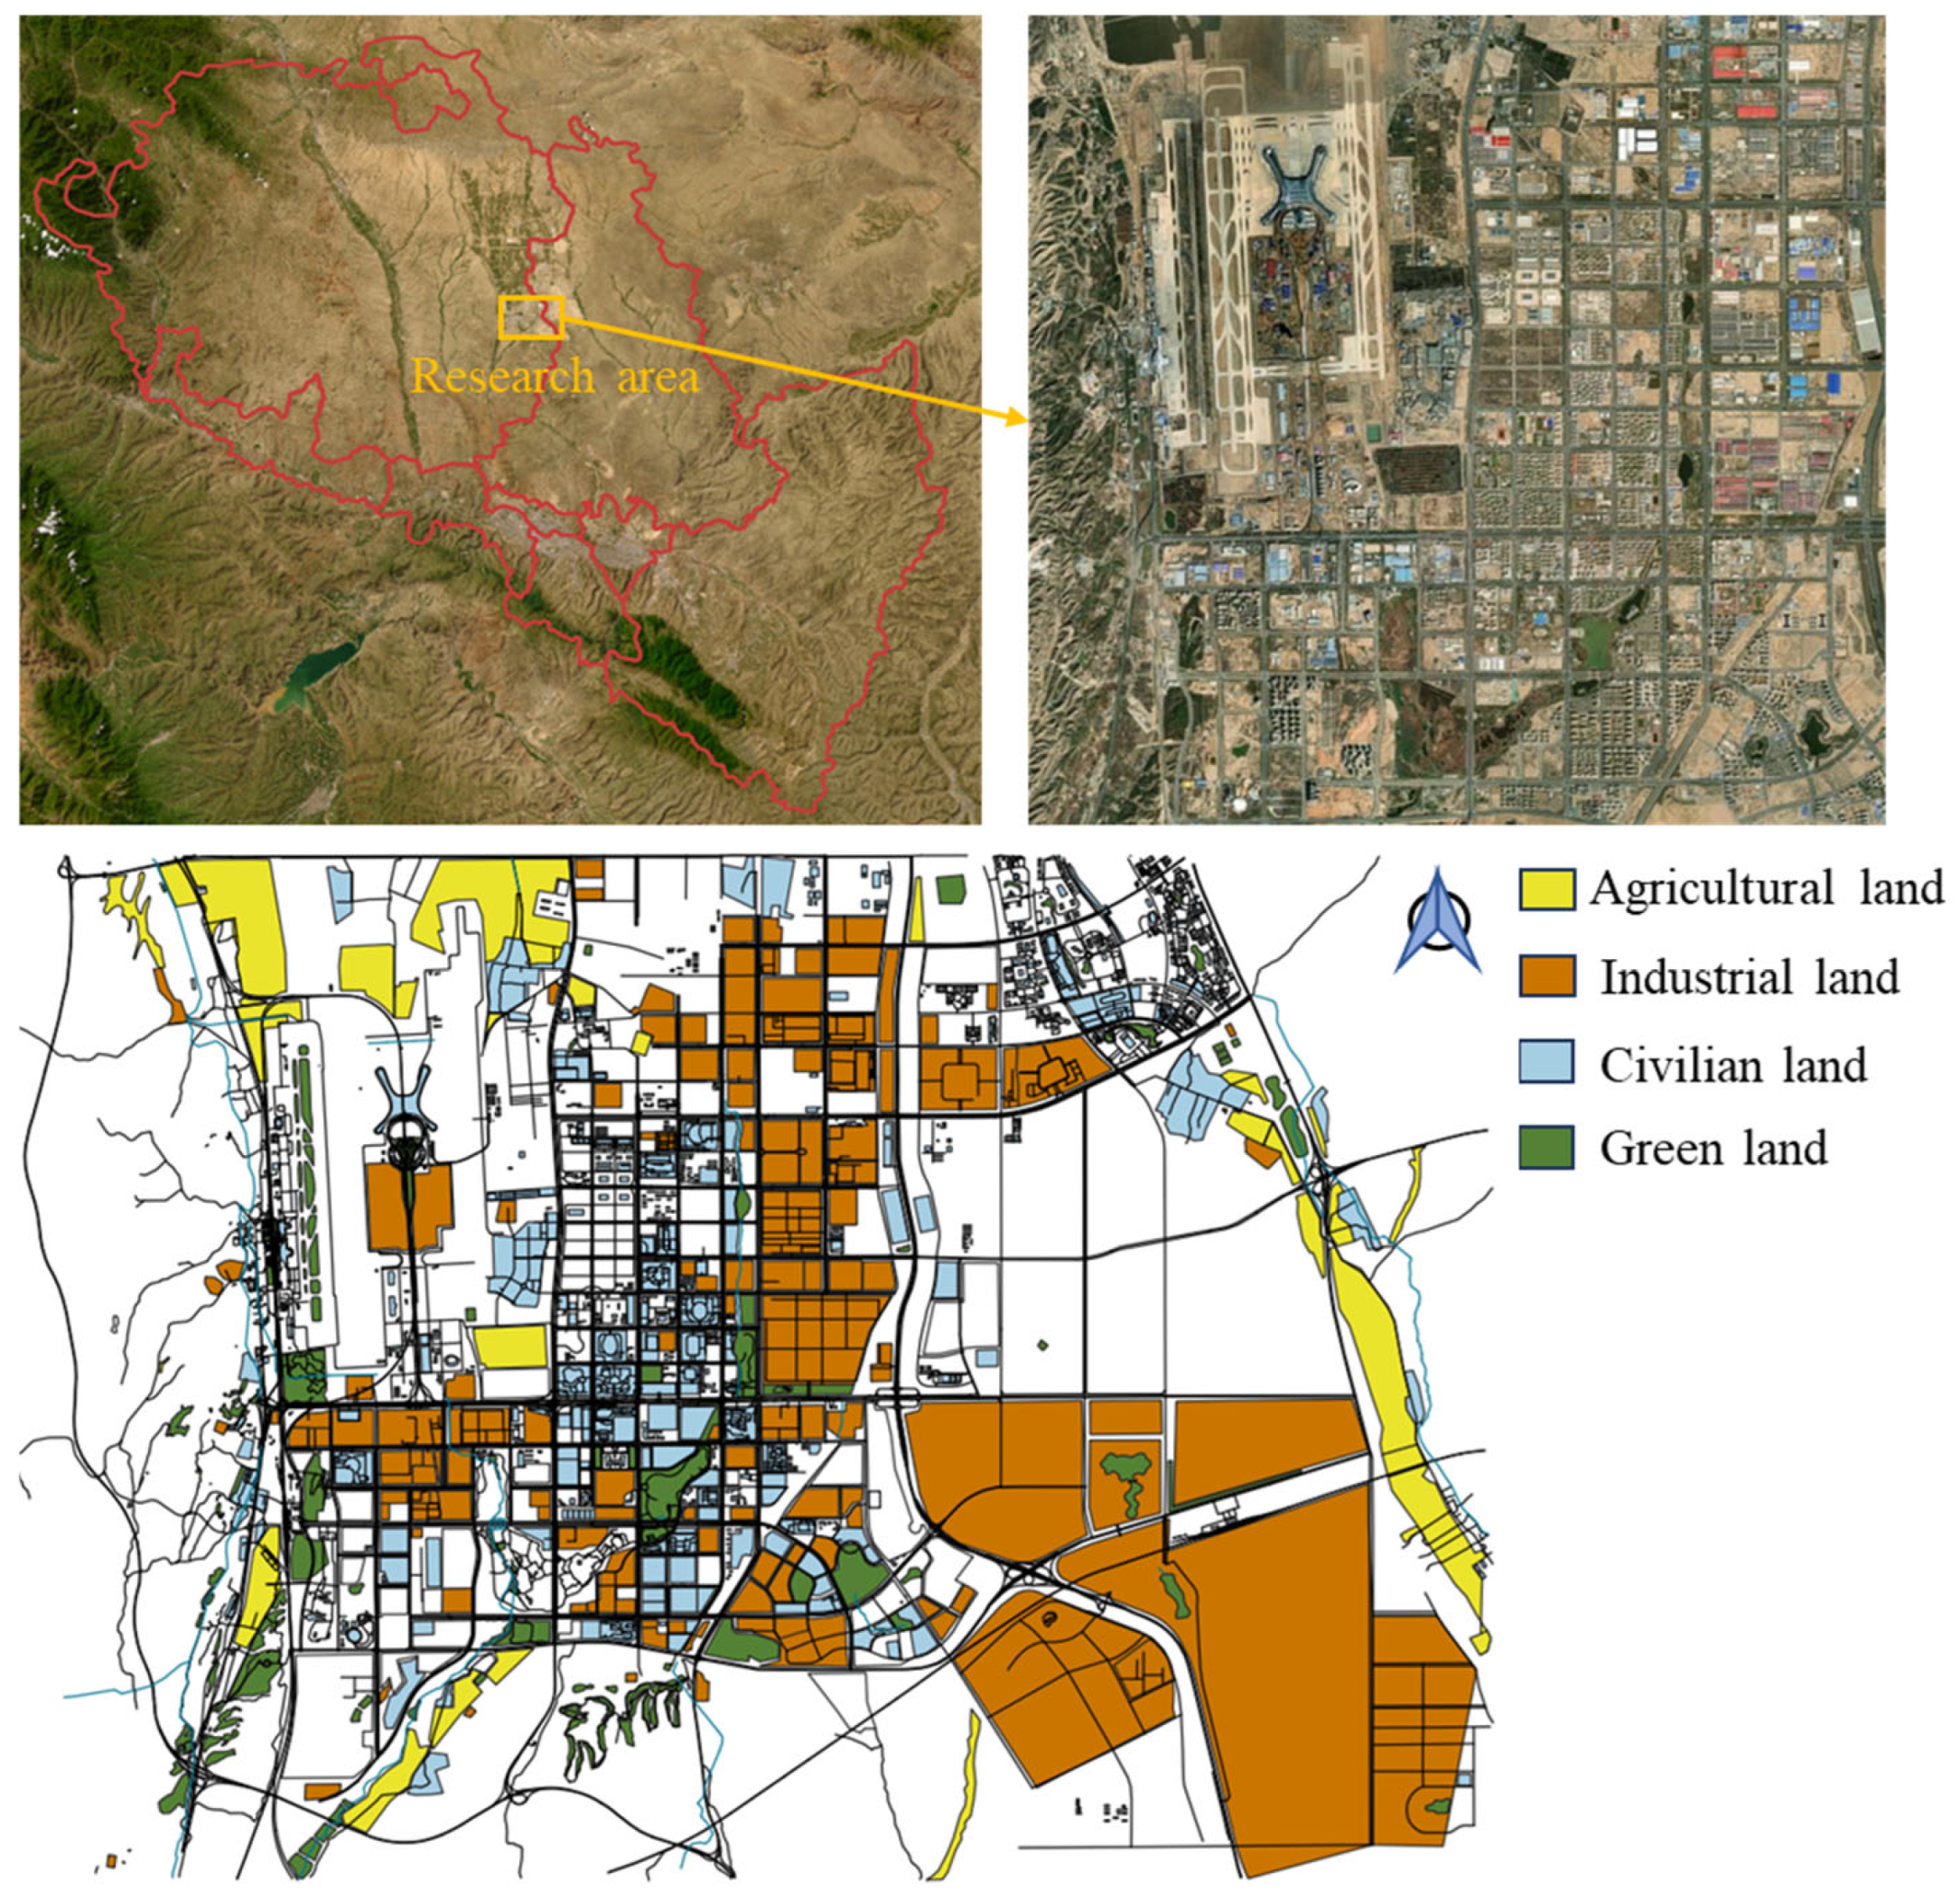
In this paper, the land use types of Lanzhou New District are obtained through an open-source data website and visualized by QGIS software for classification and division of industrial buildings and civil buildings. Industrial buildings mainly include large-scale machinery manufacturing, metallurgical processing plants, warehousing and logistics centers, green chemical parks, and other types. Civil buildings mainly include commercial buildings, office buildings, residential buildings, and other types.
The relevant satellite image data used for deep learning model training and testing came from the central city of Lanzhou, and its data volume is shown in
Table 2. The satellite maps came from ESRI satellite image maps, and the satellite maps were gridded through the QGIS software. The actual size of the exported image was set to be 100 × 100 m and the pixels to be 2000 × 2000, and the satellite images were finally exported.
Labeled data are manually labeled labels on the exported satellite images by LabelMe, which mainly labels the roof area in each satellite image.
The research area selected in this paper belongs to the center area in Lanzhou New District, and the research area is divided by QGIS software, which finally includes a total of 8774 satellite images for the research and analysis of this paper.
2.3. Evaluation Indexes
In this paper,
maxFβ and
MAE (Mean Absolute Error) are selected as evaluation indexes for evaluating the recognition results of deep learning models for building roofs [
42,
43].
The
maxFβ parameter takes into account both accuracy and recall. Accuracy refers to the proportion of the number of correctly recognized pixels as “roof” to the total number of recognized pixels as “roof” by the model, as shown in Equation (1). Recall is the ratio of the number of correctly recognized pixels as “roof” to the number of actual pixels as “roof”, as shown in Equation (2). The equation is as follows.
F-measure
Fβ is used for combined evaluation of accuracy and recall, as shown in Equation (3).
where β
2 is taken as 0.3 and the maximum
Fβ (
maxFβ) is taken for each dataset.
MAE (Mean Absolute Error) calculates the average of the absolute values of the prediction errors for each sample, as shown in Equation (4). Its advantage is that it can visualize the size of the gap between the model’s predicted value and the true value, and the range of values of
MAE is [0, +∞); the smaller the value of
MAE, the smaller the representative error.
where
n represents the number of samples,
yi is the true value, and
is the predicted value.
4. Results and Discussion
4.1. Analysis of Model Prediction Results
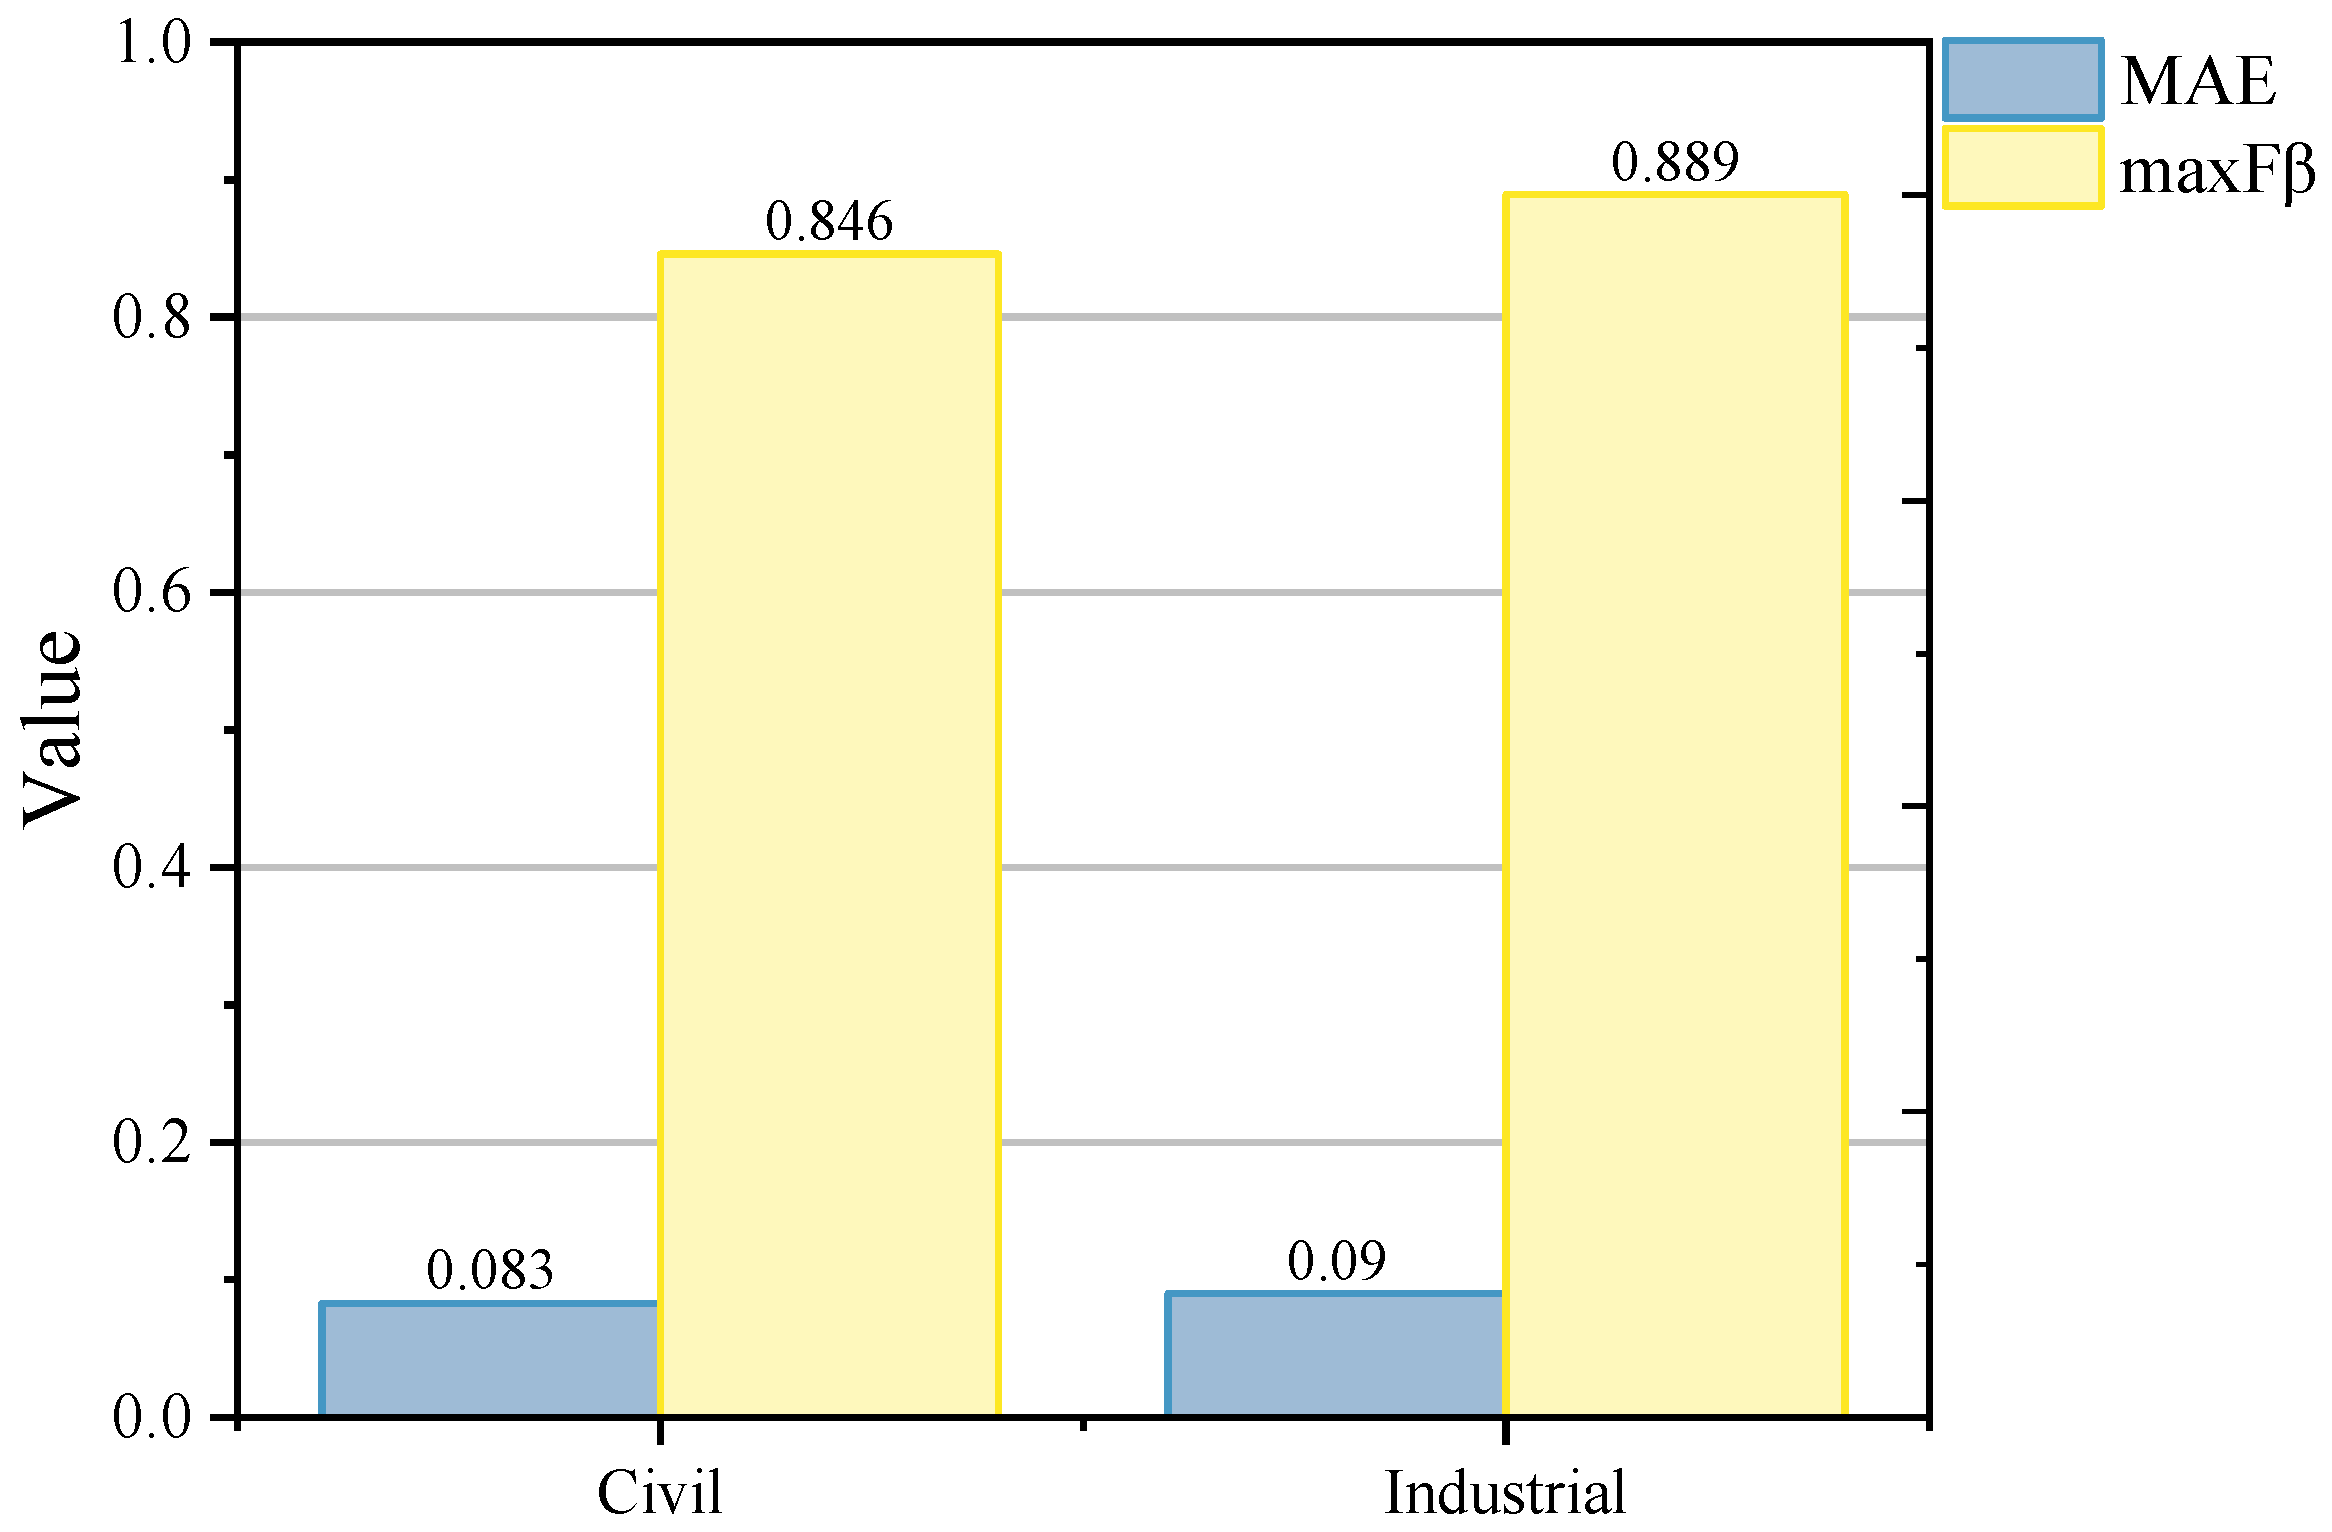
This part mainly shows the deep learning model training results for industrial and civil buildings. As shown in
Figure 6, both are the optimal results retained after 200 iterations of calculation through the model. Among them, the identification accuracy of the roof area of industrial buildings is higher, with a maximum
maxFβ value of 0.889 and an
MAE value of 0.09. While the identification results of the roof area of civil buildings are slightly lower, with a
maxFβ value of 0.846, which is lower than that of industrial buildings by about 5.08%, and the
MAE value of 0.083. Overall, the predicted
maxFβ values for both types of buildings are higher than 0.84, and the
MAE values are lower than 0.09, so the errors in the predictions are both relatively small, and the predictions are better.
In particular, the reason for the higher identification accuracy of the roof area of industrial buildings may be that the roof contour of industrial buildings is often more regular. The roof area is usually larger, and the model is easier to extract features from. While civil buildings are used for a wider range of architectural purposes. Therefore, the roof contour of the building is more complex and is mostly distributed as an irregular polygon, so the training is relatively more difficult.
The optimal weights retained during the training process of the deep learning model are utilized to identify the research area in the intercepted Lanzhou New District on a large scale, which includes a total of 8774 satellite images (the overall specification is 107 × 82), and the research area covers 87.74 km
2, and the overall prediction results are shown in
Figure 7.
In overall terms, industrial buildings in the research area are mostly distributed in the northeast and southwest and are mostly concentrated in the nearby airport area and distributed along the main transportation arteries, and the overall regional division is more obvious. Civil buildings are mostly distributed in the southeast, with a wider range of distribution and more concentration.
4.2. Analysis of Solar PV Potential in the Research Area
This part focuses on analyzing the solar PV potential of the research area by visualizing the PV potential of building rooftops in the research area. Combining the difference in the calculation results of the PV potential of the two types of buildings with a comparative analysis in order to better provide scientific guidance and planning for the practical application of solar energy in the city.
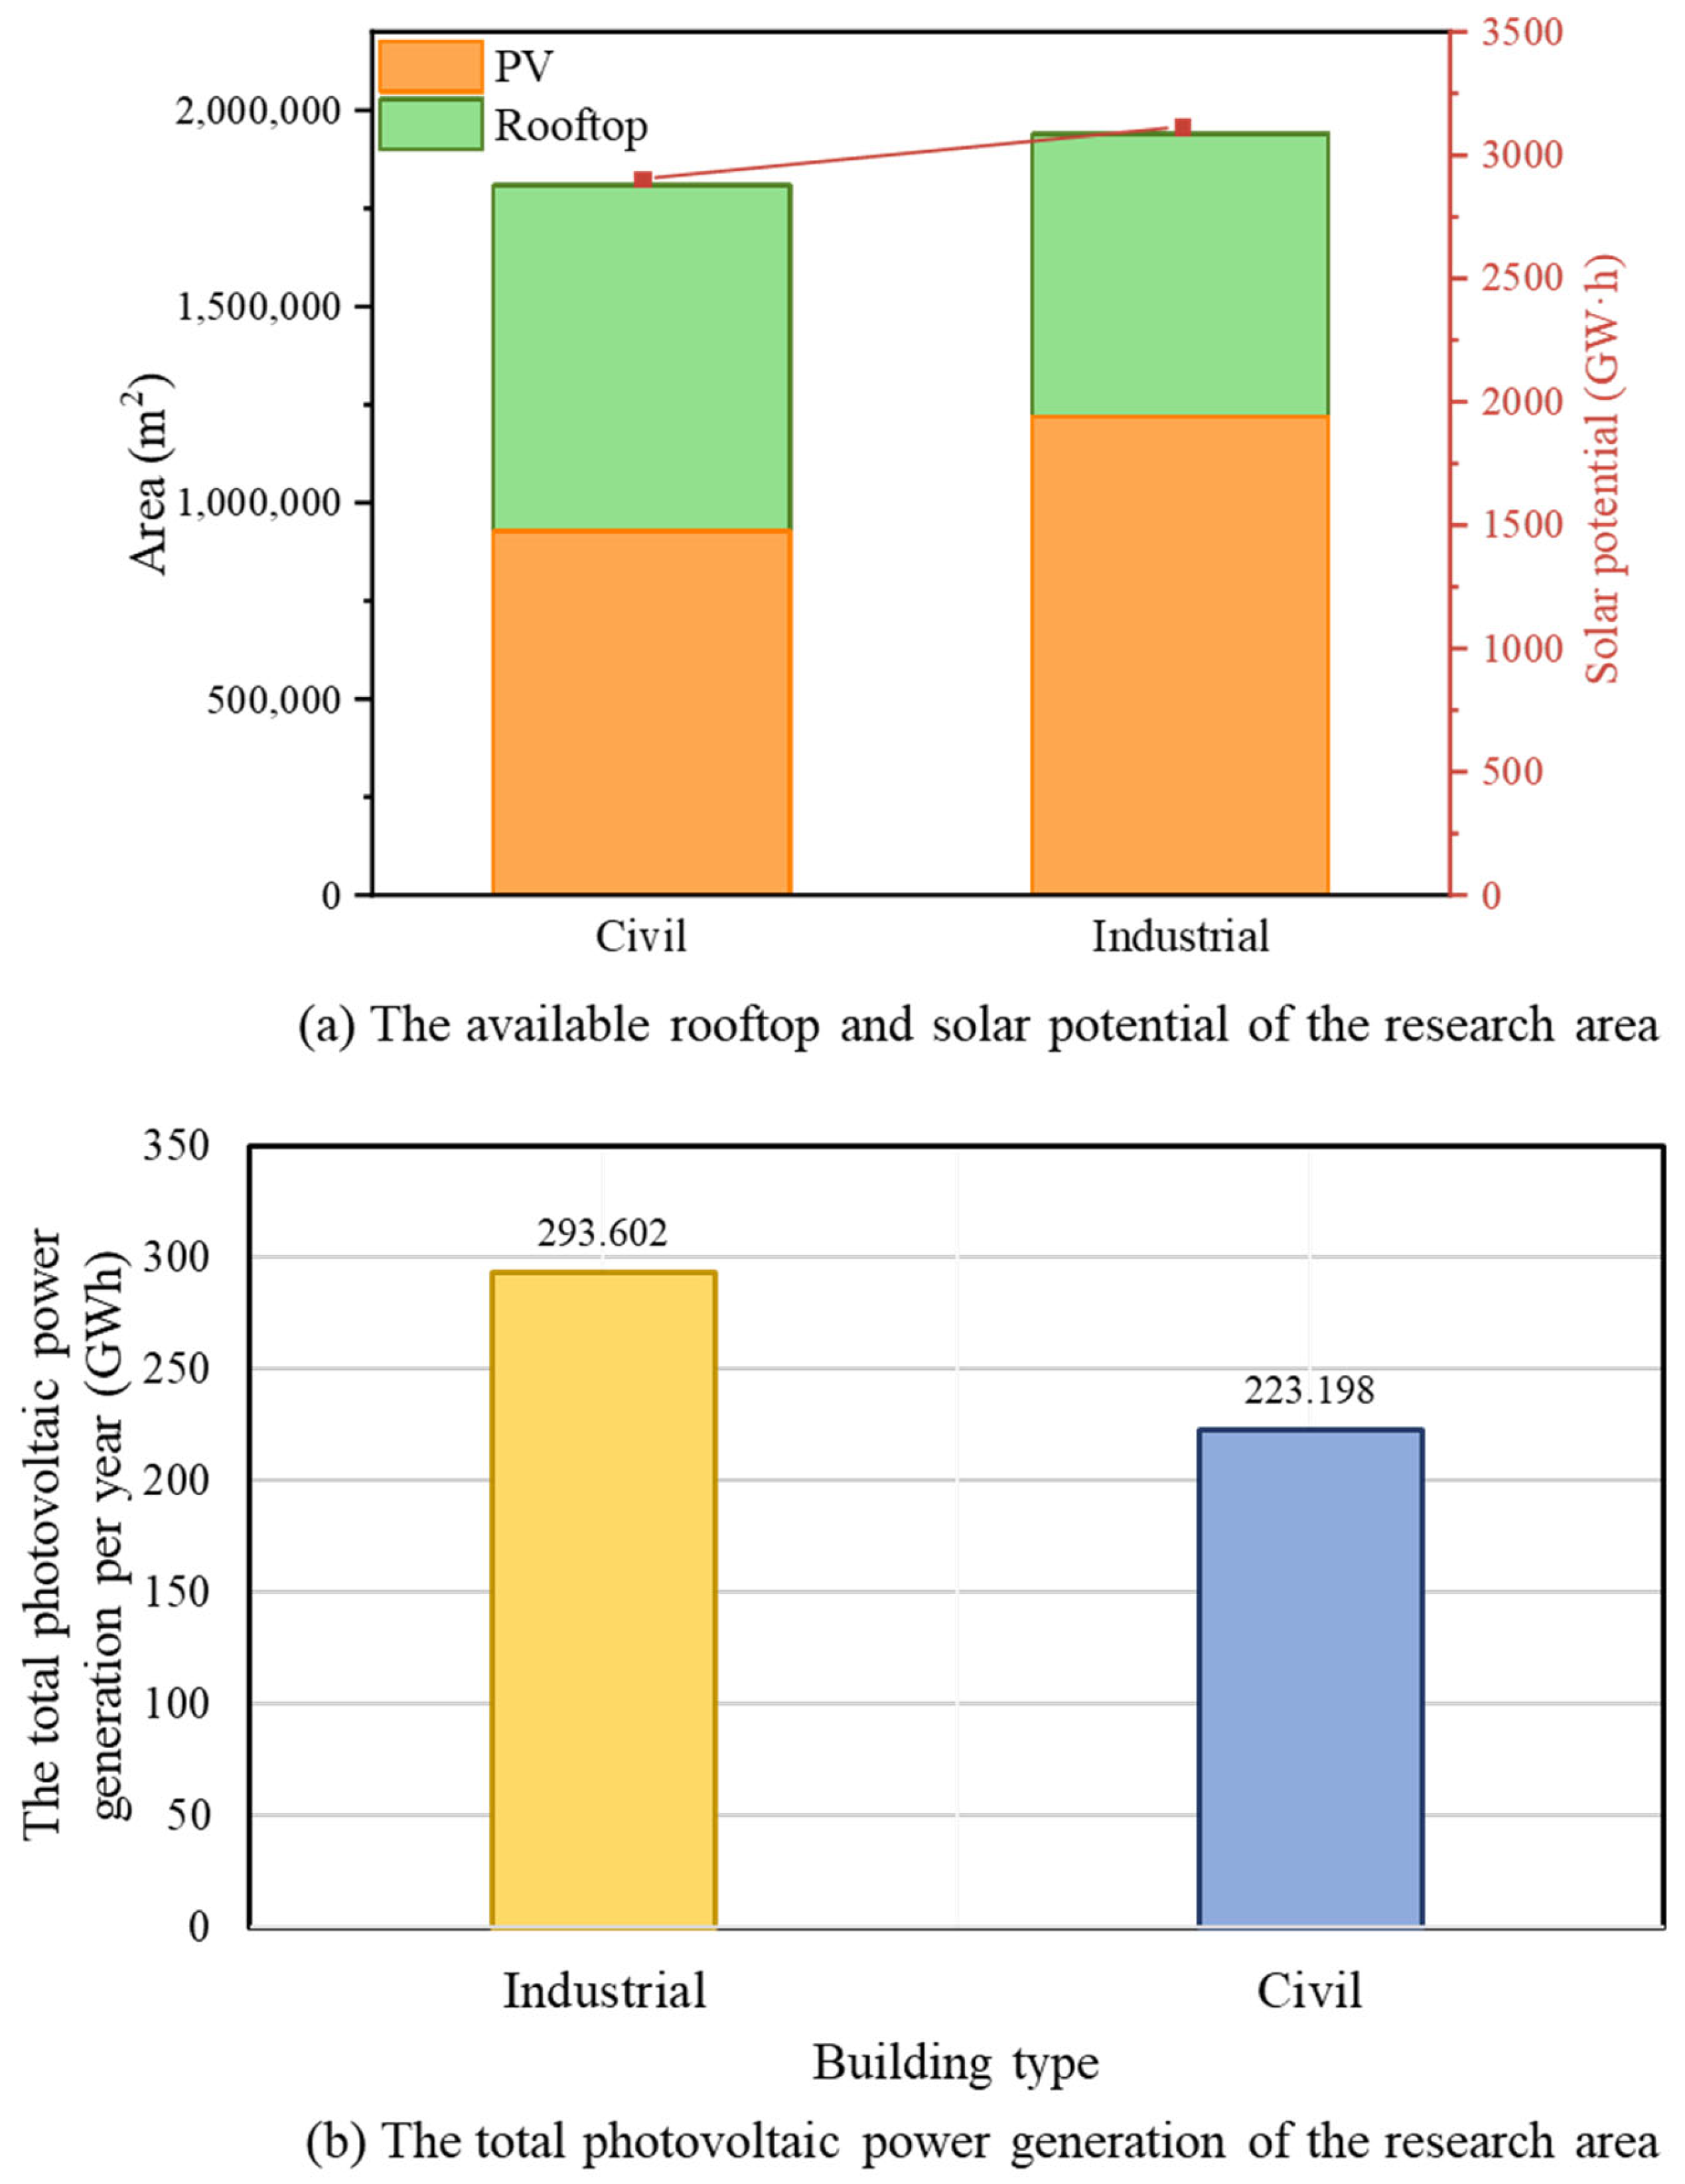
Figure 8a illustrates the comparison between residential and industrial buildings in terms of roof area, available PV panel area, and solar energy potential.
As shown in
Figure 8, the roof area of the industrial building is 1,940,012.6 m
2, and the simulation calculation shows that it can install photovoltaic panels on an area of 1,219,075 m
2, corresponding to the solar energy potential of 3114.88 GWh. The solar energy potential is 1957.35 GWh, while the roof area of the civil building is 1,808,791.38 m
2. The area of photovoltaic panels on an area of 926,750 m
2, corresponds to the solar energy potential of 2904.19 GWh and the solar energy potential of 1487.99 GWh. The roof area of civil buildings is 1,808,791.38 m
2, which can be covered with 926,750 m
2 of PV panels, with a corresponding solar potential of 2904.19 GWh and a PV potential of 1487.99 GWh. The data indicates that, due to the larger roof area, industrial buildings are able to cover more PV panels and thus have higher PV potential.
In order to further accurately assess the actual applicable electrical energy resources in the region and to provide a more rational planning basis for urban renewable energy applications, this paper also considers the efficiency of photovoltaic panels in converting solar energy into electrical energy.
Figure 8b shows the calculation results of solar PV potential: By analyzing the roof area and solar PV potential of the research area, combined with energy conversion efficiency, the theoretical electrical energy that can be generated by installing PV panels on the roofs of industrial buildings is calculated to be 293.602 GWh. The theoretical electrical energy that can be generated by civil buildings is calculated to be 223.198 GWh. The theoretical electricity generation of industrial buildings is higher, 31.54% higher than that of civil buildings.
Through the above analysis, it can be obtained that the roof area of industrial buildings is larger and higher than the roof area of civil buildings by about 7.25%, while the roof area of industrial buildings where photovoltaic panels can be installed is higher than that of civil buildings by about 31.54%. Industrial buildings can lay PV panels in an area that accounts for 62.84% of the total roof area, and civil buildings can lay PV panels in an area that accounts for 51.24% of the total roof area. PV panels installed in industrial buildings account for a higher percentage of the area, proving that PV panels installed in industrial buildings utilize more of the area. Therefore, in the actual PV installation planning and application, the PV installation planning for industrial buildings should be prioritized and widely promoted so that urban planners and decision-makers can more accurately formulate relevant policies to promote the effective utilization and development of renewable energy sources.
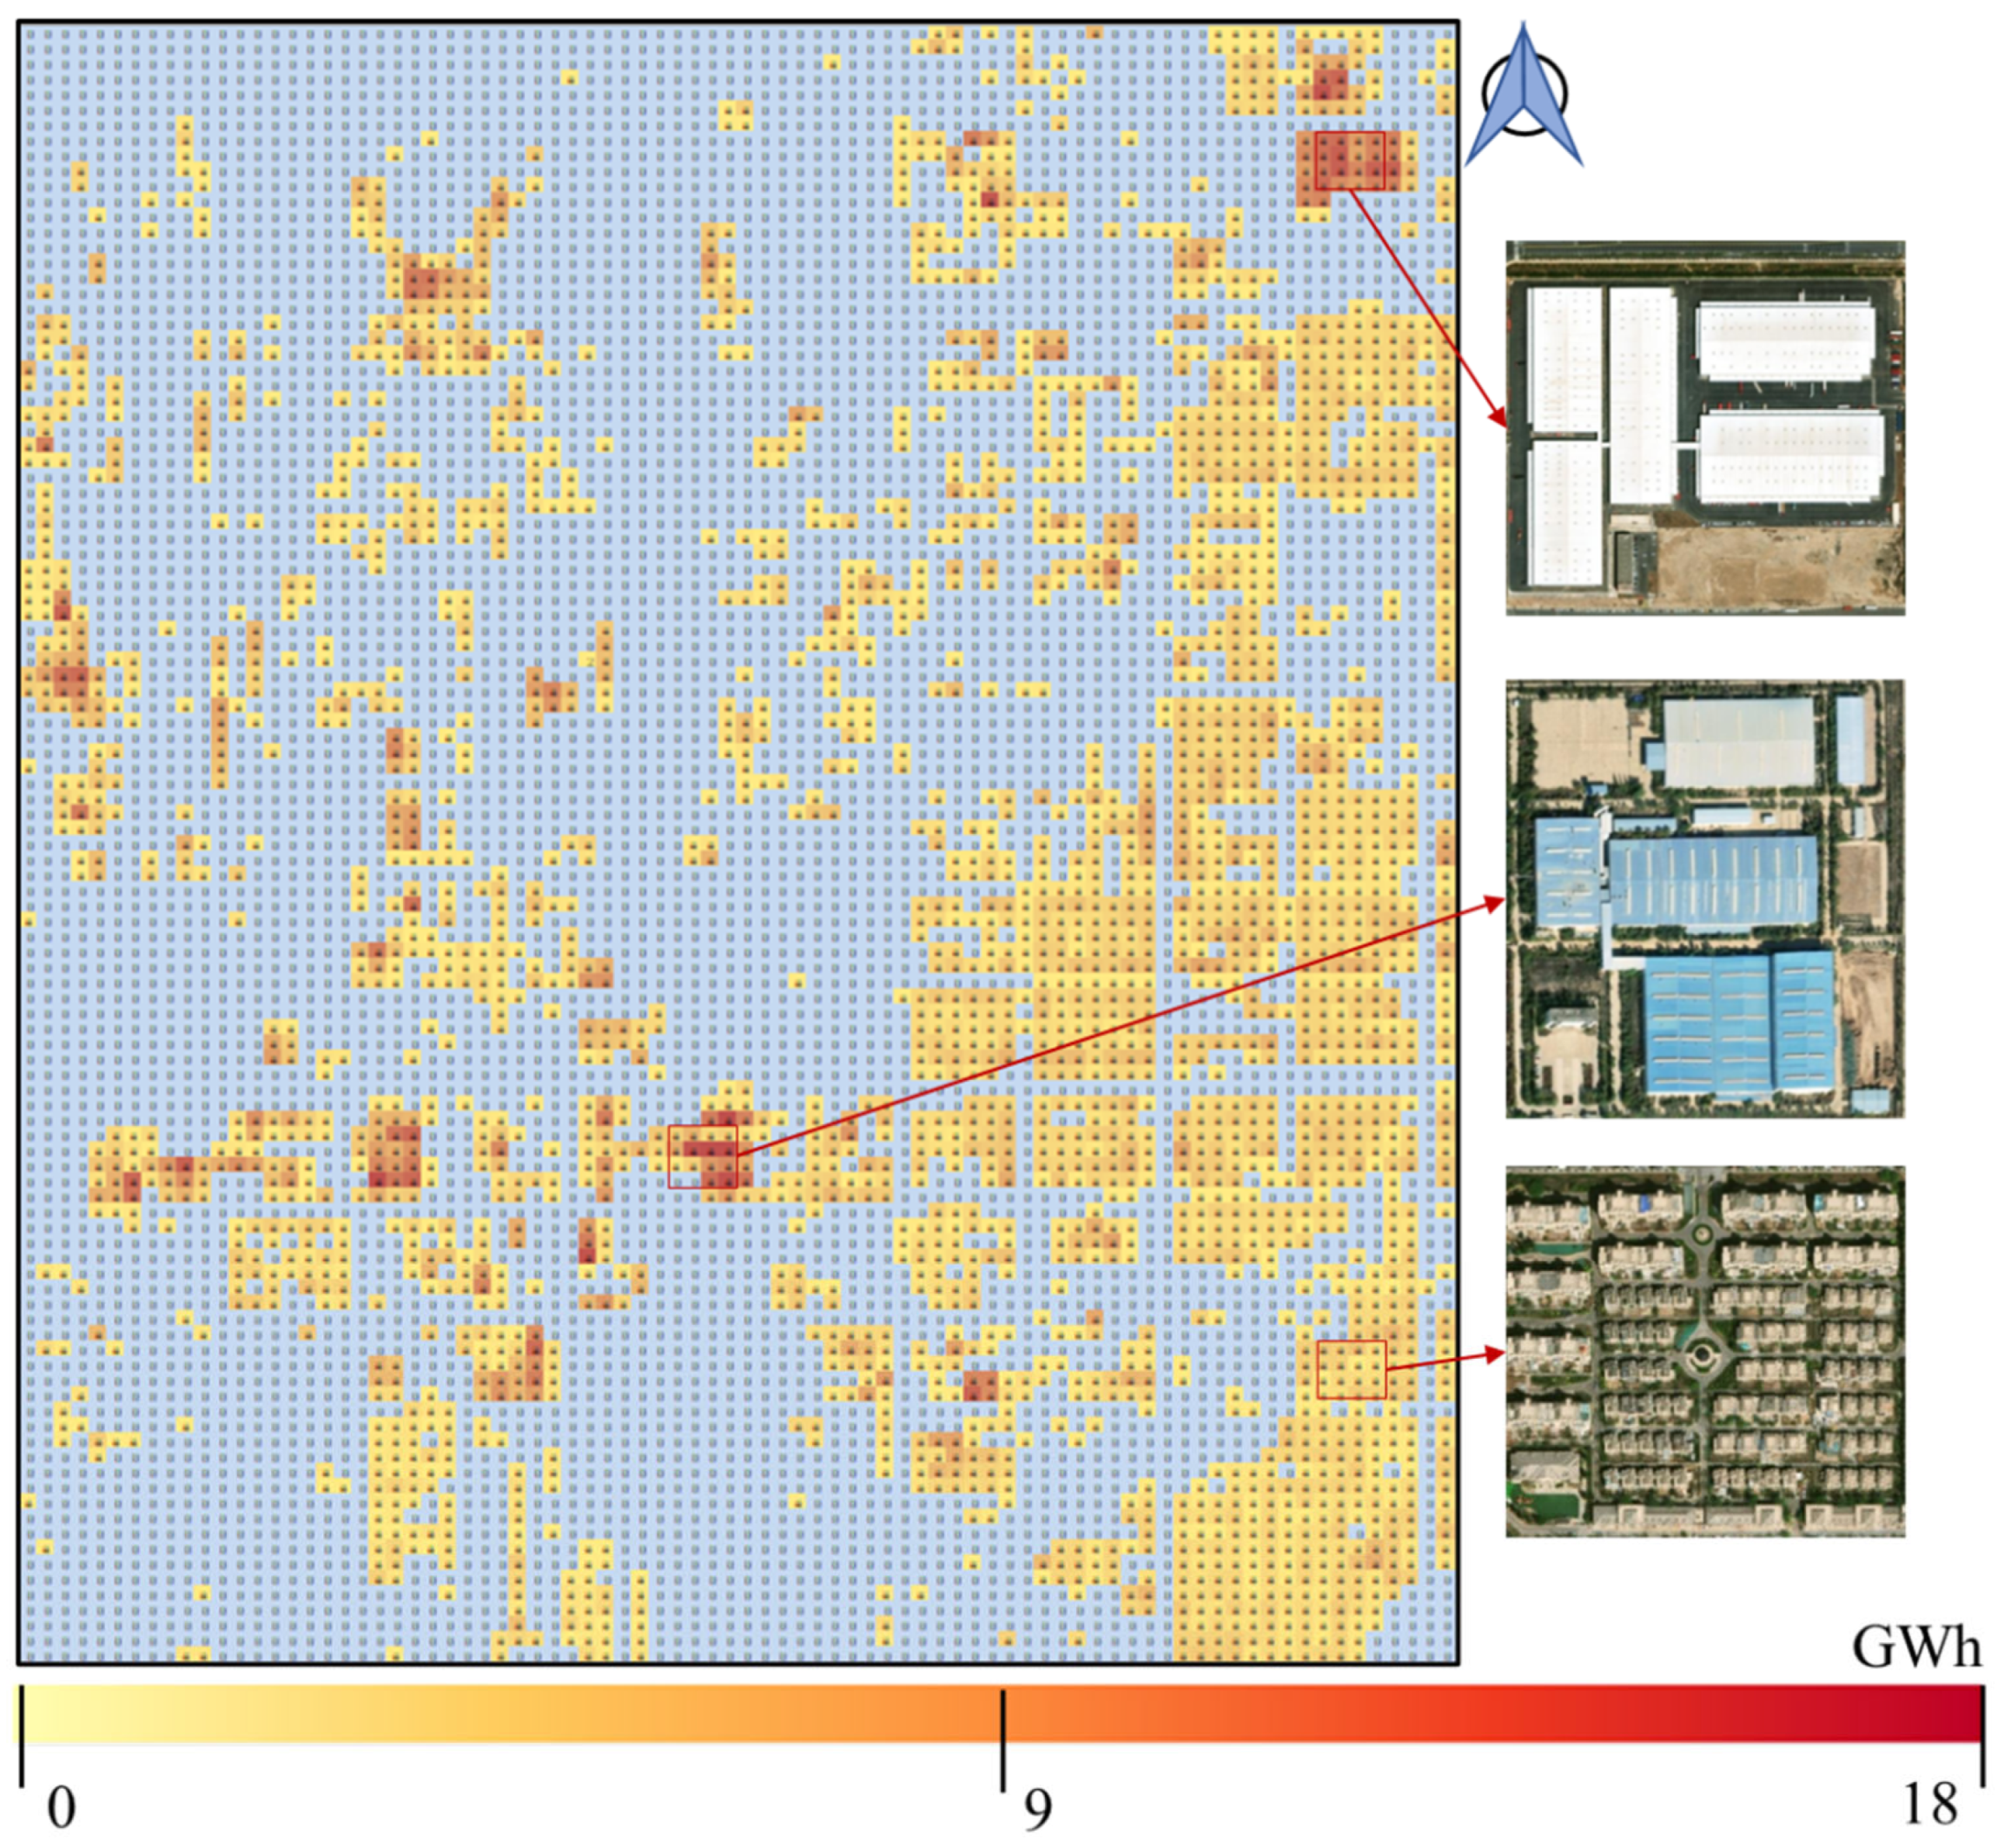
The identification of the roof area in the research area was calculated by the deep learning model, combined with the intensity of regional solar radiation, while the results of the calculations for each area (comprising a total of 8774 zones) were visualized as shown in
Figure 9, reflecting the solar photovoltaic potential of the rooftops in the research area. Overall, the industrial zones present a high PV potential, while the civil zones have a relatively low PV potential. Specific analysis shows that the difference in the distribution of solar potential between industrial areas is more obvious, and there are multiple high-potential hotspots in some industrial areas, with the largest area of solar PV potential reaching about 16.5 GWh, while some edge areas have lower solar PV potential. The distribution of solar PV potential in civil areas is more even, mostly at the medium potential level, within the range of 0~9 GWh.
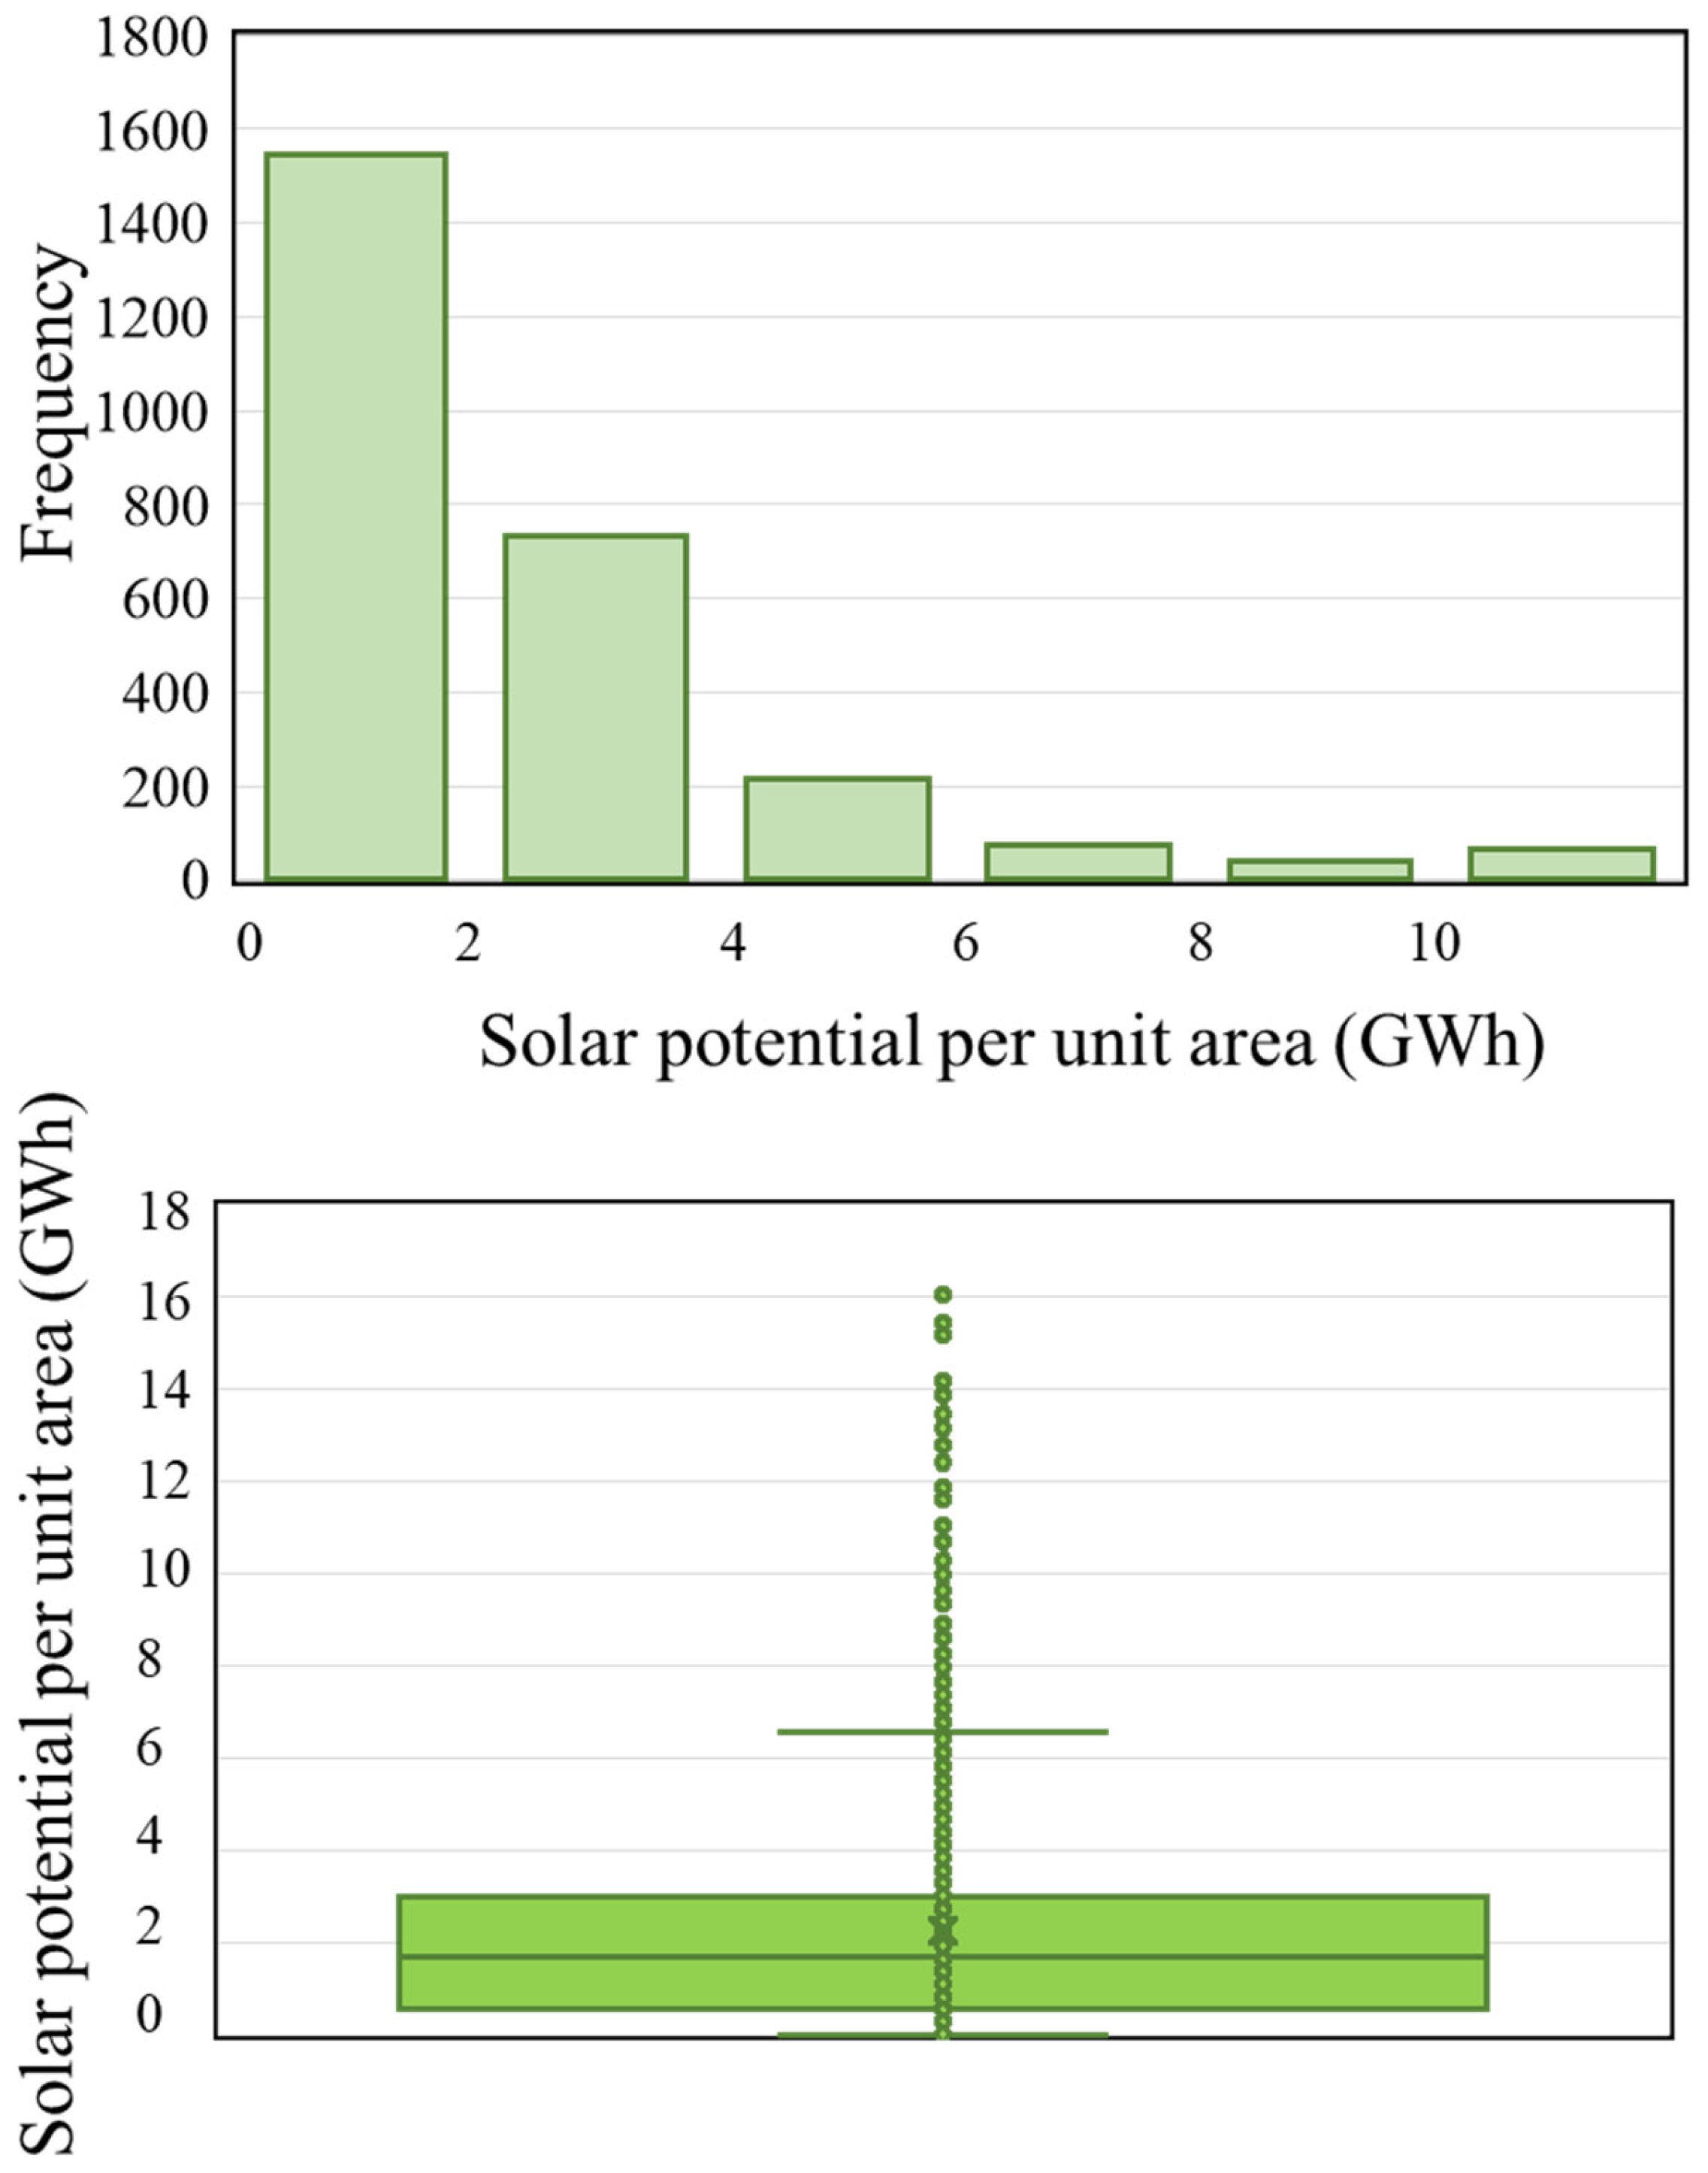
Through the statistics of the results of the 8774 solar potential measurement areas in the research area, the overall frequency and frequency distribution are obtained as shown in
Figure 10, and the results of the statistics reflect that the frequency of the solar potential per unit area in the research area is less than 2 GWh, which appears to be the largest, and higher than 6 GWh, which appears to be less frequent, and the maximum value of the regional solar potential is 16.056 GWh, and the overall average value of solar potential of each area is 2.25 GWh. The average value of solar potential is 2.25 GWh, which indicates that the planning of urban PV utilization potential in this region can prioritize the development of high-potential key areas. At the same time, it provides a quantitative standard for the planning and development basis of urban PV utilization potential.
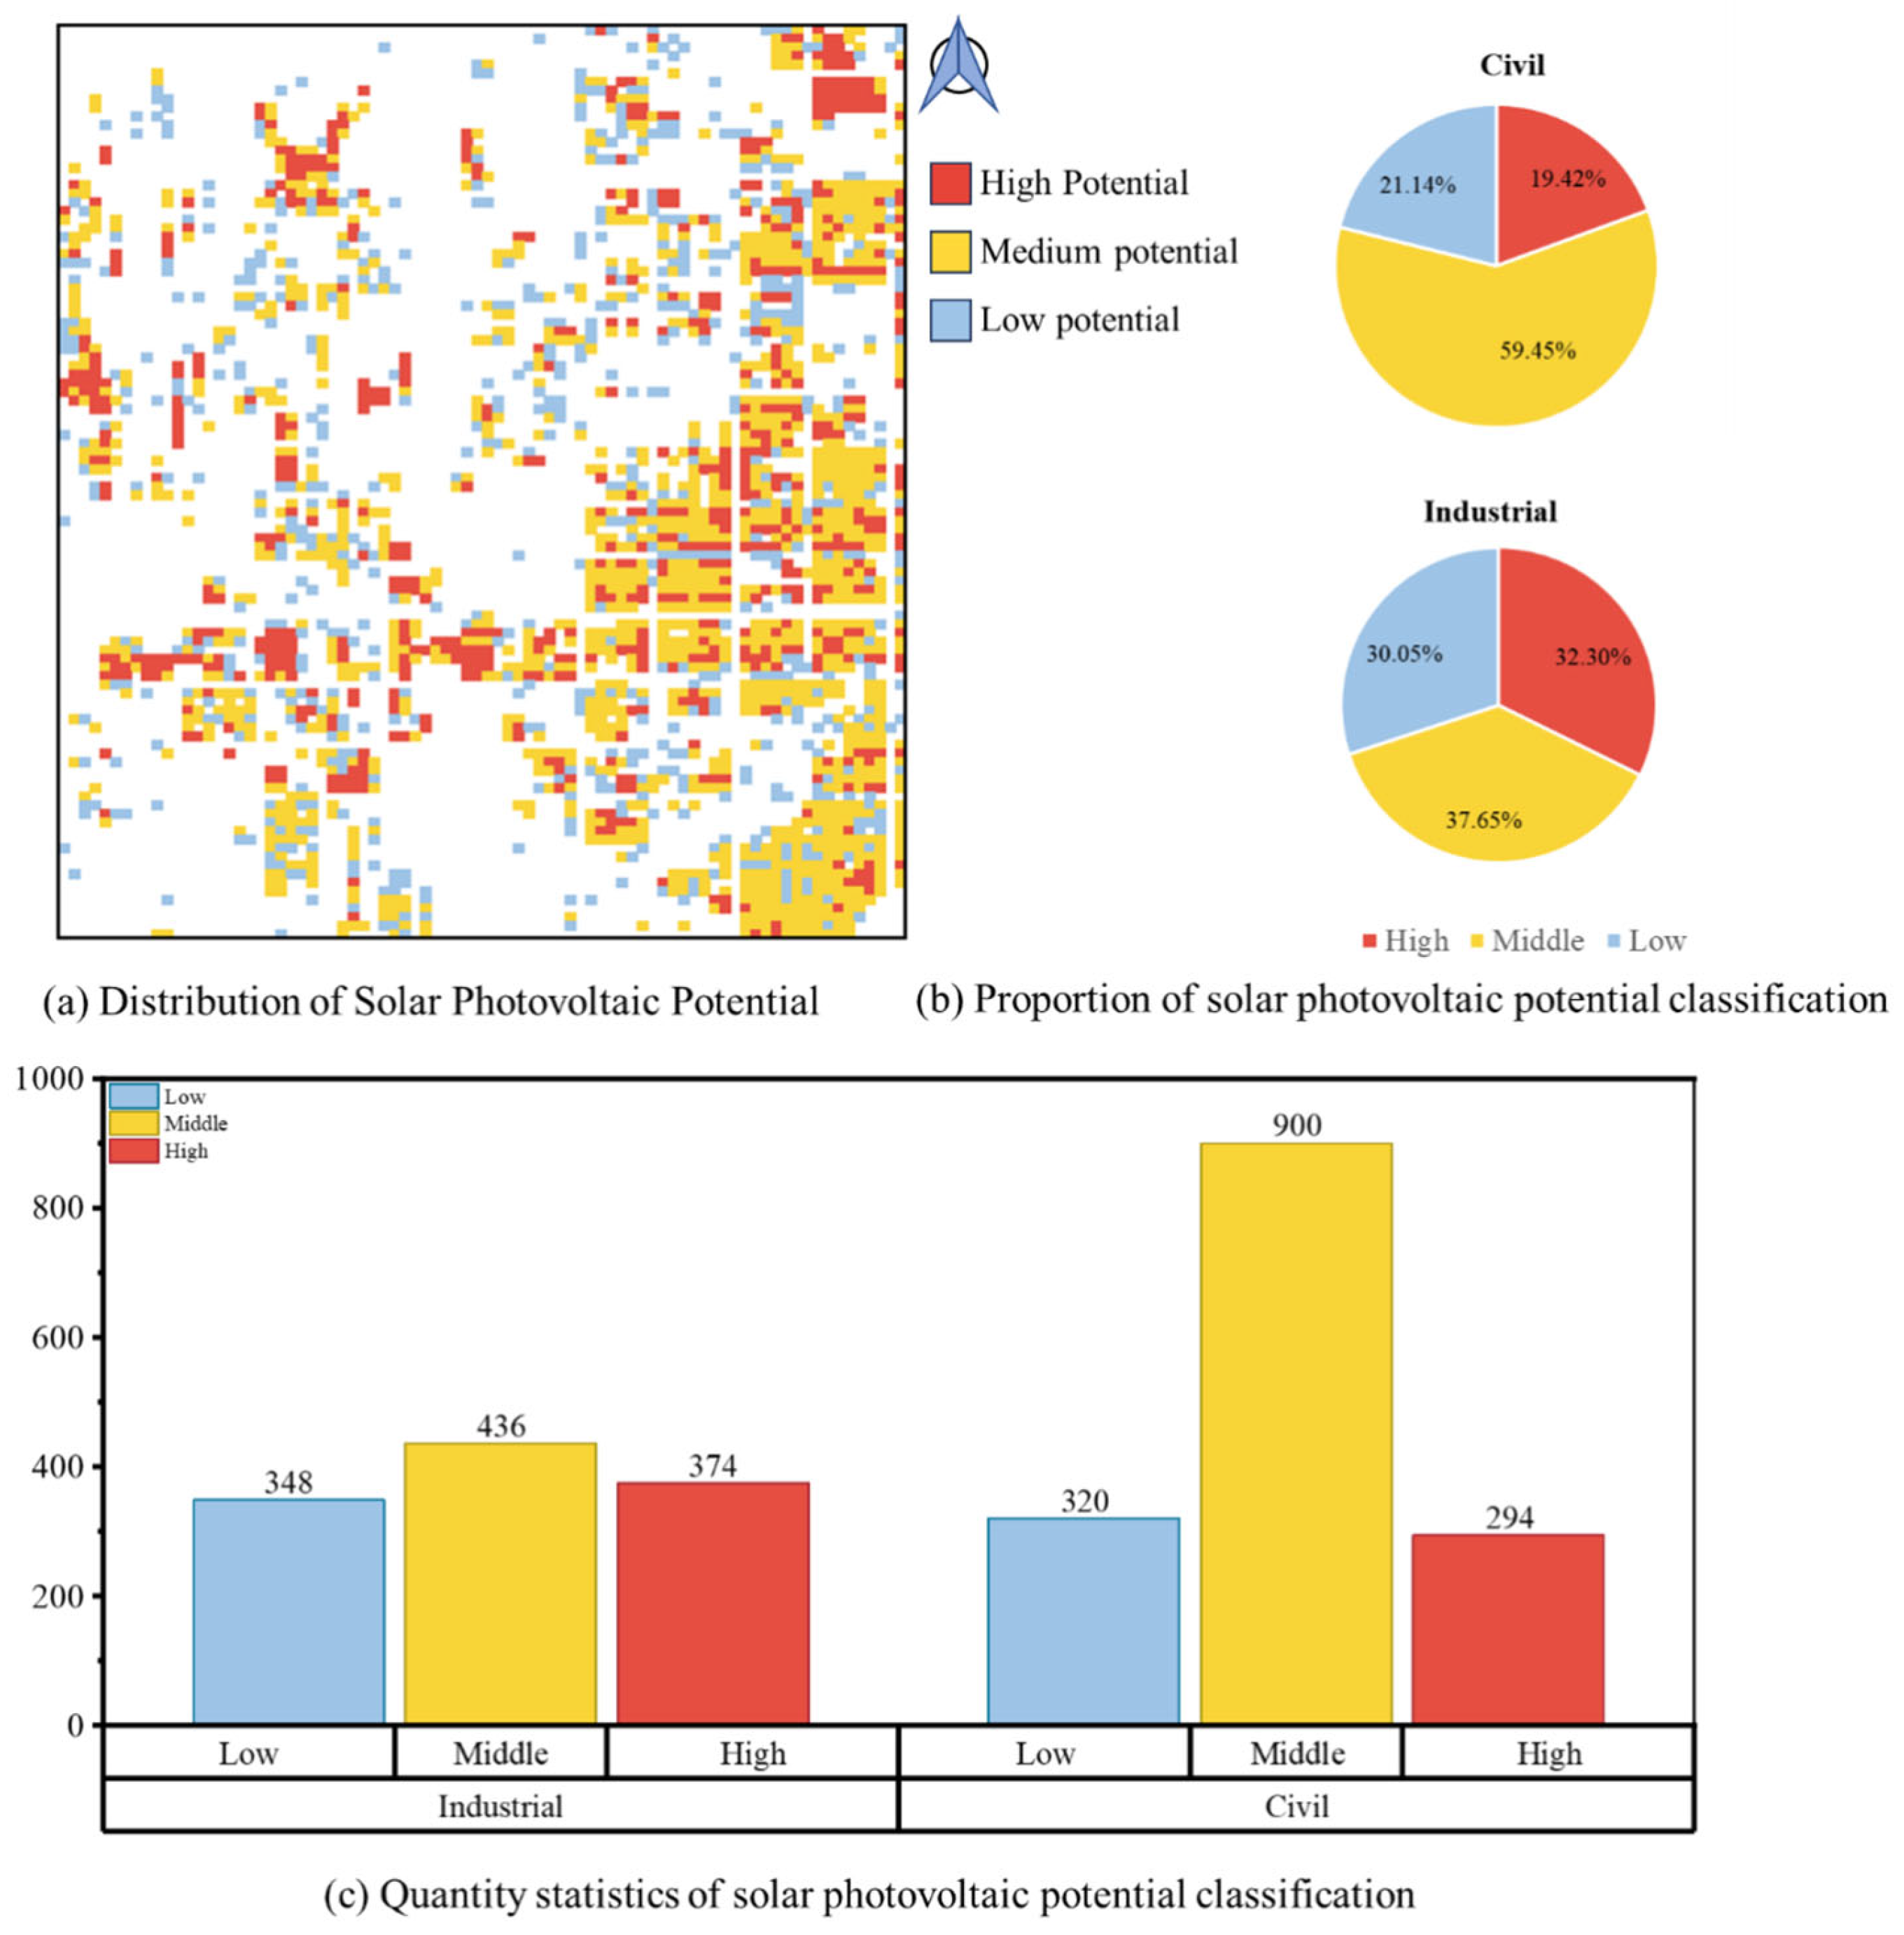
By calculating and counting the solar potential corresponding to each area region in the research area, and at the same time, the results of solar potential calculations are sorted from high to low and graded and processed, divided into three levels according to the size of the solar potential. The overall summary of the solar potential of the value of higher than 75% of the area is defined as a high-potential area, the area between 25% and 75% of the area is defined as a medium-potential area, and less than 25% is defined as a low-potential area. Finally, the results are visualized as shown in
Figure 11. Combined with the analysis of land use types in the Lanzhou New District in
Figure 3, the solar potential levels of industrial and civil building areas are mainly counted. As shown in
Figure 11b,c, for civil buildings, the number of high, medium, and low potential regions are 294, 900, and 320, respectively, of which the proportion of high potential areas is 19.42%, the proportion of medium potential areas is 59.45%, and the proportion of low potential areas is 21.14%. For industrial buildings, the number of high, medium, and low potential regions is 374, 436, and 348, respectively, with 32.30% of high potential regions, 37.65% of medium potential regions, and 30.05% of low potential regions. The regional solar potential grading of civil buildings varies greatly, showing that it is dominated by medium-potential regions, and the proportion of high- and low-potential regions is relatively small. The regional solar potential grading level of industrial buildings is more average, in which the number of high-potential areas is higher than that of civil buildings by 80, which has higher potential and value for solar energy development and is more conducive to the centralized development and implementation of urban photovoltaic planning.
4.3. Analysis of Solar Energy Applications in the Research Area
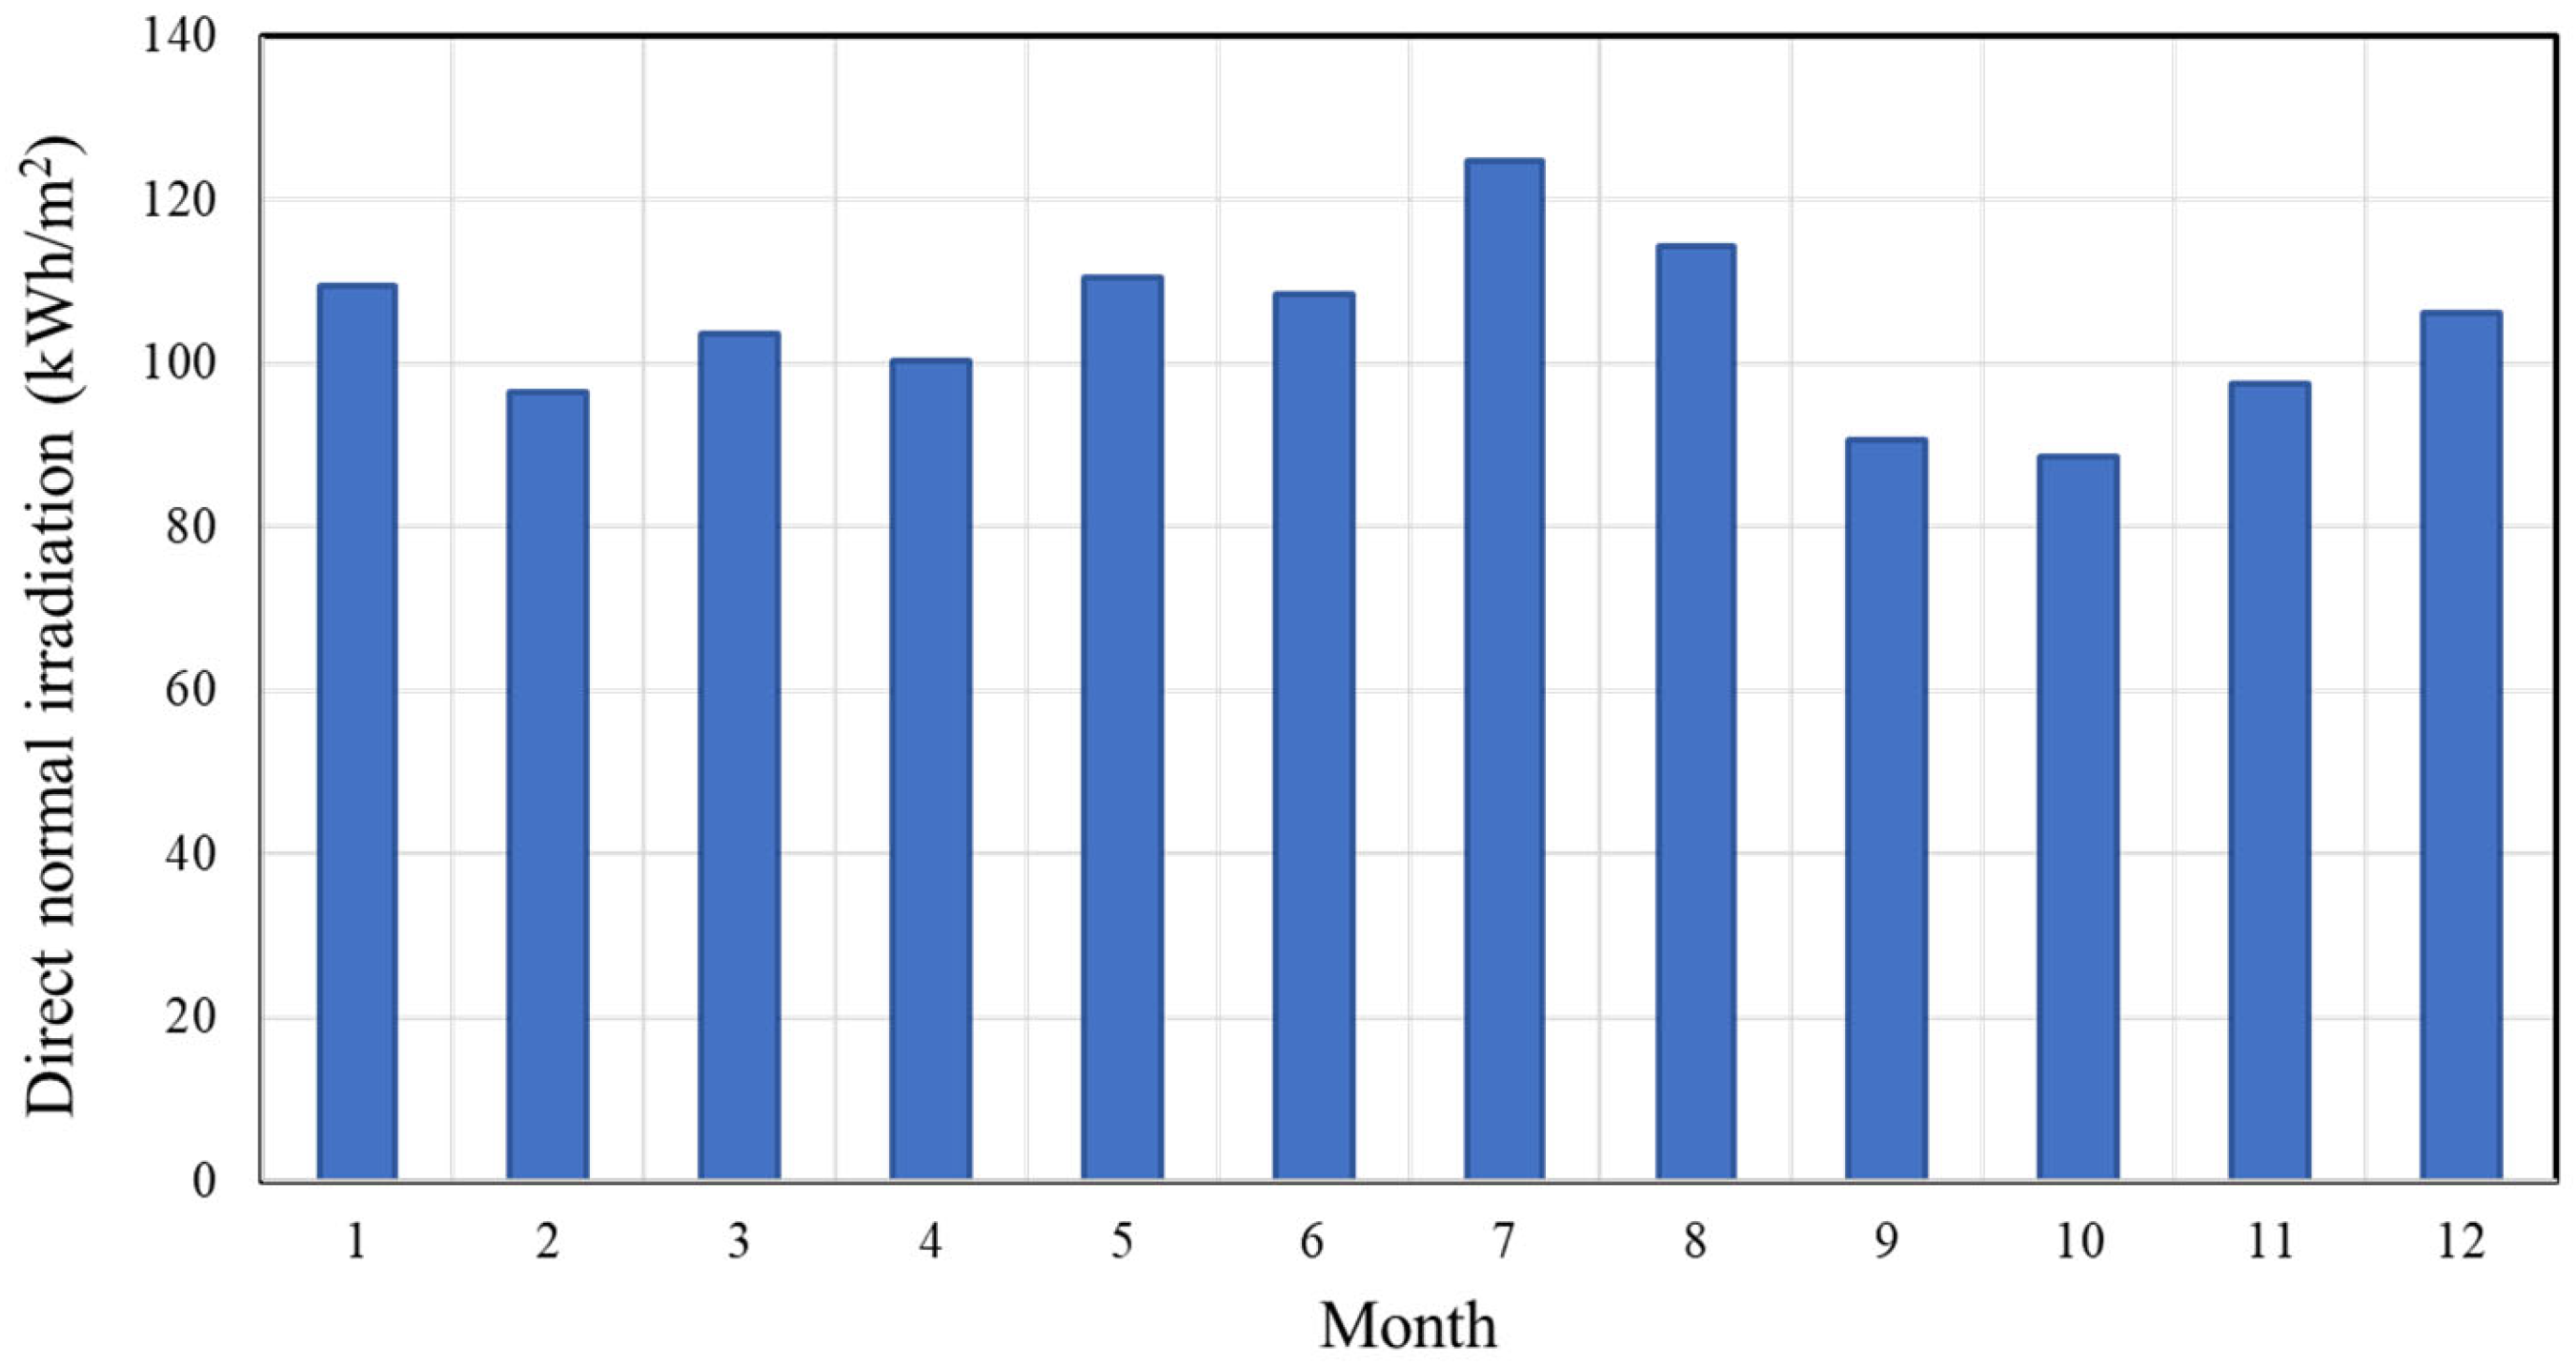
To quantify the emission reduction contribution of large-scale PV deployment to the city-level energy structure, this research area takes a typical area in Lanzhou New District as a case study and integrates the following multi-source data: (1) The city’s annual electricity load baseline (averaged over 2020–2024); (2) GIS-based assessment of the spatial PV potential (integrating rooftop availability, solar radiation, and conversion efficiency). As shown in
Figure 12, it aims to provide decision support for renewable energy planning in high-density cities in the arid Northwest region.
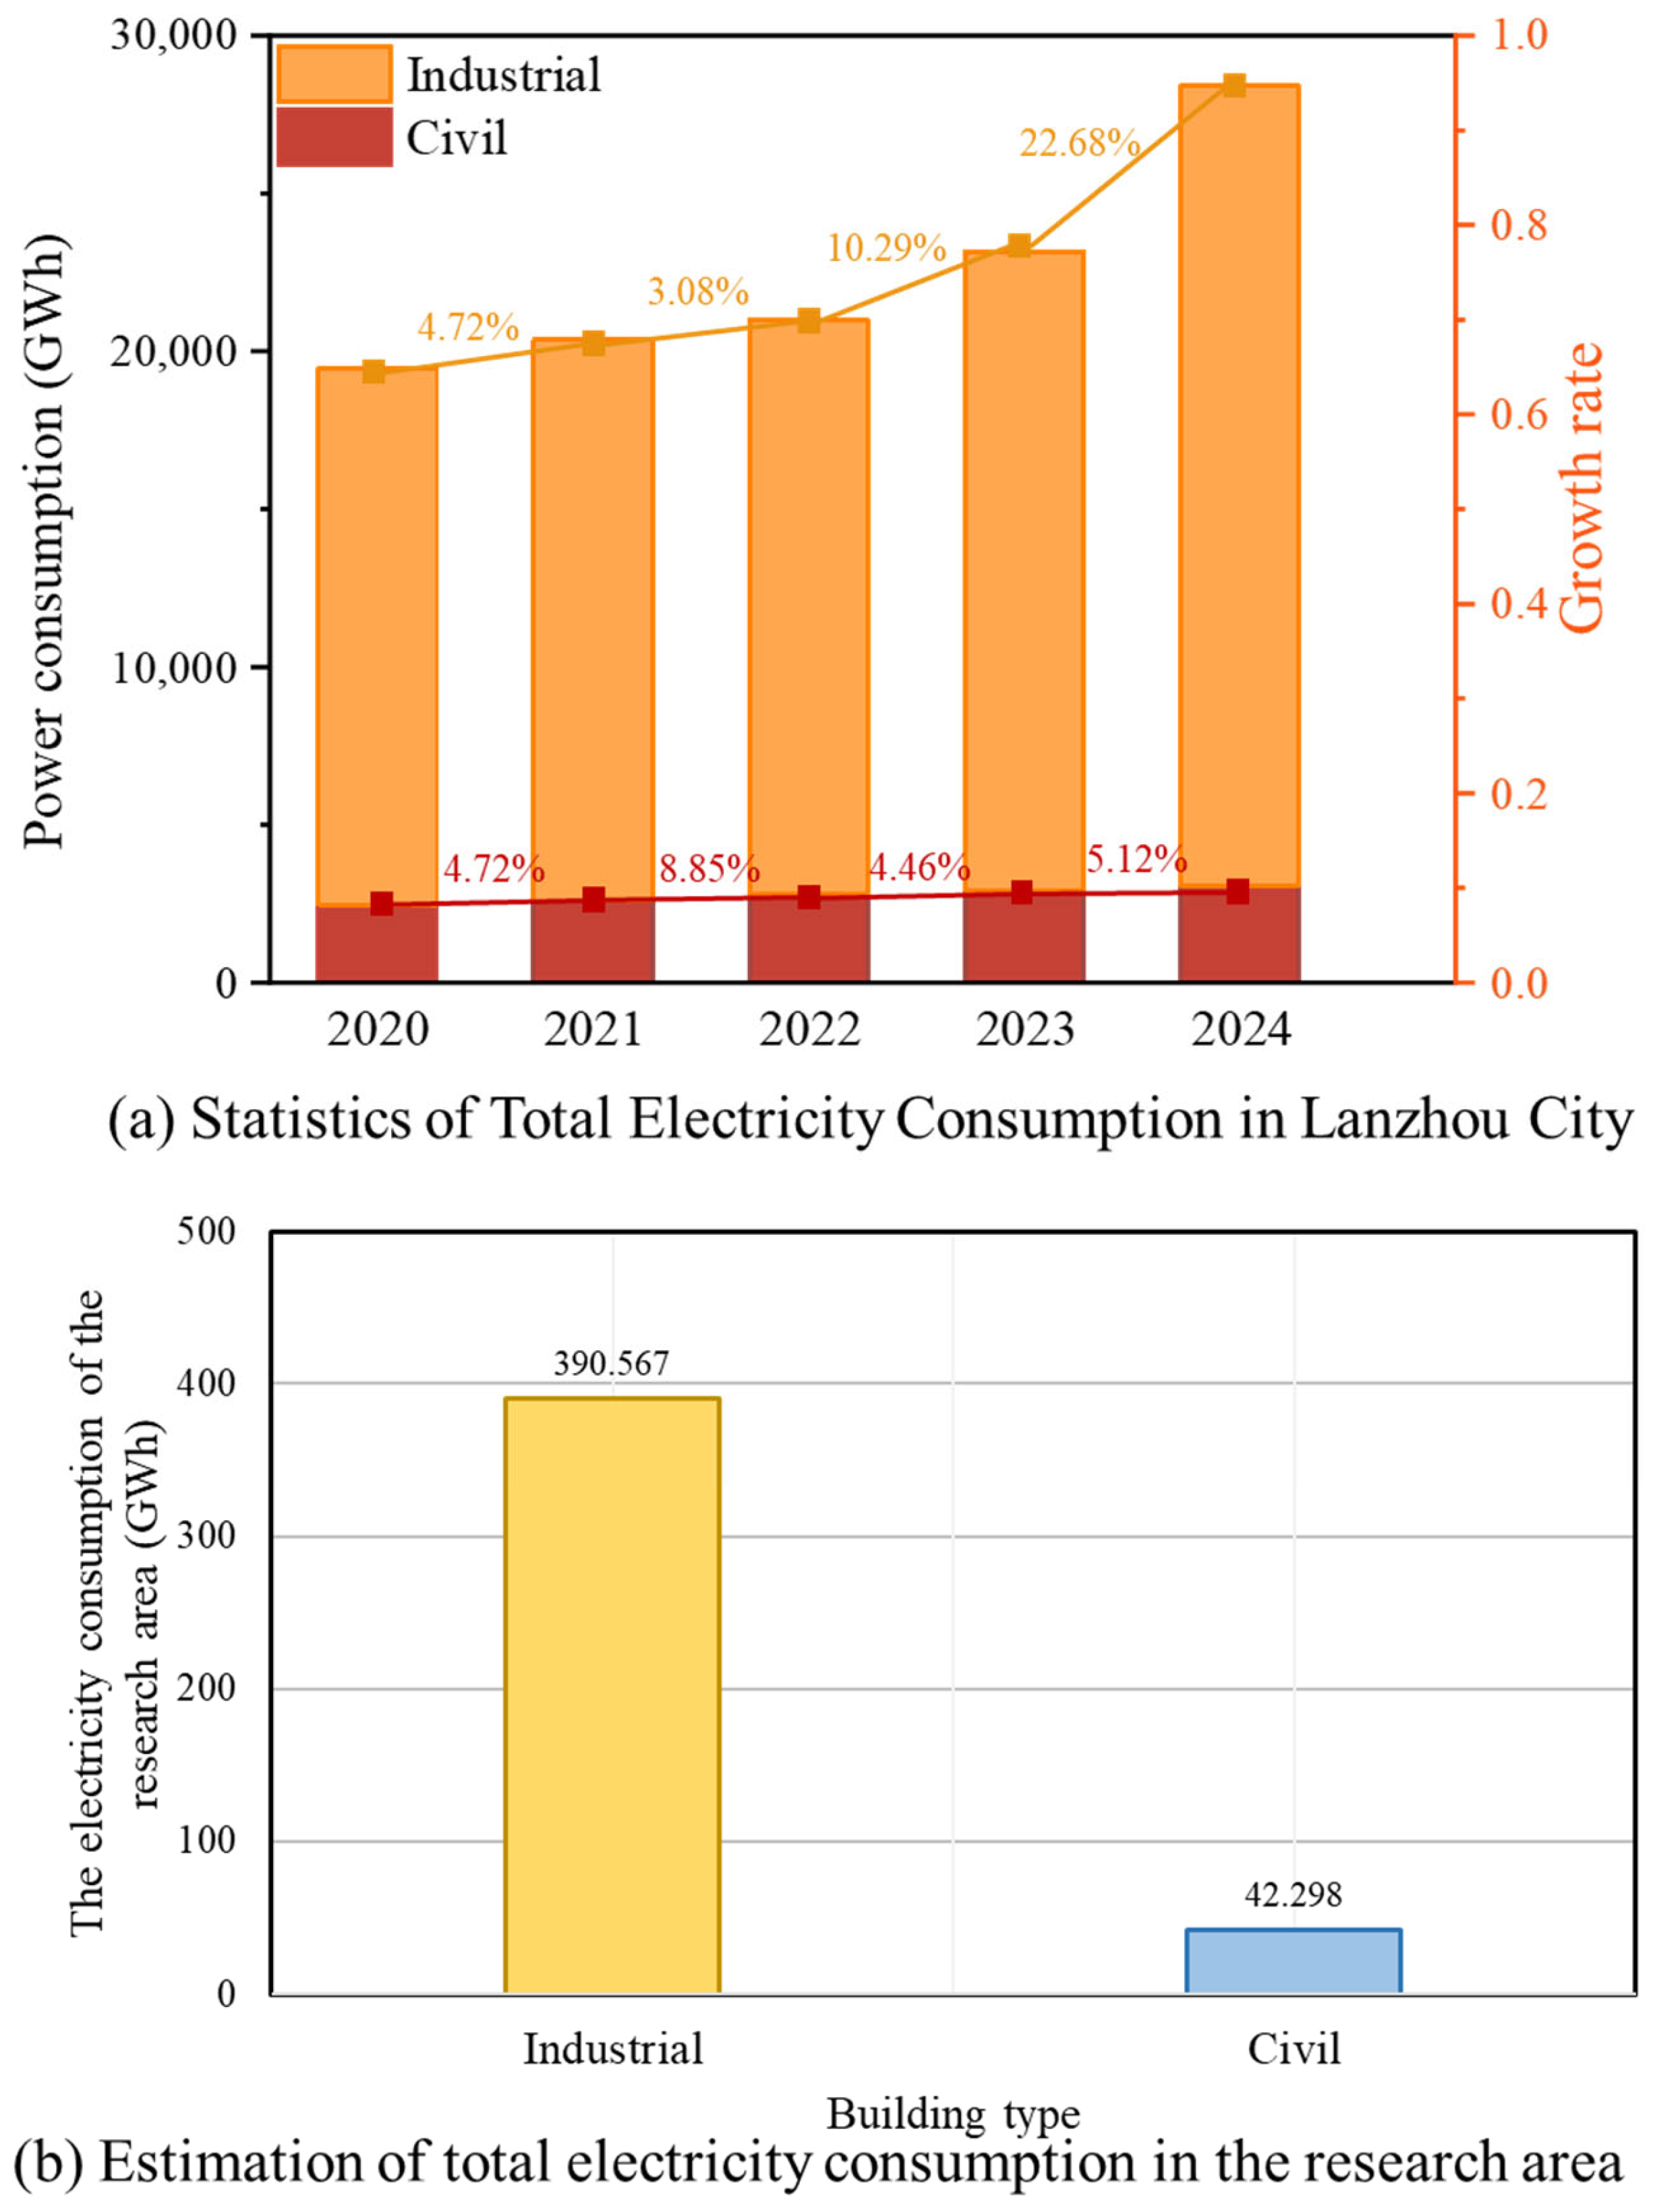
Figure 12a shows the total amount of industrial electricity consumption and residential electricity consumption in Lanzhou city in the past five years and the trend of change. In which the total amount of industrial electricity consumption is higher, its average value is about 22,473.35 GWh, higher than the average value of total residential electricity consumption of about 711.67%. The annual growth trend is also more obvious; the largest increase appeared in 2024, higher than the total amount of electricity consumption in 2023, by about 22.68%. The average increase in the last five years is about 10.19%; the growth rate is faster, indicating that Lanzhou New District has grown in the last five years. The level of industrialization is developing rapidly, so the electricity consumption is larger. The total amount of residential electricity consumption is low, with an average value of about 2768.76 GWh, and the annual growth trend is relatively flat, of which the largest increase occurs in 2022, compared with the total amount of electricity consumption in 2021, which is about 8.85% higher, and the average increase in the past five years is about 5.71%.
In order to more systematically and comprehensively analyze the direction of the implementation of solar PV programs in the research area, this paper is based on detailed annals data of Lanzhou, covering multiple dimensions such as population size, industrial development profile, and overall electricity consumption of the city. Considering the proportion of Lanzhou New District in the city’s population, the level of industrial development, and other information, this paper estimates the basic electricity demand of Lanzhou New District; specifically, the basic electricity consumption of Lanzhou New District mainly consists of industrial electricity and residential electricity consumption. According to the calculation results, the total electricity consumption of Lanzhou New District in 2024 is shown in
Figure 12b.
The industrial electricity consumption in the Lanzhou New District is more prominent, with an average of 390.567 GWh in 2024, while the residential electricity consumption is relatively low, with an average of 42.298 GWh in 2024. This reflects the high level of industrial development in Lanzhou New District, where industrial activities consume a large amount of resources. Therefore, for industrial buildings, it is more suitable to fully develop the application of solar PV strategies. Meanwhile, combining the results of the solar PV potential assessment of the research area in
Figure 8, for industrial buildings, the solar PV potential is able to satisfy 75.17% of the total annual electricity consumption of the industry. The solar PV potential of civil buildings is 5.28 times the total annual electricity consumption of the residents’ lives, which is more abundant through PV power generation.
In practical terms, considering the high level of industrialization in the research area, this not only means that there are large number of industrial buildings in the area but also indicates that industrial buildings have large roof areas and open spaces that are more suitable for the installation of solar PV systems. Considering that industrial buildings usually have high energy demand, by prioritizing the deployment of solar PV panels on them, these resource-rich spaces can be effectively utilized to generate clean energy, thus reducing reliance on traditional fossil fuels, lowering carbon emissions, and at the same time saving energy costs for businesses. In addition, the application of PV in industrial buildings can promote the sustainable development of the regional economy and the advancement of green energy technologies. Therefore, when planning and implementing solar photovoltaic projects, industrial buildings should be examined and developed as key objects to maximize their potential environmental and economic benefits.
Considering that civil buildings are usually more complex in structure and are often affected by factors such as shading effects, the potential for photovoltaic development is relatively limited, and it is necessary to make full use of existing resources through rational planning in order to promote sustainable regenerative development. For example, for commercial scenarios, including office buildings, commercial centers, and other areas, taking into account their often greater demand for electricity and the fact that the building roof area is relatively large, residential buildings should give priority to promoting the development of building roof photovoltaics in such scenarios. For residential buildings, the installation and deployment of photovoltaic panels should be planned reasonably, taking into account the relevant policies of the local government and the actual demand. For old buildings and other buildings that may not have the conditions for installing photovoltaic panels, the installation and planning of photovoltaic panels will not be considered. At the same time, taking into account that the potential of solar PV in civil buildings far exceeds the total annual electricity consumption of residents, the actual application does not need to fully develop the roof area of civil buildings, which needs to be combined with the actual application needs and relevant government policy considerations in order to plan for the application of photovoltaics in civil buildings according to the demand. During periods of high solar resource availability (typically when peak irradiance exceeds 800 W/m2 during daytime hours), excess electricity generated by photovoltaic power systems can be stored using high-efficiency energy storage devices. This stored energy can then be released during periods of low irradiance (such as at night or on cloudy days), thus effectively enabling the temporal and spatial transfer of electricity to enhance system stability.
Overall, the comprehensive promotion of solar photovoltaic application strategy can basically satisfy the basic electricity demand in the research area, thus saving a large amount of resources and promoting sustainable regenerative development in order to synchronize the development of the local economy. In the future development of renewable energy in Lanzhou New District, solar energy application planning needs to consider the following three aspects simultaneously:
(1) For urban energy planning, it is necessary to balance regional solar energy resources and regional consumption capacity. The Lanzhou region has long hours of sunshine and abundant solar energy resources, which are suitable for the development of distributed and centralized photovoltaic projects. While considering the potential of regional solar photovoltaic energy, it is also necessary to consider the actual layout of regional energy storage facilities and electricity consumption capacity.
(2) Regarding relevant policies, it is necessary to ensure the consistency of regional standards and improve the detailed regulations for the grid connection of distributed photovoltaic systems. At the same time, photovoltaic installation policies should be considered, taking into account actual economic viability and technical compatibility.
(3) The sustainable development contribution of rooftop photovoltaic systems depends on lifecycle management. In practical applications, it is not only necessary to consider the load capacity of rooftop photovoltaic systems but also to address recycling issues.
4.4. Shortcomings and Prospects
This paper evaluates the regional solar photovoltaic (PV) potential through simulation calculations using deep learning methods and analyzes the characteristics of regional solar PV applications from a variety of perspectives. The results of this paper can provide scientific guidance and planning suggestions for urban PV application, which can promote the development of regional solar energy application, improve the utilization efficiency of renewable energy, and promote regional renewable development. However, this paper is based on a large number of satellite images for simulation and evaluation, so there are still some limitations that need to be further analyzed in detail and optimized in the future.
First, this paper classifies and evaluates the building types based on the underlying building types, and the classification of building types can be refined in future research to discuss the impact of the diversity of building roofs and the distribution characteristics of their roof obstacles on the available roof area. Second, this paper combines solar radiation from open-source data for solar potential assessment. The accuracy of solar PV potential prediction can be further improved in future research by modeling regional solar irradiation intensity and considering the influence of building shadow shading effects. Finally, this paper combines the data related to regional annual electricity consumption to provide reasonable suggestions for regional PV planning. In the future, the development direction of rooftop PV applications can be considered in combination with the economic analysis of PV deployment, and the development direction of rooftop PV applications can be comprehensively analyzed from multiple perspectives.
5. Conclusions
This paper takes a typical area in the Lanzhou New District as an example, identifies the available area of urban rooftops through a deep learning image identification method, and realizes the evaluation of regional solar PV potential on a large scale by combining the local solar radiation data. And combined with the data related to the annual electricity consumption in Lanzhou city, the application analysis was carried out with the categories of industrial buildings and civil buildings, and the comprehensive analysis results provide scientific guidance and data support for the regional solar photovoltaic planning, and the research area of this paper is summarized as follows.
(1) The average maxFβ value of area roof area identification by deep learning method is higher than 0.84, among which the industrial buildings have higher identification accuracy with a maxFβ value of 0.889, and the identification maxFβ value of civil buildings reaches 0.846. The MAE value of the identification error judgment is less than 0.09 for both types of buildings.
(2) By comprehensively considering the area of roof-mounted PV panels and the efficiency of energy conversion, the predicted results of regional solar PV potential show that industrial buildings have higher solar PV potential, with 62.84% of roof-mounted PV panels and an effective value of 293.602 GWh of electricity, while the solar PV potential of civil buildings is relatively low, with 51.24% of roof-mounted PV panels and 223.198 GWh of electricity conversion. At the same time, the industrial buildings contain a larger number of high-potential areas, with the high-potential area accounting for 32.3%, while the high-potential area accounting for civil buildings only accounts for 19.42%. Therefore, industrial buildings are more suitable for the priority development of urban rooftop solar PV.
(3) Combined with the annual electricity consumption data of the cities in the research area, the industrial category of electricity consumption is more prominent, and its total electricity consumption in the last five years is higher than the residential electricity consumption by an average of about 711.67%. When considering the application of urban PV planning, priority should be given to the PV planning and development of industrial buildings, and the power provided by the rooftop PV potential of industrial buildings can cover 75.17% of industrial electricity consumption. For the PV planning and development of civil buildings, it needs to be combined with the actual demand for electricity and the government’s relevant policies for collaborative development.
