
Approaching a Nearly Zero Energy Building Integrated with PCM by Optimization of Energy Sources


Abstract
1. Introduction
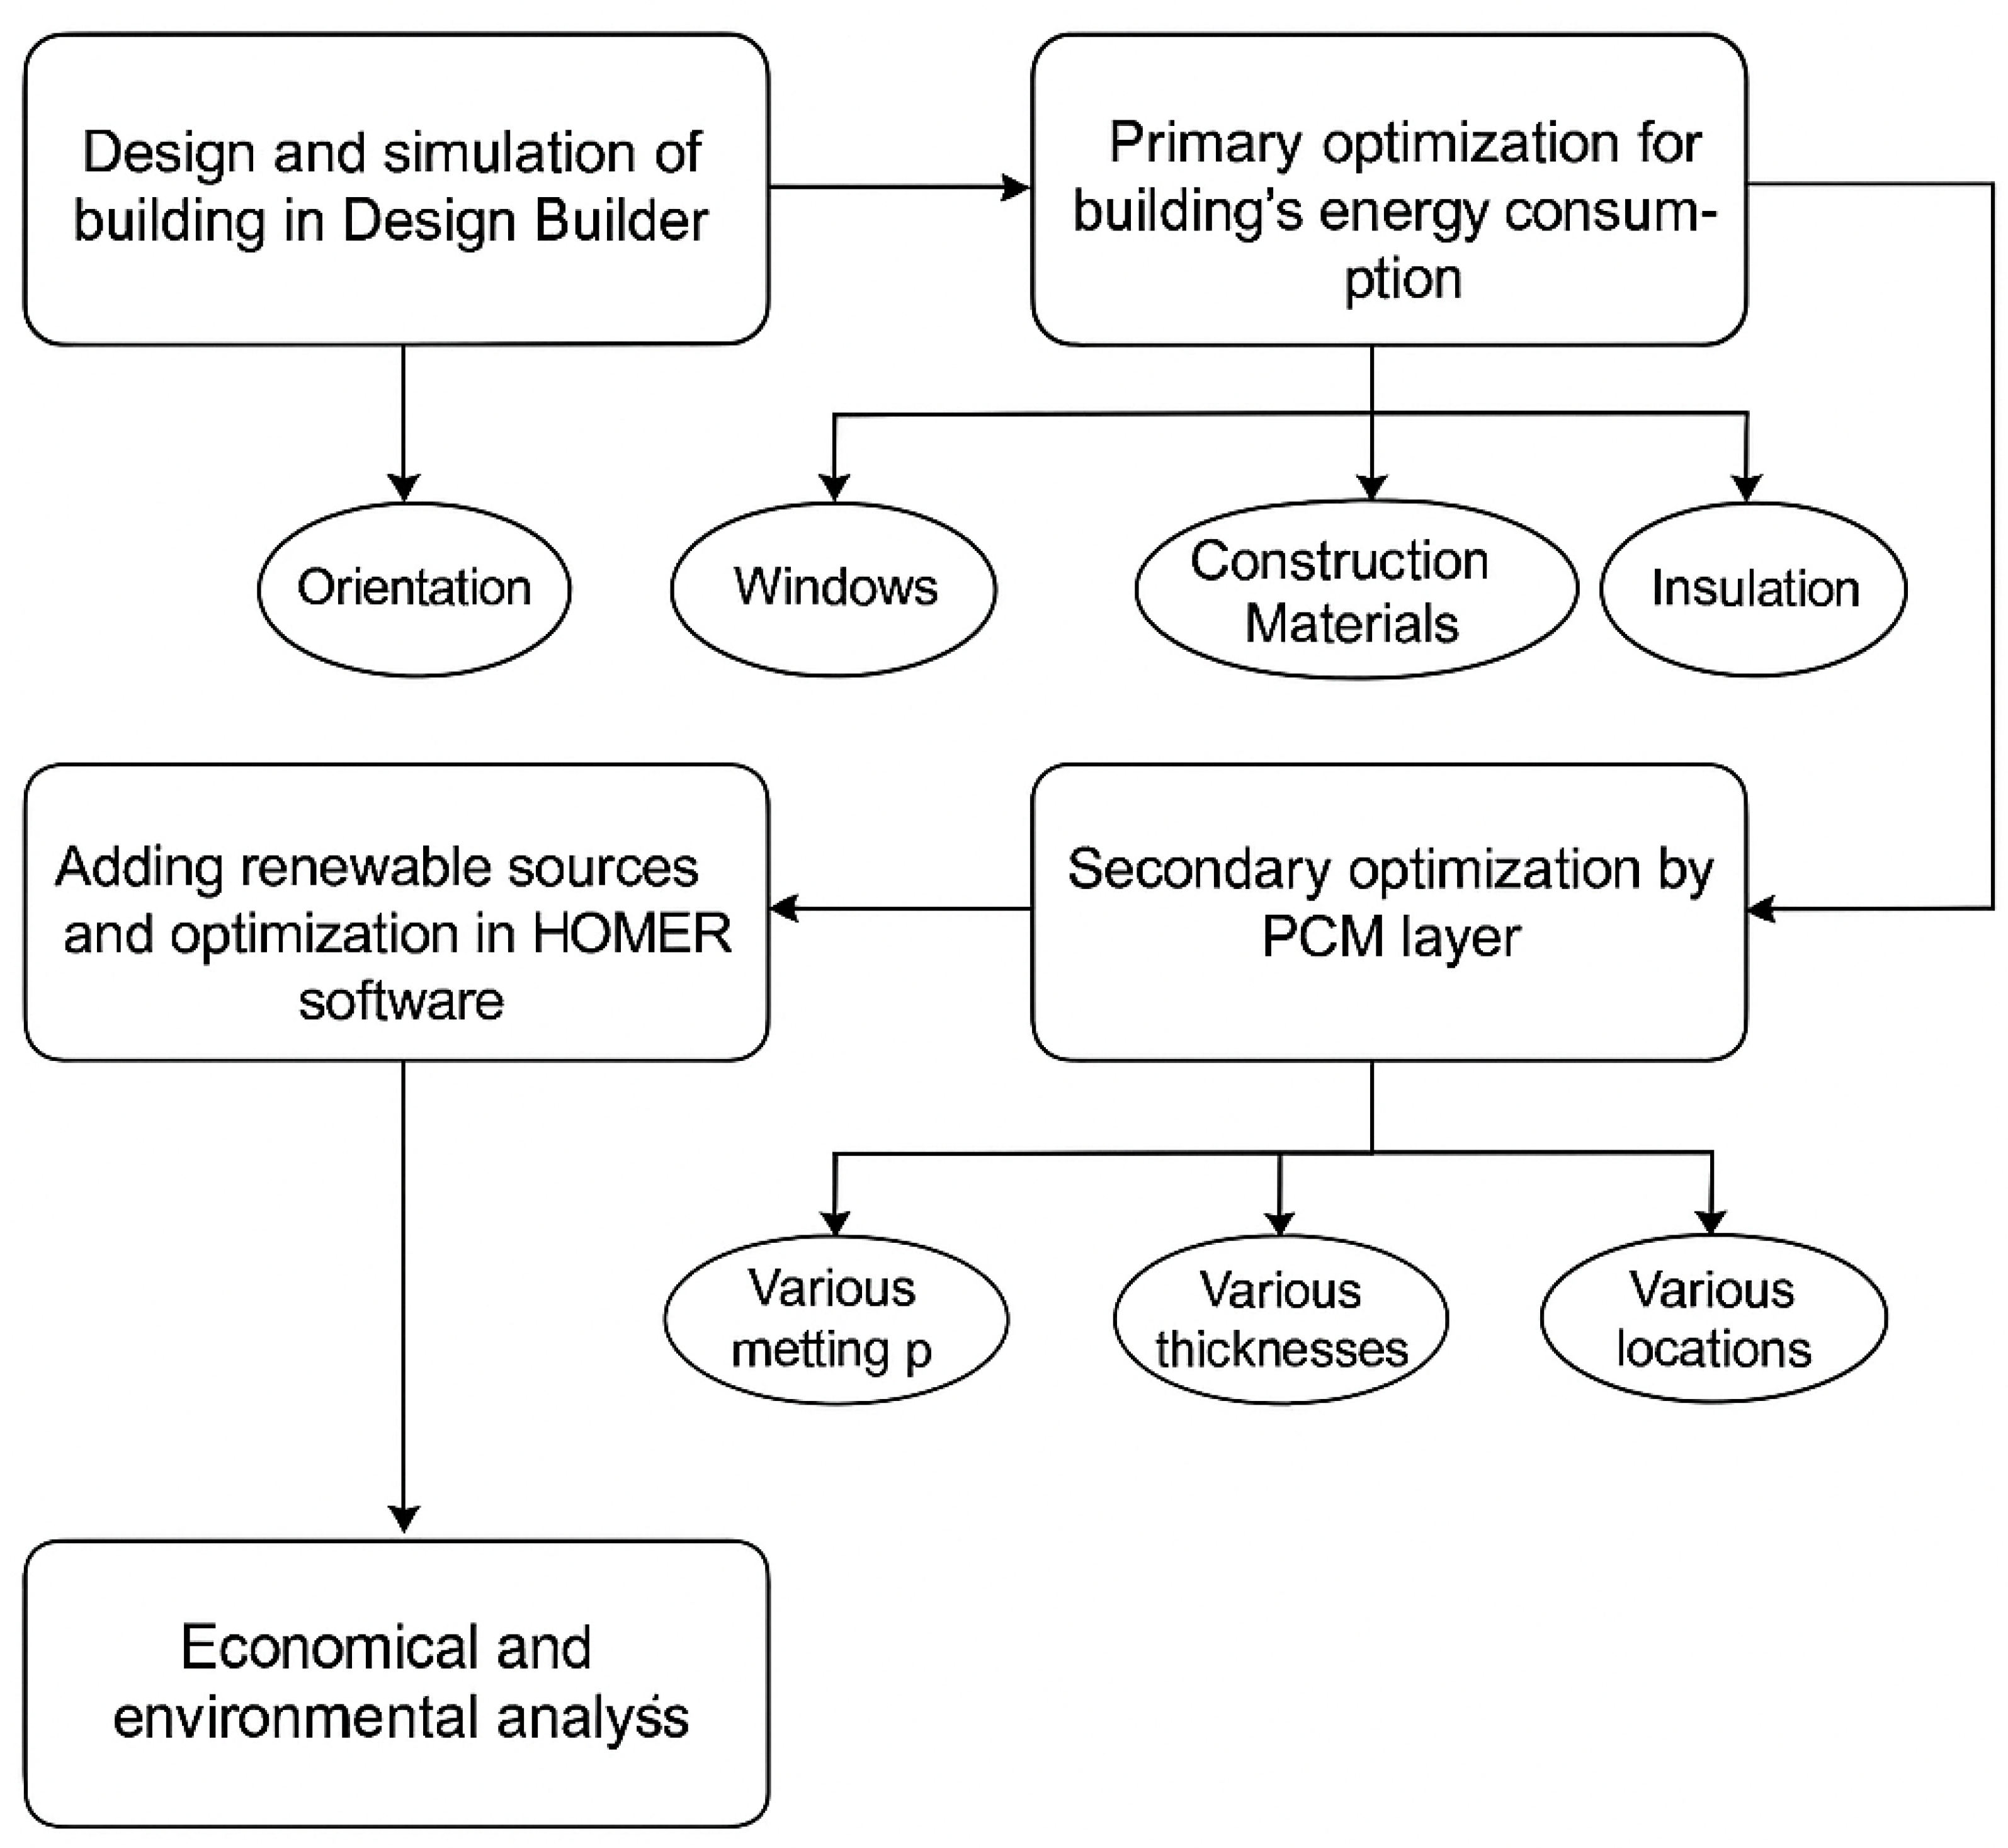
2. Methodology
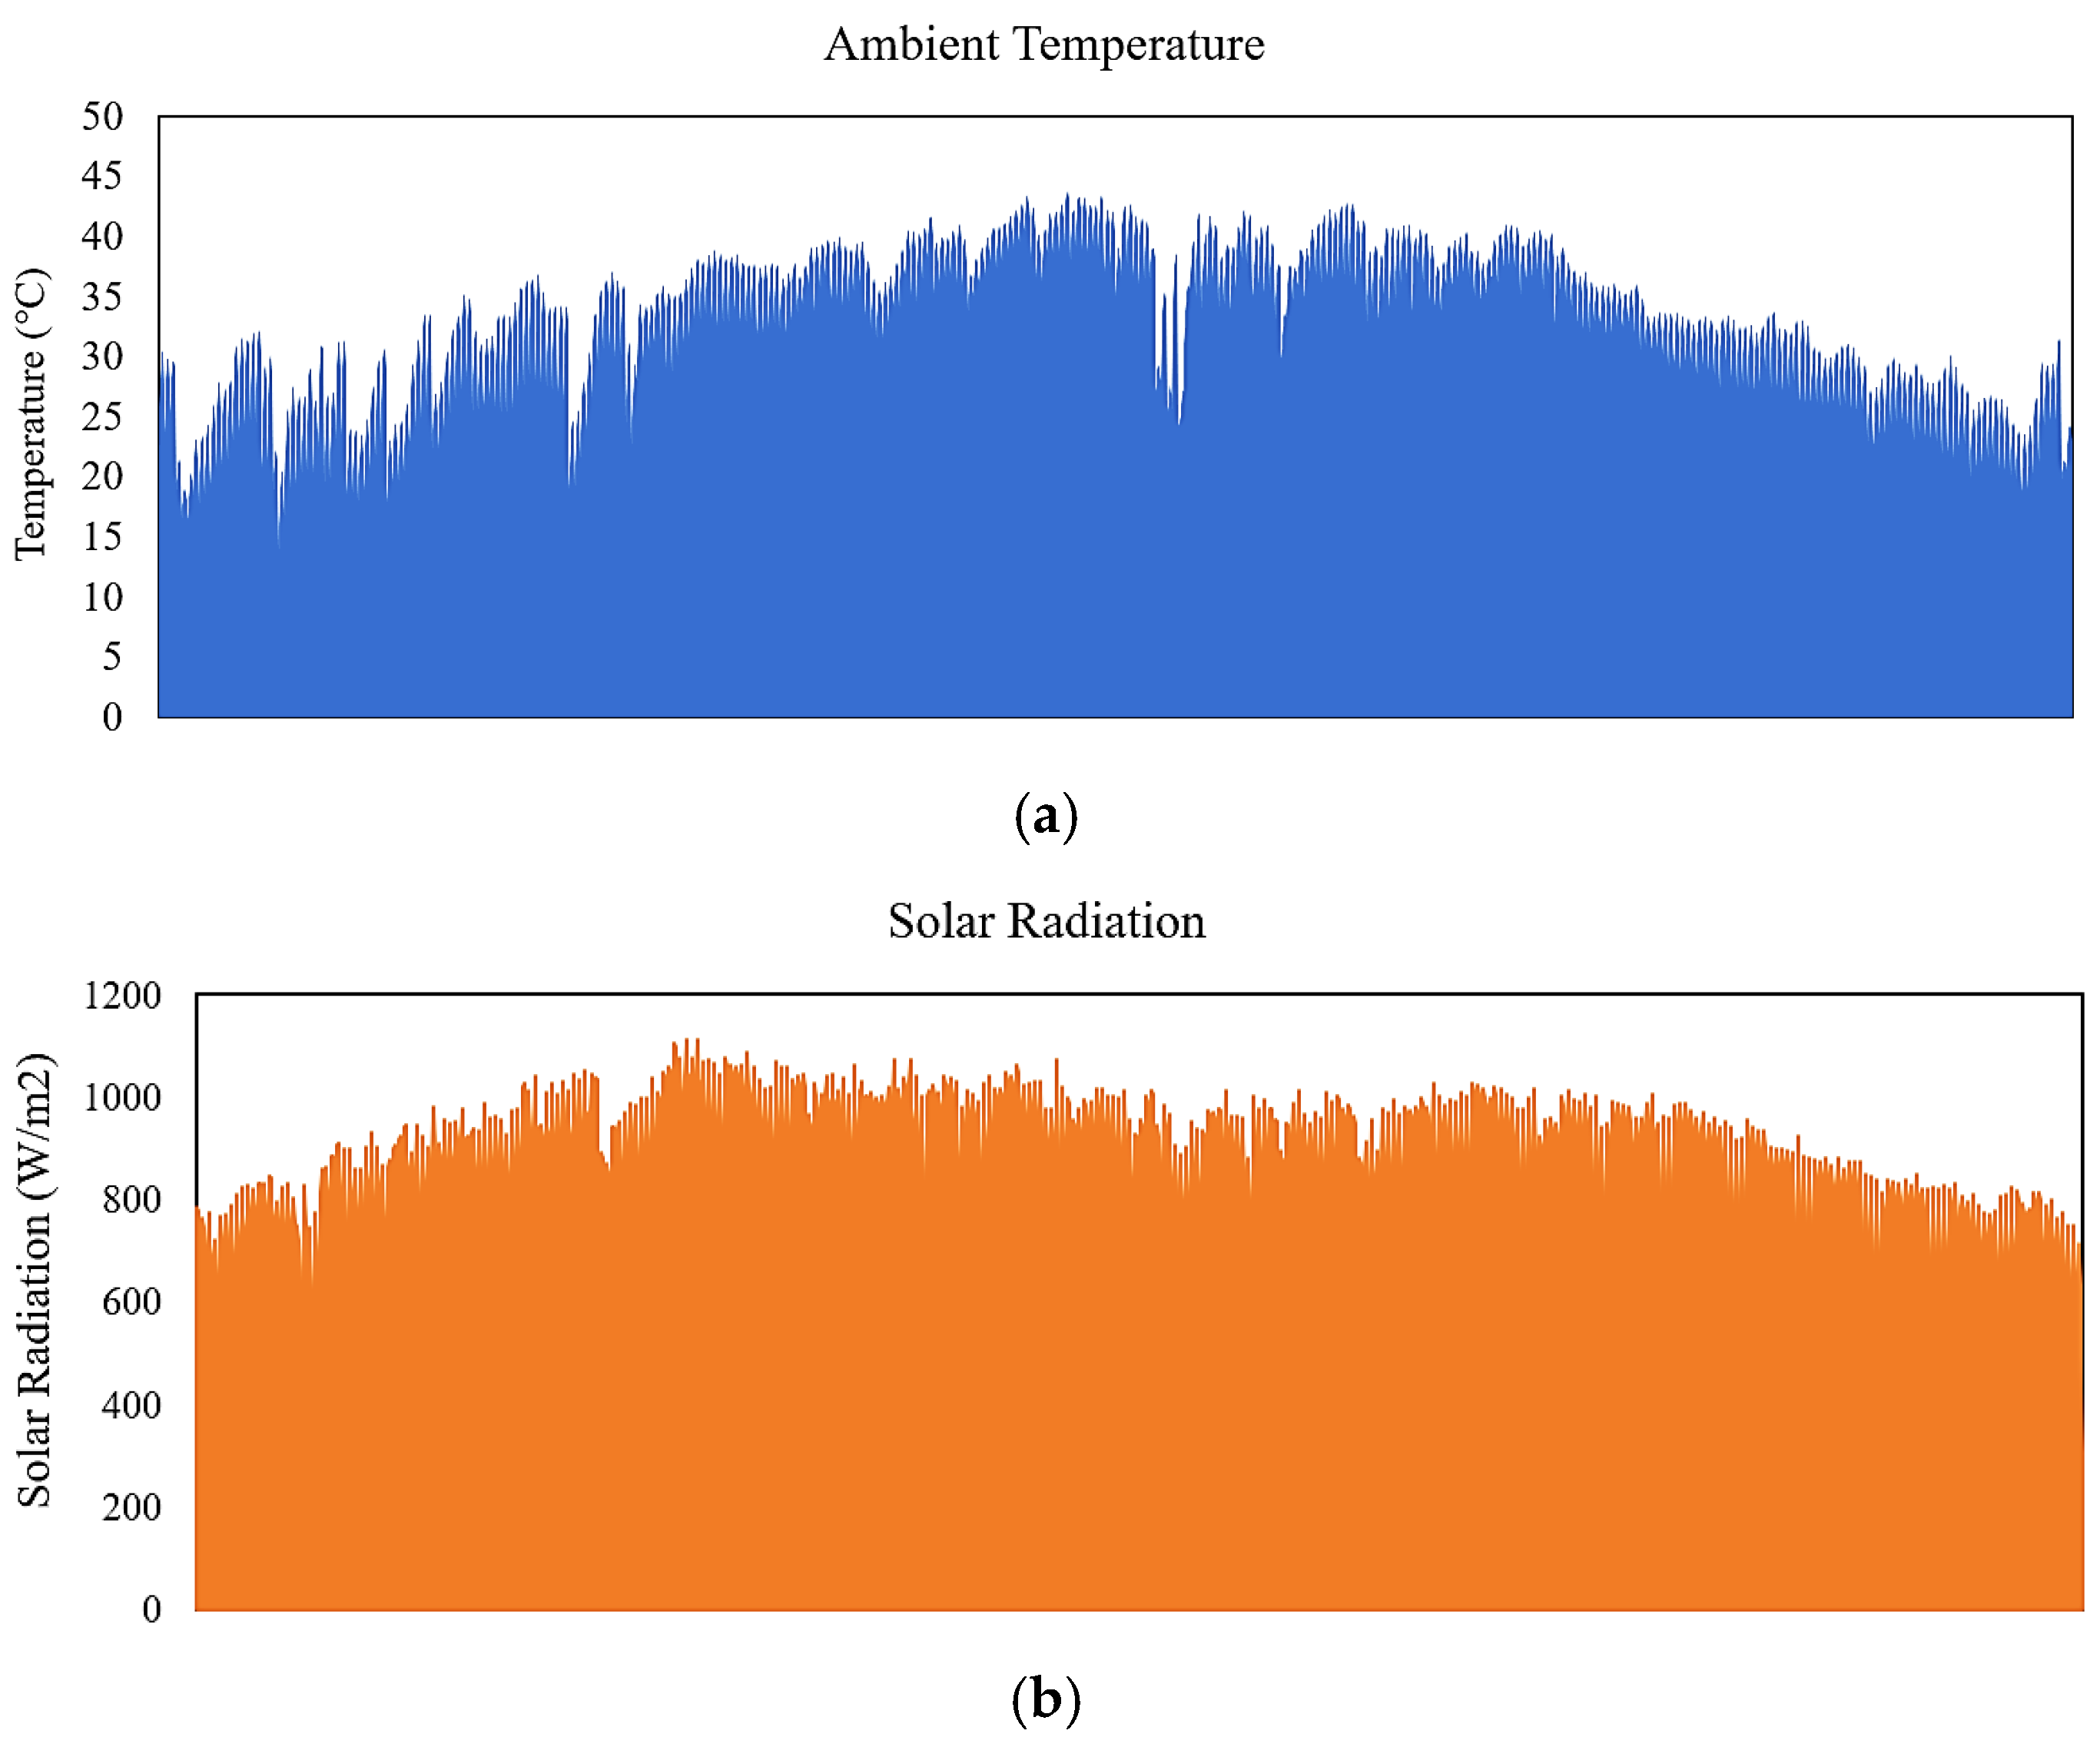
2.1. Geographical and Climatic Conditions
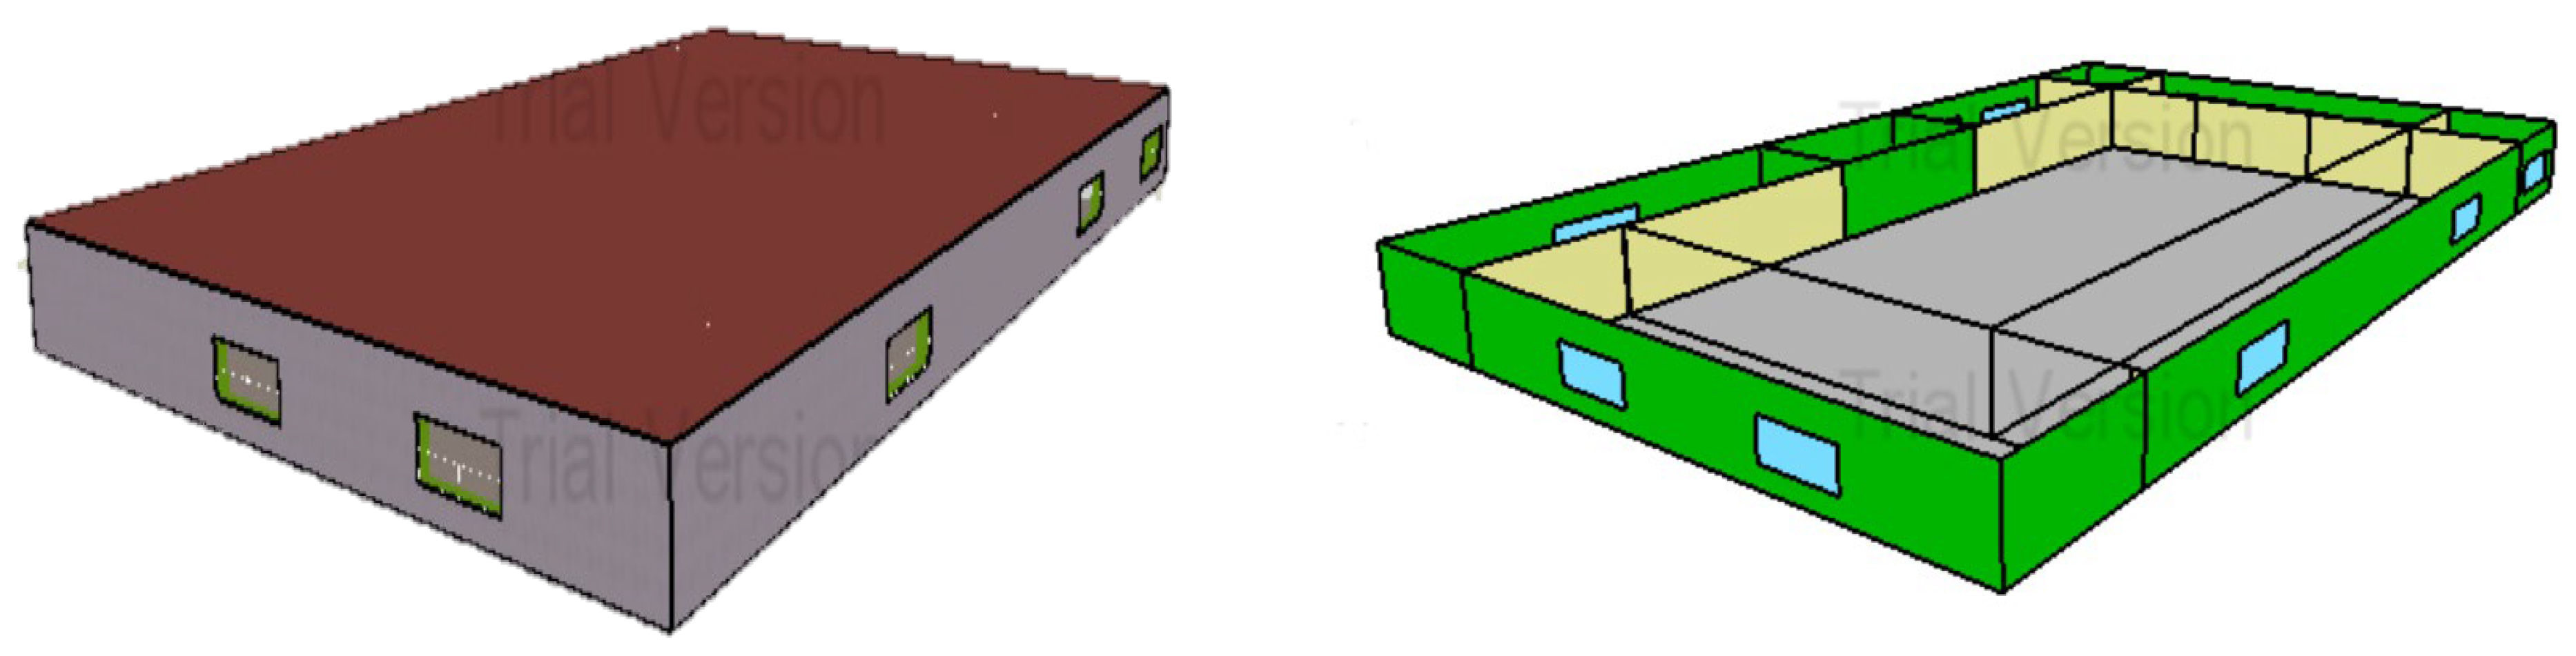
2.2. Design Builder Software
2.3. Building Components
2.4. Energy Saving Scenarios
- First Scenario
- Second Scenario
- Third Scenario
2.5. Mathematical Equations of Design Builder Software
- The PCM parameters in liquid and solid states are varied from each other.
- The effect of natural convection in the PCM’s melting process is neglected.
- The ambient heat loss is ignored.
- The one-dimensional airflow and two-dimensional heat transfer from PCM are assumed.
- The symmetrical heat transfer between PCM and air is considered.
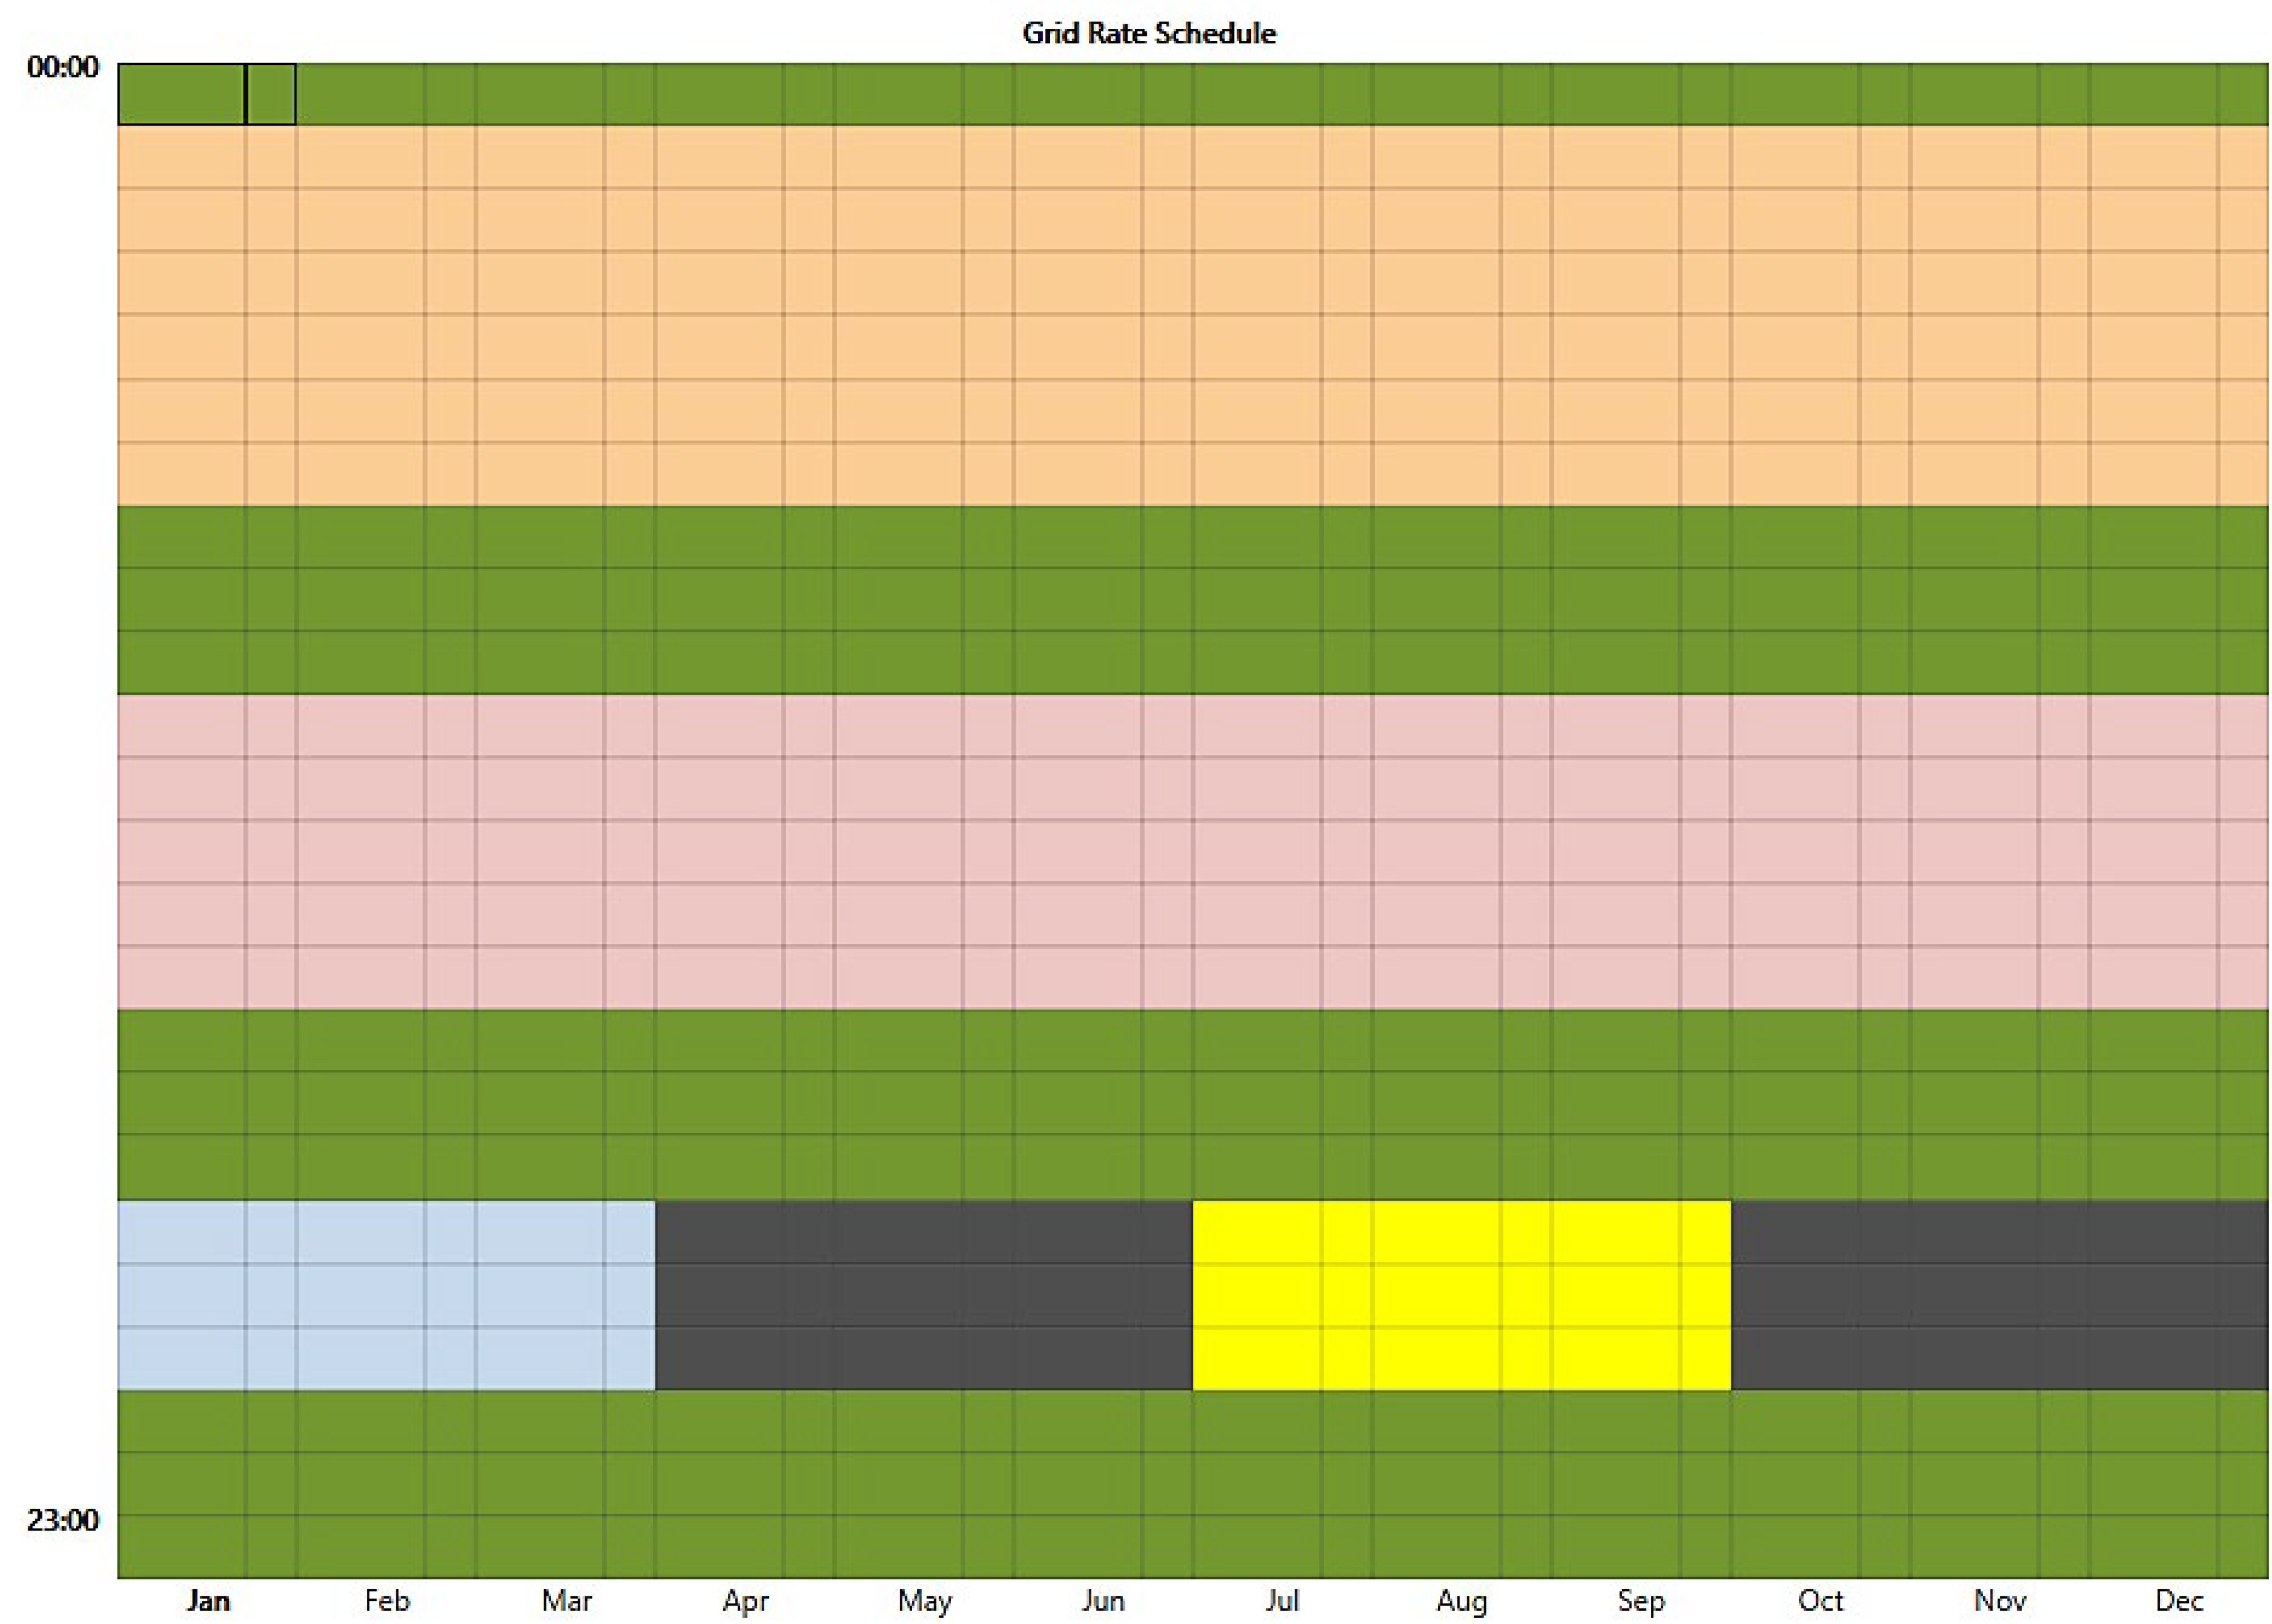
2.6. HOMER Software
2.7. HOMER Optimization
2.8. Mathematical Equations of HOMER Software
3. Results and Discussion
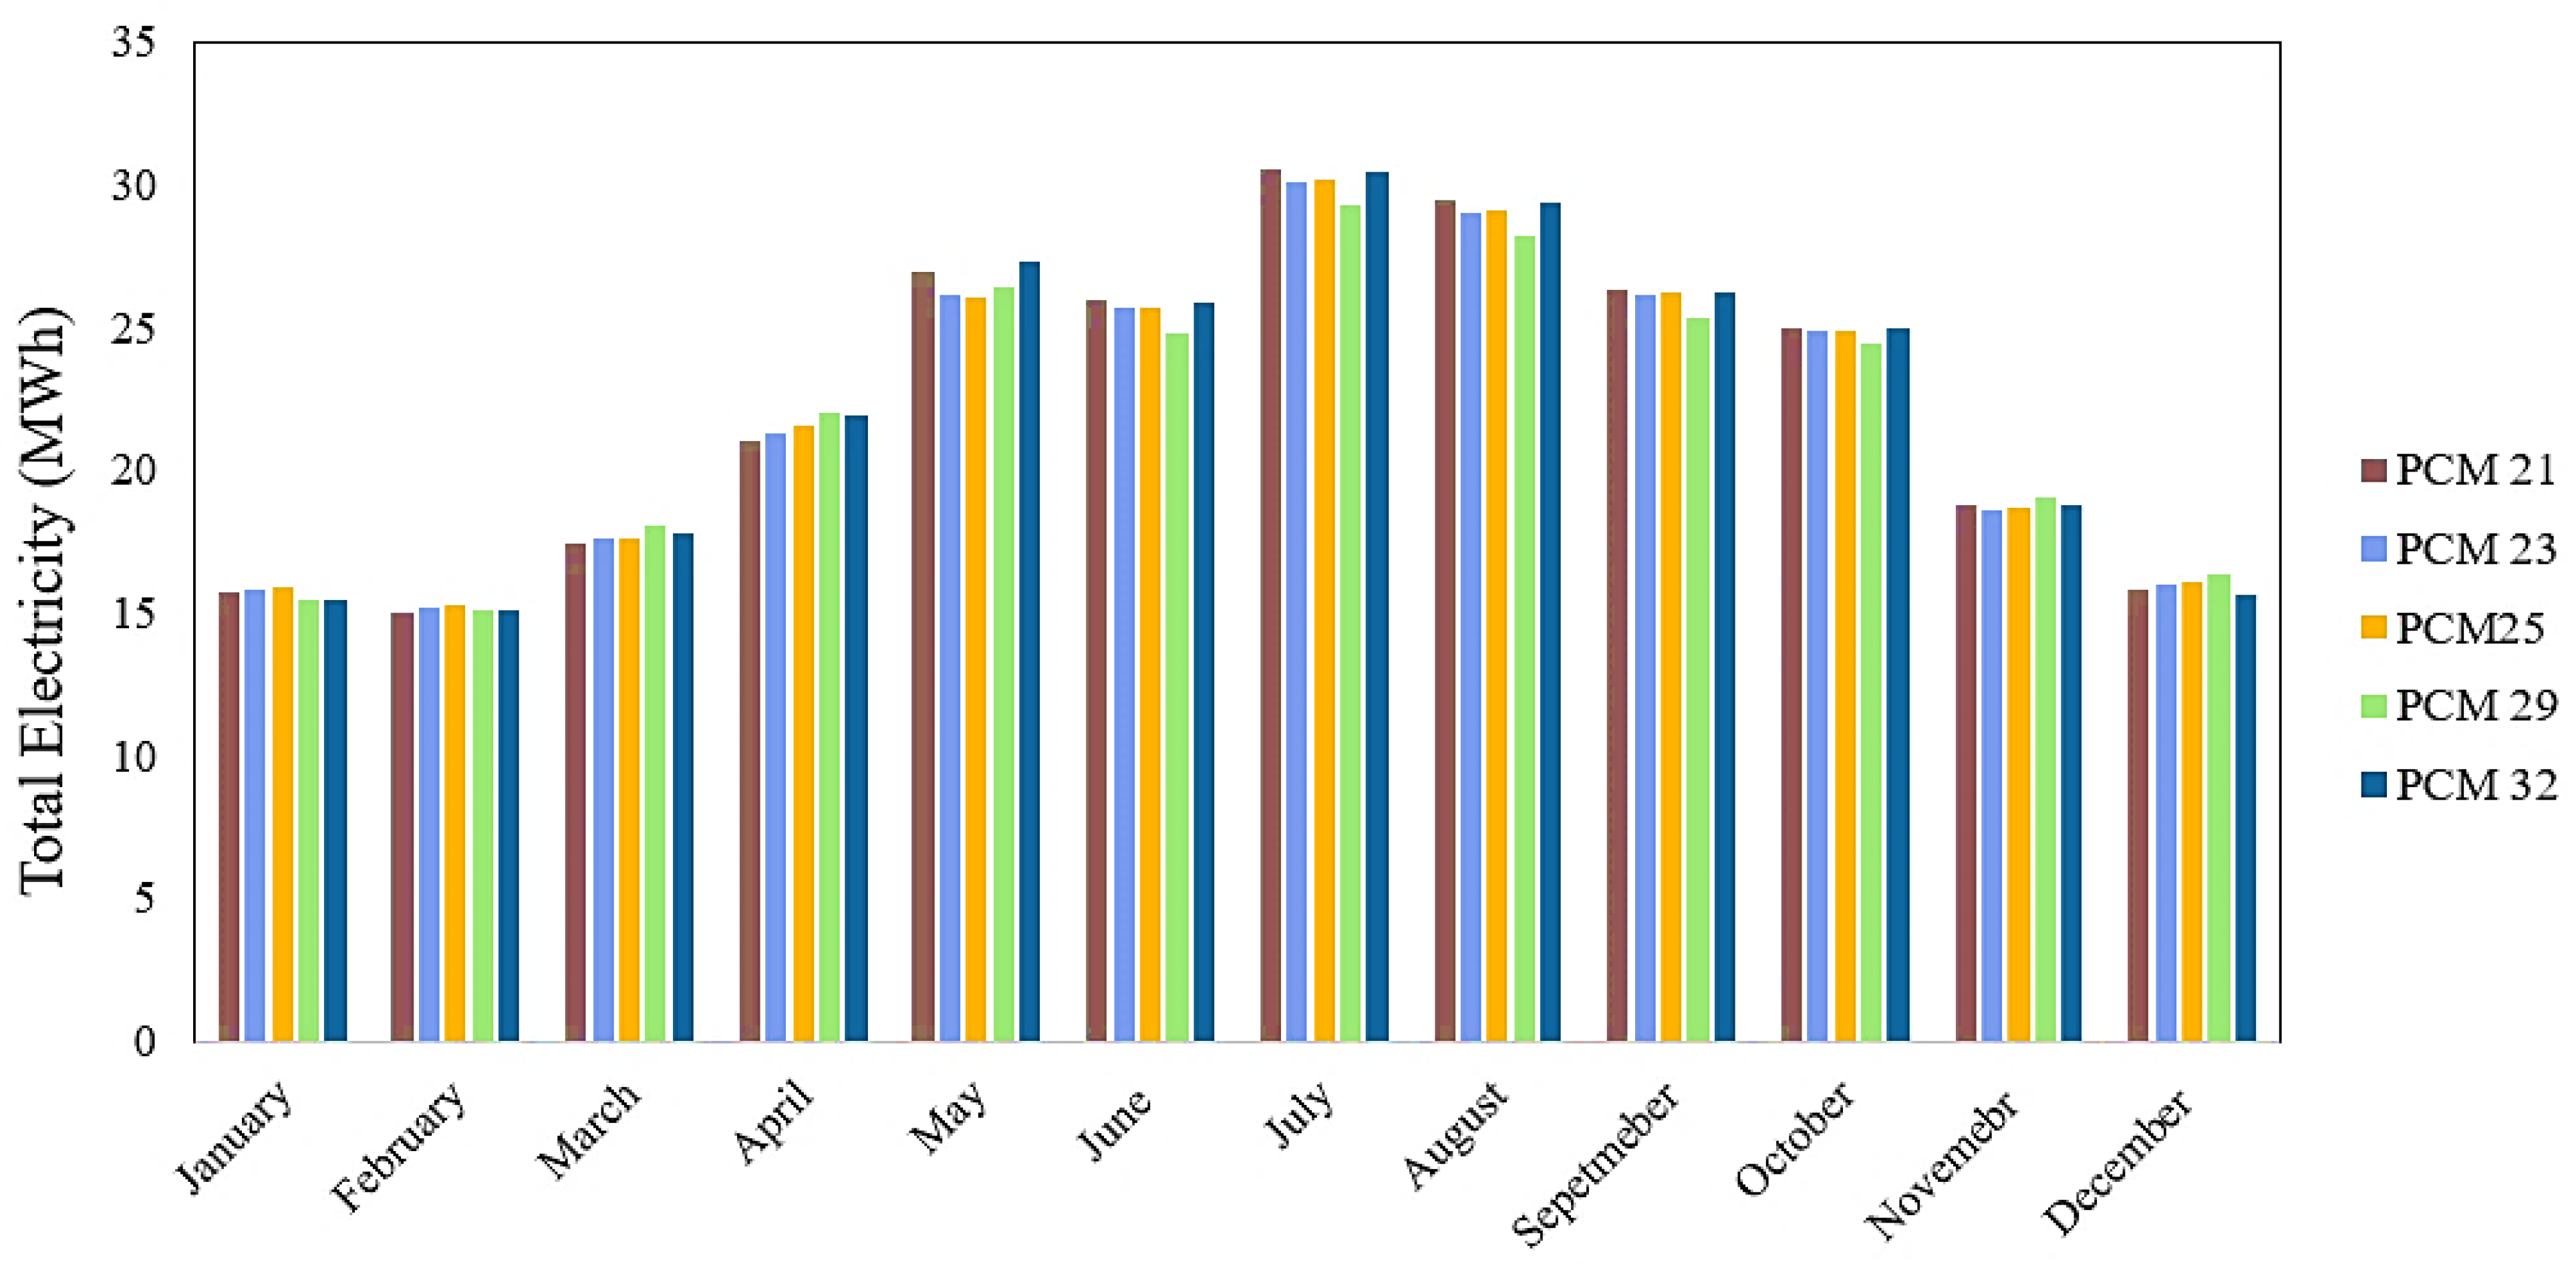
3.1. Design Builder Results
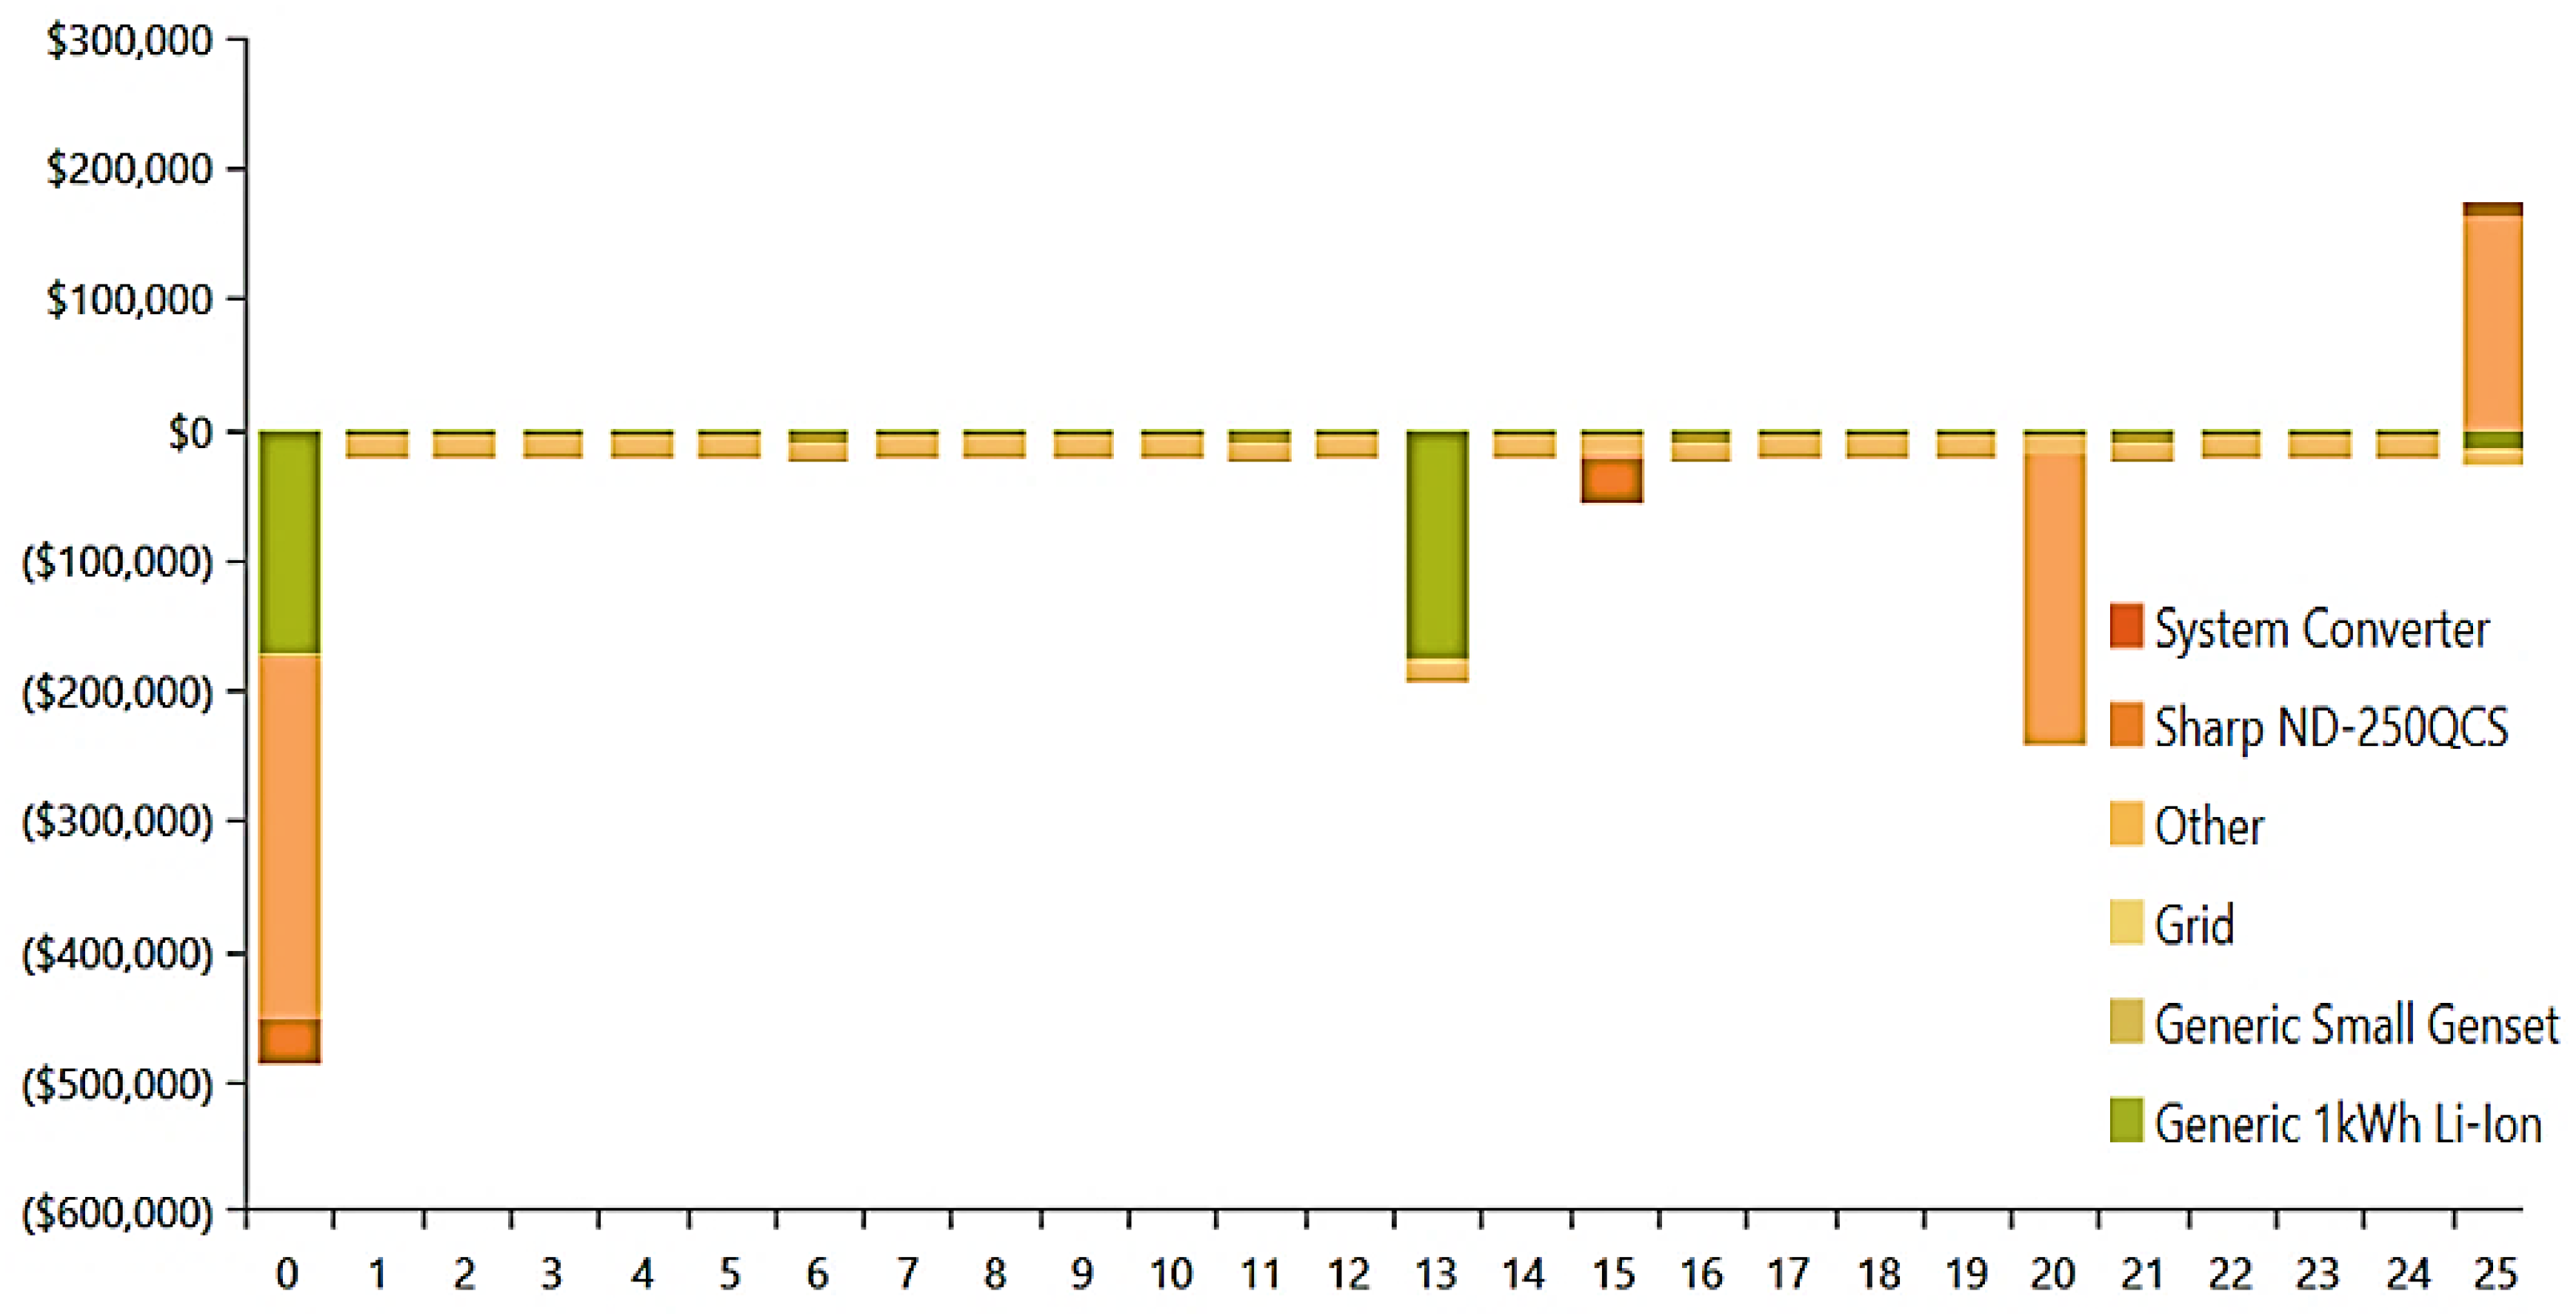
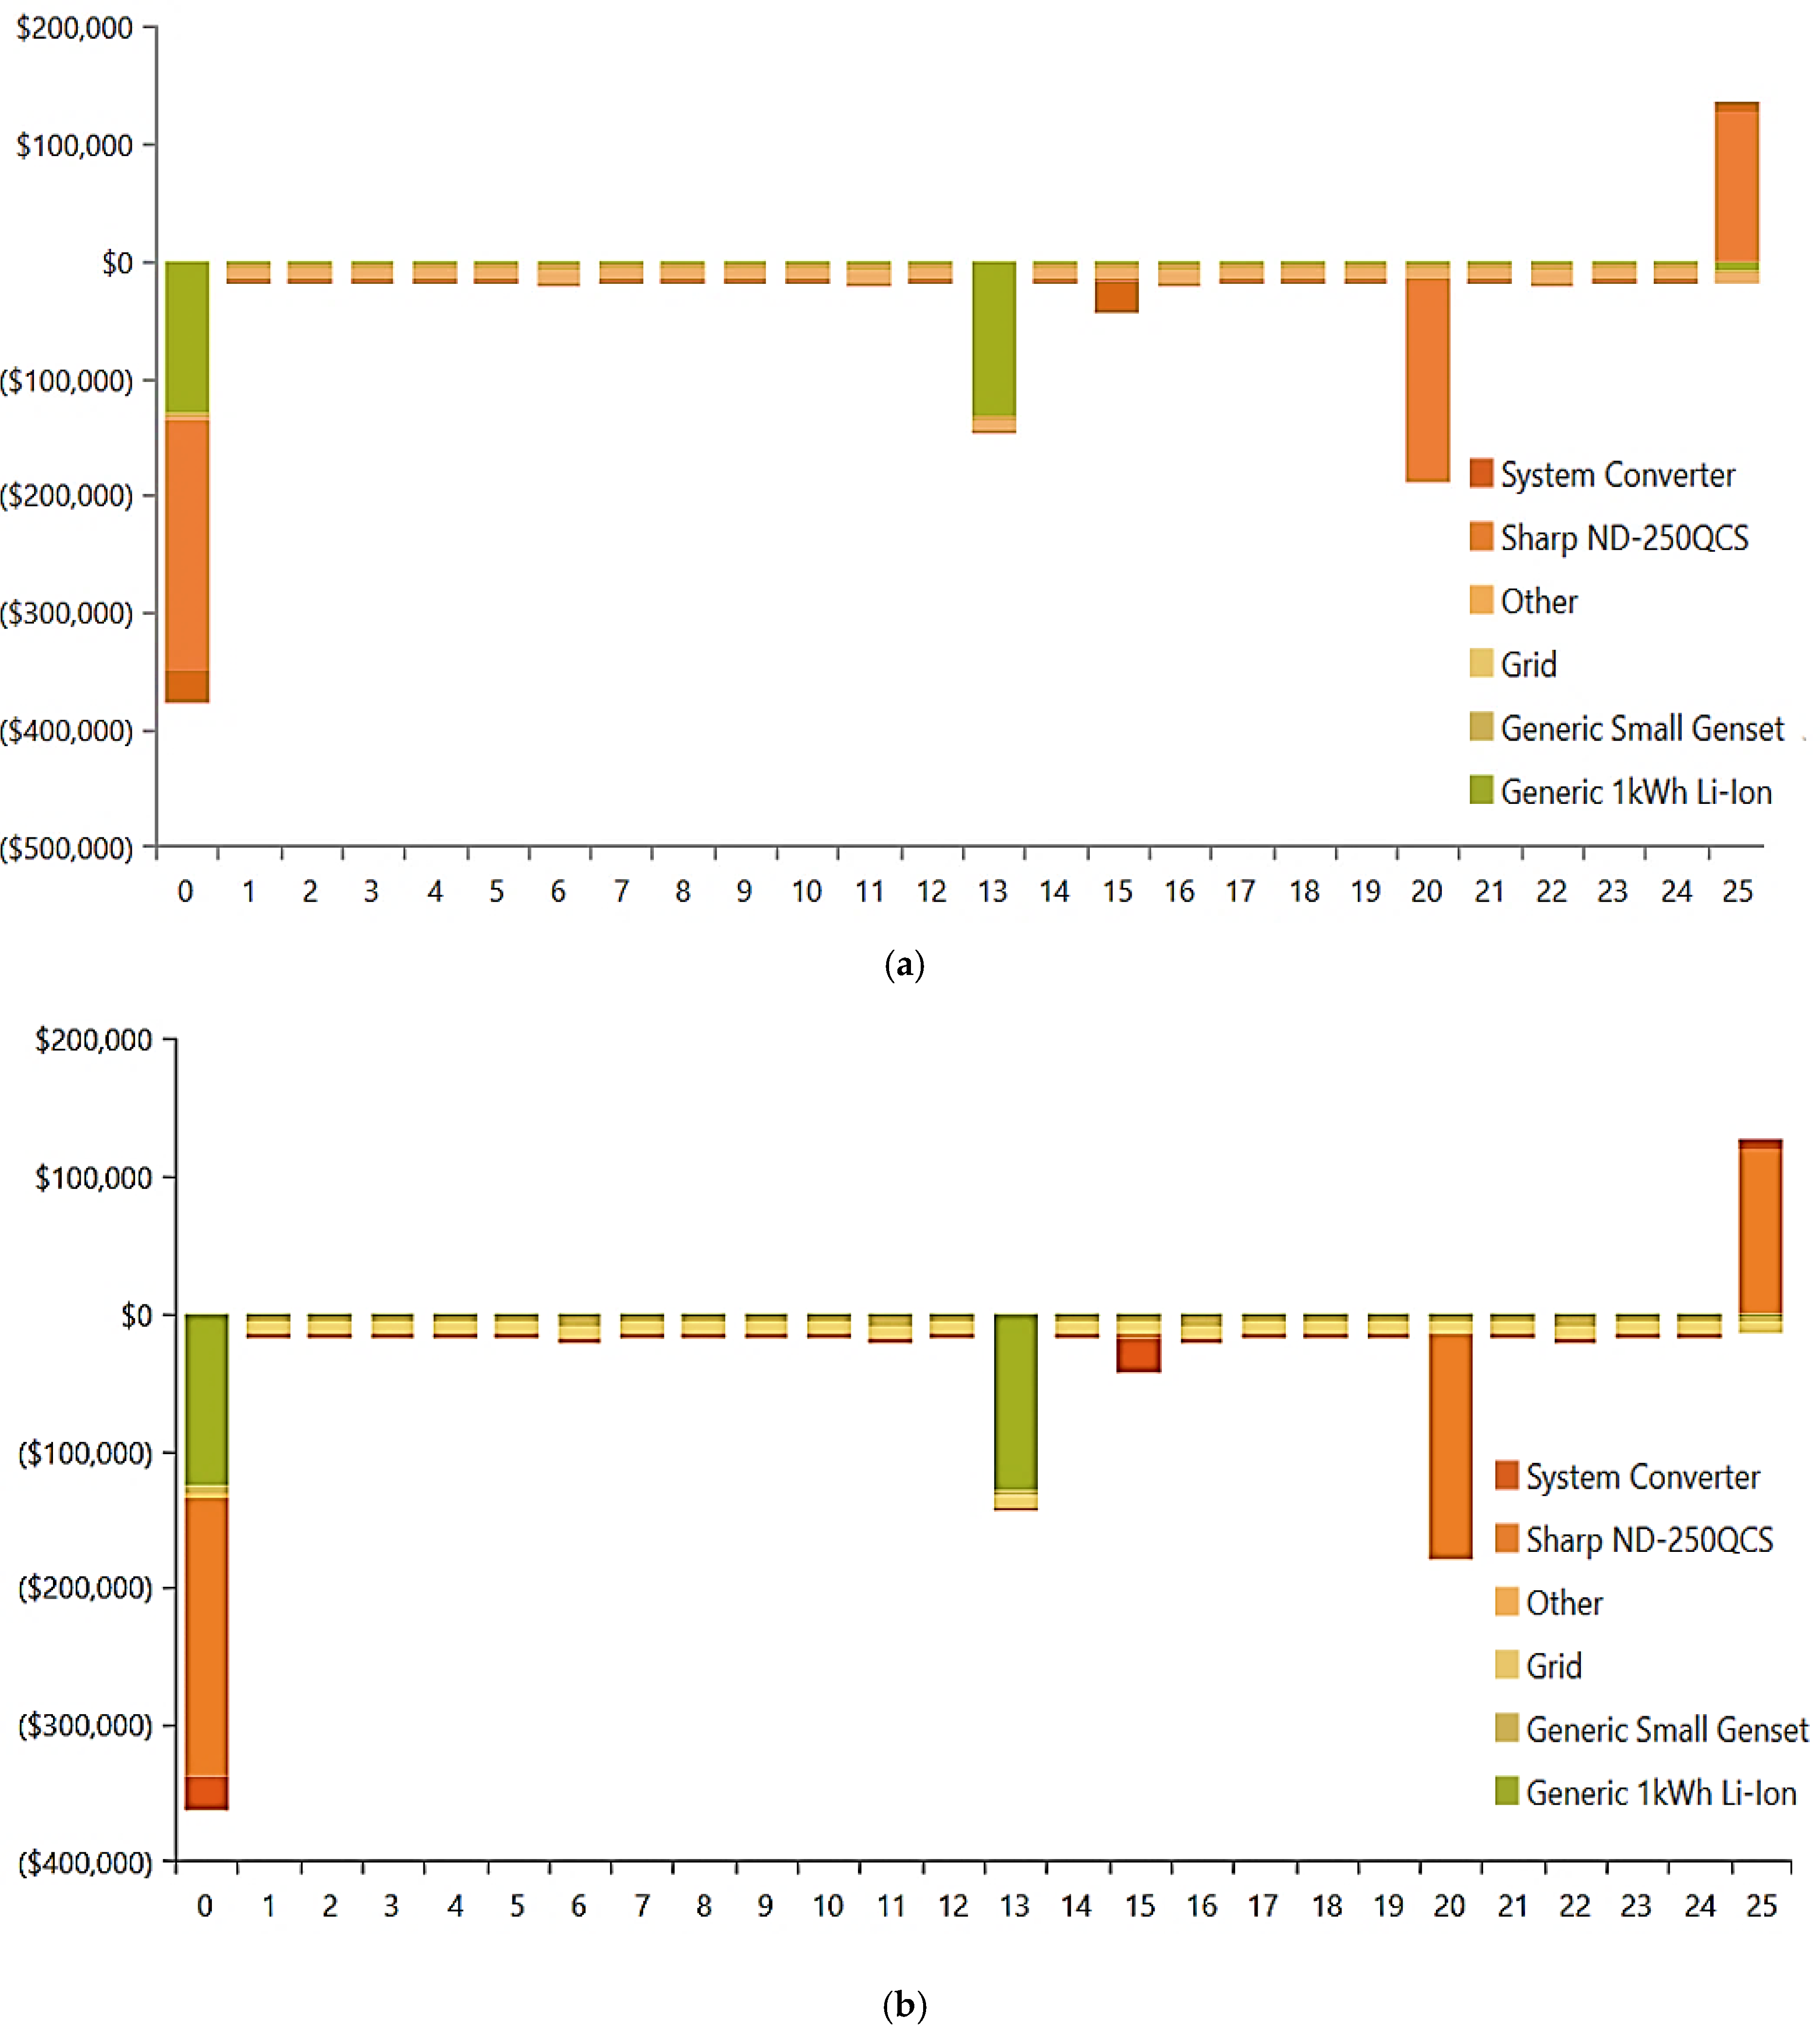
3.2. HOMER Results
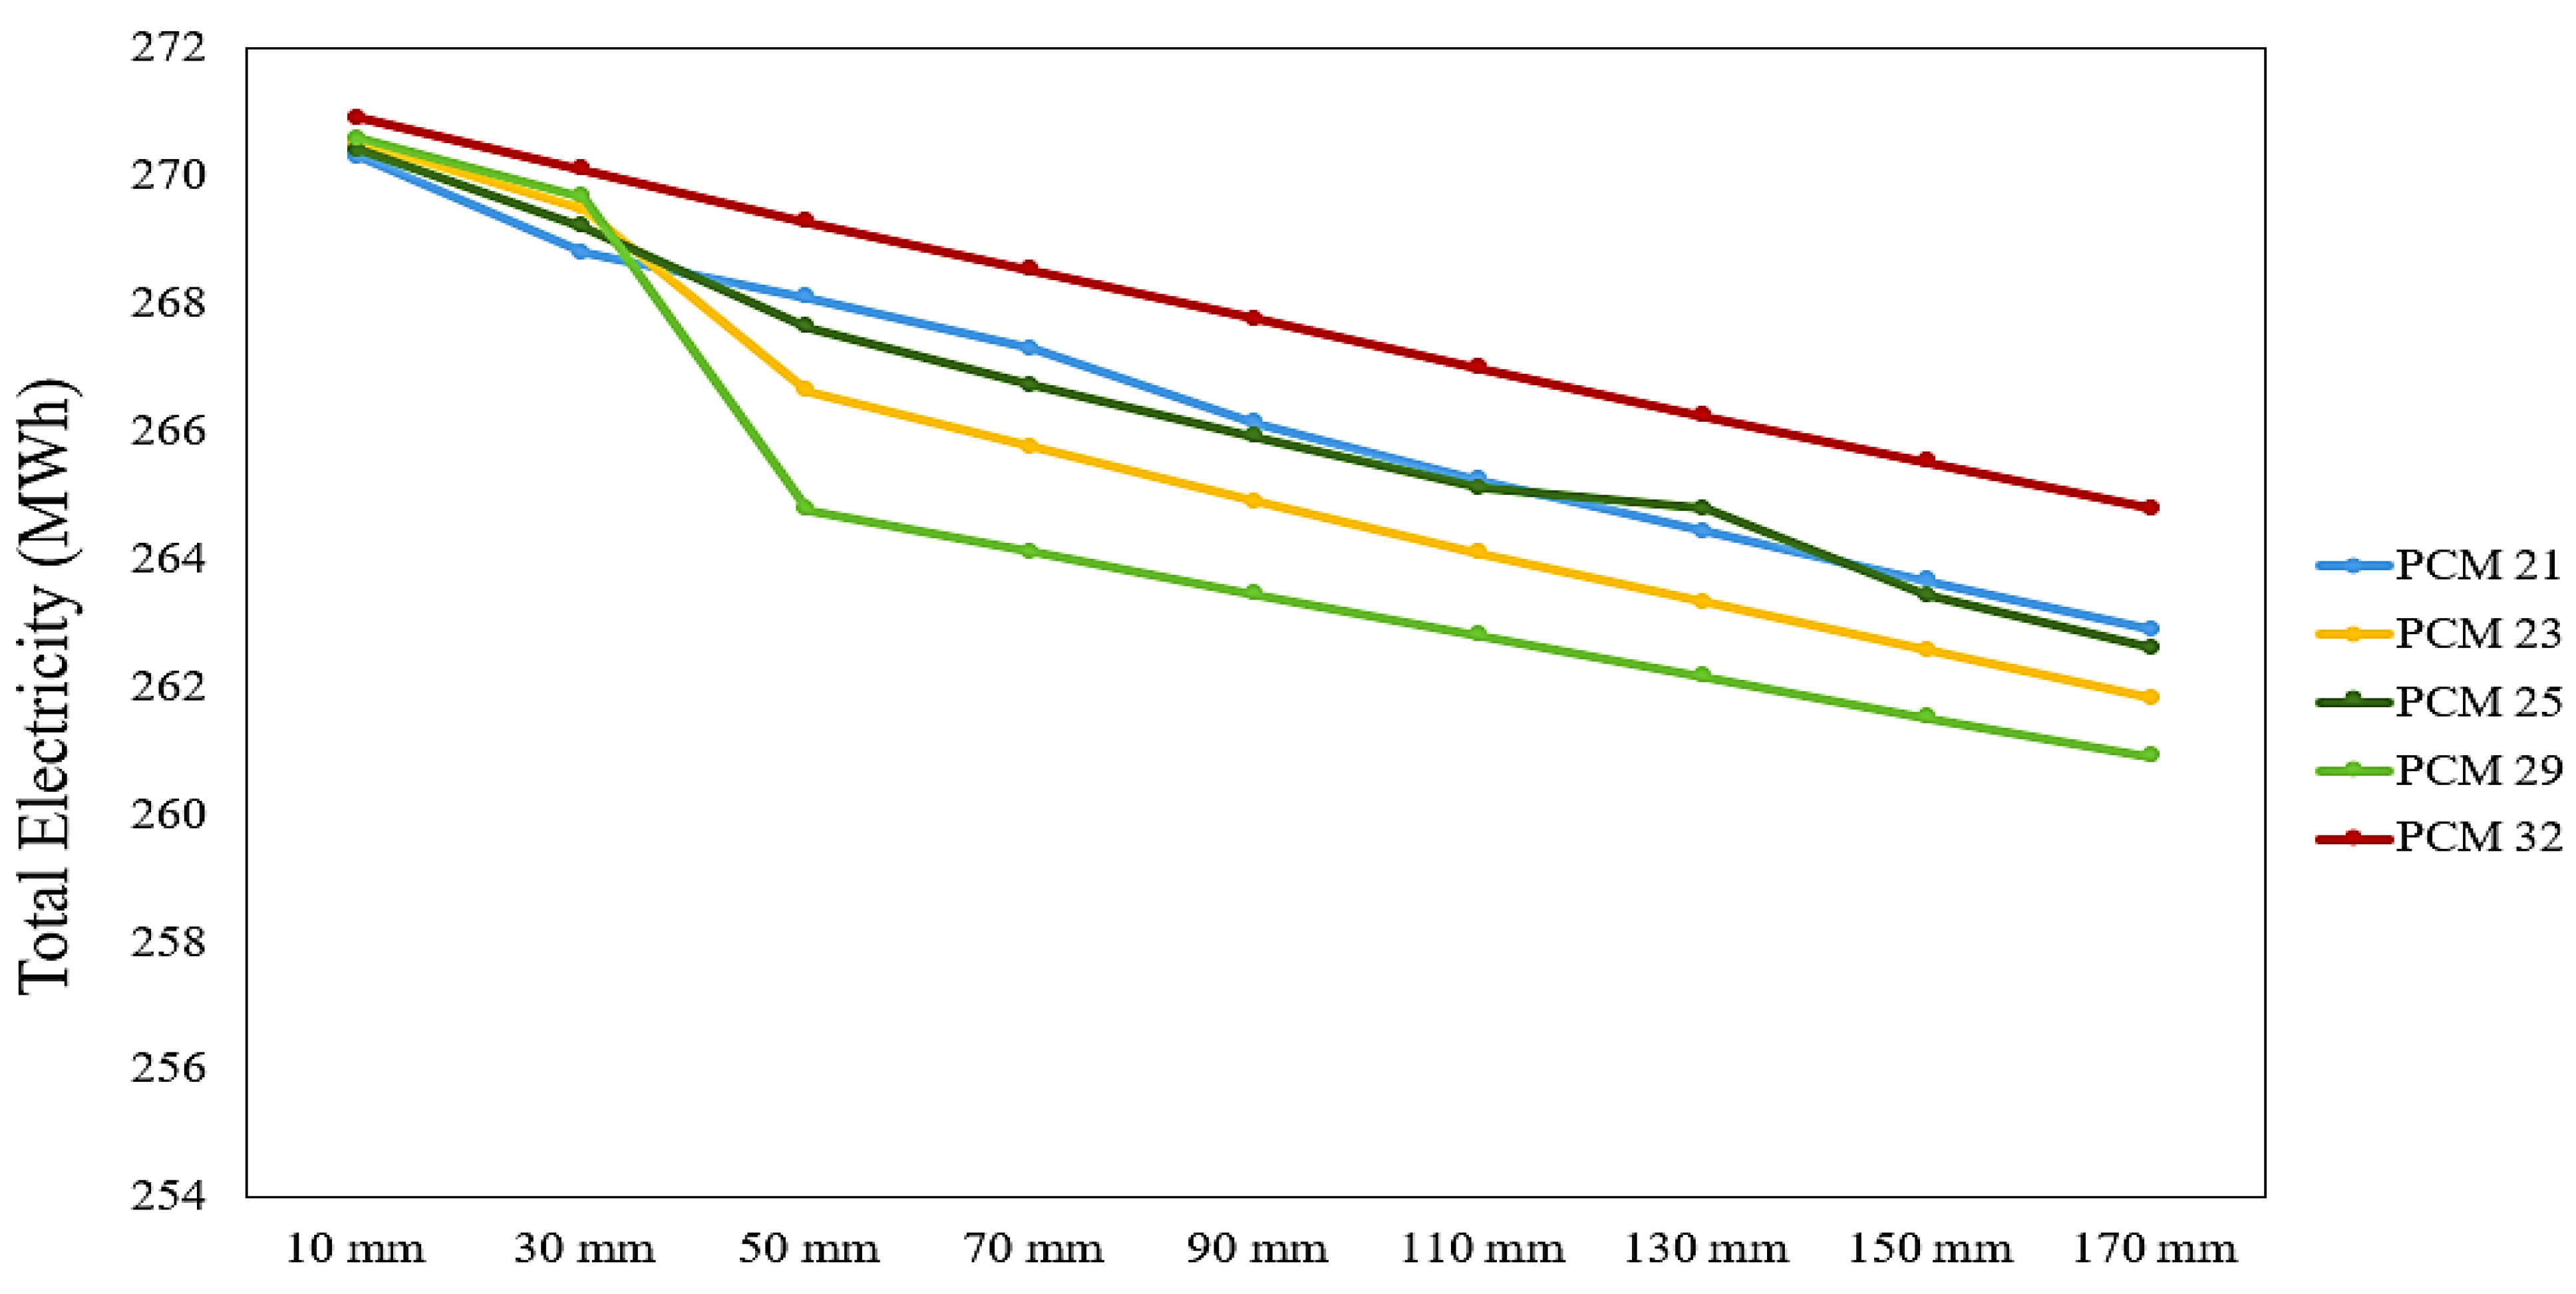
3.3. Accuracy of Method and Simulation Results
4. Conclusions
- The primary optimizations conducted on the designed building reduced the consumed energy by about 11% compared to the base case.
- According to the selected area, PCM 29 performed better and decreased the energy consumption by about 20.72% and 9.56% compared to the base case and optimized system. Furthermore, the produced CO2 reduction was 44.08 × 10³ kg, which demonstrated a great environmental impact decrement.
- Based on the defined scenarios, the best thickness for PCM 29 was 50 mm, and the energy consumption was 264.78 MWh.
- Various strategies were applied for finding the best arrangement of two-layer PCM in the roof. The results indicated that the total energy utilization and CO2 production were 255.38 MWh and 155.71 × 10³ kg, respectively, at the best arrangement.
- The HOMER results indicated that the optimized system includes PV, DG, Bat, and grid, in which the COE reached about USD 0.162.
- The grid utilization decreased by about 21.2% and 24.3% by utilizing one-layer PCM and two-layer PCM in the building.
- Broader analysis of seasonal variations is recommended.
- It is suggested to investigate the analyzed parameters and scenarios on the various housing types and multi-storey buildings.
- Investigation and comparison of various climate conditions are proposed.
- The detailed analysis of the effect of temperature variations during a day on the various phase change materials’ performance is recommended.
- The effect of ambient temperature on the various types of phase change materials, including bioPCMs, hydrated salt PCMs, and their comparison, is proposed.
Funding
Data Availability Statement
Acknowledgments
Conflicts of Interest
Abbreviations
| Abbreviations | |||
| Batt | Battery | Specified Inflation Rate | |
| CFD | Computational Fluid Dynamics | i and i + 1 | Previous and Present Simulation Time Steps |
| COE | Cost of Energy (per kWh) | j − 1, j + 1, and j | Nodes Toward the Outer, Inner, and Modeled Sides of Building |
| COP | Coefficient of Performance | j | Real Interest Rate |
| CRF | Capital Recovery Factor | Nominal Interest Rate | |
| DG | Diesel Generator | Thermal Conductivity of the Interface Between j and j − 1 Node | |
| DHW | Domestic Hot Water | Thermal Conductivity Between the Surface Between j and j + 1 Node | |
| GHI | Global Horizontal Irradiation | L | Evaporation Heat (J/Kg °C) |
| HVAC | Heating, Ventilation, and Air Conditioning | n | Functional Life Years of Project |
| IEA | International Energy Agency | Components’ Cost | |
| NPC | Net Present Cost | Life Time of Project | |
| NREL | US National Energy Laboratory | S | Salvage Value |
| PCM | Phase Change Material | Lower Limit of Liquid and Solid Phase Temperature | |
| PV | Photovoltaic Panel | PCM Melting Temperature (°C) | |
| RF | Renewable Fraction | PCM Temperature (°C) | |
| Nomenclature | Upper Limits of Liquid and Solid Phase Temperature | ||
| Specific Heat Capacity (kJ/kg K) | Greek Letters | ||
| Replacement Cost | PCM’s local liquefaction coefficient | ||
| Total Energy Utilized for Serving AC Primary Loads | PCM’s thermal conductivity (W/m °C) | ||
| Total Energy Utilized for Serving DC Primary Loads | Density (kg/m3) | ||
| Deferrable Load Served | Time Step (s) | ||
| Sold Energy to Grid | Thickness of Layer (m) | ||
References
- Deymi-Dashtebayaz, M.; Nikitin, A.; Norani, M.; Nikitina, V.; Hekmatshoar, M.; Shein, V. Comparison of two hybrid renewable energy systems for a residential building based on sustainability assessment and emergy analysis. J. Clean. Prod. 2022, 379, 134592. [Google Scholar] [CrossRef]
- Transition to Sustainable Buildings. 2024. Available online: https://www.iea.org/reports/transition-to-sustainable-buildings (accessed on 21 June 2025).
- Zhao, Z.; Li, H.; Wang, S. Identification of the key design parameters of Zero/low energy buildings and the impacts of climate and building morphology. Appl. Energy 2022, 328, 120185. [Google Scholar] [CrossRef]
- D’Agostino, D.; Mazzarella, L. What is a Nearly zero energy building? Overview, implementation and comparison of definitions. J. Build. Eng. 2019, 21, 200–212. [Google Scholar] [CrossRef]
- Fereidoni, S.; Fereidooni, L.; Shabestari, S.T.; Esmaeili, M.S.; Zare, M.; Kasaeian, A. Application of solar chimneys and hybrid solar chimneys for ventilation in buildings: A review. Sol. Energy 2025, 288, 113246. [Google Scholar] [CrossRef]
- Esmaeili, M.S.; Mehrpooya, M. Modeling and exergy analysis of an integrated cryogenic refrigeration system and superconducting magnetic energy storage. J. Energy Storage 2023, 73, 109033. [Google Scholar] [CrossRef]
- Stropnik, R.; Koželj, R.; Zavrl, E.; Stritih, U. Improved thermal energy storage for nearly zero energy buildings with PCM integration. Sol. Energy 2019, 190, 420–426. [Google Scholar] [CrossRef]
- Kouravand, A.; Shabestari, S.T.; Zirak, N.; Kasaeian, G.; Fereidooni, L.; Kasaeian, A. Thermal management strategies for a portable double slope solar still with energy storage: An experimental study for enhancing the performance. Next Energy 2025, 8, 100244. [Google Scholar] [CrossRef]
- Jelle, B.; Kalnæs, S. Phase change materials for application in energy-efficient buildings, Cost-effective energy efficient building retrofitting. In Cost-Effective Energy Efficient Building Retrofitting; Woodhead Publishing: Sawston, UK, 2017; pp. 57–118. [Google Scholar]
- Faraj, K.; Khaled, M.; Faraj, J.; Hachem, F.; Castelain, C. Phase change material thermal energy storage systems for cooling applications in buildings: A review. Renew. Sustain. Energy Rev. 2020, 119, 109579. [Google Scholar] [CrossRef]
- Lamrani, B.; Johannes, K.; Kuznik, F. Phase change materials integrated into building walls: An updated review. Renew. Sustain. Energy Rev. 2021, 140, 110751. [Google Scholar] [CrossRef]
- Al-Yasiri, Q.; Szabó, M. Incorporation of phase change materials into building envelope for thermal comfort and energy saving: A comprehensive analysis. J. Build. Eng. 2021, 36, 102122. [Google Scholar] [CrossRef]
- Younsi, Z.; Naji, H. Numerical simulation and thermal performance of hybrid brick walls embedding a phase change material for passive building applications. J. Therm. Anal. Calorim. 2020, 140, 965–978. [Google Scholar] [CrossRef]
- Khan, R.J.; Bhuiyan, Z.H.; Ahmed, D.H. Investigation of heat transfer of a building wall in the presence of phase change material (PCM). Energy Built Environ. 2020, 1, 199–206. [Google Scholar] [CrossRef]
- Yang, X.; Almojil, S.F.; Yang, Y.; Almohana, A.I.; Alali, A.F.; Rajhi, A.A.; Alamri, S.; Qasim, F.; Ren, Y.; Zhang, Z.; et al. The effect of using phase change materials in the walls of a building on the amount of carbon dioxide production and reducing fuel consumption. J. Build. Eng. 2022, 59, 105058. [Google Scholar] [CrossRef]
- Anter, A.G.; Sultan, A.A.; Hegazi, A.; El Bouz, M. Thermal performance and energy saving using phase change materials (PCM) integrated in building walls. J. Energy Storage 2023, 67, 107568. [Google Scholar] [CrossRef]
- Jahangir, M.H.; Alimohamadi, R. A comparative evaluation on energy consumption of a building using bio-based and paraffin-based phase change materials integrated to external building envelope. Energy Rep. 2024, 11, 3914–3930. [Google Scholar] [CrossRef]
- Zhang, Z.; Wen, K.; Sun, W. Optimization and sustainability analysis of a hybrid diesel-solar-battery energy storage structure for zero energy buildings at various reliability conditions. Sustain. Energy Technol. Assess. 2023, 55, 102913. [Google Scholar] [CrossRef]
- Al-Odat, M.; Al-Hasan, M.; Obeidat, F.; Chamkha, A.J. Optimization of ON-grid hybrid PV/wind system for a cement factory in Kuwait using HOMER pro software. Int. J. Low-Carbon Technol. 2024, 19, 120–126. [Google Scholar] [CrossRef]
- Boruah, D.; Chandel, S.S. Techno-economic feasibility analysis of a commercial grid-connected photovoltaic plant with battery energy storage-achieving a net zero energy system. J. Energy Storage 2024, 77, 109984. [Google Scholar] [CrossRef]
- Al Huneidi, D.I.; Tahir, F.; Al-Ghamdi, S.G. Energy modeling and photovoltaics integration as a mitigation measure for climate change impacts on energy demand. Energy Rep. 2022, 8, 166–171. [Google Scholar] [CrossRef]
- Elenga, R.G.; Zhu, L.; Tongora, D.M.; Defilla, S. Feasibility and performance analysis of a net-zero energy residential building in tropical climates: A case of Congo-Brazzaville. Indoor Built Environ. 2024, 33, 1128–1147. [Google Scholar] [CrossRef]
- Sady, H.; Rashidi, S.; Rafee, R. Towards a net-zero-energy building with smart control of Trombe walls, underground air ducts, and optimal microgrid composed of renewable energy systems. Energy 2024, 294, 130703. [Google Scholar] [CrossRef]
- SolarGIS. Solar Resource Maps & GIS Data. 2024. Available online: https://solargis.com/maps-and-gis-data/download/saudi-arabia (accessed on 21 June 2025).
- Alrashdan, A.; Ghaleb, A.M.; Ahmad, K.H.; Daoud, A.N. Integration of Phase Change Materials in Service Areas of Building Envelopes for Improved Thermal Performance: An Experimental Study in Saudi Arabia. Buildings 2024, 14, 904. [Google Scholar] [CrossRef]
- Alsagri, A.S.; Alrobaian, A.A. Analysis and performance prediction of a building integrated photovoltaic thermal system with and without phase change material. Energy 2024, 310, 133249. [Google Scholar] [CrossRef]
- NASA Weather Historical Data. 2024. Available online: https://power.larc.nasa.gov/data-access-viewer (accessed on 21 June 2025).
- Design Builder Software. 2024. Available online: https://designbuilder.co.uk/about-us (accessed on 21 June 2025).
- Javadi, F.; Metselaar, H.; Ganesan, P. Performance improvement of solar thermal systems integrated with phase change materials (PCM), a review. Sol. Energy 2020, 206, 330–352. [Google Scholar] [CrossRef]
- Wang, X.; Li, W.; Luo, Z.; Wang, K.; Shah, S.P. A critical review on phase change materials (PCM) for sustainable and energy efficient building: Design, characteristic, performance and application. Energy Build. 2022, 260, 111923. [Google Scholar] [CrossRef]
- Ghosh, D.; Ghose, J.; Datta, P.; Kumari, P.; Paul, S. Strategies for phase change material application in latent heat thermal energy storage enhancement: Status and prospect. J. Energy Storage 2022, 53, 105179. [Google Scholar] [CrossRef]
- Kenzhekhanov, S.; Memon, S.A.; Adilkhanova, I. Quantitative evaluation of thermal performance and energy saving potential of the building integrated with PCM in a subarctic climate. Energy 2020, 192, 116607. [Google Scholar] [CrossRef]
- Ascione, F.; Borrelli, M.; De Masi, R.F.; de Rossi, F.; Vanoli, G.P. A framework for NZEB design in Mediterranean climate: Design, building and set-up monitoring of a lab-small villa. Sol. Energy 2019, 184, 11–29. [Google Scholar] [CrossRef]
- Zahid, I.; Farooq, M.; Farhan, M. Phase Change Materials (PCMs). In Nano Enhanced Phase Change Materials: Preparation, Properties and Applications; Said, Z., Pandey, A.K., Eds.; Springer Nature: Singapore, 2023; pp. 11–44. [Google Scholar]
- Huang, B.; Yang, S.; Wang, J.; Lund, P.D. Optimizing the shape of PCM container to enhance the melting process. Oxf. Open Energy 2022, 1, oiab006. [Google Scholar] [CrossRef]
- Voller, V.R. Fast implicit finite-difference method for the analysis of phase change problems. Numer. Heat Transfer. 1990, 17, 155–169. [Google Scholar] [CrossRef]
- Voller, V.R.; Swaminathan, C.; Thomas, B.G. Fixed grid techniques for phase change problems: A review. Int. J. Numer. Methods Eng. 1990, 30, 875–898. [Google Scholar] [CrossRef]
- Rad, M.A.V.; Shahsavari, A.; Rajaee, F.; Kasaeian, A.; Pourfayaz, F.; Yan, W.-M. Techno-economic assessment of a hybrid system for energy supply in the affected areas by natural disasters: A case study. Energy Convers. Manag. 2020, 221, 113170. [Google Scholar]
- Shabestari, S.T.; Kasaeian, A.; Rad, M.A.V.; Fard, H.F.; Yan, W.-M.; Pourfayaz, F. Techno-financial evaluation of a hybrid renewable solution for supplying the predicted power outages by machine learning methods in rural areas. Renew. Energy 2022, 194, 1303–1325. [Google Scholar] [CrossRef]
- Das, B.K.; Hassan, R.; Islam, S.; Rezaei, M. Influence of energy management strategies and storage devices on the techno-enviro-economic optimization of hybrid energy systems: A case study in Western Australia. J. Energy Storage 2022, 51, 104239. [Google Scholar] [CrossRef]
- Hassan, R.; Das, B.K.; Hasan, M. Integrated off-grid hybrid renewable energy system optimization based on economic, environmental, and social indicators for sustainable development. Energy 2022, 250, 123823. [Google Scholar] [CrossRef]
- Asghari, M.; Fereidoni, S.; Fereidooni, L.; Nabisi, M.; Kasaeian, A. Energy efficiency analysis of applying phase change materials and thermal insulation layers in a building. Energy Build. 2024, 312, 114211. [Google Scholar] [CrossRef]
- Mahdaoui, M.; Hamdaoui, S.; Msaad, A.A.; Kousksou, T.; El Rhafiki, T.; Jamil, A.; Ahachad, M. Building bricks with phase change material (PCM): Thermal performances. Constr. Build. Mater. 2021, 269, 121315. [Google Scholar] [CrossRef]
- Kishore, R.A.; Bianchi, M.V.; Booten, C.; Vidal, J.; Jackson, R. Enhancing building energy performance by effectively using phase change material and dynamic insulation in walls. Appl. Energy 2021, 283, 116306. [Google Scholar] [CrossRef]


| Materials | Thickness | Conductivity (W/m-K) | Specific Heat (J/kg-K) | Density (kg/m3) | |
|---|---|---|---|---|---|
| External Wall | Granite | 0.0200 | 2.8000 | 1000.00 | 2600.00 |
| Cement/Plaster/Mortar | 0.0300 | 0.7200 | 840.00 | 1860.00 | |
| Concrete Block | 0.2000 | 0.5100 | 1000.00 | 1400.00 | |
| PUR Polyurethane Board | 0.0742 | 0.0280 | 1590.00 | 35.00 | |
| Concrete Block | 0.1000 | 0.5100 | 1000.00 | 1400.00 | |
| Gypsum Plastering | 0.0200 | 0.4000 | 1000.00 | 1000.00 | |
| Paint Plasterboard | 0.0100 | 0.2100 | 1000.00 | 700.00 | |
| Flat Roof | Roof Tile | 0.0300 | 0.8400 | 800.00 | 1900.00 |
| Cement/Plaster/Mortar | 0.0200 | 0.7200 | 840.00 | 1760.00 | |
| Foam-polyurethane | 0.0030 | 0.0280 | 1470.00 | 30.00 | |
| Cement/Plaster/Mortar | 0.0100 | 0.7200 | 840.00 | 1760.00 | |
| Cast Concrete | 0.0500 | 1.1300 | 1000.00 | 2000.00 | |
| PUR Polyurethane Board | 0.0742 | 0.0280 | 1590.00 | 35.00 | |
| Aerated Concrete Slab | 0.200 | 0.1600 | 840.00 | 500.00 | |
| Gypsum Plastering | 0.0100 | 0.4000 | 1000.00 | 1000.00 | |
| Internal Partitions | Gypsum Plasterboard | 0.0250 | 0.2500 | 1000.00 | 900.00 |
| Air gap 10 mm | 0.1000 | 0.3000 | 1000.00 | 1000.00 | |
| Gypsum Plasterboard | 0.0250 | 0.2500 | 1000.00 | 900.00 | |
| Ground Floor | Urea Formaldehyde Foam | 0.1327 | 0.0400 | 1400.00 | 10.00 |
| Cast Concrete | 0.1000 | 1.1300 | 1000.00 | 2000.00 | |
| Floor/Roof Screed | 0.0700 | 0.4100 | 840.00 | 1200.00 | |
| Timber Flooring | 0.0300 | 0.1400 | 1200.00 | 650.00 |
| Materials | Latent Heat (J/kg) | Specific Heat (J/kg·K) | Density (kg/m3) | Conductivity (W/m·K) | Melting Point (°C) |
|---|---|---|---|---|---|
| InfinitRPCM21C | 200,000.00 | 3140.00 | 929.00 | 0.8150 | 20–22 |
| InfinitRPCM23C | 200,000.00 | 3140.00 | 929.00 | 0.8150 | 22–24 |
| InfinitRPCM25C | 200,000.00 | 3140.00 | 929.00 | 0.8150 | 24–26 |
| InfinitRPCM29C | 200,000.00 | 3140.00 | 929.00 | 0.8150 | 28–30 |
| PCM 32C | 200,000.00 | 3150.00 | 8750.00 | 0.9120 | 30–32 |
| Model | Utilized PCMs in Wall/Outer Roof Layer/Inner Roof Layer |
|---|---|
| A | 21/21/21 |
| B | 23/23/23 |
| C | 25/25/25 |
| D | 29/29/29 |
| E | 29/29/21 |
| F | 29/29/23 |
| G | 29/29/25 |
| H | 29/25/21 |
| I | 29/25/23 |
| J | 29/23/21 |
| K | 29/32/29 |
| L | 29/32/25 |
| M | 29/32/23 |
| N | 29/32/21 |
| Summer Peak Time (USD/kWh) | Spring and Fall Peak Time (USD/kWh) | Winter Peak Time (USD/kWh) | First Off-Peak Period (USD/kWh) | Second Off-Peak Period (USD/kWh) | Shoulder Period (USD/kWh) | |
|---|---|---|---|---|---|---|
| 1.2500 | 0.5900 | 0.3600 | 0.12000 | 0.0800 | 0.200 | |
| Color in Schedule |
| Component | Data |
|---|---|
| PV | |
| Model | Sharp ND-250QCS |
| Cell Type | Polycrystalline silicon |
| Operating Temperature | 47.5 °C |
| Temperature Coefficient | −0.485%/°C |
| Efficiency | 15.3% |
| Lifetime (years) | 20 |
| Replacement Cost (USD) | 1200/kW |
| Capital Cost (USD) | 1500/kW |
| Generator | |
| Model | Generic Small Genset (Gen50) |
| Minimum Load Ratio | 25% |
| Dry Weight | |
| Rated RPM | |
| Lifetime (hours) | 15,000.00 |
| Replacement Cost (USD) | 357.00 |
| Nominal Cost (USD) | |
| Capital Cost (USD) | 428.00 |
| Capacity search space (kW) | 0, 5, 10 |
| Converter | |
| Inverter Efficiency | 95% |
| Rectifier Efficiency | 95% |
| Lifetime (years) | 15 |
| Replacement Cost (USD) | 300.00 |
| Capital Cost (USD) | 300.00 |
| O&M Cost (USD/year) | 3.00 |
| Battery | |
| Model | Generic 1 kWh Li-Ion |
| Roundtrip Efficiency | 90% |
| Nominal Voltage (V) | 6 |
| Nominal Capacity (kWh-Ah) | 1–167 |
| Maximum Discharge Current (A) | 500 |
| Maximum Charge Current (A) | 167 |
| Lifetime | 15 |
| Throughput (kWh) | 3000.00 |
| Replacement Cost (USD) | 400.00 |
| Capital Cost (USD) | 400.00 |
| O&M Cost (USD) | 10.00 |
| Total Electricity (MWh) | Total Gas (MWh) | CO2 Emission (×103 kg) | Total Cooling (MWh) | Zone Heating (MWh) | |
|---|---|---|---|---|---|
| Base Model | 333.99 | 13.57 | 204.93 | 315.00 | 11.53 |
| PCM 21 | 268.1 | 2.29 | 162.9 | 204.85 | 1.94 |
| PCM 23 | 266.64 | 2.05 | 161.97 | 203.22 | 1.74 |
| PCM 25 | 267.63 | 1.86 | 162.53 | 204.89 | 1.57 |
| PCM 29 | 264.78 | 2.12 | 160.86 | 199.88 | 1.8 |
| PCM 32 | 269.29 | 2.52 | 163.66 | 207.98 | 2.15 |
| Total Electricity (MWh) | Required Thickness (mm) | CO2 Production (×103 kg) | Heating (MWh) | Cooling (MWh) | Gas (MWh) | |
|---|---|---|---|---|---|---|
| PCM 21 | 264.43 | 130 | 160.66 | 1.89 | 201.56 | 2.22 |
| PCM 23 | 264.9 | 90 | 160.9 | 1.68 | 201.25 | 1.98 |
| PCM 25 | 264.8 | 130 | 160.48 | 1.53 | 201.28 | 1.8 |
| PCM 29 | 264.78 | 50 | 160.86 | 1.8 | 199.88 | 2.12 |
| PCM 32 | 264.8 | 170 | 160.92 | 2.04 | 203.36 | 2.39 |
| Scenario | PV (kW) | Battery (kWh) | Converter (kW) | Grid Purchase (kWh) | Generator Working Hours | Initial Cost (USD) | NPC (USD) | COE (USD) | RF (%) |
|---|---|---|---|---|---|---|---|---|---|
| Base Case | 184 | 429 | 114 | 55,747 | 2930 | 486,421 | 996,045 | 0.162 | 79.2 |
| One-layer PCM | 142 | 323 | 85.6 | 43,890 | 2827 | 375,829 | 781,737 | 0.162 | 77.6 |
| Two-layer PCM | 135 | 316 | 84.1 | 42,188 | 2821 | 363,157 | 754,342 | 0.163 | 77.2 |
Disclaimer/Publisher’s Note: The statements, opinions and data contained in all publications are solely those of the individual author(s) and contributor(s) and not of MDPI and/or the editor(s). MDPI and/or the editor(s) disclaim responsibility for any injury to people or property resulting from any ideas, methods, instructions or products referred to in the content. |
© 2025 by the author. Licensee MDPI, Basel, Switzerland. This article is an open access article distributed under the terms and conditions of the Creative Commons Attribution (CC BY) license (https://creativecommons.org/licenses/by/4.0/).
Share and Cite
Alsagri, A.S. Approaching a Nearly Zero Energy Building Integrated with PCM by Optimization of Energy Sources. Buildings 2025, 15, 2205. https://doi.org/10.3390/buildings15132205
Alsagri AS. Approaching a Nearly Zero Energy Building Integrated with PCM by Optimization of Energy Sources. Buildings. 2025; 15(13):2205. https://doi.org/10.3390/buildings15132205
Chicago/Turabian StyleAlsagri, Ali Sulaiman. 2025. "Approaching a Nearly Zero Energy Building Integrated with PCM by Optimization of Energy Sources" Buildings 15, no. 13: 2205. https://doi.org/10.3390/buildings15132205
APA StyleAlsagri, A. S. (2025). Approaching a Nearly Zero Energy Building Integrated with PCM by Optimization of Energy Sources. Buildings, 15(13), 2205. https://doi.org/10.3390/buildings15132205