Article

A Whole-Life Carbon Assessment of a Single-Family House in North India Using BIM-LCA Integration

by
Deepak Kumar
1,2,3,
Kranti Kumar Maurya
3,
Shailendra K. Mandal
3,
Nandini Halder
1,2,
Basit Afaq Mir
1,2,
Anissa Nurdiawati
1,2 and
Sami G. Al-Ghamdi
1,2,*
1
Environmental Science and Engineering Program, Biological and Environmental Science and Engineering Division, King Abdullah University of Science and Technology (KAUST), Thuwal 23955-6900, Saudi Arabia
2
KAUST Climate and Livability Initiative, King Abdullah University of Science and Technology (KAUST), Thuwal 23955-6900, Saudi Arabia
3
Department of Architecture and Planning, National Institute of Technology Patna, Patna 800005, India
*
Author to whom correspondence should be addressed.
Buildings 2025, 15(13), 2195; https://doi.org/10.3390/buildings15132195
Submission received: 14 April 2025 / Revised: 2 June 2025 / Accepted: 19 June 2025 / Published: 23 June 2025
(This article belongs to the Section Building Energy, Physics, Environment, and Systems)

Abstract

As the population increases, the growing demand for residential housing escalates construction activities, significantly impacting global warming by contributing 42% of primary energy use and 39% of global greenhouse gas (GHG) emissions. This study addresses a gap in research on lifecycle assessment (LCA) for Indian residential buildings by evaluating the full cradle-to-grave carbon footprint of a typical single-family house in Northern India. A BIM-based LCA framework was applied to a 110 m2 single-family dwelling over a 60-year life span. Operational use performance and climate analysis was evaluated via cove tool. The total carbon footprint over a 60-year lifespan was approximately 5884 kg CO2e, with operational energy use accounting for about 87% and embodied carbon approximately 11%. Additional impacts came from maintenance and replacements. Energy usage was calculated as 71.76 kWh/m2/year and water usage as 232.2 m3/year. Energy consumption was the biggest driver of emissions, but substantial impacts also stemmed from material production. Cement-based components and steel were the largest embodied carbon contributors. Under the business-as-usual (BAU) scenario, the operational emissions reach approximately 668,000 kg CO2e with HVAC and 482,000 kg CO2e without HVAC. The findings highlight the necessity of integrating embodied carbon considerations alongside operational energy efficiency in India’s building codes, emphasizing reductions in energy consumption and the adoption of low-carbon materials to mitigate the environmental impact of residential buildings. Future work should focus on the dynamic modeling of electricity decarbonization, improved regional datasets, and scenario-based LCA to better support India’s transition to net-zero emissions by 2070.

1. Introduction and Background

Climate change and global warming represent profound challenges to the future of humanity, primarily driven by the unrelenting increase in GHG emissions and the subsequent rise in global temperatures [1,2,3,4,5]. Over the last century, the Earth’s temperature has risen significantly, with the global mean temperature increasing by approximately 1.1 °C compared to pre-industrial levels [6,7,8]. The Intergovernmental Panel on Climate Change (IPCC) recommends that to limit global warming to a 1.5 °C increase by 2100, net human-induced CO2 emissions must be reduced by 45% by 2030 and reach net-zero by 2050 [9,10,11]. This temperature rise is primarily attributed to the concentration of carbon dioxide (CO2) and other GHGs in the atmosphere [12,13], causing widespread environmental repercussions [14] such as melting polar ice caps, rising sea levels, ocean acidification [15], and an escalation in extreme weather events like hurricanes [16], droughts, and heatwaves [17,18]. These changes have profound implications for ecosystems, human health, and economic stability [19,20].
Buildings experience multiple phases during their lifecycle, including preconstruction, construction, operation, maintenance, and demolition [21]. Reducing environmental pollution in the construction industry is crucial for addressing global environmental and climate issues [22,23]. The construction industry plays a significant role in global warming, accounting for 42% of primary energy use and 39% of worldwide GHG emissions [24,25]. Embodied carbon (EC) accounts for approximately 11% of total global energy-related CO2 emissions and 28% of emissions in the building sector [26]. By 2050, it is estimated that embodied carbon will represent 50% of the total emissions from new constructions as operational emissions could decline due to improved energy efficiency and renewable energy adoption [27]. A study by Chastas et al. (2016) analyzing residential buildings found that EC emissions range between 250 and 600 kg CO2e/m2 over the building lifetime, depending on material selection, construction techniques, and regional energy sources [28]. Operational emissions (OEs), also known as operational use emission and operational carbon, refer to GHG emissions caused by energy consumption during a building’s use phase [29,30]. A study by Sartori and Hestnes (2007) found that net-zero energy buildings (NZEBs) can achieve up to 80–100% reductions in operational emissions by combining energy-efficient design with on-site renewable energy generation [31]. The building construction industry significantly contributes to GHG emissions, with two major contributors, OE and EC, as shown in Figure 1. Lifecycle assessment (LCA) is a widely recognized method for quantifying EC and OE that are linked to a building throughout its entire lifecycle [32,33,34]. This includes all stages, from raw material extraction and manufacturing to usage and final disposal [35]. EN 15978:2011 [36] categorizes emissions into EC, OE and beyond-building lifecycle impacts. The importance of LCA is increasingly becoming known across many industries, including the construction sector [37,38]. As the industry strives to mitigate the environmental impacts of buildings and materials used, LCA has gained importance as a valuable tool [39].
Numerous LCA studies have been carried out to evaluate the environmental impacts of the construction sector. In Europe, these assessments have focused on various building types, including office buildings [40,41,42,43], universities [44,45,46], apartment buildings [47,48,49,50,51], and houses [52,53,54,55,56,57]. Similarly, in China, LCA studies encompass a broad range of construction sectors [58,59,60,61,62,63,64,65,66,67], covering industrial, academic, office, and residential buildings. Presently, there are numerous studies on global level [68,69,70,71,72,73], which explore the environmental impact of the construction sector. The majority of the existing building–LCA literature from India primarily consists of review articles or studies that focus on partial lifecycle stages [74,75,76], such as the embodied energy of materials [77,78,79,80], rather than adopting a comprehensive cradle-to-grave approach. Despite extensive global research on LCA in building construction, there remains a significant gap in published studies specifically addressing Indian residential buildings [81,82,83,84]. India experiencing rapid urbanization and increasing construction activity [85,86]. Understanding LCA in this context is crucial for developing sustainable building practices tailored to regional material use, climatic conditions, and energy systems [87,88]. Many green building initiatives and codes have been introduced in India for energy efficient building, such as the Eco-Niwas Samhita energy code [89] for residential buildings and rating systems such as GRIHA [90] and LEED [91,92], to improve the OE of a building. However, EC has received comparatively less attention. To bridge this gap, this study conducts a whole-life carbon (WLC) impact assessment including the cradle-to-grave phase for a typical single-family residential housing in North India (New Delhi). Also, this research integrates Building Information Modeling (BIM) with LCA tools to evaluate embodied carbon, operational energy use, water consumption, and GWP impacts over a 60-year service life.
The aim of this research is to develop a BIM-LCA integrated cradle-to-grave methodology framework to quantify the environmental impacts of a typical single-family residential dwelling unit in northern India and provide recommendations to reduce environmental impacts of the unit throughout its lifecycle. The key research questions (RQs) guiding this study include the following:
  • What is the whole-life carbon emission of a typical single-family residential dwelling unit of Northern India?
  • How significant is the contribution of embodied carbon compared to operational carbon over the complete lifecycle of a typical single-family residential dwelling unit in northern India?
  • Which specific building materials contribute most significantly to the embodied CO2e emissions of single-family residential construction based on their mass and resource type?
  • How can BIM-LCA integrated methodology contribute to more effective decision-making in the design and policy-making process towards sustainable residential construction practices?

2. Materials and Methods

This study employs an LCA approach to evaluate the environmental impact of a residential house in Northern India, integrating BIM for a more accurate assessment. This research utilizes a range of software tools to enhance accuracy in building modeling, sustainability analysis, and lifecycle assessment. Autodesk Revit 2025 was used for building modeling, providing detailed geometric and material data essential for lifecycle inventory (LCI) development. Navisworks Manage 2025 was employed for clash detection, ensuring coordination between different building components to minimize construction errors. Cove tool is an advanced, data-driven building performance simulation software designed to evaluate and optimize the sustainability of architectural projects [93]. The tool provides real-time insights into energy efficiency, water usage, carbon emissions, daylight availability, and thermal comfort, enabling architects and engineers to make informed decisions during the early stages of design [94]. Cove tool was used to assess Energy Use Intensity (EUI) and water use. Furthermore, One Click LCA was utilized to calculate the GWP of materials, providing insights into the EC and OE footprint of the building. The integration of these tools enabled a comprehensive and data-driven approach to evaluating the sustainability performance of the case study building. Also, sensitivity analysis was conducted using three future electricity grid mix scenarios provided by Sphera’s India-specific LCI datasets for the years 2030 and 2050. The analysis compares the baseline (BAU) operational emissions with future scenarios, both with and without HVAC systems, to quantify potential emission reductions from grid decarbonization alone (Section 3.4).

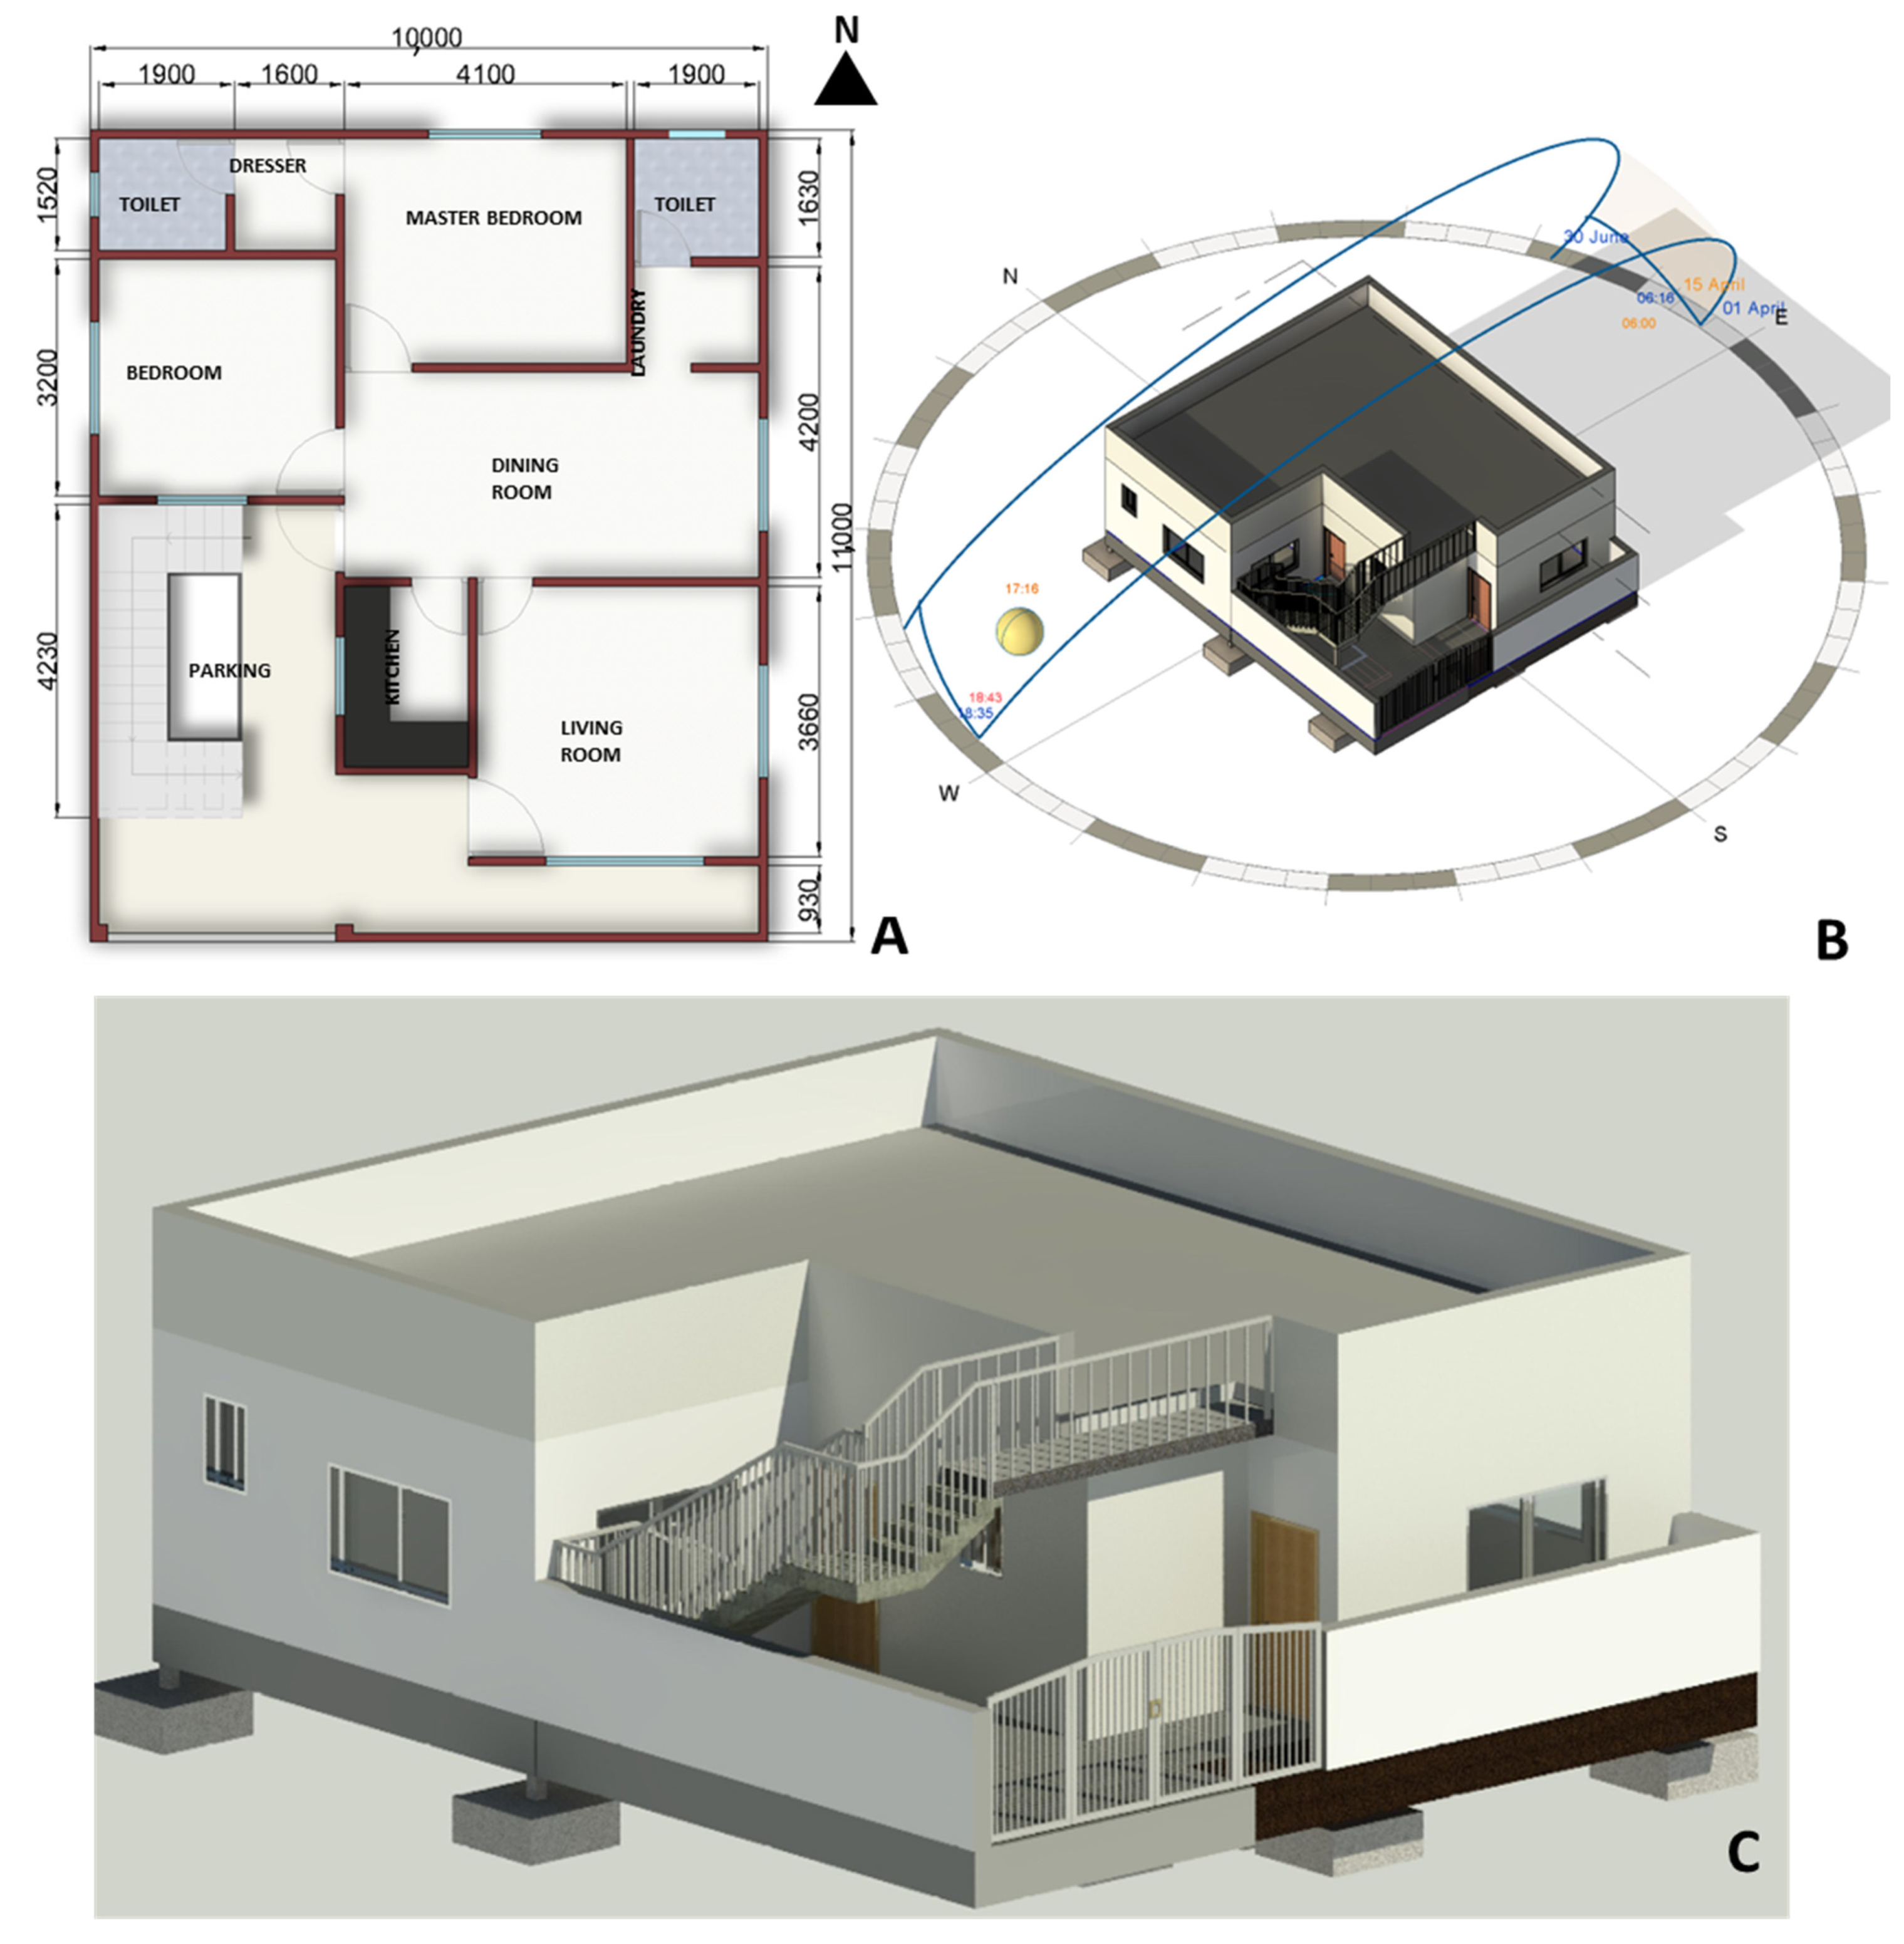
2.1. Case Study Building Description

The selected case study is a typical single-family residential dwelling unit in New Delhi, representative of mid-income residential construction in North India’s urban context. The choice of New Delhi provides a scenario in a composite climate (hot summers and cool winters) that requires both cooling and some heating, thus influencing operational energy use. This house configuration is typical of many low-rise urban homes in Northern India. The house is assumed to be a newly built dwelling in 2025, complying with local building codes, the national building code (NBC) [95] and typical construction practices. The selected design, with two bedrooms, a living room, a kitchen, and two bathrooms within 110 m2, aligns with the NBC for space planning and functional layout for mid-income housing. The housing form is a low-rise, ground-floor, reinforced concrete frame with brick infill and is widely prevalent across Indian Tier 2 and Tier 3 cities, especially in peri-urban zones. This layout balances economic efficiency, space optimization, and local construction practice, making it a suitable proxy for LCA analysis targeting a representative housing type. Key characteristics of the single-family dwelling unit case study are summarized in Table 1.
The structural frame of this building is RCC with infill brick walls (a common practice for robustness and familiarity in the region). The use of fired clay bricks, cement mortar, concrete, and steel reinforcement reflect standard materials. The floor area of 110 m2 and number of occupants (5) represent an average mid-sized family home, providing living spaces, bedrooms, kitchen, etc. We assume the house has basic amenities {electric fans, lights, a refrigerator, possibly an air conditioner unit for summer cooling in the master bedroom, and a liquid petroleum gas (LPG) cylinder for cooking}, which will influence operational energy consumption. The building envelope has no extraordinary passive design features beyond the code minimum (e.g., 230 mm brick walls providing moderate thermal mass, a roof with some insulation to reduce heat gain). These assumptions set a baseline “business-as-usual” scenario for a typical dwelling; potential improvements (like better insulation or solar panels) are not included in the base case but are considered in discussions of optimization.
Moreover, centralized HVAC systems are not typical in such dwellings. Instead, localized thermal comfort measures are employed, including natural ventilation, ceiling fans, a split air-conditioning unit in the master bedroom, and the occasional use of electric heaters in winter. These assumptions reflect actual usage patterns for similar households, supported by energy consumption profiles reported in BEE 2019 and IEA (India Energy Outlook 2021) [97,98]. These inputs were explicitly modeled during energy simulation (via cove tool) and included in the operational phase of the LCA. These justifications collectively confirm that the case study offers a realistic representation of urban residential construction in North India.
Figure 2 presents a comprehensive analysis of a single dwelling residential unit, illustrating key components utilized in both architectural planning and energy performance assessment. Subfigure (A) displays the detailed floor plan layout, showcasing the spatial organization and functional zoning within the residential unit, which serves as a basis for further modeling and simulation. Subfigure (B) depicts the sun path diagram, essential for conducting solar exposure and daylighting analyses, which inform passive design strategies to enhance thermal comfort and reduce energy consumption. Subfigure (C) features the 3D building information model developed in Autodesk Revit, facilitating integration across design, structural, and energy modeling workflows. The combined visualizations provide a holistic view of the design and performance evaluation process. It should be noted that the figure is not to scale.

2.2. Lifecycle Assessment of Residential House in Northern India

The study follows the ISO 14040/14044 framework for LCA, adopting a cradle-to-grave perspective consistent with building LCA standards (EN 15978:2011) [36]. This involves four phases: goal and scope definition, lifecycle inventory (LCI) analysis, impact assessment, and interpretation. In practice, we combined these steps through iterative analysis using BIM-derived data and LCA software (One Click LCA version 4.0.8), as illustrated in Figure 3.

2.2.1. Goal and Scope Definition

The goal of this research is to conduct a whole-life carbon environmental impact assessment of a representative single-family dwelling unit in New Delhi, evaluating its EC, OE, CO2e and recommendation of sustainable construction. Its scope encompasses a cradle-to-grave assessment, covering material production, construction, operation (use-phase energy and water), maintenance, and end-of-life disposal, all significant building components (structure, envelope, and finishes), and the GWP impact category. The system function describes clearly the purpose and functionality of the house under analysis. Specifically, it provides shelter and residential amenities (sleeping, cooking, bathing, and living spaces) designed for comfort and utility. This aligns closely with typical single-family residential expectations in North India. The functional unit is defined as the construction, use, maintenance and end of life of a single-family residential dwelling (a total built-up area of 110 m2), accommodating an average household size of five occupants in New Delhi, for a reference lifespan of 60 years. This unit accounts for providing adequate shelter, thermal comfort, and essential amenities typical of mid-income urban households in North India.
The system boundary defines the lifecycle phases and processes considered in this study, shown in Figure 4, following EN 15978:2011 [36]. A1–A3 (material production) includes the extraction, processing, and manufacturing of raw materials (e.g., cement, steel, bricks, concrete, glass, and finishes). A4–A5 (the construction phase) includes material transportation to site and on-site activities such as assembly, energy use for machinery, and construction waste. B1–B7 (the use phase and maintenance) includes operational energy consumption (electricity, cooling, lighting, and appliances), periodic maintenance, repairs, and replacements. C1–C4 (the end-of-life phase) includes demolition, the transportation of waste, recycling, landfill disposal, and material recovery.

2.2.2. Lifecycle Inventory (LCI) and Assumptions

To conduct the LCA, this study used the software OneClick LCA (2023 edition) following LCA standards EN 15978, ISO 21931–1 and ISO 21929 and data requirements of ISO 14040 and EN:15804 [36,99,100,101,102]. OneClick LCA provides a comprehensive database of construction product data and can be combined with BIM. The material quantities are obtained from Navisworks Manage and then analyzed using environmental impact data from the One Click LCA database, which sources its information from Ecoinvent 3.8 LCI and Environmental Product Declarations (EPDs). Wherever available, region-specific data (e.g., an EPD for Indian cement or generic “Asia” datasets) are used. In cases where Indian-specific data were lacking like metal doors, we used global average data. Key data points and assumptions include the use of concrete modeled with a generic mix design of approximately 25 MPa compressive strength, incorporating a typical Portland cement content. The data used for stages such as A4–A5 (transportation and construction) is derived from the default values provided within the One Click LCA tool, ensuring consistency with standardized assumptions when project-specific data are unavailable. The international EPD system dataset from JSW-manufactured “Ready-Mix Concrete” (Normal, C25/M25, 25 MPa, 2400 kg/m3) was used, with adjustments for transport. The dataset implicitly included the concrete quantity (in cubic meters) along with its cement, sand, and aggregate content. The steel reinforcement was linked by associating the rebar quantity with a reinforcement steel dataset, specifically using the EPD for steel rebar from Tata Steel Limited, Kolkata. This study assumed a 1200 km transport leg from product manufacture to transportation distance to site. The transportation stage scenario was established based on local construction sector practices. A transportation distance of 50 km was assumed from the manufacturer to the construction site for all materials, as they were sourced from the New Delhi industrial area.
It is important to clarify what is excluded from the system boundary. The impacts associated with site preparation, such as site clearance, are considered minimal and thus omitted from the analysis [99,103]. Occupancy-related impacts, including emissions from human metabolism, are also excluded [104]. he manufacturing of capital equipment such as machinery and vehicles used in production is not accounted for, as these impacts are assumed to be amortized within background processes in the LCA database [105]. Biogenic carbon storage is considered negligible, given that the building contains virtually no wood, with minimal wood present in door frames or furnishings either ignored or treated as carbon neutral. Moreover, land use change impacts from raw material extraction, such as limestone quarrying for cement production, are not explicitly considered beyond what is already embedded within the environmental data.
The present study assumed 0.08 kg CO2 refrigerant leakages per year refrigerant substances based on the IPCC [106]. The analysis also accounts for routine maintenance activities, such as the painting of walls, assumed to occur every 5 years for interiors and every 3 years for exteriors, as well as minor repairs to plaster. The associated materials and processes, including cumulative paint consumption over a 60-year lifespan, are included in the model. In addition, this study considers the periodic replacement of building components with shorter lifespans than the overall building. For example, it is assumed that kitchen and bathroom wall tiles may be replaced once during the lifetime of a building (around year 30) due to wear or esthetic updates. Similarly, fixtures such as water heaters and appliances are expected to be replaced every 10 to 15 years, reflecting typical product lifecycles [107,108]. However, structural elements, the main envelope (the walls and roof), and windows are assumed to last the full 60 years (no full replacements, barring minor repairs). For doors, it is assumed that they will not require replacement or refurbishment throughout the entire lifespan of the house. Also, major refurbishment is not expected within 60 years for this case.
For operational energy data, the present study utilized the cove tool software (a building energy modeling tool) using New Delhi climate data (typical meteorological year file) and standard usage assumptions. The model, simplified from the original BIM geometry, incorporated the building’s orientation and thermal performance of construction assemblies. The U-value for a 230 mm thick brick wall, roof and single-glazed window was approximately taken according to the Bureau of Indian Standards 2016 [109]. The analysis assumed natural ventilation when outdoor conditions allowed and cooling via split-unit Acs. In winter, small electric heaters were used to maintain 20 °C. Typical occupancy schedules were applied, with lighting loads around 3 W/m2 in the evenings and average appliance loads of about 500 watts [110].
The operational energy consumption (Module B6) calculated through the cove tool simulation was converted to carbon emissions using a regionally appropriate electricity emission factor. Instead of relying on generalized global averages, this study adopted a value of 1.13 kg CO2e/kWh, representative of the Northern India regional grid, as reported in the Central Electricity Authority (CEA) CO2 Baseline Database (Version 20, 2023) [111]. This value reflects the current fossil fuel-heavy generation mix, dominated by coal, and is also consistent with the region-specific defaults used in One Click LCA for Indian projects. For cooking energy, LPG consumption was modeled using an emission factor of 2.983 kg CO2e/kg, in line with IPCC 2006 Guidelines and validated by Indian LCI sources [112]. These emission factors ensure that operational carbon estimates are rooted in an India-specific energy context, enhancing the accuracy and relevance of lifecycle impact results.
At the end of life, waste processing and disposal are assumed to follow the assumptions outlined in the EPDs. For bricks and concrete reused as fill, we gave no credit (conservative, as low-grade reuse). We did account for the fact that landfilling processes emit some methane for wood waste and consume diesel. These data were taken from Ecoinvent modules for construction waste disposal.

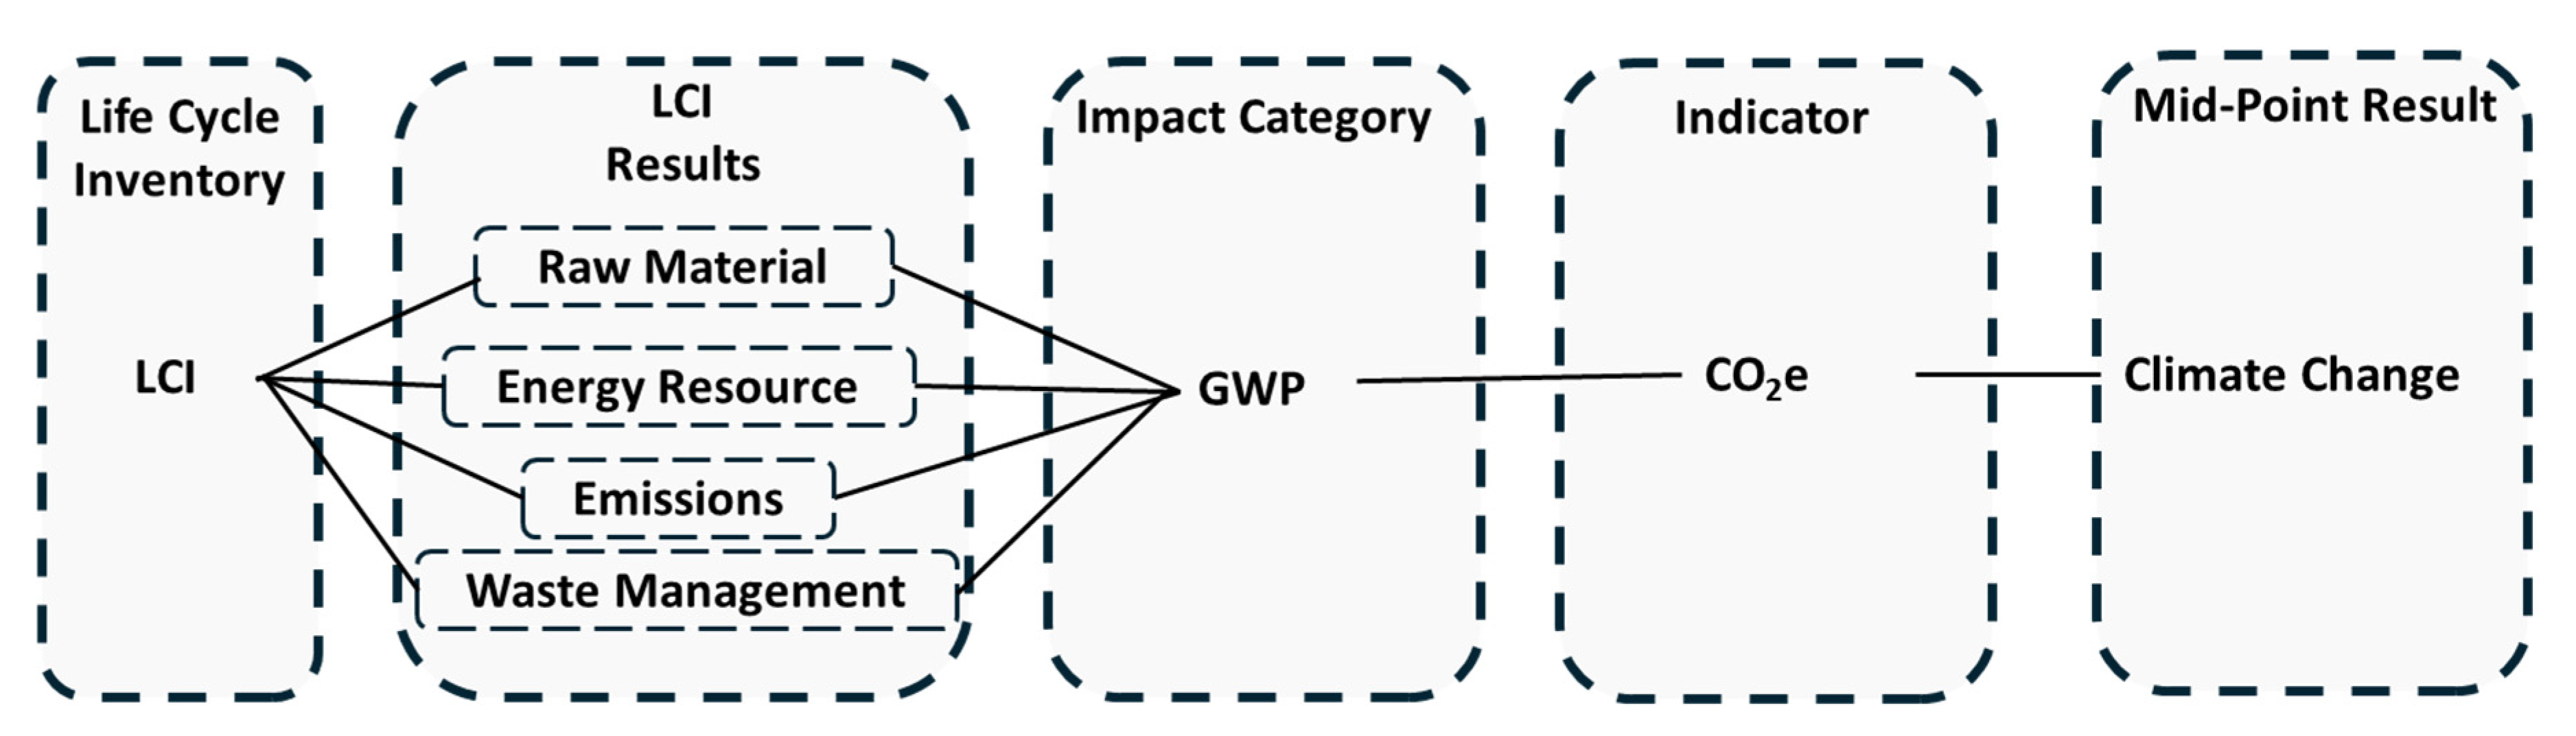
2.2.3. Lifecycle Impact Assessment

The primary impact category of interest is global warming potential (GWP) over 100 years, reported in metric tons of CO2-equivalent (CO2e). We also evaluated Cumulative Energy Demand (CED) in terms of total primary energy use (in GJ) and water usage in cubic meters. Given its focus, this study will report mainly carbon, energy, and water, as well as some insights into material resource use (through total material mass and key contributors). The impact assessment was conducted such that both embodied and operational emissions are included for operational data. The GWP includes CO2 from electricity generation (based on Indian grid mix emissions) and from LPG combustion (CO2 and minor CH4). A detailed framework of the impact assessment is shown in Figure 5. The CML assessment method is conducted by the One-Click LCA tool. The emission factor for electricity generation was assumed constant over the 60-year analysis period, reflecting a business-as-usual scenario. Although future grid decarbonization is anticipated in India, dynamic changes to carbon intensity were not modeled in this study due to scope limitations.

2.2.4. Interpretation

In the results and analysis section, the obtained results were interpreted, generating results of the LCA for decision-making and highlighting opportunities to improve the buildings’ environmental performance. The impact category of this study is climate change, which uses the metric GWP (CO2e) to express the warming of different GHGs, associated with different building materials classified by resource type and mass (kg), energy and end of life as well as the role of BIM-LCA integration and operational performance analysis.

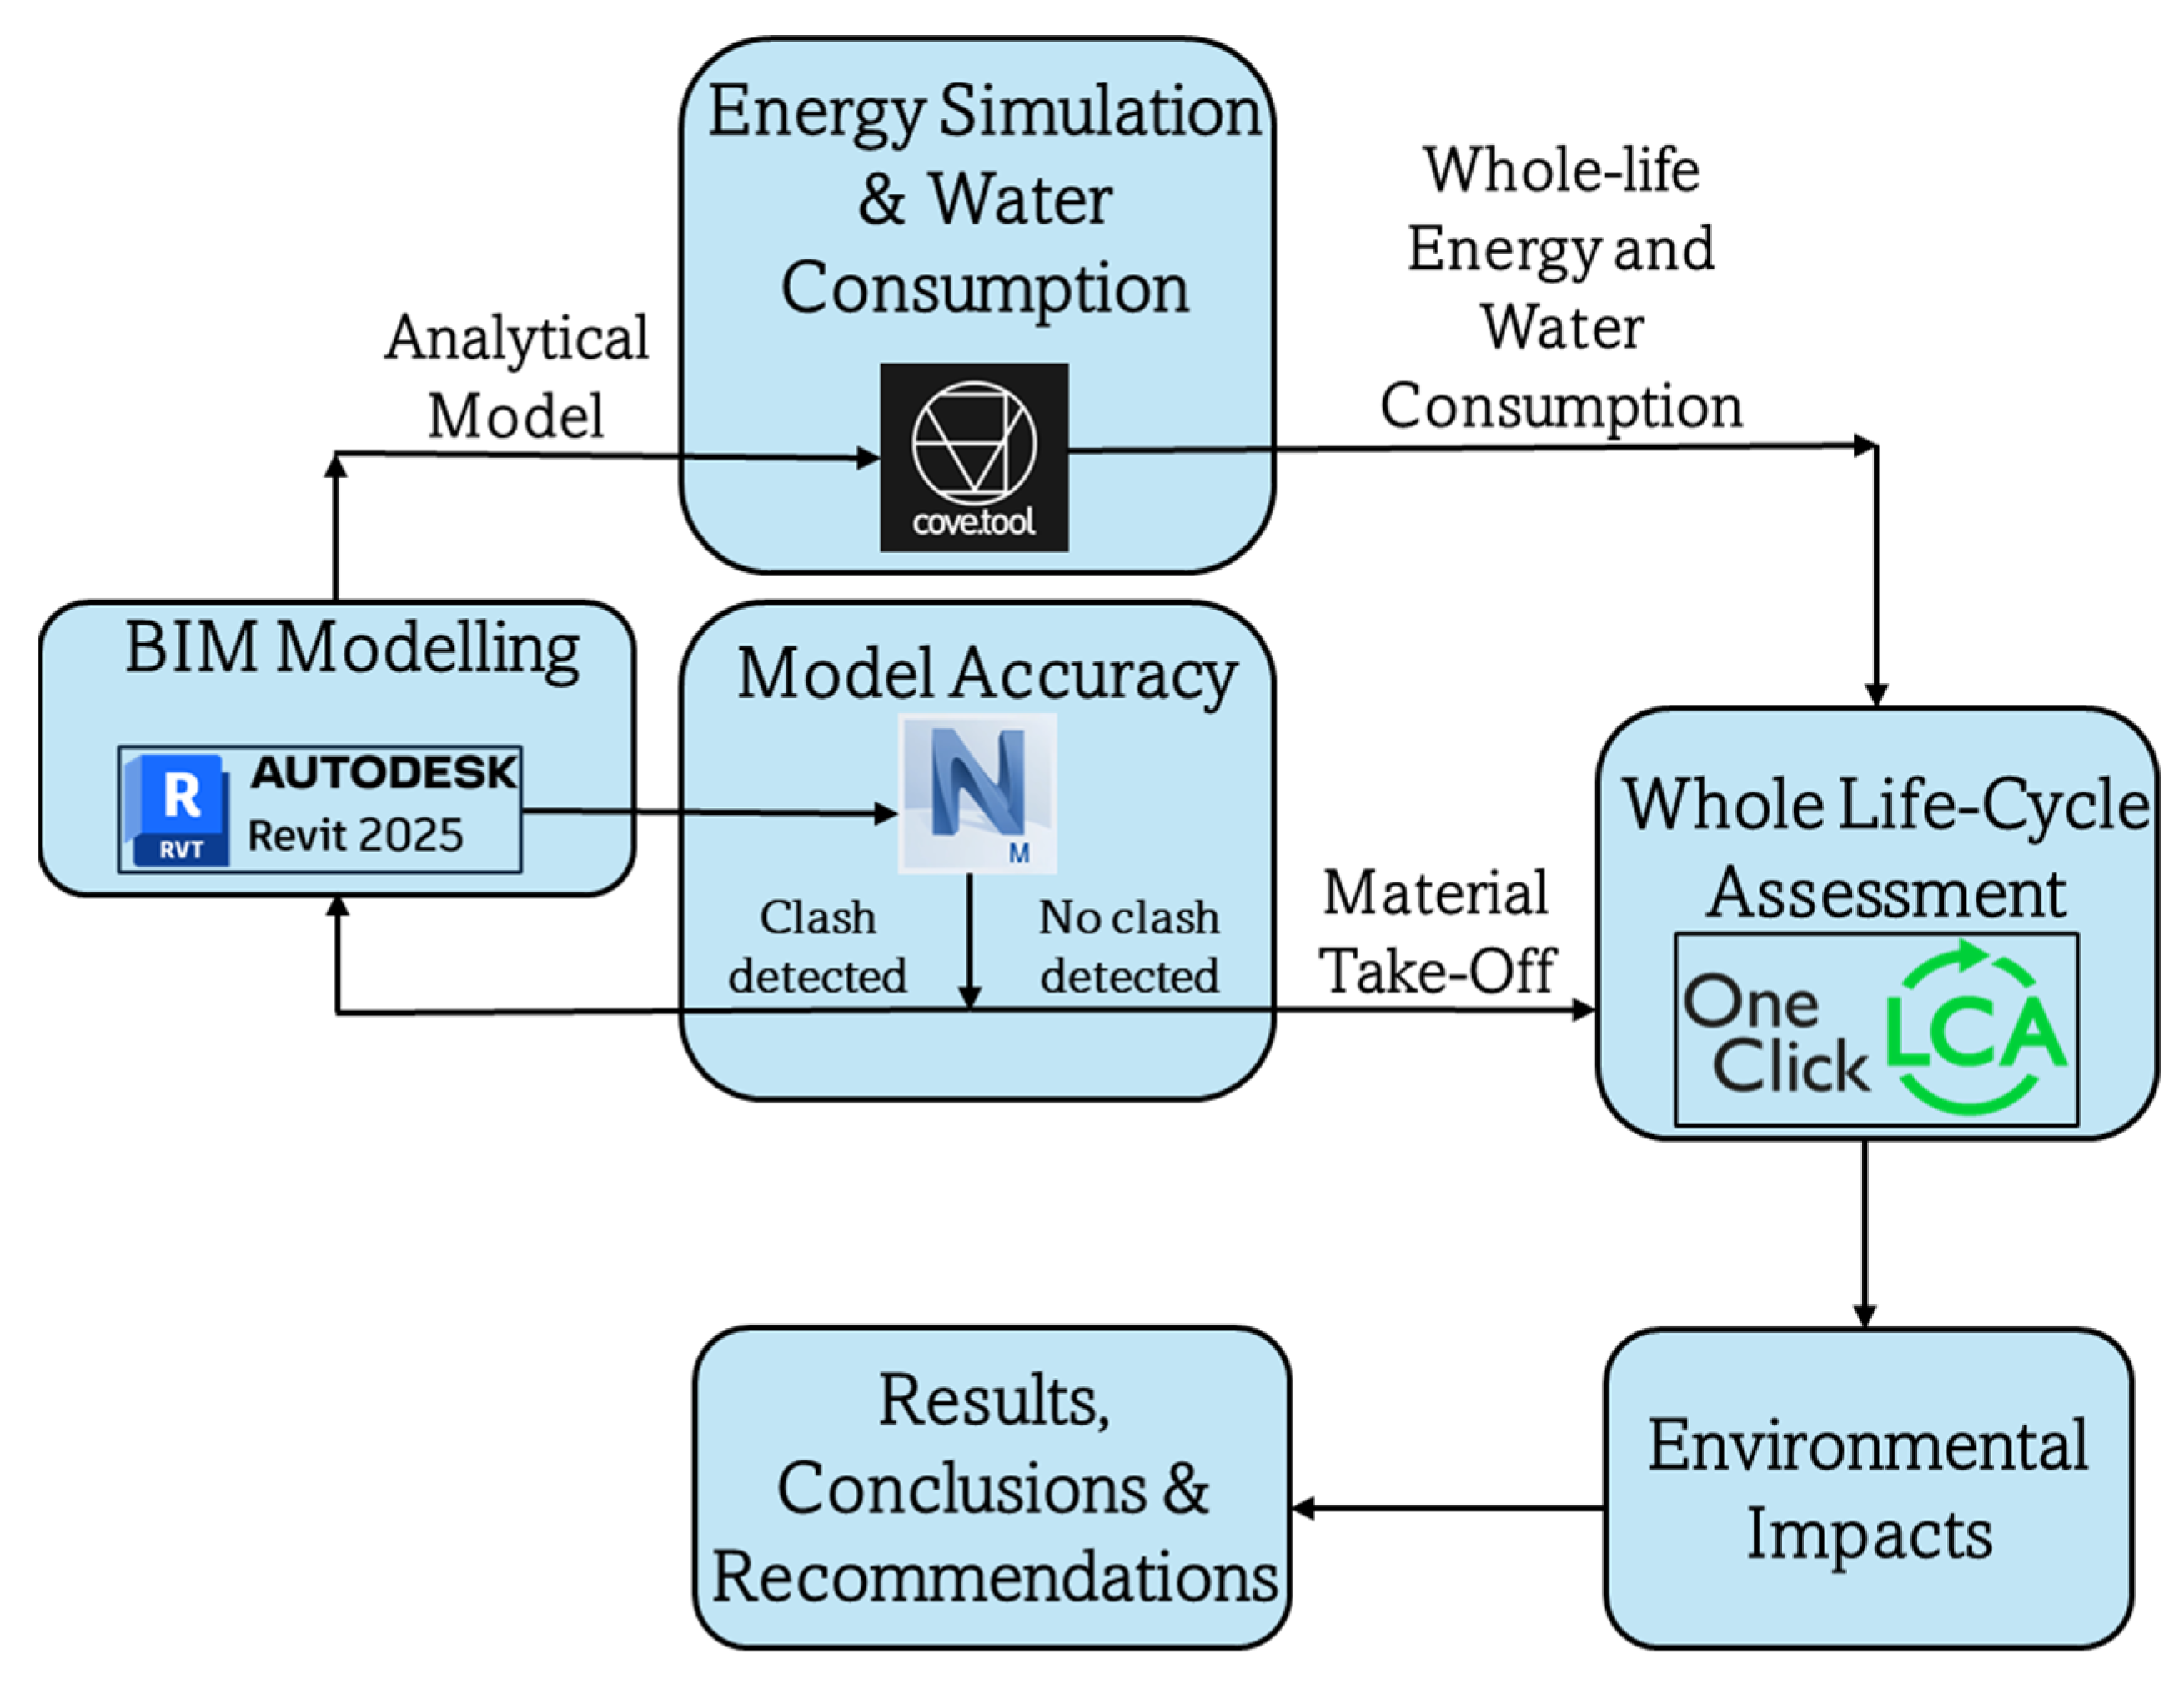
2.3. Model Validation and Quality Assurance

The methodological workflow is initiated with BIM created in Autodesk Revit 2025, a standard industry tool for accurate building representation and documentation. BIM serves as a foundational data-rich digital representation from, from which an accurate analysis can be carried out [114]. A framework for integration of BIM and LCA is shown in Figure 6. To ensure the accuracy and reliability of the BIM data used in this study, the developed Revit 2025 model underwent a detailed quality assurance process. Autodesk Navisworks Manage 2025 was used to perform clash detection, which evaluates whether different building components intersect improperly or violate spatial constraints. The model was found to be clash-free, indicating that all elements (e.g., structural frame, walls, slabs, finishes) were correctly modeled and coordinated.
Only after confirming the absence of geometric or spatial inconsistencies were material quantities extracted for LCA using the built-in material quantity take-off (MQT) functionality in Navisworks. This step ensured that the LCI data used in One Click LCA was based on a geometrically validated and coordinated model, enhancing the accuracy and reproducibility of the lifecycle results. Subsequently, the BIM model seamlessly integrates with cove tool through a dedicated Revit 2025 plug-in, facilitating comprehensive energy and water consumption analyses. Detailed MQT of single-dwelling residential unit in Northern India is shown in Table 2.
For the operational energy assessment (Modules B6 and B7), the building model was simulated using cove tool (2023 version), an automated energy performance software that integrates climatic, spatial, and material data. Precise site selection was used for this study. The location was set to Rohini, New Delhi, allowing the software to automatically select the most appropriate local climate file based on the nearest TMY weather grid. This approach ensures alignment with actual weather patterns of Delhi, which experiences hot and dry summers, a monsoon period, and cool winters—climatically distinct from a composite climate zone according to the NBC.
The building envelope was modeled using custom construction assemblies typical of North Indian urban housing, in line with both LCA inputs and local construction practices. These included
  • Solid brick masonry walls that are 230 mm thick with a U-value of approximately 1.8 W/m2K, [115];
  • A reinforced concrete roof slab (U-value ≈ 1.5 W/m2K), [116];
  • Single-glazed windows with a U-value of approximately 5.3 W/m2K [117].
The building was assumed to be ventilated naturally whenever ambient conditions permitted, using simple operable windows to allow passive airflow. This was modeled in cove tool using the natural ventilation feature, which activates window opening when indoor temperatures exceed 26 °C and outdoor temperatures fall within a comfort band of 23–30 °C. The model applies standard assumptions for air change rates and infiltration, reflecting natural ventilation behavior typical in Indian single-family homes during evenings and shoulder seasons. This approach does not employ a detailed airflow network but simulates passive cooling consistent with actual usage.
For mechanical cooling, non-ducted split air-conditioning systems are widely used in Delhi households, especially in the residential sector, due to their moderate cost and easy installation [118]. The system was manually configured to reflect
  • A cooling setpoint of 27 °C, with activation when indoor temperatures exceeded 30 °C;
  • An average COP (Coefficient of Performance) of 3.2–3.5, representing 3- to 5-star BEE-rated systems available on the Indian market [117].
The energy model incorporated natural ventilation during shoulder seasons, split-unit air conditioners for cooling when indoor temperatures exceeded 30 °C (setpoint 27 °C), and electric space heaters in winter when indoor temperatures fell below 15 °C (setpoint 20 °C). No centralized HVAC or forced mechanical ventilation was included, aligning with actual construction and appliance practices in middle-income Indian housing. These configurations were selected over standard ASHRAE 90.1 defaults to ensure that the model accurately reflects realistic user behavior and technology choices in Delhi. Lighting loads were set at 3 W/m2 in occupied zones during the evening, and appliance loads averaged 500 W per household. Based on this configuration, the annual electricity consumption was calculated at 71.76 kWh/m2/year, with cooling contributing ~60%, heating ~10%, and lighting/appliances ~30% to the total. Additionally, the household used 10 LPG cylinders/year (≈140 kg) for cooking and 232.2 m3/year of water, which were also included in the lifecycle inventory. The whole-building LCA is executed using One Click LCA, enabling the precise quantification of embodied carbon emissions and assessing comprehensive environmental impacts derived from material and construction choices. Finally, insights gained from the energy simulation, water consumption analysis, and lifecycle assessment are synthesized into clear results, conclusions, and actionable recommendations aimed at substantially minimizing environmental impacts and maximizing sustainability. This integrated BIM-to-LCA methodology empowers informed decision-making early in the design phase, significantly enhancing sustainability and operational efficiency throughout the building’s lifecycle.

3. Results

3.1. Energy, Water and Climate Analysis

The analysis evaluated Energy Use Intensity (EUI), water consumption, and conducted detailed climate analysis using cove tool to support sustainable design decisions. The building energy simulation was conducted using weather data representative of New Delhi, India. The region experiences a composite climate characterized by extremely hot summers (temperatures exceeding 40 °C), a monsoon season with high humidity between June and September, and mild winters with temperatures occasionally dropping to 5–7 °C. These conditions necessitate cooling during most of the year, while heating requirements are minimal. Solar radiation levels are relatively high, with an annual average of about 5.5 kWh/m2/day, supporting passive strategies like shading and natural ventilation during transitional seasons. This climatic context informed the choice of envelope materials and operational energy modeling parameters in the study.

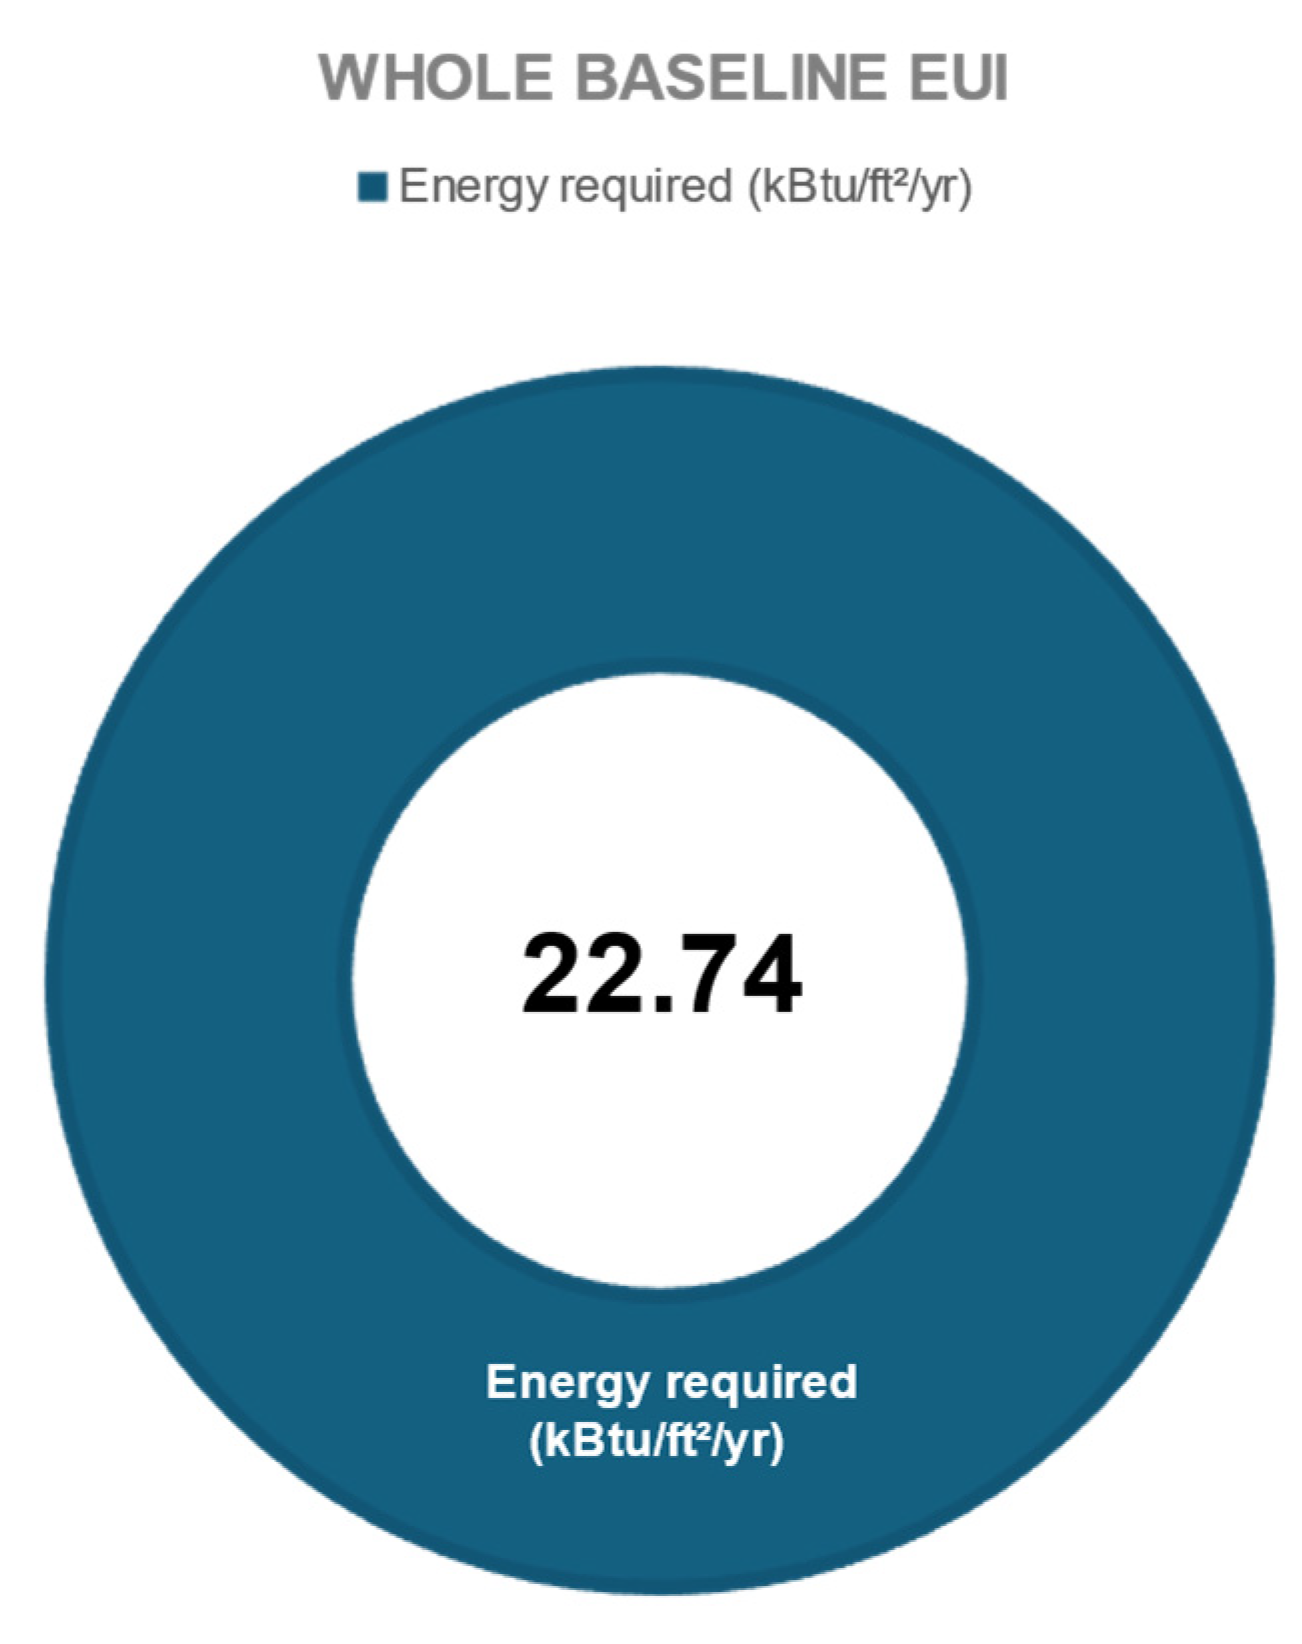
3.1.1. Energy Use Intensity (EUI)

The analyzed typical single-family residential dwelling unit situated in New Delhi demonstrated an EUI of 71.76 kWh/m2/year (22.74 kBtu/ft2/year). The unit kBtu/ft2/year represents British thermal units of the energy consumed of a building area annually, commonly used to measure building energy use intensity. Figure 7 indicates that the whole baseline EUI of the study area. The analysis highlighted equipment (39.15%) and fan energy (27.77%) as the dominant sources of energy consumption, with lighting also contributing significantly (18.87%). Strategies such as upgrading equipment efficiency, improving fan controls, and optimizing daylighting can substantially reduce the overall energy demand, helping to achieve future sustainability targets.

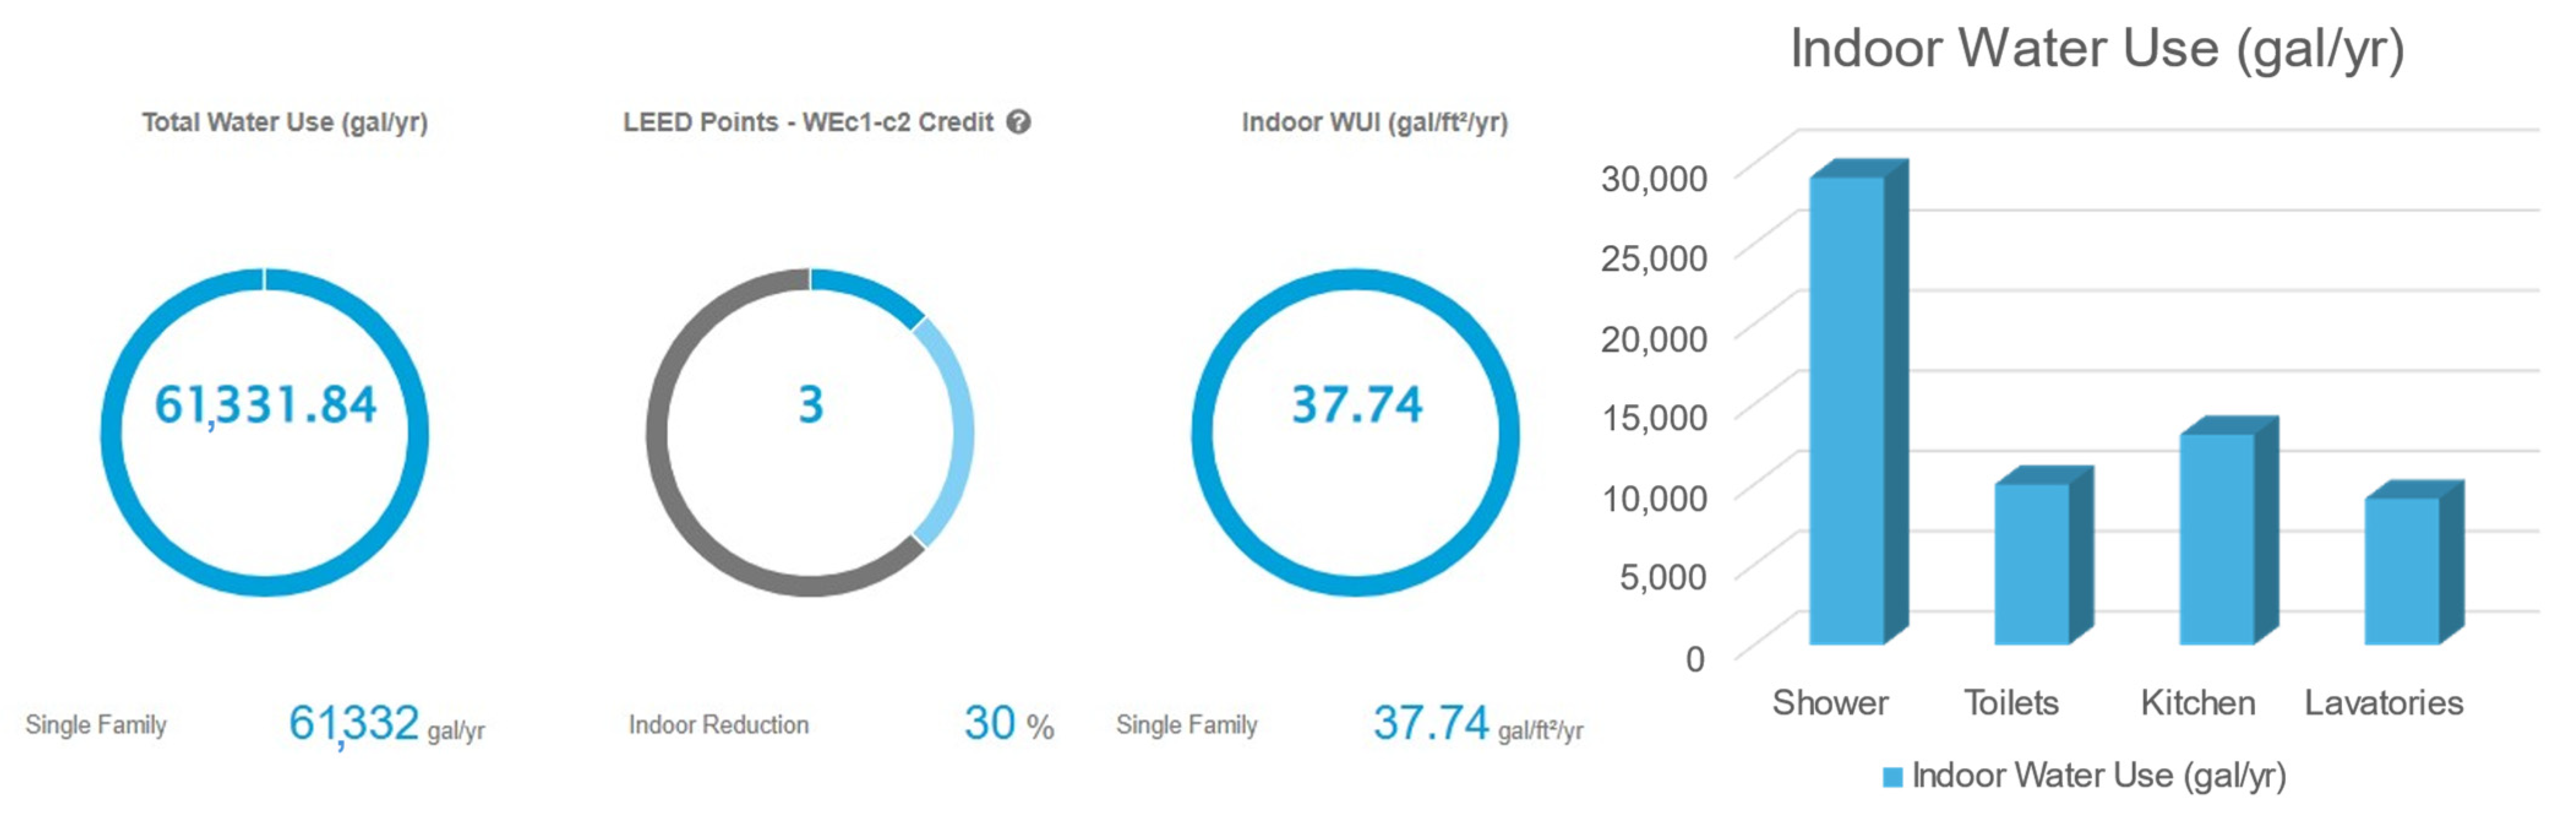
3.1.2. Water Consumption

The annual water consumption of the typical residential dwelling unit in Northen India is approximately 232.12 cubic meters per year (61,332 gallons), indicating substantial indoor water use, while no irrigation or outdoor water consumption was recorded, as shown in Figure 8. The Indoor Water Use Intensity (WUI) for the studied residential building is estimated at 37.74 gallons per square foot per year, reflecting the total indoor water consumption normalized by the building’s floor area. Based on water-efficient fixtures and strategies, the model projects a potential indoor water use reduction of approximately 30%. This level of reduction qualifies the project to earn 3 LEED points under the Water Efficiency credits WEc1 and WEc2. These credits are awarded as part of the LEED v4 rating system for demonstrating a reduction in indoor potable water use from a calculated baseline [119]. Detailed indoor consumption analysis reveals that showers contribute most substantially to water use, followed by kitchen activities, toilets, and lavatories. The data clearly emphasize showers as the primary area to target for water conservation measures, suggesting that the implementation of low-flow fixtures and efficient appliances could notably decrease overall water consumption and further enhance building sustainability.

3.2. Lifecycle Impact Breakdown by Stage

The LCA results reveal the distribution of environmental impacts across the lifecycle stages of the single-family house. Table 3 summarizes the contributions of the main stages to total GHG emissions (carbon footprint), cumulative energy use emission, and water usage emission over the 60-year life span.
From the above results, the analysis of the building’s lifecycle carbon footprint indicates a total global warming potential of 5.884 tonne CO2e. The most significant contributor to the building’s carbon footprint is energy consumption (B6), accounting for 508,314 kg CO2e, followed by construction materials (A1–A3) contributing 41,947 kg CO2e. Other notable impacts include repair (B3) at 10,328 kg CO2e, and material replacement and refurbishment (B4–B5) at 4261 kg CO2e. The construction process, transportation, and water usage also have measurable but relatively smaller contributions. Normalized per square meter, the building exhibits a carbon intensity of 5844 kg CO2e/m2, reflecting a considerable environmental impact over its lifecycle. This analysis highlights critical areas, particularly energy consumption and material choices, where strategic interventions can significantly reduce the building’s carbon footprint. The One Click LCA Carbon Heroes Benchmark Program is a standardized initiative for measuring embodied carbon in buildings using One Click LCA software version 4.0.8. Developed by Bionova Ltd., it provides consistent, anonymized benchmarks across building types and regions, supporting decarbonization efforts in construction. Following EN 15978 and ISO 21930, it tracks lifecycle stages A1–A3, A4, B4–B5, and C1–C4, covering material production, transportation, replacements, and end-of-life processes. The benchmark dataset, built from hundreds of verified buildings, delivers carbon intensity values (kg CO2-eq/m2) for comparison. The results are categorized into performance bands, helping to assess whether a building’s footprint meets industry norms [120]. This program enhances transparency and policy-making, aiding low-carbon construction decisions globally. The results of the Carbon Heroes Benchmark from One Click LCA software is shown in Figure 9.
The above figure presents the cradle-to-grave carbon footprint assessment (stages A1–A4, B4–B5, and C1–C4) conducted using One Click LCA software. The building demonstrates a carbon intensity of 561 kg CO2e/m2, placing it within category “D” on the scale, which corresponds to moderate environmental impact. According to the classification provided, category “E” falls within the range of 530 to 590 kg CO2e/m2, indicating that the building’s performance is moderate whilst highlighting opportunities for improvement. Efforts in material selection, refurbishment processes, and end-of-life management can effectively enhance its environmental profile, potentially advancing the building toward categories A or B, thereby significantly reducing its lifecycle carbon emissions.

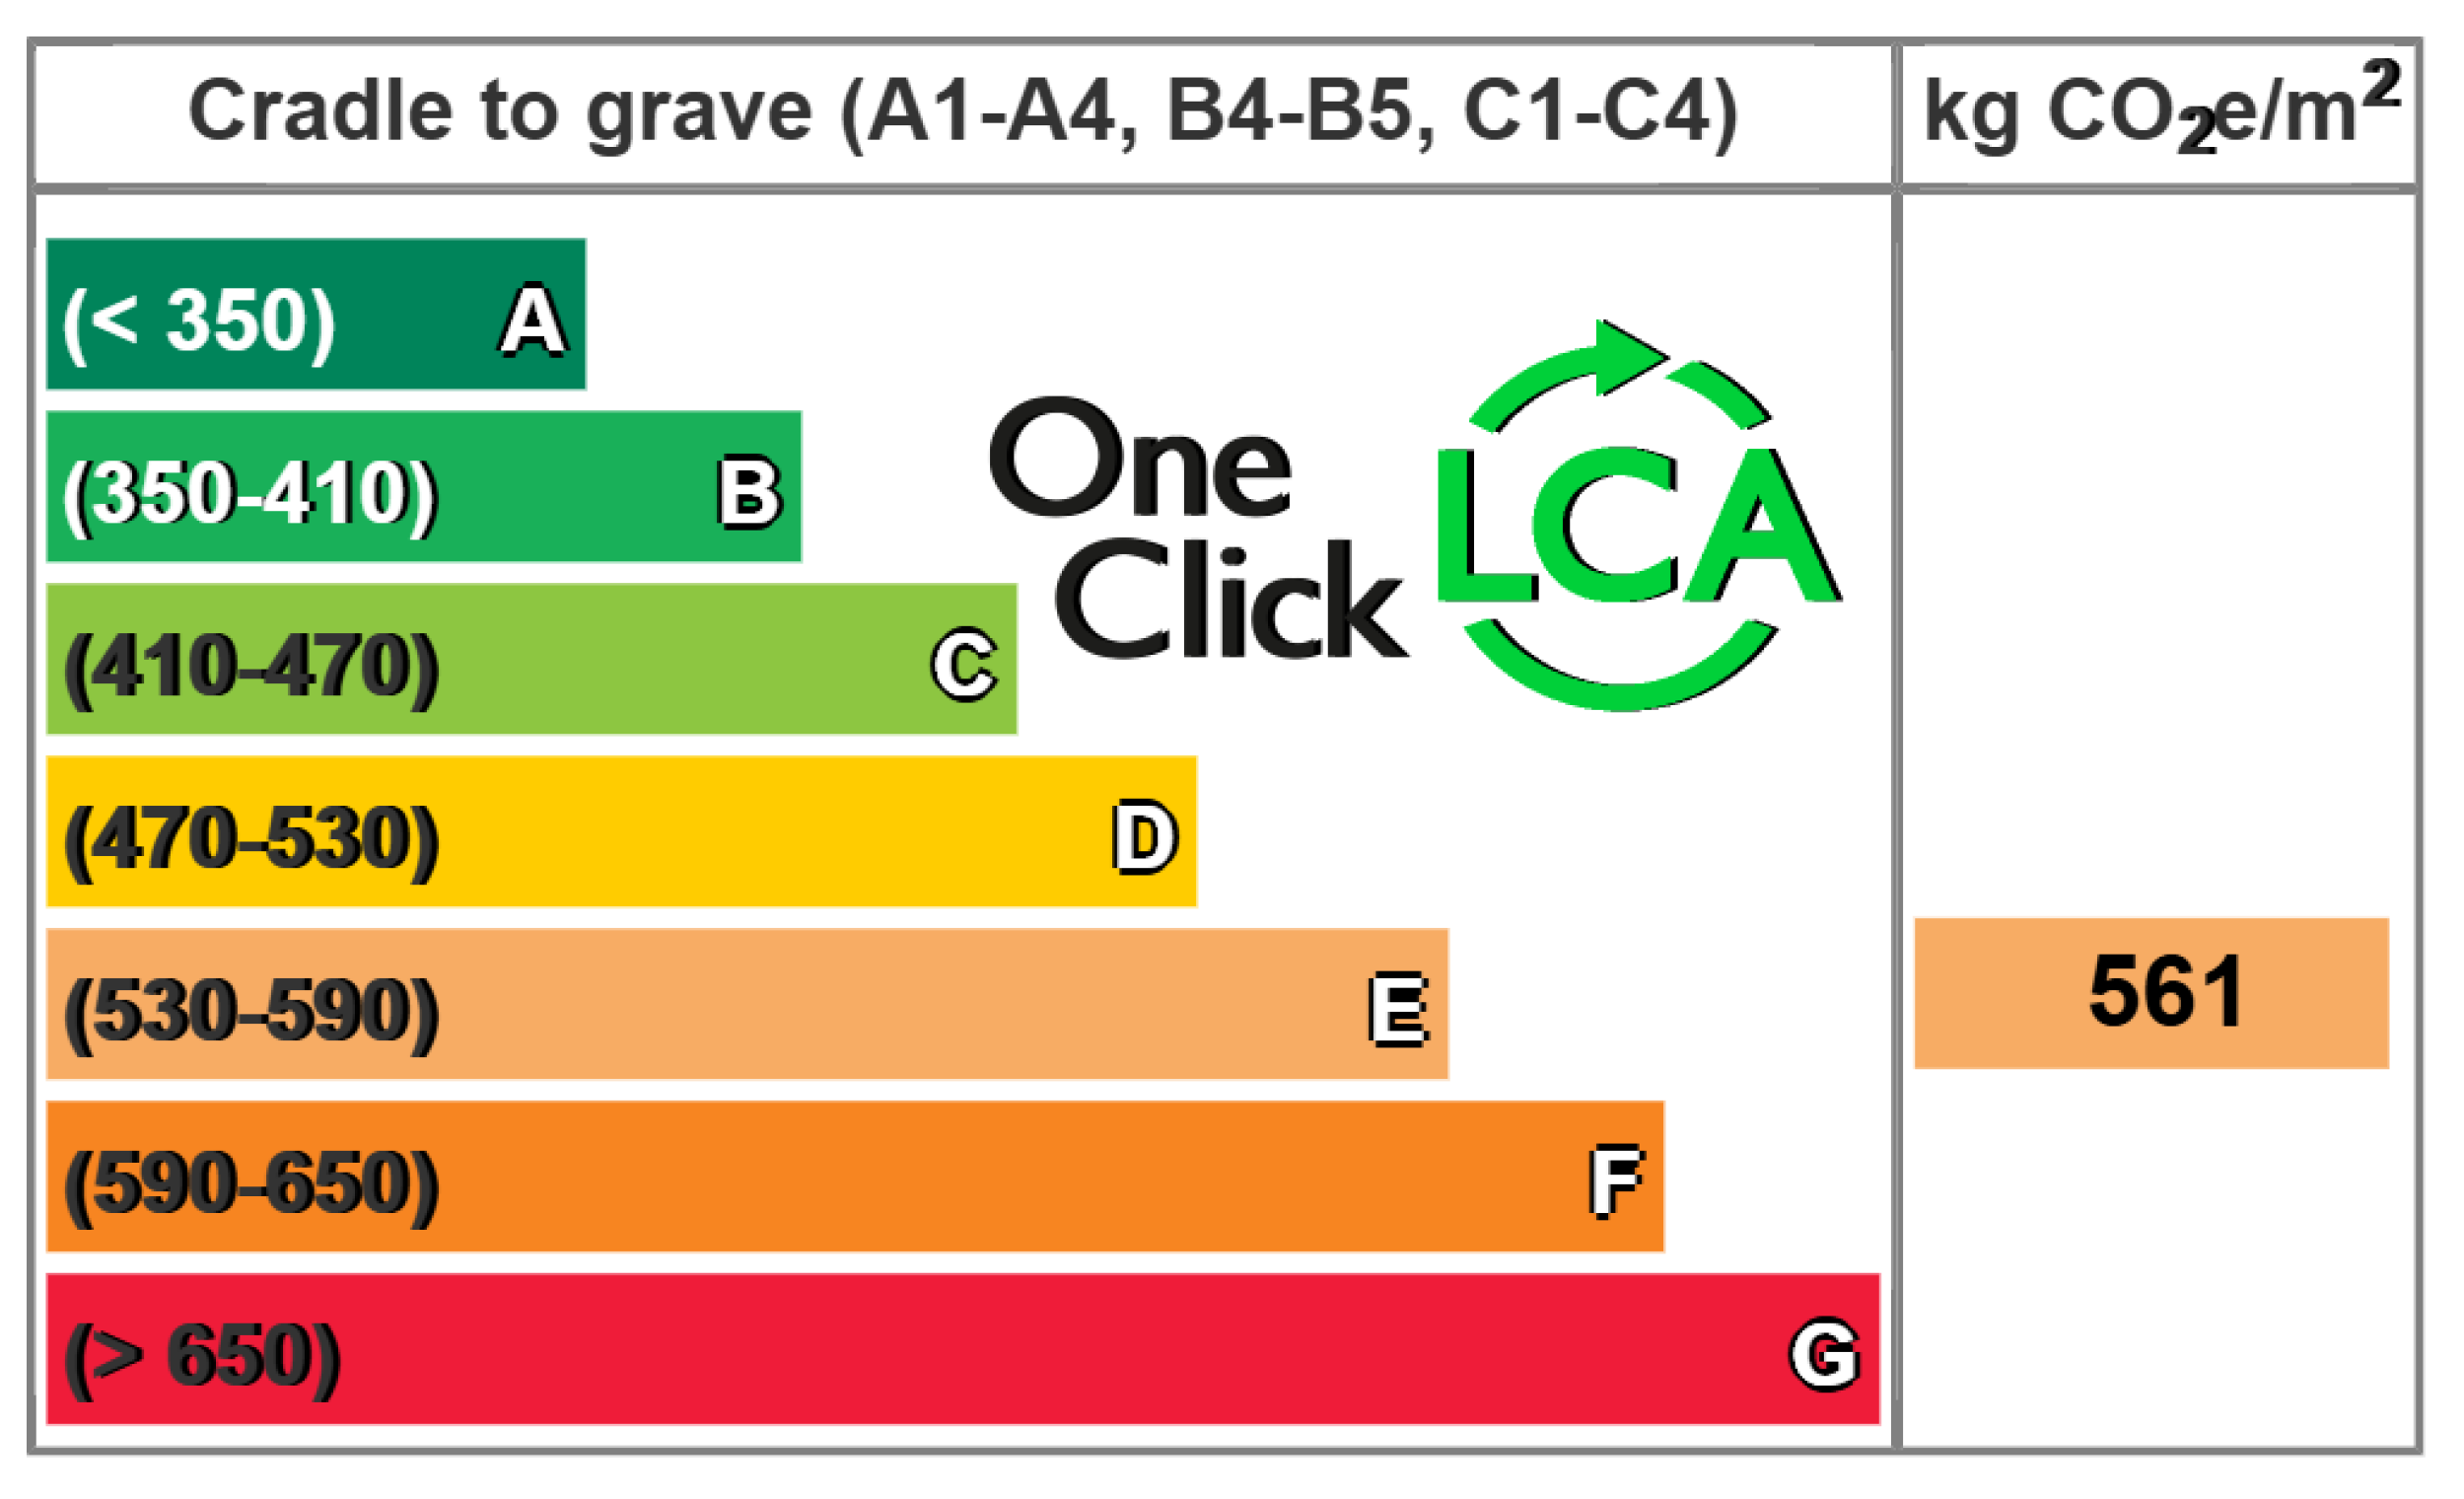
3.2.1. Global Warming Potential (kg CO2e) Across Lifecycle Stages

The lifecycle stage analysis for global warming potential that is shown in Figure 10 reveals that energy consumption (B6) significantly dominates the carbon footprint, accounting for 87.86% of total emissions. Construction materials (A1–A3) also represent a substantial portion, contributing 7.25% to overall carbon emissions. Repair activities (B3) account for 1.79%, indicating notable environmental impacts during the building’s operational life. Other stages, including material replacements (B4–B5, 0.74%), construction (A5, 0.68%), transportation (A4, 0.67%) and water usage (B7, 0.65%), have relatively smaller but collectively meaningful impacts. Minimal contributions are observed from waste transport (C2, 0.14%), maintenance (B2, 0.03%), and end-of-life activities such as deconstruction (C1, 0.1%), waste disposal (C4, 0.09%), and waste processing (C3, ~0%). This detailed distribution underscores the necessity of prioritizing energy efficiency and material selection strategies during the design and operational phases to effectively minimize the building’s lifecycle carbon emissions.

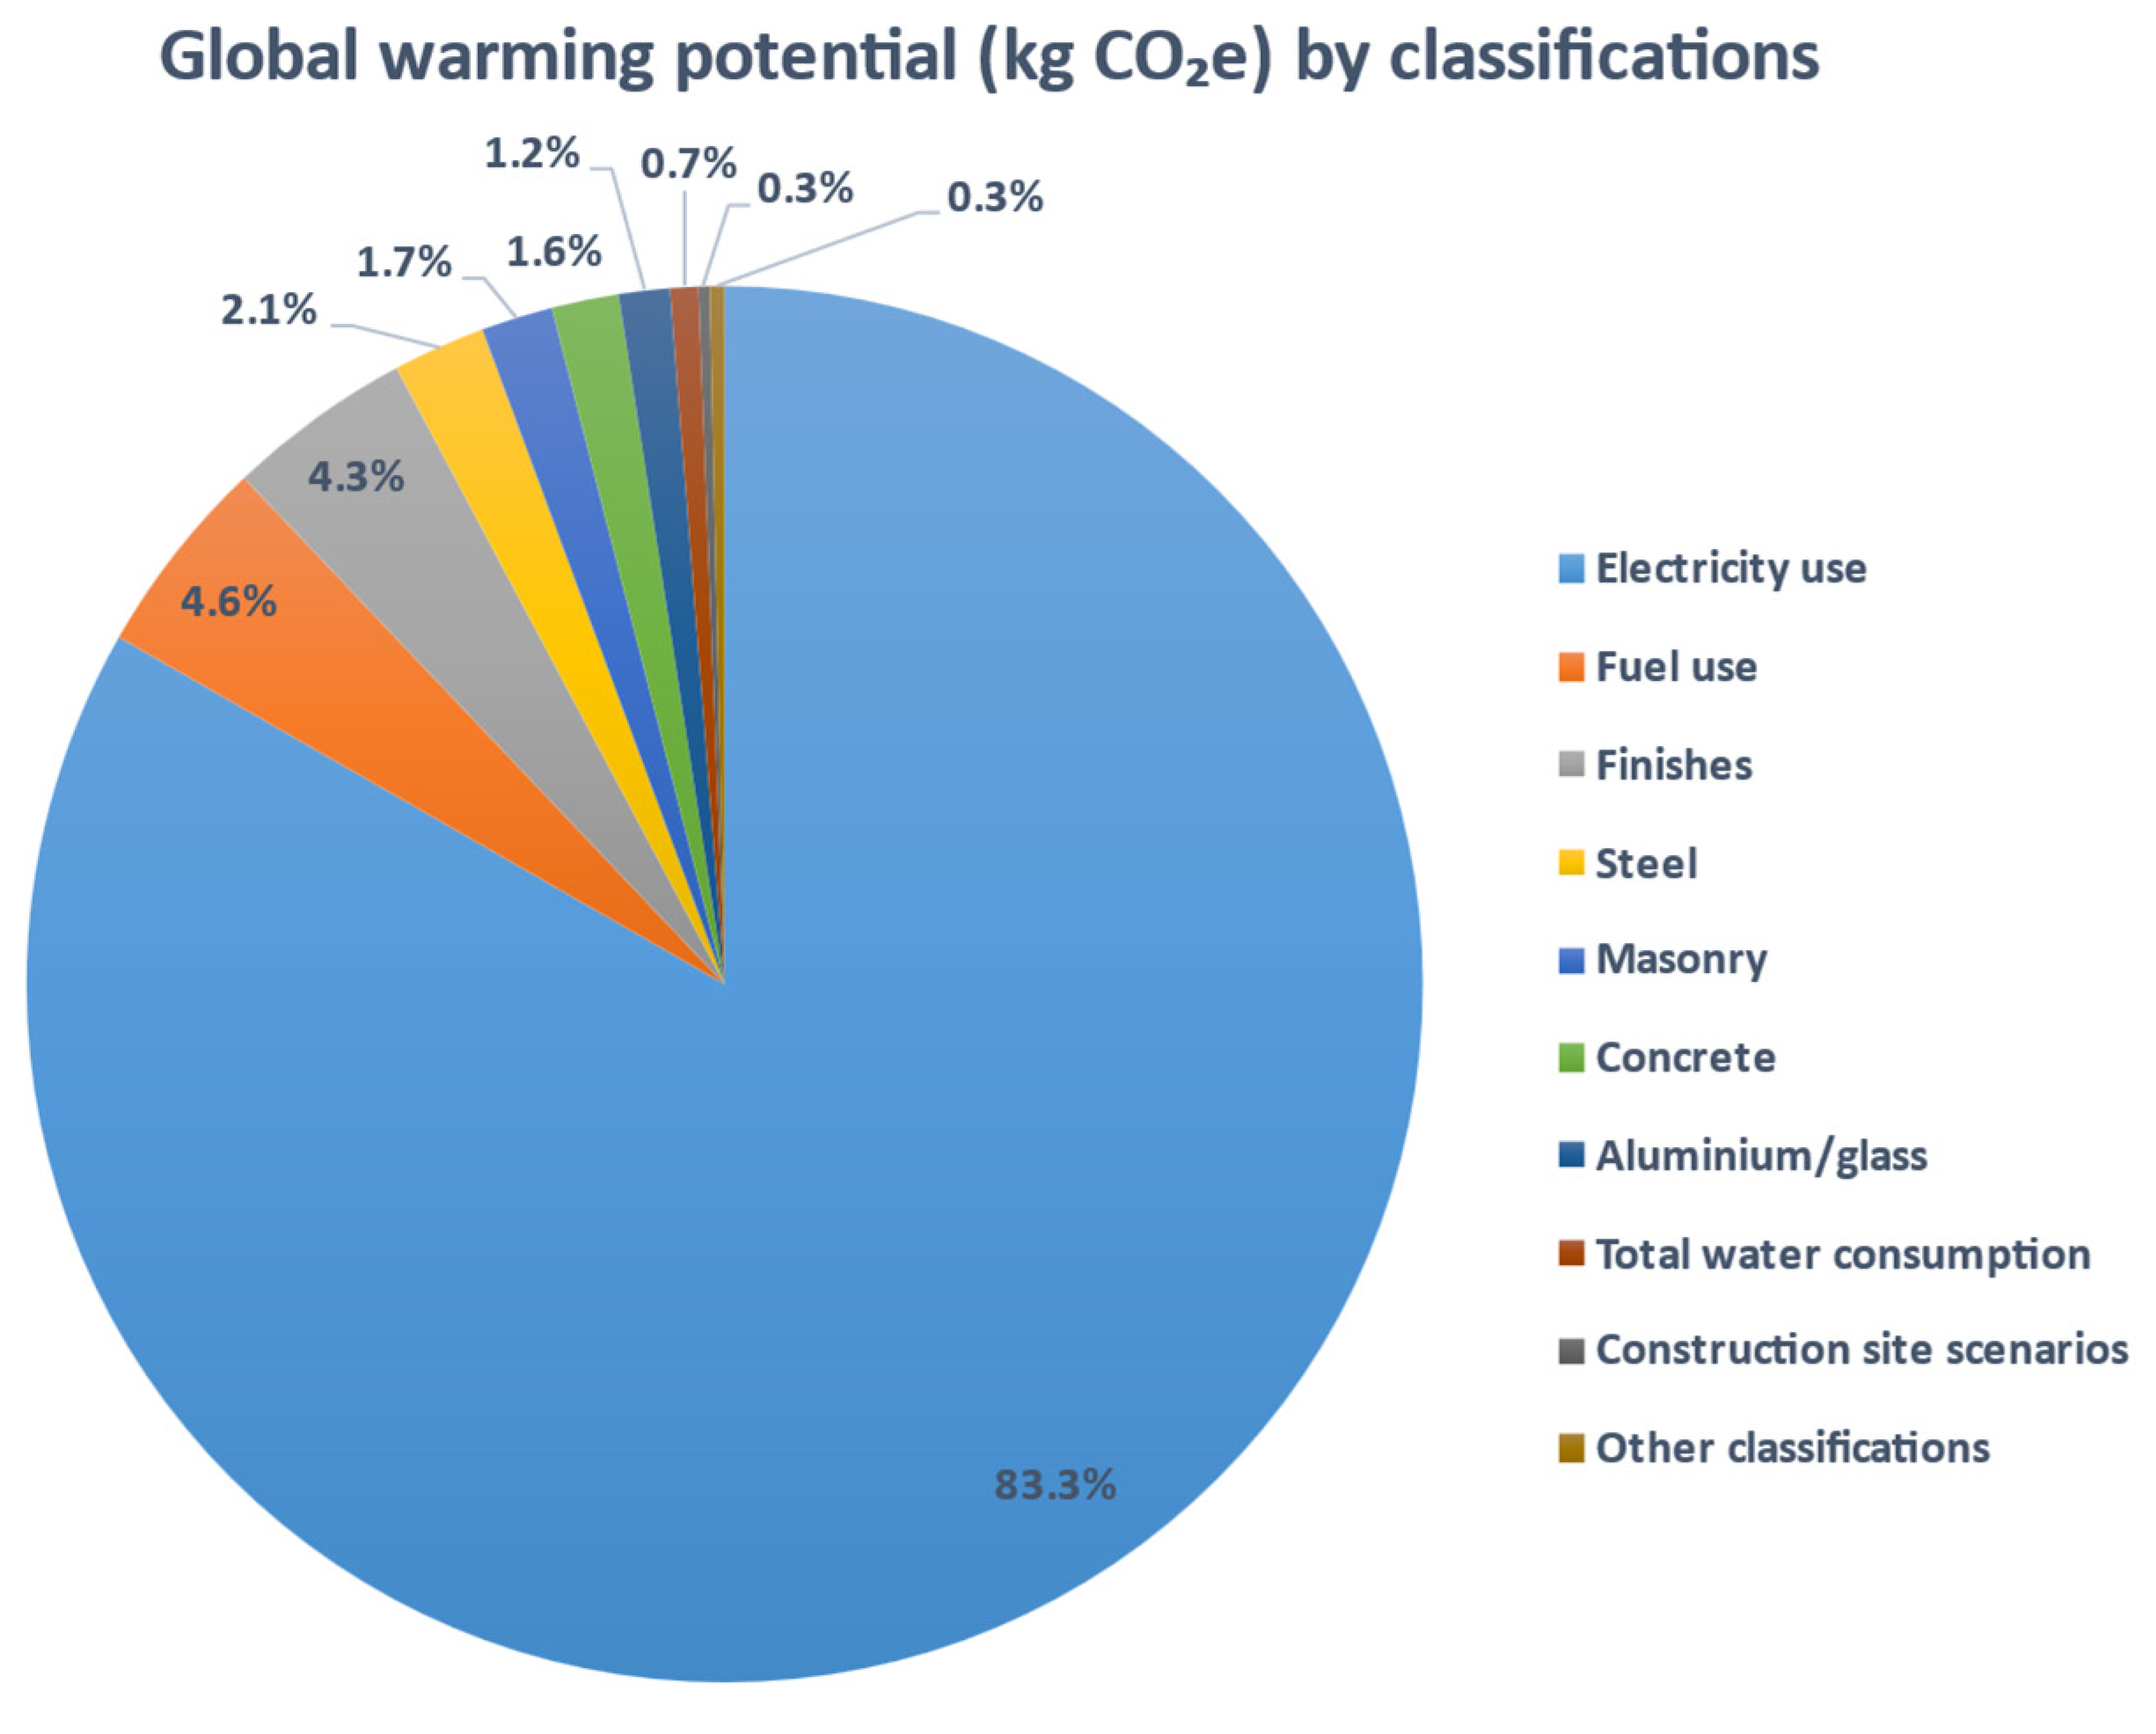
3.2.2. Global Warming Potential (kg CO2e) by Classifications

The classification-based analysis of global warming potential is shown in Figure 11 and identifies electricity usage as the leading contributor, accounting for 83.2% of total carbon emissions. Fuel use significantly impacts emissions as well, contributing 4.6%. Among structural components, external walls and façade material finishes represent a substantial share (4.3%), closely followed by concrete in floor slabs, ceilings, roofing decks, beams, and roofs (1.6%). Windows and doors account for 1.2%, while steel used in the concrete element section collectively contributes (2.1%). Water consumption (0.3%), other miscellaneous structures and materials (0.3%) and other classifications (0.7%) have comparatively smaller yet relevant environmental impacts. The data emphasize significant opportunities to reduce building carbon footprints through enhanced energy efficiency and the thoughtful selection of materials for key structural elements.

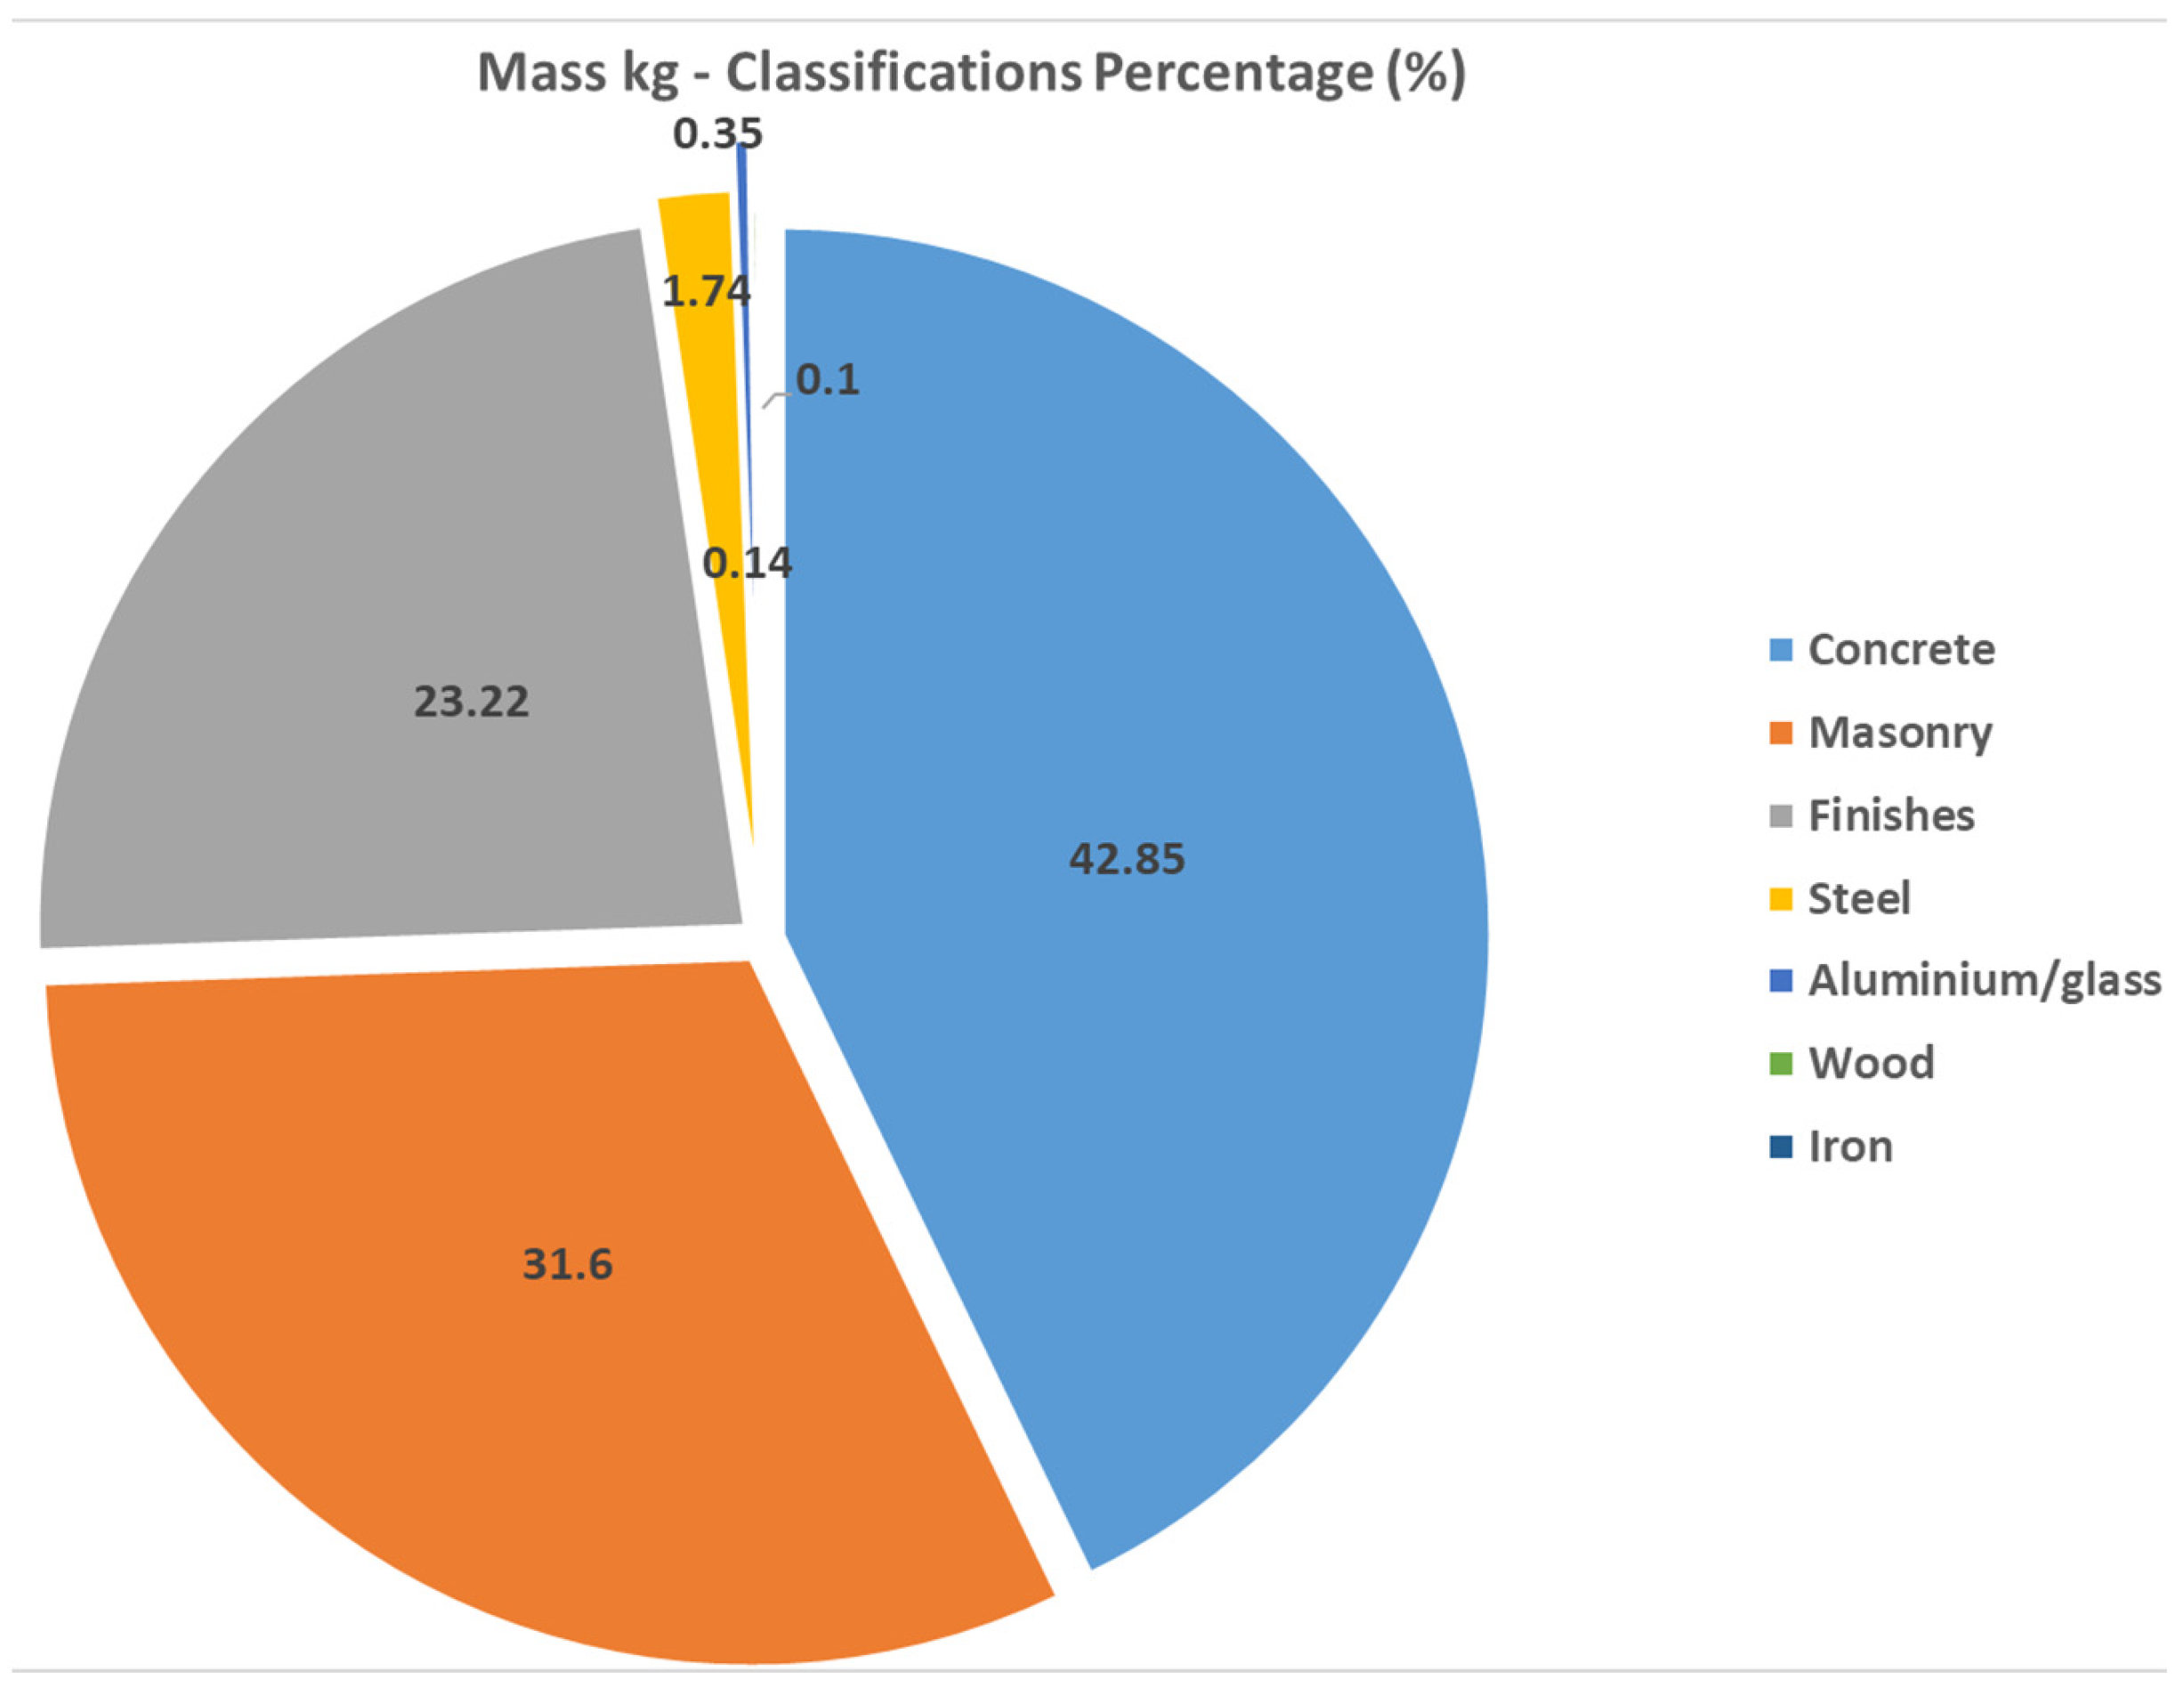
3.2.3. Global Warming Potential (kg CO2e) by Resource Types and Mass Classification (kg)

The mass distribution across building material classifications is shown in Figure 12 and indicates that concrete, used predominantly in floor slabs, beams, roofing decks, and structural frames, accounts for the largest share at 42.85%. This is closely followed by masonry, comprising 31.6%, largely attributed to load bearing walls and partitioning elements. Finishes including plaster, cladding, and flooring layers make up 23.22%, indicating a significant contribution to the total mass despite their generally nonstructural nature. Steel elements contribute 1.74%, typically representing reinforcement and structural supports. Aluminum/glass systems, wood, and iron are minimal contributors at 0.35%, 0.14%, and 0.1%, respectively, primarily associated with fenestration, detailing, and ancillary fittings. This breakdown highlights concrete and masonry as dominant targets for material substitution or optimization to achieve impactful reductions in embodied carbon. Emphasis on material efficiency, especially in high-mass components, is crucial for advancing sustainable building practices.

3.3. Integration of BIM-Based Workflows with LCA

One of the objectives of this study was to demonstrate the utility of integrating BIM with LCA and energy simulation for a comprehensive sustainability analysis. In practice, the use of the BIM model (Revit, Navisworks manage, cove tool) in conjunction with OneClick LCA software proved highly effective. By linking the digital model to environmental data, we were able to rapidly compute the impacts of design choices and easily update the results if the design changed. The integration of BIM with LCA and energy modeling proved to be a powerful approach for conducting the assessment. It allowed for the detailed tracking of material quantities and facilitated scenario analyses to test the impact of design changes on both embodied and operational performance. By using the BIM software (Revit 2025, Navisworks manage 2025, cove tool v4.0.2) and OneClick LCA version 4.0.8, we ensured a high level of data accuracy and consistency in the inventory. This approach also demonstrated how design teams can obtain immediate feedback on the sustainability implications of their choices. Chou et al. (2006) found that incorporating up to 60% fly ash in brick manufacturing can effectively reduce carbon emissions while maintaining structural integrity [121]. Similarly, Rahmat and Saleh (2023) demonstrated that fly ash bricks made from industrial waste significantly lower equivalent CO2 emissions compared to traditional clay bricks [122]. Further, Fernández-Pereira et al. (2011) explored the potential of biomass gasification fly ash in bricks, highlighting its environmental and economic benefits [123]. These studies collectively reinforce the 40–60% CO2 reduction potential of fly ash bricks, supporting their role in sustainable building materials.
In summary, the use of BIM-LCA in tandem enabled a richer analysis:
  • We ensured data consistency (the same building geometry and specs used for both energy and LCA, avoiding double modeling errors).
  • We could visualize impacts via BIM (for example, producing color-coded models showing the carbon intensity of each building element to communicate hotspots to the design team).
  • We improved collaboration: multiple stakeholders (architects and sustainability consultants) could use the same BIM model to derive the info they need, which aligns with the benefits of BIM noted in the literature (improved information exchange and decision-making).
The successful use of these digital tools in our study suggests that the wider adoption of BIM-LCA workflows in the building industry could greatly aid sustainable design, enabling architects and engineers to routinely perform whole-building LCAs as part of the design process rather than as afterthoughts.

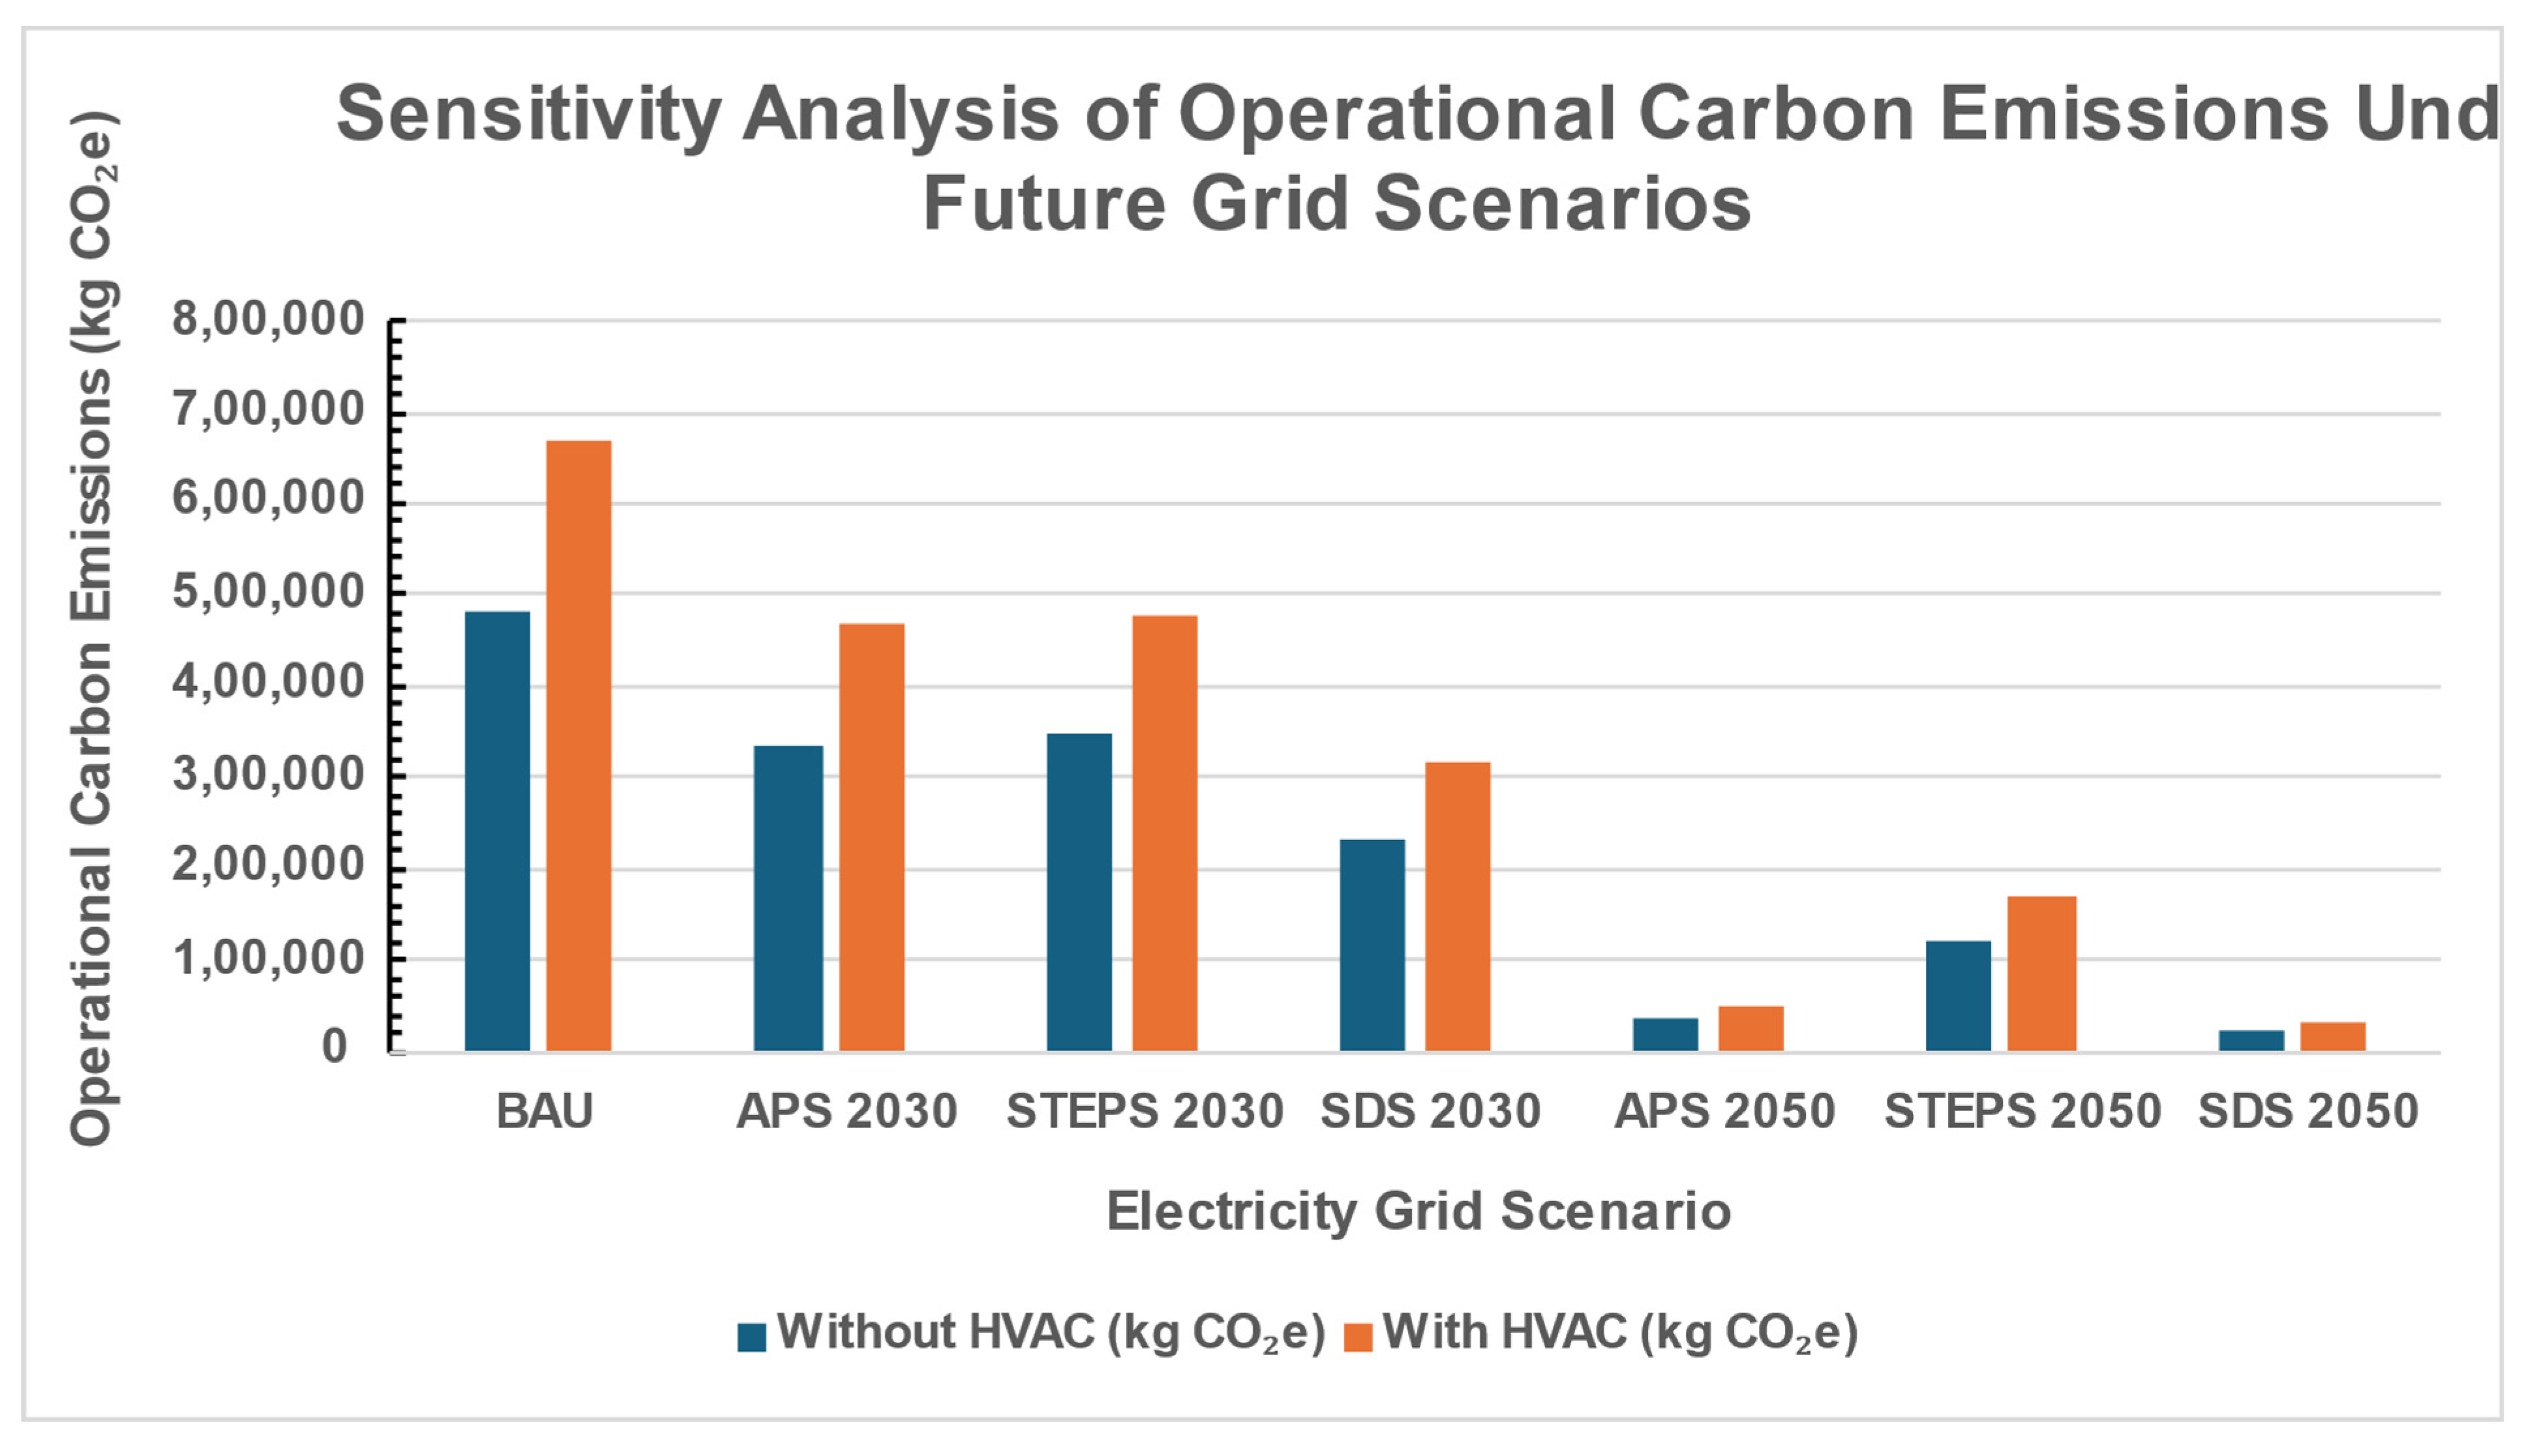
3.4. Sensitivity Analysis of Grid Emission Scenarios

To assess the influence of projected electricity grid decarbonization on operational carbon emissions, a sensitivity analysis was conducted using three future electricity grid mix scenarios provided by Sphera’s India-specific LCI datasets for the years 2030 and 2050 [124]. These scenarios correspond to the following policy pathways:
  • APS (Announced Pledges Scenario).
  • STEPS (Stated Policies Scenario).
  • SDS (Sustainable Development Scenario).
To illustrate the impact of decarbonization pathways, we modeled two operational energy scenarios: one with minimal mechanical cooling (natural ventilation-based, business as usual) and another with active HVAC usage. In each case, annual electricity consumption was multiplied by the projected grid emission factors for the corresponding years and scenarios.
The full numerical results of this sensitivity analysis, including emission projections for each scenario, are provided in Supplementary Tables S3 and S4. These tables include emission values in kgCO2e per year and percentage reductions compared to the baseline assumption of a constant emission factor.
This analysis reveals that future grid decarbonization alone, as projected under India’s evolving policy commitments, can lead to significant reductions in operational carbon emissions, even without any changes in household behavior or energy efficiency measures. The SDS pathway, which assumes aggressive renewable energy expansion and policy enforcement, could achieve over 95% reduction by 2050. These results highlight the importance of aligning building design practices with long-term national decarbonization trajectories. However, in the near term (for example, by 2030), the need for demand-side interventions, such as passive cooling, low-energy appliances, and building envelope improvements, remains crucial to achieve substantial emission reductions under slower policy scenarios like APS or STEPS.
Figure 13 illustrates the sensitivity of operational carbon emissions to projected changes in India’s electricity grid carbon intensity under various policy scenarios. The results are presented for both configurations, with and without HVAC systems, to highlight how energy demand profiles influence total emissions. Under the BAU scenario, the operational emissions reach approximately 668,000 kg CO2e with HVAC, and 482,000 kg CO2e without HVAC. However, emissions decrease sharply under more ambitious decarbonization pathways. For instance, in the SDS 2050 scenario, emissions fall to just 30,134 kg CO2e with HVAC and 21,728 kg CO2e without HVAC, representing a reduction of over 95 percent compared to BAU. These findings demonstrate that aligning building performance with national decarbonization efforts can result in substantial long-term emission savings, even without modifying end use behavior or equipment.

4. Discussion

This research presented an LCA impact assessment of a representative single-family residential house in North India, combining BIM-based material quantification, operational energy simulation, and LCA to evaluate embodied carbon, energy use emission, water use emission, and overall carbon assessment. The key findings from this study are as follows.

4.1. Embodied vs. Operational Carbon Significance

The results for the case study house illustrate the relative importance of EC versus OE over its lifecycle. OE (primarily from the use-phase energy consumption) was higher than EC, but not overwhelmingly so. Over the 60-year lifespan, operational energy use (module B6) accounted for about 87.86% of the total GWP, while the initial embodied carbon from material production and construction (modules A1–A3) contributed roughly 7.25%. Including other lifecycle stages like maintenance, repairs, and replacements brings the cumulative embodied share to nearly 2.56% of total emissions.
This finding underscores that focusing only on operational efficiency, as is common in building practice, overlooks a substantial portion of emissions. With energy codes and efficiency improvements gradually lowering operational energy use (and with the grid expected to decarbonize over time), the proportional impact of embodied carbon will likely grow. Therefore, embodied carbon is a critical consideration for long-term emission reduction [125].
Notably, the unusually high proportion of operational carbon observed in this study, approximately 90%, is significantly greater than the conventional 75–25% operational-to-embodied split typically reported for buildings. This elevated share reflects the carbon-intensive nature of India’s current electricity grid, where coal-based generation continues to dominate [126]. While improving building-level efficiency and adopting low-carbon materials are essential strategies, the systemic decarbonization of the national energy infrastructure is equally critical. Without substantial reductions in grid emission intensity, opportunities for lowering operational carbon will remain constrained. Therefore, achieving meaningful lifecycle carbon reductions demands integrated efforts that align building design improvements with broader energy sector transitions toward renewable sources [127].

4.2. Major Building Materials Driving Embodied CO2

The analysis identified which building materials contribute most to the EC of the house, answering the third research question. Cement-based materials (ready-mix concrete and plaster) and steel emerged as the dominant sources of embodied CO2. Specifically, the cement mortar used in brick masonry and plaster (a mix of cement and sand) was responsible for about 4.4% of the total CO2e, making it the single largest material contributor. Reinforcing steel (rebar) embedded in concrete elements was the next major contributor, at roughly 2.1% of total emissions. Among bulk construction materials, burnt clay bricks themselves contributed around 1.7%, and the cast-in-place concrete (M25) used for foundations, slabs, and columns contributed approximately 1.6%. In sum, these four material categories—mortar (cement), steel rebar, bricks, and concrete—together accounted for a significant portion of the building’s lifecycle carbon footprint, reflecting the carbon-intensive nature of conventional masonry and structural components [128,129].
Looking at the contribution by the building subsystem further reinforces this point. The external walls and façades (composed mainly of brick and mortar) alone accounted for roughly 6.1% of total emissions, while the floor slabs, roof deck, and other structural frame elements (primarily concrete and steel) added about 3.7%. By contrast, less mass-intensive components had smaller impacts—for instance, all windows and doors combined (including glass and aluminum frames) contributed ~0.35% of emissions, and interior partition materials had even less. This hierarchy of impacts indicates that any strategy to reduce embodied carbon should prioritize high-impact materials: cement and concrete, steel, and clay bricks. Replacing or reducing the use of Portland cement (e.g., using blended cements with fly ash or slag in mortar and concrete) and optimizing structural design to use less steel and concrete can yield substantial carbon savings [130]. The results clearly highlight these materials as key hotspots for intervention in sustainable residential construction [131].

4.3. BIM–LCA Integration for Sustainable Design Decisions

The fourth research question explored how integrating BIM with LCA can improve decision-making. The case study demonstrated that a BIM–LCA integrated workflow offers significant advantages for sustainable design. By linking the BIM model (created in Autodesk Revit/Navisworks Manage and cove tool) with LCA software (One Click LCA), the project team could seamlessly calculate environmental impacts for the entire building and quickly update the analysis whenever the design changed. This ability to obtain real-time feedback on the consequences of design choices proved invaluable. For example, the BIM-LCA system allowed the team to test a material change, such as using high fly ash content bricks instead of conventional bricks and immediately see the reduction in embodied CO2 for the walls [132]. In conventional practice, this kind of detailed carbon analysis is usually conducted later or separately from the design process, but in this study, it was immediately available during the design itself.
The integration also ensured a high level of data consistency and detail. The BIM model contained exact material quantities and specifications. The team could perform “what-if” scenarios easily, iterating between the design model and impact results to optimize choices. Another benefit was the visualization of results: when using BIM, the carbon intensities of different building elements could be color-coded in the model to highlight hotspots, helping communicate these insights to the design team [133]. This approach also facilitated better collaboration with architects, engineers, and sustainability analysts who all worked from the same coordinated BIM data, which improved information sharing and aligned decision-making. Overall, BIM-LCA integration proved to be a powerful decision-support tool [134]. It allowed the project to optimize the design for a lower carbon footprint in a way that would be difficult to achieve with disjointed methods [135]. The success of this approach in the study suggests that the wider adoption of BIM-integrated LCA can mainstream lifecycle thinking in residential design, enabling stakeholders to routinely evaluate and minimize carbon impacts from early stages [136].

4.4. Policy and Regulatory Implications for Low-Carbon Housing in India

The findings of this study underscore the need for more comprehensive building policies in India that address both operational and embodied carbon emissions. Current codes, such as the Eco-Niwas Samhita (ENS) for residential buildings, and rating systems like GRIHA and LEED, primarily focus on improving operational energy efficiency through insulation, efficient appliances, and ventilation [137,138]. While these initiatives have enhanced energy performance, they do not yet regulate embodied carbon, which accounts for approximately 10–20% of total emissions in typical buildings and remains largely unaddressed [139].
Our case study illustrates this gap: despite moderate operational efficiency, embodied emissions remain substantial. To achieve meaningful carbon reductions, building standards must expand to include lifecycle emissions [140]. Encouragingly, the Bureau of Energy Efficiency (BEE) is revising codes to integrate broader sustainability criteria, including the development of an Energy Conservation and Sustainability Building Code that would incorporate embodied carbon alongside operational targets.
Green certification frameworks can also evolve by rewarding the use of Environmental Product Declarations (EPDs), conducting whole-building LCAs, or meeting CO2e/m2 benchmarks [141,142]. Prospective LCAs enable designers to evaluate embodied emissions early in the project lifecycle [143]. Policymakers might also establish incremental embodied carbon limits, akin to current standards for Energy Use Intensity (EUI) or thermal transmittance, while promoting low-carbon materials (e.g., fly ash bricks, low-clinker cement, recycled content) through incentives or streamlined approvals [144].
While embodied carbon is beginning to gain policy attention in India, its integration into regulatory frameworks remains limited. This study supports a dual-policy approach—continuing to tighten operational efficiency standards while introducing robust embodied carbon regulations [145]. This integrated strategy is essential for aligning India’s construction sector with national climate goals.
A key strategy for reducing embodied carbon lies in the substitution of carbon-intensive materials with lower-impact alternatives. In cementitious systems, the use of Supplementary Cementitious Materials (SCMs) such as fly ash (a byproduct of coal combustion) and GGBS (a byproduct of steel manufacturing) offers a practical solution. These materials can replace 30–50% of clinker in cement, leading to reductions in cement-related CO2 emissions by up to 40–50% without compromising structural performance [146,147]. In this study, green concrete mixes were assumed based on these SCM substitutions.
For steel, green steel production technologies, including electric arc furnaces (EAFs) using scrap metal and renewable energy sources, as well as hydrogen-based direct reduced iron (H-DRI) are gaining global traction. While widespread commercial deployment is still limited in India, some manufacturers are exploring the pilot-scale production of low-carbon steel [148]. Where such alternatives are not available, designers can still reduce embodied emissions through efficiency in structural design, material reuse, and recycling.
As the Indian market evolves, the increasing availability of materials with verified Environmental Product Declarations (EPDs) and regional low-carbon innovations will further support this transition [149].
Based on the results, several recommendations are proposed for design optimizations and policy enhancements:
  • Enhance the operational energy efficiency and use of renewables: Emphasize passive design (orientation, insulation, and natural ventilation) and high-efficiency appliances. On-site renewable systems, such as solar panels, can offset grid electricity, reducing operational emissions [150,151].
  • Use low-carbon bricks for masonry: Replacing conventional clay bricks with fly ash bricks—as tested in this study—can reduce wall-related CO2e emissions from 6.7% to 2.3%. The trial mix used bricks with ~37% fly ash content, demonstrating the effectiveness of such substitutions [152].
  • Adopt green concrete mixes: Substituting a portion of Portland cement with supplementary cementitious materials (e.g., fly ash, slag) can cut concrete-related emissions by up to 50%, significantly reducing the embodied carbon of structural elements [153].
  • Leverage BIM-LCA tools in design decisions: Integrate LCA analysis with BIM during the early-design stage to evaluate the impact of different material and design options on the building’s carbon footprint. Also, integrating LCA within the BIM workflow allows the real-time assessment of design choices on lifecycle emissions, enabling the identification of material and energy hotspots prior to construction [154].
  • Support India’s Net Zero by 2070 Target: The findings from this study highlight actionable pathways to reduce carbon intensity in residential buildings. Embedding lifecycle carbon assessments into building codes (e.g., NBC) and mandating low-carbon materials and BIM-LCA integration can significantly reduce emissions in India’s rapidly urbanizing sector. These measures align with international climate commitments, including India’s pledge at COP26 to achieve net-zero emissions by 2070 [138].

4.5. Limitations and Assumptions

This study, like all LCA-based research, involves several methodological limitations and assumptions that affect the generalizability and precision of the results [155,156,157]. Firstly, although the selected case study reflects a typical middle-income, single-family house in North India, no single building can fully represent the architectural, climatic, and socio-economic diversity across the region, and modeling efforts must therefore account for a range of typologies and contexts [158,159]. The intention was not to define a universal model but to approximate a realistic and broadly representative typology using available data and standard construction practices.
In terms of data sources, this study relies on a combination of primary quantities extracted from the BIM model and secondary environmental impact data from the One Click LCA platform. While region-specific EPDs were used where available (e.g., for Indian cement or rebar), certain materials required proxy or global datasets due to the absence of Indian-specific information [160]. This introduces uncertainty in embodied carbon estimates as EPDs are influenced by production methods, local energy mixes, and transport assumptions [161,162]. In large countries like India, such assumptions may not always align with project-specific realities.
Although this study applies an India-specific electricity emission factor (1.13 kg CO2e/kWh) based on the Northern regional grid profile, it is important to acknowledge that the electricity grid is expected to decarbonize over time due to ongoing renewable energy integration [163]. However, modeling dynamic grid emission intensity trajectories was beyond the scope of this work. Additionally, the emission factor for electricity was held constant over the 60-year lifecycle under a business-as-usual (BAU) scenario. Occupancy schedules, maintenance intervals, and replacement frequencies were based on standard assumptions informed by national guidelines and the literature.
Finally, LCA provides a relative comparison tool rather than an absolute predictor of future environmental impacts. While the results offer meaningful insights for policy and design, they should be interpreted within the context of these assumptions and data constraints. Future studies could address these limitations by using more localized datasets, dynamic grid modeling, and multi-scenario analyses.

5. Conclusions and Outlook

This study carried out an LCA of a typical urban single-family residential house in North India, meeting its objectives of quantifying whole-life carbon impacts, identifying major material contributors, and demonstrating BIM-based LCA integration. The house’s total carbon footprint is about 5.884 tonnes CO2e over 60 years. Operational energy use contributed the largest share (approximately 87% of GWP), while embodied carbon accounted for around 11%. Additional impacts came from maintenance and replacements. The analysis revealed that both operational and embodied carbon are major contributors to the building’s 60-year emissions. To reduce embodied carbon, this study recommends using low-carbon materials such as fly ash bricks and green concrete, optimizing structural design for material efficiency, and integrating BIM-LCA tools early in the design process to identify and address carbon hotspots. These strategies offer practical pathways toward low-carbon residential construction in India. The results also confirmed that materials like cement and steel are key drivers of embodied CO2e, aligning with global findings.
This study also reveals gaps in India’s current building policies, which emphasize operational performance but lack explicit guidelines for embodied carbon. Recent developments by the Bureau of Energy Efficiency (BEE), and insights from the International Energy Agency (IEA), suggest a shift toward integrated sustainability codes. The findings advocate for a dual regulatory approach, tightening operational energy codes while introducing embodied carbon benchmarks.
This study represents one of the first attempts in the Indian context to implement a BIM-integrated LCA workflow for a residential building, combining local construction practices, region-specific EPDs, and operational energy modeling tailored to Delhi’s climate. While tools like cove tool, Revit, Navisworks manage and One Click LCA were used, the value lies in their customized application, incorporating India-specific datasets, adjusted transport distances, and non-generic HVAC and usage profiles. As such, the findings not only quantify the embodied and operational carbon impacts but also demonstrate the practical feasibility of applying digital workflows for sustainable design in India. This work can serve as a foundational reference for future BIM-LCA integration in the country and support the evolution of data-driven building regulations and decarbonization strategies.
Limitations include reliance on proxy LCA datasets and a static electricity grid emission factor, which may not capture regional or temporal variability. However, the results provide robust guidance for integrating LCA in Indian residential design and policy-making.
Future research should build on this work by examining a wider range of building types, climates, and construction methods in the Indian context. Future work should focus on the dynamic modeling of electricity decarbonization, improved regional datasets, and scenario-based LCA to better support India’s transition to net-zero emissions by 2070.

Supplementary Materials

The following supporting information can be downloaded at: https://www.mdpi.com/article/10.3390/buildings15132195/s1, Figure S1: Navisworks Manage clash detection results; Table S1: Documentation of LCA data used in the study; Table S2: LCA results in table form; Table S3: Operational carbon emissions under different scenarios (Without HVAC system); Table S4: Operational carbon emissions under different scenarios (With HVAC system).

Author Contributions

D.K.: Writing—Original Draft, Conceptualization, Methodology, Formal Analysis, BIM, Visualization, Writing—Review and Editing, Validation; K.K.M.: Writing—Original Draft, Conceptualization, Formal Analysis; S.K.M.: Visualization, Formal Analysis; N.H.: Visualization, BIM, EUI, Water Use Simulation, Review, Editing; B.A.M.: Writing, Validation, Review, Editing, Supervision; A.N.: Writing—Review and Editing, Project Administration, Supervision; S.G.A.-G.: Writing—Review and Editing, Supervision, Resources, Project Administration. All authors have read and agreed to the published version of the manuscript.

Funding

This study did not use any specific grants from funding agencies in the public, commercial, or not-for-profit sectors.

Data Availability Statement

The data that support the findings of this study are available on request from the corresponding author [S.G.A.-G].

Acknowledgments

The authors gratefully acknowledge the support provided by the National Institute of Technology (NIT) Patna, India, for facilitating this research. We extend our sincere appreciation to Pinnacle Infotech for their valuable training and expertise in Building Information Modeling (BIM), which significantly enhanced the methodological rigor of this study. We also express our profound gratitude to King Abdullah University of Science and Technology (KAUST), Saudi Arabia, for their continuous guidance and support in lifecycle assessment (LCA) modeling.

Conflicts of Interest

The authors declare that they have no known competing financial interests or personal relationships that could have appeared to influence the work reported in this paper. The authors are not involved in the editorial review or the decision to publish this article. The authors declare that no funding was obtained for this study.

References

  1. Gabric, A.J. The Climate Change Crisis: A Review of Its Causes and Possible Responses. Atmosphere 2023, 14, 1081. [Google Scholar] [CrossRef]
  2. Halder, N.; Kumar, M.; Deepak, A.; Mandal, S.K.; Azmeer, A.; Mir, B.A.; Nurdiawati, A.; Al-Ghamdi, S.G. The Role of Urban Greenery in Enhancing Thermal Comfort: Systematic Review Insights. Sustainability 2025, 17, 2545. [Google Scholar] [CrossRef]
  3. Sathaye, J.; Shukla, P.R.; Ravindranath, N.H. Climate Change, Sustainable Development and India: Global and National Concerns. Curr. Sci. 2006, 90, 314–325. [Google Scholar]
  4. Sun, Q.; Miao, C.; Hanel, M.; Borthwick, A.G.L.; Duan, Q.; Ji, D.; Li, H. Global Heat Stress on Health, Wildfires, and Agricultural Crops under Different Levels of Climate Warming. Environ. Int. 2019, 128, 125–136. [Google Scholar] [CrossRef]
  5. Azmeer, A.; Tahir, F.; Al-Ghamdi, S.G. Progress on Green Infrastructure for Urban Cooling: Evaluating Techniques, Design Strategies, and Benefits. Urban. Clim. 2024, 56, 102077. [Google Scholar] [CrossRef]
  6. Mondal, S.K.; Huang, J.; Wang, Y.; Su, B.; Kundzewicz, Z.W.; Jiang, S.; Zhai, J.; Chen, Z.; Jing, C.; Jiang, T. Changes in Extreme Precipitation across South Asia for Each 0.5 °C of Warming from 1.5 °C to 3.0 °C above Pre-Industrial Levels. Atmos. Res. 2022, 266, 105961. [Google Scholar] [CrossRef]
  7. Wang, X.; Jiang, D.; Lang, X. Climate Change of 4 °C Global Warming above Pre-Industrial Levels. Adv. Atmos. Sci. 2018, 35, 757–770. [Google Scholar] [CrossRef]
  8. Warren, R.; Price, J.; Forstenhäusler, N.; Andrews, O.; Brown, S.; Ebi, K.; Gernaat, D.; Goodwin, P.; Guan, D.; He, Y.; et al. Risks Associated with Global Warming of 1.5 to 4 °C above Pre-Industrial Levels in Human and Natural Systems in Six Countries. Clim. Change 2024, 177, 48. [Google Scholar] [CrossRef]
  9. Rogelj, J.; Shindell, D.; Jiang, K.; Fifita, S.; Forster, P.; Ginzburg, V.; Handa, C.; Kheshgi, H.; Kobayashi, S.; Kriegler, E.; et al. Mitigation Pathways Compatible with 1.5 °C in the Context of Sustainable Development. In Global Warming of 1.5 °C; Cambridge University Press: Cambridge, UK, 2022; pp. 93–174. [Google Scholar]
  10. Kanwal, Q.; Tahir, F.; Al-Humaiqani, M.; Al-Qawasmeh, R.; Mir, B.A.; Azmeer, A.; Terán-Cuadrado, G.; Yu, Z.; Nurdiawati, A.; Al-Ghamdi, S.G. Building a National Framework for Life Cycle Assessment: Pathways to Sustainable Development in Saudi Arabia; King Abdullah University of Science and Technology (KAUST): Thuwal, Saudi Arabia, 2025. [Google Scholar] [CrossRef]
  11. Habib, S.; Tahir, F.; Hussain, F.; Macauley, N.; Al-Ghamdi, S.G. Current and Emerging Technologies for Carbon Accounting in Urban Landscapes: Advantages and Limitations. Ecol. Indic. 2023, 154, 110603. [Google Scholar] [CrossRef]
  12. Mohajan, H.K. Greenhouse Gas Emissions, Global Warming and Climate Change: Successful Shipping Management of American President Line (APL). In Proceedings of the 15th Chittagong Conference on Mathematical Physics, Jamal Nazrul Islam Research Centre for Mathematical and Physical Sciences (JNIRCMPS), University of Chittagong, Chittagong, Bangladesh, 2017. Available online: https://www.researchgate.net/publication/315668490 (accessed on 18 June 2025).
  13. Audi, M.; Ali, A.; Kassem, M. Greenhouse Gases: A Review of Losses and Benefits. Int. J. Energy Econ. Policy 2020, 10, 403–418. [Google Scholar] [CrossRef]
  14. Van Aalst, M.K. The Impacts of Climate Change on the Risk of Natural Disasters. Disasters 2006, 30, 5–18. [Google Scholar] [CrossRef] [PubMed]
  15. Tang, D.; Ho, K. Implications of Climate Change on Marine Biodiversity. Glob. J. Agric. Soil Sci. 2020, 1, 1–6. [Google Scholar]
  16. Harley, C.D.G.; Hughes, A.R.; Hultgren, K.M.; Miner, B.G.; Sorte, C.J.B.; Thornber, C.S.; Rodriguez, L.F.; Tomanek, L.; Williams, S.L. The Impacts of Climate Change in Coastal Marine Systems. Ecol. Lett. 2006, 9, 228–241. [Google Scholar] [CrossRef] [PubMed]
  17. Banholzer, S.; Kossin, J.; Donner, S. The Impact of Climate Change on Natural Disasters. In Reducing Disaster: Early Warning Systems for Climate Change; Springer: Dordrecht, The Netherlands, 2014; Volume 9789401785983, pp. 21–49. ISBN 9789401785983. [Google Scholar]
  18. Florides, G.A.; Christodoulides, P. Global Warming and Carbon Dioxide through Sciences. Environ. Int. 2009, 35, 390–401. [Google Scholar] [CrossRef]
  19. Pecl, G.T.; Araújo, M.B.; Bell, J.D.; Blanchard, J.; Bonebrake, T.C.; Chen, I.C.; Clark, T.D.; Colwell, R.K.; Danielsen, F.; Evengård, B.; et al. Biodiversity Redistribution under Climate Change: Impacts on Ecosystems and Human Well-Being. Science 2017, 355, eaai9214. [Google Scholar] [CrossRef]
  20. Malhi, Y.; Franklin, J.; Seddon, N.; Solan, M.; Turner, M.G.; Field, C.B.; Knowlton, N. Climate Change and Ecosystems: Threats, Opportunities and Solutions. Philos. Trans. R. Soc. B Biol. Sci. 2020, 375, 20190104. [Google Scholar] [CrossRef]
  21. Bhyan, P.; Shrivastava, B.; Kumar, N. Allocating Weightage to Sustainability Criteria’s for Performance Assessment of Group Housing Developments: Using Fuzzy Analytic Hierarchy Process. J. Build. Eng. 2023, 65, 105684. [Google Scholar] [CrossRef]
  22. Terán-Cuadrado, G.; Sbahieh, S.; Tahir, F.; Nurdiawati, A.; Almarshoud, M.A.; Al-Ghamdi, S.G. Evaluating the Influence of Functional Unit on Life Cycle Assessment (LCA) Reliability of Concrete. Mater. Today Proc. 2024. [Google Scholar] [CrossRef]
  23. Yu, Z.; Nurdiawati, A.; Kanwal, Q.; Al-Humaiqani, M.M.; Al-Ghamdi, S.G. Assessing and Mitigating Environmental Impacts of Construction Materials: Insights from Environmental Product Declarations. J. Build. Eng. 2024, 98, 110929. [Google Scholar] [CrossRef]
  24. International Energy Agency. The Future of Cooling, Opportunities for Energy-Efficient Air Conditioning; International Energy Agency: Paris, France, 2018. [Google Scholar]
  25. Global Status Report for Buildings and Construction: Towards a Zero-Emission, Efficient and Resilient Buildings and Construction Sector; United Nations Environment Programme: Nairobi, Kenya, 2020.
  26. Global Alliance for Buildings and Construction Global Status Report for Buildings and Construction 2021; UNEP: Nairobi, Kenya, 2021.
  27. World Green Building Council. Bringing Embodied Carbon Upfront: Coordinated Action for the Building and Construction Sector to Tackle Embodied Carbon. Available online: https://worldgbc.org/article/bringing-embodied-carbon-upfront/ (accessed on 18 June 2025).
  28. Chastas, P.; Theodosiou, T.; Bikas, D. Embodied Energy in Residential Buildings-towards the Nearly Zero Energy Building: A Literature Review. Build. Environ. 2016, 105, 267–282. [Google Scholar] [CrossRef]
  29. Cabeza, L.F.; Rincón, L.; Vilariño, V.; Pérez, G.; Castell, A. Life Cycle Assessment (LCA) and Life Cycle Energy Analysis (LCEA) of Buildings and the Building Sector: A Review. Renew. Sustain. Energy Rev. 2014, 29, 394–416. [Google Scholar] [CrossRef]
  30. Gardezi, S.S.S.; Shafiq, N. Operational Carbon Footprint Prediction Model for Conventional Tropical Housing: A Malaysian Prospective. Int. J. Environ. Sci. Technol. 2019, 16, 7817–7826. [Google Scholar] [CrossRef]
  31. Sartori, I.; Hestnes, A.G. Energy Use in the Life Cycle of Conventional and Low-Energy Buildings: A Review Article. Energy Build. 2007, 39, 249–257. [Google Scholar] [CrossRef]
  32. Zimmermann, R.K.; Kanafani, K.; Rasmussen, F.N.; Andersen, C.; Birgisdóttir, H. LCA-Framework to Evaluate Circular Economy Strategies in Existing Buildings. IOP Conf. Ser. Earth Environ. Sci. 2020, 588, 042044. [Google Scholar] [CrossRef]
  33. Kanafani, K.; Zimmermann, R.K.; Rasmussen, F.N.; Birgisdóttir, H. Learnings from Developing a Context-Specific LCA Tool for Buildings—The Case of Lcabyg 4. Sustainability 2021, 13, 1508. [Google Scholar] [CrossRef]
  34. Napolano, L.; Menna, C.; Asprone, D.; Prota, A.; Manfredi, G. LCA-Based Study on Structural Retrofit Options for Masonry Buildings. Int. J. Life Cycle Assess. 2015, 20, 23–35. [Google Scholar] [CrossRef]
  35. Alshamrani, O.S.; Galal, K.; Alkass, S. Integrated LCA-LEED Sustainability Assessment Model for Structure and Envelope Systems of School Buildings. Build. Environ. 2014, 80, 61–70. [Google Scholar] [CrossRef]
  36. EN 15978:2011; Sustainability of Construction Works. Assessment of Environmental Performance of Buildings: Calculation Method. CEN (European Committee for Standardization): Bruxelles, Belgium, 2011.
  37. Jafary Nasab, T.; Monavari, S.M.; Jozi, S.A.; Majedi, H. Assessment of Carbon Footprint in the Construction Phase of High-Rise Constructions in Tehran. Int. J. Environ. Sci. Technol. 2020, 17, 3153–3164. [Google Scholar] [CrossRef]
  38. Escamilla, E.Z.; Habert, G.; Daza, J.F.C.; Archilla, H.F.; Echeverry Fernández, J.S.; Trujillo, D. Industrial or Traditional Bamboo Construction? Comparative Life Cycle Assessment (LCA) of Bamboo-Based Buildings. Sustainability 2018, 10, 3096. [Google Scholar] [CrossRef]
  39. Radhi, H. On the Effect of Global Warming and the UAE Built Environment. In Global Warming; Sciyo: Rijeka, Croatia, 2010. [Google Scholar]
  40. Eberhardt, L.C.M.; Birgisdóttir, H.; Birkved, M. Life Cycle Assessment of a Danish Office Building Designed for Disassembly. Build. Res. Inf. 2019, 47, 666–680. [Google Scholar] [CrossRef]
  41. Gustafsson, M.; Dipasquale, C.; Poppi, S.; Bellini, A.; Fedrizzi, R.; Bales, C.; Ochs, F.; Sié, M.; Holmberg, S. Economic and Environmental Analysis of Energy Renovation Packages for European Office Buildings. Energy Build. 2017, 148, 155–165. [Google Scholar] [CrossRef]
  42. Victoria, M.F.; Perera, S.; Davies, A.; Fernando, N. Carbon and Cost Critical Elements: A Comparative Analysis of Two Office Buildings. Built Environ. Proj. Asset Manag. 2017, 7, 460–470. [Google Scholar] [CrossRef]
  43. Junnila, S.; Horvath, A.; Guggemos, A.A. Life-Cycle Assessment of Office Buildings in Europe and the United States. J. Infrastruct. Syst. 2006, 12, 10–17. [Google Scholar] [CrossRef]
  44. Abrahamsen, F.E.; Ruud, S.G.; Gebremedhin, A. Assessing Efficiency and Environmental Performance of a Nearly Zero-Energy University Building’s Energy System in Norway. Buildings 2023, 13, 169. [Google Scholar] [CrossRef]
  45. Teshnizi, Z.; Pilon, A.; Storey, S.; Lopez, D.; Froese, T.M. Lessons Learned from Life Cycle Assessment and Life Cycle Costing of Two Residential Towers at the University of British Columbia. Procedia CIRP 2018, 69, 172–177. [Google Scholar] [CrossRef]
  46. Lo-Iacono-Ferreira, V.G.; Torregrosa-López, J.I.; Capuz-Rizo, S.F. Use of Life Cycle Assessment Methodology in the Analysis of Ecological Footprint Assessment Results to Evaluate the Environmental Performance of Universities. J. Clean. Prod. 2016, 133, 43–53. [Google Scholar] [CrossRef]
  47. Kmet’kovä, J.; Krajčik, M. Energy Efficient Retrofit and Life Cycle Assessment of an Apartment Building. Energy Procedia 2015, 78, 3186–3191. [Google Scholar] [CrossRef]
  48. Buyle, M.; Braet, J.; Audenaert, A. Life Cycle Assessment of an Apartment Building: Comparison of an Attributional and Consequential Approach. Energy Procedia 2014, 62, 132–140. [Google Scholar] [CrossRef]
  49. Wrålsen, B.; O’Born, R.; Skaar, C. Life Cycle Assessment of an Ambitious Renovation of a Norwegian Apartment Building to NZEB Standard. Energy Build. 2018, 177, 197–206. [Google Scholar] [CrossRef]
  50. Van Gulck, L.; Van de Putte, S.; Delghust, M.; Van Den Bossche, N.; Steeman, M. Environmental and Financial Assessment of Façade Renovations Designed for Change: Developing Optimal Scenarios for Apartment Buildings in Flanders. Build. Environ. 2020, 183, 107178. [Google Scholar] [CrossRef]
  51. Simons, A.; Firth, S.K. Life-Cycle Assessment of a 100% Solar Fraction Thermal Supply to a European Apartment Building Using Water-Based Sensible Heat Storage. Energy Build. 2011, 43, 1231–1240. [Google Scholar] [CrossRef]
  52. Ochoa, L.; Ries, R.; Matthews, H.S.; Hendrickson, C. Life Cycle Assessment of Residential Buildings. In Proceedings of the Construction Research Congress 2005: Broadening Perspectives—Proceedings of the Congress, San Diego, CA, USA, 5–7 April 2005; pp. 173–181. [Google Scholar]
  53. Hoxha, E.; Habert, G.; Lasvaux, S.; Chevalier, J.; Le Roy, R. Influence of Construction Material Uncertainties on Residential Building LCA Reliability. J. Clean. Prod. 2017, 144, 33–47. [Google Scholar] [CrossRef]
  54. Papadaki, D.; Nikolaou, D.A.; Assimakopoulos, M.N. Circular Environmental Impact of Recycled Building Materials and Residential Renewable Energy. Sustainability 2022, 14, 4039. [Google Scholar] [CrossRef]
  55. Rodrigues, C.; Freire, F. Environmental Impacts and Costs of Residential Building Retrofits—What Matters? Sustain. Cities Soc. 2021, 67, 102733. [Google Scholar] [CrossRef]
  56. Korentz, J.; Nowogońska, B. Assessment of the Life Cycle of Masonry Walls in Residential Buildings. MATEC Web Conf. 2018, 174, 01025. [Google Scholar] [CrossRef]
  57. Andersson, M.; Barkander, J.; Kono, J.; Ostermeyer, Y. Abatement Cost of Embodied Emissions of a Residential Building in Sweden. Energy Build. 2018, 158, 595–604. [Google Scholar] [CrossRef]
  58. Liu, Y.; Guo, H.; Sun, C.; Chang, W.-S. Assessing Cross Laminated Timber (CLT) as an Alternative Material for Mid-Rise Residential Buildings in Cold Regions in China-A Life-Cycle Assessment Approach. Sustainability 2016, 8, 1047. [Google Scholar] [CrossRef]
  59. Chen, W.; Wu, F.; Geng, W.; Yu, G. Carbon Emissions in China’s Industrial Sectors. Resour. Conserv. Recycl. 2017, 117, 264–273. [Google Scholar] [CrossRef]
  60. Wang, J.; Huang, Y.; Teng, Y.; Yu, B.; Wang, J.; Zhang, H.; Duan, H. Can Buildings Sector Achieve the Carbon Mitigation Ambitious Goal: Case Study for a Low-Carbon Demonstration City in China? Environ. Impact Assess. Rev. 2021, 90, vp. [Google Scholar] [CrossRef]
  61. Ma, W.; Hao, J.L.; Zhang, C.; Di Sarno, L.; Mannis, A. Evaluating Carbon Emissions of China’s Waste Management Strategies for Building Refurbishment Projects: Contributing to a Circular Economy. Environ. Sci. Pollut. Res. 2023, 30, 8657–8671. [Google Scholar] [CrossRef]
  62. Luo, Z.; Yang, L.; Liu, J. Embodied Carbon Emissions of Office Building: A Case Study of China’s 78 Office Buildings. Build. Environ. 2016, 95, 365–371. [Google Scholar] [CrossRef]
  63. Zhang, X.; Liu, K.; Zhang, Z. Life Cycle Carbon Emissions of Two Residential Buildings in China: Comparison and Uncertainty Analysis of Different Assessment Methods. J. Clean. Prod. 2020, 266, 122037. [Google Scholar] [CrossRef]
  64. Su, X.; Tian, S.; Shao, X.; Zhao, X. Embodied and Operational Energy and Carbon Emissions of Passive Building in HSCW Zone in China: A Case Study. Energy Build. 2020, 222, 110090. [Google Scholar] [CrossRef]
  65. Yu, D.; Tan, H.; Ruan, Y. A Future Bamboo-Structure Residential Building Prototype in China: Life Cycle Assessment of Energy Use and Carbon Emissi. Energy Build. 2011, 43, 2638–2646. [Google Scholar] [CrossRef]
  66. Jiang, P.; Dong, W.; Kung, Y.; Geng, Y. Analysing Co-Benefits of the Energy Conservation and Carbon Reduction in China’s Large Commercial Buildings. J. Clean. Prod. 2013, 58, 112–120. [Google Scholar] [CrossRef]
  67. Zhang, Y.; Yan, D.; Hu, S.; Guo, S. Modelling of Energy Consumption and Carbon Emission from the Building Construction Sector in China, a Process-Based LCA Approach. Energy Policy 2019, 134, 110949. [Google Scholar] [CrossRef]
  68. Emami, N.; Marteinsson, B.; Heinonen, J. Environmental Impact Assessment of a School Building in Iceland Using LCA-Including the Effect of Long Distance Transport of Materials. Buildings 2016, 6, 46. [Google Scholar] [CrossRef]
  69. Lee, K.; Tae, S.; Shin, S. Development of a Life Cycle Assessment Program for Building (SUSB-LCA) in South Korea. Renew. Sustain. Energy Rev. 2009, 13, 1994–2002. [Google Scholar] [CrossRef]
  70. Mir, B.A.; Nurdiawati, A.; Al-Ghamdi, S.G. Assessing the Environmental Impact of Freshwater Use in LCA: Established Practices and Current Methods. Environ. Sci. Water Res. Technol. 2025, 11, 196–221. [Google Scholar] [CrossRef]
  71. Reza, B.; Sadiq, R.; Hewage, K. Emergy-Based Life Cycle Assessment (Em-LCA) of Multi-Unit and Single-Family Residential Buildings in Canada. Int. J. Sustain. Built Environ. 2014, 3, 207–224. [Google Scholar] [CrossRef]
  72. Bueno, C.; Fabricio, M.M. Comparative Analysis between a Complete LCA Study and Results from a BIM-LCA Plug-In. Autom. Constr. 2018, 90, 188–200. [Google Scholar] [CrossRef]
  73. Aktas, C.B.; Bilec, M.M. Impact of Lifetime on US Residential Building LCA Results. Int. J. Life Cycle Assess. 2012, 17, 337–349. [Google Scholar] [CrossRef]
  74. Kirupakaran, K. Sustainable Construction Technologies. In Civil Engineering Innovations for Sustainable Communities with Net Zero Targets; CRC Press: Boca Raton, FL, USA, 2024; pp. 39–64. [Google Scholar]
  75. Chaudhary, A.; Akhtar, A. Template for Evaluating Cradle-to-Site Environmental Life Cycle Impacts of Buildings in India. ACS Environ. Au 2023, 3, 94–104. [Google Scholar] [CrossRef] [PubMed]
  76. Jain, M.; Rawal, R. Emissions from a Net-Zero Building in India: Life Cycle Assessment. Build. Cities 2022, 3, 398. [Google Scholar] [CrossRef]
  77. Chottemada, P.G.; Kar, A.; Kara De Maeijer, P. Environmental Impact Analysis of Alkali-Activated Concrete with Fiber Reinforcement. Infrastructures 2023, 8, 68. [Google Scholar] [CrossRef]
  78. Yadav, J.; Singh, V.P.; Kumar, A. Life Cycle Assessment of Sustainable Building Materials. In Sustainable Technologies for Energy Efficient Buildings; CRC Press: Boca Raton, FL, USA, 2024; pp. 64–101. [Google Scholar]
  79. Sravani, T.; Prasanna Venkatesan, R.; Madhumathi, A. A Comparative LCA Study of Passive Cooling Roof Materials for a Residential Building: An Indian Case Study. Mater. Today Proc. 2022, 64, 1014–1022. [Google Scholar] [CrossRef]
  80. Choudhary, K.; Sangwa, N.R.; Sangwan, K.S. Comparative Life Cycle Assessment of Flooring Options for Sustainable Buildings. Constr. Innov. 2023, 25, 1108–1126. [Google Scholar] [CrossRef]
  81. Venkatesh, G. Critique of Selected Peer-Reviewed Publications on Applied Social Life Cycle Assessment: Focus on Cases from Developing Countries. Clean. Technol. Environ. Policy 2019, 21, 413–430. [Google Scholar] [CrossRef]
  82. Gaurav, G.; Bihari Singh, A.; Mistry, S.; Gupta, S.; Dangayach, G.S.; Meena, M.L. Recent Progress of Scientific Research on Life Cycle Assessment. Mater. Today Proc. 2021, 47, 3161–3170. [Google Scholar] [CrossRef]
  83. Talpur, B.D.; Liuzzi, S.; Rubino, C.; Cannavale, A.; Martellotta, F. Life Cycle Assessment and Circular Building Design in South Asian Countries: A Review of the Current State of the Art and Research Potentials. Buildings 2023, 13, 3045. [Google Scholar] [CrossRef]
  84. Basu, M.; Kaja, N.; Rao, P. Study on Life Cycle Assessment and Life Cycle Sustainability Assessment of Buildings: A Review. J. Inst. Eng. (India) Ser. A 2024, 105, 749–766. [Google Scholar] [CrossRef]
  85. Chadchan, J.; Shankar, R. An Analysis of Urban Growth Trends in the Post-Economic Reforms Period in India. Int. J. Sustain. Built Environ. 2012, 1, 36–49. [Google Scholar] [CrossRef]
  86. Sharma, R.; Joshi, P.K. Mapping Environmental Impacts of Rapid Urbanization in the National Capital Region of India Using Remote Sensing Inputs. Urban. Clim. 2016, 15, 70–82. [Google Scholar] [CrossRef]
  87. Moncaster, A.M.; Symons, K.E. A method and tool for ‘cradle to grave’ embodied carbon and energy impacts of UK buildings in compliance with the new TC350 standards. Energy Build. 2013, 66, 514–523. [Google Scholar] [CrossRef]
  88. Terán-Cuadrado, G.; Tahir, F.; Nurdiawati, A.; Almarshoud, M.A.; Al-Ghamdi, S.G. Current and Potential Materials for the Low-Carbon Cement Production: Life Cycle Assessment Perspective. J. Build. Eng. 2024, 96, 110528. [Google Scholar] [CrossRef]
  89. Government of Indian Ministry of Power. Eco-Niwas Samhita (ENS) 2024 (Energy Conservation and Sustainable Building Code-Residential). 2023. Available online: https://beeindia.gov.in/sites/default/files/ENS%202024_Buildign%20Code%20for%20Residential%20Buildings.pdf (accessed on 18 June 2025).
  90. The Energy and Resources Institute (TERI); Ministry of New and Renewable Energy (MNRE). GRIHA (Green Rating for Integrated Habitat Assessment) Rating System. Available online: https://www.grihaindia.org/ (accessed on 15 March 2025).
  91. Dekkiche, H.; Taileb, A. The Importance of Integrating LCA into the LEED Rating System. Procedia Eng. 2016, 145, 844–851. [Google Scholar] [CrossRef]
  92. Thilakaratne, R.; Lew, V. Is LEED Leading Asia?: An Analysis of Global Adaptation and Trends. Procedia Eng. 2011, 21, 1136–1144. [Google Scholar] [CrossRef]
  93. Forouzandeh, N.; Tahsildoost, M.; Zomorodian, Z.S. A Review of Web-Based Building Energy Analysis Applications. J. Clean. Prod. 2021, 306, 127251. [Google Scholar] [CrossRef]
  94. Le, A.B.D.; Whyte, A.; Biswas, W.K. Carbon Footprint and Embodied Energy Assessment of Roof-Covering Materials. Clean. Technol. Environ. Policy 2019, 21, 1913–1923. [Google Scholar] [CrossRef]
  95. Bureau of Indian Standards. National Building Code of India 2016 (NBC 2016). Available online: https://www.bis.gov.in/standards/technical-department/national-building-code/ (accessed on 16 March 2025).
  96. Office of the Registrar General & Census Commissioner, India. Population Census. Table HH-01: Normal Households by Household Size (Total), NCT of Delhi—2011. Available online: https://censusindia.gov.in/nada/index.php/catalog/?page=1&sort_by=popularity&sort_order=desc&ps=15 (accessed on 15 March 2025).
  97. Bureau of Energy Efficiency (BEE) Energy Efficiency in Indian Households. Ministry of Power. Available online: https://beeindia.gov.in (accessed on 20 May 2025).
  98. International Energy Agency (IEA). India Energy Outlook 2021; International Energy Agency: Paris, France, 2021; Available online: https://www.iea.org/reports/india-energy-outlook-2021 (accessed on 20 May 2025).
  99. ISO 14040:2006; Environmental Management—Life Cycle Assessment—Principles and Framework. Available online: https://www.iso.org/standard/37456.html (accessed on 16 March 2025).
  100. ISO 21929-1:2011; Sustainability in Building Construction—Sustainability Indicators Part 1: Framework for the Development of Indicators and a Core Set of Indicators for Buildings. Available online: https://www.iso.org/standard/46599.html (accessed on 24 March 2025).
  101. ISO 21931-1:2022; Sustainability in Buildings and Civil Engineering Works—Framework for Methods of Assessment of the Environmental, Social and Economic Performance of Construction Works as a Basis for Sustainability Assessment. Available online: https://www.iso.org/standard/71183.html (accessed on 24 March 2025).
  102. EN 15804:2012+A2:2019; Sustainability of Construction Works. Available online: https://cdn.standards.iteh.ai/samples/70014/d1c2e14c078c467d8e2ad35806a52ae2/SIST-EN-15804-2012-A2-2019.pdf (accessed on 24 March 2025).
  103. Song, X.; Carlsson, C.; Kiilsgaard, R.; Bendz, D.; Kennedy, H. Life Cycle Assessment of Geotechnical Works in Building Construction: A Review and Recommendations. Sustainability 2020, 12, 8442. [Google Scholar] [CrossRef]
  104. De Toro, P.; Iodice, S. Urban Metabolism Evaluation Methods: Life Cycle Assessment and Territorial Regeneration. Regen. Territ. 2022, 128, 213–230. [Google Scholar]
  105. Ylmén, P.; Peñaloza, D.; Mjörnell, K. Life Cycle Assessment of an Office Building Based on Site-Specific Data. Energies 2019, 12, 2588. [Google Scholar] [CrossRef]
  106. Gundabattini, E.; Masselli, C.; Gnanaraj, D.; Tadikonda, S.; Karnati, V.; Vemireddy, V. Improving the Energy Performances of the Refrigeration Systems with Subcooling Using the Eco-Friendly Refrigerant R600a: Initial Experimental Results. Instrum. Mes. Métrologie 2020, 19, 73–81. [Google Scholar] [CrossRef]
  107. Arpke, A.; Hutzler, N. Operational Life-Cycle Assessment and Life-Cycle Cost Analysis for Water Use in Multioccupant Buildings. J. Archit. Eng. 2005, 11, 99–109. [Google Scholar] [CrossRef]
  108. Zhang, W.; Tan, S.; Lei, Y.; Wang, S. Life Cycle Assessment of a Single-Family Residential Building in Canada: A Case Study. Build. Simul. 2014, 7, 429–438. [Google Scholar] [CrossRef]
  109. Bureau of Indian Standards. National Building Code of India 2016, Part 8: Building Services—Section 1: Lighting and Ventilation; BIS: New Delhi, India, 2016. Available online: https://www.bis.gov.in (accessed on 3 April 2025).
  110. Bureau of Energy Efficiency. Energy Conservation Building Code (ECBC) 2017. Available online: https://ecbc.in/resources/stateref/ECBCchange.pdf (accessed on 18 June 2025).
  111. Central Electricity Authority (CEA). CO2 Baseline Database for the Indian Power Sector. Available online: https://cea.nic.in/old/index.html (accessed on 20 May 2025).
  112. Intergovernmental Panel on Climate Change (IPCC). IPCC Guidelines for National Greenhouse Gas Inventories; Volume 2: Energy. Available online: https://www.ipcc-nggip.iges.or.jp/public/2006gl/pdf/2_Volume2/V2_4_Ch4_Fugitive_Emissions.pdf (accessed on 20 May 2025).
  113. Bulle, C.; Margni, M.; Patouillard, L.; Boulay, A.-M.; Bourgault, G.; De Bruille, V.; Cao, V.; Hauschild, M.; Henderson, A.; Humbert, S.; et al. IMPACT World+: A Globally Regionalized Life Cycle Impact Assessment Method. Int. J. Life Cycle Assess. 2019, 24, 1653–1674. [Google Scholar] [CrossRef]
  114. Cavalliere, C.; Hollberg, A.; Dell’Osso, G.R.; Habert, G. Consistent BIM-Led LCA during the Entire Building Design Process. IOP Conf. Ser. Earth Environ. Sci. 2019, 323, 012099. [Google Scholar] [CrossRef]
  115. Bansal, N.K.; Hauser, G.; Minke, G. Passive Building Design: A Handbook of Natural Climate Control; Elsevier Science: Amsterdam, The Netherlands, 1994. [Google Scholar]
  116. Bureau of Energy Efficiency. Eco-Niwas Samhita: Energy Conservation Building Code for Residential Buildings; Ministry of Power, Government of India: New Delhi, India, 2018. [Google Scholar]
  117. Sahu, T.K.; Patanwar, P.; Bhaskar, M.; Singh, S.; Gautam, B.S.; Gupta, P.; Singroul, S.; Kumar, R.; Rakesh, C.; Kumar, A.; et al. Evaluating Energy Efficiency in LIG Buildings Using Louver Shading Systems. Case Stud. Therm. Eng. 2025, 72, 106272. [Google Scholar] [CrossRef]
  118. Burak Gunay, H.; Darwazeh, D.; Shillinglaw, S.; Wilton, I. Remote Characterization of Envelope Performance through Inverse Modelling with Building Automation System Data. Energy Build. 2021, 240, 110893. [Google Scholar] [CrossRef]
  119. U.S. Green Building Council. LEED v4 for Building Design and Construction. Available online: https://www.usgbc.org/resources/leed-v4-building-design-and-construction-current-version (accessed on 3 April 2025).
  120. Pasanen, P.; Castro, R. Carbon Heroes Benchmark Program—Whole Building Embodied Carbon Profiling. IOP Conf. Ser. Earth Environ. Sci. 2019, 323, 012028. [Google Scholar] [CrossRef]
  121. Chou, M.-I.; Chou, S.-F.; Patel, V.; Pickering, M.D.; Stucki, J.W. Manufacturing Fired Bricks with Class F Fly-Ash from Illinois Basin Coals; University of Illinois Urbana-Champaign: Champaign, IL, USA, 2006. [Google Scholar]
  122. Rahmat, M.N.; Saleh, A.M. Strength and Environmental Evaluation of Building Bricks Using Industrial Waste for Liveable Environments. Constr. Build. Mater. 2023, 403, 132864. [Google Scholar] [CrossRef]
  123. Fernández-Pereira, C.; de la Casa, J.A.; Gómez-Barea, A.; Arroyo, F.; Leiva, C.; Luna, Y. Application of Biomass Gasification Fly Ash for Brick Manufacturing. Fuel 2011, 90, 220–232. [Google Scholar] [CrossRef]
  124. Solutions, S. Life Cycle Database—India Electricity Grid Mix Scenarios (APS, STEPS, SDS), 2030 and 2050. Available online: https://sphera.com/solutions/product-stewardship/life-cycle-assessment-software-and-data/ (accessed on 28 May 2025).
  125. Simpson, K.; Janda, K.B.; Owen, A. Preparing ‘Middle Actors’ to Deliver Zero-Carbon Building Transitions. Build. Cities 2020, 1, 610. [Google Scholar] [CrossRef]
  126. Central Electricity Authority. CO2 Baseline Database for the Indian Power Sector—Version 20; Central Electricity Authority: New Delhi, India, 2023. [Google Scholar]
  127. Röck, M.; Saade, M.R.M.; Balouktsi, M.; Rasmussen, F.N.; Birgisdottir, H.; Frischknecht, R.; Habert, G.; Lützkendorf, T.; Passer, A. Embodied GHG Emissions of Buildings—The Hidden Challenge for Effective Climate Change Mitigation. Appl. Energy 2020, 258, 114107. [Google Scholar] [CrossRef]
  128. Habert, G.; d’Espinose de Lacaillerie, J.B.; Roussel, N. An Environmental Evaluation of Geopolymer Based Concrete Production: Reviewing Current Research Trends. J. Clean. Prod. 2011, 19, 1229–1238. [Google Scholar] [CrossRef]
  129. De Wolf, C.; Pomponi, F.; Moncaster, A. Measuring Embodied Carbon Dioxide Equivalent of Buildings: A Review and Critique of Current Industry Practice. Energy Build. 2017, 140, 68–80. [Google Scholar] [CrossRef]
  130. Vintzileou, E.; Panagiotidou, E. An Empirical Model for Predicting the Mechanical Properties of FRP-Confined Concrete. Constr. Build. Mater. 2008, 22, 841–854. [Google Scholar] [CrossRef]
  131. Hasanbeigi, A.; Price, L.; Lin, E. Emerging Energy-Efficiency and CO2 Emission-Reduction Technologies for Cement and Concrete Production: A Technical Review. Renew. Sustain. Energy Rev. 2012, 16, 6220–6238. [Google Scholar] [CrossRef]
  132. Alireza, A.F.F.; Rashidi, T.H.; Akbarnezhad, A.; Waller, S.T. BIM-Enabled Sustainability Assessment of Material Supply Decisions. Eng. Constr. Archit. Manag. 2017, 24, 668–695. [Google Scholar] [CrossRef]
  133. Francisco, A.; Truong, H.; Khosrowpour, A.; Taylor, J.E.; Mohammadi, N. Occupant Perceptions of Building Information Model-Based Energy Visualizations in Eco-Feedback Systems. Appl. Energy 2020, 276, 115410. [Google Scholar] [CrossRef]
  134. Santos, R.; Costa, A.A.; Silvestre, J.D.; Pyl, L. Integration of LCA and LCC Analysis within a BIM-Based Environment. Autom. Constr. 2019, 103, 127–149. [Google Scholar] [CrossRef]
  135. Raouf, A.M.I.; Al-Ghamdi, S.G. Building Information Modelling and Green Buildings: Challenges and Opportunities. Archit. Eng. Des. Manag. 2019, 15, 1–28. [Google Scholar] [CrossRef]
  136. Saleem, M.; Chhipi-Shrestha, G.; Túlio Barbosa Andrade, M.; Dyck, R.; Ruparathna, R.; Hewage, K.; Sadiq, R. Life Cycle Thinking-Based Selection of Building Facades. J. Archit. Eng. 2018, 24. [Google Scholar] [CrossRef]
  137. Middlemiss, L.; Stevens, M.; Ambrosio-Albalá, P.; Pellicer-Sifres, V.; van Grieken, A. How Do Interventions for Energy Poverty and Health Work? Energy Policy 2023, 180, 113684. [Google Scholar] [CrossRef]
  138. Mohan, S.; Vijayalaxmi, J. Embodied Carbon Impacts of Green Building Rating Systems. In Embodied and Operational Carbon in Buildings; Springer: Singapore, 2024; pp. 13–25. [Google Scholar]
  139. Ghosh, A.; Neogi, S. Energy Efficiency in Buildings and Related Assessment Tools Under Indian Perspective. In Strategic Management, Decision Theory, and Decision Science; Springer: Singapore, 2021; pp. 33–50. [Google Scholar]
  140. Kumar Kirme, S.; Kapse, V.S. A Comprehensive Review of Residential Building Energy Efficiency Measures in India. Energy Build. 2024, 319, 114537. [Google Scholar] [CrossRef]
  141. Al-Ghamdi, S.G.; Bilec, M.M. Whole-Building LCA and Green Building Rating Systems: Exploratory Review of the Available Tools Whole-Building LCA and Green Building Rating Systems 2. In Proceedings of the International Symposium on Sustainable Systems and Technologies, Dearborn, MI, USA, 17–19 May 2015. Sustainable Conoscente Network. [Google Scholar]
  142. Al-Ghamdi, S.G.; Bilec, M.M. Green Building Rating Systems and Whole-Building Life Cycle Assessment: Comparative Study of the Existing Assessment Tools. J. Archit. Eng. 2017, 23, 04016015. [Google Scholar] [CrossRef]
  143. Nurdiawati, A.; Mir, B.A.; Al-Ghamdi, S.G. Recent Advancements in Prospective Life Cycle Assessment: Current Practices, Trends, and Implications for Future Research. Resour. Environ. Sustain. 2025, 20, 100203. [Google Scholar] [CrossRef]
  144. Kanagaraj, B.; Anand, N.; Lubloy, E. Sustainability and Durability Performance Evaluation of Geopolymer Concrete with Industrial Effluent as Alternative to Conventional River Sand. Dev. Built Environ. 2024, 19, 100517. [Google Scholar] [CrossRef]
  145. Barbhuiya, S.; Das, B.B.; Adak, D.; Kapoor, K.; Tabish, M. Low Carbon Concrete: Advancements, Challenges and Future Directions in Sustainable Construction. Discov. Concr. Cem. 2025, 1, 3. [Google Scholar] [CrossRef]
  146. Basavaraj, A.; Gettu, R. Life cycle assessment as a tool in sustainability assessment of concrete systems: Why and how? Indian Concr. J. 2022, 96, 1–20. [Google Scholar]
  147. Kiruthika, K.; Ambily, P.S.; Ponmalar, V.; Kaliyavaradhan, S.K. Computation of Embodied Energy and Carbon Dioxide Emissions of Geopolymer Concrete in High-Rise Buildings: A Case Study in Chennai City. Eur. J. Environ. Civ. Eng. 2024, 28, 1517–1543. [Google Scholar] [CrossRef]
  148. Singh, N.; Sharma, R.L.; Yadav, K. Sustainable Solutions: Exploring Supplementary Cementitious Materials in Construction. Iran. J. Sci. Technol. Trans. Civ. Eng. 2024, 49, 2191–2224. [Google Scholar] [CrossRef]
  149. Mahevi, S.A.; Kaliluthin, A.K.; Husain, D.; Ansari, Y.; Ahmad, I. Ecological Footprint and Economic Assessment of Ready-Mix Concrete Production. In Ecological Footprint of Industrial Spaces and Processes; Springer: Cham, Switzerland, 2024; pp. 37–48. [Google Scholar]
  150. Chandel, R.; Chandel, S.S.; Prasad, D.; Dwivedi, R.P. Sustainable Passive Solar and Photovoltaic Integrated Technology Interventions for Climate Responsive Net Zero Energy Buildings in Western Himalayan Mountainous Terrain of India. Next Sustain. 2024, 3, 100039. [Google Scholar] [CrossRef]
  151. Vora, S.; Rajgor, M.; Pitroda, J. A critical review of net zero energy efficient design strategies in construction sector. Int. J. Adv. Res. Innov. Ideas Educ. 2017, 3, 1187–1194. [Google Scholar]
  152. Sengupta, N.; Roy, S.; Guha, H. Assessing Embodied GHG Emission Reduction Potential of Cost-Effective Technologies for Construction of Residential Buildings of Economically Weaker Section in India. Asian J. Civ. Eng. 2018, 19, 139–156. [Google Scholar] [CrossRef]
  153. Shaik, S.; Roy, A.; Hussain Shaik, A.; Rehaan Chandan, M.; Arıcı, M.; Saxena, K.K.; Alam, T. Innovate, Insulate, Integrate: Embracing Circular Economy in Innovative Insulations for Reduced Air Conditioning Expenses and Carbon Mitigation in Fly Ash Brick Buildings. Energy Build. 2024, 322, 114694. [Google Scholar] [CrossRef]
  154. Kumar, D.; Maurya, K.K.; Mandal, S.K.; Mir, B.A.; Nurdiawati, A.; Al-Ghamdi, S.G. Life Cycle Assessment in the Early Design Phase of Buildings: Strategies, Tools, and Future Directions. Buildings 2025, 15, 1612. [Google Scholar] [CrossRef]
  155. Finnveden, G.; Hauschild, M.Z.; Ekvall, T.; Guinée, J.; Heijungs, R.; Hellweg, S.; Koehler, A.; Pennington, D.; Suh, S. Recent Developments in Life Cycle Assessment. J. Environ. Manag. 2009, 91, 1–21. [Google Scholar] [CrossRef]
  156. Curran, M.A. Life Cycle Assessment: A Review of the Methodology and Its Application to Sustainability. Curr. Opin. Chem. Eng. 2013, 2, 273–277. [Google Scholar] [CrossRef]
  157. Rebitzer, G.; Ekvall, T.; Frischknecht, R.; Hunkeler, D.; Norris, G.; Rydberg, T.; Schmidt, W.-P.; Suh, S.; Weidema, B.P.; Pennington, D.W. Life Cycle Assessment. Environ. Int. 2004, 30, 701–720. [Google Scholar] [CrossRef]
  158. Heo, Y.; Choudhary, R.; Augenbroe, G.A. Calibration of Building Energy Models for Retrofit Analysis under Uncertainty. Energy Build. 2012, 47, 550–560. [Google Scholar] [CrossRef]
  159. Sokol, J.; Cerezo Davila, C.; Reinhart, C.F. Validation of a Bayesian-Based Method for Defining Residential Archetypes in Urban Building Energy Models. Energy Build. 2017, 134, 11–24. [Google Scholar] [CrossRef]
  160. Frischknecht, R.; Rebitzer, G. The Ecoinvent Database System: A Comprehensive Web-Based LCA Database. J. Clean. Prod. 2005, 13, 1337–1343. [Google Scholar] [CrossRef]
  161. Liu, Y.; Zhou, X.; Wang, D.; Song, C.; Liu, J. A Prediction Model of VOC Partition Coefficient in Porous Building Materials Based on Adsorption Potential Theory. Build. Environ. 2015, 93, 221–233. [Google Scholar] [CrossRef]
  162. Hollberg, A.; Ruth, J. LCA in Architectural Design—A Parametric Approach. Int. J. Life Cycle Assess. 2016, 21, 943–960. [Google Scholar] [CrossRef]
  163. India’s Role in Global Energy Governance Framework: 2040 and Beyond; Ganeshan, S., Bhattacharjya, S., Eds.; The Energy and Resources Institute (TERI): New Delhi, India, 2022; ISBN 978-93-94657-01-4. [Google Scholar]
Figure 1. Embodied carbon and operational carbon in building.
Buildings 15 02195 g001
Figure 2. Single dwelling residential unit analysis. (A) Floor plan layout. (B) Sun path diagram for energy simulation. (C) Revit 3D model. Figure is not to scale.
Buildings 15 02195 g002
Figure 3. Methodological approach of lifecycle assessment. Adapted from (ISO 14040:2006) [99].
Buildings 15 02195 g003
Figure 4. System boundaries and lifecycle stages considered in the cradle-to-grave LCA of the case study. Adapted from EN: 15978 module designations.
Buildings 15 02195 g004
Figure 5. The LCA impact assessment framework of the study. Source: [113].
Buildings 15 02195 g005
Figure 6. Methodological framework of BIM-LCA integration for single-dwelling residential unit.
Buildings 15 02195 g006
Figure 7. The energy use intensity of the selected case study.
Buildings 15 02195 g007
Figure 8. Water consumption of the single dwelling unit.
Buildings 15 02195 g008
Figure 9. Cradle-to-grave lifecycle carbon assessment (Stages A1–A4, B4–B5, C1–C4) indicating moderate environmental impact (Category D) with an intensity of 561 kg CO2e/m2 (source: the One Click LCA Carbon Heroes Benchmark Program).
Buildings 15 02195 g009
Figure 10. A breakdown of global warming potential (kg CO2e) by lifecycle stages. The electricity-related GWP values assume a constant emission factor over the entire 60-year lifecycle. The dynamic decarbonization of the grid was not modeled in this study.
Buildings 15 02195 g010
Figure 11. Distribution of global warming potential (kg CO2e) across classifications, highlighting electricity, fuel use, and external walls as major contributors.
Buildings 15 02195 g011
Figure 12. Mass-based classification distribution, emphasizing dominance of structural components such as floors, roofs, and external walls.
Buildings 15 02195 g012
Figure 13. Sensitivity analysis of operational carbon emissions across future electricity grid scenarios with and without HVAC systems.
Buildings 15 02195 g013
Table 1. Key characteristics of the single-family dwelling unit case study.
ParameterDescription
LocationNew Delhi, India (urban context, composite climate zone)
House typeSingle-family residential dwelling unit (stand-alone, ground-floor construction)
Floors/storiesGround floor
Total floor area110 m2 (approx. 1184 ft2)
Gross floor internal area99 m2
Bedrooms/bathrooms2 bedrooms, 2 bathrooms, 1 living room, 1 kitchen and 1 dining area
Occupancy5 persons (normal households’ size by population census 2011) [96]
Structural systemReinforced concrete frame {columns, beams, RCC (reinforced cement concrete), slabs}
Wall constructionBrick masonry (burnt clay bricks) with cement plaster
Roof constructionFlat RCC slab roof with waterproofing
Floor finishesCeramic tile with cement screed subfloor
Windows/doorsSingle-glazed aluminum windows; wood/metal doors
HVAC and comfort systemsNatural ventilation, ceiling fans, 1 split AC unit (master bedroom), portable room heater
Design lifespan60 years (service life considered for LCA)
Design standardsAligned with National Building Code (NBC 2016) standards for mid-income housing; moderate energy efficiency (basic insulation, natural ventilation features)
Table 2. Detailed material quantity take-off (MQT) of single-dwelling residential unit in Northern India.
ClassMaterialQuantityQty_Type
FoundationConcrete—Cast-in-Place Concrete9.84M3
FoundationReinforcement Steel890KG
WallBrick Common76.18TON
WallMortar13944KG
WallAcrylic Topcoat Paint for Exterior0.02514M3
WallEmulsion Paint for Interior0.05686M3
SlabConcrete—Cast-in-Place Concrete14.93M3
SlabReinforcement Steel1350KG
SlabConcrete—Screed7.08M3
ColumnConcrete—Cast-in-Place Concrete1.08M3
ColumnReinforcement steel155KG
BeamConcrete—Cast-in-Place Concrete1.05M3
BeamReinforcement steel180KG
RoofRoof_Generic—150 mm14.52M3
RoofReinforcement Steel1450KG
RoofPlaster2420KG
StairsReady-Mix Concrete C25/301.62M3
StairsReinforcement Steel180KG
DoorWood43M2
DoorMetal Door with Steel Core250KG
WindowWindow33M2
Horizontal finishStone and Ceramic mix1930KG
OtherDamp-proofing0.37M3
Table 3. Lifecycle stage-wise results for the case study house.
Result CategoryGlobal Warming Potential (kg CO2e)
A1–A3 Materials41,947.7
A4 Transport3875.8
A5 Construction3924.8
B1 Use phase0.272
B2 Maintenance151.5
B3 Repair10,328.4
B4–B5 Replacement4261.7
B6 Energy508,314.6
B7 Water3774.9
C1 Deconstruction/demolition601.8
C2 Waste transport805.3
C3 Waste processing15.9
C4 Waste disposal519.2
Total578,522
Results per denominator:
Gross internal floor area (IPMS/RICS): 99.0 m2
Global warming potential per m2: 5844 kg CO2e/m2
Disclaimer/Publisher’s Note: The statements, opinions and data contained in all publications are solely those of the individual author(s) and contributor(s) and not of MDPI and/or the editor(s). MDPI and/or the editor(s) disclaim responsibility for any injury to people or property resulting from any ideas, methods, instructions or products referred to in the content.

