Article

Flexural Behavior of Shield Tunnel Joints with Auto-Lock Connectors: A Theoretical and Numerical Investigation with Parametric Analysis

1
College of Railway Engineering, Guangzhou Railway Polytechnic, Guangzhou 511300, China
2
Research Center of Coastal and Urban Geotechnical Engineering, Zhejiang University, Hangzhou 310058, China
3
School of Engineering, Hangzhou City University, Hangzhou 310015, China
4
Beijing Urban Construction Design & Development Group Co., Ltd., Beijing 100045, China
*
Author to whom correspondence should be addressed.
Buildings 2025, 15(13), 2182; https://doi.org/10.3390/buildings15132182
Submission received: 23 May 2025 / Revised: 11 June 2025 / Accepted: 17 June 2025 / Published: 23 June 2025

Abstract

Rapid connectors for shield tunnels represent a critical advancement in underground engineering construction. This study proposes a novel auto-lock connector, detailing its structure and working principle. The flexural behavior of the auto-lock joint is investigated through theoretical analysis and numerical simulation, with a comprehensive evaluation of influencing factors. The results indicate that joint opening increases with reduced axial force, peaking at 24.1 mm under negative bending under a 100 kN axial load. The ultimate bending moment demonstrates a nonlinear variation with axial force. At low axial forces, increasing material strength or dimensions enhances joint flexural capacity, with more pronounced improvements under lower loads. This research establishes a theoretical foundation for the practical application of auto-lock connectors.

1. Introduction

Shield tunnels are constructed by assembling curved precast concrete segments into rings through mechanical connectors. These joints govern the structural stability of the tunnel by transmitting internal forces between adjacent segments, thereby defining their mechanical performance [1,2,3]. Conventional connectors, such as short straight bolts, long straight bolts, curved bolts, and spear bolts, exhibit critical limitations in segment joint applications. Bolt–hand holes introduced during installation compromise segment integrity, increasing risks of localized concrete cracking. Manual installation processes are labor-intensive, inefficient, and prone to safety hazards, ultimately degrading construction quality. Furthermore, construction deviations frequently induce joint misalignment, adversely affecting tunnel geometry. To address these challenges, rapid connectors (e.g., C-T slide-in joints, push-grip joints, and BEST joints) have been developed to automate construction and enhance quality control [4,5,6,7]. These innovations reduce manual labor requirements, accelerate assembly efficiency, and improve joint reliability, marking a pivotal advancement in prefabricated tunnel engineering.
Recent advancements in civil engineering have driven extensive research on the mechanical behavior, load-bearing capacity, and durability of segmental joints under diverse loading scenarios. Liu et al. [8] established a bending mechanical model through full-scale tests, elucidating the nonlinear relationship between joint opening and bending moments (M-N) in large-section tunnels. Zhang et al. [9] developed a novel joint system with ductile iron panels for quasi-rectangular tunnels, combining experimental tests and numerical simulations to enhance longitudinal joint behavior. Liu et al. [10] evaluated the ultimate bearing capacity of continuously jointed linings under varying environmental conditions through full-scale tests, quantifying segment deformations, joint openings, and bolt forces. Liu et al. [11] investigated longitudinal joints in the Shanghai Metro system under multi-axial loads, developing an analytical model to predict bearing capacity and identifying failure modes analogous to large/small eccentricity stress cross-sections under positive/negative bending moments. Ding et al. [12] characterized the nonlinear flexural behavior of double-bolted joints in deep-buried Shanghai tunnels, proposing a tri-linear stiffness model to capture joint stiffness evolution under positive and negative moments. Xiao et al. [13] formulated a flexural capacity calculation model by discretizing discontinuous joint interfaces, accompanied by a robust numerical solution algorithm. Zuo et al. [14] analyzed ring seam behavior under compression–bending loads via 1:1 prototype tests, correlating surface strain, joint opening, and deflection to internal force distributions at longitudinal seams. Guo et al. [15] examined circumferential joint behavior in super-large cross-section underwater tunnels through full-scale tests and 3D numerical analysis, highlighting the roles of mortises, tenons, and bolts in shear resistance under compression–shear loads. Zhou et al. [16] investigated the compression–shear behavior of a novel connector through full-scale experiments, analyzing damage modes and evaluating its structural performance.
The auto-lock connector is a novel rapid joint system characterized by minimal cross-sectional weakening, optimized force distribution, automated installation, and ease of maintenance. This study addresses four critical research gaps in shield tunnel joints: (1) enabling fully mechanized and automated connector installation, (2) developing a theoretical model for the connector’s flexural bearing capacity, (3) uncovering the evolution of complex stress states in joints, and (4) clarifying how design parameters influence bearing capacity. Through working mechanism analysis, theoretical derivation, numerical simulation, and parameter analysis, this paper systematically investigates the flexural behavior of longitudinal joints with auto-lock connectors. The results provide a theoretical basis for optimizing connector designs in practical engineering applications.

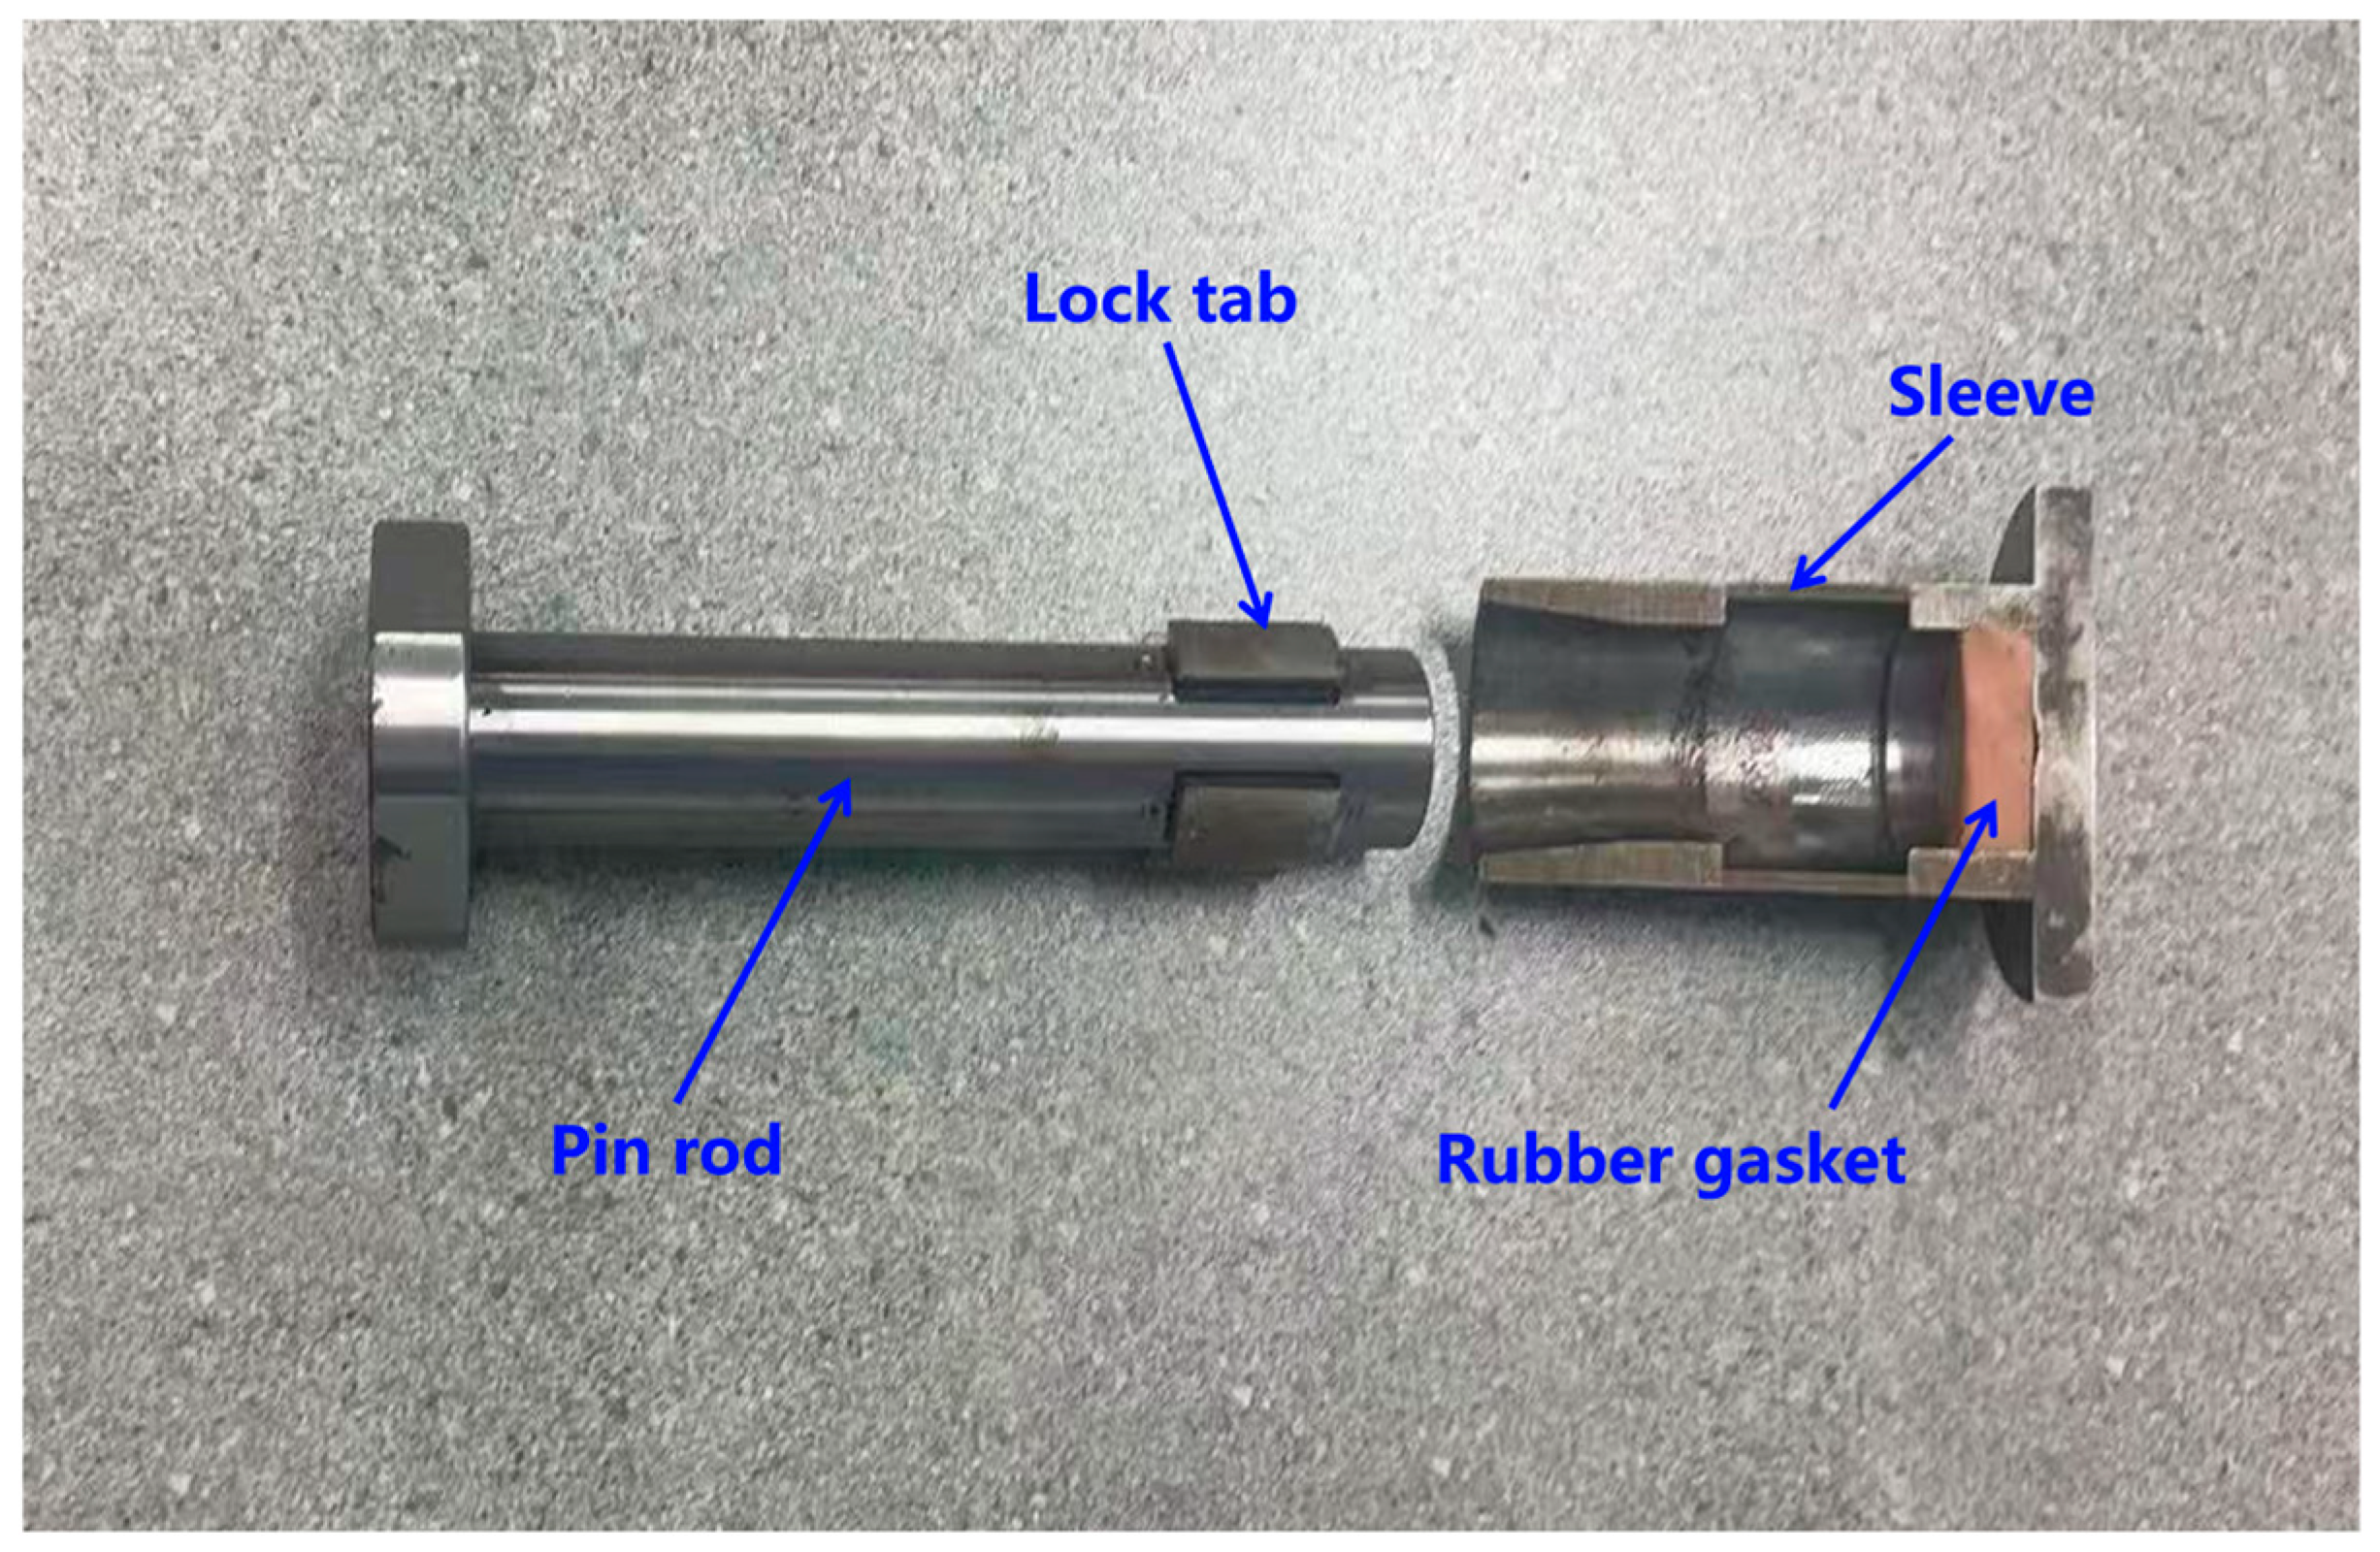
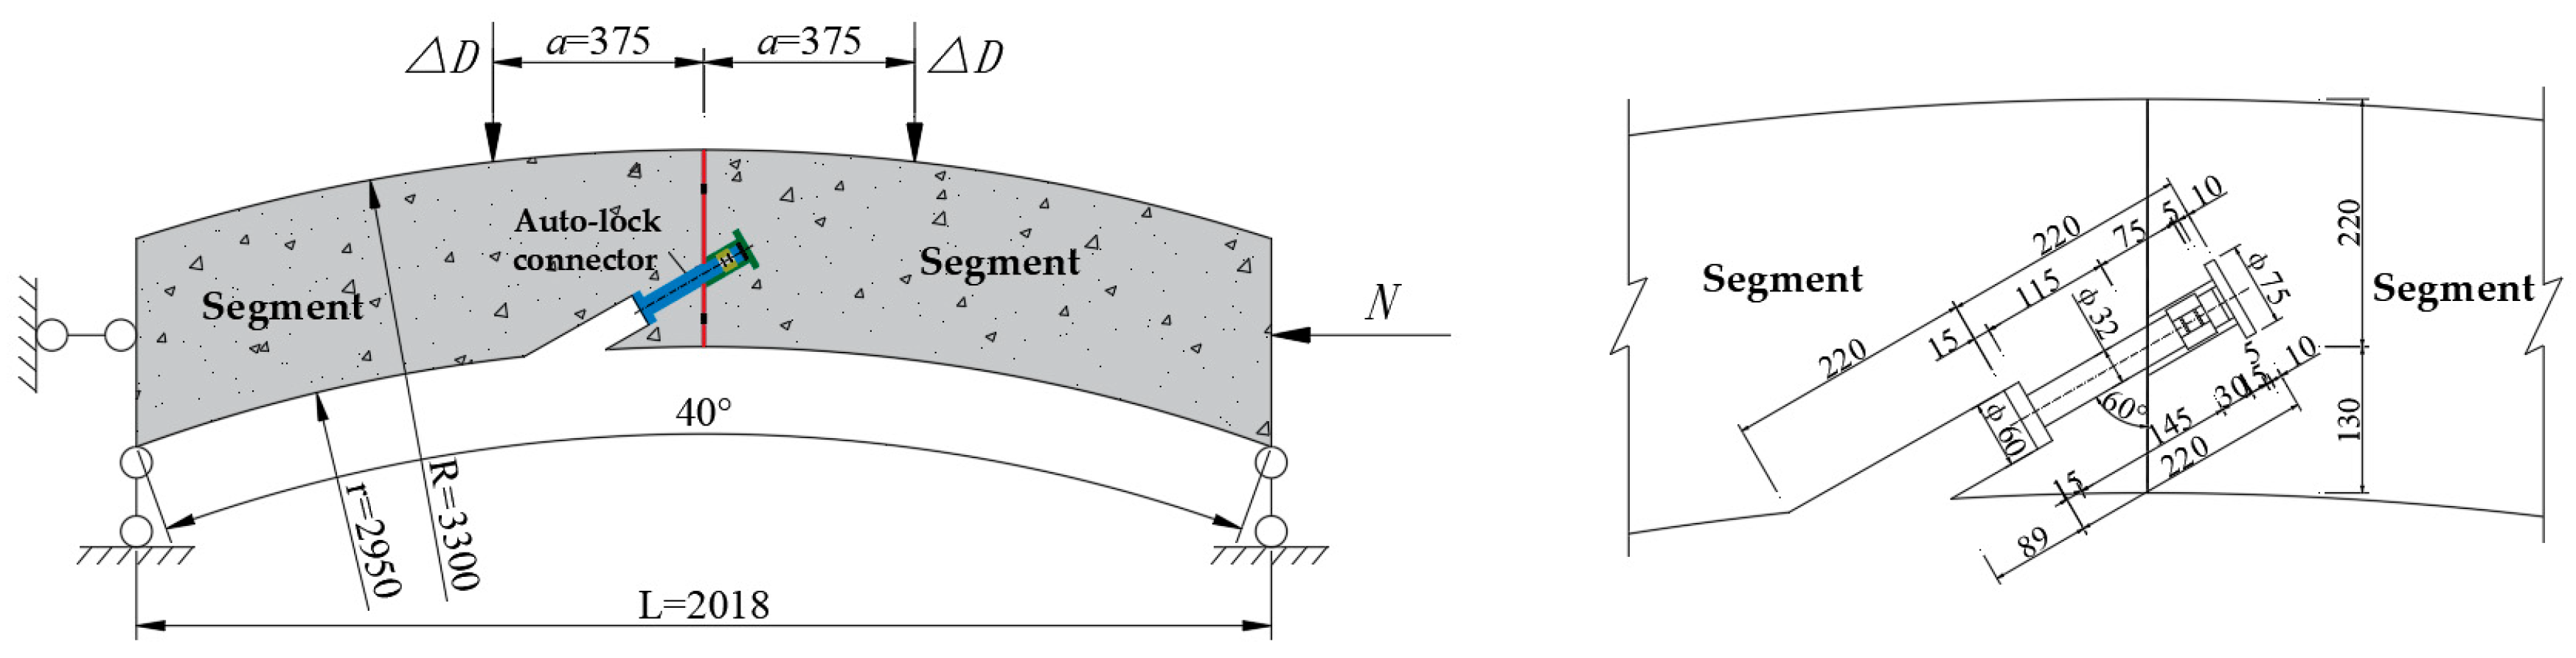
2. Characteristics of the Auto-Lock Connector

2.1. Structure of the Auto-Lock Connector

The main structure of the auto-lock connector consists of a sleeve, a pin rod, four lock tabs, a piece of rubber gasket and a set of springs. The sleeve mouth expands outwards at a certain angle, and the length of the inner groove in the sleeve is 1–2 mm longer than that of the lock tab to facilitate automated installation, as shown in Figure 1. To ensure the tightness of the joint between segments, stress pads and elastic sealing gaskets are installed at the joint.

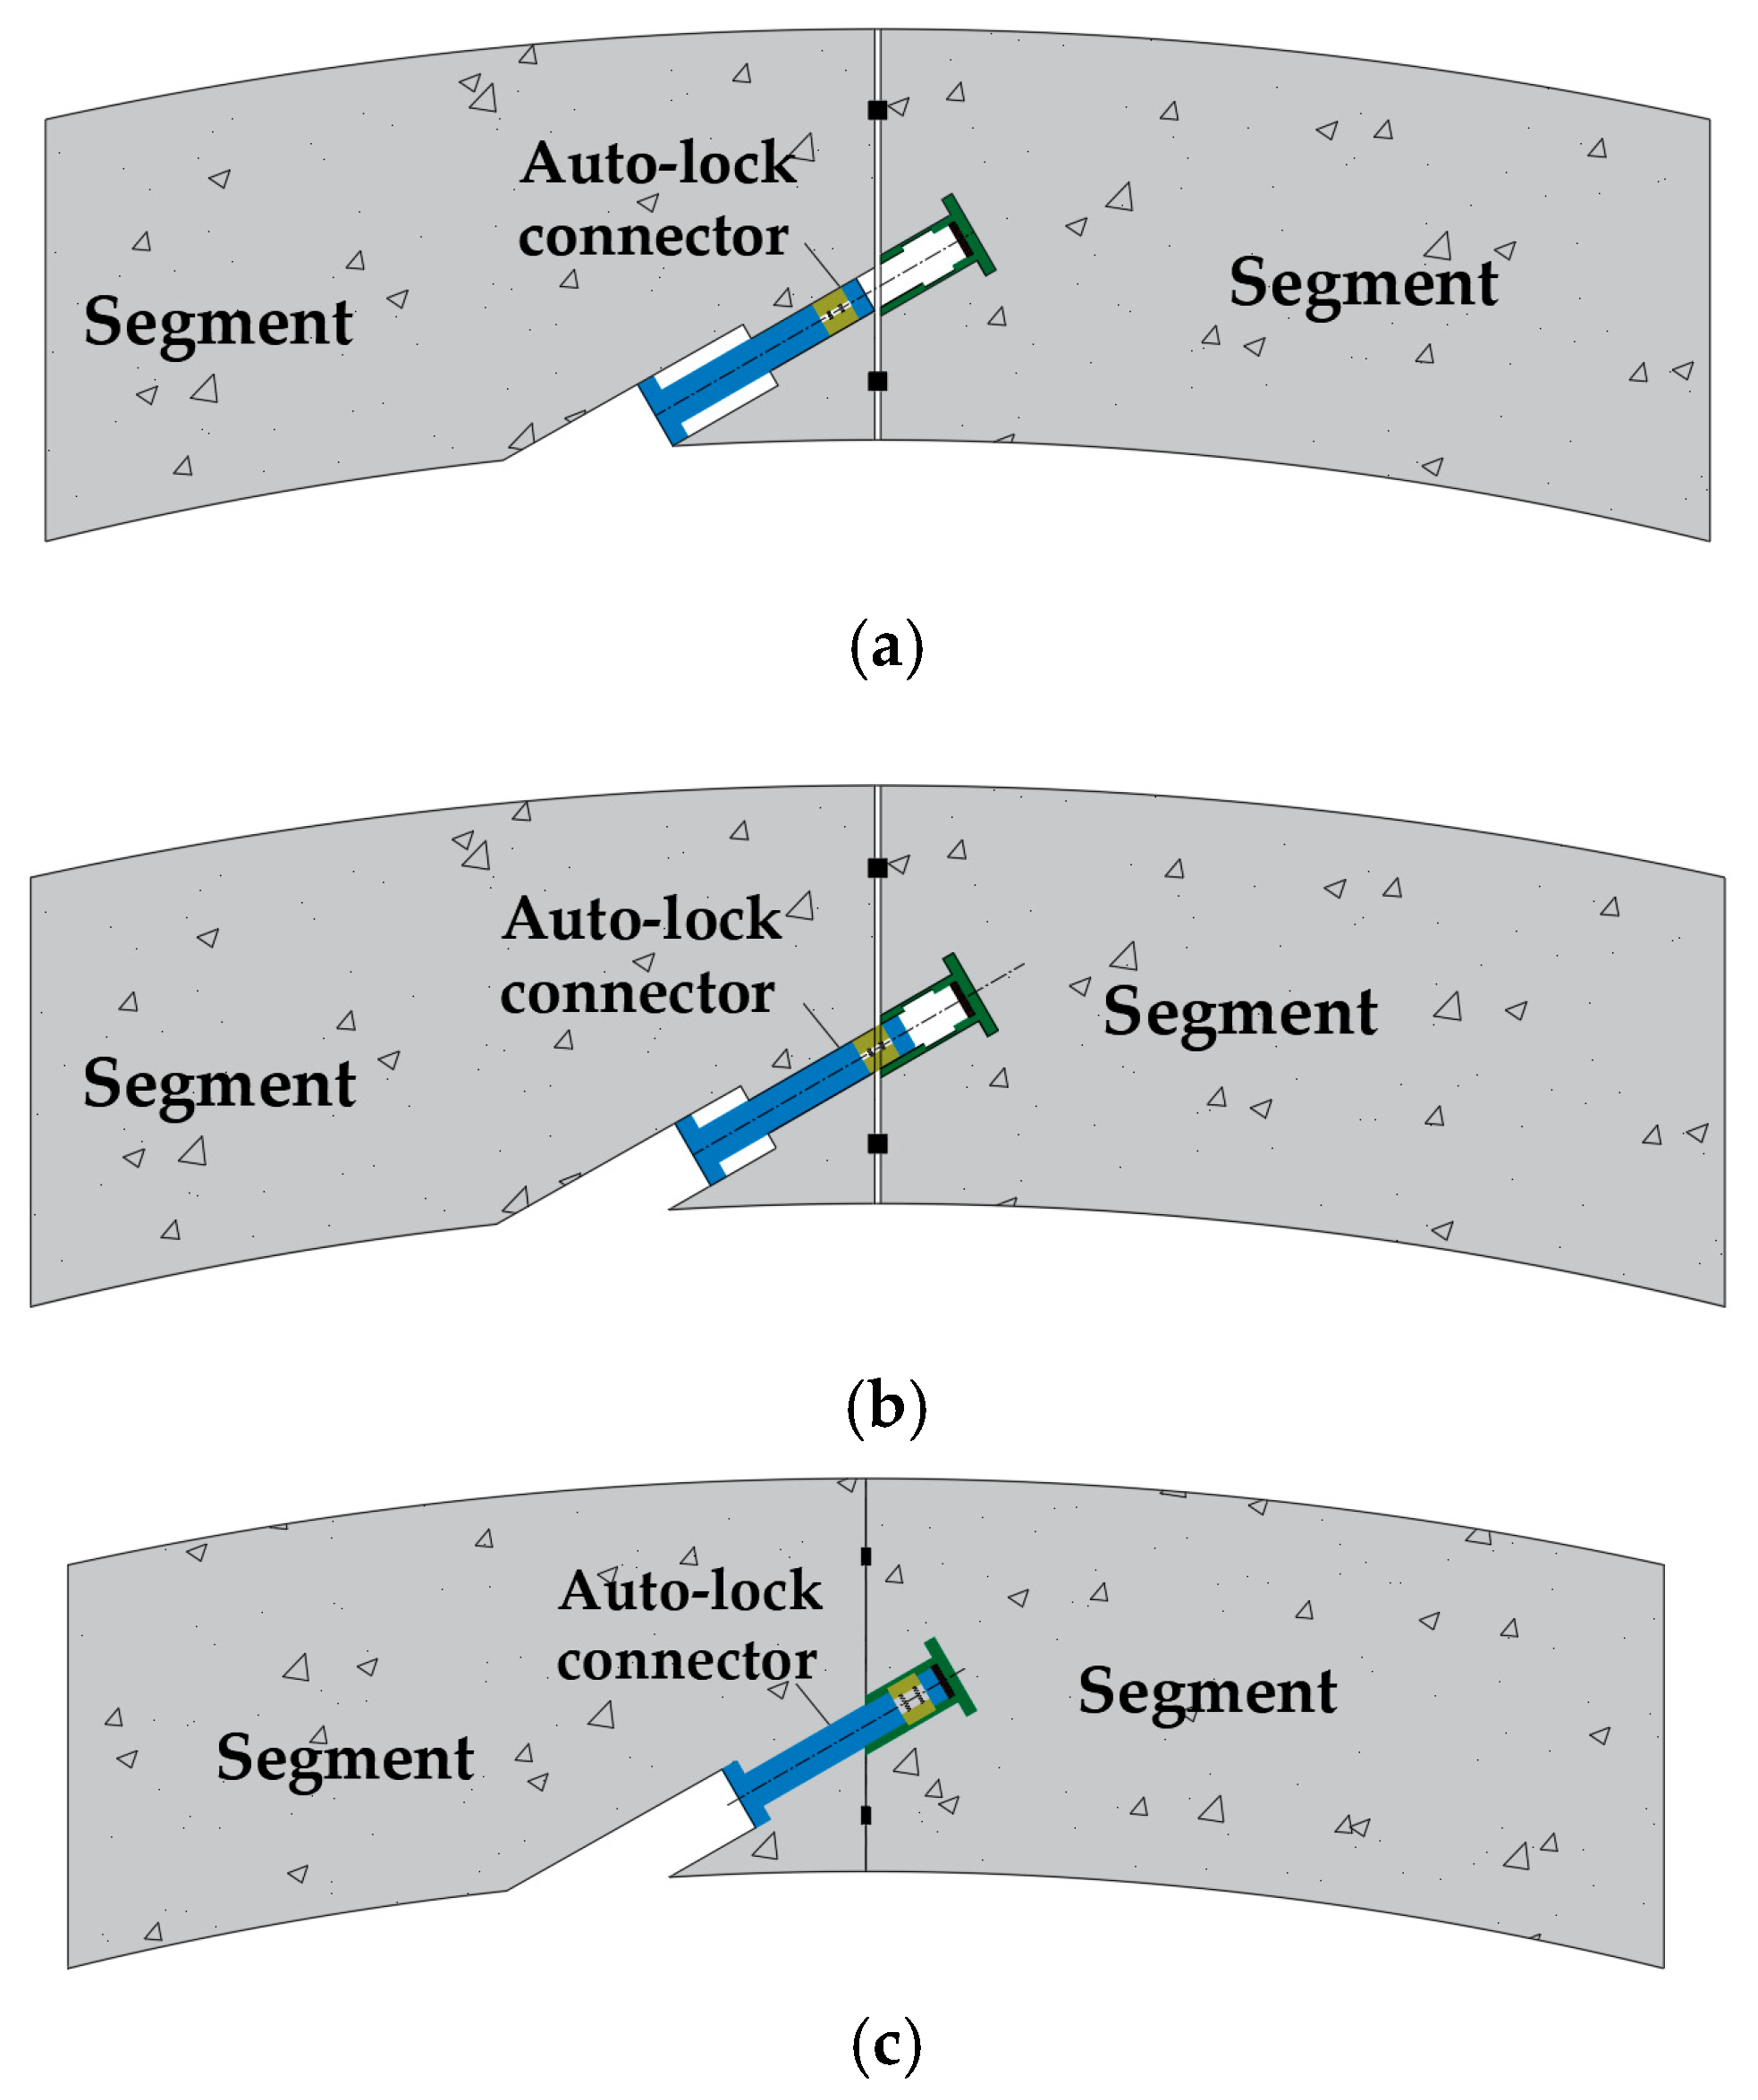
2.2. Working Mechanism of the Auto-Lock Connector

Figure 2 illustrates the installation process of the auto-lock connector. After the segment assembly is completed, the robotic arm aligns with the hole. Next, the robotic arm pushes the preset pins along the hole until the locking tabs fully enter the sleeve embedded in the opposite segment. Under the action of the springs, the locking tabs are pushed outwards into the chamber. Finally, the joint achieves mechanical interlocking between components through an internally mounted spring, and the segments are unified into a cohesive structure. During installation, the gaskets and sealing pads at the joint are compressed. After the robotic arm withdraws, the connector’s engagement suppresses the rebound of the gaskets and sealing pads, thereby generating a preload at the joint. However, owing to potential installation discrepancies, the pretension of the auto-lock connector is not exact.
The auto-lock connector has obvious advantages. Firstly, the connector does not need to pass through segment structures, which greatly reduces its size. Second, the bottom of the embedded sleeve and the end of the bolt are both enlarged, which reduces the stress concentration of the concrete around the joint and lowers the reinforcement requirements for segments. Third, due to the gaps and the springs, the connector possess strong deformation adaptability to prevent shear failure when large displacements occur. The locking function of the connector enhances segment installation tolerance and realizes automated assembly, improving construction efficiency significantly. The locking function of the connector not only enhances the segment installation tolerance but also enables automated assembly, which is thereby expected to significantly improve construction efficiency by 70%. In addition, the detachable springs facilitate easy replacement and reduce operational maintenance costs.

3. Analytical Solution of the Auto-Lock Joint

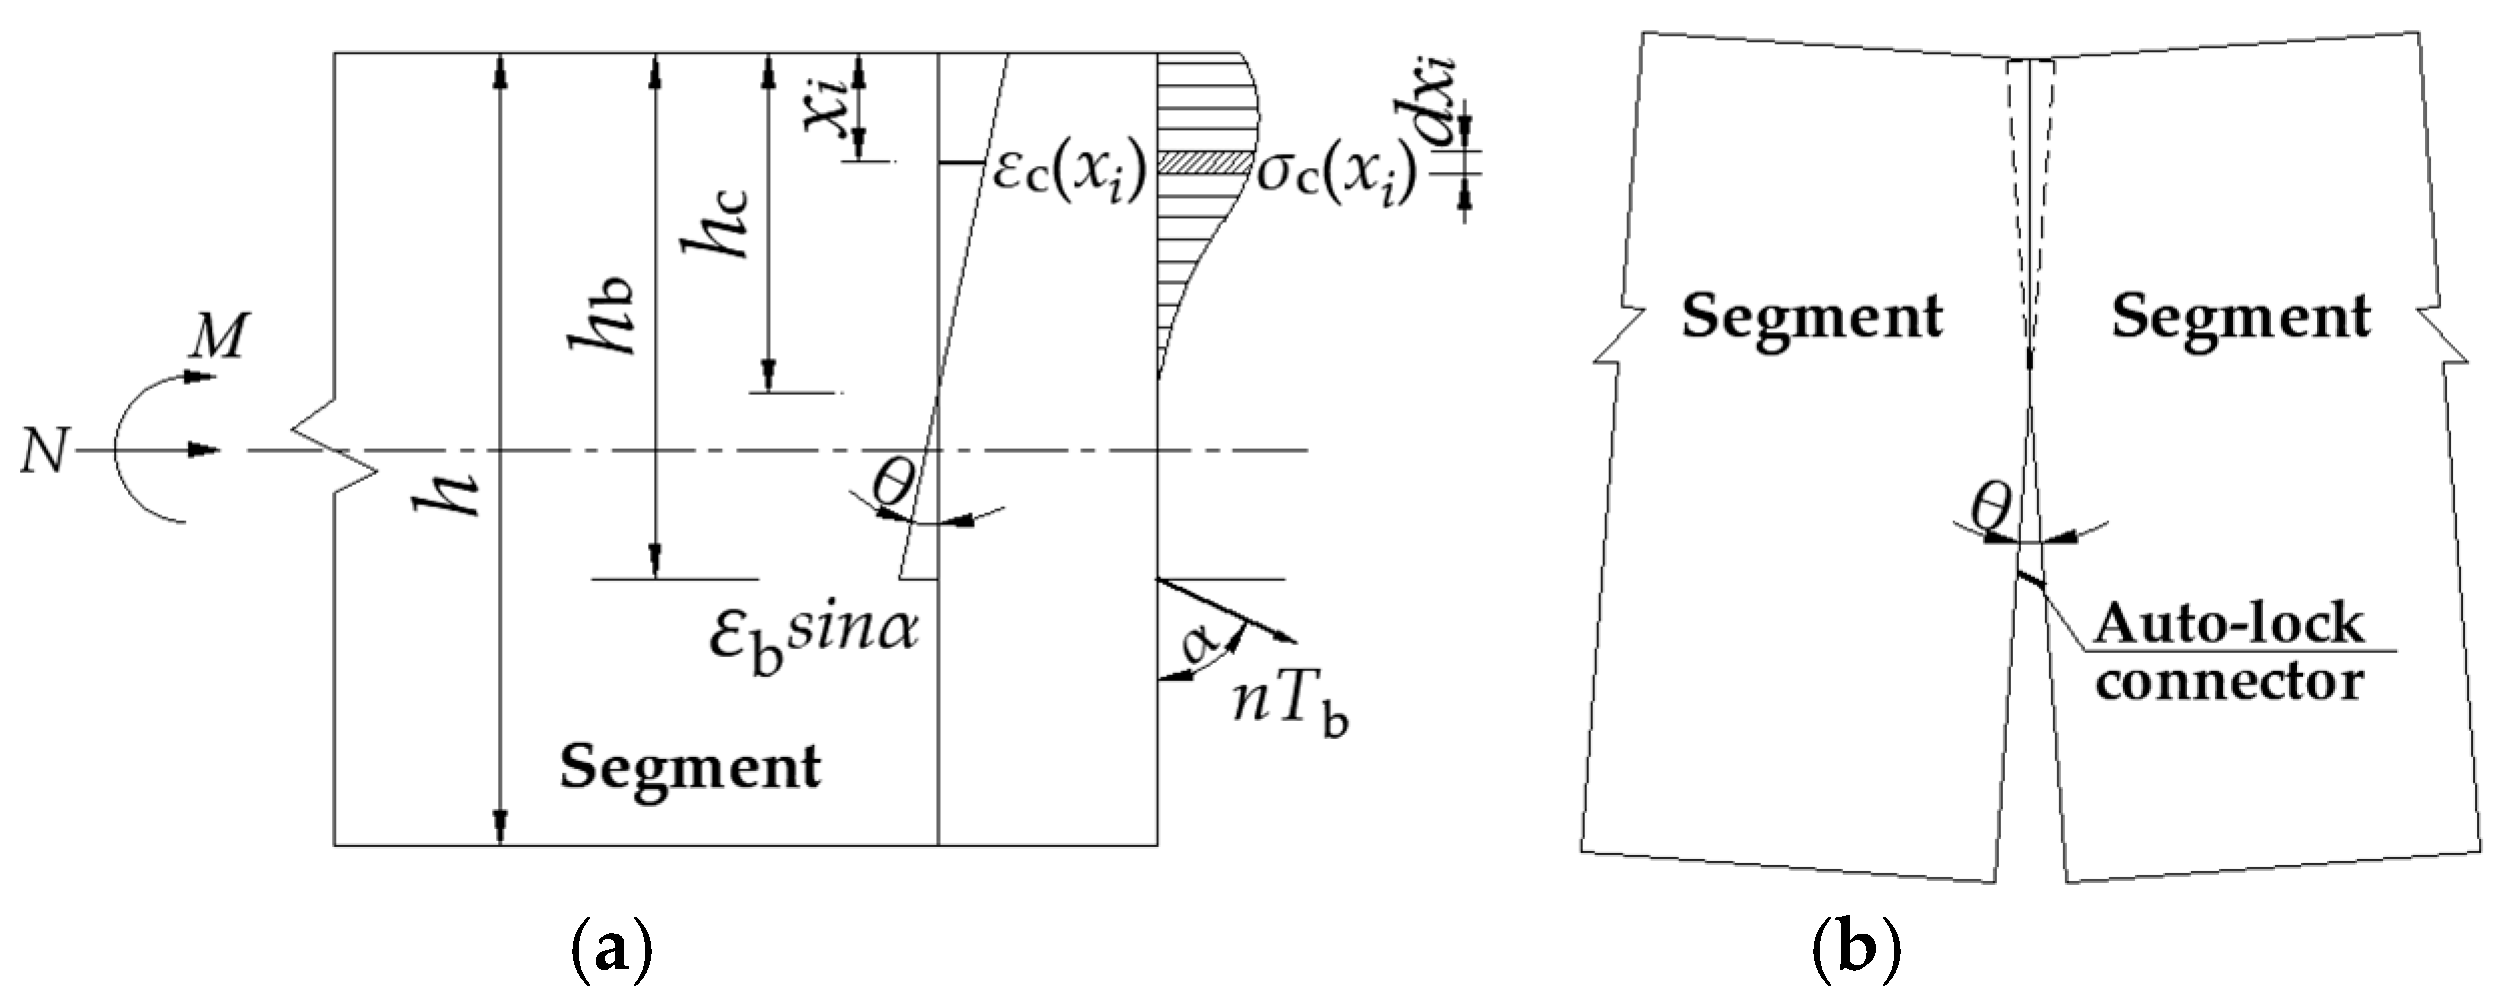
3.1. Basic Assumptions

(1)
The materials involved are isotropic.
(2)
Only the effects of the axial force and the bending moment on the segment joint are considered [17].
(3)
Under bending and axial loading, the joint undergoes rotational deformation, and the stress on the joint satisfies the plane section assumption.
(4)
The entire cross-section of the joint surface is in a state of compression before the joint opens, and connectors are not engaged in the work. Once the joint opens, the detachment zone and the compression zone on the joint section maintain compatible deformation. Tension is supported by the connectors, whereas compression is taken only by the segment.
(5)
The effects of the pretension of connectors, hole channel errors, transmission cushion, and waterproof sealing cushion on the mechanical performance of the joint are not considered.

3.2. Constitutive Model of Materials

3.2.1. Concrete

The stress distribution in the segment joint is influenced by the properties of concrete and connector. In this study, the constitutive model for concrete proposed by Hognestad was adopted for the following derivation according to the relevant design codes for concrete structures [18,19]. The concrete compressive stress–strain relationship features an ascent stage in a parabola and a descent stage in a straight line, as indicated by Equations (1) and (2), as shown in Figure 3 [20]. The stress after reaching the yield strength decreases as the strain increases, which meticulously captures the post-peak behavior of concrete.
σ = f c 2 ε ε c 0 ε ε c 0 2 0 < ε < ε c 0
σ = f c 1 0.15 ε ε 0 ε c u ε c 0 ε c 0 < ε < ε c u
where σ and ε are the stress and strain of the concrete, respectively. fc is the compressive strength of the concrete. ε0 is the strain corresponding to σc0, which is 0.002. εcu is the ultimate strain of the concrete, which is 0.0033.

3.2.2. Connector

The auto-lock connector adopts high-strength steel, which behaves as a perfectly elastic material before yielding and exhibits strain hardening after yielding. The constitutive relationship employs a bilinear model, as illustrated in Figure 4. Segment OA represents the elastic stage with an elastic modulus of Es, whereas segment AB signifies the hardening stage with an elastic modulus of Est (Est = 0.01 Es), as described by Equations (3) and (4).
σ   =   E s ε ( ε ε y )
σ   = f y + 0.01 E s ( ε ε y ) ( ε y < ε ε u )
where σ and ε are the stress and the strain of the steel, respectively. fy and εy are the yield stress and yield strain of the steel, respectively. fu and εu are the ultimate stress and ultimate strain of the connector steel.

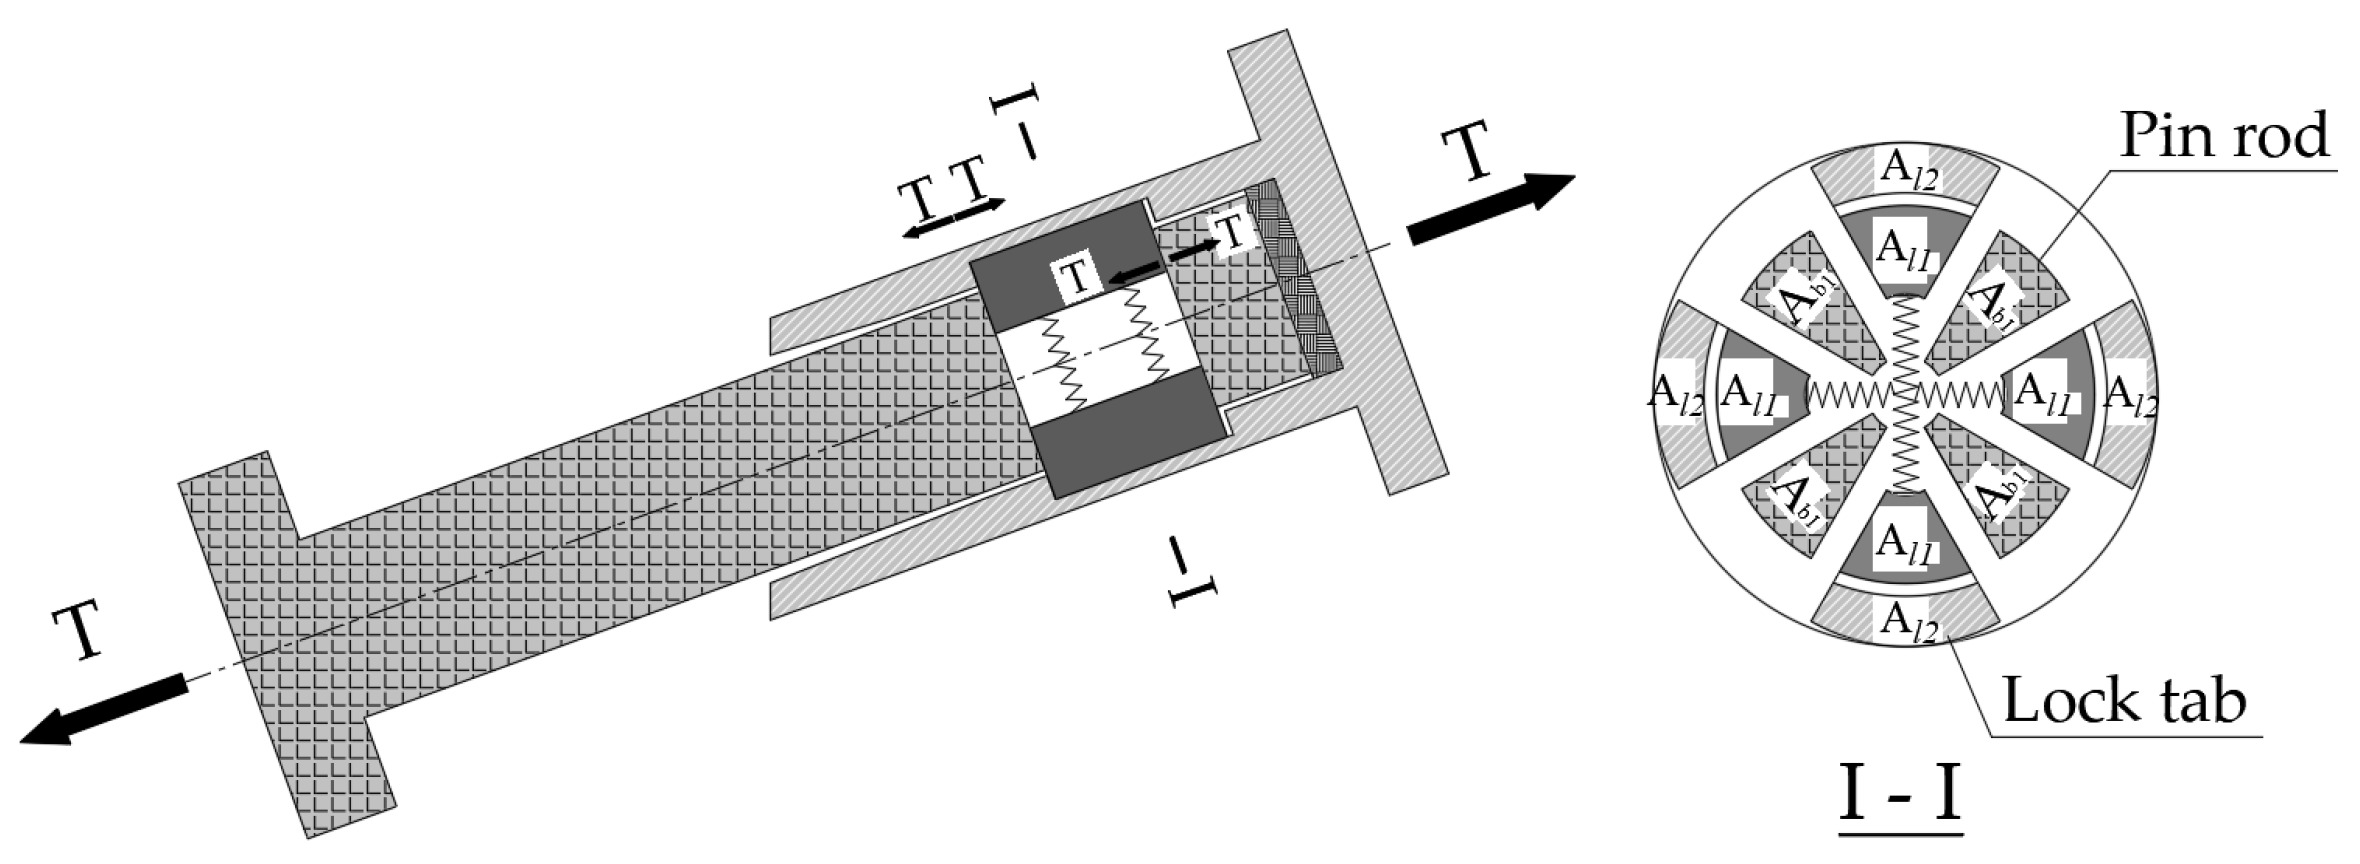
3.3. Bearing Capacity of the Auto-Lock Connector

When the connector is subjected to the tension T, the force is transmitted through the interaction between the sleeve, the bolt, and the lock tabs. The force of each component is illustrated in Figure 5:
Owing to the openings, the bolt stress at the movable lock tabs is the smallest, resulting in the highest tensile stress on the cross-section. Consequently, this area determines the tensile load-bearing capacity of the entire pin rod, and its maximum tensile stress σb is:
σ b = T A b 1 f u
where Ab1 is the cross-sectional area of the bolt at the lock tab.
At this point, the maximum compressive stress σl on the lock tab is:
σ l = T min A l 1 , A l 2 f u
where Al1 is the contact area between the bolt and lock tabs. Al2 is the contact area between the bolt and sleeve.
The maximum compressive stress σsl on the sleeve bottom is:
σ s l = T A l 2 f u
The bearing capacity of the auto-lock connector T b m a x is:
T b m a x = min f u A b 1 , f u min A l 1 , A l 2 , f u A l 2
Formulas (5)–(8) indicate that the maximum tensile force T b m a x that an auto-lock connector can withdraw depends on its dimensions and material properties. The bearing capacity of the connector can be significantly improved by increasing the size and improving the material properties. When selecting connectors, it is crucial to choose them appropriately based on specific engineering requirements to ensure optimal performance.
The maximum strain ε b m a x in the ultimate limit state of the connector is:
ε b m a x = ε b 1 l b 1 + ε b 2 l b 2 l b = T b m a x E s A b 1 l b 1 + T b m a x E s A b 2 l b 2 l b
where εb1 and εb2 are the stresses of the lock tab and non-lock tab section in the pin rod, respectively. lb1 and lb2 are the lengths of the lock tab and non-lock tab section, respectively. lb is the length of the whole pin rod. Ab2 is the area of the non-lock tab section.

3.4. Mechanical Model of the Auto-Lock Joint

3.4.1. Failure Modes

Under the combined action of axial force and bending moment, the joints of shield tunnel segments bear loads through the interaction of auto-lock connectors and the concrete at the joint. As the deformation of the joint increases, the concrete on one side may be crushed, or some components of the auto-lock connector may reach their ultimate strain. At this point, the segment joint loses its further load-carrying capacity and reaches its ultimate load-bearing state. The failure modes of the joint can be divided into the following.
(1)
Some components of auto-lock connectors reach the ultimate strain, but the concrete remains intact.
When the joint is subjected to low axial pressure, significant rotational deformation occurs due to bending moments, and the joint is prone to failure of auto-lock connectors before the concrete crushing. This means that while auto-lock connectors have reached their limit, the concrete has not yet reached its ultimate strain.
(2)
The connectors yield, and the concrete is partially crushed.
Under the combined action of axial force and bending moment, one side of the joint interface opens up due to tension. Connectors undergo tensile deformation, whereas the concrete on the other side compresses against itself. When the joint fails due to excessive deformation, the strain at the outermost edge of the compressed concrete reaches its ultimate limit, and simultaneously, some components of auto-lock connectors reach a yield state.
(3)
The connector has not yielded, while the concrete has been partially crushed.
Under high axial compression, the joint opening caused by bending moments is minimal, resulting in low stress on the auto-lock connectors. When the joint fails, the concrete reaches its ultimate strain and forms a crush zone, while the components of connectors still retain elastic.
(4)
The connector is out of service, and the concrete is partially crushed.
Under the combined action of the axial force and bending moment, connectors remain in the compression zone. Since the connectors cannot bear compressive stress, they can be regarded as out of work, and the bending moment and axial force at the joint surface are borne by the concrete segments. Partial crushing of the concrete signifies joint failure.

3.4.2. Bearing Capacity of the Auto-Lock Joint

The auto-lock connectors have a complex structure, and concrete is a nonlinear material. To facilitate the analysis of the mechanical performance of segment joints and obtain the stress conditions of the concrete and connector when the joint fails, mechanical analysis equations are established by the equal strip method. First, the compressed area of the joint surface is divided into several strips. Then, the internal forces within each strip are calculated layer by layer based on the plane section assumption and material constitutive relationship. Next, a set of mechanical equilibrium equations is established by superimposing the internal forces of each strip and the internal force of the connector with the external force of the joint. Finally, according to different failure modes, the internal forces and other variables under the ultimate bearing state of the joint are solved by assigning the parameters h c , ε b , or ε μ .
When Failure Modes (1)~(3) appear, the connectors and the segments cooperate, and the stress, deformation, and forces of the auto-lock joint are shown in Figure 6.
Based on the plane section assumption, the strain relationship between concrete and connectors is as shown in Equation (10).
h c x i h b h c = ε x i ε b sin α
where h is the height of the RC (reinforced concrete) segment. hc is the height of the concrete compression zone. hb is the distance from the center of the connector to the upper edge of the joint. xi is the distance from the center of the i-th compressed strip to the upper edge of the joint. ε x i is the compressive strain at the center of the i-th compressed strip. α is the inclination angle of the connector.
According to the equilibrium condition of axial forces, Equation (11) is obtained:
N = 0 h c b σ c x d x n T b sin α = i = 1 m b σ c x i d x i n σ b 1 A b 1 sin α
where N is the axial force of the joint. n is the number of connectors. Tb is the tension of the auto-lock connector. α is the angle between the connector and the joint. σ c x i is the stress in the center of the i-th compressed strip.
According to the equilibrium condition of moments, Equation (12) is obtained:
M + N h b 1 2 h = 0 h c b σ c x h b x d x = i = 1 m b σ c x i h c j = 1 i 1 x j x i 2 d x i    
When Failure Mode (4) occurs, the connector is within the compression zone, and the force Tb is zero, so the bending moment and axial force of the joint are completely borne by the segment. Equations (13) and (14) degenerate into:
N = 0 h c b σ c x d x = i = 1 m b σ c x i d x i
M + N h b 1 2 h = 0 h c b σ c x h b x d x = i = 1 m b σ c x i h c j = 1 i 1 x j x i 2 d x i

4. Numerical Analysis

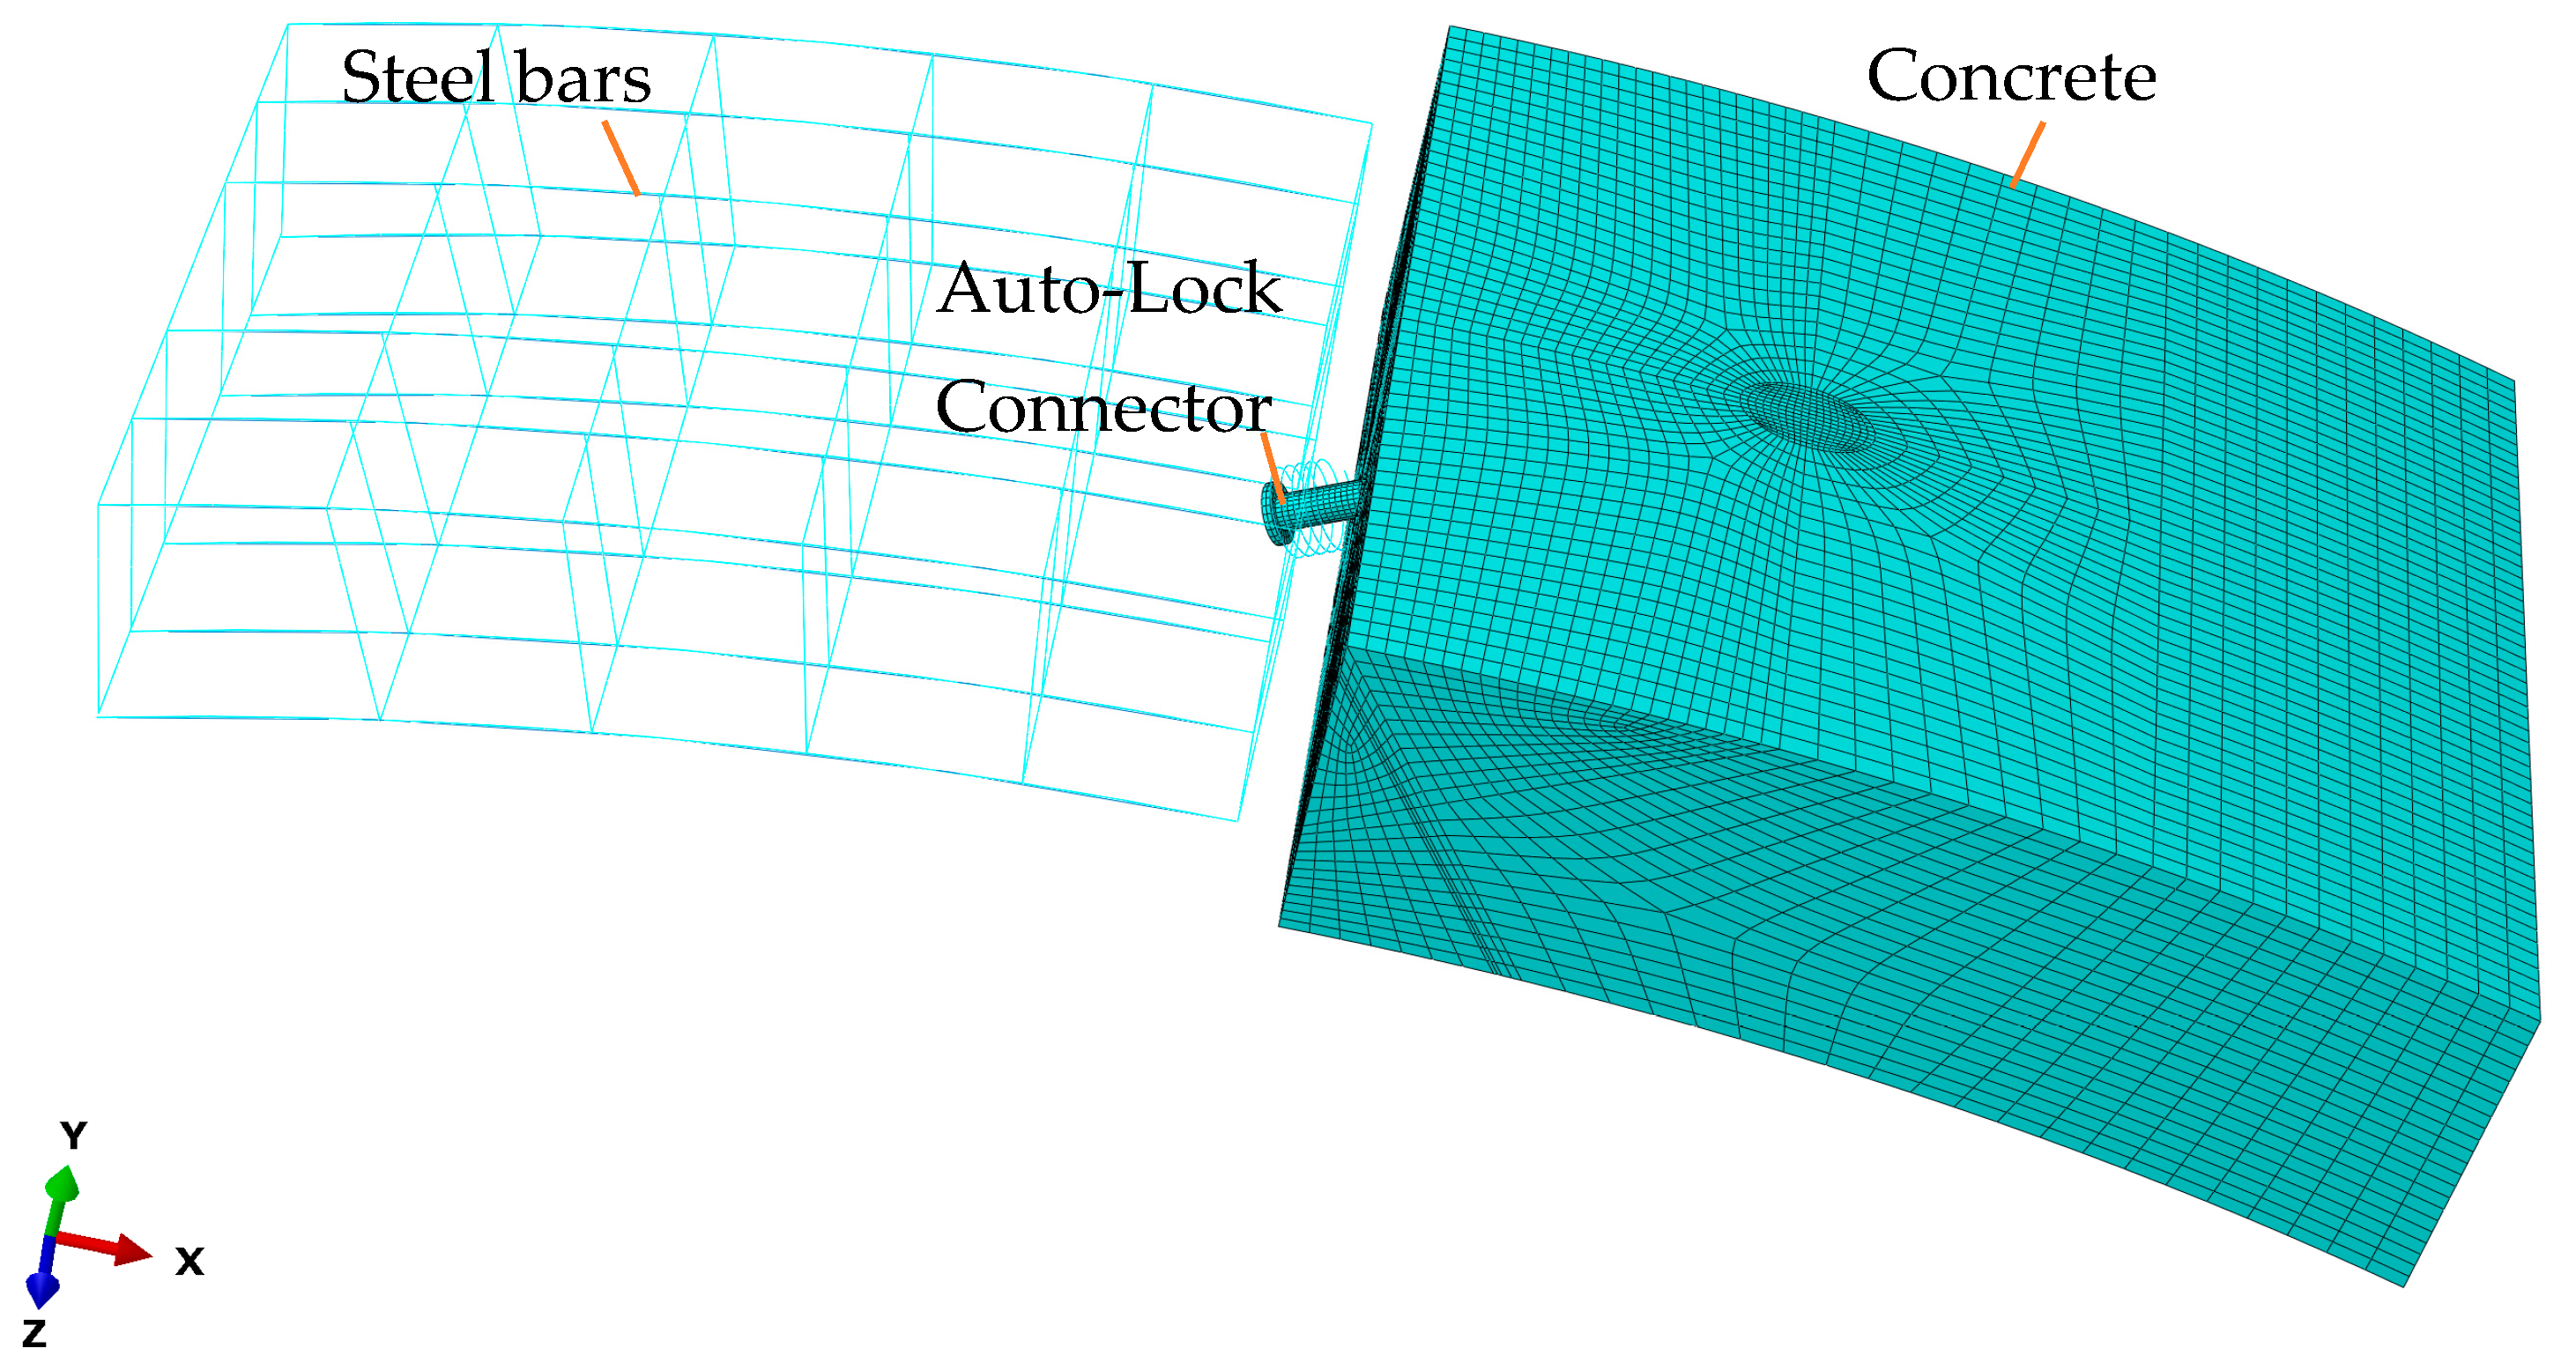
4.1. Numerical Model

The failure of joints in a shield tunnel is a complex process involving the combined effects of multiple factors [21,22,23]. It is necessary to conduct comprehensive and in-depth research on the auto-lock joint. Taking a typical shield tunnel in the subway as the research object, the inner diameter of the segment is 2.95 m, the outer diameter is 3.3 m, the width is 1.5 m, and the thickness is 0.35 m. The numerical model is composed of two segments that are connected by two sets of auto-lock connectors. The connector passes through 220 mm from the upper edge of the segment and has an angle of 60° to the joint plane.
The segment joints at the top and bottom of shield tunnels open inwards under a positive bending moment, and the joints on both sides open outwards under a negative bending moment [24]. According to the deformation of the shield tunnel, the mechanical performance of the segment joint under different load combinations is simulated by adjusting the horizontal force N at both ends and the vertical displacement ΔD on the upper or lower part, as shown in Figure 7 [25]. During loading, N was first applied at both ends of the segments. Then, symmetrical vertical displacement ΔD was applied to the segment through the loading beam until the joint failed. To obtain the ultimate bending moment of the auto-lock joint under different axial forces, N was taken as 100 kN, 200 kN, 300 kN, 400 kN, and 500 kN, respectively.
To simulate the spatial relationship and interaction between the components, a 1/2 fine model of the auto-lock joint was built in ABAQUS/CAE 2020 by taking the half-structure along the width of the segment. In this model, connectors and concrete were modeled using solid elements, whereas steel reinforcements were represented by truss units. The impacts of waterproof sealing gaskets, water retaining strips, and positioning grooves were neglected [26]. The sleeve and reinforcement were bound with concrete by “binding” constraints. The surfaces between the deadbolt and the pin, the deadbolt and the sleeve, and the pins and the hole end were set up with “hard contact”. That is, the pressure perpendicular to the contact surface can be completely transmitted between the two. The penalty function was used to simulate the transfer of shear stress tangentially, and the friction coefficient between the contact surfaces was set at 0.3 [27]. To prevent redundant forces at the joint, displacement constraints were applied to the left segment end in the X-, Y-, and Z-directions, while the right end was constrained only in the Y- and Z-directions; rotational moments were unconstrained at both ends. To prevent lateral torsion, displacement in the Z-direction and rotation angles in the X- and Y-directions were constrained on the segment’s symmetrical plane. Refined grids were utilized at the joint, and the three-dimensional finite element model is shown in Figure 8.

4.2. Material Properties

Unlike the theoretical derivation in Section 3, the concrete damage plasticity (CDP) model was adopted during the numerical simulation to investigate the damage evolution of concrete. The parameters of the C50 segments in accordance with the Code for Design of Concrete Structures (GB50010-2010) are shown in Table 1 [28,29,30]. The yield strengths of HRB400 and HPB300 reinforcements are 400 MPa and 300 MPa, respectively. The auto-lock connector is made of 15 Cr alloy steel, which is assumed to be elastic–plastic. According to the Code for Alloy Structure steels (GB/T 3077-2015) [31], the yield strength and ultimate strength of auto-lock connectors are 490 MPa and 685 MPa, respectively. The reinforcement and auto-lock connector are made of steel with a Young’s modulus of 200 GPa and a Poisson’s ratio of 0.3.

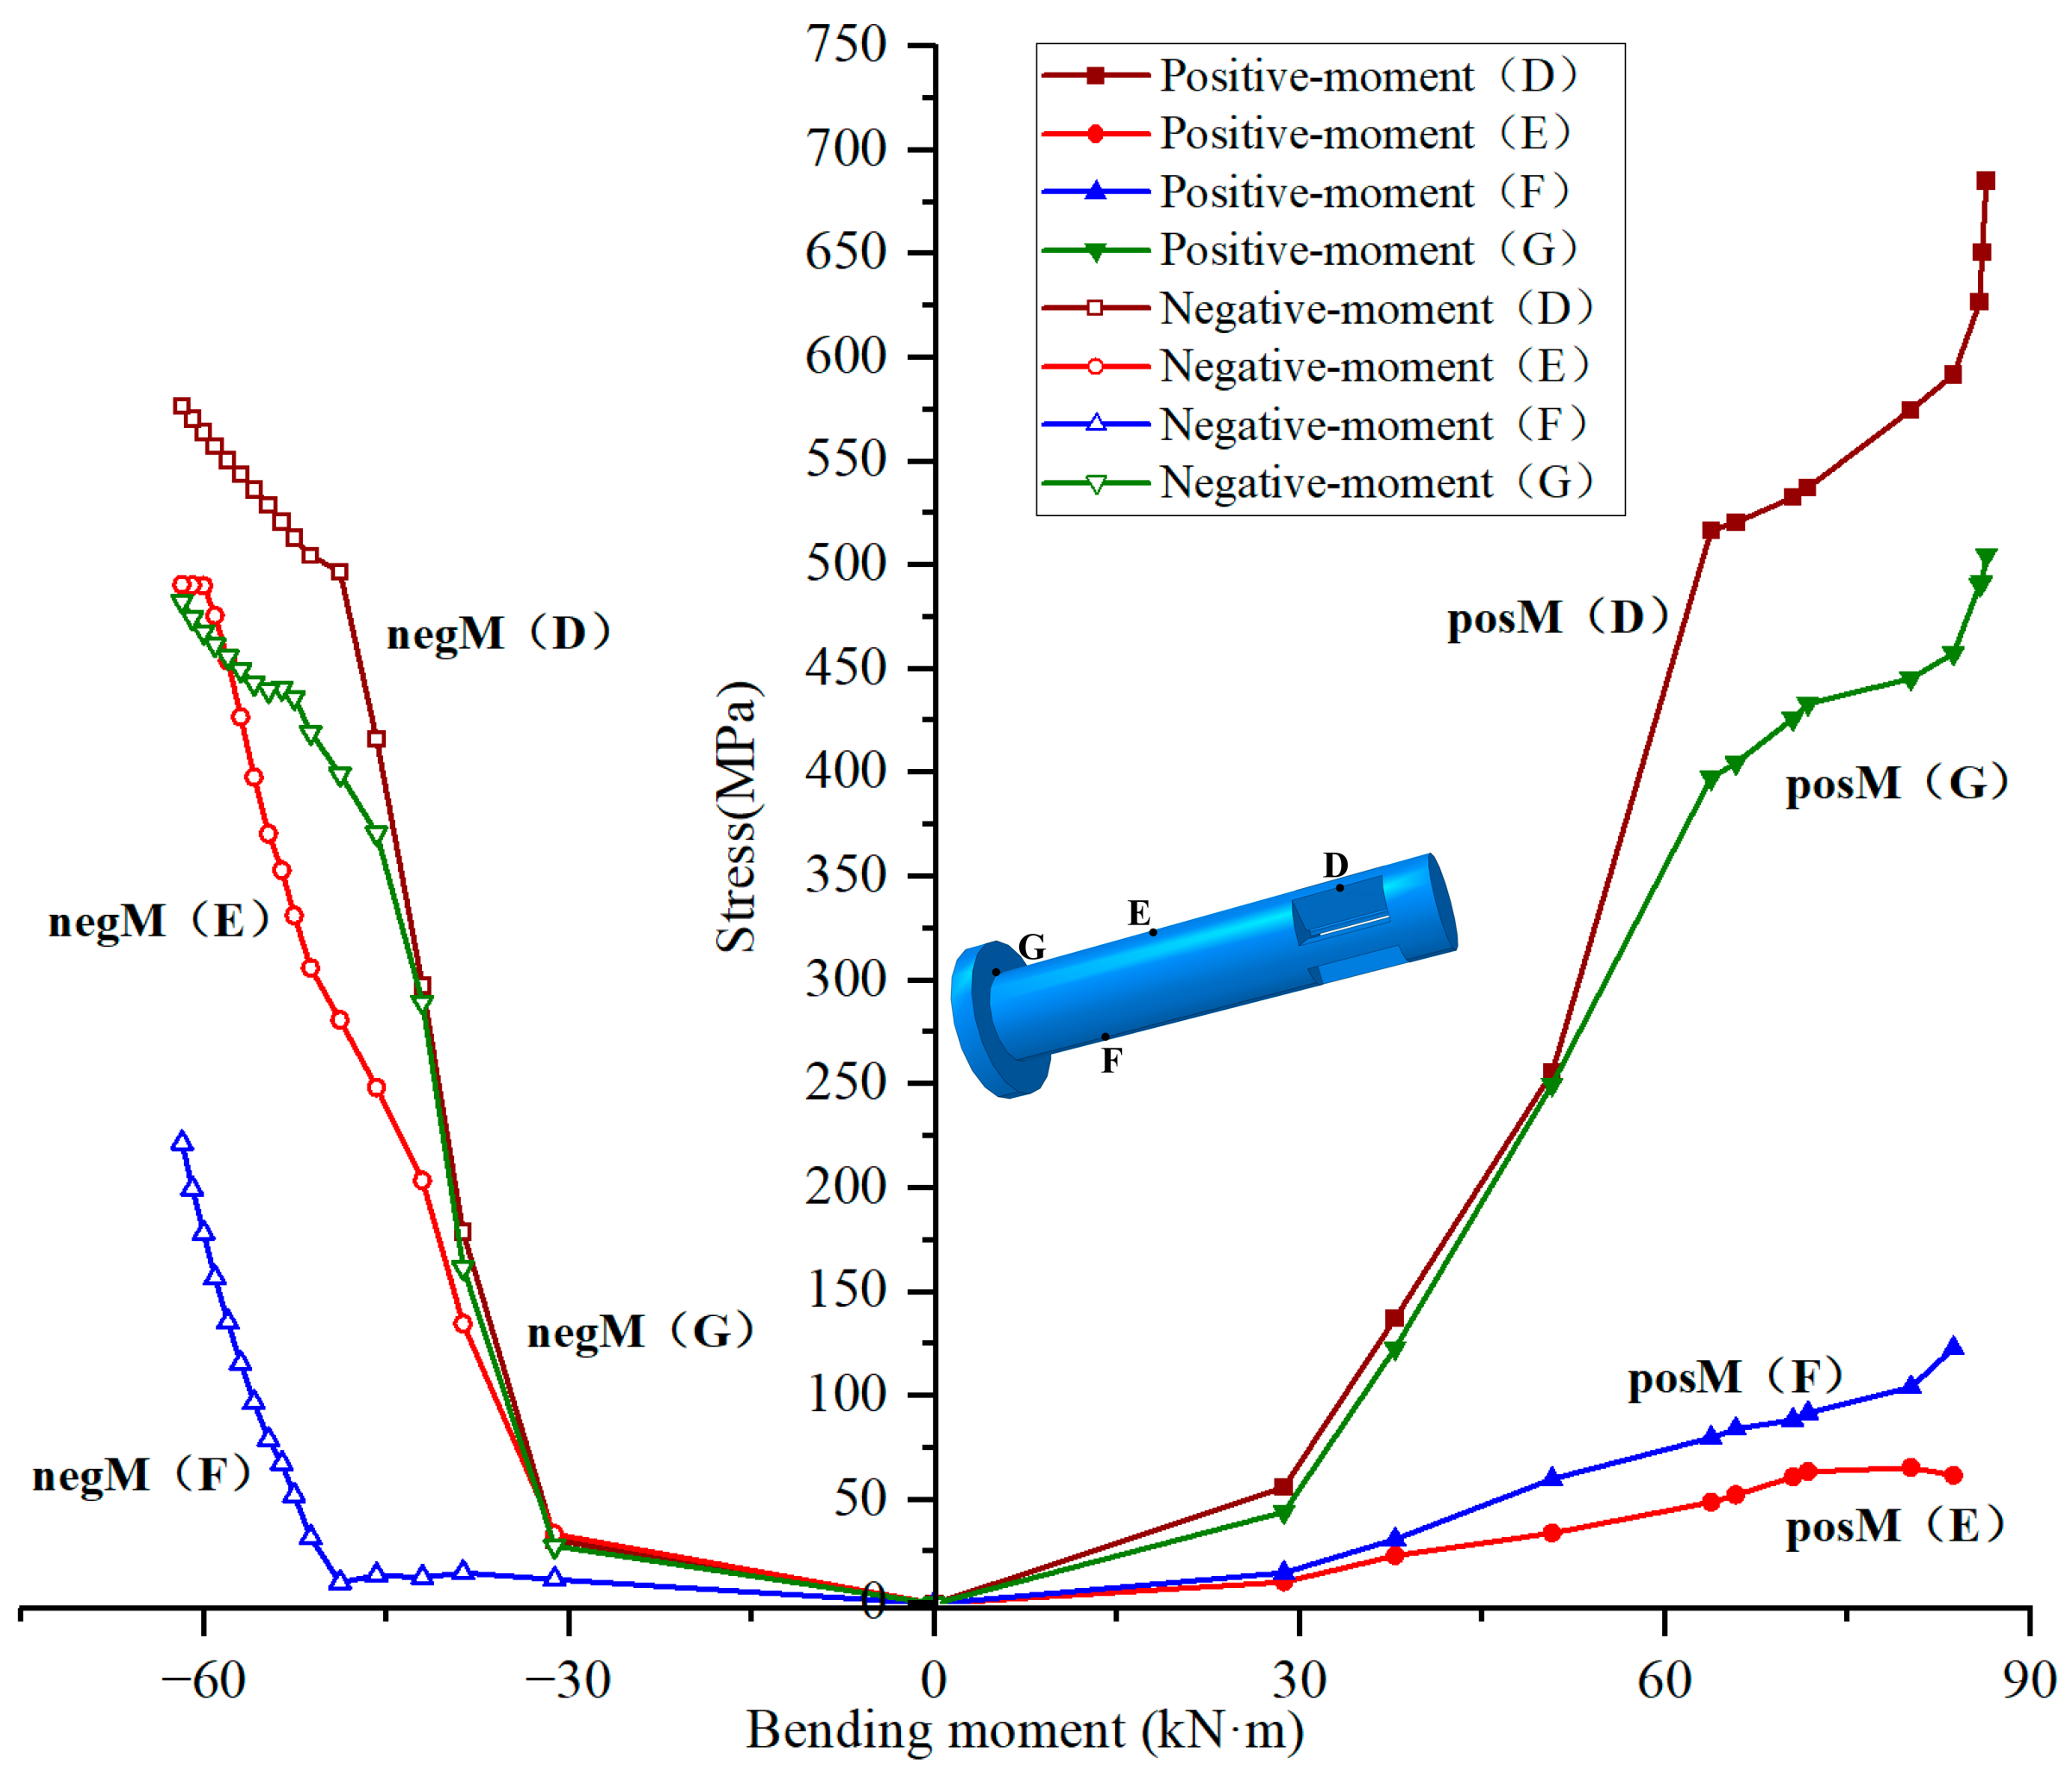
4.3. Results and Discussion

4.3.1. Joint Opening

Based on the numerical simulation and Formulas (1)–(3) for the flexural bearing capacity of the segmental joint derived in Section 4.3, the joint forces and opening under different ultimate conditions are obtained, as shown in Table 2. The greater the axial force of the joint is, the stronger the restraint effect on the joint opening, resulting in a higher bearing capacity of the auto-lock connector. The results from the numerical simulation solution (NSS) and the theoretical analytical solution (TAS) differ by less than 6% and result in substantial agreement.
Figure 9 shows the relationship curves between the joint opening and load under positive and negative bending moments. The development pattern of curves under negative bending is roughly similar to that under positive bending, except that the joint opens on the inner segment side under positive bending, whereas it opens on the outer segment side under negative bending. Initially, under the action of N, the joint plane is in a compressed state, and the connectors are not involved in the work. After applying ΔD, as the bending moment of the joint gradually increases, the segment joint opens, and the auto-lock connector begins to work, bearing the axial force and the bending moment together with the compressed concrete. Since the bending moment is small at this time, both the opening amount and height of the joint increase linearly with the bending moment. As the bending moment continues to increase, the concrete enters the plastic state, or some components of the connectors reach their yield strength. The joint opening amount and opening height rapidly increase, but the load increases slowly, showing a nonlinear change before failure. Finally, significant stretching of the curve can be observed just before the joint fails. This also indicates that either the concrete on one side of the segment reaches its ultimate compressive strain or that a certain component of the connector reaches its ultimate strength.
A comparison of these curves reveals that an increase in the axial force results in a smaller maximum opening amount of the joint and enhances its flexural bearing capacity. This finding indicates that the axial force can restrain joint opening to some extent. Under identical conditions, since connectors experience force later under negative bending than under positive bending, the opening amount of joint planes under negative bending is greater. This suggests that the joint has a stronger ability to resist positive bending deformation. Auto-lock connectors are made of ductile materials, and there is a significant relative displacement between the joint planes when auto-lock joints fail, which is considered ductile failure.

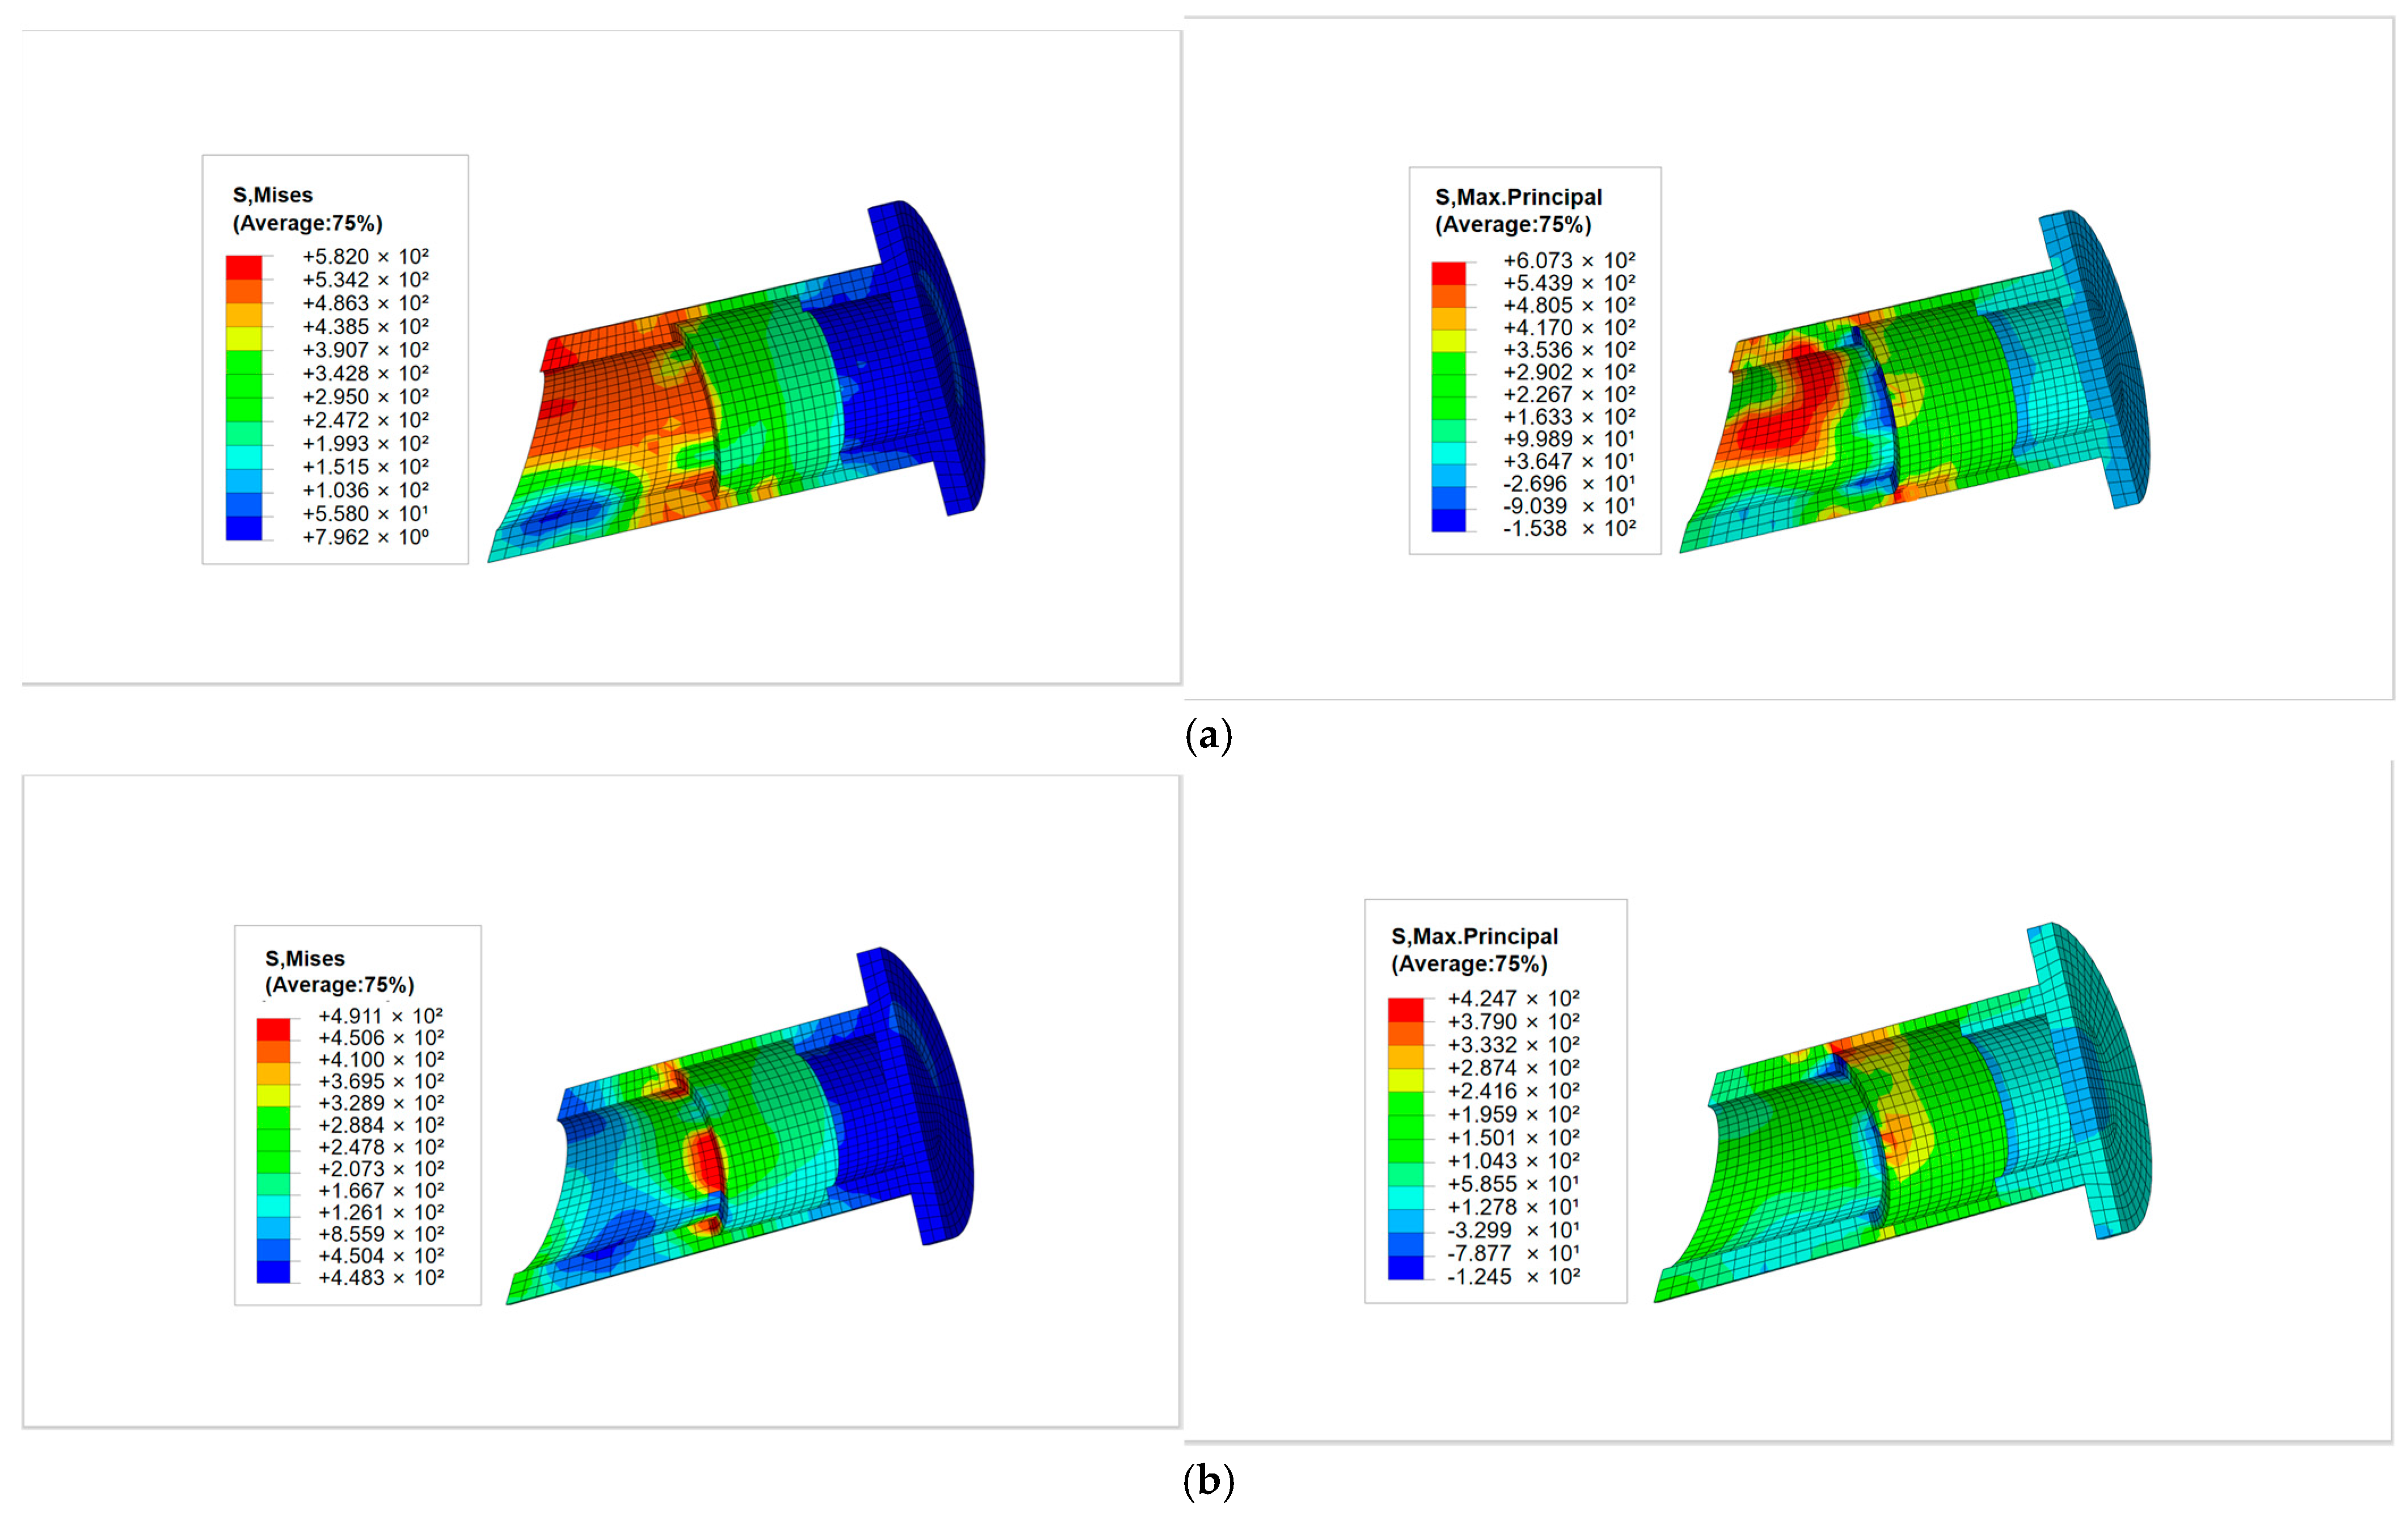
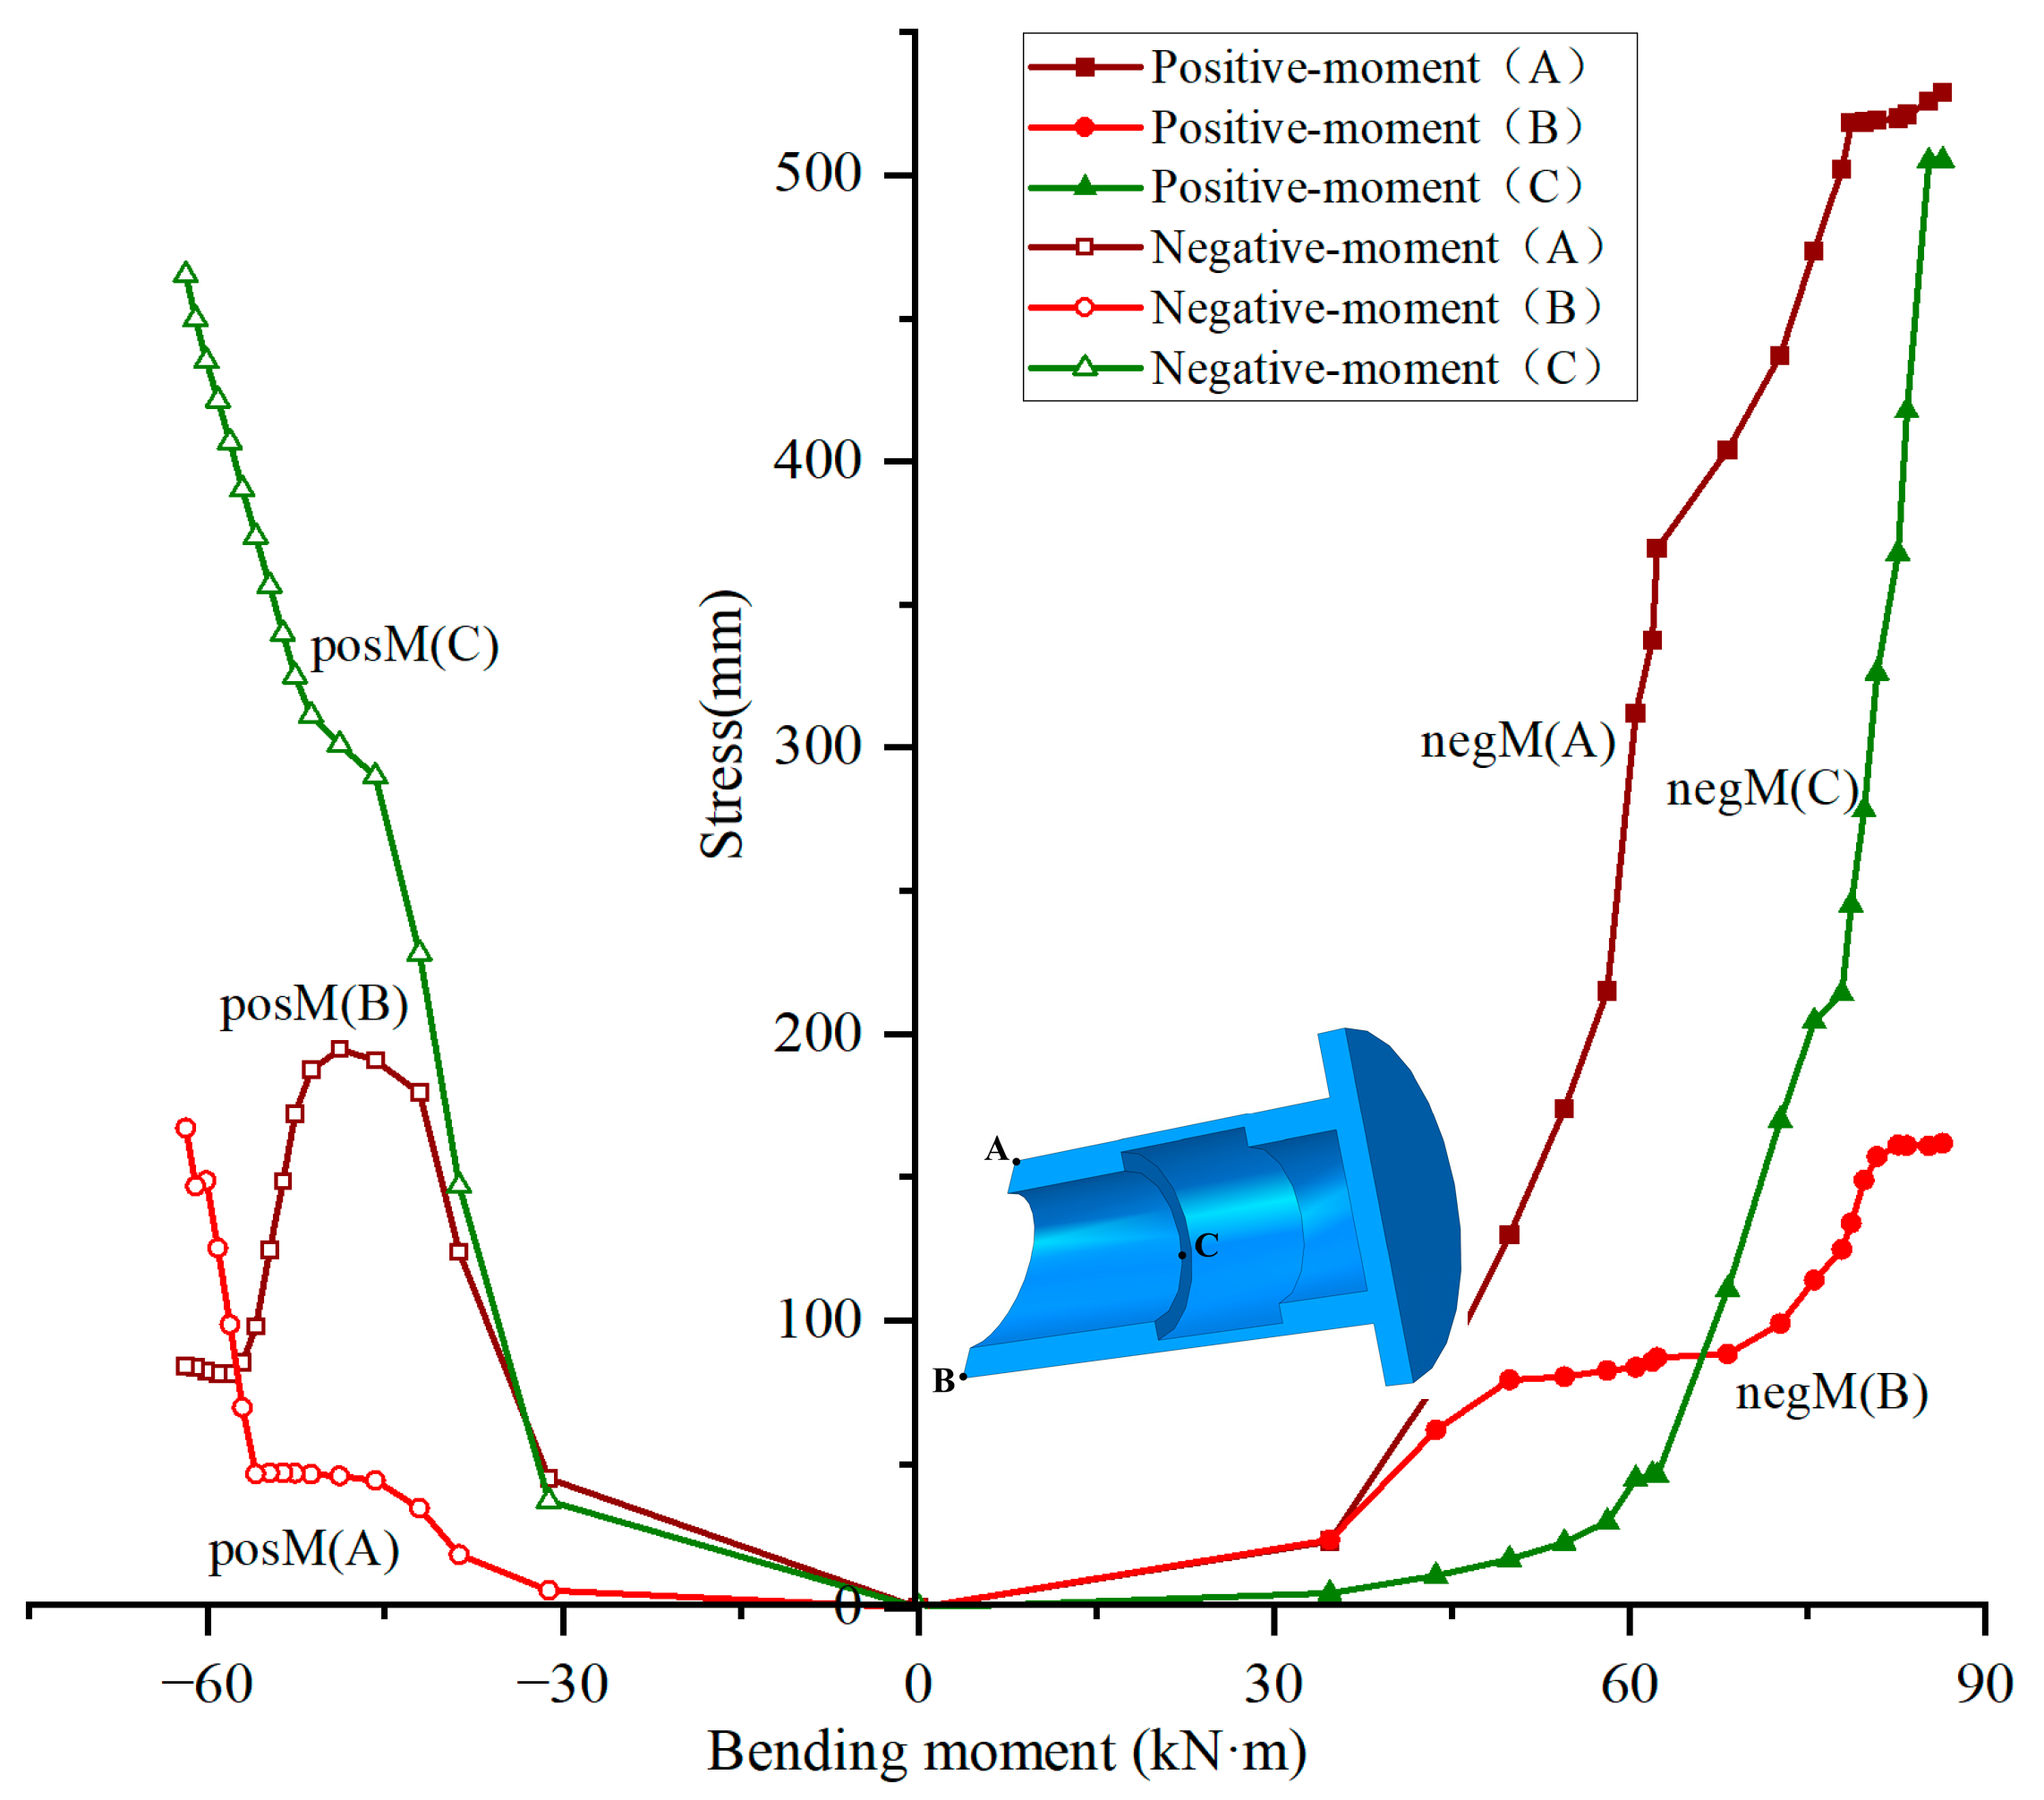
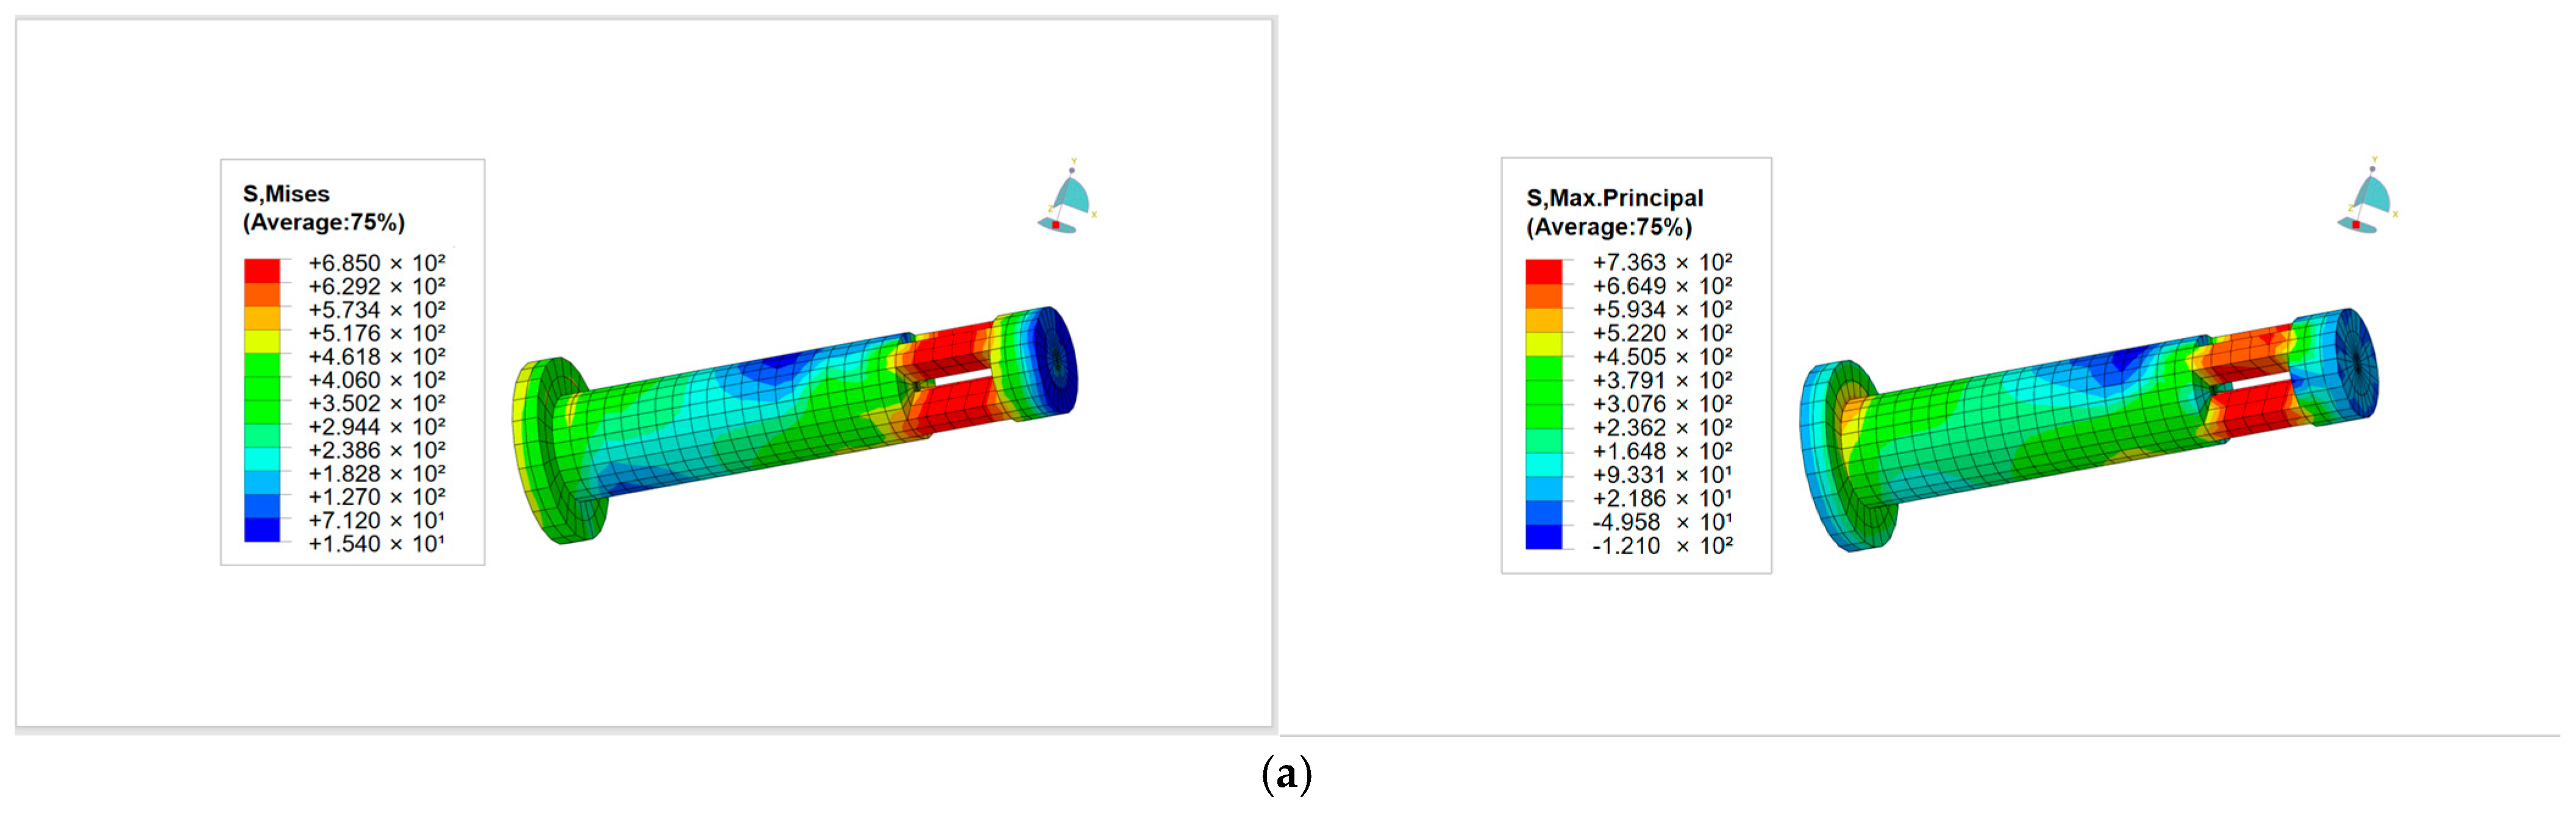
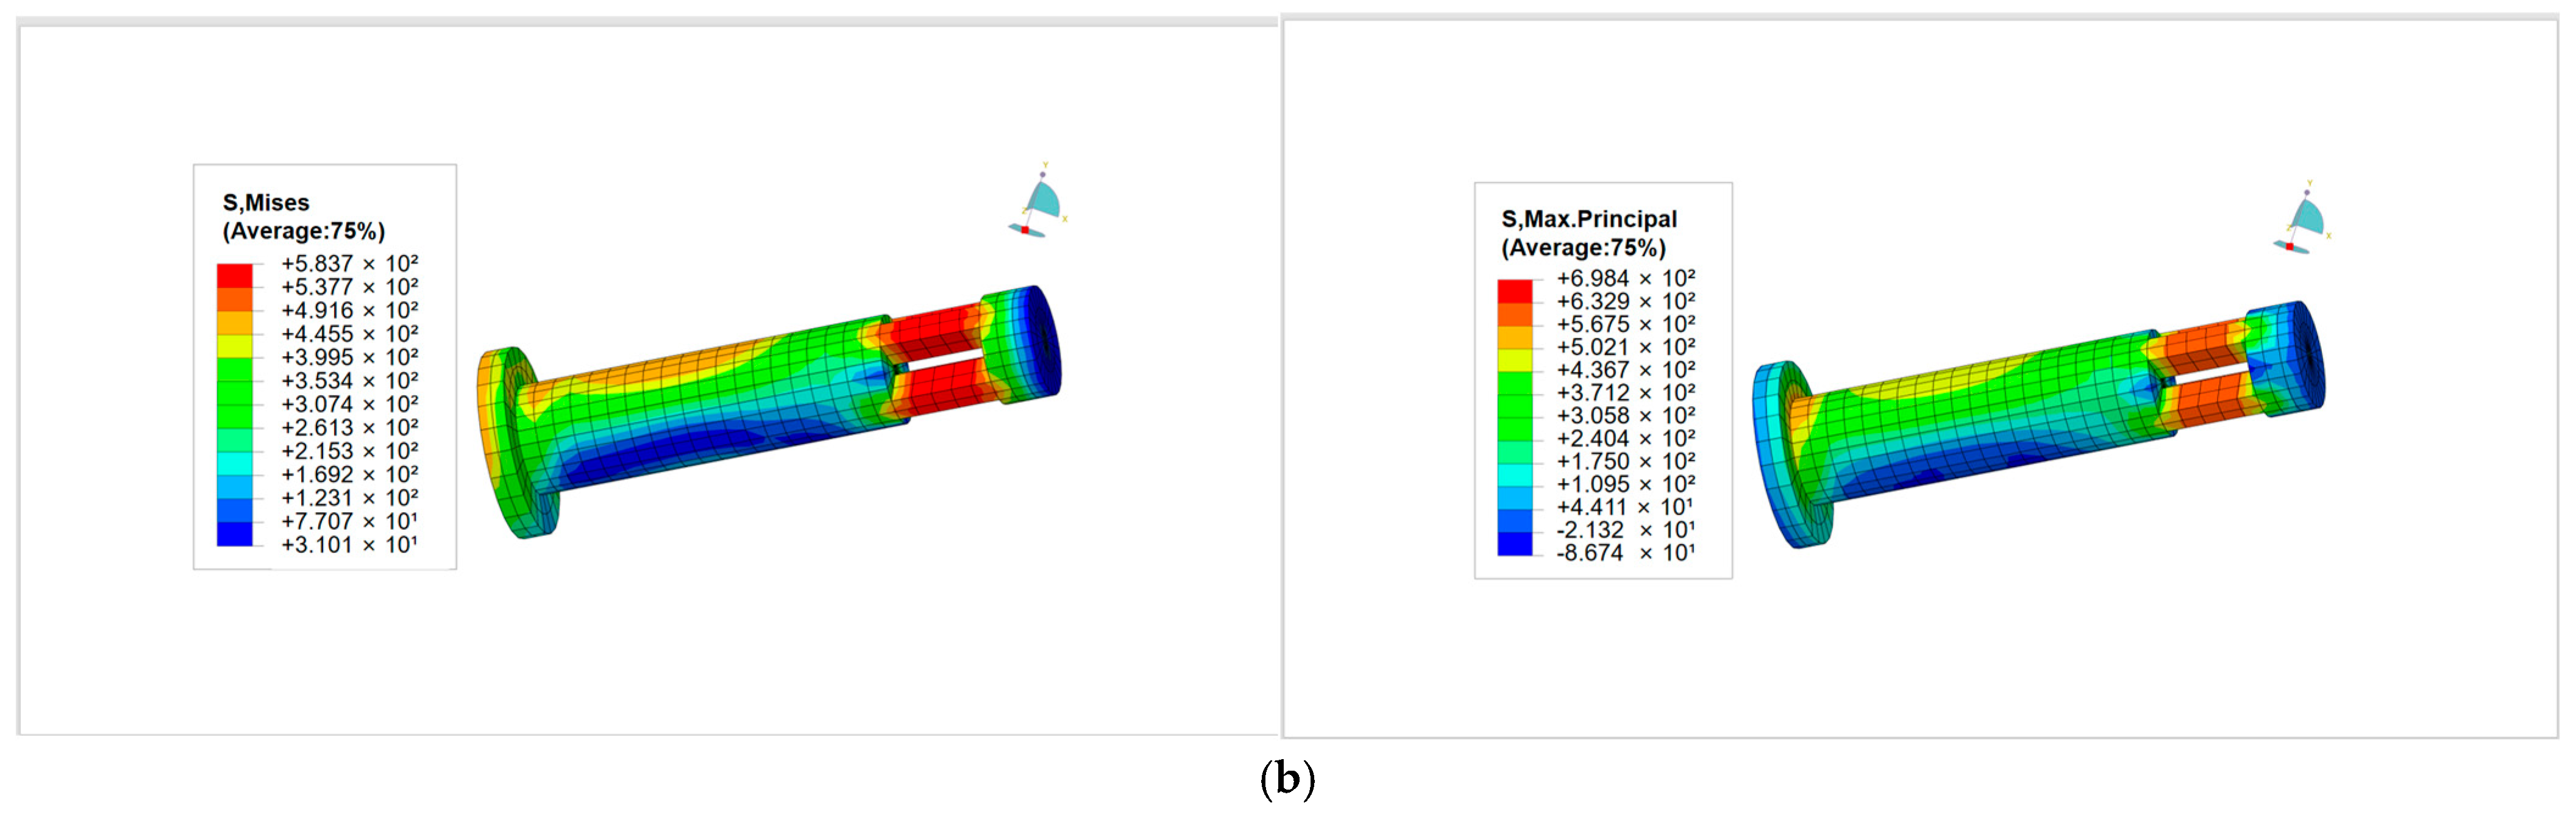
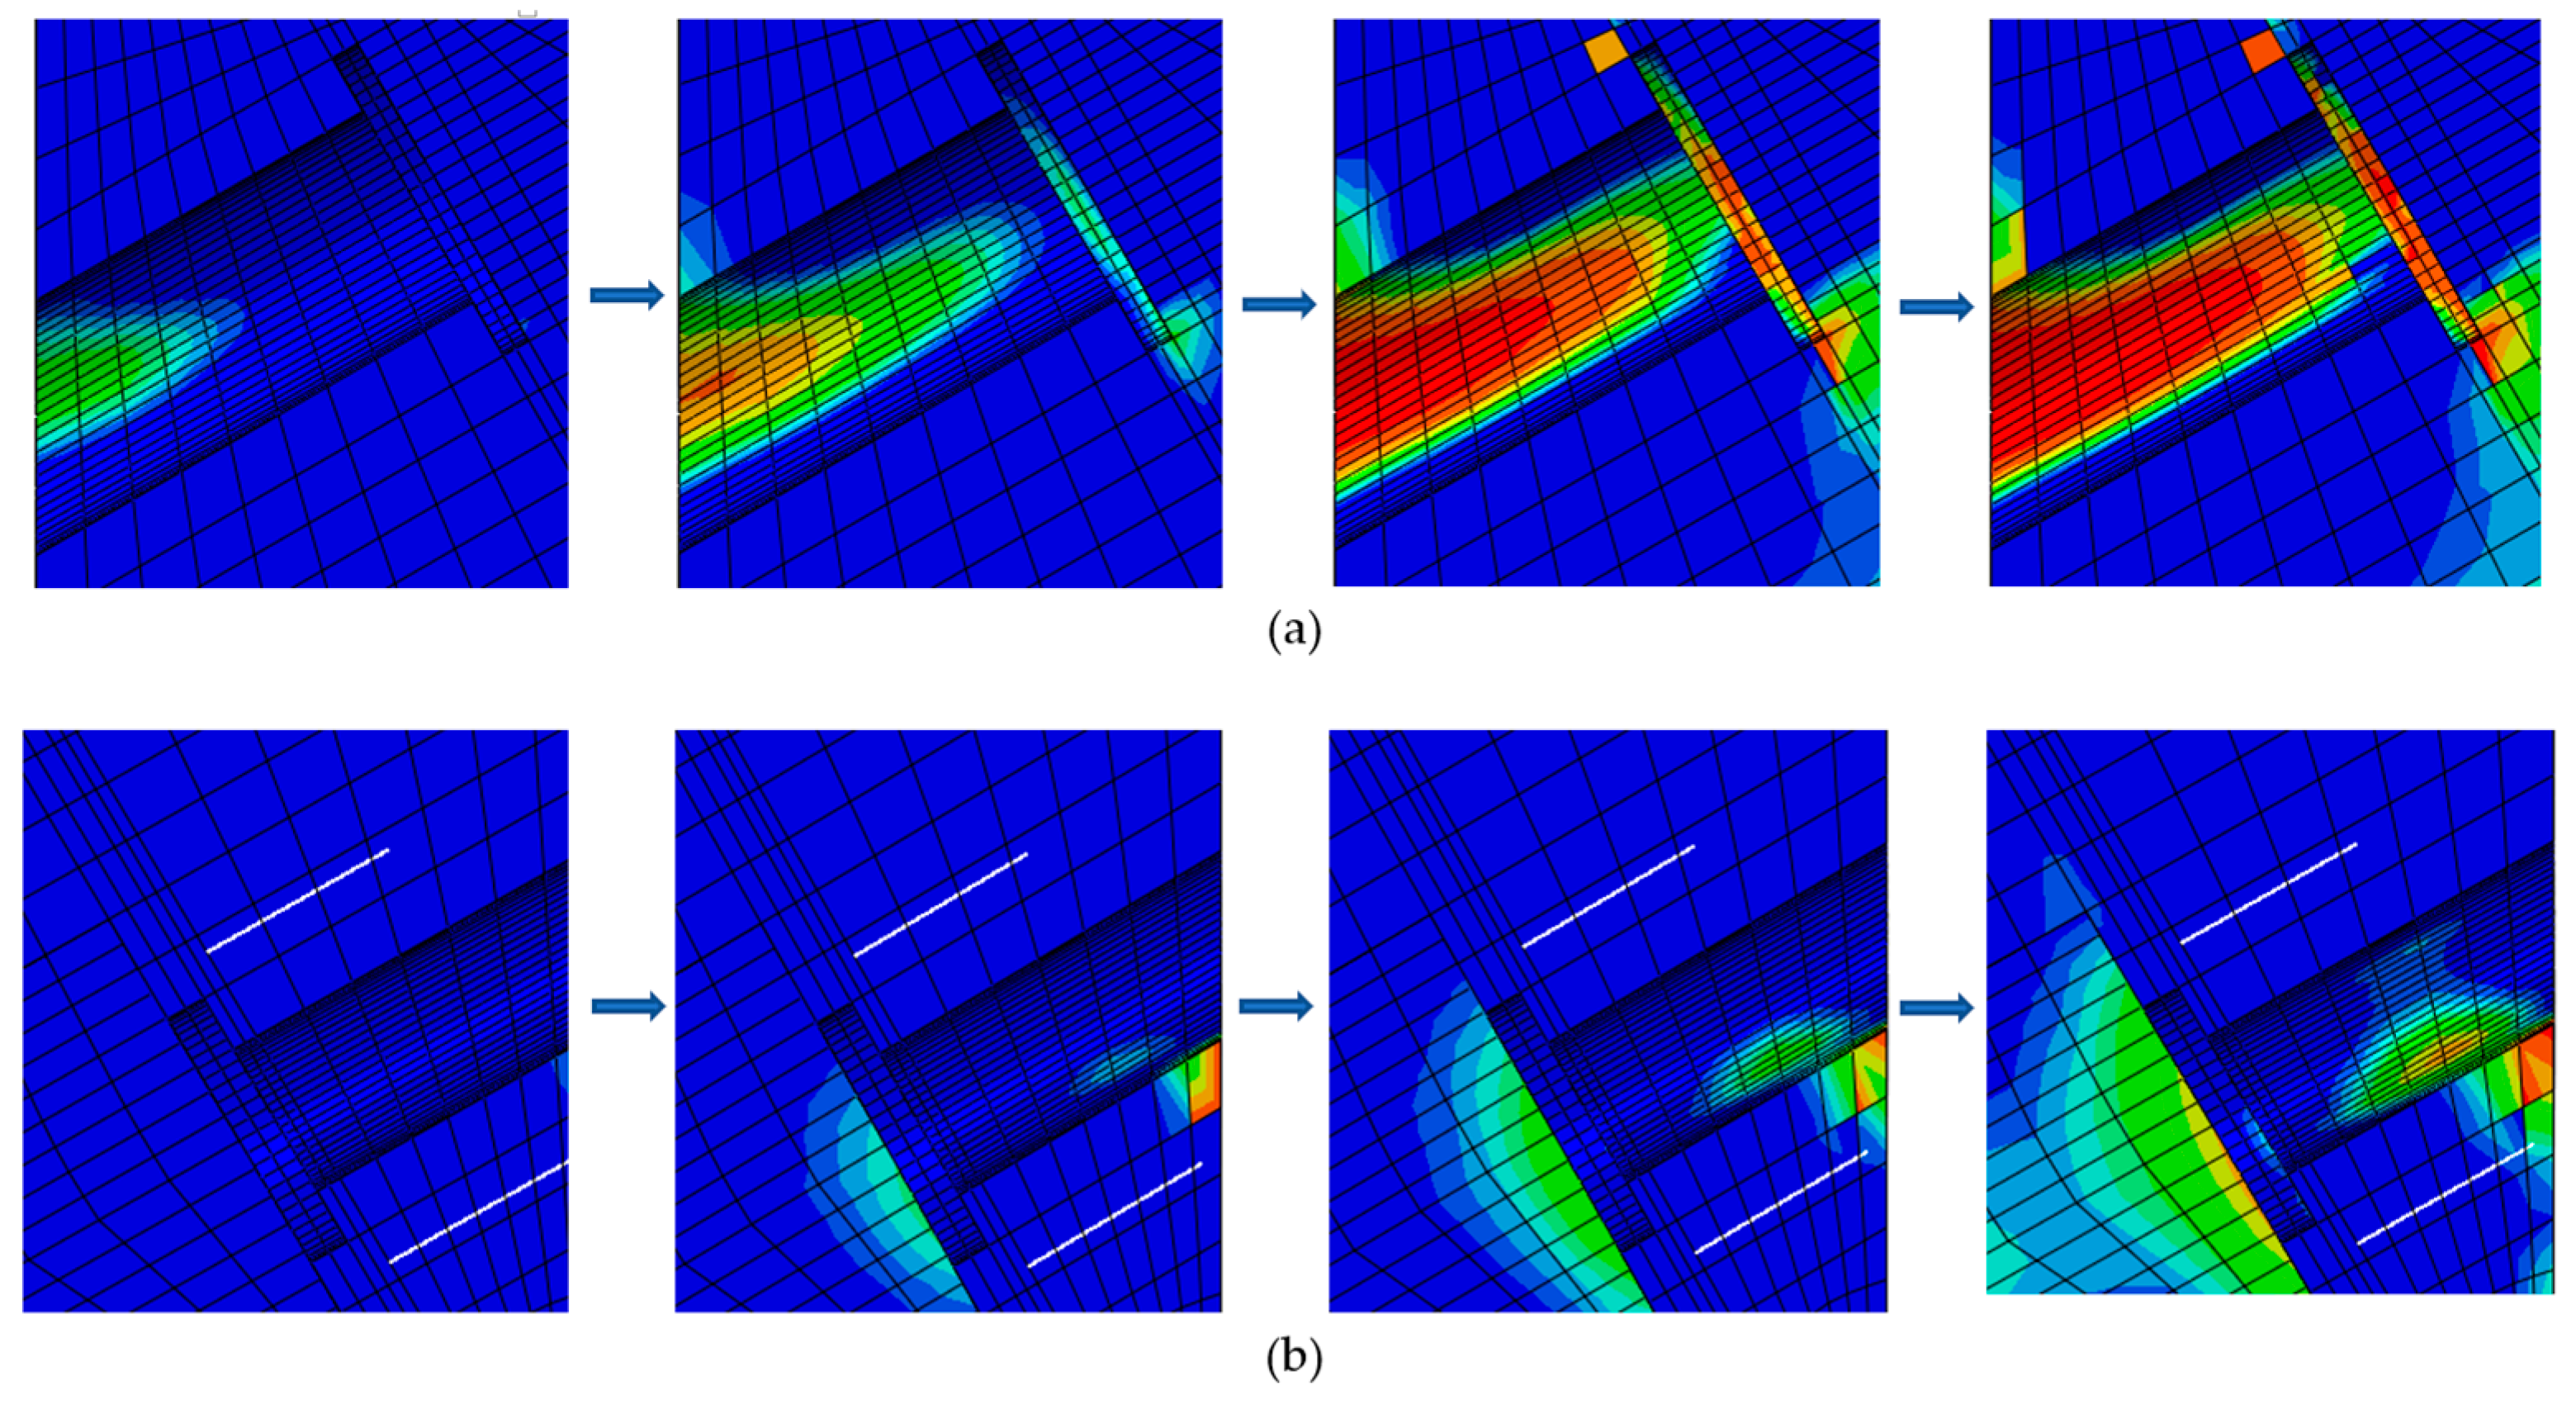
4.3.2. Stress of the Auto-Lock Connector

Through numerical simulation, the internal force changes of the auto-lock connector throughout the entire process can be intuitively observed. The connector is in a high-stress state under both positive and negative bending at N = 200 kN. Therefore, this condition can serve as an example for investigating the ultimate stress state and failure modes of the connectors.
(1)
Sleeve stress
Figure 10 shows the maximum principal stress and von Mises stress of the sleeve when the joint reaches its ultimate bearing capacity at N = 200 kN. The end of the sleeve is designed with an expanded base, which can be firmly fixed in the concrete segment without excessive anchorage length, and the external stress is evenly distributed. The lock tabs cause local pressure on the groove. High stress occurs where the sleeve presses against the concrete at the joint.
Figure 11 shows the variation in stress at points A, B, and C on the sleeve as the load increases. As the bending moment increases, the joint opens up, and the connector begins to participate in the work. The stresses at the three points all increase linearly with increasing load. As the bending moment continues to increase, owing to localized pressure, the stresses of A and C under positive bending and the stress of C under negative bending rapidly increase at the same rate until the joint fails. During positive bending, points A and C experience high stresses of 528 MPa and 505 MPa, respectively; during negative bending, the maximum stress of C reaches 465 MPa. However, both the stress of B under negative bending and the stresses of A and B under positive bending increase slowly throughout the loading process, remaining within 200 MPa. Throughout the entire process, none of the points on the sleeve reach their tensile strength; therefore, the sleeve cannot determine the bearing capacity of the auto-lock joint.
(2)
Pin rod stress
Owing to factors such as the opening, section weakening, localized pressure, and complex force distributions at the joints, the pin rod experiences extremely complex stress. Figure 12 shows the stress distribution on the surface of the pin rod under the limit state. Point D, located at the weakened area of the lock tab, reaches the highest stress. Point G is subjected to localized pressure at the end, resulting in relatively high stress. Points E and F experience both tensile stress along the pin rod direction and pressure due to compression by the concrete channel. However, aside from point E, which has significant tensile stress under negative bending, the stresses at points E and F are not substantial under other conditions.
The stress variation curves of points D, E, F, and G with increasing bending moment are shown in Figure 13. At the beginning of positive bending, the stress at each point increases linearly with the load, with points D and G experiencing a higher rate of increase than points E and F. When the bending moment reaches approximately 60 kN·m, point D yields, and a noticeable inflection point appears in the curves of points D and G. After that, the stress growth slows down, but as the connection approaches failure, the stress at points D and G rapidly increases, ultimately reaching maximum values of σDmax = 685 MPa and σGmax = 503 MPa. Throughout the process, the stresses at points E and F continue to increase at a constant rate. When the connector is damaged, σEmax and σFmax are 125.1 MPa and 49.4 MPa, respectively. When the joint is subjected to negative bending, the distribution and development of internal forces at points D, F, and G of the connector during the force process are similar to those of positive bending. At the limit state, σDmax, σFmax, and σGmax are 576 Mpa, 221 MPa and 482 MPa, respectively. However, point E behaves differently from when it is under negative bending moment. Its stress initially increases rapidly and linearly, then slows down after the bending moment reaches 475 kN·m, and ultimately reaches a maximum stress of σEmax = 490 MPa.
Through the simulation analysis of the critical areas of the auto-lock connector, such as the pin rod and sleeve, it was found that stress concentration is prone to occur at the opening of the pin rod. When point D reaches its ultimate strength, the other points have not yet reached their compressive strength. Consequently, the failure mode is that the pin rod is pulled apart at the openings. This area determines the bearing capacity of the auto-lock connector and has a significant effect on the flexural bearing ability of the segment joint.

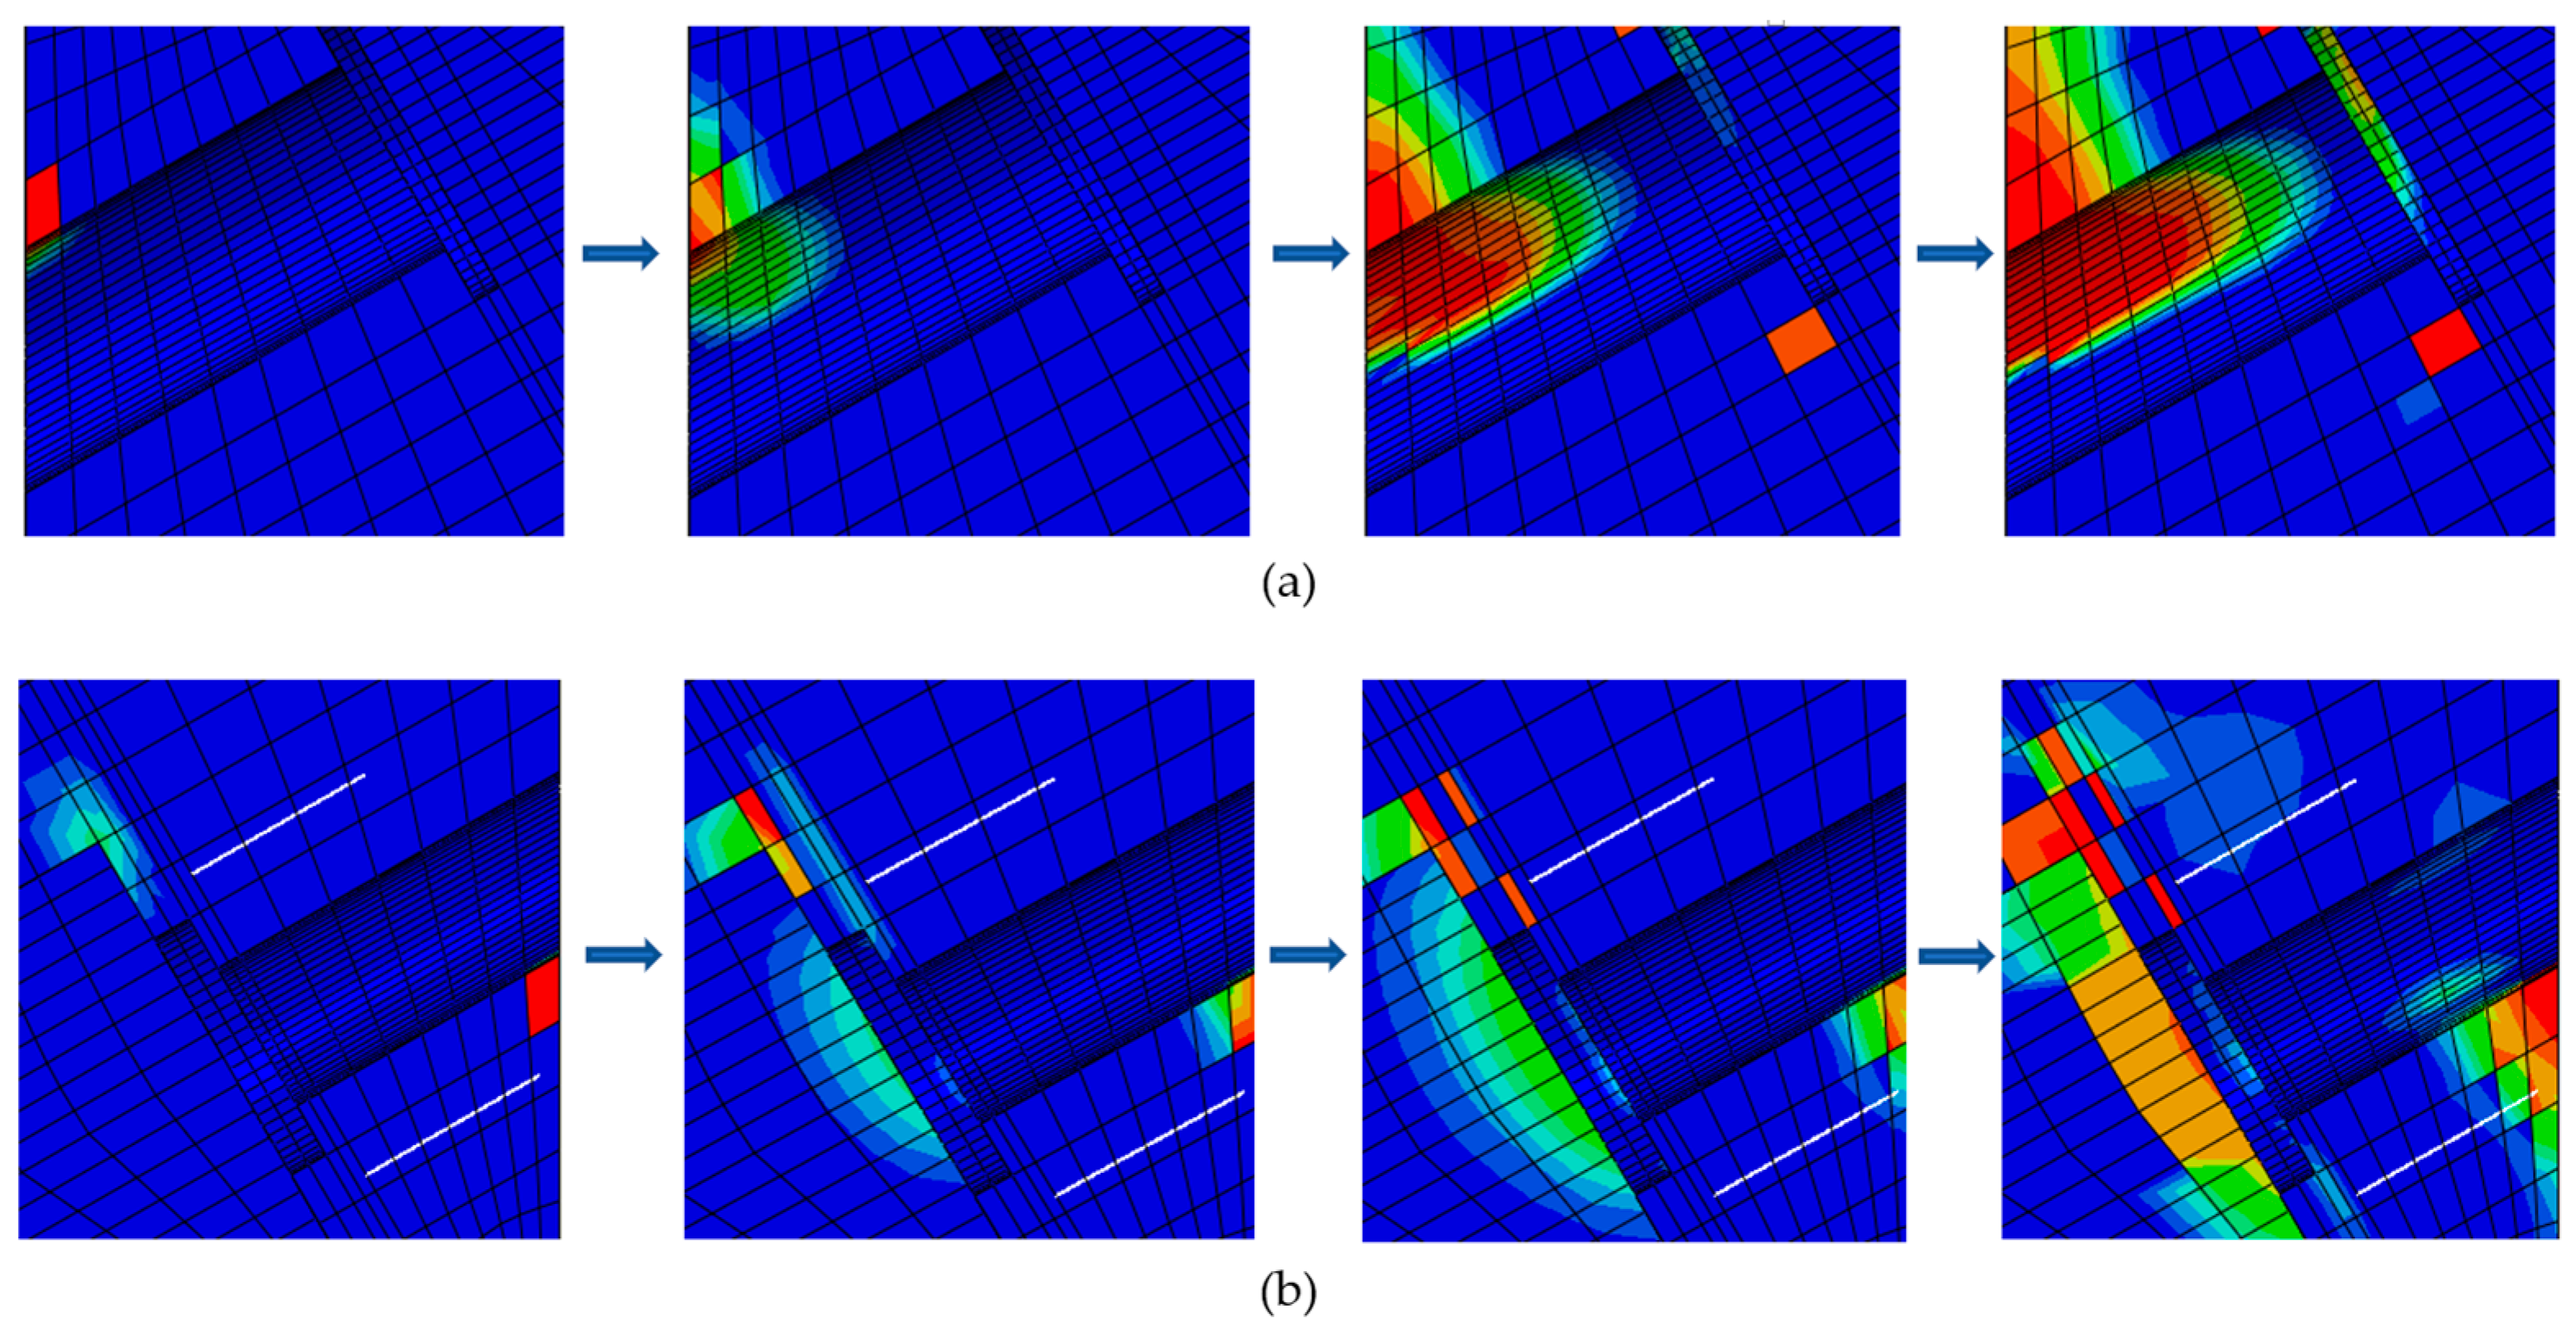
4.3.3. Damage Evolution of the Concrete Around the Auto-Lock Connector

Figure 14 illustrates the development of tensile damage in the concrete surrounding the auto-lock connector under positive bending. In the initial stage of loading, sporadic damage first occurred to the concrete holes above the sleeve and below the pin rod under the compression and pulling of the connector. As the load continued to increase, the damage to the concrete at these locations gradually expanded. The concrete around the ends of the sleeve and pin rod subsequently became damaged, which gradually spread until the connector broke. The damage to the concrete at the top of the sleeve and around the end of the pin rod was more severe than that in the other two areas.
Figure 15 shows the development of tensile damage to the concrete around the connector under negative bending. The concrete on both sides and the end of the sleeve was damaged successively, and with increasing load, these cracks expanded significantly until the joint fails. In contrast, there was no severe damage to the concrete around the pin rod.
Under both positive bending and negative bending, the concrete tensile damage area is distributed mainly at both ends of the auto-lock connector and around the holes that are squeezed by the connector. Before the connector breaks, only local damage occurs without penetrating failure. This indicates that connector detachment will not occur in the auto-lock joint, and this mode of failure can be considered safer. The expanded ends of the connector allow it to be firmly fixed in the concrete segment without excessive anchoring length, thereby achieving miniaturization of the connector.

5. Parameter Analysis

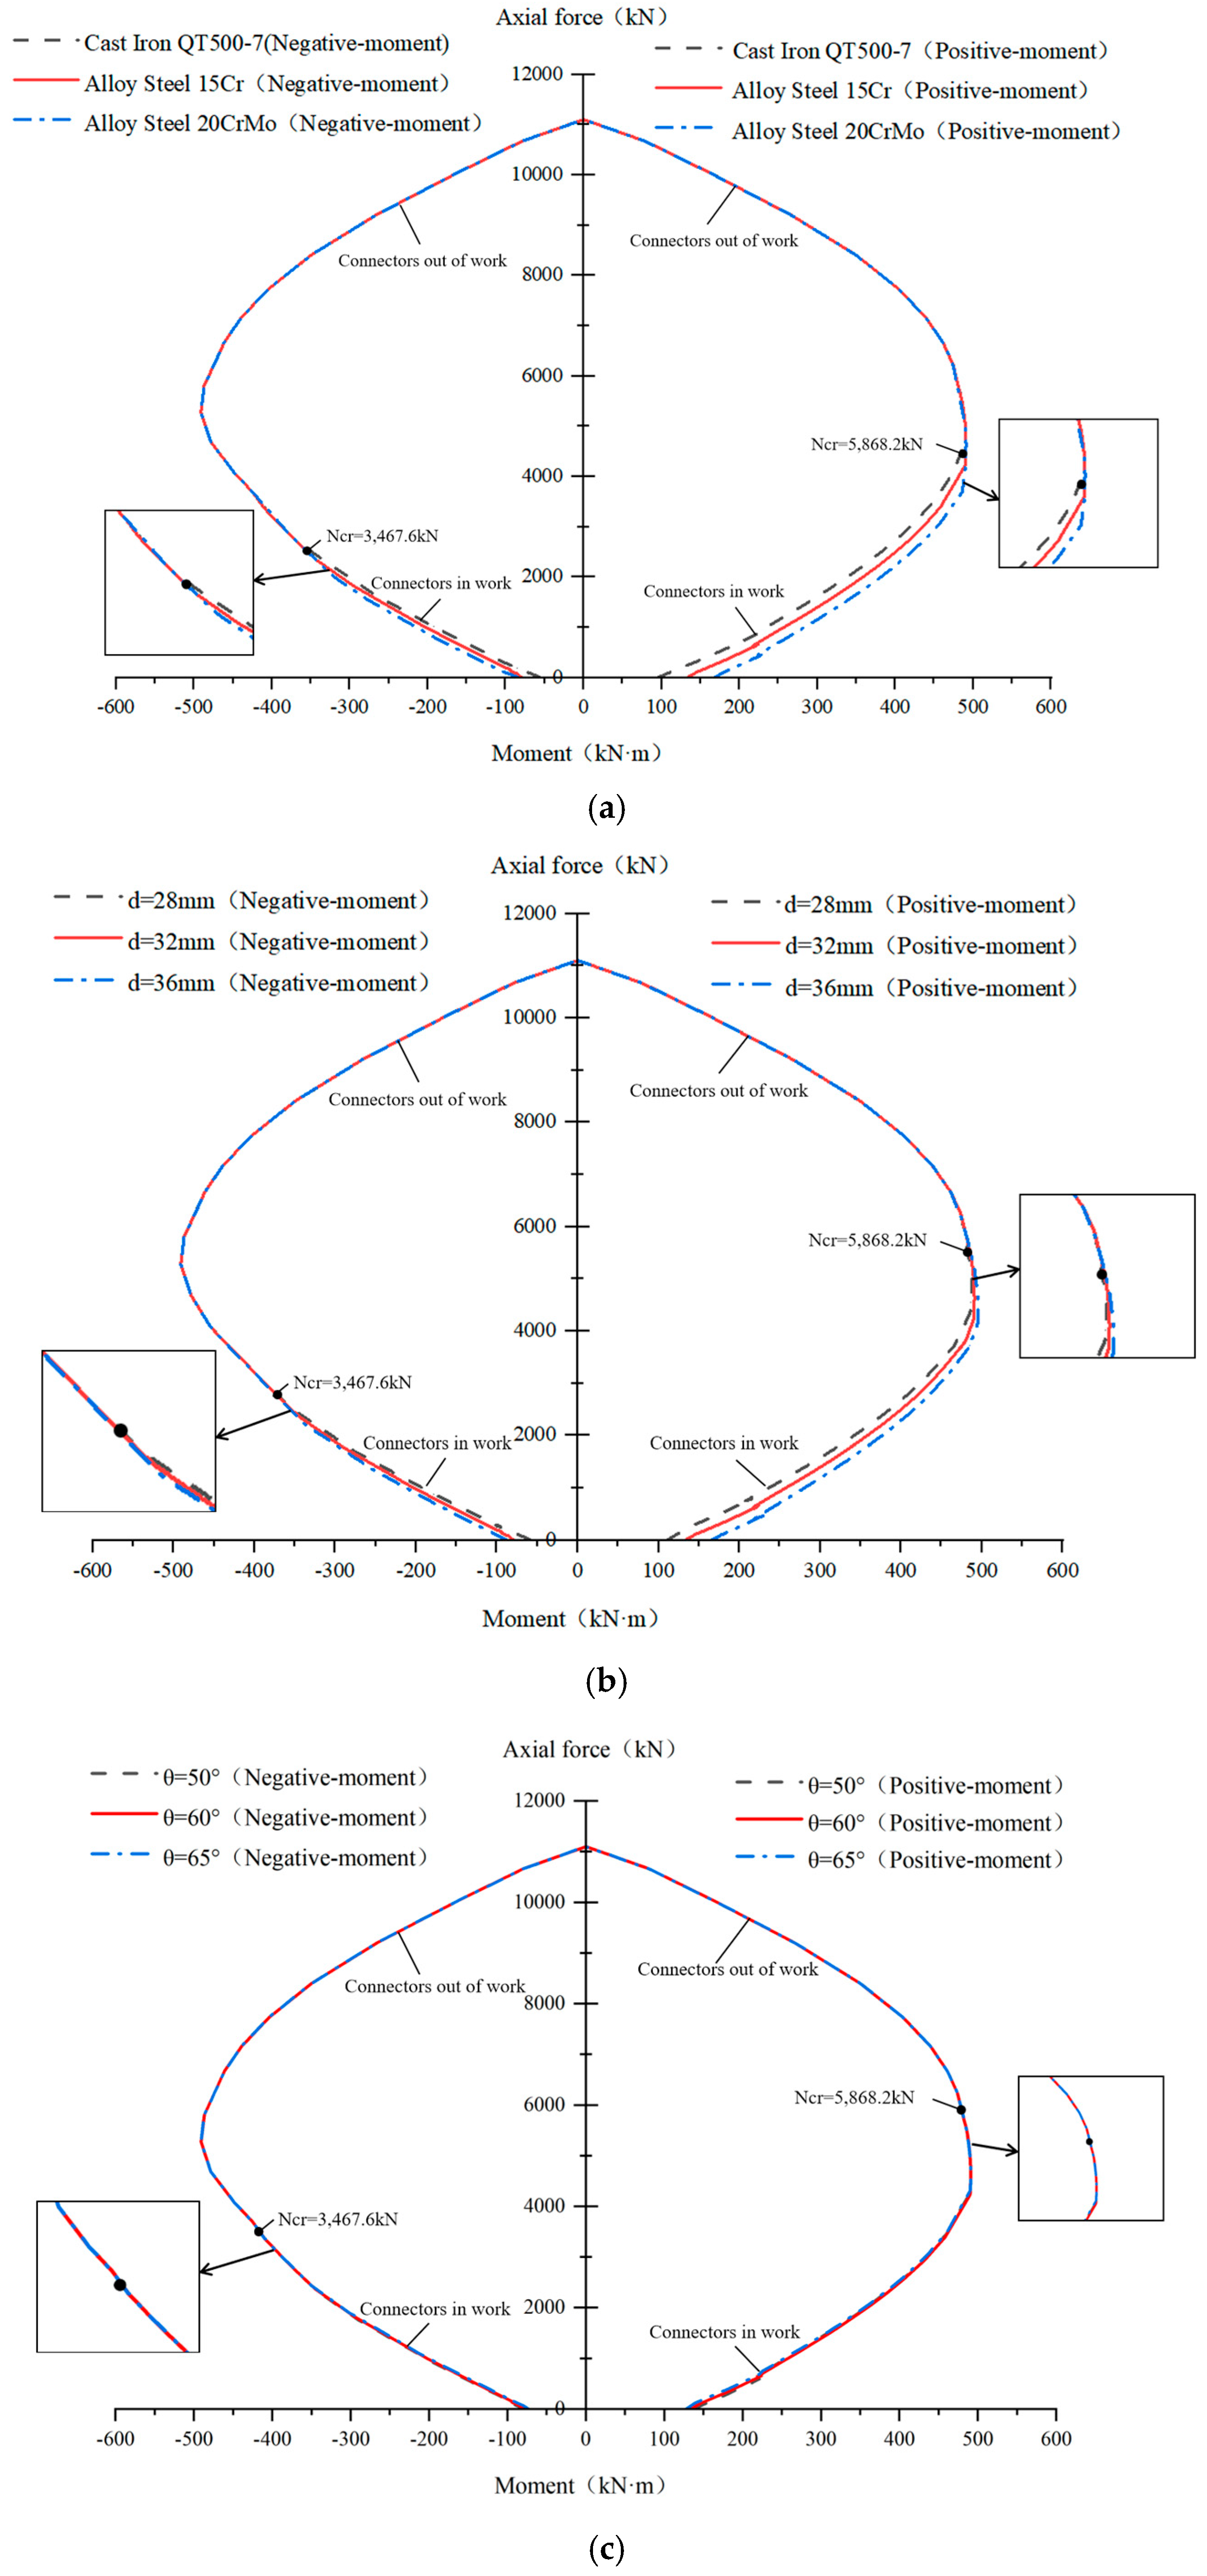
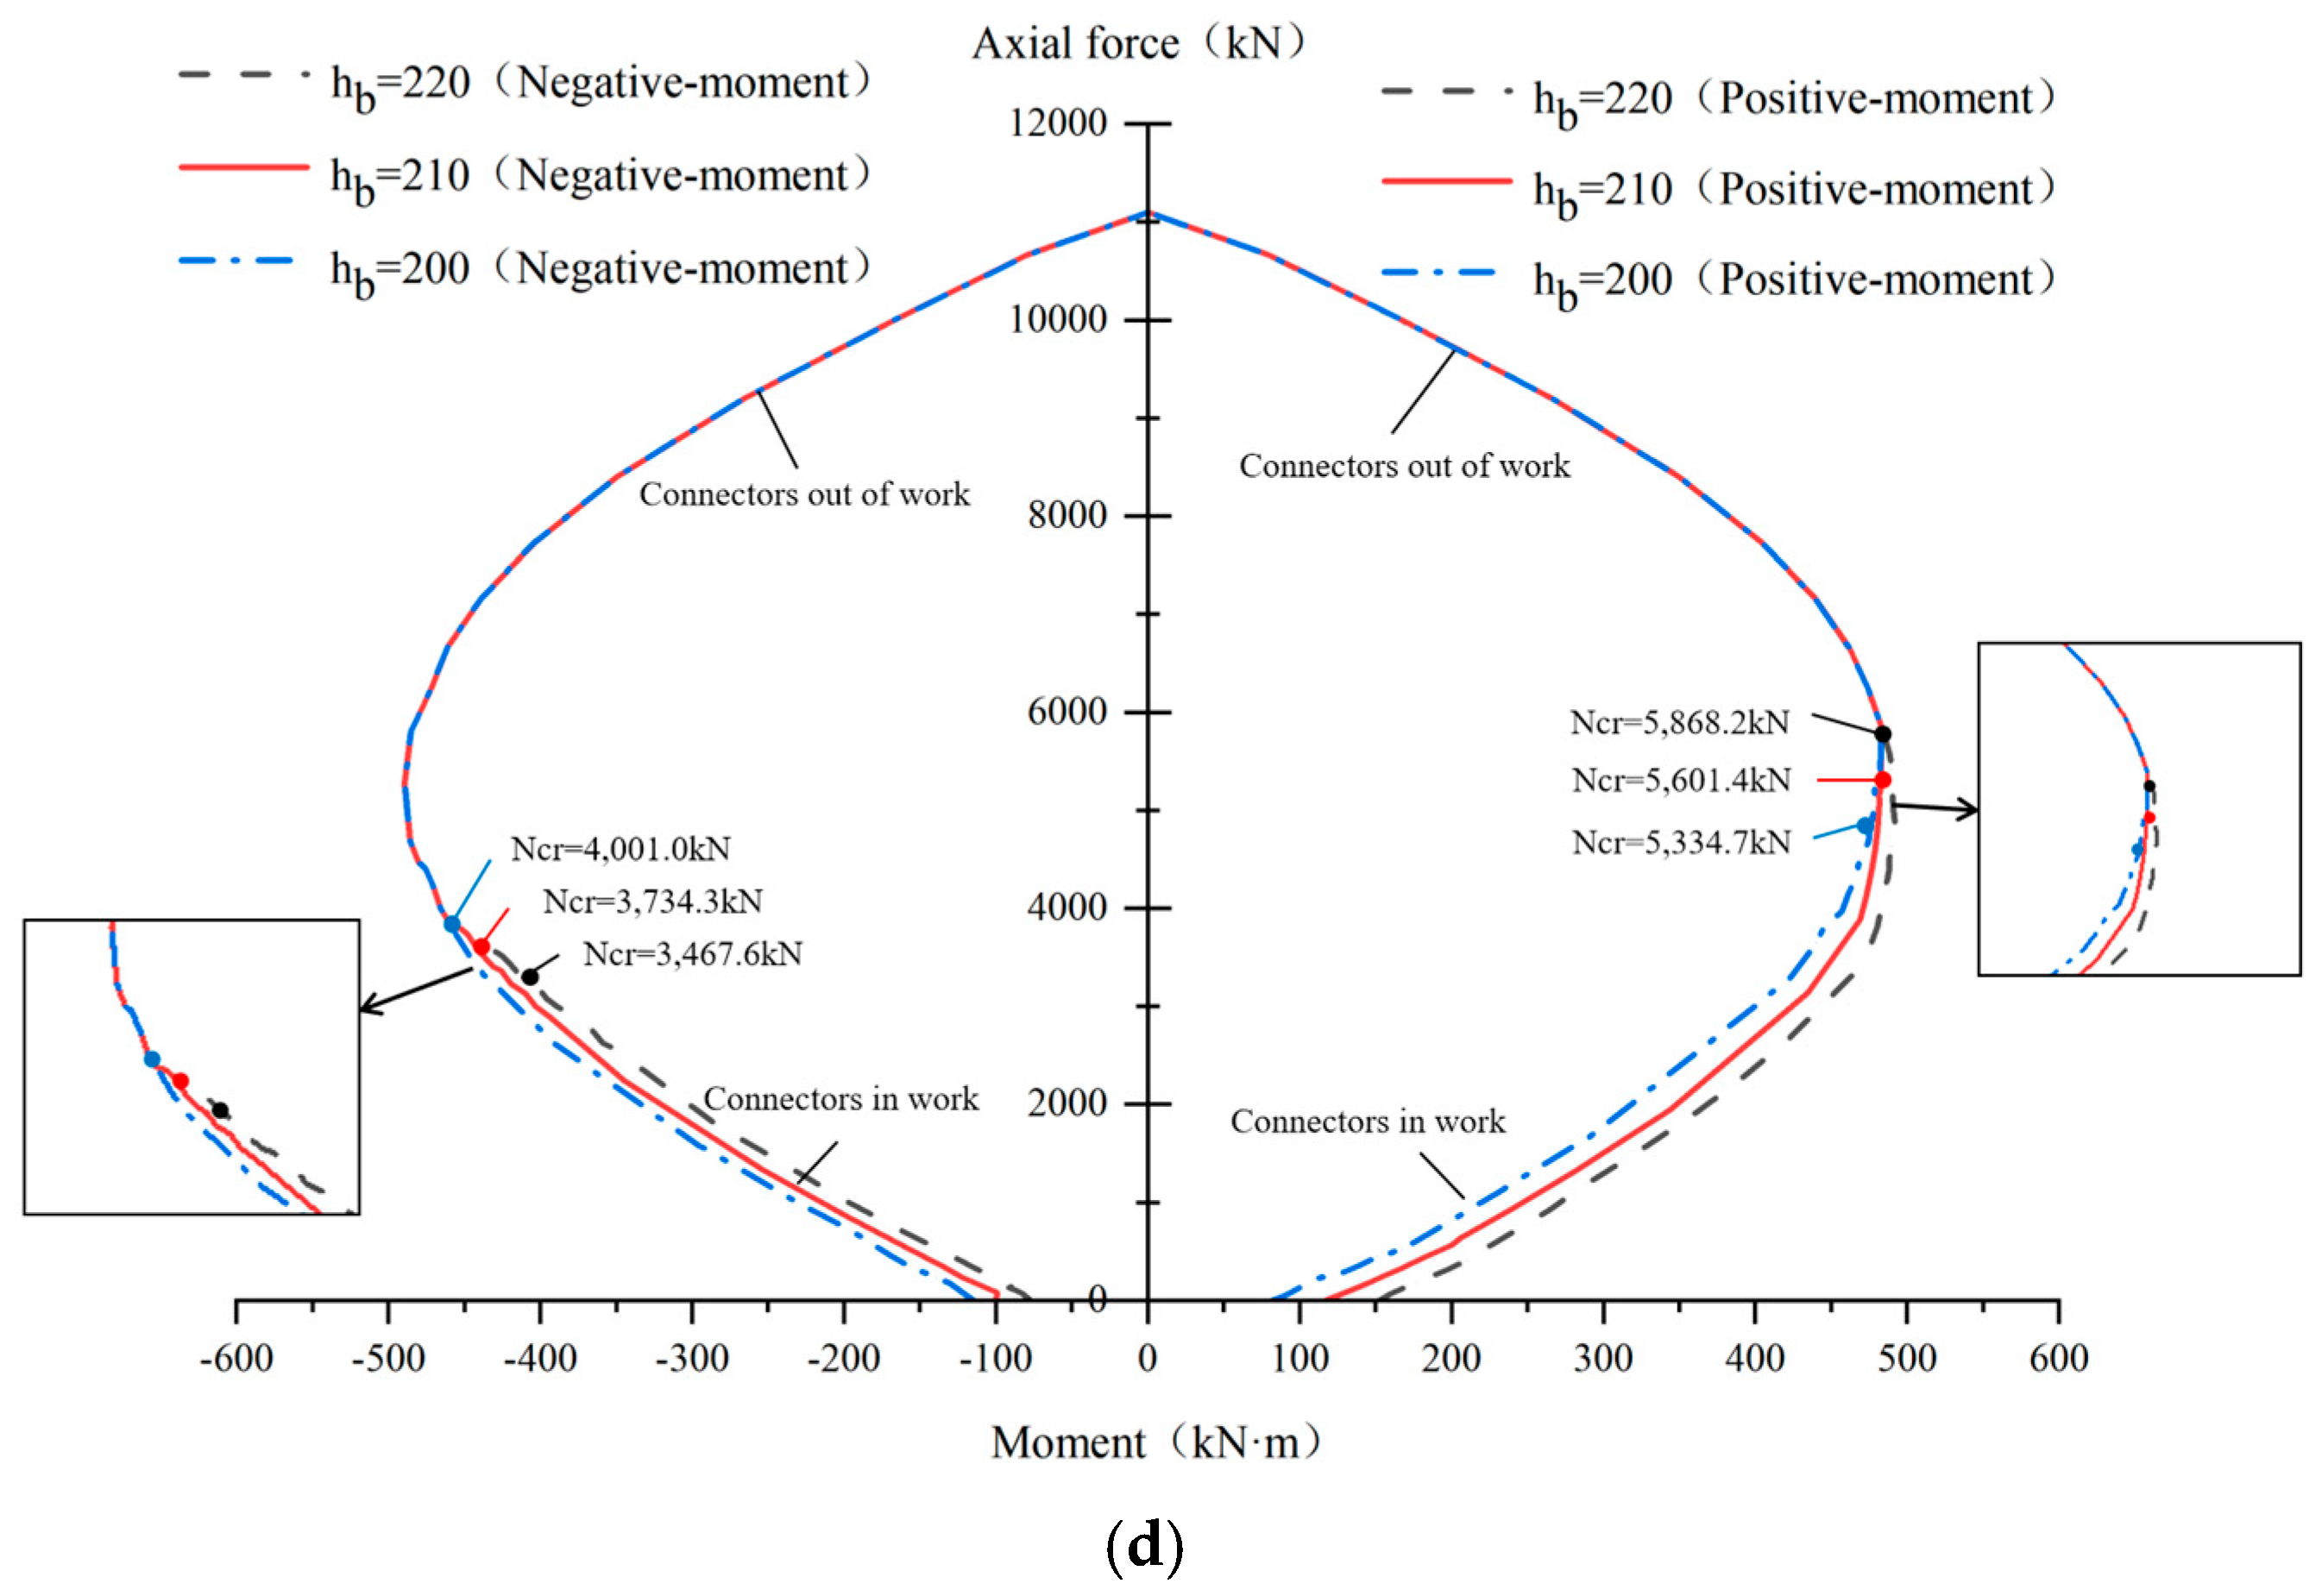
5.1. Influencing Factors

The above research shows that the bending capacity of auto-lock joints is related to factors such as axial compression, eccentricity, and the size, strength, and position of the connectors. To further explore the influence of factors related to auto-lock connectors on the flexural capacity of segmental joints, a parameter analysis was carried out based on the joint structure shown in Figure 7 to systematically study the variation law of the joint mechanical response. To align with practical engineering applications, the influencing factors and their parameter values are selected as shown in Table 3. Specifically, the connector materials chosen include cast iron QT500-7, alloy steel 15Cr, and alloy steel 20CrMo, with corresponding yield points of 320 MPa, 485 MPa, and 685 MPa, respectively; their tensile strengths are 500 MPa, 690 MPa, and 885 MPa, respectively [31].

5.2. Parametric Studies

According to the mechanical analysis formula proposed in Section 3.4, the bending moments and axial forces at joint failure can be obtained. For a more intuitive display and comparison, the calculation results for each parameter group are represented in the form of curves, as shown in Figure 16.
Figure 16 clearly shows that the joint bearing capacity curve can be divided into two segments based on whether the connector is functional: one where the connector participates in the work and another where it does not. When the joint axial force is zero, the joint only bears a bending moment and undergoes pure bending failure. With a small axial force, the joint exhibits significant opening deformation under a bending moment, and the auto-lock connector experiences considerable force, reaching the ultimate strength in local areas. As the axial pressure increases, joint failure manifests as concrete crushing on one side while the connector remains below its ultimate state. A further increase in the axial force gradually reduces the joint opening deformation, and the force on the connector at the time of joint failure decreases accordingly. Once the axial force reaches a certain threshold, the connector ceases to function and no longer bears any load. The joint’s ultimate bending moment continuously decreases as the axial force increases. Eventually, under a certain axial pressure, the joint’s bending moment drops to zero, and the concrete at the joint surface fails under pure compression.
Figure 16a,b show that when the axial force N ≥ 5868.2 kN (positive bending) or 3467.6 kN (negative bending), auto-lock connectors are in the compression zone and do not contribute to the joint’s bending capacity. Parameter changes do not affect the flexural bearing capacity curves of the auto-lock joint, causing these curves to overlap. When the axial force N < 5868.2 kN (positive bending) or 3467.6 kN (negative bending), the influence of the material strength and pin rod diameter on the joint’s bearing capacity gradually increases as the axial force decreases. That is, auto-lock connectors with high strength and thicker diameter can enhance the joint’s bending capacity under low axial force, and the smaller the axial force is, the greater the improvement.
The bending capacity curves corresponding to different inclination angles of the auto-lock connectors in Figure 16c show minimal variation. This finding indicates that the inclination angle of the connector has a limited effect on the bending capacity of the joint. The determination of the inclination angle should focus on the operability of installation and the convenience of construction.
Figure 16d shows the critical axial forces at which auto-lock connectors, positioned at distances of 220 mm, 200 mm, and 180 mm from the inner edge of the segment, participate in operation. Correspondingly, under positive bending, the critical axial forces are 5868.2 kN, 5601.4 kN, and 5334.7 kN, respectively; under negative bending, the Ncr are 3467.6 kN, 3734.3 kN, and 4001.0 kN, respectively. The farther connectors are from the compression side of the concrete, the earlier they participate in the joint opening process and the greater the critical axial force. When the axial force exceeds the critical axial force, the connector does not function, thus maintaining consistency with other loading conditions. When the axial force is less than the critical axial force, the bending capacity of the auto-lock joint increases as the distance from the inner edge grows during positive bending, while it decreases during negative bending under the same conditions. Therefore, the positive bending capacity and negative bending capacity of the same position connector are inversely proportional under a low axial force. Increasing the positive bending capacity means reducing the negative bending capacity. In engineering practice, the appropriate position of auto-lock connectors should be determined based on the internal force distribution of the entire ring.

6. Discussion

The research methods for rapid segment joints in shield tunneling have evolved into a comprehensive and multi-faceted approach, integrating theoretical analysis [32], numerical simulation [33,34,35], experimental studies [36,37,38], and data-driven techniques [39,40,41]. Theoretical analysis, based on principles of material mechanics and structural mechanics, establishes simplified mechanical models to evaluate stress–strain distribution, load-bearing capacity, and failure modes under axial, shear, and bending loads. Numerical simulations using finite element software like ABAQUS provide detailed insights into the mechanical behavior of joints under real-world conditions, optimizing geometric and material parameters. Experimental studies, including prototype and model tests, validate key performance metrics such as ultimate load capacity, deformation characteristics, and fatigue resistance, offering empirical support for theoretical models. Monitoring and measurement techniques, employing sensors, strain gauges, and displacement meters, enable real-time data collection on stress, strain, and displacement during construction and operation, ensuring the reliability and safety of joints in practical applications. In shield tunnel construction, data-driven technology addresses critical challenges in auto-locking connector installation by integrating intelligent recognition and adaptive control mechanisms. Deep learning-powered vision systems achieve millimeter-level precision in detecting segment joints and connector positions, while high-sensitivity force feedback sensors combined with real-time optimization algorithms enable robotic arms to dynamically adapt to installation deviations, ensuring stable and accurate connector insertion. This approach, validated through simulations and pilot projects, is expected to enhance installation efficiency by 30%, minimize human intervention, and reduce quality risks associated with labor-intensive operations. Additionally, data-driven methods are transforming shield tunnel design and construction by integrating theory, experimentation, and real-time monitoring to optimize designs and construction parameters. Future research will focus on refining theoretical models through in-depth experiments, improving numerical algorithms via advanced machinery development, and integrating monitoring technologies into equipment to achieve fully mechanized shield tunnel construction.

7. Conclusions

This work elucidates the structure and working principle of the newly developed auto-lock connectors and analyzes the flexural behavior of longitudinal joints. According to the theoretical derivation and numerical simulation, the following conclusions were drawn.
(1)
Analytical solutions for auto-lock joint bending capacity show close agreement with numerical simulations.
(2)
Horizontal axial force restricts joint opening and enhances positive bending resistance. The ultimate bending moment varies nonlinearly with axial force due to the differing working states of auto-lock connectors and concrete material properties.
(3)
The failure of the auto-lock connectors occur due to tearing at the weakened hole-opening position of the pin rod, rather than overall pull-out from the segment.
(4)
Enhancing the material strength and diameter of connectors improves their bending capacity, with greater improvements under lower axial loads. Connector inclination and positioning largely depend on installation requirements and the internal forces of tunnel rings.
(5)
The paper enriches the theoretical understanding of auto-lock joint mechanics and promotes the data-driven, fully mechanized construction of shield tunnels.

Author Contributions

Conceptualization, L.L. and H.H.; data curation, L.L.; formal analysis, L.L. and H.H.; funding acquisition, L.L.; investigation, W.L. and H.L.; methodology, L.L.; project administration, G.L.; resources, G.L.; software, W.L.; supervision, L.L.; validation, L.L.; visualization, L.L.; writing—original draft, L.L.; writing—review and editing, L.L. and H.H. All authors have read and agreed to the published version of the manuscript.

Funding

This study was funded by the Characteristic Innovation Project for Colleges and Universities in Guangdong Province (2020KTSCX288); the Innovation Team Project for Colleges and Universities in Guangdong Province (2022KCXTD052); 2023 Guangzhou Higher Education Teaching Quality and Teaching Reform Project—Rail Transit Intelligent Construction and Safety Operation and Maintenance Industry Education Integration Training Base (No. 2023CJRHJD004).

Data Availability Statement

If needed, you can ask the corresponding author for it, unconditionally.

Conflicts of Interest

Author Gang Lei was employed by the company Beijing Urban Construction Design & Development Group Co., Ltd. The remaining authors declare that the research was conducted in the absence of any commercial or financial relationships that could be construed as a potential conflict of interest.

References

  1. Wen, H.; Tang, B.; Xu, Z.Z.; Zhang, K.J.; Zeng, Y.W. The sensitivity analysis of beam-spring model for shield tunnel segment. Appl. Mech. Mater. 2013, 256, 1263–1269. [Google Scholar] [CrossRef]
  2. Liu, X.; Dong, Z.; Song, W.; Bai, Y. Investigation of the structural effect induced by stagger joints in segmental tunnel linings: Direct insight from mechanical behaviors of longitudinal and circumferential joints. Tunn. Undergr. Space Technol. 2018, 71, 271–291. [Google Scholar] [CrossRef]
  3. Li, H.; Li, X.; Yang, Y.; Liu, Y.; Ma, M. Structural stress characteristics and joint deformation of shield tunnels crossing active faults. Appl. Sci. 2022, 12, 3229. [Google Scholar] [CrossRef]
  4. Zhang, R.D.; Xue, Y.D.; Liao, L. Simulation and analysis on the mechanical properties of a new slide-in Joint for shield tunnel segment. IOP Conf. Ser. Earth Environ. Sci. 2020, 570, 022061. [Google Scholar]
  5. Zhang, S.L. Research on the Mechanical Properties and Type Selection of Prefabricated Lining Joints in Railway Tunnels. Ph.D. Thesis, China Academy of Railway Sciences, Beijing, China, 2020. [Google Scholar]
  6. Guan, L.X.; Sun, W.; Zhang, M.X.; Fang, T.; Zhang, J. Mechanical performance and experimental research on circumferential fast connector of shield tunnel. Tunn. Constr. 2022, 42, 967. [Google Scholar]
  7. Bi, X.; Liu, X.; Li, W.; Cao, W.; Wang, X.; Chen, B. Research on the application of new connecting segment technology in metro shield tunnel. Urban Mass Transit 2020, 23, 1–11. [Google Scholar]
  8. Liu, S.J.; Feng, K.; He, C.; He, Z.S. Study on the bending mechanical model of segmental joint in shield tunnel with large cross-section. Eng. Mech. 2015, 32, 215–221. [Google Scholar]
  9. Zhang, W.; De Corte, W.; Liu, X.; Taerwe, L. Optimization study on longitudinal joints in quasi-rectangular shield tunnels. Appl. Sci. 2021, 11, 573. [Google Scholar] [CrossRef]
  10. Liu, X.; Bai, Y.; Yuan, Y.; Mang, H.A. Experimental investigation of the ultimate bearing capacity of continuously jointed segmental tunnel linings. Struct. Infrastruct. Eng. 2016, 12, 1364–1379. [Google Scholar] [CrossRef]
  11. Liu, X.; Zhang, C.; Zhang, C.G.; Yuan, Y. Ultimate load-carrying capacity of the longitudinal joints in segmental tunnel linings. Struct. Concr. 2017, 18, 693–709. [Google Scholar] [CrossRef]
  12. Ding, W.Q.; Chen, X.Q.; Jin, Y.L.; Qiao, Y.F. Flexural behavior of segmental joint containing double rows of bolts: Experiment and simulation. Tunn. Undergr. Space Technol. 2021, 112, 103940. [Google Scholar] [CrossRef]
  13. Xiao, M.Q.; Feng, K.; Zhang, L.; He, C. A calculation model of flexural bearing capacity of segmental joint for shield tunnels. China Civ. Eng. J. 2019, 52, 108–119. [Google Scholar]
  14. Zuo, L.; Li, G.; Feng, K.; Ma, X.; Zhang, L.; Qiu, Y.; Cao, S.; Feng, L. Experimental analysis of mechanical behavior of segmental joint for gas pipeline shield tunnel under unfavorable compression-bending loads. Tunn. Undergr. Space Technol. 2018, 77, 227–236. [Google Scholar] [CrossRef]
  15. Guo, W.; Feng, K.; Zhou, Y.; Lu, X.; Qi, M.; He, C.; Xiao, M. Experimental and numerical investigation on the shear behavior and damage mechanism of segmental joint under compression-shear load. Tunn. Undergr. Space Technol. 2023, 139, 105238. [Google Scholar] [CrossRef]
  16. Zhou, Z.; Feng, K.; Liu, Y.; Wu, B.; Lu, C.; Lin, G.; He, C. Experimental study on the compression-shear performance of a new-type circumferential joint of shield tunnel. Undergr. Space 2024, 14, 138–155. [Google Scholar] [CrossRef]
  17. Lei, M.; Lin, D.; Shi, C.; Ma, J.; Yang, W.; Sun, J. A structural calculation model of shield tunnel segment: Heterogeneous equivalent beam model. Adv. Civ. Eng. 2018, 2018, 9637838. [Google Scholar] [CrossRef]
  18. ACI 318; Building Code Requirements for Structural Concrete and Commentary. American Concrete Institute: Farmington Hills, MI, USA, 2011.
  19. NZS 3101; Concrete Structures Standard—Part 1—The Design of Concrete Structures. Standards New Zealand: Wellington, New Zealand, 2006.
  20. Zhang, L.; Feng, K.; Li, M.; Sun, Y.; He, C.; Xiao, M. Analytical method regarding compression-bending capacity of segmental joints: Theoretical model and verification. Tunn. Undergr. Space Technol. 2019, 93, 103083. [Google Scholar] [CrossRef]
  21. Wang, Y.C.; Xu, H.; Lei, Y.T.; Zhou, X.; Hao, Y. Research on the deformation and failure law of prefabricated invert joints in highway tunnels. China J. Highw. Transp. 2024, 37, 58–69. [Google Scholar] [CrossRef]
  22. Xu, J.; Gao, M.; Wang, Y.; Yu, Z.; Zhao, J.; DeJong, M.J. Numerical investigation of the effects of separated footings on tunnel-soil-structure interaction. J. Geotech. Geoenviron. Eng. 2025, 151, 04025057. [Google Scholar] [CrossRef]
  23. Xu, J.; Zheng, L.; Song, G.; Zhang, D.; Sheil, B.; Marshall, A.M. Effects of embedded walls on tunnelling-induced sandy ground displacements: A numerical investigation. Géotechnique 2025, 75, 472–485. [Google Scholar] [CrossRef]
  24. Liu, Y.; Huang, H.W.; Zhang, D.M. Influence of segment design of shield tunnel on the magnitude of joint opening. Adv. Mater. Res. 2011, 160, 698–703. [Google Scholar] [CrossRef]
  25. Zhong, X.; Zhu, W.; Huang, Z.; Han, Y. Effect of joint structure on joint stiffness for shield tunnel lining. Tunn. Undergr. Space Technol. 2006, 21, 406–407. [Google Scholar]
  26. Feng, K.; He, C.; Xiao, M.Q. Bending resistance tests on segments Joints with complex joint surfaces of shield tunnels under high Axial compression. China Civ. Eng. J. 2016, 49, 99–110. [Google Scholar]
  27. Su, H.; Deng, T.; Yang, Z.; Qin, J.; Zheng, L. Characterization of shear damage and channel reinforcement of circumferential joints between shield tunneling segments based on numerical simulation. Buildings 2024, 14, 540. [Google Scholar] [CrossRef]
  28. Lu, C.; Liu, C.; Zhang, X. Segment thickness design and bearing performance analysis of large inner-diameter shield tunnel under lateral unloading. Appl. Sci. 2023, 13, 11871. [Google Scholar] [CrossRef]
  29. Wei, L.; Yang, C.; Chen, W.; Liu, L.; Su, D. Numerical analysis of ground surcharge effects on deformation characteristics in shield tunnel linings. Appl. Sci. 2024, 14, 2328. [Google Scholar] [CrossRef]
  30. GB50010; Code for Design of Concrete Structures. China Architecture and Building Press: Beijing, China, 2010. (In Chinese)
  31. GB/T 3077; Alloy Structure Steels. National Standardization Administration: Beijing, China, 2015. (In Chinese)
  32. Liang, K.; Feng, K.; Zhang, L.; He, C.; Su, A.; Guo, W. Failure mechanism of underwater shield tunnel: An experimental and theoretical study. Tunn. Undergr. Space Technol. 2023, 137, 105155. [Google Scholar] [CrossRef]
  33. Hu, X.; Hu, H.; Xie, N.; Huang, Y.; Guo, P.; Gong, X. The effect of grain size heterogeneity on mechanical and microcracking behavior of pre-heated Lac du Bonnet granite using a grain-based model. Rock Mech. Rock Eng. 2023, 56, 5923–5954. [Google Scholar] [CrossRef]
  34. Hu, X.; Guo, P.; Xie, N.; Hu, H.; Lei, G.; Ma, J.; Gong, X. Creep behavior and associated acoustic characteristics of heterogeneous granite containing a single pre-existing flaw using a grain-based parallel-bonded stress corrosion model. Rock Mech. Rock Eng. 2023, 56, 4799–4832. [Google Scholar] [CrossRef]
  35. Li, R.; Yin, Z.-Y.; He, S.-H. 3D reconstruction of arbitrary granular media utilizing vision foundation model. Appl. Soft Comput. 2025, 169, 112599. [Google Scholar] [CrossRef]
  36. He, S.H.; Yin, Z.Y.; Ding, Z.; Li, R.D. Particle morphology and principal stress direction dependent strength anisotropy through torsional shear testing. Can. Geotech. J. 2024, 62. [Google Scholar] [CrossRef]
  37. He, S.H.; Yin, Z.Y.; Ibraim, E.; Ding, Z. Face mask chips-reinforced sands under monotonic and cyclic torsional shearing. Géotechnique 2025, 20, 167–183. [Google Scholar] [CrossRef]
  38. He, S.H.; Yin, Z.Y.; Ding, Z.; Sun, Y. The role of incremental stress ratio in mechanical behavior and particle breakage of calcareous sand. Acta Geotech. 2025, 20, 167–183. [Google Scholar] [CrossRef]
  39. Hu, X.; Shentu, J.; Xie, N.; Huang, Y.; Lei, G.; Hu, H.; Guo, P.; Gong, X. Predicting triaxial compressive strength of high-temperature treated rock using machine learning techniques. J. Rock Mech. Geotech. Eng. 2023, 15, 2072–2082. [Google Scholar] [CrossRef]
  40. Hu, H.; Hu, X.; Gong, X. Predicting the strut forces of the steel supporting structure of deep excavation considering various factors by machine learning methods. Undergr. Space 2024, 18, 114–129. [Google Scholar] [CrossRef]
  41. He, S.H.; Yin, Z.Y.; Sun, Y.; Ding, Z. Intelligent Parameter Identification for a High-Cycle Accumulation Model of Sand With Enhancement of Cuckoo Search Algorithm. Int. J. Numer. Anal. Methods Geomech. 2024, 48, 4410–4427. [Google Scholar] [CrossRef]
Figure 1. Structure of the auto-lock connector.
Buildings 15 02182 g001
Figure 2. Installation process of the auto-lock connector. (a) Step I: The segments are assembled in place. (b) Step II: The robotic arm pushes the preset pin rad into the sleeve. (c) Step III: After the pin is fully inserted, the lock tabs are pushed outwards into the chamber under the action of springs and embedded in the sleeve.
Buildings 15 02182 g002
Figure 3. Compressive stress–strain curves of the concrete.
Buildings 15 02182 g003
Figure 4. Stress–strain curves for steel.
Buildings 15 02182 g004
Figure 5. Schematic diagram of the forces on the auto-lock connector.
Buildings 15 02182 g005
Figure 6. Mechanical model for calculation: (a) mechanical distribution of the joint; (b) deformation of the joint.
Buildings 15 02182 g006
Figure 7. Schematic diagram of the two-ring compression–bending model (unit: mm).
Buildings 15 02182 g007
Figure 8. Refined finite element model.
Buildings 15 02182 g008
Figure 9. Joint opening curves as a function of the bending moment.
Buildings 15 02182 g009
Figure 10. Stress cloud diagrams of the sleeve at N = 200 kN: (a) positive moment; (b) negative moment.
Buildings 15 02182 g010
Figure 11. Stress–moment curve of the sleeve at N = 200 kN.
Buildings 15 02182 g011
Figure 12. Stress cloud diagrams of the pin rod: (a) positive bending; (b) negative bending.
Buildings 15 02182 g012aBuildings 15 02182 g012b
Figure 13. Stress–moment curve of the pin rod at N = 200 kN.
Buildings 15 02182 g013
Figure 14. Damage evolution diagram of the concrete under positive bending: (a) around the sleeve; (b) around the pin rod.
Buildings 15 02182 g014
Figure 15. Damage evolution diagram of the concrete under negative bending: (a) around the sleeve; (b) around the pin rod.
Buildings 15 02182 g015
Figure 16. Flexural bearing capacity curves of auto-lock joints: (a) different material strengths; (b) different pin rod diameters; (c) different inclination angles; (d) different distances from the outer segment side.
Buildings 15 02182 g016aBuildings 15 02182 g016b
Table 1. Concrete parameters in the CDP model.
ParametersValuesParametersValues
Mass density ρ (kg/m3)2500Invariant stress ratio Kc0.6667
Young’s modulus Ec (MPa)35,100Viscosity parameter μ 0.0005
Compressive strength σcf (MPa)23.1Dilation angle ψ   (°)30
Tensile strength σtf (MPa)2.64 f b 0 / f c 0 1.16
Poisson’s ratio ν 0.167 e 0.1
Table 2. Failure modes and bearing capacity of auto-lock joints for different loading schemes.
Loading SchemesFailure Modes
(See Section 4.1)
Ultimate Bearing CapacityDeviation
(Mu-NSS–M’u-TAS)/M’u
CaseN/kNΔDmax/mmNu/kNMu-NSS/kN·mM’u-TAS/kN·m
Positive-moment100−20(2)93.5776.0078.90−3.67%
200−20(2)198.1786.4090.47−4.50%
300−15(3)294.2797.45103.13−5.51%
400−10(3)402.51108.45115.20−5.86%
500−10(3)494.34119.89125.57−4.52%
Negative-moment10020(3)95.49−54.14−51.604.93%
20020(3)192.17−62.01−61.301.15%
30015(3)298.77−73.73−76.56−3.70%
40010(3)399.76−88.01−89.45−1.60%
50010(3)494.25−99.44−101.38−1.91%
Table 3. Influencing factors and their parameter values.
Influencing FactorParameter Value
Material strength fu500 MPa, 690 MPa, 885 Mpa
Pin rod’s diameter d28 mm, 32 mm, 36 mm
Inclination angle α65°, 60°, 55°
Distance from outer segment side hb220 mm, 210 mm, 200 mm
Disclaimer/Publisher’s Note: The statements, opinions and data contained in all publications are solely those of the individual author(s) and contributor(s) and not of MDPI and/or the editor(s). MDPI and/or the editor(s) disclaim responsibility for any injury to people or property resulting from any ideas, methods, instructions or products referred to in the content.

