Optimizing Public Space Quality in High-Density Old Districts of Asian Megacities: Thermal Environment Analysis of Shenzhen’s Urban Fringe


Abstract
1. Introduction
2. Wind Environment Characteristics of Urban Villages in Shenzhen
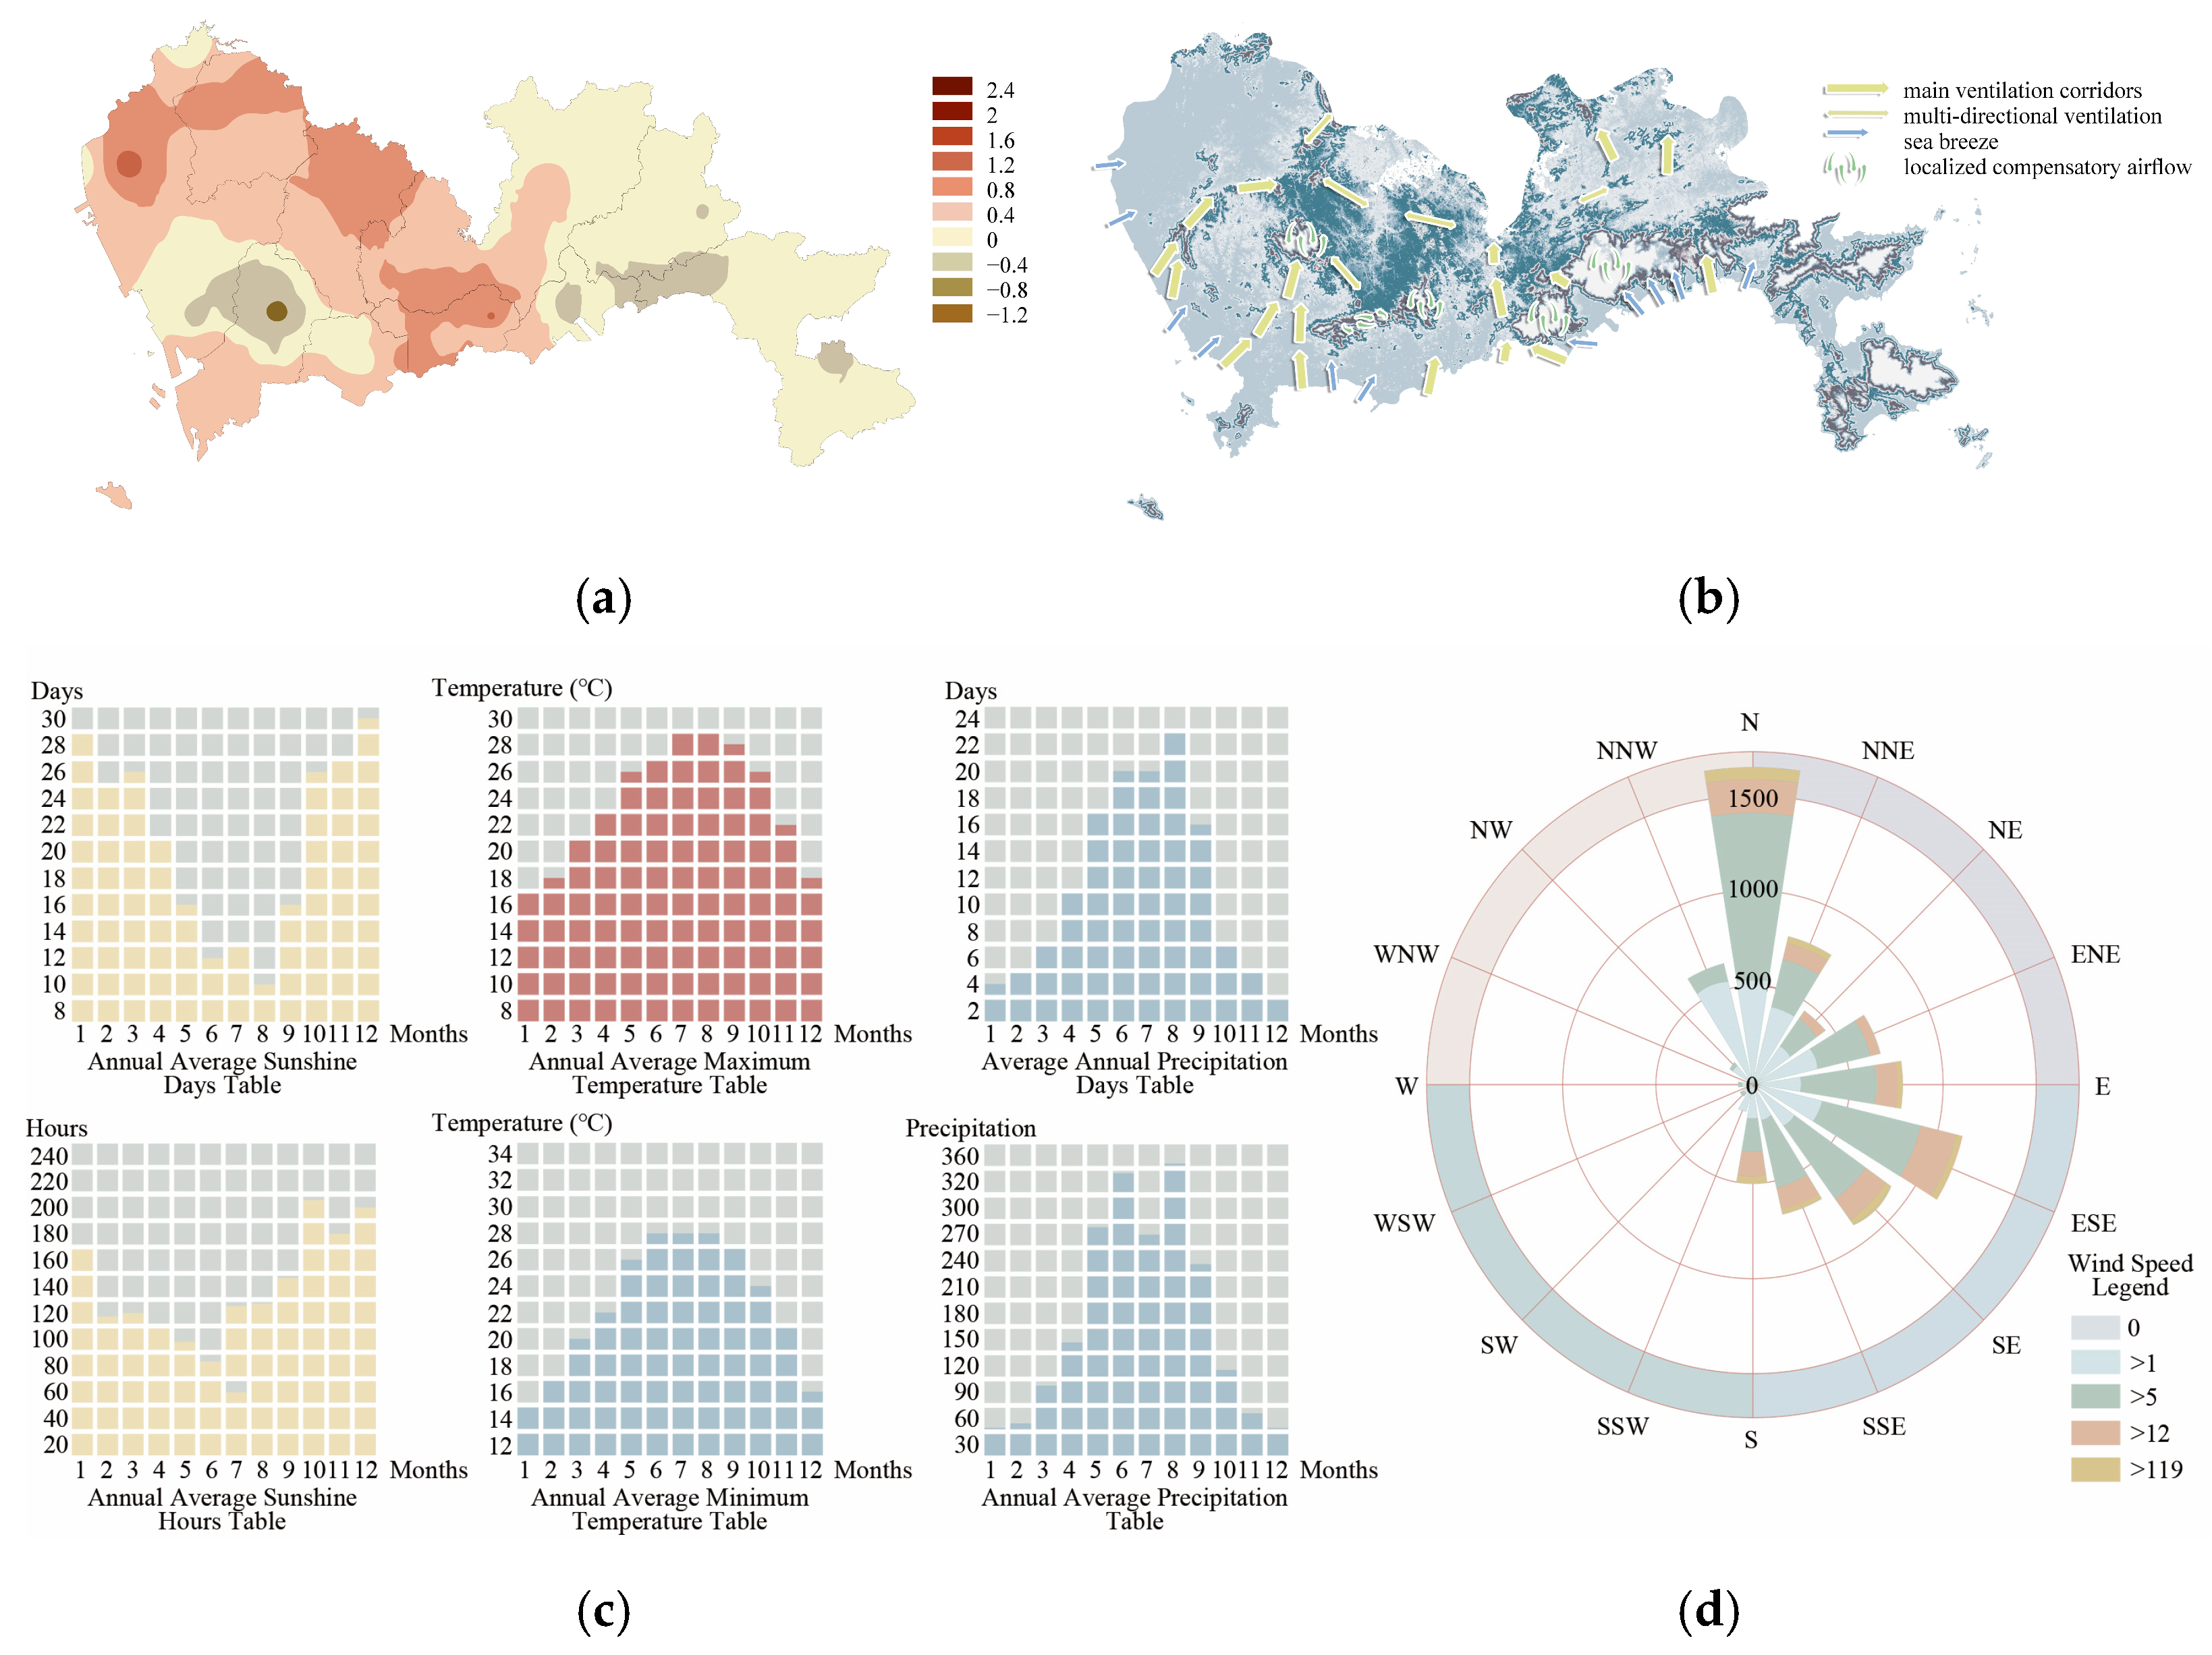
2.1. Macroclimatic Characteristics in Shenzhen
2.2. Study Area and Wind Environment Characteristics in Urban Villages
2.2.1. Study Area
2.2.2. Wind Environment Characteristics in Urban Villages in Shenzhen
3. Materials and Methods
3.1. Computational Fluid Dynamics (CFD) Technology
3.2. Data Sources and Processing
3.2.1. Climate Data
3.2.2. Model Data
3.3. Analysis Methods and Procedures
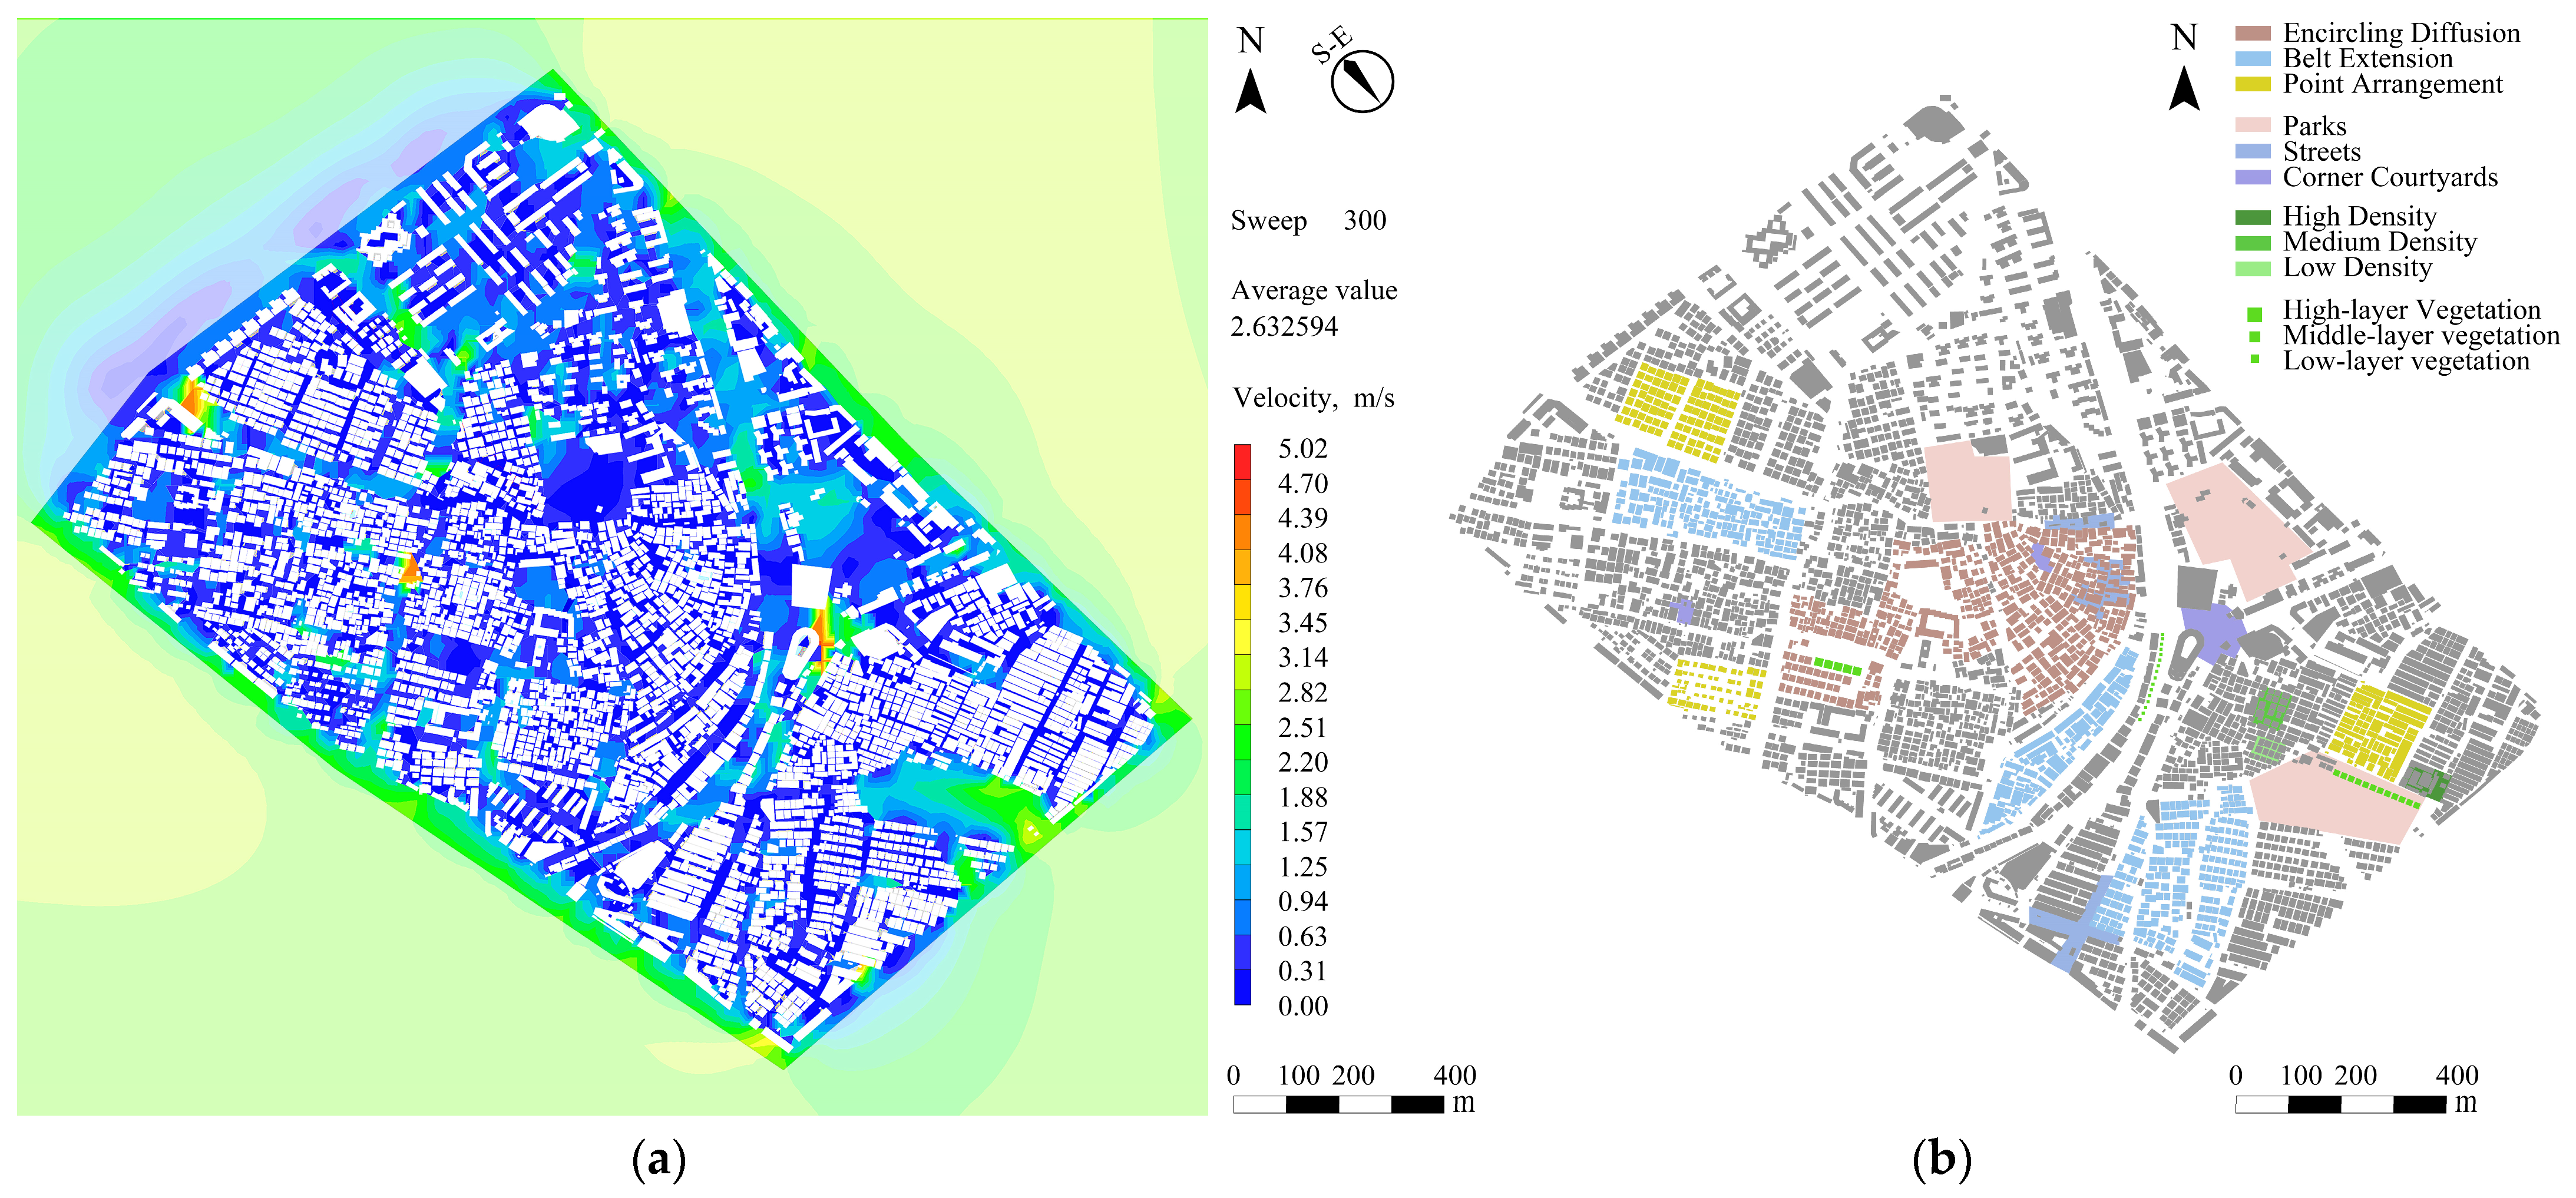
3.3.1. Area Modeling
3.3.2. Regional Wind Environment Formulation
3.3.3. Grid Division
3.4. Classification of Wind Environment Suitability
4. Results
4.1. Building Group Prototypes
4.1.1. Encircling Diffusion Type
4.1.2. Belt Extension Type
4.1.3. Point Arrangement Type
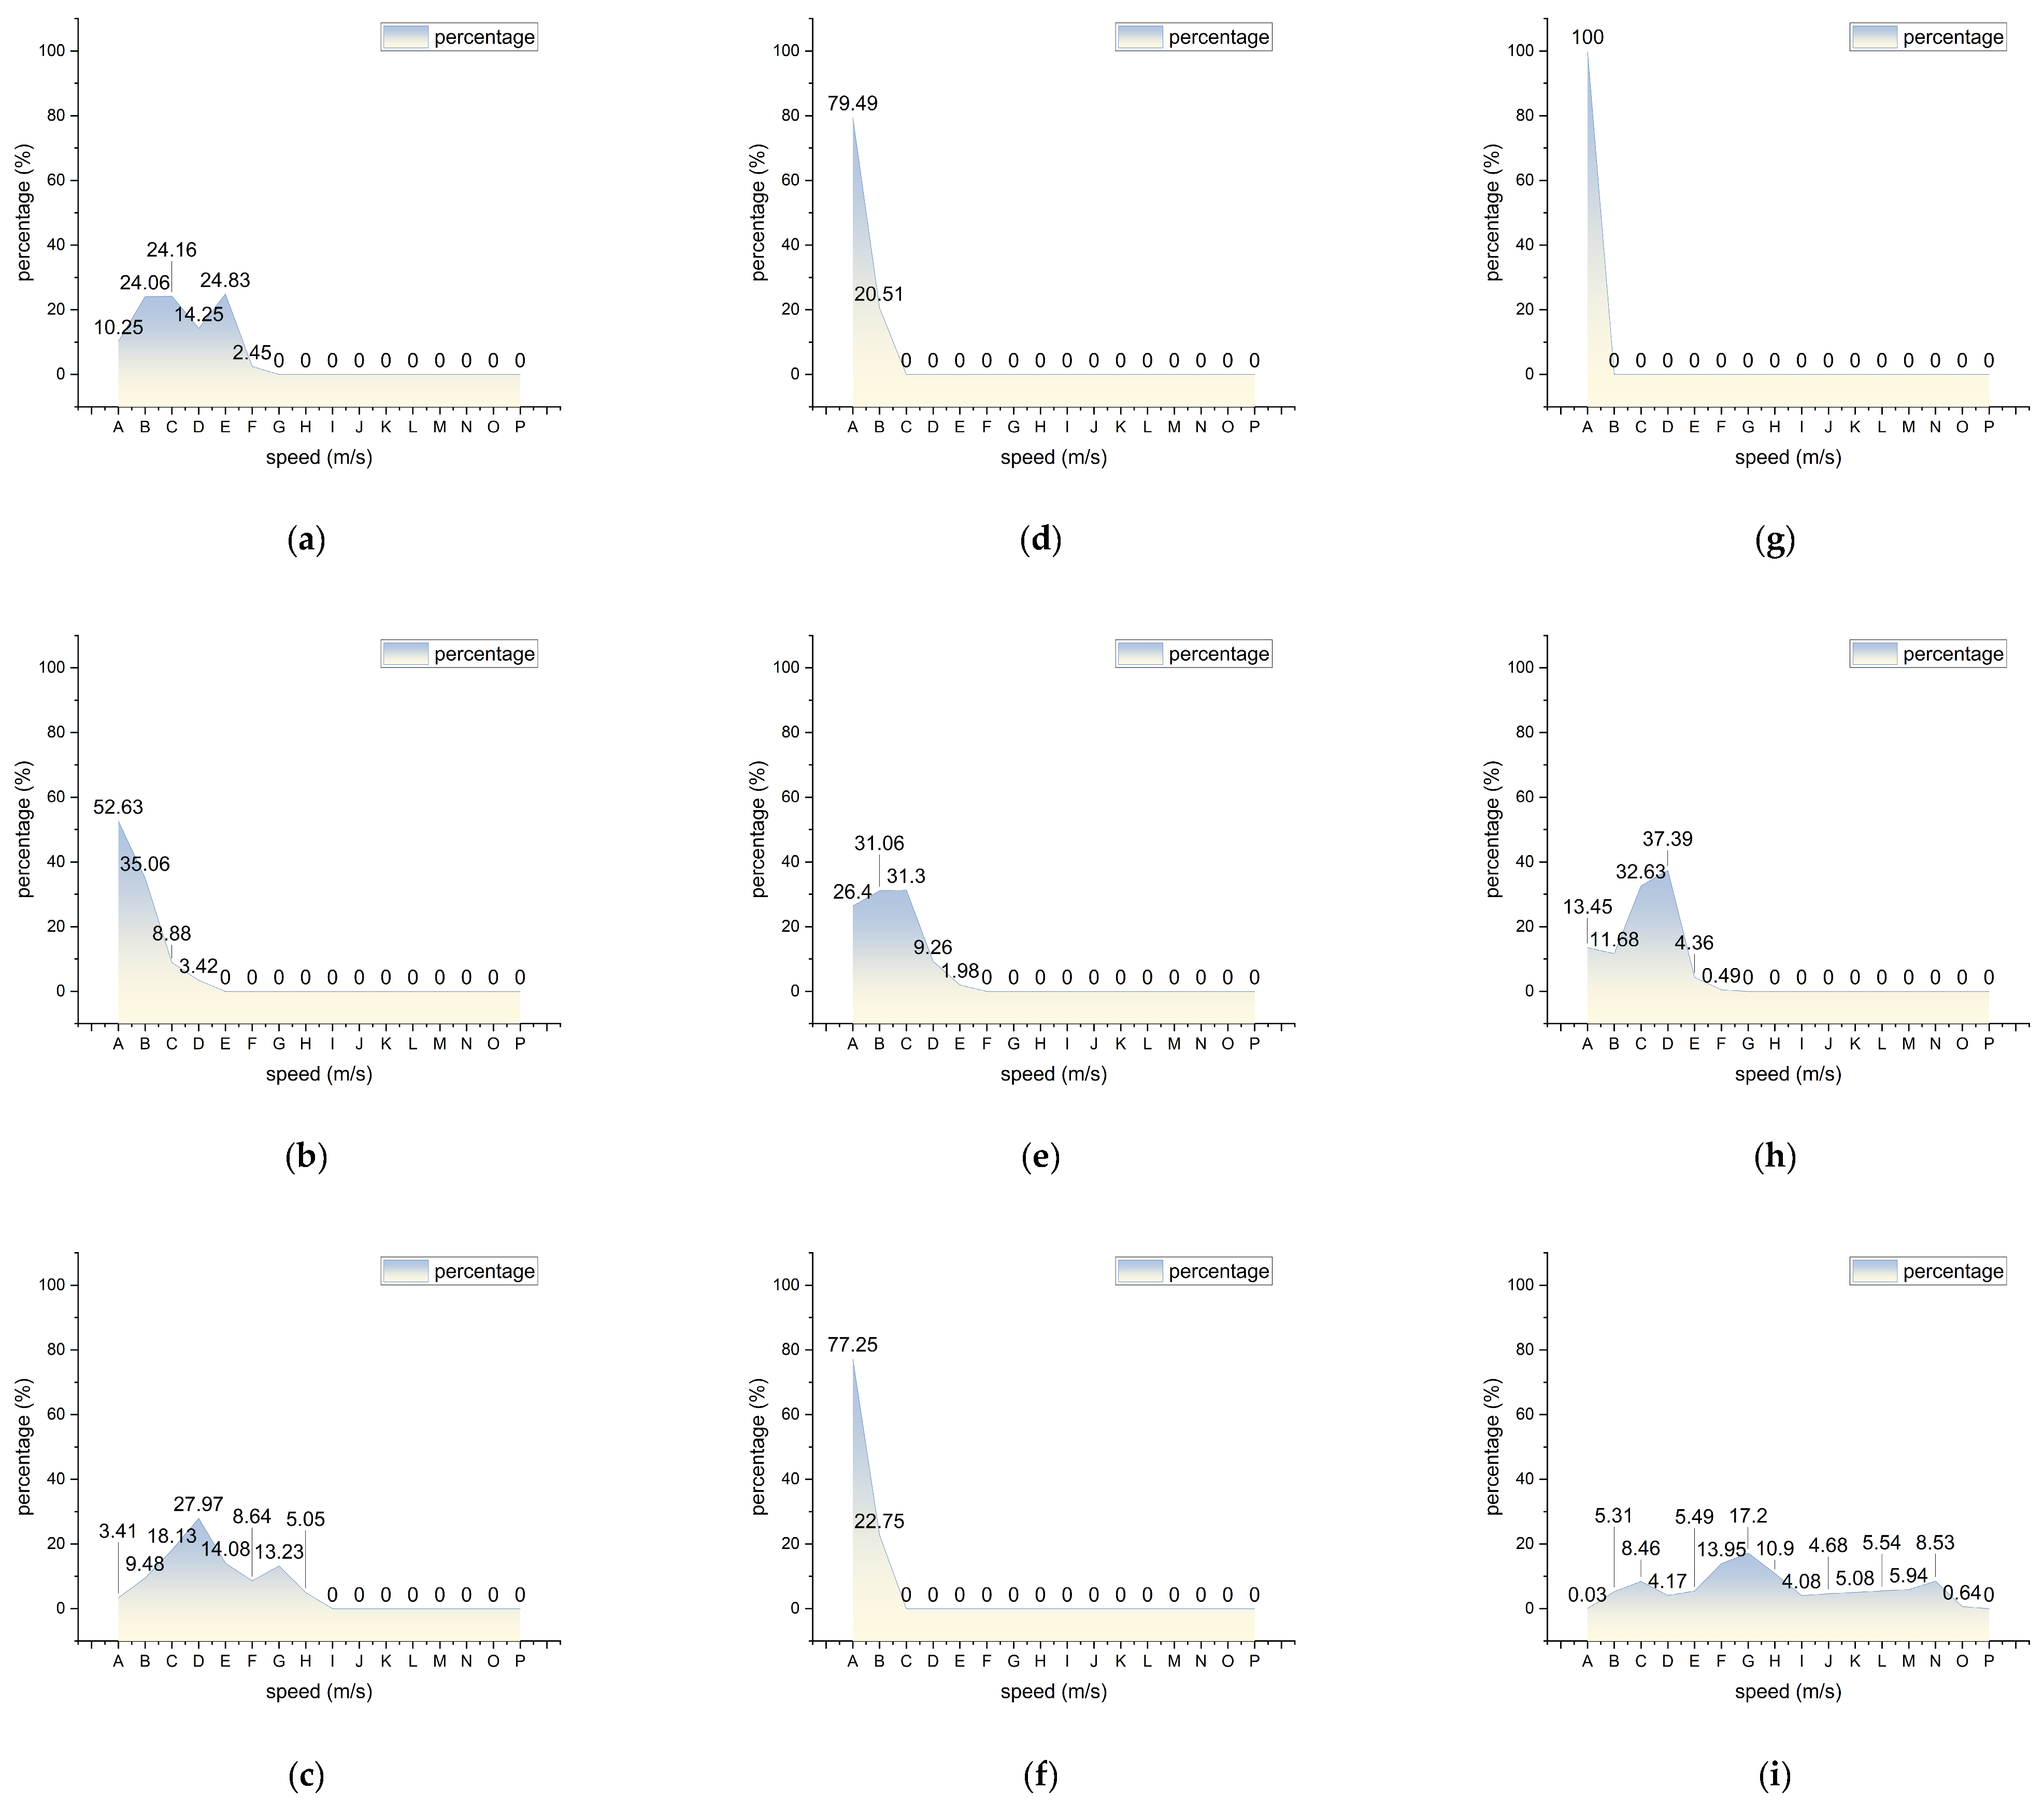
4.1.4. In-Depth Wind Analysis of Building Group Prototypes
4.1.5. Architectural Space Prototypes
- Architectural Façade Type
- Fifth Elevation Type
- Vertical Space Type
4.2. Public Space Prototypes
4.2.1. Park Type
4.2.2. Street Type
4.2.3. Corner Courtyard Type
4.2.4. In-Depth Wind Analysis of Public Space Prototype
4.3. Plant Relationship Prototypes
4.3.1. Planar Density
4.3.2. Vertical Height
4.3.3. Comparative Analysis of Wind Environments
5. Discussion
5.1. Planning and Renovation Strategies
5.2. Landscape Intervention Measures
5.3. Specific Associations Between Spatial Prototypes and Wind Environments
5.4. Limitations and Future Research Directions
6. Conclusions
- Spatial configurations—including building density, height distribution, orientation, and green space integration—are essential factors that influence thermal comfort and wind environment performance.
- Reducing the building density, adjusting the height distribution, and embedding vegetation improved ventilation and thermal comfort. Among prototypes, belt extension, low-density point grouping, and single-sided open parks were most effective for wind environment optimization.
- Radial spatial layouts can effectively channel prevailing winds into dense urban interiors, thereby increasing airflow and reducing heat accumulation.
- Green infrastructure elements, such as green roofs and vertical greening, significantly alleviate the urban heat island (UHI) effect.
- The combined application of GIS and wind simulation tools at early planning stages provides effective support for spatial decision-making and environmental performance evaluation.
Author Contributions
Funding
Data Availability Statement
Conflicts of Interest
References
- UN-Habitat. World Cities Report 2020: The Value of Sustainable Urbanization, United Nations Human Settlements Programme. 2020. Available online: https://unhabitat.org/world-cities-report-2020-the-value-of-sustainable-urbanization (accessed on 10 January 2025).
- Tan, W.; Li, J.; Mai, Y.; Ma, Q. Analysis of the Transformation Dilemma of China’s Development Zones from the Perspective of Space Production Theory: Take Zhangzhou Development Zone as an Example. Urban Dev. Stud. 2023, 30, 25–28+34. [Google Scholar] [CrossRef]
- Peng, L.; Liu, J.; Wang, Y.; Chan, P.; Lee, T.; Peng, F.; Wong, M.; Li, Y. Wind Weakening in a Dense High-Rise City Due to Over Nearly Five Decades of Urbanization. Build. Environ. 2018, 138, 207–220. [Google Scholar] [CrossRef]
- Wang, Z.; Xiao, Z.; Tam, C.; Pan, W.; Chen, J.; Hu, C.; Ren, C.; Wei, W.; Yang, S. The Projected Effects of Urbanization and Climate Change on Summer Thermal Environment in Guangdong-Hong Kong-Macao Greater Bay Area of China. Urban Clim. 2021, 37, 100866. [Google Scholar] [CrossRef]
- Wei, L.; Yan, X. “Urban Village”: Transformation Under the Premise of Survival—An Overview of the Feasibility Model of “Urban Village” Transformation. City Plan. Rev. 2005, 24, 9–13+56. [Google Scholar] [CrossRef]
- Yu, Z.; Zhang, H. Digital Model of CFD Simulation Design in Urban Planning. City Plan. Rev. 2007, 31, 52–55. [Google Scholar] [CrossRef]
- Wu, K.; Shan, L. Make Way for the Wind—Promoting Urban Wind Corridor Planning by Integrating RS, GIS, and CFD in Urban Planning and Design to Mitigate the Heat Island Effect. Atmosphere 2024, 15, 257. [Google Scholar] [CrossRef]
- Toparlar, Y.; Blocken, B.; Vos, P.; Heijst, G.; Janssen, W.; Hooff, T.; Montazeri, H.; Timmermans, H. CFD Simulation and Validation of Urban Microclimate: A Case Study for Bergpolder Zuid, Rotterdam. Build. Environ. 2015, 83, 79–90. [Google Scholar] [CrossRef]
- Takahashi, K.; Yoshida, H.; Tanaka, Y.; Aotake, N.; Wang, F. Measurement of Thermal Environment in Kyoto City and its Prediction by CFD Simulation. Energy Build. 2004, 36, 771–779. [Google Scholar] [CrossRef]
- Azizi, M.; Javanmardi, K. The Effects of Urban Block Forms on the Patterns of Wind and Natural Ventilation. Procedia Eng. 2017, 180, 541–549. [Google Scholar] [CrossRef]
- Ramponi, R.; Blocken, B.; Coo, L.; Janssen, W. CFD Simulation of Outdoor Ventilation of Generic Urban Configurations with Different Urban Densities and Equal and Unequal Street Widths. Build. Environ. 2015, 92, 152–166. [Google Scholar] [CrossRef]
- Ying, X.; Kan, Q. The Influence of Street Spatial Layout Factors on Wind Environment in Hangzhou, Zhejiang. Sci. Geogr. Sin. 2018, 38, 2093–2099. [Google Scholar] [CrossRef]
- Lin, T.; Yin, S.; Yu, B.; He, Y.; Xiao, Y.; Li, X. A Review of Rapid Prediction Methods for Wind Environment on the Urban Block Scale. Build. Sci. 2025, 41, 9–15. [Google Scholar] [CrossRef]
- Bouyer, J.; Inard, C.; Musy, M. Microclimatic Coupling as a Solution to Improve Building Energy Simulation in an Urban Context. Energy Build. 2011, 43, 1549–1559. [Google Scholar] [CrossRef]
- Hosseinzadeh, A.; Bottacin-Busolin, A.; Keshmiri, A. A parametric Study on the Effects of Green Roofs, Green Walls and Trees on Air Quality, Temperature and Velocity. Buildings 2022, 12, 2159. [Google Scholar] [CrossRef]
- Zhang, D.-Y.; Yang, L.; Feng, L.-Y.; Liu, J.; Hong, X.-C. Optimizing Green Spaces Significantly Improves Wind Environment and Accessibility in County Towns. Land 2025, 14, 730. [Google Scholar] [CrossRef]
- Li, R.; Wang, Y.; Lin, H.; Du, H.; Wang, C.; Chen, X.; Huang, M. A Mesoscale CFD Simulation Study of Basic Wind Pressure in Complex Terrain—A Case Study of Taizhou City. Appl. Sci. 2022, 12, 10481. [Google Scholar] [CrossRef]
- Mirzaei, P. CFD Modeling of Micro and Urban Climates: Problems to be Solved in the New Decade. Sustain. Cities Soc. 2021, 69, 102839. [Google Scholar] [CrossRef]
- Peng, C.; Zou, Z.; Hong, L.; Pan, Q. Numerical Simulation of Wind and Thermal Environment in Inner Cities and Strategies for Partial Renewal: A Case Study of Dazhimen, Wuhan. City Plan. Rev. 2016, 40, 16–24. Available online: https://www.planning.org.cn/thesis/view?id=9257 (accessed on 12 June 2025).
- Lai, B.; Fu, J.; Guo, C.; Zhang, D.; Wu, Z. Street Geometry Factors Influencing Outdoor Pedestrian Thermal Comfort in a Historic District. Buildings 2025, 15, 613. [Google Scholar] [CrossRef]
- Zhang, Q.; Lai, X.; Huang, Q.; Zhang, A. Research on Climate Adaptability of Traditional Settlements of the Dong Ethnic Group. J. Hum. Settl. West China 2023, 38, 141–146. [Google Scholar] [CrossRef]
- Xu, H.; Xia, H.; Dong, L. Impact Effects of Traditional Settlement Spaces on the Wind Environment in Hot and Humid Regions with Gentle Airflow. J. Shenyang Jianzhu Univ. Nat. Sci. 2024, 40, 495–504. [Google Scholar] [CrossRef]
- Shirzadi, M.; Naghashzadegan, M.; Mirzaei, P. Improving the CFD Modelling of Cross-ventilation in Highly-packed Urban Areas. Sustain. Cities Soc. 2018, 37, 451–465. [Google Scholar] [CrossRef]
- Zhang, P.; Jia, B.; Gao, Y.; Chen, Z. Simulation and Optimization of Summer Wind and Thermal Environments in Blocks Based on Building Heights and Layouts. J. Univ. Jinan 2025, 39, 63–70. [Google Scholar] [CrossRef]
- Zeng, S.; Tian, J.; Zeng, J. A Study on Ventilation Efficiency and Optimal Layout of Typical Residential Modules Based on CFD Simulation. Archit. J. 2019, 35, 24–30. [Google Scholar] [CrossRef]
- Tork, L.; Tibiriçá, A.; Tibiriçá, Á. Análise Da Ventilação Natural Conforme Planos Diretores: Resultados De Pesquisa Em Belém, PA. Ambiente Construído 2017, 17, 329–351. [Google Scholar] [CrossRef]
- Hågbo, T.; Giljarhus, K. Sensitivity of Urban Morphology and the Number of CFD Simulated Wind Directions on Pedestrian Wind Comfort and Safety Assessments. Build. Environ. 2024, 253, 111310. [Google Scholar] [CrossRef]
- Hu, Y.; Peng, Y.; Gao, Z.; Xu, F. Application of CFD Plug-ins Integrated into Urban and Building Design Platforms for Performance Simulations: A Literature Review. Front. Archit. Res. 2023, 12, 148–174. [Google Scholar] [CrossRef]
- Fang, H.; Yang, T.; Dai, P. Research on the Coupling of Public Space Morphology and Summer Wind Environment in Qingdao’s Urban Villages. Buildings 2025, 15, 1066. [Google Scholar] [CrossRef]
- Peng, L.; Yin, H. Research on the Influence of Plant Community Characteristics on the Health of Residential Wind Environment:Taking Multi-storey Slab Residential Area in Beijing as an Example. Chin. Landsc. Archit. 2024, 40, 119–125. [Google Scholar] [CrossRef]
- Hong, B.; Lin, B. Study on Optimal Design of Vegetation in Residential District in Winter Coupling Field Experiment and Numerical Simulation. Chin. Landsc. Archit. 2014, 30, 104–108. [Google Scholar]
- Zhu, X.; Yang, J.; Shi, X.; Min, H. Exploration of Multi-scale Urban Design Method Based on Physical Environment Simulation and Optimization-Taking Qiantang River Waterfront as an Example. Chin. Landsc. Archit. 2023, 39, 71–76. [Google Scholar] [CrossRef]
- An, L.; Li, Q.; Liang, J.; Zhao, Y.; Zhang, W.; Hang, J. A review of Computational Fluid Dynamics applications in urban wind and thermal environments in China. Acta Aerodynamica Sinica 2024, 42, 1–18. [Google Scholar] [CrossRef]
- Cao, P.; Li, T. Optimization Study of Outdoor Activity Space Wind Environment in Residential Areas Based on Spatial Syntax and Computational Fluid Dynamics Simulation. Sustainability 2024, 16, 7322. [Google Scholar] [CrossRef]
- Li, K.; Yu, Z. Comparative and Combinative Study of Urban Heat Island in Wuhan City with Remote Sensing and CFD Simulation. Sensors 2008, 8, 6692–6703. [Google Scholar] [CrossRef]
- Xie, C. Study on the Diurnal Variation Characteristics and Population Exposure to Urban Heat Islands and High-Temperature Heatwaves in Shenzhen. Master’s Thesis, Southwest Jiaotong University, Chengdu, China, 2020. [Google Scholar] [CrossRef]
- Guo, Q.; Zou, Z.; Li, H.; Qiu, G. Thermal Environment Characteristics and Heat Island Intensity Analysis of Urban Villages in Shenzhen. Ecol. Environ. Sci. 2015, 24, 427–435. [Google Scholar] [CrossRef]
- Miao, Y. Study on the Outside Environment of Winter Olympic Village Based on Wind Environment Comfort. Master’s Thesis, Shenyang Jianzhu University, Shenyang, China, 2021. [Google Scholar] [CrossRef]
- Zhang, H.; Huang, C. Influence of Building Layout on Wind Environment of Urban Residential Communities and Optimization Strategies. Contemp. Hortic. 2024, 47, 97–100. [Google Scholar] [CrossRef]
- Gong, C. Numerical Simulation of Wind Environment at Pedestrian Level in Residential Districts. Master’s Thesis, Guangdong University of Technology, Guangzhou, China, 2012. [Google Scholar] [CrossRef]
- Yang, Y. Study on Density and Spatial Morphology of Urban Villages. Master’s Thesis, Xi’an University of Architecture and Technology, Xi’an, China, 2023. [Google Scholar] [CrossRef]
- Pragati, S.; Shanthi Priya, R.; Pradeepa, C.; Senthil, R. Simulation of the Energy Performance of a Building with Green Roofs and Green Walls in a Tropical Climate. Sustainability 2023, 15, 2006. [Google Scholar] [CrossRef]
- Xu, H.; Jin, T.; Liu, W. Study on the Scale and Landscape Pattern Evolution Characteristics of Blue-Green Space in Suzhou-Wuxi-Changzhou Metropolitan Area, China. J. Nanjing For. Univ. 2022, 46, 219–226. [Google Scholar] [CrossRef]


| Level | Wind Speed (m/s) | Suitability Class |
|---|---|---|
| 1 | 2.20 < a ≤ 2.82 | Very suitable |
| 2 | 1.88 < a ≤ 2.20; 2.82 < a ≤ 3.45 | Appropriate |
| 3 | 0.63 < a ≤ 1.88; 3.45 < a ≤ 4.39 | Generally suitable |
| 4 | 0.00 ≤ a ≤ 0.63; 4.39 < a ≤ 5.02 | Unsuitable |
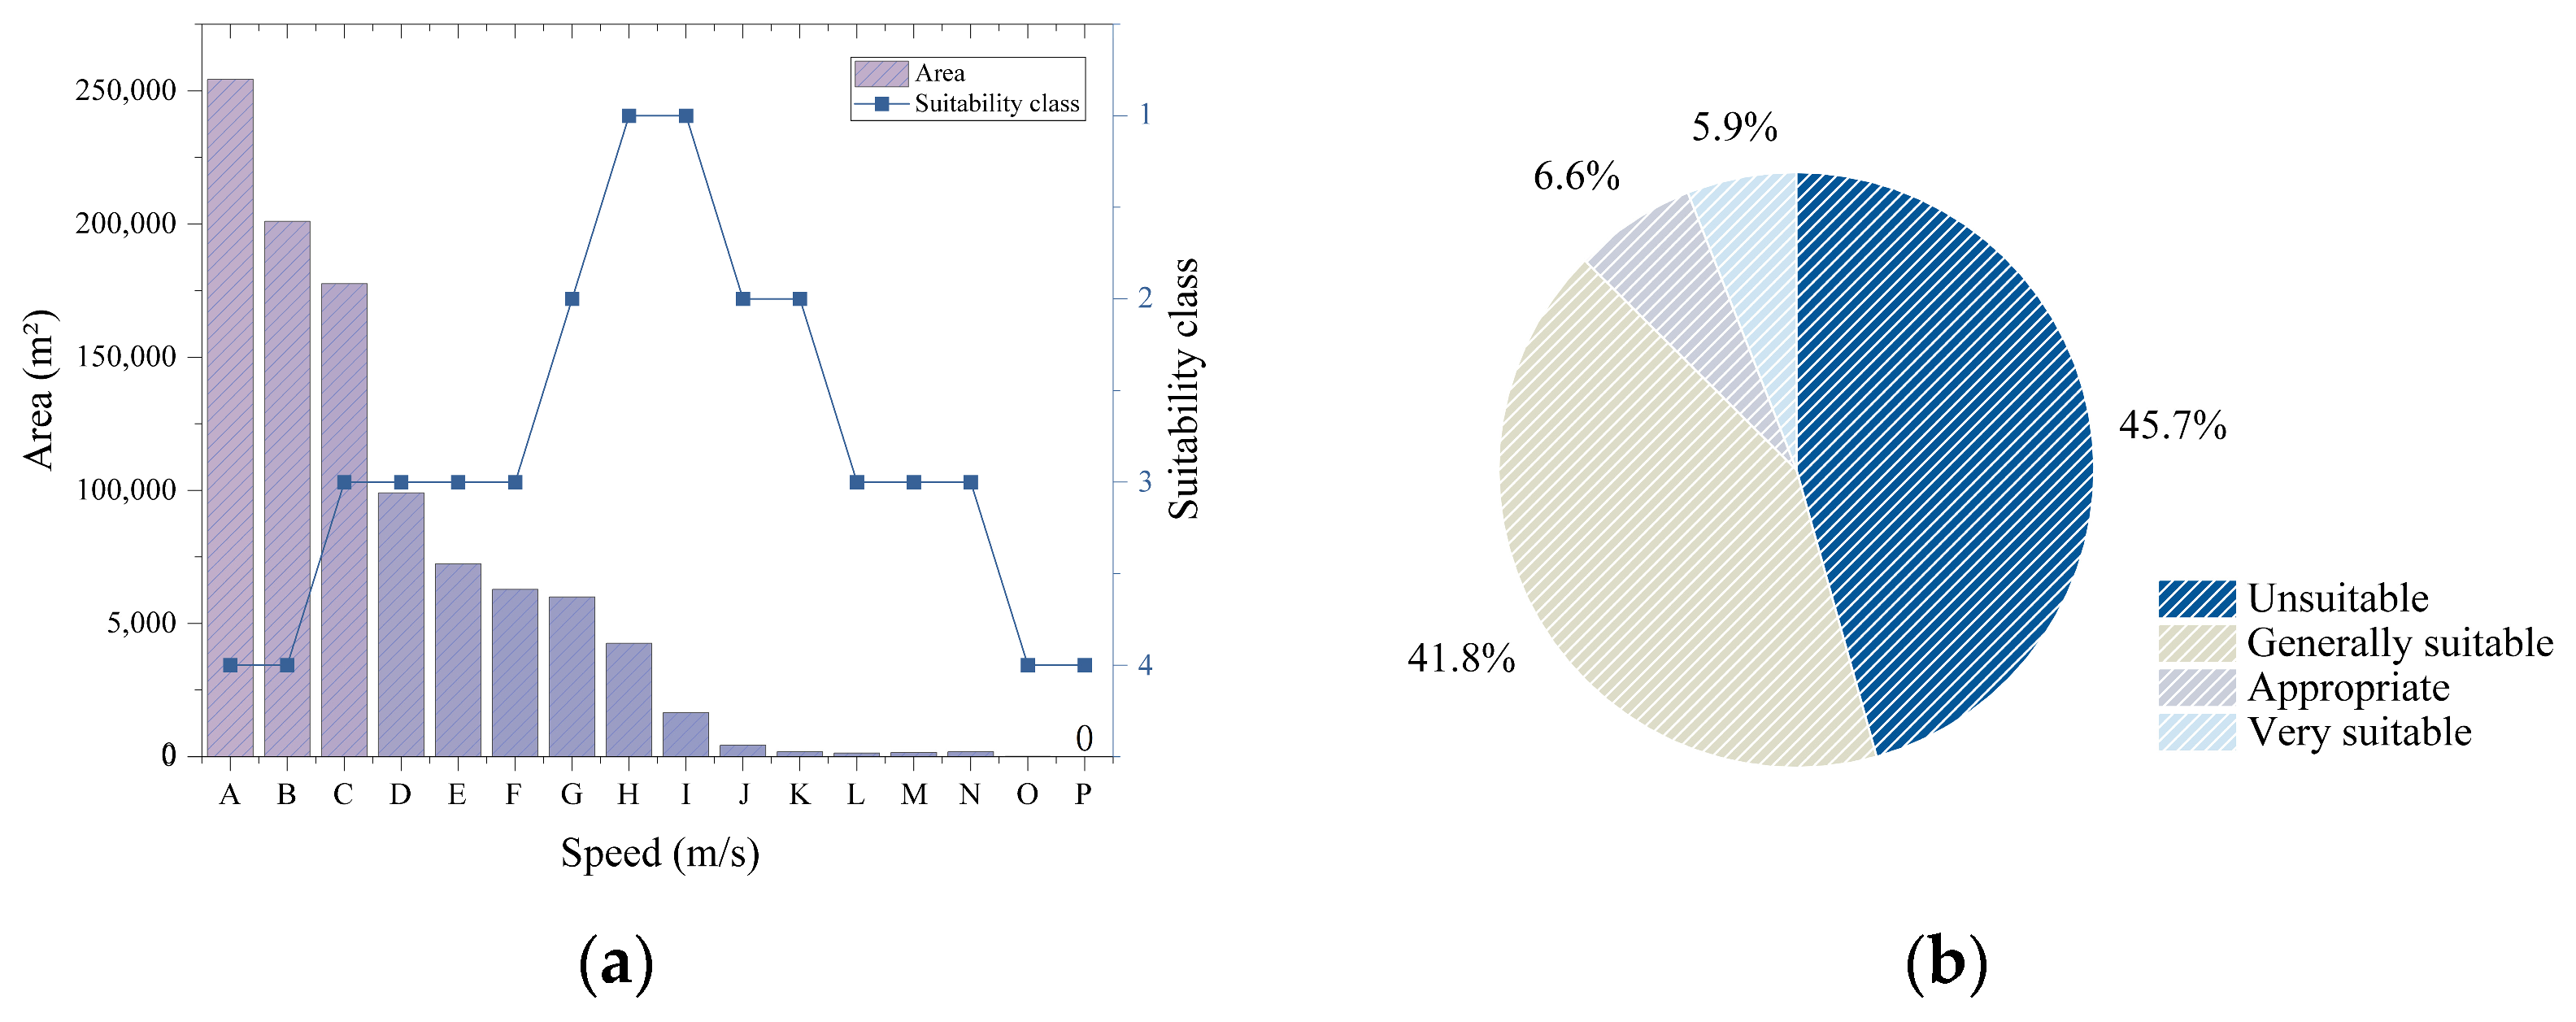
| No. | Wind Speed (m/s) | Area (m2) | Suitability Class | Level | Percentage (%) |
|---|---|---|---|---|---|
| A | 0.00–0.31 | 254,321.83 | Unsuitable | 4 | 25.49 |
| B | 0.31–0.63 | 201,098.09 | Unsuitable | 4 | 20.16 |
| C | 0.63–0.94 | 177,548.83 | Generally suitable | 3 | 17.81 |
| D | 0.94–1.25 | 99,046.22 | Generally suitable | 3 | 9.93 |
| E | 1.25–1.57 | 72,432.73 | Generally suitable | 3 | 7.26 |
| F | 1.57–1.88 | 62,783.2 | Generally suitable | 3 | 6.29 |
| G | 1.88–2.20 | 60,045.57 | Appropriate | 2 | 6.02 |
| H | 2.20–2.51 | 42,600.91 | Very suitable | 1 | 4.27 |
| I | 2.51–2.82 | 16,580.95 | Very suitable | 1 | 1.66 |
| J | 2.82–3.14 | 4301.22 | Appropriate | 2 | 0.43 |
| K | 2.82–3.45 | 1915.15 | Appropriate | 2 | 0.19 |
| L | 3.45–3.76 | 1408.42 | Generally suitable | 3 | 0.14 |
| M | 3.76–4.08 | 1600.48 | Generally suitable | 3 | 0.16 |
| N | 4.08–4.39 | 1830.51 | Generally suitable | 3 | 0.18 |
| O | 4.39–4.70 | 118.27 | Unsuitable | 4 | 0.01 |
| P | 4.70–5.02 | 0 | Unsuitable | 4 | 0 |
| Public space | — | 997,632.38 | — | — | 100 |
| Total site | — | 2,072,889.54 | — | — | — |
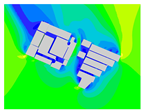
| Type 1 Encircling Diffusion | Type 2 Belt Extension | Type 3 Point Arrangement | |||
|---|---|---|---|---|---|
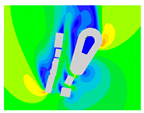
| 01 Fan diffusion  | Limited circulation in downwind areas; enhanced airflow along streets and in pockets. | 01 Riverfront ribbon cluster | Perpendicular buildings block airflow; minimal ventilation within clusters. | 01 High-density spot formation | Minimal wind; airflow limited to access points. |
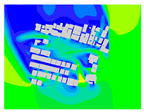
02 Perimeter block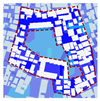 | Overall wind speed remains low, with slight improvements observed along the site boundaries. | 02 Major belt 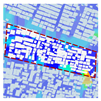 | Wind directed along roads; restricted interior airflow. | 02 Low-density point grouping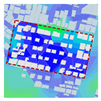 | Enhanced wind reflection and circulation on the windward side. |
03 Semi-enclosed perimeter layout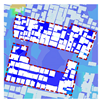 | The wind environment around the open side shows notable improvement. | 03 Secondary strip belt | Overall low ventilation; slight improvement in street-facing pockets. | 03 Strip point groupings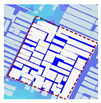 | Narrow gaps limit internal airflow. |
| Type 1 Architectural Façade | Type 2 Fifth Elevation | Type 3 Vertical Space | |||
|---|---|---|---|---|---|
| 01 Door and window structures | 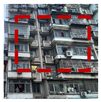 | 01 Low-rise street level |  | 01 Architectural crevices |  |
| 02 Complex materials |  | 02 Mid-rise rooftop |  | 02 Architectural corridors | 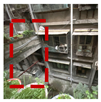 |
| 03 Living facilities | 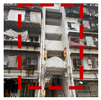 | 03 Side terrace |  | ||
| Archetypes | Characteristics | Forms |
|---|---|---|
| Type 1 Parks | Enhanced internal airflow; shading limits climate impacts on surrounding areas | Low-density green space |
| High-density yard areas | ||
| Single-sided open parks | ||
| Type 2 Streets | Narrow, sheltered; dense facades restrict airflow | Staggered alleys |
| Crossroad alleys | ||
| Bilateral alleys | ||
| Type 3 Corner courtyards | Limited climate control; moderate airflow advantages | Internal courtyards |
| Street-side courtyards | ||
| Corner spaces |
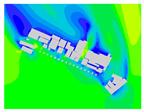
| Type 1 Parks | Type 2 Streets | Type 3 Corner Courtyards | |||
|---|---|---|---|---|---|
01 Low-density green space | (1) Overall well-ventilated environment. (2) Limited shading from surrounding buildings. | 01 Staggered alleys  | (1) Streets and alleys are folded. (2) Airflow is impeded. | 01 Internal courtyards  | (1) Sheltered by dense outer buildings. (2) Near-wind zone. |
| 02 High-density yards areas  | (1) High-density surrounding buildings. (2) Open spaces with high winds. | 02 Crossroad alleyways 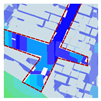 | (1) Few shaded roads and with openings at crossroads. (2) Improved wind environment at local street corners. | 02 Street-side courtyards  | (1) Embedded within building zones. (2) Often aligned with the dominant wind direction. (3) Wind often guided through these areas. |
| 03 Single-sided open parks 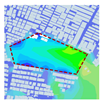 | (1) Openings on the windward side. (2) An overall suitable wind environment. | 03 Bilateral alleyways 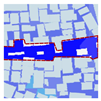 | (1) Unidirectional roads. (2) Dense and cluttered buildings on both sides. (3) Poor overall ventilation. | 03 Corner Spaces  | (1) Complicated wind environment. (2) Good overall wind environment. (3) High winds often form. |
| Type 1 Planar Density | |||||
|---|---|---|---|---|---|
| 01 Classification | 02 Coverage | 03 Example situation | 04 Shading effect | 05 Transpiration | 06 Impact on the wind-heated environment |
| High density | Greater than 80% |  | Provides a large area of shade, effectively reducing the ground temperature. | Strong transpiration increases air humidity. | Regulating the temperature of the zone wind environment also has the potential to block the flow of natural air. |
| Medium density | 50–80% |  | Provides an appropriate amount of shade while allowing some sunlight to reach the ground. | Transpiration is moderate and helps regulate local climate, but not as significantly as high-density vegetation. | It has a certain effect on guiding and changing the wind direction. |
| Low density | Below 50% |  | Provides less shade, with limited effect on reducing ground temperatures. | Transpiration is relatively weak, contributing minimally to increasing air humidity. | It has a small impact on wind speed but has a moderating effect on the comfort of the wind environment in the surrounding residential areas. |
| Type2 Vertical Height | |||||
| 01 Classification | 02 Height | 03 Example situation | 04 Vegetation type | 05 Function | 06 Impact |
| High-level vegetation | Taller than 5 meters |  | Tall trees | Forms a cool canopy layer to provide extensive shade. | The canopy layer can significantly reduce the temperature of the area below, minimize heat accumulation, and provide a cool environment for people. |
| Middle-level vegetation | Between 1 and 5 meters |  | Medium-height shrubs and smaller trees | Provides shaded areas, blocking some direct sunlight from reaching the ground and buildings. | Reduce the heat load from direct sunlight, lower the temperature of the surrounding environment, and enhance the comfort of the shaded areas. |
| Low-level vegetation | Below 1 meter |  | Ground cover plants, herbaceous plants, and low shrubs | Provide ground coverage to reduce the amount of heat reflected from the ground. | By the blocking of direct sunlight, the surface temperature is reduced, and the transfer of heat to the surrounding environment is decreased, thereby improving thermal comfort. |
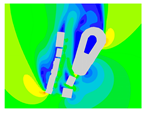
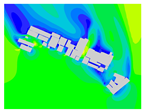
| Type 1 Planar Density | |||||
|---|---|---|---|---|---|
| High Density | Medium Density | Low Density | |||
| 01 Layout features | 04 Comparison | 01 Layout features | 04 Comparison | 01 Layout features | 04 Comparison |
 | (1) High vegetation density can significantly obstruct wind flow, thereby exacerbating the deterioration of the wind environment within settlements. |  | (1) Medium-density plantings have a limited impact on wind speed in relatively wide lanes. (2) In narrower areas, vegetation can obstruct wind flow. (3) In confined spaces, vegetation may partially alter the direction of wind flow. |  | (1) Low-density spot planting can help regulate wind speed and alter flow direction in specific areas. (2) It also contributes to mitigating high-velocity wind phenomena induced by building layout. |
| 02 Vegetated | 02 Vegetated | 02 Vegetated | |||
 |  |  | |||
| 03 Non-vegetated | 03 Non-vegetated | 03 Non-vegetated | |||
 |  |  | |||
| Type 2 Vertical Height | |||||
| High-Level Vegetation | Middle-Level Vegetation | Low-Level Vegetation | |||
| 01 Layout features | 04 Comparison | 01 Layout features | 04 Comparison | 01 Layout features | 04 Comparison |
 | (1) The elevated vegetation zone along the lakefront exerts a slight decelerating effect on wind speeds across the roadway; however, its influence on the wind environment surrounding buildings located farther inland is minimal to negligible. |  | (1) Vegetation of medium height situated in relatively open areas exerts minimal influence on wind speed. (2) Conversely, vegetation surrounding the perimeter of adjacent buildings facilitates the formation of an extended area of reduced wind velocity on one side. |  | (1) Lower vegetation belts in the landscape can moderately enhance regional wind speeds. |
| 02 Vegetated | 02 Vegetated | 02 Vegetated | |||
 |  |  | |||
| 03 Non-vegetated | 03 Non-vegetated | 03 Non-vegetated | |||
 |  |  | |||
| Levels of Strategy | Strategic Approaches | Specific Practices | Thermal Comfort Improvement |
|---|---|---|---|
| 01 Neighborhood Level | (1) Rationally use terrain. | Expand the ventilation corridors in the windward direction, leveraging terrain and natural features. | Mitigate the overall UHI effect in the area. |
| (2) Demolish old and outdated buildings. | Demolish old buildings and building features located in potential wind corridors. | ||
| (3) Expand the width of the ventilation corridors. | Expand the width of the ventilation corridors in the direction of the prevailing wind. | ||
| (4) Adjust the building density. | Adjust the high-density, low-rise layout to a high-rise, low-density layout. | ||
| 02 Residential Unit Level | (1) Optimize the building layout structure. | Modify the row layout for buildings that border open areas and stagger the layout for adjacent buildings. | Enhance the heat dissipation in residential units. Improve the internal thermal environment of buildings. |
| (2) Optimize the building layout orientation. | Reasonably design the building layout orientation according to the dominant wind direction. | ||
| (3) Increase the size and number of public spaces. | Remove some buildings in high-density areas and increase point-based open spaces. | ||
| 03 Building Unit Level | (1) Optimize the building materials. | Optimize the surface of the building materials to reduce the surface roughness. | Reduce temperatures on the building surface. |
| (2) Optimize the building form. | Adopt more streamlined designs. | ||
| (3) Enhance the building ventilation. | Install ventilation on elevated floors to guide wind flows through the buildings. | ||
| (4) Optimize the building design. | Ensure that the building podium overlaps with the main body of the building. | ||
| (5) Increase greenery on the building surfaces. | Increase the amount of greenery on rooftops or facades of buildings. |
| Main Retrofit Strategies | Specific Measures | Wind Environment Regulation | Thermal Comfort Improvement |
|---|---|---|---|
| 1. Regional planning level | |||
| Optimizing ecological nodes | (1) Restore environmental quality at damaged ecological nodes. | (1) Optimize the local wind environment. | (1) Isolating heat islands, promoting temperature exchange between the internal spaces and localized “cold islands” in the peripheral areas, and improving the overall thermal environment within the urban areas. |
| (2) Establish key ecological nodes such as eco-parks, nature reserves, and nature conservation buffer zones. | |||
| Constructing ecological corridors | (1) Optimize the layout of the green spaces in the direction of the unventilated corridors and increase the vegetation coverage to the greatest extent. | (2) Ensure the directional continuity of the ventilation corridors to support cold air circulation. | |
| (2) Improve river channels, integrate shoreline resources, and increase the width of greenways. | |||
| Build an ecological network | (1) Enhance the areas of ecological corridors and the transitions between ecological corridors. | (3) Form an overall ventilation network. | |
| (2) Enhance the penetration and connection of ecological corridors and the transitions between corridors. | |||
| (3) Strengthen the green infrastructure and ecological isolation zones. | |||
| 2. Neighborhood improvement level | |||
| Community parks | (1) Support reasonable, dense planting. | (1) Increase the areas of shaded surfaces. (2) Increase the water content of the air. | (1) Utilize the shaded surfaces of plants and buildings to enhance thermal comfort. (2) Utilize the evaporation of water vapor to lower the ambient temperature. |
| (2) Set up pavilions, umbrellas, and rest areas and plant tall shade trees. | |||
| (3) Conduct artificial cooling with water from sprinkler irrigation. | |||
| Waterfront green spaces | (1) Utilize terrain to guide wind direction. | (1) Direct winds to increase wind flows. | (1) Reduce the area of sunlight absorption, reduce the temperature of water surfaces, and better utilize thermal regulation by water bodies. |
| (2) Establish tall plants along rivers. | |||
| (3) Build ecological green islands. | |||
| Street spaces | (1) Incorporate green concepts into the design of street layouts; ecological planting in public areas. | (1) Direct winds to create neighborhood cold corridors. (2) Utilize the moderating effect of plants to create localized microclimates. | (1) Enhance the thermal comfort of the travel corridors and recreational areas. |
| (2) Green the facades of buildings and plant trees along streets. | |||
| (3) Avoid bare and impermeable land areas. | |||
| (4) Adopt specific layouts for leisure, sport, and fitness facilities, surrounded by plants. | |||
| (5) Reasonably arrange bus stops and rest areas. | |||
| Pocket green spaces | (1) Establish a regular, block-based layout of small green spaces. | (1) Create localized islands. (2) Regulate the circulation of cold air. | (1) Reduce building temperatures. (2) Build cool spaces. |
| (2) Plant tall shade trees. | |||
| (3) Add water features. | |||
| (4) Install cooling pavement. | |||
| Rooftop green spaces | (1) Roof gardens. | ||
| (2) Rooftop farms. | |||
| (3) Eco-paving. | |||
Disclaimer/Publisher’s Note: The statements, opinions and data contained in all publications are solely those of the individual author(s) and contributor(s) and not of MDPI and/or the editor(s). MDPI and/or the editor(s) disclaim responsibility for any injury to people or property resulting from any ideas, methods, instructions or products referred to in the content. |
© 2025 by the authors. Licensee MDPI, Basel, Switzerland. This article is an open access article distributed under the terms and conditions of the Creative Commons Attribution (CC BY) license (https://creativecommons.org/licenses/by/4.0/).
Share and Cite
Ren, J.; Xu, X.; Jiang, J. Optimizing Public Space Quality in High-Density Old Districts of Asian Megacities: Thermal Environment Analysis of Shenzhen’s Urban Fringe. Buildings 2025, 15, 2166. https://doi.org/10.3390/buildings15132166
Ren J, Xu X, Jiang J. Optimizing Public Space Quality in High-Density Old Districts of Asian Megacities: Thermal Environment Analysis of Shenzhen’s Urban Fringe. Buildings. 2025; 15(13):2166. https://doi.org/10.3390/buildings15132166
Chicago/Turabian StyleRen, Jie, Xiaohui Xu, and Jielong Jiang. 2025. "Optimizing Public Space Quality in High-Density Old Districts of Asian Megacities: Thermal Environment Analysis of Shenzhen’s Urban Fringe" Buildings 15, no. 13: 2166. https://doi.org/10.3390/buildings15132166
APA StyleRen, J., Xu, X., & Jiang, J. (2025). Optimizing Public Space Quality in High-Density Old Districts of Asian Megacities: Thermal Environment Analysis of Shenzhen’s Urban Fringe. Buildings, 15(13), 2166. https://doi.org/10.3390/buildings15132166