1. Introduction
Masonry, a construction technology that has been used since ancient times to create shelter systems, has evolved significantly from its originally simple formats. Today’s masonry incorporates various systems and techniques, such as mortar, to enhance efficiency. With its versatility and durability, masonry remains a popular choice in the modern construction industry. Despite these advancements, productivity remains a major concern within the masonry sector, reflecting broader challenges across the construction industry [
1].
Lean philosophy, which aims to maximize value in all forms for stakeholders, suggests that reducing variability can significantly decrease waste—though not eliminate it entirely. About three decades ago, lean as a philosophy was introduced to the construction industry by Koskela [
2], followed shortly by the definition of lean principles such as pull, flow, and continuous improvement [
3]. Since then, the implementation of lean in construction has steadily increased, leading to broader applicability across the industry. Notable implementations included the introduction of the Last Planner System [
4] and Kanban systems [
5], followed by the creation of frameworks for lean construction [
6].
While the adoption of lean practices in construction has been gradual, it is increasingly necessary due to the high levels of debris and waste on construction sites [
7]. In fact, waste rates in the industry have been reported to reach up to 57% ([
8], underscoring the urgency of implementing lean principles. The use of lean philosophy as a tool to minimize on-site waste [
9] has therefore become more critical than ever. Moreover, Hamzeh et al. [
10] indicated that the architecture, engineering, and construction (AEC) industry suffers from a notable innovation deficit, a challenge that is particularly evident in masonry construction. Without a clear understanding of the problems faced by the industry, it becomes increasingly difficult to address and resolve them [
11]. Furthermore, Suresh and Nathan [
12], found that supplier selection in a construction project has a significant impact in determining a project’s readiness to integrate lean practices into the procurement process. Negi et al. [
13] identified that the lack of understanding of lean construction is a major barrier in the uptake of lean in the construction industry [
8]. Hence, the masonry sector, like any other construction sector, encounters several obstacles, particularly delays and a shortage of skilled labour [
14], which exacerbate productivity issues, often leading to cost overruns and schedule delays. These setbacks are direct consequences of the various sources of waste present within current construction practices.
Over the past few decades, the construction industry has seen improvements in cost, productivity, and scheduling, all of which impact the value generated for stakeholders. While advancements continue, few efforts have specifically addressed the improvement of construction site conditions. Melo et al. [
15] applied value stream mapping in the masonry construction industry through site visits, interviews, and analysis of historical data. Their findings revealed that non-value-adding time accounted for 32.45% of the total construction time. This inefficiency was primarily due to ineffective unloading of material and the use of cranes for on-site transportation. Various lean tools were employed (Kanban, Heijunka, Kaizen, etc.) to reduce waste and increase value. When applied, these tools reduced the total non-value-adding time by 60.55% compared to the original value stream map developed. This application also yielded improvements across multiple metrics, including lead time.
The use of lean thinking is not limited to small-scale projects; it is equally applicable to large-scale projects and megaprojects. Schöttle and Böker [
16] applied the Last Planner System to two projects of varying durations and concluded that the application improved the understanding of the project schedule and production planning. Additionally, Gartoumi et al. [
17] applied a DMAIC approach to optimize the construction process for a tower, demonstrating lean’s applicability in complex high-rise construction contexts.
Value stream mapping has been widely used as a tool across various industries and countries. It has been used in Brazil for concrete slabs [
18] and ceramic blocks [
19] ( as well as in Saudi Arabia for concrete block masonry [
20]. Additionally, Sakka et al. [
21] applied value stream mapping to the manufacturing industry and proposed the application of lean principles to the mapped process. When applied across different industries, lean principles have consistently shown promising results. For instance, Xiaoshen & Hamzeh [
22] used value stream mapping in precast construction to enhance the understanding of material and information flows. Their study emphasized that the impact of flow on site should be a macro-level concern, rather than focusing solely on mitigating the impact of specific issues. Moreover, value stream mapping has been applied to compare planned construction schedules with actual delays, offering valuable insights into schedule performance. Value stream mapping as a tool is not limited to specific tasks or process scales but may be applied at both the micro- and macro-levels and even in project delivery systems [
23]. In addition to value stream mapping, the use of technological advances such as simulation modelling has also increasingly permeated the construction industry. In fact, simulation has been used as a tool within lean construction settings for over two decades [
24]. Over the years, simulation modelling has been employed to evaluate the effectiveness of lean practices in the construction sector [
25,
26].
Simulation modelling typically involves several key steps. The first step is conceptual modelling, in which the problem is defined. This is followed by the construction of the model, testing and validation, and finally, the implementation of the simulation model to improve existing systems or introduce new ones [
27] As a tool, one of the main advantages of simulation modelling is its ability to assess proposed solutions based on lean principles before applying them in real-life settings. Wang et al. [
28] demonstrated that using simulation modelling in pipe spool fabrication provided a more practical means of evaluating and improving current production practices.
Abbasian-Hosseini et al. [
25] applied lean concepts to a masonry construction setting using simulation modelling as a tool. By implementing lean principles and running models based on the modifications made, a 43% increase in productivity and a 27% increase in operational efficiency were observed. Moreover, the total cycle time decreased by 41%. Abdelmagid [
27] further emphasized the importance of using simulation modelling as a decision-support tool in the AEC industry. However, stakeholders have remained hesitant to implement simulation modelling as a standard practice [
29].
Masonry construction hence faces a shortage of skilled labour, labour-intensive practices, as well as the rising cost of material and equipment needed. These shortages translate into declining productivity and subsequent loss of value. The limited research available on streamlining and analyzing masonry construction practices further impedes efforts to optimize and improve them. Moreover, the slow adoption of lean principles within the construction industry contributes to the ongoing decline in productivity and the reduced use of masonry as a preferred construction material. Recent studies on the application of lean principles in the masonry construction industry identified three main categories of interest where improvements can be applied: masonry design, concrete masonry units, and masonry construction processes [
30]). Addressing these gaps and shortcomings is essential to modernize the masonry construction sector and align it more closely with advancements seen in the manufacturing industry.
This study aims to bridge the gap in research concerning feasible solutions to enhance construction practices through the creation of semi-autonomous systems. Despite recent advancements, limited research has explored the implementation of improved construction practices that address the challenges encountered on masonry construction sites, while simultaneously examining each step of the masonry construction process.
According to the Canadian Standards Association (CSA) A165 [
31], masonry units are categorized into three types: solid units, semi-solid units, and hollow units. This paper presents data collected on semi-solid CMU blocks used in constructing a typical masonry wall with no changes in height, at intersections, or protrusions.
To address the inefficiencies in current masonry construction practices, lean principles can provide the adequate tools and methods needed to reduce variability and waste. Simulation modelling is used as a decision-support tool enabling the assessment of lean-based solutions in a safe and virtual setting. Indeed, on-site experimentation is both risky and costly due to its inherent variability and labour-intensive nature. Employing simulation, different scenarios and combinations of scenarios were explored, and the potential impact of these scenarios was assessed. This paper contributes to the academic field by presenting and verifying the validity of a framework aimed at improving construction productivity using value stream mapping and simulation modelling. Moreover, the study proposes ways to transform on-site masonry construction practices, with a particular focus on reducing the lead time by implementing multiple interventions. The study aims to establish the feasibility of integrating robotics into the construction field to create a semi-autonomous system for construction.
This paper is organized into five sections. The first section provides an overview of current masonry construction practices.
Section 2 describes the different materials and methods used for data collection in the study.
Section 3 presents the results derived from the data gathered.
Section 4 discusses the alternative systems of construction proposed in
Section 3.
Section 5 presents the conclusion and research limitations of the study. The primary objective of this paper is to develop a framework that systematically identifies and facilitates ways to enhance masonry construction site practices.
2. Methodology
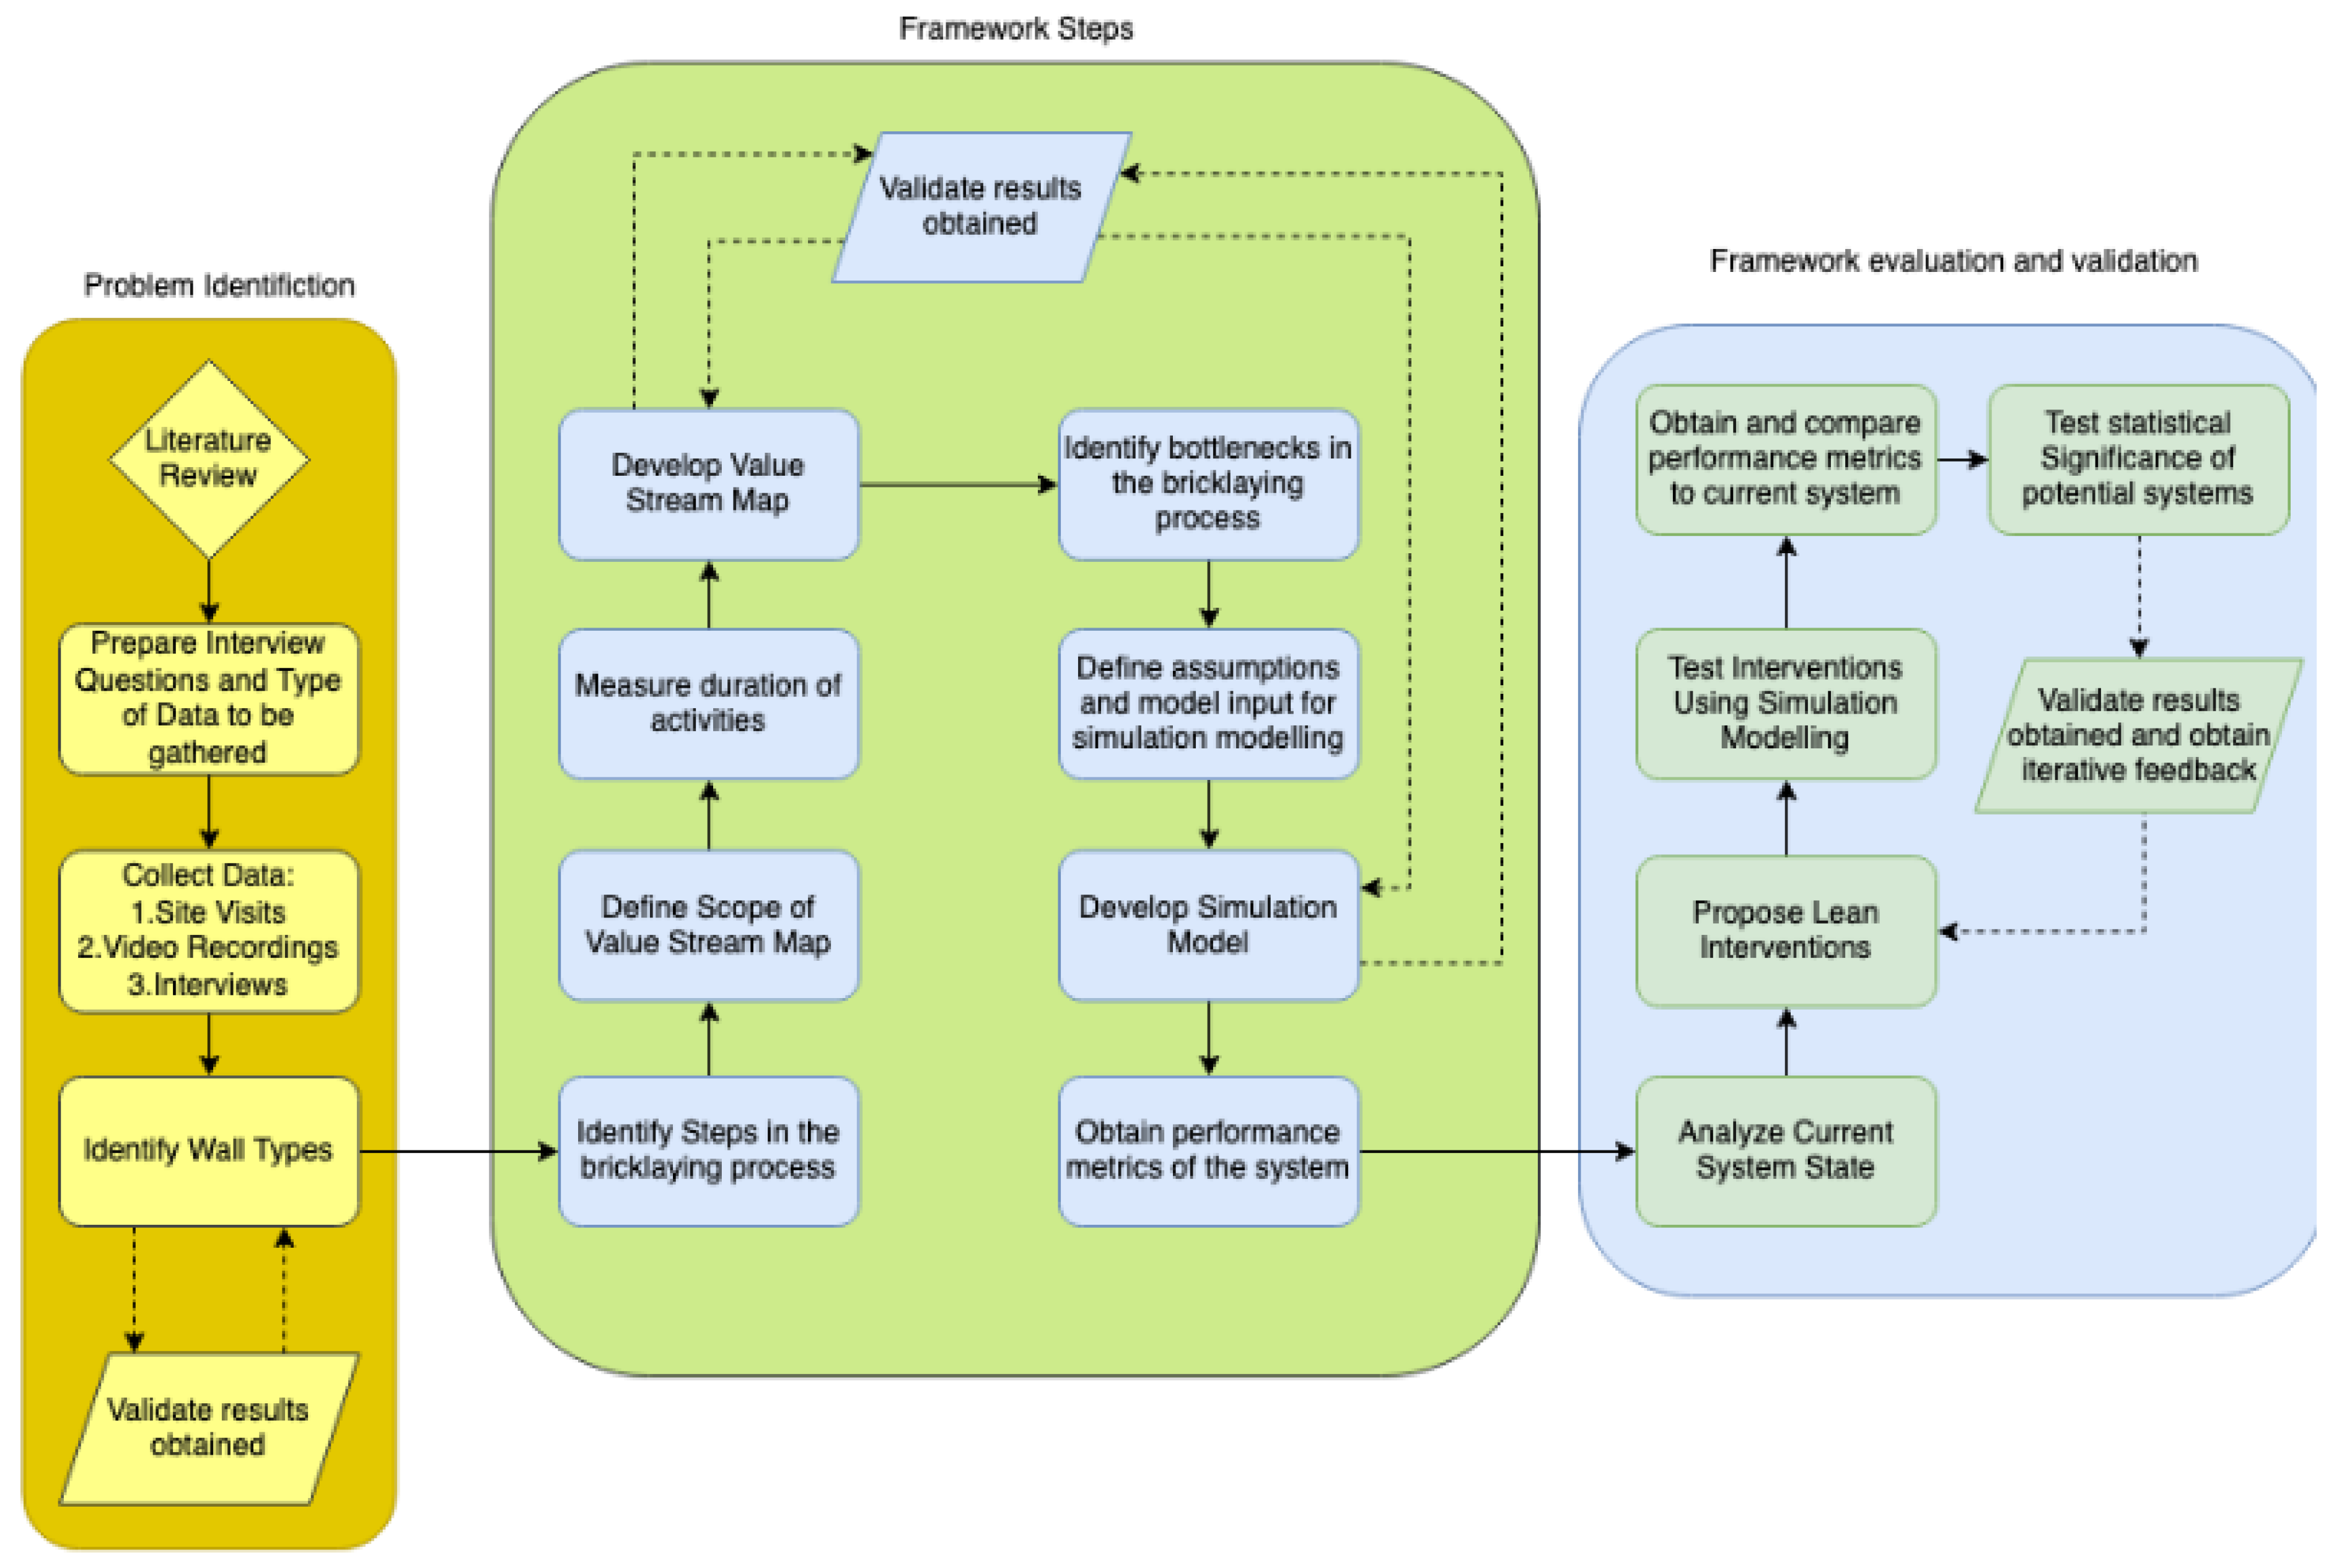
This study adopted design science research as its research methodology, which consists of three main steps: (1) problem identification, (2) framework development, and (3) framework evaluation [
32].
Figure 1 shows the research methodology adopted in the study, following the design science research framework. The steps are explained in detail in the following subsections.
2.1. Problem Identification
The first step in the framework involves identifying the various problems and challenges present on construction sites through different means, including site visits, interviews with masonry industry practitioners, and video recordings of on-site activities. A literature review is then conducted to examine current research, identify knowledge gaps, and formulate questions for further analysis. Moreover, the literature review provides insights into the tools currently being used to improve conditions on construction sites, such as simulation modelling. This review aims to collect, synthesize, and evaluate the limitations of existing research, forming the foundation for developing the study’s questionnaire.
Additionally, this step facilitates the identification of different wall types and helps to refine the research objectives.
To effectively compare potential methods that could be implemented to improve construction site conditions, a systematic research approach is necessary to establish a baseline scenario for masonry construction. The first step involves conducting a literature review to understand the current advancements in the masonry construction industry. This review lays the foundation for subsequent steps, including data collection and categorizing the different wall types achievable with masonry construction. Following this, the distinct steps involved in the bricklaying process are identified through site visits and video recordings. This step enhances the understanding of the process, enabling the proposal of potential methods for improvement.
Once identified, the different steps in the bricklaying process are timed to determine existing bottlenecks. The timings obtained are then used to create a baseline simulation model that reflects the current steps undertaken on site. This simulation model obtained is used to generate various performance metrics, such as construction lead time, daily productivity rate, and utilization rate. These metrics are essential for evaluating the baseline system and comparing it against proposed improvements. Finally, the statistical significance of the construction lead time for potential methods is tested to make sure there is a significant difference compared to the original baseline scenario.
2.2. Framework Development
The second step in the framework involves multiple stages. To create the framework, both lean theory and lean construction practices were employed. The framework itself comprises several tools designed to improve construction site conditions. By integrating these theories, the framework identifies value-adding and non-value-adding activities. The primary goal of the framework is to reduce variability while minimizing waste and increasing value on construction sites. The framework follows a defined sequence of steps. Data collection, a critical component of this study, is conducted through various methods including video recordings, site visits, time and motion studies, and interviews. These methods provide a comprehensive understanding of the processes and conditions on construction sites, allowing for an in-depth analysis of the dynamics and interactions among different elements. Once data collection is complete, a value stream map is developed with two main objectives: to identify the steps undertaken during construction on site and to pinpoint the steps in the construction flow that generate the most waste. The value stream map development follows four main steps.
Define the Scope: The scope of the mapping is defined based on the observations performed on site. While the scope of the value stream map must be comprehensive and encompassing, the availability of data can limit its ability and hence narrow the scope of work of the developed map. However, the scope should be detailed enough to capture material handling and key steps in the construction process.
Data Collection: Once the scope is defined, the data is collected and mapped including information on materials, equipment, and personnel numbers where available.
Identify Bottlenecks: This step involves the identification of bottlenecks by analyzing activities with the longest cycle time. This step is important for determining areas that require improvement.
Develop Assumptions and Scope for the Simulation Model: With the bottlenecks identified, assumptions and the scope for the simulation model are defined, allowing for the development of different interventions to address inefficiencies effectively.
A simulation model is developed to obtain several performance metrics related to different construction steps on site, with a particular focus on construction lead time, which is defined as the duration required to complete one iteration of the process in the simulation. The simulation modelling process is carried out in six steps. The first step involves defining the objectives of the modelling itself. In this case, the primary objective is to identify waste within the construction flow on site. Having done so, the assumptions on which the simulation model is based are made. This step is crucial as it sets the boundaries for the simulation models developed. The third step involves defining the resources required for the simulation model based on the results obtained from the value stream map. These resources are selected to align with the construction flow. In this step, the duration of the different activities is included, and conditions are set to ensure that the on-site flow logic and resource constraints are accurately represented, thereby corroborating the model’s reliability. Once the model is developed, the fourth step involves checking it for errors and inconsistencies using three different verification methods: desk checking, white-box checking, and black-box checking [
33]. These methods assess how accurately the model reflects the real masonry construction process. Following verification, the model is validated using three distinct methods: face validity, event validity, and internal validity [
33]. Validation is carried out to ensure the model accurately reflects real on-site conditions. Both verification and validation of the simulation models is a crucial step to ensure the reliability as well as the credibility of the simulation models developed. Verification ensures that the simulation model aligns with the conceptual design, while validation assesses whether it accurately represents real-world conditions. Validation relies on the input of subject matter experts, while verification relies on comparison and debugging. The final step is to obtain performance metrics from the simulation model.
Three key metrics are considered: construction lead time, daily productivity rate, and station utilization rate. The daily productivity rate is calculated based on the total number of hours worked in a day multiplied by the number of bricks divided by the duration of simulation using Equation (1):
Equation (1): Daily Productivity Equation
If the simulation runs for a different length of time (e.g., one day vs. two days), the total number of bricks laid would be different. To ensure that the productivity is measured on a consistent daily basis, division by the duration of the simulation is necessary. Moreover, if we want to compare productivity across different simulations, a common time frame is needed. Hence, dividing by the duration of simulation would allow for a fair comparison.
When considering a fixed quantity of a resource (such as CMU blocks) and assuming a 7 h workday, the simulation model is run to determine the daily productivity.
The station utilization rate is another critical performance metric calculated using the simulation model. This metric allows us to derive the coefficient of variation, which indicates the part of the process with the highest variability. It is calculated using Equation (2) as follows:
Equation (2): Coefficient of Variation Equation
Simulation modelling is also used to evaluate and compare different proposed solutions (scenarios) against the base case scenario.
2.3. Framework Evaluation and Validation
The last step involves the evaluation and validation of the framework. Lean principles are applied to identify areas for improvement based on observations and deductions made using value stream mapping and simulation modelling. Two main principles out of the 14 core lean principles outlined by Liker [
34] are used as a basis for the proposed scenarios. The first is Principle 6, which states: “Standardized tasks are the foundation for continue improvement and employee empowerment.” This principle emphasizes the importance of reducing internal process variability. Individual activities should have uniform and consistent durations across iterations, ensuring that standardized procedures lead to reproducible and efficient results. The second principle is Principle 13: “Make decisions slowly by consensus, thoroughly considering all options; implement rapidly.” It is essential that any changes to construction processes involve all parties who may be affected. In an industry that is traditionally slow to adapt, decisions regarding construction practices cannot be made unilaterally. Instead, they must be made collaboratively, as a proposed solution holds value only if it is agreed upon by multiple stakeholders. Hence, multiple entities need to be involved from the early stages of research.
Data is gathered from the case study and used as the baseline, referred to as the “traditional masonry construction process”. The proposed lean improvements are tested using simulation modelling, and their performance metrics are compared with the traditional masonry construction practices (also known as the base case scenario). The proposed lean scenarios are tested for their statistical significance compared to the base case scenario before validating the results, iterative feedback is obtained from masonry construction practitioners to incorporate their insights and refine the framework through an iterative process.
3. Results
3.1. Case Study
This research presents a case study of the masonry construction process for a school gymnasium in Edmonton, Alberta, Canada. The gymnasium features various wall configurations and shapes, such as L-shaped walls and those with openings. The case study here focuses on semi-solid blocks used in a typical horizontal shear wall. Site visits were conducted to identify the most common wall patterns on site. Four primary configurations were identified: typical horizontal shear walls, L-shaped walls, T-shaped walls, and U-shaped walls. Among these, the typical horizontal shear wall, constructed with 8”×8”×16” blocks, is the focus of this study. This shear wall was found to be the most prevalent and straightforward to construct due to its simple shape compared to the other three configurations, which require more complex construction techniques. The case study is used to validate the methodology developed.
3.2. Information Flow
Figure 2 shows the information flow on the construction site, which begins with mobilization of the crew and procurement of different materials and equipment. This phase includes setting up scaffolding, a hydro-platform, offices, trailers, and other necessary infrastructure. The second step involves the sourcing and procurement of CMUs and mortar elements from their respective suppliers based on the project’s progress and schedule. The CMU and mortar elements are delivered on site and stored in a specific area until they are used in the third step. The subsequent phase focuses on the construction using masonry blocks. The final phase is demobilization, which involves winding down operations, removing materials and equipment from the site, and dismantling temporary infrastructure such as offices and trailers. This case study primarily focuses on the masonry construction phase within this broader information flow.
3.3. Construction Process
Figure 3 provides an overview of the construction process (corresponding to the third step in
Figure 2), which begins with the mobilization of mortar and CMU blocks to the designated area of the site where construction will occur. Once there, construction can begin and is composed of five main steps: first, spreading the mortar where the block is to be placed and subsequently placing the block, which is knocked and levelled using the trowel. The fourth step involves removing any excess mortar resulting from the knocking and levelling. Once the wall has been built, the final step involves jointing and finishing the wall. The process is repeated for all the blocks composing the wall.
3.4. Data Gathering
To better understand the masonry construction process and identify potential areas for improvement, data collection was carried out at the construction site in question. The data was gathered using video recordings, time and motions studies, and interviews, based on which a simplified value stream map was developed, leading to the following conclusions: (1) a significant amount of time is spent handling the mortar as a resource, and (2) further analysis is required to better understand masonry construction productivity. To ensure that the data closely resembled real-world construction site conditions, it was collected by observing different stages of wall construction. Multiple masons with varying levels of experience were observed to account for differences in skill and technique.
Data was collected for 31 different blocks to determine the efficiency of current construction practices. A systematic approach was employed for data collection, observing masons on site as they constructed the wall. The collection process highlights the efforts made in the field to consider novel approaches for improving construction site conditions. Once the data was collected, motion studies were conducted to analyze the individual steps and sub-steps of the bricklaying process. This analysis helped identify problematic or non-value-adding activities. The findings are summarized in the
Table 1, which outlines the different steps involved in the masonry block construction process and the corresponding actions performed during each step.
The fourth method of data collection involved interviews with the site superintendent. The input of the superintendent was instrumental in developing the baseline model, which served as the foundation for subsequent improved models.
3.5. Value Stream Map (VSM)
Based on the steps undertaken on the construction site, a value stream map was developed to identify bottlenecks and classify activities in the masonry construction process into three categories: value-adding activities, non-value-adding but necessary activities, and non-value-adding activities. This classification is based on the contribution of each activity to the overall construction process.
The value stream map highlights the bottlenecks in the process and showcases the interactions between different resources, equipment, and personnel on site. Several assumptions were made during the development of the map, including the omission of suppliers of sand, cement, mortar, and CMUs, as they were considered outside the scope of the VSM. The main metrics included in the VSM are C/T (cycle time), which describes the duration required for a CMU block to pass through a specific station (step) in the VSM; CLT (construction lead time), which describes the total time for a CMU block to move through all different steps in the VSM (get through a complete cycle of the masonry construction process); and shift duration, which is the total working hours of personnel during a typical workday on the construction site.
The VSM, shown in
Figure 4, depicts the flow of mortar and CMU blocks from their arrival on site and removal from inventory to their use in building a typical horizontal shear wall. The steps identified through various data collection methods form the basis for the development of the VSM and its subsequent application throughout the study.
A simplified version of the VSM used to study the masonry construction process is shown in
Figure 5:
The VSM reveals that bottlenecks occur at the final step in the process, after all the blocks of the wall have been assembled. Moreover, it highlights that a substantial amount of time is spent handling mortar, which is involved in two of the steps studied.
Following data collection and development of the value stream map, simulation modelling was performed to identify the bottlenecks in the process. Simulation modelling provides key performance metrics for comparing potential solution systems. To develop the baseline simulation model, several assumptions were made. First, the sequence of steps necessary for masonry construction is consecutive. Second, no rework is performed on any brick. Third, the blocks are laid sequentially, one after the other and not simultaneously.
Based on the data collected for the 31 blocks, probability density functions were obtained based on distribution fitting. In this study, four main steps of masonry construction are considered as previously stated.
Table 2 shows the probability density functions obtained for each step. The probability density functions are continuous, positively skewed probability distributions commonly used to model non-negative data sets.
3.6. Simulation Model
Figure 6 illustrates the simulation model developed to represent a typical 8″ × 8″ × 16″ CMU block. In the simulation, the block passes through all the stations of the model and only proceeds to “Bringing New Pallets” and “Replenish Mortar Stations” if needed. The simulation model is flexible and can accommodate any number of blocks and rows by adjusting its internal parameters. This allows for simulating the duration of constructing a wall with any number of rows (X) and blocks (Y) using the model.
The different steps in the model are based on either the average values obtained through site observations or by using the probability density functions, as presented in the table. For instance, the first mortar delivery (as well as subsequent deliveries) is set to take 30 min. The grouting duration is assumed to be 5 m/h based on site observations. The simulation model also assumes the capacity of each activity to be one, as blocks are laid sequentially, one at a time.
The main metric extracted from the simulation model is productivity, which is used as a benchmark to evaluate the potential impact of proposed lean interventions.
Once the model was developed, its verification and validation were performed. To verify that the model accurately mimics real-life construction site conditions, three verification techniques were used. First, desk checking was conducted, which involved checking the consistency of the model by reviewing the simulation model step by step and verifying the output for all iterations of the simulation model. The model, being linear and straightforward, passed the desk checking verification process. Second, black-box testing was performed. This verification technique involves comparing the input and output of the simulation model. In our baseline model, the number of blocks passing through the system remained constant for any number of rows selected when running the model, hence verifying the model. Third, white-box testing involves analyzing the internal logic and interactions between different components of the model. In this case, mortar is delivered only when the supply is exhausted, and blocks are replenished only when the brick station is empty. These controlled interactions validated the model’s internal logic; hence, it passed the white-box testing.
Verification confirms that the simulation model accurately represents real-life conditions, making it a reliable tool for benchmarking potential lean improvements to the system. Verification was carried out using three methods. First, the face validity of the event was assessed by comparing the number of blocks laid per day with the productivity of a single mason. The site superintendent confirmed that the model realistically represents on-site productivity. Second, event validity was performed by comparing the modelling scenario to the actual system. When running the baseline model, the productivity obtained matched the historical rates provided by the superintendent. Additionally, activities such as the supply of CMUs and mortar contribute to a major part of the construction time as expected. Furthermore, anticipated delays in the supply of resources like mortar and CMU blocks were accurately reflected in the simulation, which further reinforced the event validation of the baseline model by incorporating typical non-value-adding time, inherent to current masonry construction practices. Third, internal validity was assessed. The variability in construction lead time across different simulation runs was around 5%, indicating that the system developed is stable and predictable. This consistency confirms the internal validity of the baseline model.
Having verified and validated the baseline model, it is now possible to propose and compare different solutions.
4. Interventions
4.1. Intervention 1: Modular Construction
The first intervention involves modular construction. This method involves assembling panels (prefabricated sections) of 24 CMU blocks each, which are subsequently grouted. The blocks used to make a panel are then lifted into place and used for both load-bearing and non-load-bearing walls. The construction of these modular sections occurs on the ground, rather than at an elevation. The steps were deduced from recordings of the panel assembly process. Compared to the traditional process, the key change in this intervention is the absence of mortar delivery to the construction site. The simulation model incorporates additional steps to reflect these changes. First, “Unit Lift” was added as an activity, with its duration derived from observations made during the wall assembly. The major advantage of this method is its ability to alleviate the time constraints and reduce pressure on masons to complete sections of a wall, thereby avoiding schedule overruns. Most importantly, the panels can be constructed on site and transferred to storage until needed. The simulation model starts with the traditional masonry construction steps and incorporates “Grout Wall Section” and “Unit Lift” as additional steps to the model. Grouting occurs after a panel of 24 blocks is complete. When the simulation model was run, the construction lead time decreased by 46% compared to traditional masonry construction. This intervention also enables the pre-calculation of panel quantities and provides the option for robotic handling. Moreover, from a safety perspective, constructing modular units on the ground significantly reduces hazards, thereby making the new process safer. In terms of productivity, the time per block decreased from 593 s/block to 320 s/block.
4.2. Intervention 2: Interlocking Masonry Block
This intervention investigates the use of interlocking masonry blocks which would reduce the amount of mortar needed when building a wall. In this approach, it is assumed that stacking the blocks alone is sufficient to build a wall, with grouting being performed only if required. The steps in this intervention involve a simplified masonry construction process that is based on traditional methods. This approach also enhances safety as it eliminates the need to lift mortar to an elevation to join the blocks together. The simplified sequence of steps includes placing the CMU blocks and finishing the wall once construction is complete. These assumptions allowed for the development of the simulation model to compare its productivity with that of traditional masonry construction.
In this scenario, the “Placing Brick” step is similar to the traditional process. The main difference is the elimination of mortar as a modelled resource. The duration of placing a block is assumed to be the same as in the base case scenario since the interlocking blocks would have similar shapes and dimensions to the standard 8″ × 8″ × 16″ CMU blocks. Moreover, the replenishing of the mortar station as an activity was removed from the simulation, as no mortar is used in this intervention. It should be noted that the removal of mortar as a resource reduces variability, as fewer activities are being executed. Grouting, in this case, is performed only when required.
Figure 7 and
Figure 8 show an example of an interlocking block and the way it is stacked in linear rows, respectively.
When the model is run, it shows a 22% decrease in the time needed to lay one block. This intervention also presents an opportunity to use robots for material handling, and the required quantities for wall construction can be calculated in advance to reduce the lead time and streamline the procurement and delivery of masonry blocks. While units are stacked on top of each other in a manner similar to traditional masonry construction, it is essential to note that the hazard associated with lifting heavy equipment on site, such as a mortar tub, to an elevated position is eliminated. This technique also involves one mason stacking the blocks adjacently and on top of each other. The 22% decrease in construction time (productivity) reduces the time from 593 s/block to 462 s/block, which corresponds to a 28.35% increase.
4.3. Intervention 3: Semi-Autonomous Masonry Construction System
This intervention investigates the use of robots for developing a semi-autonomous system in which the mason does not need to be involved in material handling. The assumption is that robots would assist in transporting and delivering mortar and CMU blocks as needed, enabling the application of a just-in-time inventory on the construction site. The semi-autonomous system would involve the use of two robots. The first robot would function as a platform that transports the blocks from inventory to the location where the masonry wall is being built. It would be activated when the inventory by the wall being built is low. The second robot would transfer the CMU blocks onto the platform. This intervention assumes that two stations of CMU blocks are available to a single mason to successfully implement just-in-time delivery.
When run, the model shows a 13.5% decrease in the time needed to lay one block. This intervention uses robots for handling CMU blocks under human supervision, with human intervention only occurring when necessary. The use of robots would reduce human effort and physical strain required for the work. The 13.5% decrease in construction time (productivity) reduces the time from 593 s/block to 514 s/block.
4.4. Combined Interventions
It is essential to compare the baseline scenarios with the three interventions by simulating possible combinations of these interventions. The productivity rate and construction lead time were the chosen metrics for analysis and simulation. The combinations of interventions are as follows. For Intervention 1+2, the modular units are made using interlocking blocks. For Intervention 1+3, the modular units are made with robot-assisted material handling on site. For Intervention 2+3, the interlocking blocks are used with robot-assisted material handling on site. For Intervention 1+2+3, interlocking blocks are used to make modular units with robot-assisted material handling on site.
4.4.1. Intervention 1+2
In this intervention, panels consisting of 24 interlocking blocks are created. Due to the incorporation of Intervention 2, no mortar is needed. As a result, this combination eliminates the need to transport tubs of mortar, effectively removing mortar as a resource from the masonry construction process.
4.4.2. Intervention 1+3
In this intervention, a robot delivers new pallets to the site where modular panels are being assembled. By adopting a just-in-time inventory system, the lead time is reduced due to the elimination of delays typically associated with transporting new pallets.
4.4.3. Intervention 1+2+3
This scenario is the sum of all three interventions together. Interlocking blocks are used to create modular units, while robots assist with on-site material handling, streamlining and optimizing the entire construction process.
5. Discussion of Results
5.1. Construction Lead Time
Figure 9 shows the construction lead time per CMU block for the base case, each individual intervention, and their combinations. The goal of mapping the construction lead time is to compare and benchmark the effectiveness of the various interventions. The graph clearly demonstrates that incorporating any intervention decreases the lead time, thereby increasing productivity. When all three interventions are combined, the construction lead time is minimized compared to the base case scenario. We can also notice a more linear and uniform trend in the construction lead time as the number of CMU blocks increases, which indicates the elimination of idle time, which was more prevalent in the base case scenario.
Running simulations for the different scenarios and their combinations gives us the lead time for each. Compared to the base case scenario, the lean improvements implemented result in noticeable reductions in overall lead time. In the graph, the time it takes to build a single CMU block is plotted. For interventions involving modular units, the total time taken was divided by 24 (the number of blocks per panel) to obtain a per-block value. The purple line shows the base case scenario lead time, which exhibits the highest lead time out of all possible scenarios. Intervention 2 by itself is more effective when combined with other interventions. Intervention 3 by itself has the smallest impact on the lead time compared to the other interventions or combinations of interventions. Intervention 1 alone had the most significant impact on reducing the construction lead time when implemented individually. The combination of all interventions together (Int 1+2+3) results in the greatest reduction in lead time due to the improvements made at both the micro-level (fewer steps in the masonry process) and the macro-level (more efficient handling of the different resources on site).
5.2. Construction Productivity Rate
The daily productivity rate was calculated, and the number of blocks laid per day over a 40-day period was plotted. The base case has the lowest average daily productivity, while the combination of all the interventions showed the highest daily productivity. Fluctuations in the productivity may occur for interventions involving modular construction. These fluctuations arise because a batch of 24 blocks is counted only when a modular unit is completed on a given day.
Figure 10 shows the construction productivity rate.
The daily productivity of the different scenarios is shown below in
Table 3:
5.3. Statistical Analysis
While the average daily construction rate differs for each scenario, it is essential to determine whether the differences between interventions are statistically significant. The first step in the analysis is to test whether the data is normal.
Table 4 presents the results of the normality tests for each scenario. The non-normality observed in the different scenarios emphasizes the complexity of the approaches and underscores the importance of testing for differences between the mean daily productivity of the base case scenario and the interventions. All scenarios involving modular construction (Intervention 1) or a semi-autonomous system (Intervention 3) exhibit non-normal distributions. Such a result is expected due to the characteristics of these interventions. For Intervention 1, fluctuations occur because productivity is recorded only when a full batch of 24 blocks (i.e., one modular unit) is completed. For Intervention 3, the regularized nature of the proposed lean improvement minimizes variation in the time needed to lay the blocks.
Given the non-normality of the data, a two-tailed Wilcoxon Unpaired Rank Sum Test (nonparametric unpaired t-test) was used to compare the means of the different scenarios. The significance level alpha was taken to be 0.05. The different scenarios were compared between each other and with the base case to determine whether statistically significant differences exist.
The table also shows the mean and standard deviation of the daily productivity. It can be noticed that the daily productivity significantly increases when using the lean interventions or a combination of interventions. The highest daily productivity is reached when implementing all three interventions simultaneously. The mean represents the average number of blocks laid per day, and the standard deviation captures the variability in construction using the traditional bricklaying process or with the potential lean improvements. These metrics are important for systematically comparing and evaluating the effectiveness of the lean interventions in improving masonry construction site conditions.
The daily productivity and normality for the different scenarios are shown below in
Table 4:
Table 4.
Normality of the interventions.
Table 4.
Normality of the interventions.
| | Mean (s/block) | Std. Deviation (s/block) | Coefficient of Variation | Normality |
|---|
| Base Case | 46.50 | 5.00 | 11% | Normal |
| Intervention 1 | 79.20 | 11.14 | 14% | Not Normal |
| Intervention 2 | 57.53 | 4.52 | 8% | Normal |
| Intervention 3 | 52.98 | 2.37 | 4% | Not Normal |
| Intervention 1+2 | 82.20 | 12.02 | 15% | Not Normal |
| Intervention 1+3 | 100.20 | 9.24 | 9% | Not Normal |
| Intervention 2+3 | 67.93 | 4.03 | 6% | Not Normal |
| Intervention 1+2+3 | 105.00 | 11.77 | 11% | Not Normal |
Table 5 shows the results indicating whether the null hypothesis is rejected. Rejecting H
0 would mean that there exists a statistical difference in the mean construction time between the two elements being tested.
In only two cases do the improvements not lead to a statistically significant difference in construction time: Intervention 1/Intervention 1+2 and Intervention 1+3/Intervention 1+2+3. In the first case, the use of interlocking blocks does not statistically significantly affect the construction time because the mortar is mixed close to the modular unit instead of at a distance. As a result, the time required to handle the mortar does not impact the total construction time. In the second case, there is no statistically significant difference because the time it takes to place an interlocking block is the same as that for a traditional CMU block. Additionally, the impact of mortar on the total construction time is minimal and insufficient to produce a statistically significant difference.
It is important to note, however, that interlocking blocks reduce the overall amount of mortar needed, consequently reducing the budget spent on resource procurement compared to traditional CMU blocks.
5.4. Station Utilization
Station utilization was derived for all scenarios. For Intervention 1, Intervention 3, and Intervention 1+3, the station utilization remains the same as in the base case, as the traditional masonry construction process is still used in these scenarios. For Intervention 2, Intervention 1+2, and Intervention 1+2+3, mortar was made redundant, reducing the process to only two steps.
The standard deviation in station utilization decreased when compared to the base case scenario. Moreover, the wall finish duration increased in uniformity of time between different runs of the simulation, as reflected by a smaller standard deviation.
Figure 11 shows the station utilization with the mean shown in blue and the standard deviation in orange.
5.5. Results Validation
The models proposed were shown to masonry construction industry practitioners to ensure that the results obtained are coherent and would make a significant difference if implemented on a construction site. The questionnaire was given with a Likert scale of 1 to 5, ranging from 5 = “Strongly Agree” to 1 = “Strongly Disagree”.
Table 6 shows the validation results obtained.
Based on the results of the questionnaire, modular construction and robot interventions were seen as the most realistic solutions to be implemented on site. Interlocking CMU blocks were considered viable, but only in scenarios where the first few rows are made using mortarless interlocking blocks.
7. Conclusions
This paper explores strategies to improve masonry construction site conditions by comparing different lean construction scenarios. Given that construction lead time and daily productivity are key indicators of a system’s effectiveness, it is essential to measure and compare the performance of different scenarios based on these two factors. Improper material handling and idle time were identified as the two main causes for waste generation and value reduction on construction sites. The framework developed combines utilizing value stream mapping and simulation modelling to simplify and optimize the masonry construction process. The different models obtained result in a reduction in both construction lead time and resource utilization. The goal of exploring different combinations of interventions was to identify the most viable and practical solutions for implementation on construction sites. The paper also outlines contributions to both academic and industry practice. The framework itself can be used as a guide to identify problems on site and improve construction site conditions.
This paper presents several contributions to the academic body of knowledge. The framework developed provides a foundation for better understanding current masonry construction site practices and for proposing subsequent improvements using VSM and simulation modelling. Based on design science research, the framework is validated using the case study of a typical horizontal shear wall and compared to alternative construction systems. Additionally, ways to create a semi-autonomous construction system were proposed, showcasing how lean principles can improve masonry construction site conditions.
This paper also presents multiple implications for masonry construction practices. The three proposed construction systems aim to reduce waste on three fronts: labour, equipment, and materials. Adopting these systems can lower cost and time reductions needed for construction. Reducing resource handling and usage (e.g., mortar) and incorporating robots to assist with more strenuous tasks allows masonry workers to better handle materials (e.g., CMU blocks) on site. The approach taken in this paper creates value for all stakeholders in a construction project and reduces variability in the masonry construction industry.
While providing a comprehensive overview of the masonry construction process, this research also acknowledges several limitations. First, the value stream map does not account for supply chain issues. Moreover, this study focuses exclusively on typical horizontal shear walls. Other wall types, such as T-shaped walls and L-shaped walls, would require additional steps and further refinement of the framework to propose lean scenarios and solutions. Furthermore, the results obtained from the simulated models are limited to the systems investigated in the study. Concepts such as transfer of variability and factory physics were not taken into account when performing the simulation modelling. Additionally, the results obtained were the product of simulation modelling rather than on-site implementation. Finally, the simulation modelling was performed under the premise that the unit of measurement taken is a single CMU block rather than area-based metrics such as m2 or ft2.


